TRUNK MAINS FAILURES: THE EFFECT OF CORROSION...
12
1 TRUNK MAINS FAILURES: THE EFFECT OF CORROSION ON RESIDUAL PIPE STRENGTH Stephen Adegbite 1(*) , Azadeh Fahimi 1,2 , Tim Evans 2 , Jeff Farrow 3 , David Jesson 1 , Mike Mulheron 1 , Paul Smith 1 1 Faculty of Engineering and Physical Sciences, University of Surrey, Guildford, Surrey GU2 7XH, UK 2 Innovation, Thames Water Utilities Ltd, Island Road, Reading RG2 0RP, UK 3 Formerly of Thames Water Utilities Ltd, Island Road, Reading RG2 0RP, UK (*) Email: [email protected] ABSTRACT Trunk mains are critical components of any water supply network and their failures can have significant consequences. This paper investigates nine (9) cast iron mains recovered from service using a deterministic model to predict the likelihood of failure, denoted by the factor of safety. The investigation is made on the basis of their corrosion defects and material strengths, collected as part of a larger study (where it was shown that corrosion morphology can have a significant effect on the measured residual strength). The integrity of the deterministic model to proactively predict failure is sustained by choosing a lower limit strength value of 40 MPa as the input failure stress, which leads to failure being expected when the corrosion pits are more than 40% of pipe wall thickness. Keywords: trunk mains, strength, probability, model, factor of safety, corrosion. 1. INTRODUCTION For centuries cast iron trunk mains have been used worldwide to transport potable water from treatment works to communities with notable successes achieved. In contrast with distribution mains which are comprised of pipes of diameter around 3 – 8 inches ( 75 – 200 mm), with a wall thickness typically 0.5 inches (12.5 mm), the trunk mains are typically between 12 and 60 inches ( 300 – 1500 mm) in diameter and of much larger wall thickness of around 1.2 inches ( 30 mm). (As such, when characterising these pipes, they are typically considered as thin walled structures). Although cast iron mains are being phased out of water networks, a significant proportion of network components in many countries are still comprised of aging cast iron mains (Mohebbi et al., 2010). A major problem for the water industry is that these cast iron mains deteriorate at different rates (driven by the type of cast iron, nature of corrosion defects, the geology of the surrounding soil and other conditions) which, if not mitigated, can lead to failures, both critical (bursts) and non-critical (leakage). The deterioration and residual properties of distribution cast iron mains have been considered in the literature (e.g. Atkinson et al., 2003; Belmonte et al., 2007) in which Weibull statistics were used to characterise the strength distribution of sets of different pipe samples from a given street and other samples from a single length of pipe. It was found that in each case the introduction of a defect population was a consequential effect of in-service corrosion, which lowered the pipe (mean) strength and increased the variability within the sample set compared to the pipes in the as-manufactured conditions. The relationship between the pipe strength and the corrosion pit depth measured on the fracture surface was shown to be in agreement with
Transcript of TRUNK MAINS FAILURES: THE EFFECT OF CORROSION...
1
TRUNK MAINS FAILURES: THE EFFECT OF CORROSION ON
RESIDUAL PIPE STRENGTH
Stephen Adegbite1(*)
, Azadeh Fahimi1,2
, Tim Evans2, Jeff Farrow
3, David Jesson
1, Mike Mulheron
1, Paul
Smith1
1Faculty of Engineering and Physical Sciences, University of Surrey, Guildford, Surrey GU2 7XH, UK
2Innovation, Thames Water Utilities Ltd, Island Road, Reading RG2 0RP, UK
3Formerly of Thames Water Utilities Ltd, Island Road, Reading RG2 0RP, UK
(*)Email: [email protected]
ABSTRACT
Trunk mains are critical components of any water supply network and their failures can have
significant consequences. This paper investigates nine (9) cast iron mains recovered from
service using a deterministic model to predict the likelihood of failure, denoted by the factor
of safety. The investigation is made on the basis of their corrosion defects and material
strengths, collected as part of a larger study (where it was shown that corrosion morphology
can have a significant effect on the measured residual strength). The integrity of the
deterministic model to proactively predict failure is sustained by choosing a lower limit
strength value of 40 MPa as the input failure stress, which leads to failure being expected
when the corrosion pits are more than 40% of pipe wall thickness.
Keywords: trunk mains, strength, probability, model, factor of safety, corrosion.
1. INTRODUCTION
For centuries cast iron trunk mains have been used worldwide to transport potable water from
treatment works to communities with notable successes achieved. In contrast with distribution
mains which are comprised of pipes of diameter around 3 – 8 inches ( 75 – 200 mm), with a
wall thickness typically 0.5 inches (12.5 mm), the trunk mains are typically between 12 and
60 inches ( 300 – 1500 mm) in diameter and of much larger wall thickness of around 1.2
inches ( 30 mm). (As such, when characterising these pipes, they are typically considered as
thin walled structures). Although cast iron mains are being phased out of water networks, a
significant proportion of network components in many countries are still comprised of aging
cast iron mains (Mohebbi et al., 2010). A major problem for the water industry is that these
cast iron mains deteriorate at different rates (driven by the type of cast iron, nature of
corrosion defects, the geology of the surrounding soil and other conditions) which, if not
mitigated, can lead to failures, both critical (bursts) and non-critical (leakage).
The deterioration and residual properties of distribution cast iron mains have been considered
in the literature (e.g. Atkinson et al., 2003; Belmonte et al., 2007) in which Weibull statistics
were used to characterise the strength distribution of sets of different pipe samples from a
given street and other samples from a single length of pipe. It was found that in each case the
introduction of a defect population was a consequential effect of in-service corrosion, which
lowered the pipe (mean) strength and increased the variability within the sample set compared
to the pipes in the as-manufactured conditions. The relationship between the pipe strength and
the corrosion pit depth measured on the fracture surface was shown to be in agreement with

2
either a loss-of-section model or a fracture mechanics one, which is consistent with previous
studies (e.g. Yamamoto et al., 1983; Conlin and Baker, 1991; Makar and Rajani, 2000a).
The use of deterioration models for predicting the likelihood of mains failures is thriving and
well documented. Rajani and Kleiner (2001a; b) presented a review of statistical and
physically based failure deterioration models and described the various models including their
background, governing equations, as well as critiques and comparisons. Some models were
shown to address only one or a few of the contributing factors (including, but not limited to,
pipe-soil interaction, residual strength, corrosion pits, temperature) controlling the
engineering process that leads to failure, while other models pursued a more comprehensive
approach. In their recent review, St. Clair and Sinha (2012) focussed on over-arching
categories of the failure deterioration models for predicting the condition and performance of
water mains around the world. These categories include: deterministic, statistical,
probabilistic and advanced mathematical models, such as artificial neural networks (ANN),
fuzzy logic and heuristic. The input parameters and the output results of the pipe deterioration
models are heavily dependent on the categories and methodologies incorporated.
Probabilistic modelling entails the use of statistical analysis to determine the probability, or
relative frequency, of failure occurring. Deterministic models on the other hand are required
and developed for situations where historical failure data are sparse or unavailable. Rajani and
Makar (2000b), with substantial improvements by Rajani and Abdel-Akher (2012), developed
a physical deterministic model based on Monte Carlo simulations for calculating the
likelihood of main failure, and attributed a term called the factor of safety (FS) as the ratio of
the failure stress (σfail) of the pipe to the imposed stresses, axial (σx) and hoop (σθ) (Fig. 1).
Fig. 1 Schematics of stresses imposed on a main.
In view of the critical function of trunk mains for transporting water across a network, it is
discouraging to note that there appear to be limited previous studies aimed at investigating the
in-service deterioration and corrosion defects in cast iron trunk mains, and how deterministic
models might be used to process the in-service pipe conditions and reliably determine the
likelihood of failure prior to actual failure. The aim of the present work, which is part of a
larger study of understanding cast iron trunk mains and developing tools and models for
performance assessment and risk mitigation, is to address this knowledge gap and to
investigate how pipes fail due to in-service corrosion defects. The experimental data from
pipes recovered from service are fed into the deterministic model in order to improve the

3
accuracy of predictions regarding asset life, and to proactively implement protocols for
mitigating failure, particularly in high consequence situations.
The structure of this paper is as follows: Section 2 presents an overview of the Monte Carlo
based deterministic model as developed by the National Research Council (NRC), Canada –
its methodology and a protocol for combining the axial and hoop stresses imposed on a main;
Section 3 is comprised of the pipe sample preparation and flexural test method used to derive
the strength values and the simulation procedures by the deterministic model; followed by
model simulation results and a discussion (Section 4) on the factor of safety obtainable for
varying depth of graphitisation, as informed by the pipe strength measurements.
2. MONTE CARLO BASED DETERMINISTIC MODEL
2.1 Methodology
The work of Rajani and Abdel-Akher (2012) has resulted in a Monte-Carlo based
deterministic model, which is comprised of a comprehensive suite of sub-models developed
from cast iron material and component properties and the surrounding trench conditions. This
model is used by Thames Water Utilities Limited as part of a suite of asset management tools.
Being physical and deterministic, this model evaluates the input data entered into a Microsoft
Excel-VBA programme (developed by NRC Canada) for a section length (or “stick”) of main,
and then performs Monte Carlo simulations to produce probabilistic estimates of the factor of
safety (FS), represented by frequency histograms.
Monte Carlo simulations involve a series of mathematical calculations of probability
distributions for modelling the variability or uncertainty in the input data. In this particular
model symmetrical triangular distributions are used for the input data in lieu of precise
distributions, and these distributions are defined by the mode (or most likely value, MLV), the
minimum and maximum values. The minimum and maximum values are given as variations
from the mode (± EV), expressed as a percentage of the mode, i.e. (1 – EV) x MLV and (1 +
EV) x MLV respectively. The Monte Carlo simulations, comprising 1000 runs, are then
presented in the form of frequency histograms. The factor of safety is defined as the ratio of
the failure stress (or resistance capacity) to the imposed stresses, which could be in the axial
(σx) or hoop (σθ) directions (Eq. 1).
) ,( stresses imposed
)( stress failureFS
x
fail
(1)
It should be noted that these factors of safety are treated independently, i.e. a factor of safety
is determined for either σx or σθ but not both. Hence, the factors of safety determined may be
more pessimistic or optimistic than the actual case. This is discussed in more detail in Section
2.2. In the case of cast iron mains, the failure stress (σfail) is equal to the pipe tensile strength
at failure which can be influenced by in-service corrosion defects. (The model deals with such
defects by treating corrosion simply as a loss of section). The imposed stresses in the hoop
and axial directions are comprised of stress components from external loads, internal pressure,
temperature and longitudinal bending or flexure. For a trunk main to be considered
theoretically safe, the FS must be greater than 1, i.e. the failure stress is greater than the
imposed stresses. However, a trunk main may be expected to fail for cases where 1FS0 .
The degree of safety, another characterisation parameter, is based on the amount of overlap
4
between the tails of the histograms for failure and imposed stresses (Rajani and Abdel-Akher,
2012).
2.2 Von Mises theory for combining imposed stresses in axial and hoop stress
According to Rajani and Tesfamariam (2004), the axial and hoop stresses imposed on a
buried trunk main are given by Eqs (2) and (3):
f
x
T
x
pi
x
w
xx (2)
f
xp
TpiwfTpiw (3)
where
w
x axial stress due to external loads
pi
x axial stress due to internal pressure
T
x axial stress due to temperature differential
f
x stress in the longitudinal direction due to flexural action
w
hoop stress dueto overburden loads
pi
hoop stress due to internal pressure
T
hoop stress due to temperature differential
f
hoop stress due to Poisson’s effect of longitudinal bending
p pipe Poisson’s ratio
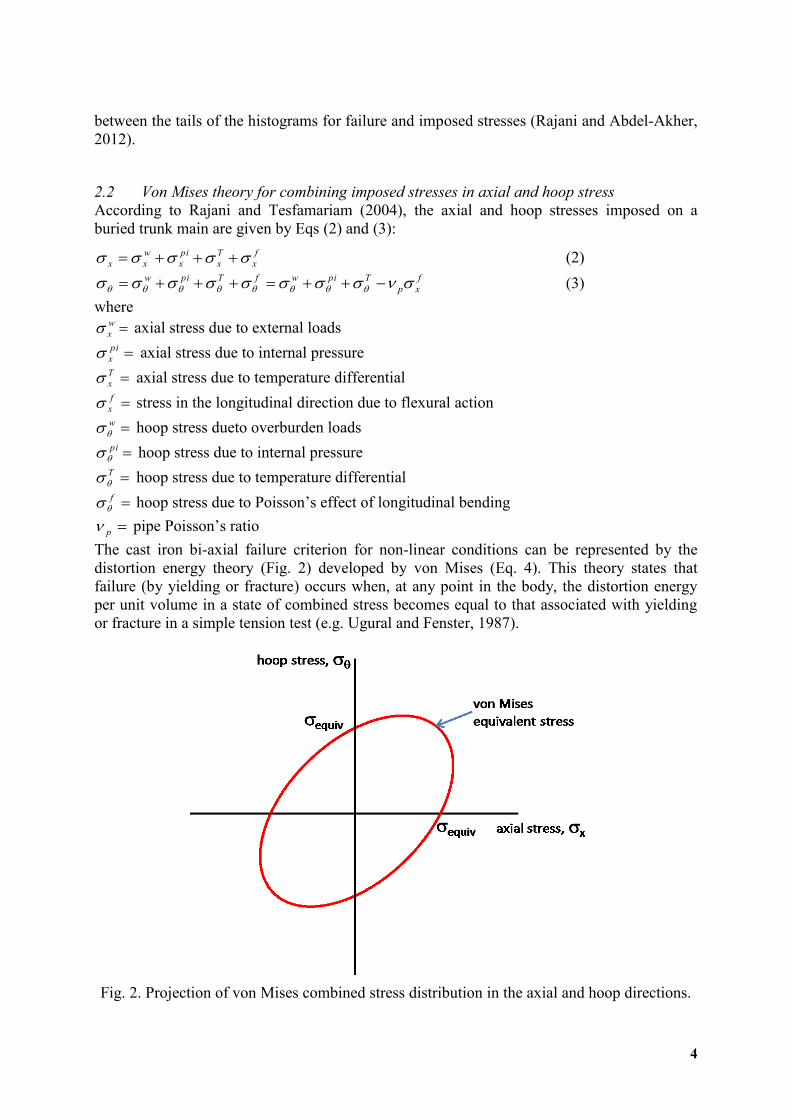
The cast iron bi-axial failure criterion for non-linear conditions can be represented by the
distortion energy theory (Fig. 2) developed by von Mises (Eq. 4). This theory states that
failure (by yielding or fracture) occurs when, at any point in the body, the distortion energy
per unit volume in a state of combined stress becomes equal to that associated with yielding
or fracture in a simple tension test (e.g. Ugural and Fenster, 1987).
Fig. 2. Projection of von Mises combined stress distribution in the axial and hoop directions.

5
xxequiv 222 (4)
Hence, it is possible to determine a factor of safety that accounts for both stresses
simultaneously:
2
equiv
fail2
equiv
fail
equivFS
i.e. ,FS
equiv (5)
Similarly,
2
fail2fail
FS i.e. ,FS
(6)
2
fail2fail
FS i.e. ,FS
x
x
x
x
(7)
Substituting Eqs (5), (6) and (7) into Eq. (4) gives:
X
fail
θ
fail
2
X
fail
2
θ
fail
2
equiv
fail
FS
σ
FS
σ
FS
σ
FS
σ
FS
σ
2
X
2
θ
Xθ
2
X
2
θ
2
fail
2
equiv
2
fail
FSFS
FSFSFSFSσ
FS
σ
XX
X
equiv
FSFSFSFS
FSFSFS
22 (8)
where
equiv = the von Mises equivalent stress combination of x and
equivFS = von Mises combined factor of safety
FS = factor of safety in the axial direction
XFS = factor of safety in the hoop direction
3. EXPERIMENTAL
3.1 Sample preparation and flexural test method
Three plates have been cut from each of nine lengths of failed water mains, Pipes 1-9, with
the exception of Pipe 8, where only two plates were available (Table 1). Flexure testing was
carried out using an Instron 1185 with a 100 kN load cell. A set of 10 specimens from each
plate was prepared, with a total of 30 specimens produced from each pipe. Three randomly
selected specimens in each set were strain gauged (using Vishay General Purpose strain
gauges) on both the tension and compression faces. The deduced tensile strength at failure
was correlated with the depth of graphitisation measured in the fracture face of each specimen
(as discussed in Jesson et al., 2013).

6
Table 1 – Details of the available nine failed pipes recovered from service
Pipe Nominal
diameter
/ inches
Nominal external
diameter
/ m
Nominal wall
thickness
/ mm
Age*
/ years
1 48 1.22 28 82
2 42 1.07 32 ~85
3 30 0.76 22 82
4 18 0.46 21 125
5 24 0.61 23 115
6 36 0.91 23 151
7 12 0.31 18 ~70
8 18 0.46 22 ~120
9 21 0.53 28 150 *Age is the duration from installation to removal from service and is to the nearest year, except for those pipes
where the age is indicated as approximate and duration is less certain.
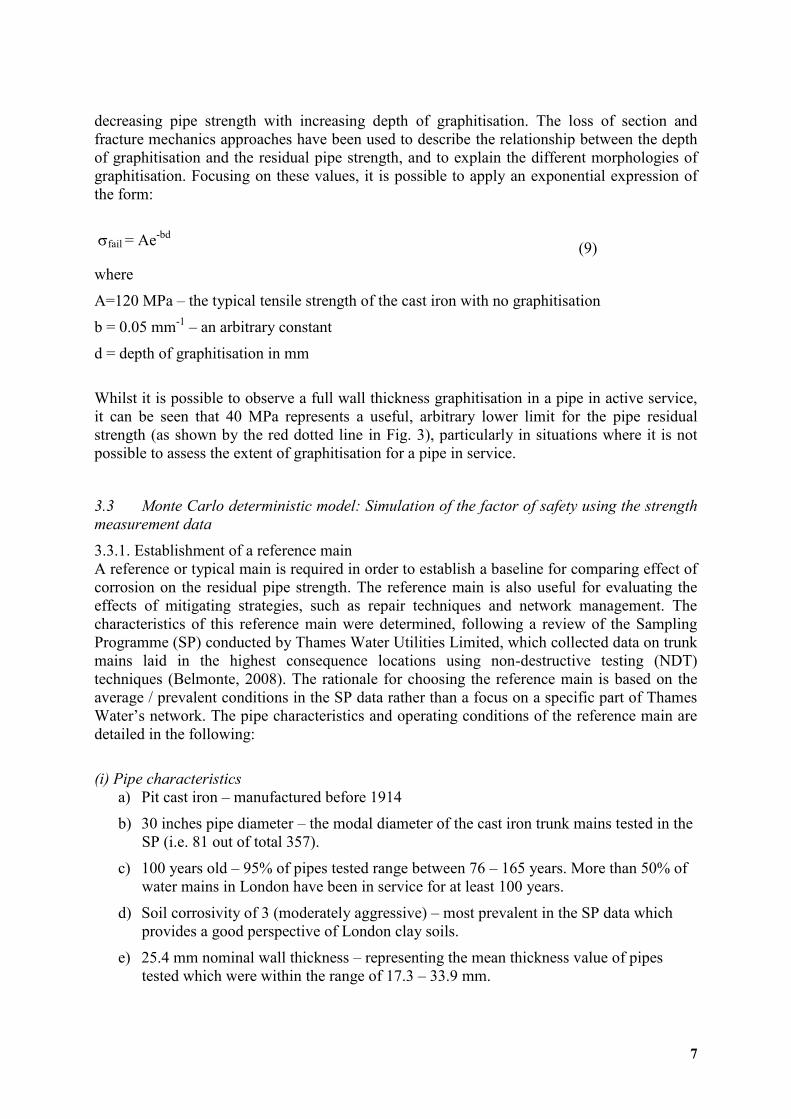
3.2 Lower values of strength measurements
Fig. 3. Effect of the depth of graphitisation on pipe strength as determined experimentally
Fig. 3 shows the plots of the nominal tensile bending stress at failure as a function of the
depth of graphitisation measured on the fracture surface. The values presented are the lowest
25 from a total of 260 specimens tested (Jesson et al., 2013). The flexure testing results show
a variation of the strengths of the samples from different pipes, together with a trend of
7
decreasing pipe strength with increasing depth of graphitisation. The loss of section and
fracture mechanics approaches have been used to describe the relationship between the depth
of graphitisation and the residual pipe strength, and to explain the different morphologies of
graphitisation. Focusing on these values, it is possible to apply an exponential expression of
the form:
fail = Ae-bd
(9)
where
A=120 MPa – the typical tensile strength of the cast iron with no graphitisation
b = 0.05 mm-1
– an arbitrary constant
d = depth of graphitisation in mm
Whilst it is possible to observe a full wall thickness graphitisation in a pipe in active service,
it can be seen that 40 MPa represents a useful, arbitrary lower limit for the pipe residual
strength (as shown by the red dotted line in Fig. 3), particularly in situations where it is not
possible to assess the extent of graphitisation for a pipe in service.
3.3 Monte Carlo deterministic model: Simulation of the factor of safety using the strength
measurement data
3.3.1. Establishment of a reference main
A reference or typical main is required in order to establish a baseline for comparing effect of
corrosion on the residual pipe strength. The reference main is also useful for evaluating the
effects of mitigating strategies, such as repair techniques and network management. The
characteristics of this reference main were determined, following a review of the Sampling
Programme (SP) conducted by Thames Water Utilities Limited, which collected data on trunk
mains laid in the highest consequence locations using non-destructive testing (NDT)
techniques (Belmonte, 2008). The rationale for choosing the reference main is based on the
average / prevalent conditions in the SP data rather than a focus on a specific part of Thames
Water’s network. The pipe characteristics and operating conditions of the reference main are
detailed in the following:
(i) Pipe characteristics
a) Pit cast iron – manufactured before 1914
b) 30 inches pipe diameter – the modal diameter of the cast iron trunk mains tested in the
SP (i.e. 81 out of total 357).
c) 100 years old – 95% of pipes tested range between 76 – 165 years. More than 50% of
water mains in London have been in service for at least 100 years.
d) Soil corrosivity of 3 (moderately aggressive) – most prevalent in the SP data which
provides a good perspective of London clay soils.
e) 25.4 mm nominal wall thickness – representing the mean thickness value of pipes
tested which were within the range of 17.3 – 33.9 mm.
8
(ii) Operating conditions
a) Internal water pressure = 10 bar
b) Pipe burial depth = 1000 mm
c) Trench width = 1000 mm
3.3.2 Calibration of the model
The Monte Carlo deterministic model was calibrated by adjusting the general input section of
the Excel-VBA programme to the characteristics of the trunk main given. A ± 5% variation
default was applied to each input data to cater for variability. The input data required for
sampling are categorised as follows:
a) Pipe material information: describes the pipe material properties, such as elasticity,
material strength at failure in tension, fracture toughness.
b) Pipe geometry information: comprises the pipe physical dimensions and related
information, such as pipe size, pipe thickness class, pipe segment length, pipe
dimensions.
c) Trench characteristics: describes excavation trench characteristics, such as trench
depth and width, pipe laying condition, pipe construction conditions, backfill material
properties.
d) Traffic/ pavement data: describes the surrounding external environment, such as
pavement thickness, pavement type as well as traffic description.
e) Operating conditions data: describes basic factors related to operational and hydraulic
conditions, e.g. external pipe loads, water pressure.
The range of cast iron tensile strength from the literature (Angus, 1976) as well as carefully
selected sets of lower strength values from the flexural tests were fed as input failure stresses
into the Monte Carlo deterministic model. These failure stresses were varied for corrosion pit
depths between 0 and 90% wall thickness, and then based on the operational service
conditions the factors of safety in the hoop (FSx) and axial directions (FS) were calculated.
Finally, the von Mises combined factor of safety (FSequiv) was evaluated from FSx FS using
the relationship derived in Eq. 8.
4. RESULTS AND DISCUSSION
To ensure proactive asset management of trunk mains in the utilities network, a “traffic-light”
colour code is proposed which is aimed at pre-emptive rehabilitation of mains likely to fail
(i.e. with very low FSequiv). A combined factor of safety FSequiv < 1 represents a severely
deteriorated main with imminent likelihood of failure, and therefore requires an urgent
replacement/ rehabilitation. For cases where 41 equiv
FS , the main has moderate likelihood
of failure and must be routinely kept under check, particularly when the FSequiv is close to the
safety line of 1. The mains which are in good condition would have FSequiv more than 4 and
these mains are designated as having low likelihood of failure.
The factor of safety outputs based on the lower strength values (40 – 120 MPa) from the
flexural tests fed into the Monte Carlo deterministic model at varying corrosion pit depth
between 0 and 90 % pipe are shown in Fig. 4. The factors of safety in the axial direction
9
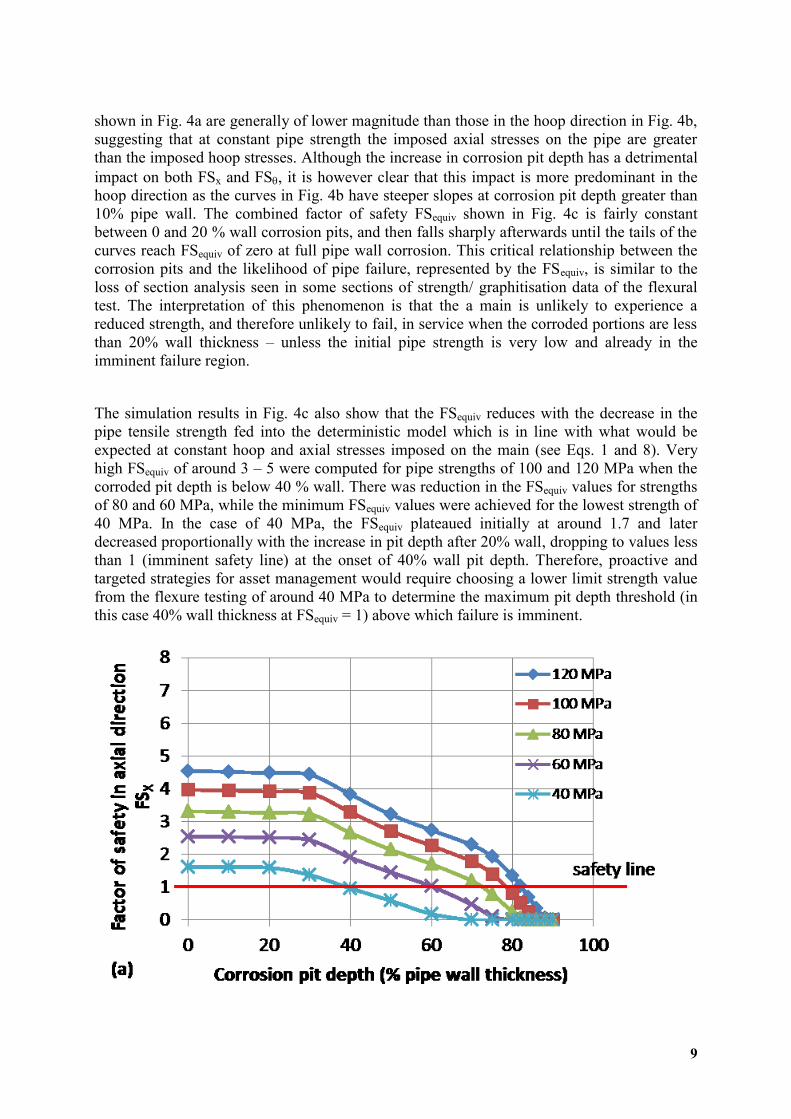
shown in Fig. 4a are generally of lower magnitude than those in the hoop direction in Fig. 4b,
suggesting that at constant pipe strength the imposed axial stresses on the pipe are greater
than the imposed hoop stresses. Although the increase in corrosion pit depth has a detrimental
impact on both FSx and FS, it is however clear that this impact is more predominant in the
hoop direction as the curves in Fig. 4b have steeper slopes at corrosion pit depth greater than
10% pipe wall. The combined factor of safety FSequiv shown in Fig. 4c is fairly constant
between 0 and 20 % wall corrosion pits, and then falls sharply afterwards until the tails of the
curves reach FSequiv of zero at full pipe wall corrosion. This critical relationship between the
corrosion pits and the likelihood of pipe failure, represented by the FSequiv, is similar to the
loss of section analysis seen in some sections of strength/ graphitisation data of the flexural
test. The interpretation of this phenomenon is that the a main is unlikely to experience a
reduced strength, and therefore unlikely to fail, in service when the corroded portions are less
than 20% wall thickness – unless the initial pipe strength is very low and already in the
imminent failure region.
The simulation results in Fig. 4c also show that the FSequiv reduces with the decrease in the
pipe tensile strength fed into the deterministic model which is in line with what would be
expected at constant hoop and axial stresses imposed on the main (see Eqs. 1 and 8). Very
high FSequiv of around 3 – 5 were computed for pipe strengths of 100 and 120 MPa when the
corroded pit depth is below 40 % wall. There was reduction in the FSequiv values for strengths
of 80 and 60 MPa, while the minimum FSequiv values were achieved for the lowest strength of
40 MPa. In the case of 40 MPa, the FSequiv plateaued initially at around 1.7 and later
decreased proportionally with the increase in pit depth after 20% wall, dropping to values less
than 1 (imminent safety line) at the onset of 40% wall pit depth. Therefore, proactive and
targeted strategies for asset management would require choosing a lower limit strength value
from the flexure testing of around 40 MPa to determine the maximum pit depth threshold (in
this case 40% wall thickness at FSequiv = 1) above which failure is imminent.

10
Fig. 4. Relationships between the factor of safety and corrosion pit depth at different pipe
strengths: (a) axial (FSx); (b) hoop (FS) and (c) combined (FSequiv).

11
5. CONCLUDING REMARKS
Trunk mains are critical water utilities assets and their conditions in service should be
properly monitored and related to asset management strategies supported by realistic failure
deterioration models. This study has investigated corrosion defects and flexural tensile
strengths of samples from nine cast iron trunk mains recovered from service, and the strength
measurements were fed into a Monte Carlo deterministic model to improve its fitness at
predicting the likelihood of failure. A protocol was established for deriving an equivalent
factor of safety FSequiv by combining the axial and hoop stresses imposed on a buried pipe
using the von Mises distortion energy theory.
Noticeable spatial variations were seen in the strength of the samples from nine different
pipes, together with the trend of decreasing pipe strength with increasing depth of
graphitisation. The inputting of the lower strength values into the Monte Carlo deterministic
model produced a relationship between the equivalent factor of safety FSequiv and the
corrosion pit depth, which was properly described by the loss of section analysis approach.
Importantly lower FSequiv values were obtained for reduced pipe strength inputs which was in
agreement with what should be expected at constant hoop and axial stresses imposed on the
main. It was shown that proactive and targeted strategies for asset management would require
choosing a lower limit strength value from the flexural testing of around 40 MPa to determine
the maximum pit depth threshold (in this case 40% wall thickness at FSequiv = 1) above which
failure is imminent.
ACKNOWLEDGEMENTS
The authors would like to acknowledge the support of Thames Water Utilities Limited
(TWUL) during the course of this investigation, which is part of a wider study of cast iron
trunk mains in collaboration with NRC (Canada). In particular, discussions with Mr Nic
Clay-Michael and Dr Balvant Rajani of NRC must be acknowledged.
REFERENCES
Angus, HT. Cast iron – Physical and engineering properties. Butterworth & Co., 2nd
Edition,
1976, pp. 34-252.
Ashby, MF, Jones, DRH. Engineering Materials. Vol.1, Butterworth-Heinemann, 2nd
Edition,
1996, p 138.
Atkinson, K, Whiter, JT, Smith, PA, Mulheron, M. Failure of small diameter of cast iron
pipes, Urban Water, 2003, 4, pp. 263 – 271.
Belmonte, HMS, Mulheron, M, Smith, PA. Weibull Analysis, extrapolations and implications
for condition assessment of cast iron water mains. Fatigue & Fracture of Engineering
Materials & Structures, 2007, 30, pp. 964-990.
Belmonte, HMS. Trunk mains – condition and strength. Thames Water Internal Report
RIN005-a, 2008.
Boresi, AP, Schmidt, RJ, Sidebottom, OM. Advanced Mechanics of Materials. John Wiley &
Sons Inc., 5th
Edition, 1993, pp. 614-615.
12
Conlin, RM, Baker, TJ. Application of fracture mechanics to the failure behaviour of buried
cast iron mains, in Transport Research Laboratory Contract Report No. 266. (1991).
Jesson, DA, Mohebbi, H, Farrow, J, Mulheron, MJ, Smith, PA. On the condition assessment
of cast iron trunk main: the effect of microstructure and in-service graphitisation on
mechanical properties in flexure, Materials Science and Engineering A, 2013 (submitted).
Makar, JM, Rajani, B. Gray cast-iron water pipe metallurgy. Journal of Materials in Civil
Engineering, 2000a, 12, pp. 245-253.
Mohebbi H, Jesson DA, Mulheron MJ, Smith PA. The fracture and fatigue properties of cast
irons used for trunk mains in the water industry, Materials Science and Engineering A, 2010,
527, 21-22, pp. 5915-5923.
Rajani, B, and Makar, J. A methodology to estimate remaining service life of grey cast iron
water mains, Canadian Journal of Civil Engineering, 2000b, 27, pp. 1259-1272.
Rajani, B, Kleiner, Y. Comprehensive review of structural deterioration of water mains:
statistical models, Urban Water, 2001a, 3, pp. 131-150.
Rajani, B, Kleiner, Y. Comprehensive review of structural deterioration of water mains:
physically based models, Urban Water, 2001b, 3, pp. 151-164.
Rajani, B, Tesfamariam, S. Uncoupled axial, flexural, and circumferential pipe-soil
interaction analyses of partially supported jointed water mains, Canadian Geotechnical
Journal, 2004, 41, 6, pp. 997-1010.
Rajani, B, Abdel-Akher, A. Re-assessment of cast iron pipes subjected to vertical loads and
internal pressure, Engineering Structures, 2012, 45, pp. 192-212.
St. Clair, AM, Sinha, S. State-of-the technology review on water pipe condition, deterioration
and failure rate prediction models!, Urban Water, 2012, 9, 2, pp. 85 -112.
Ugural, AC, Fenster, SK. Advanced strength and applied elasticity, Elsevier Science
Publishing Co., New York, 1987, p 471.
Yamamoto, K, Mizoguti, S, Yoshimitsu, K, and Kawasaki, J. Relation between graphitic
corrosion and strength of cast iron pipes. Corrosion Engineering, 1983, 32, pp. 157 - 162.