DataStax | Best Practices for Securing DataStax Enterprise (Matt Kennedy) | Cassandra Summit 2016

Troubleshooting CassandraJ.B. Langston, Principal Support Engineer
Slides: http://goo.gl/SdAzOJ

Troubleshooting Philosophy
Company Confidential© 2016 DataStax, All Rights Reserved.
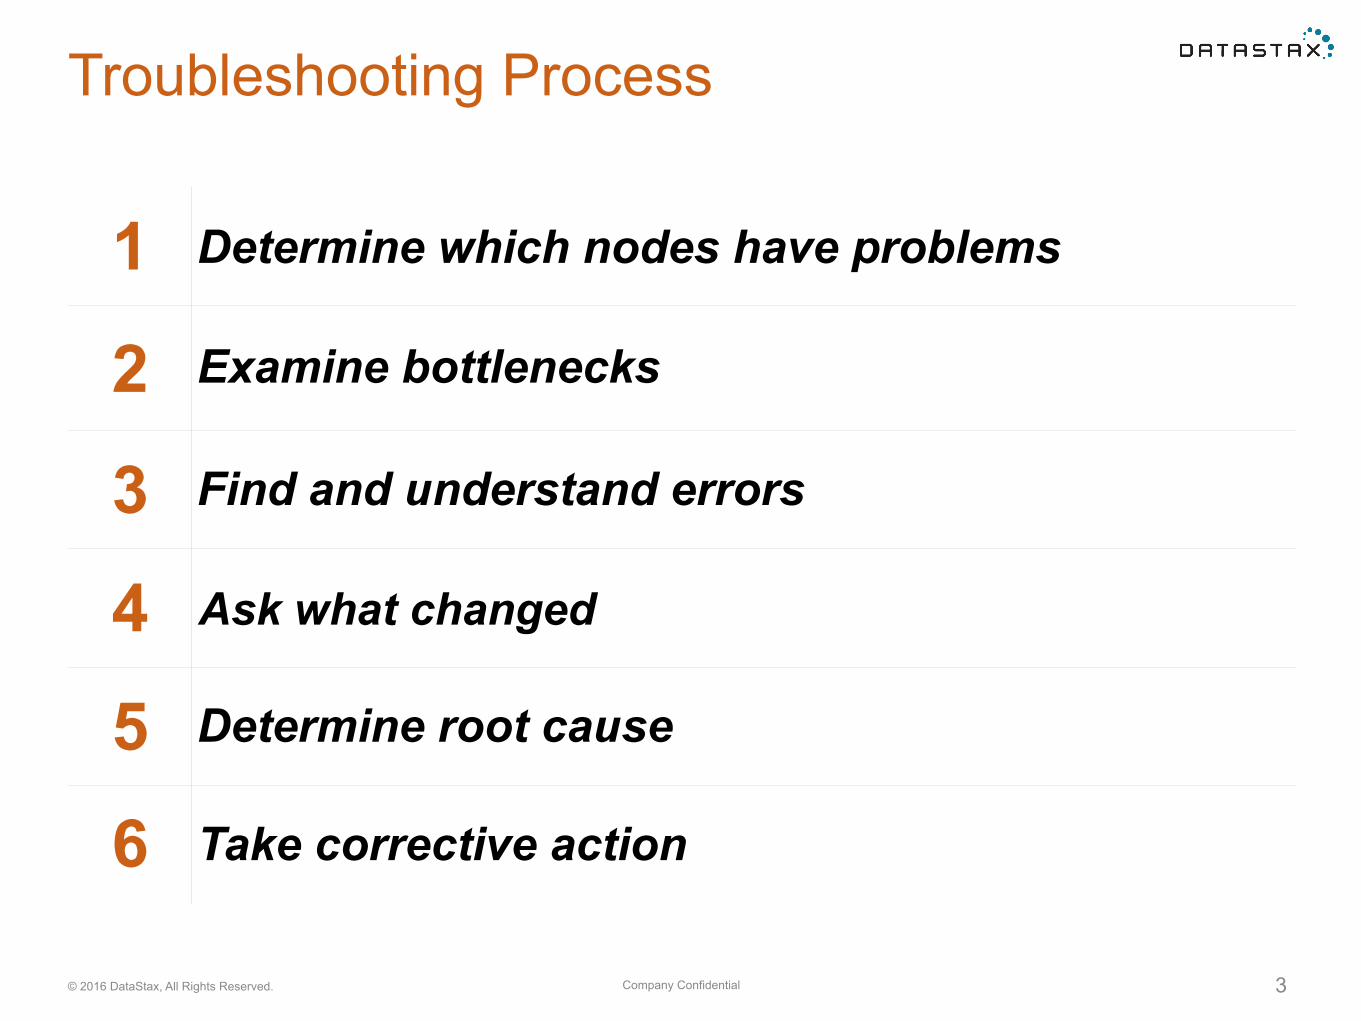
Troubleshooting Process
3
1 Determine which nodes have problems
2 Examine bottlenecks
3 Find and understand errors
4 Ask what changed
5 Determine root cause
6 Take corrective action
Company Confidential© 2014 DataStax, All Rights Reserved. 4
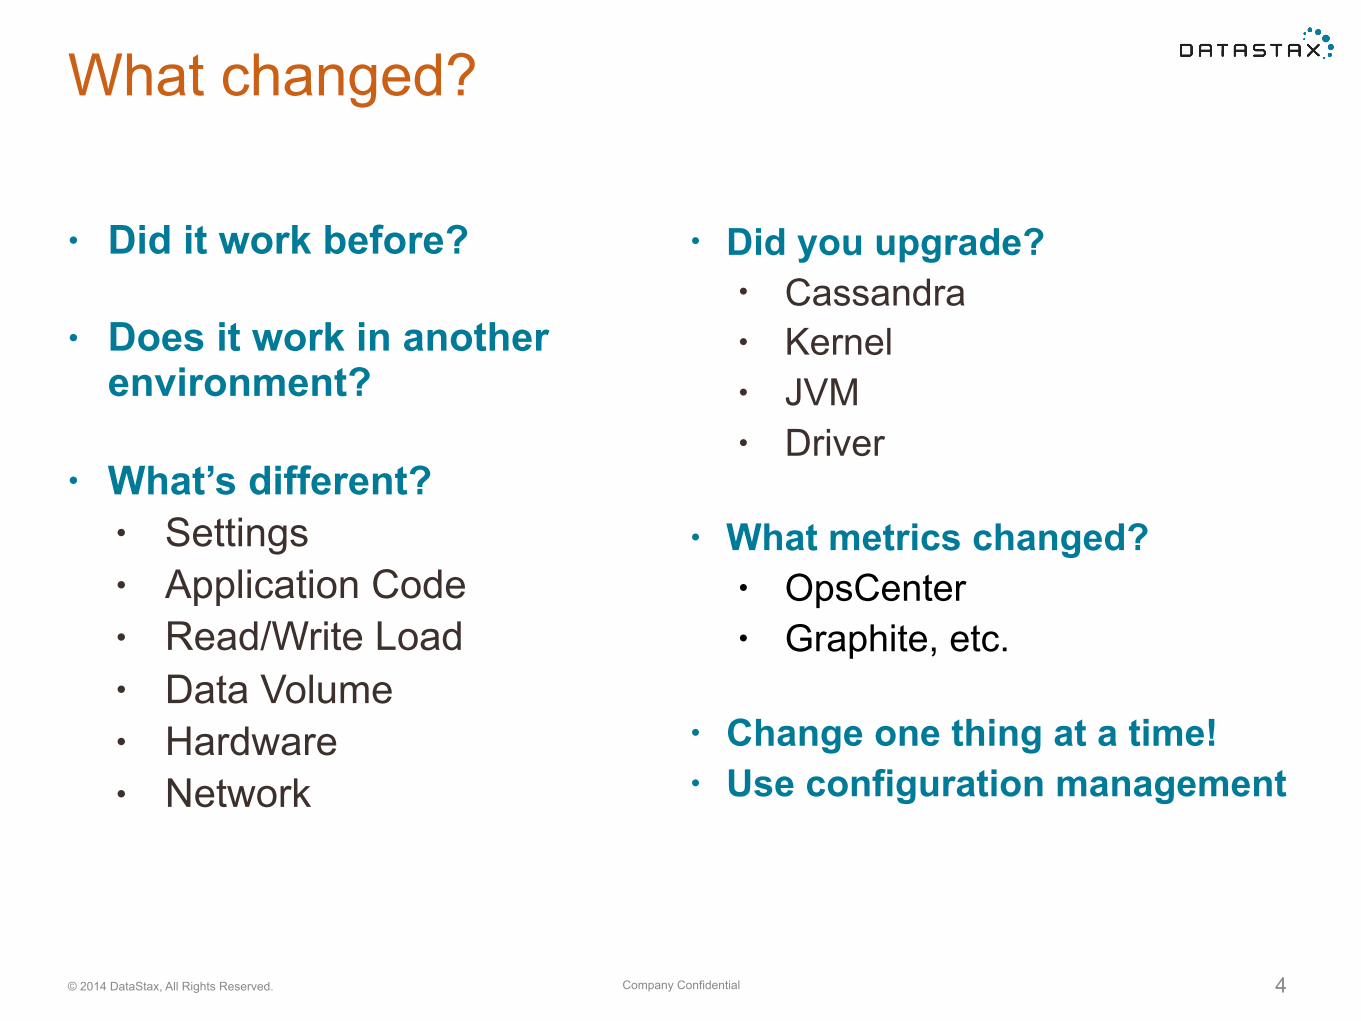
• Did you upgrade? • Cassandra • Kernel • JVM • Driver
• What metrics changed? • OpsCenter • Graphite, etc.
• Change one thing at a time! • Use configuration management
What changed?
• Did it work before?
• Does it work in another environment?
• What’s different? • Settings • Application Code • Read/Write Load • Data Volume • Hardware • Network

Tools of the Trade
Company Confidential© 2014 DataStax, All Rights Reserved. 6
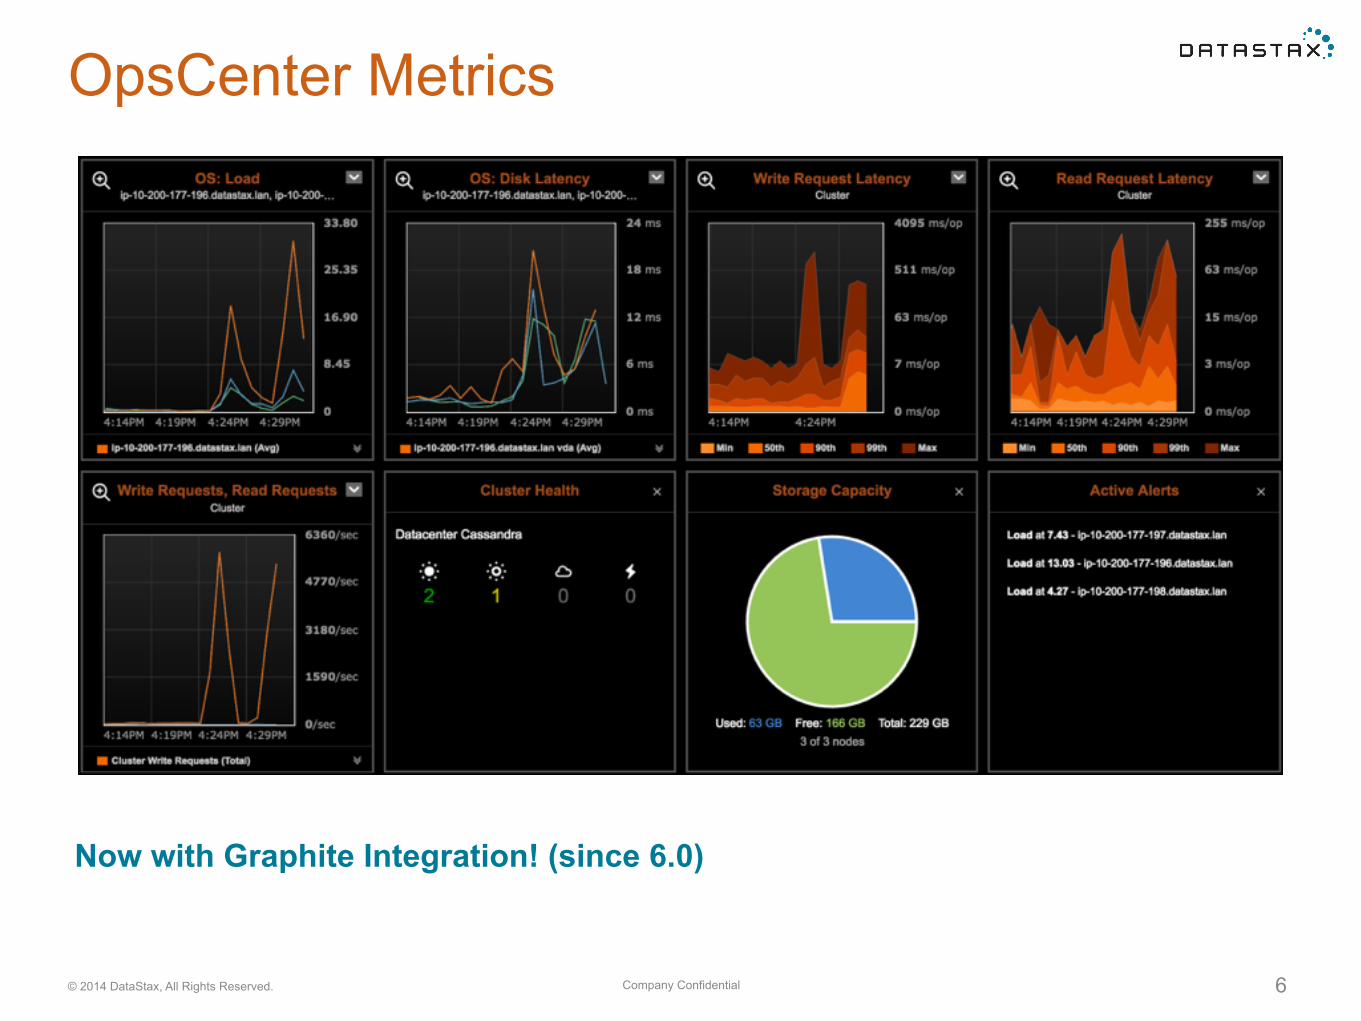
OpsCenter Metrics
Now with Graphite Integration! (since 6.0)
Company Confidential© 2014 DataStax, All Rights Reserved. 7
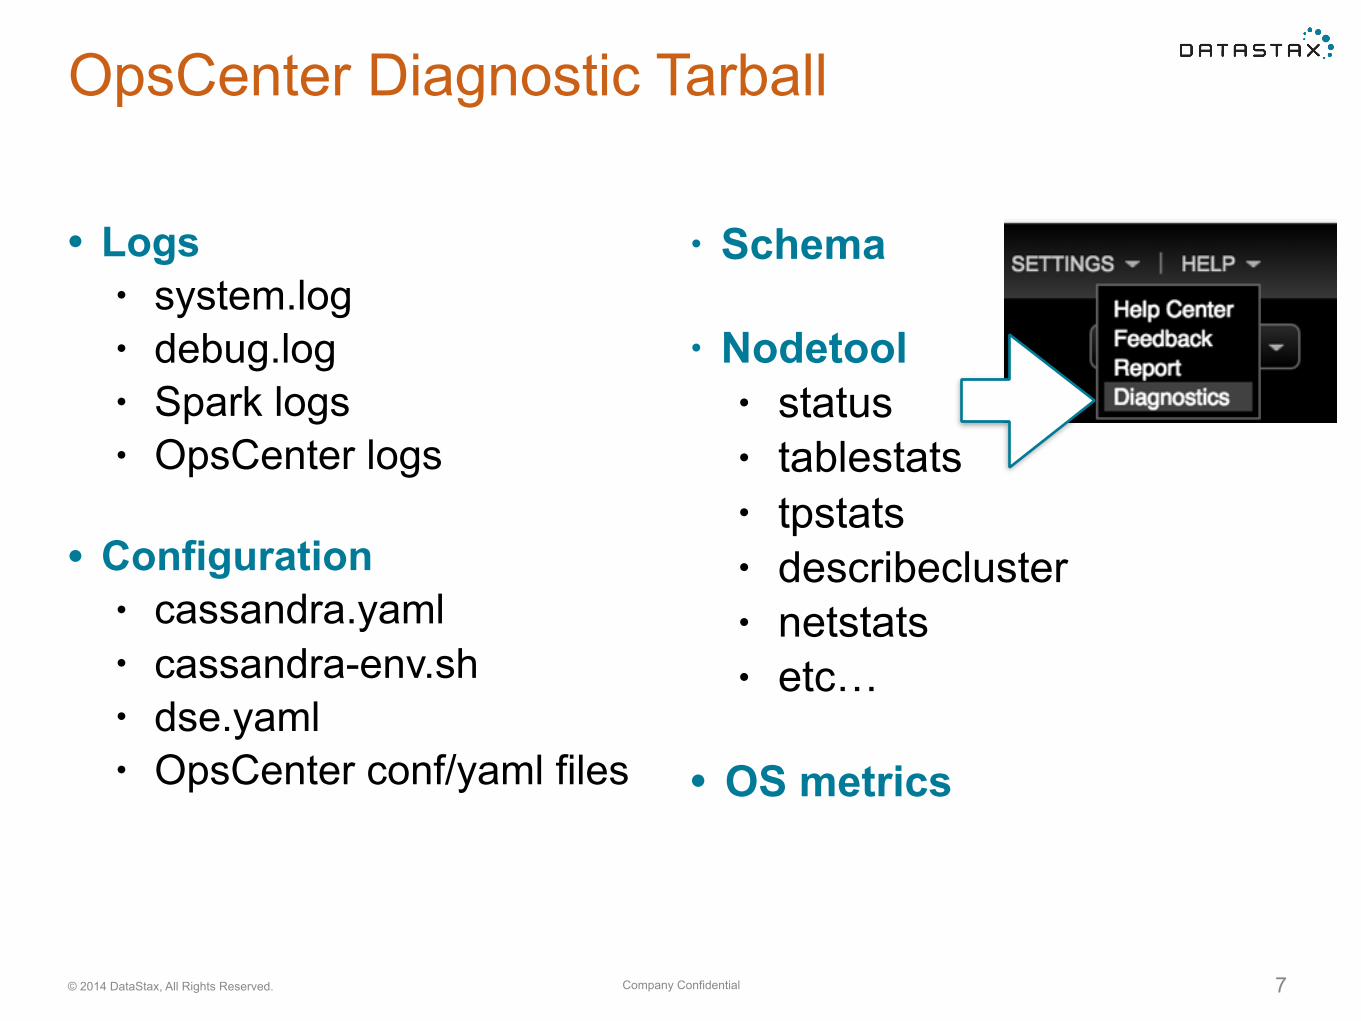
• Schema
• Nodetool • status • tablestats • tpstats • describecluster • netstats • etc…
• OS metrics
OpsCenter Diagnostic Tarball
• Logs • system.log • debug.log • Spark logs • OpsCenter logs
• Configuration • cassandra.yaml • cassandra-env.sh • dse.yaml • OpsCenter conf/yaml files
Company Confidential© 2014 DataStax, All Rights Reserved. 8
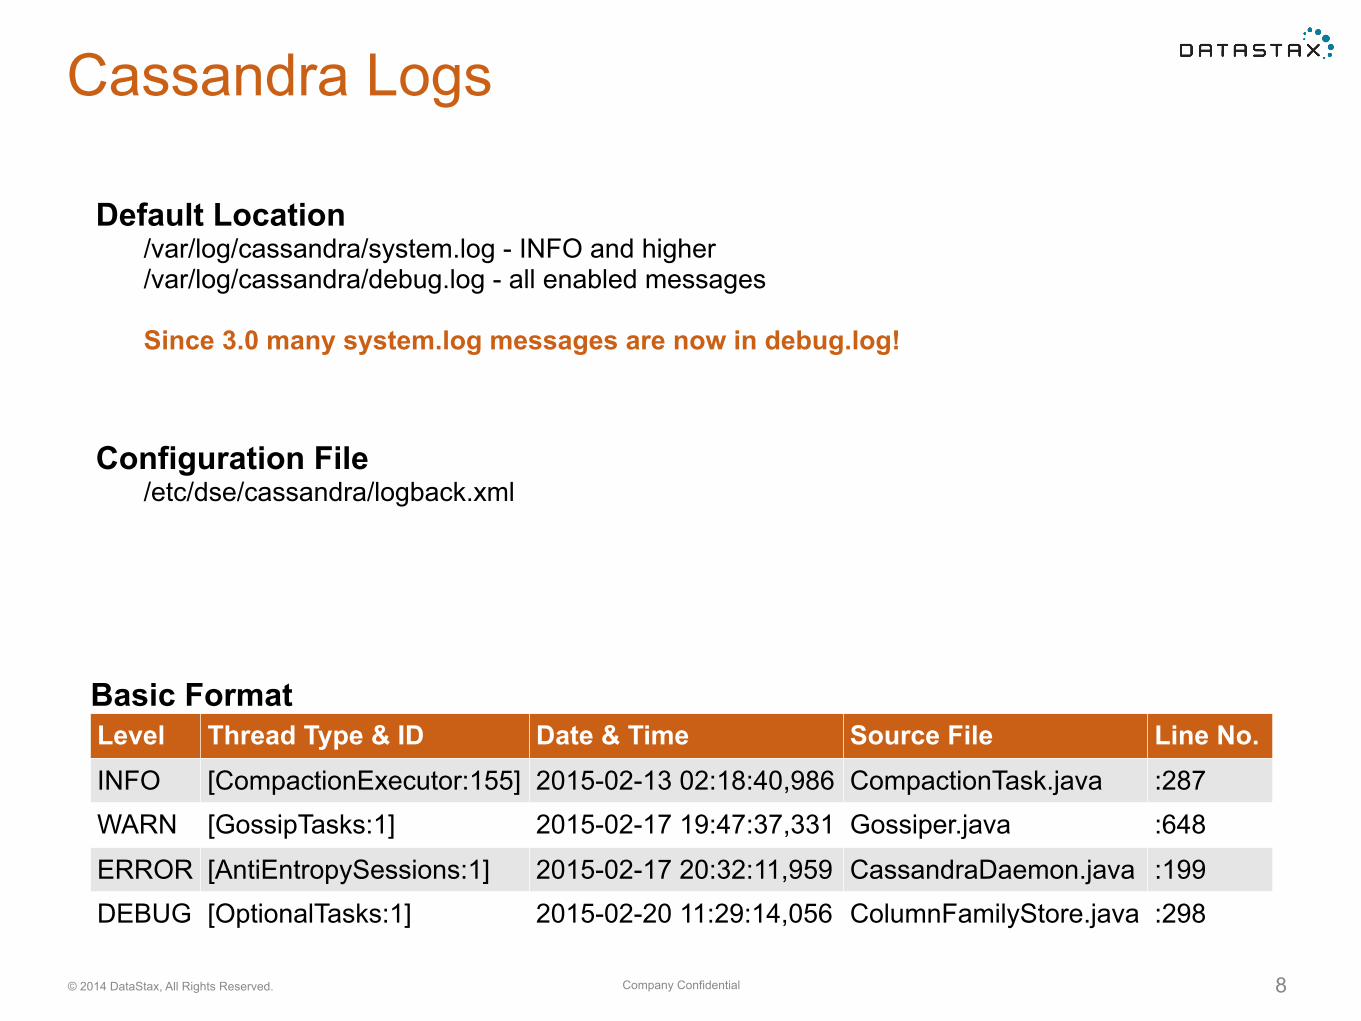
Cassandra Logs
Basic FormatLevel Thread Type & ID Date & Time Source File Line No.INFO [CompactionExecutor:155] 2015-02-13 02:18:40,986 CompactionTask.java :287WARN [GossipTasks:1] 2015-02-17 19:47:37,331 Gossiper.java :648
ERROR [AntiEntropySessions:1] 2015-02-17 20:32:11,959 CassandraDaemon.java :199DEBUG [OptionalTasks:1] 2015-02-20 11:29:14,056 ColumnFamilyStore.java :298
Default Location /var/log/cassandra/system.log - INFO and higher /var/log/cassandra/debug.log - all enabled messages
Since 3.0 many system.log messages are now in debug.log!
Configuration File /etc/dse/cassandra/logback.xml
Company Confidential© 2014 DataStax, All Rights Reserved. 9
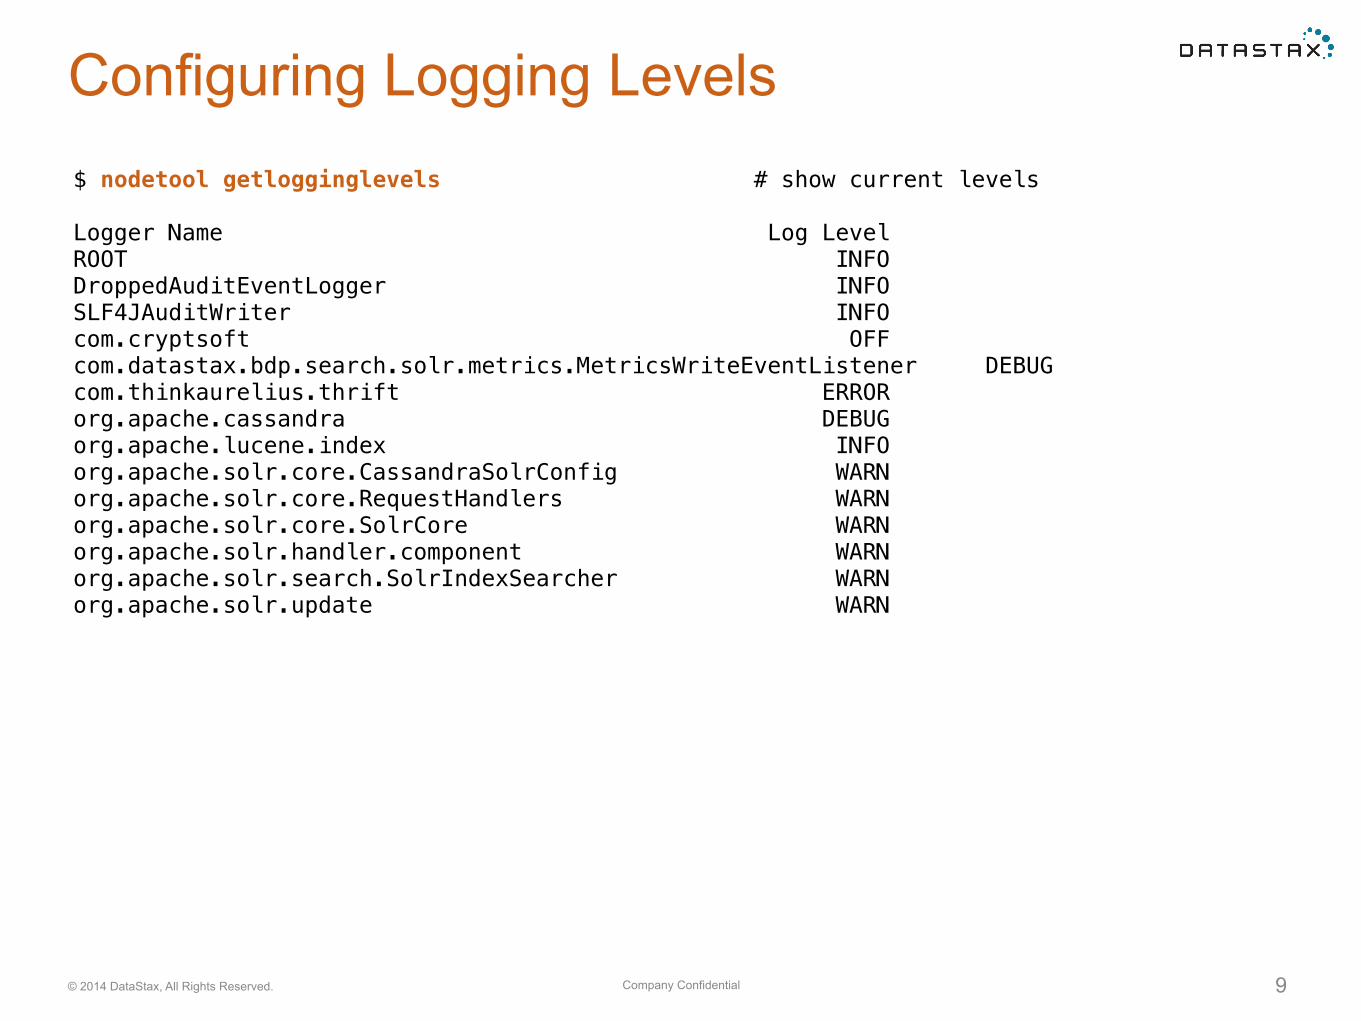
Configuring Logging Levels$ nodetool getlogginglevels # show current levels
Logger Name Log Level ROOT INFO DroppedAuditEventLogger INFO SLF4JAuditWriter INFO com.cryptsoft OFF com.datastax.bdp.search.solr.metrics.MetricsWriteEventListener DEBUG com.thinkaurelius.thrift ERROR org.apache.cassandra DEBUG org.apache.lucene.index INFO org.apache.solr.core.CassandraSolrConfig WARN org.apache.solr.core.RequestHandlers WARN org.apache.solr.core.SolrCore WARN org.apache.solr.handler.component WARN org.apache.solr.search.SolrIndexSearcher WARN org.apache.solr.update WARN
Company Confidential© 2014 DataStax, All Rights Reserved. 10
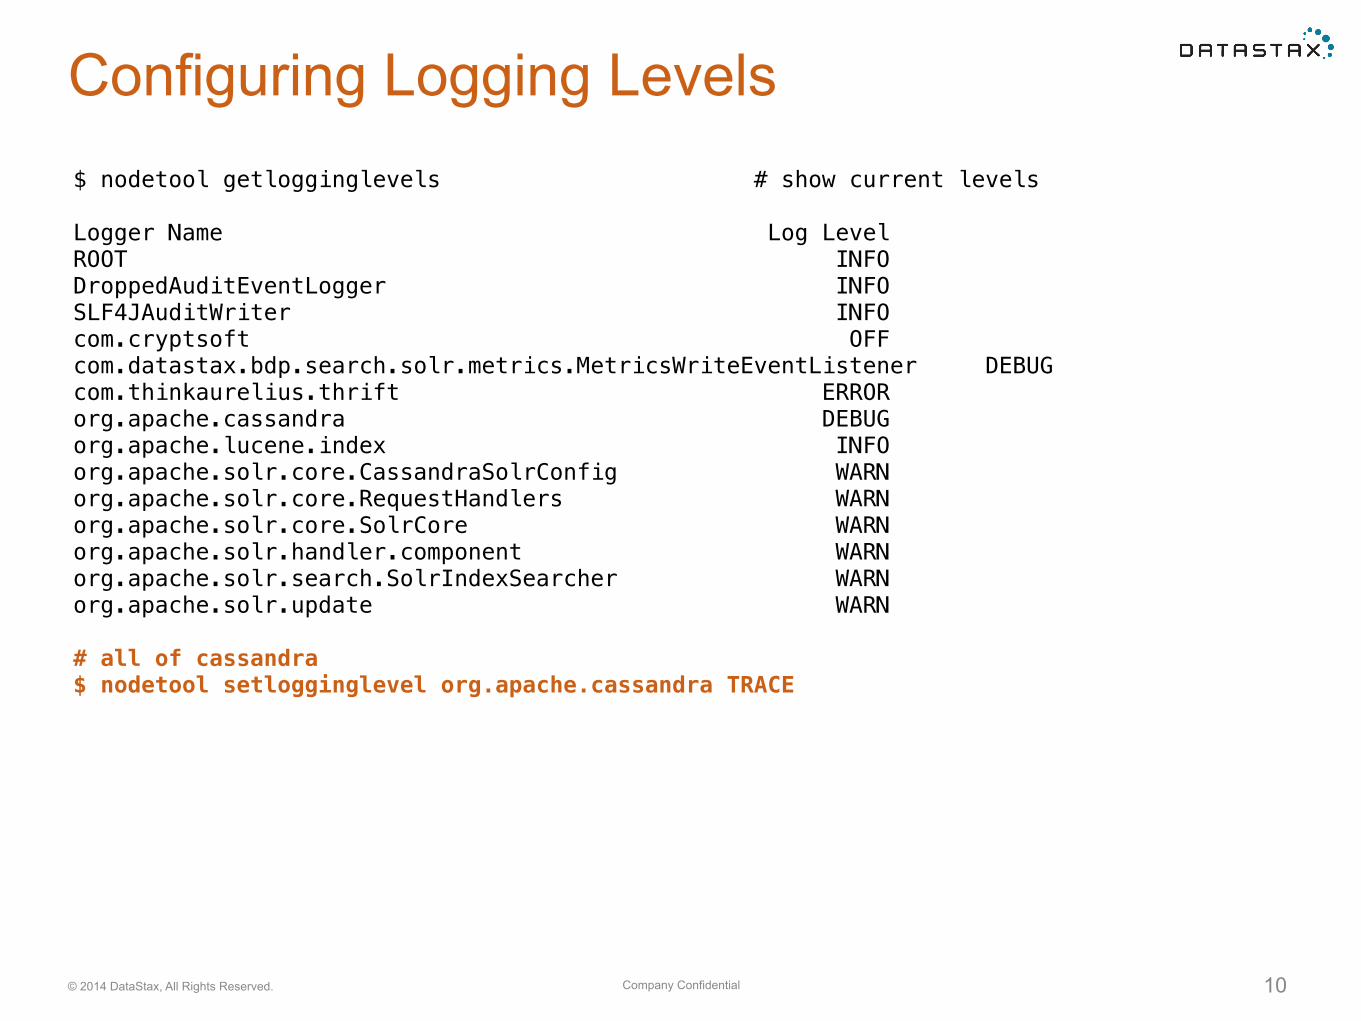
Configuring Logging Levels$ nodetool getlogginglevels # show current levels
Logger Name Log Level ROOT INFO DroppedAuditEventLogger INFO SLF4JAuditWriter INFO com.cryptsoft OFF com.datastax.bdp.search.solr.metrics.MetricsWriteEventListener DEBUG com.thinkaurelius.thrift ERROR org.apache.cassandra DEBUG org.apache.lucene.index INFO org.apache.solr.core.CassandraSolrConfig WARN org.apache.solr.core.RequestHandlers WARN org.apache.solr.core.SolrCore WARN org.apache.solr.handler.component WARN org.apache.solr.search.SolrIndexSearcher WARN org.apache.solr.update WARN
# all of cassandra $ nodetool setlogginglevel org.apache.cassandra TRACE
Company Confidential© 2014 DataStax, All Rights Reserved. 11
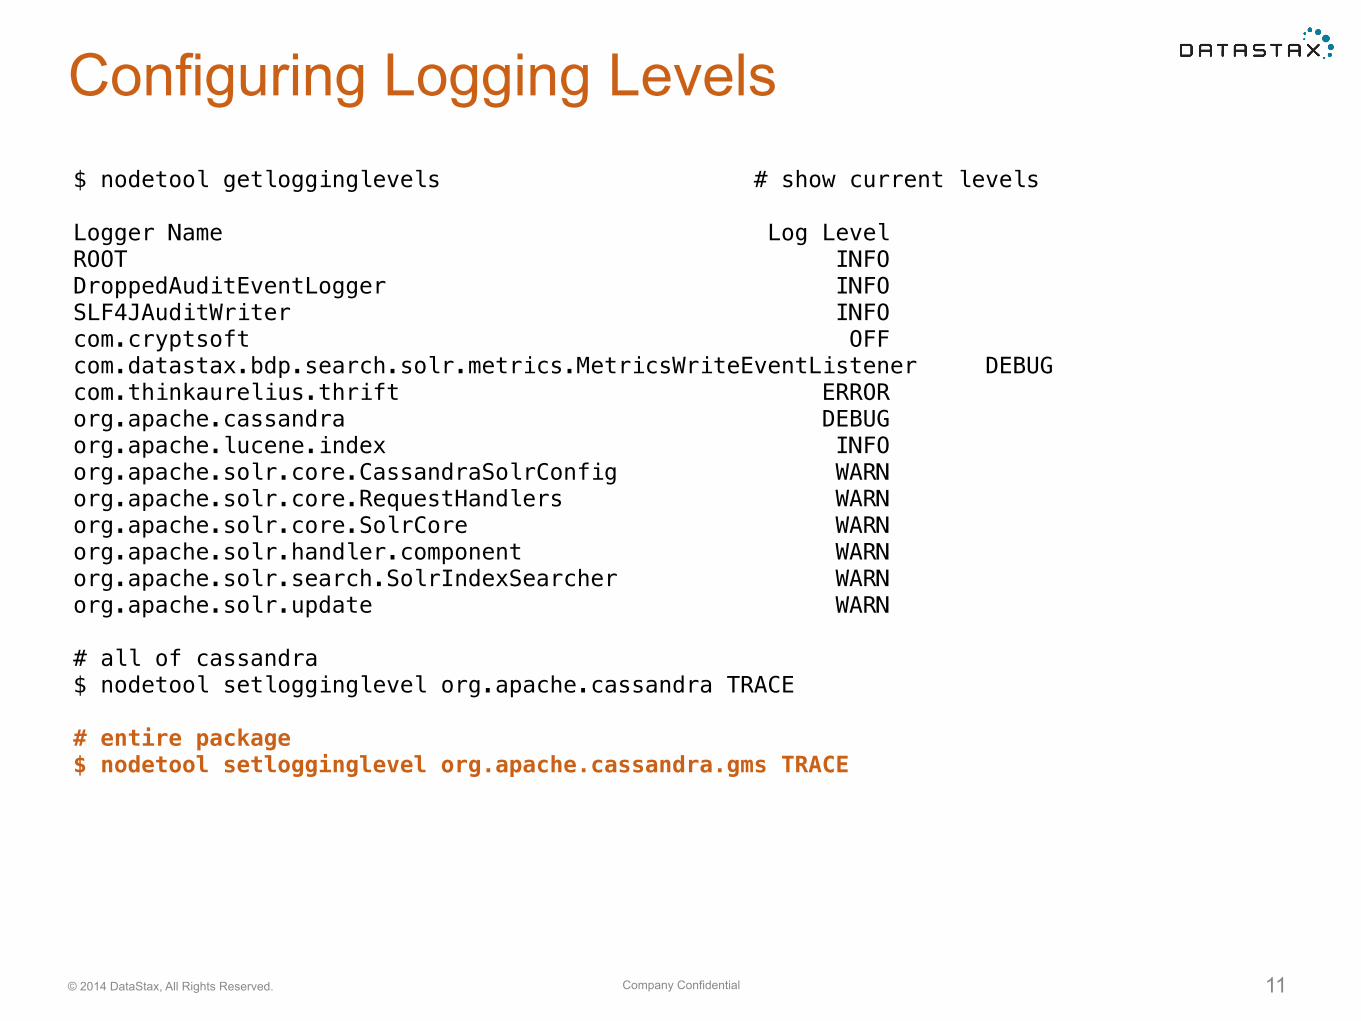
Configuring Logging Levels$ nodetool getlogginglevels # show current levels
Logger Name Log Level ROOT INFO DroppedAuditEventLogger INFO SLF4JAuditWriter INFO com.cryptsoft OFF com.datastax.bdp.search.solr.metrics.MetricsWriteEventListener DEBUG com.thinkaurelius.thrift ERROR org.apache.cassandra DEBUG org.apache.lucene.index INFO org.apache.solr.core.CassandraSolrConfig WARN org.apache.solr.core.RequestHandlers WARN org.apache.solr.core.SolrCore WARN org.apache.solr.handler.component WARN org.apache.solr.search.SolrIndexSearcher WARN org.apache.solr.update WARN
# all of cassandra $ nodetool setlogginglevel org.apache.cassandra TRACE
# entire package $ nodetool setlogginglevel org.apache.cassandra.gms TRACE
Company Confidential© 2014 DataStax, All Rights Reserved. 12
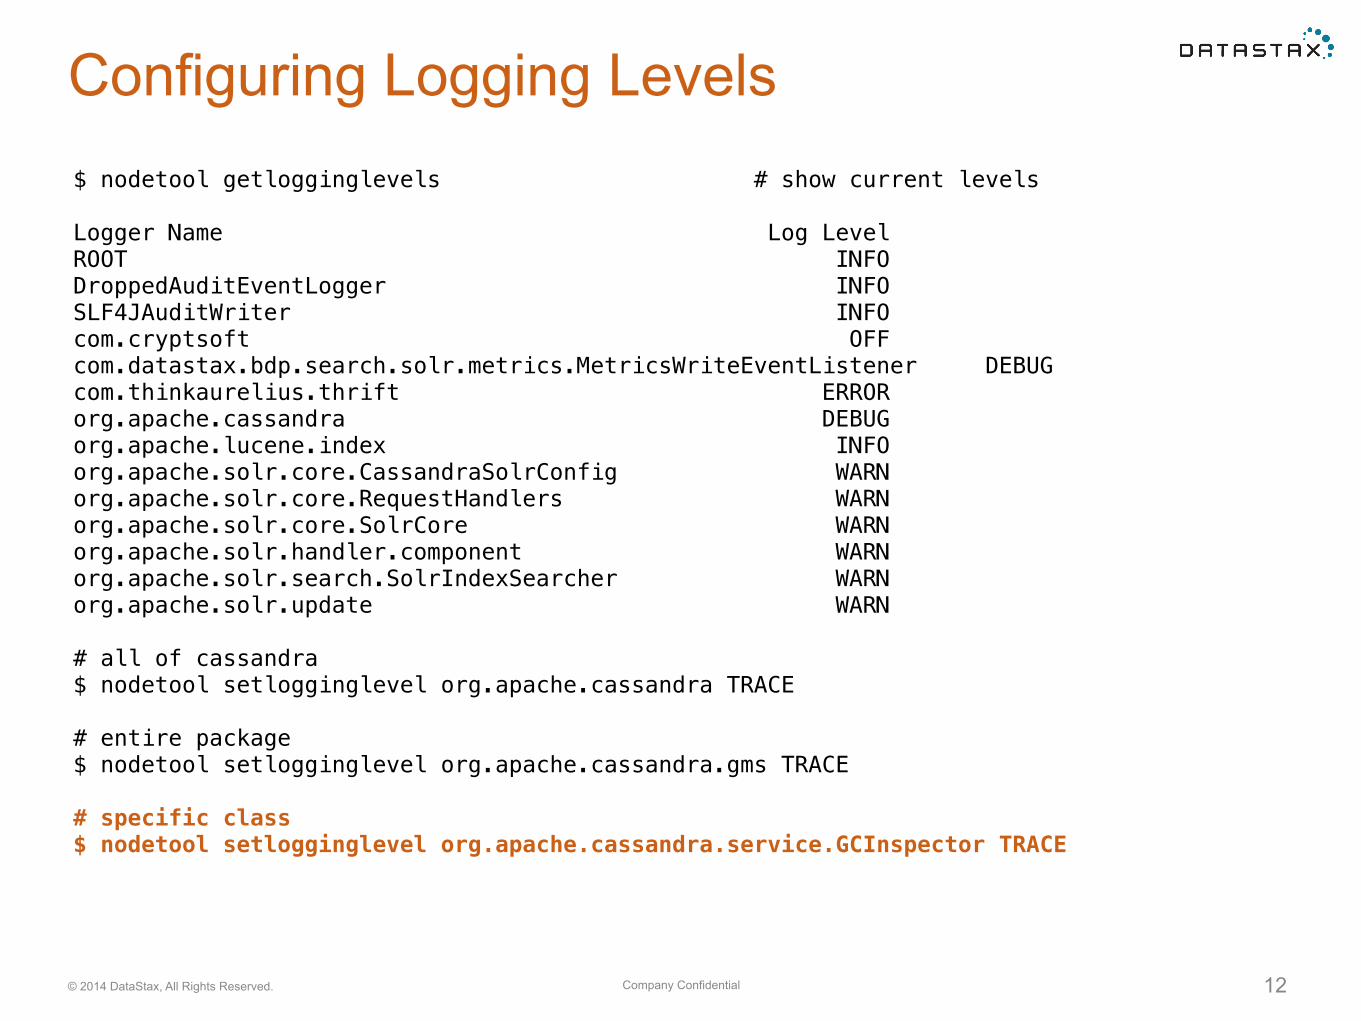
Configuring Logging Levels$ nodetool getlogginglevels # show current levels
Logger Name Log Level ROOT INFO DroppedAuditEventLogger INFO SLF4JAuditWriter INFO com.cryptsoft OFF com.datastax.bdp.search.solr.metrics.MetricsWriteEventListener DEBUG com.thinkaurelius.thrift ERROR org.apache.cassandra DEBUG org.apache.lucene.index INFO org.apache.solr.core.CassandraSolrConfig WARN org.apache.solr.core.RequestHandlers WARN org.apache.solr.core.SolrCore WARN org.apache.solr.handler.component WARN org.apache.solr.search.SolrIndexSearcher WARN org.apache.solr.update WARN
# all of cassandra $ nodetool setlogginglevel org.apache.cassandra TRACE
# entire package $ nodetool setlogginglevel org.apache.cassandra.gms TRACE
# specific class $ nodetool setlogginglevel org.apache.cassandra.service.GCInspector TRACE
Company Confidential© 2014 DataStax, All Rights Reserved. 13
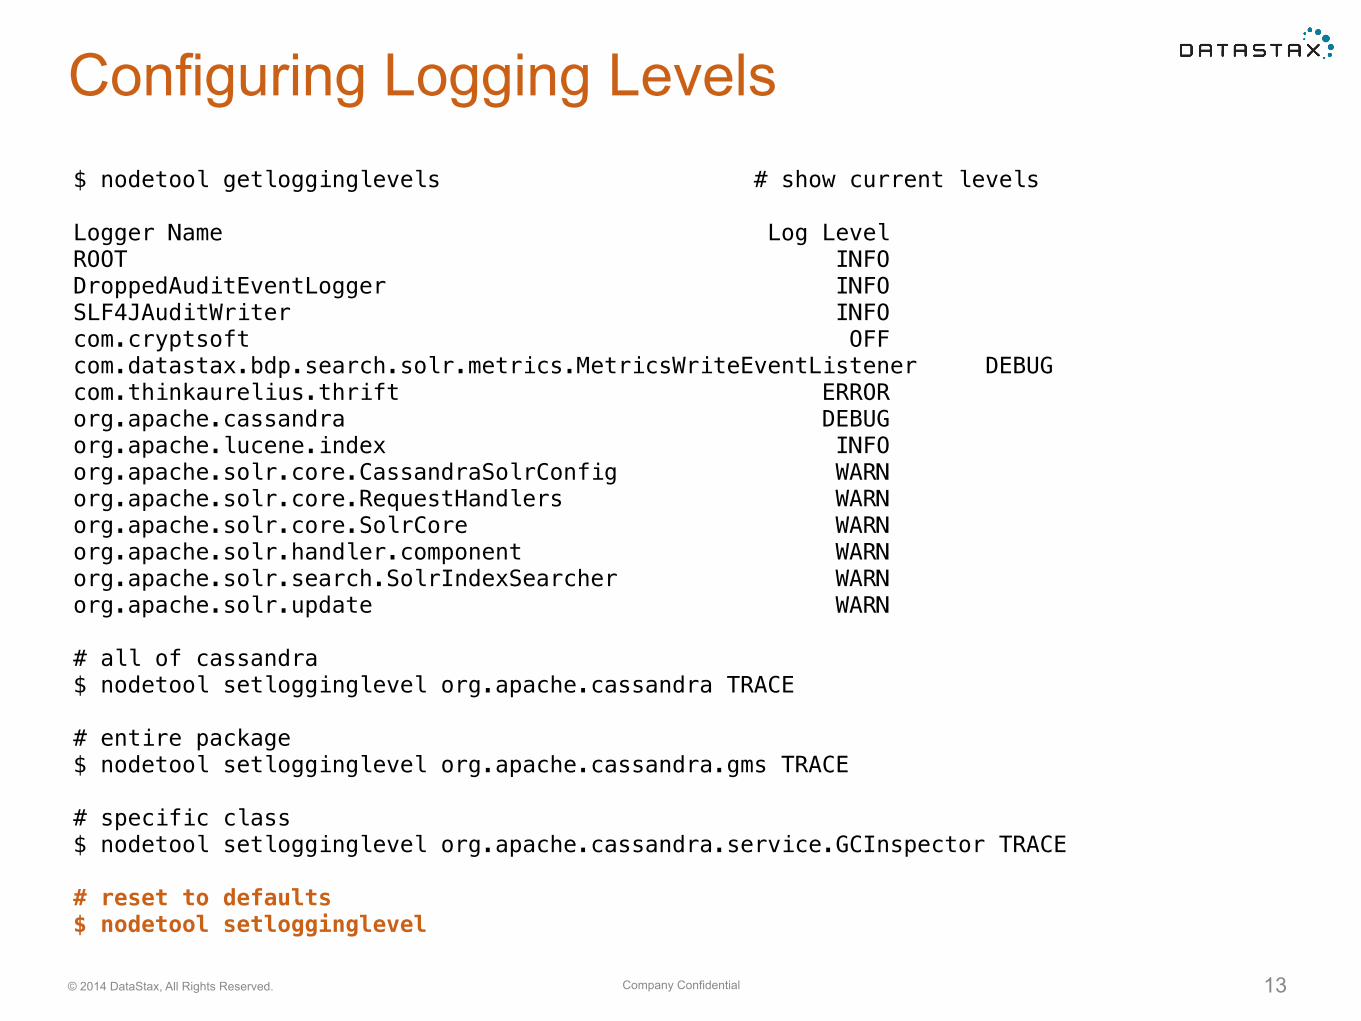
Configuring Logging Levels$ nodetool getlogginglevels # show current levels
Logger Name Log Level ROOT INFO DroppedAuditEventLogger INFO SLF4JAuditWriter INFO com.cryptsoft OFF com.datastax.bdp.search.solr.metrics.MetricsWriteEventListener DEBUG com.thinkaurelius.thrift ERROR org.apache.cassandra DEBUG org.apache.lucene.index INFO org.apache.solr.core.CassandraSolrConfig WARN org.apache.solr.core.RequestHandlers WARN org.apache.solr.core.SolrCore WARN org.apache.solr.handler.component WARN org.apache.solr.search.SolrIndexSearcher WARN org.apache.solr.update WARN
# all of cassandra $ nodetool setlogginglevel org.apache.cassandra TRACE
# entire package $ nodetool setlogginglevel org.apache.cassandra.gms TRACE
# specific class $ nodetool setlogginglevel org.apache.cassandra.service.GCInspector TRACE
# reset to defaults $ nodetool setlogginglevel
Overall status
Company Confidential© 2014 DataStax, All Rights Reserved. 15
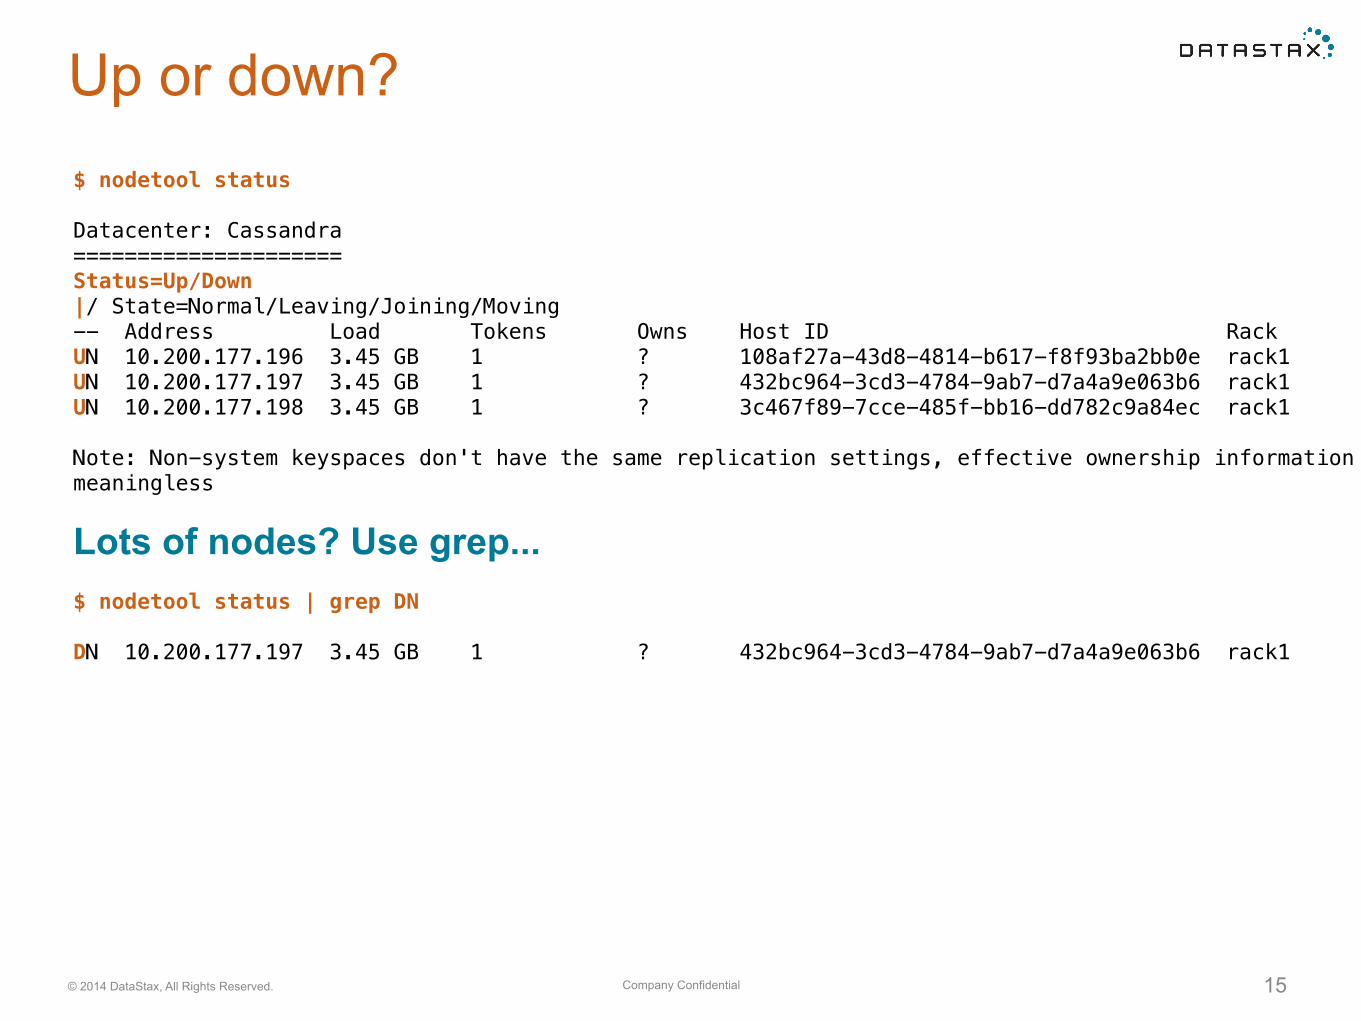
Up or down?$ nodetool status
Datacenter: Cassandra ===================== Status=Up/Down |/ State=Normal/Leaving/Joining/Moving -- Address Load Tokens Owns Host ID Rack UN 10.200.177.196 3.45 GB 1 ? 108af27a-43d8-4814-b617-f8f93ba2bb0e rack1 UN 10.200.177.197 3.45 GB 1 ? 432bc964-3cd3-4784-9ab7-d7a4a9e063b6 rack1 UN 10.200.177.198 3.45 GB 1 ? 3c467f89-7cce-485f-bb16-dd782c9a84ec rack1
Note: Non-system keyspaces don't have the same replication settings, effective ownership information is meaningless
Lots of nodes? Use grep... $ nodetool status | grep DN
DN 10.200.177.197 3.45 GB 1 ? 432bc964-3cd3-4784-9ab7-d7a4a9e063b6 rack1
Company Confidential© 2014 DataStax, All Rights Reserved. 16
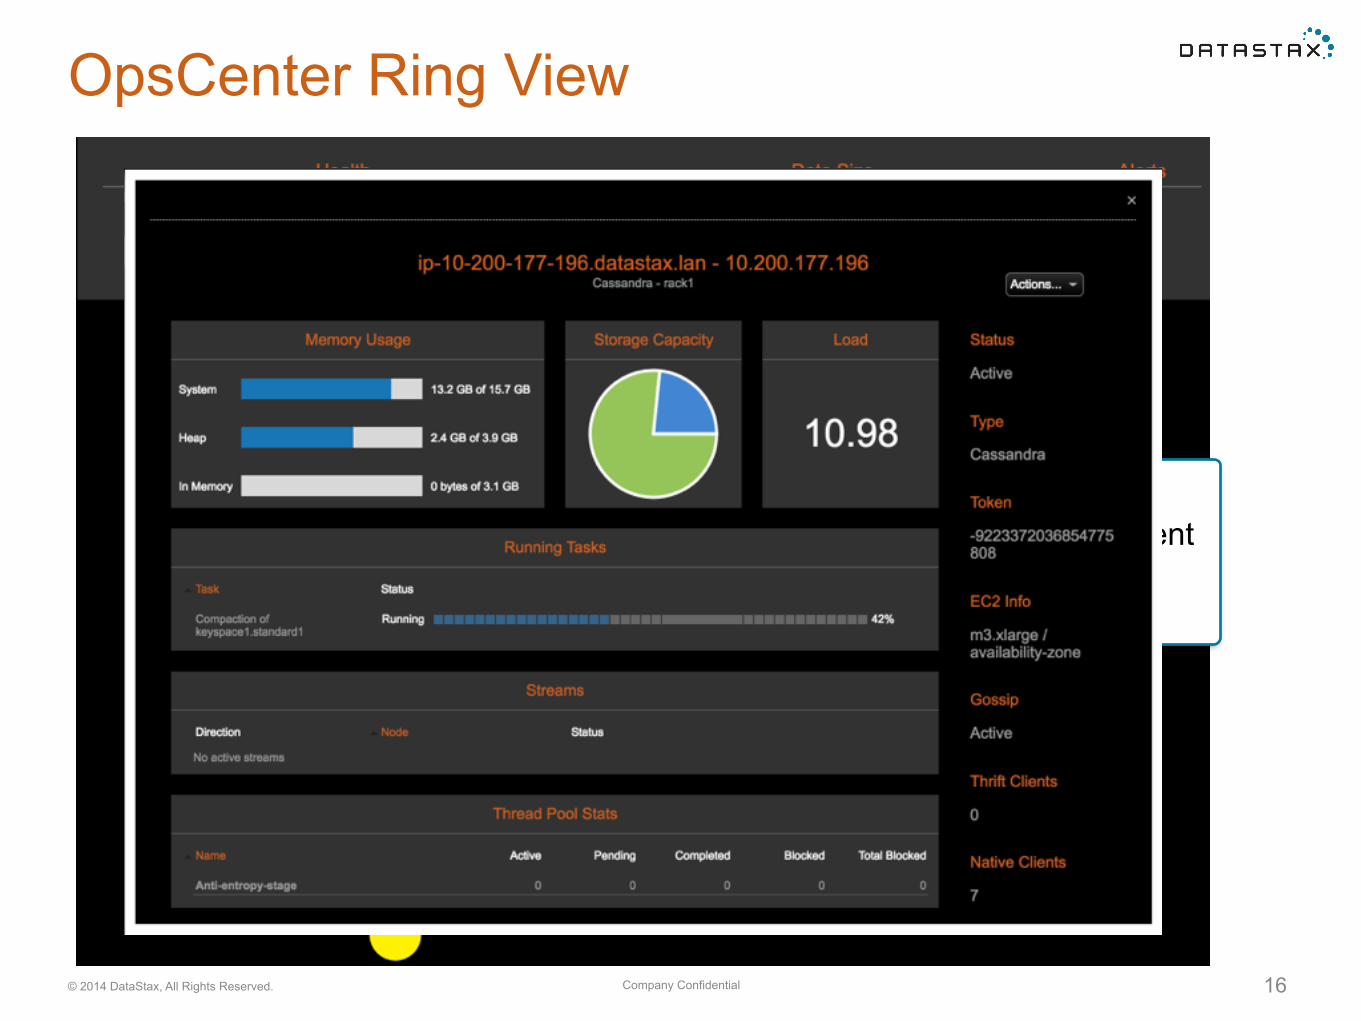
OpsCenter Ring View
• Hover over a node for details • Click on node for even more
• Size indicates data volume • Position indicates token alignment • Color indicates load • Grey means node is down
Company Confidential© 2014 DataStax, All Rights Reserved. 17
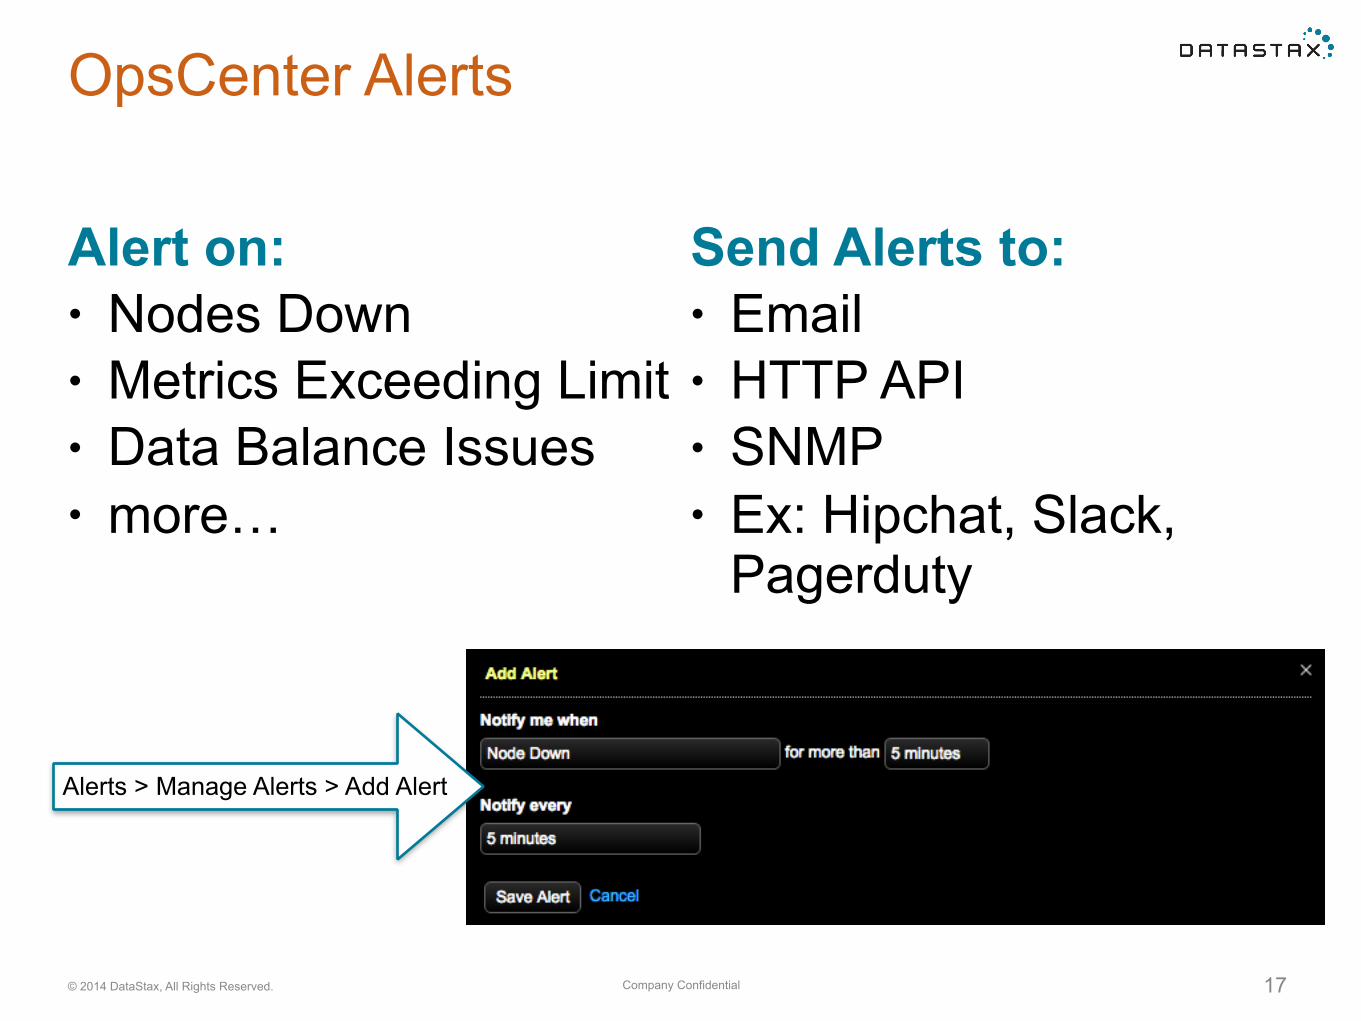
Send Alerts to: • Email • HTTP API • SNMP • Ex: Hipchat, Slack,
Pagerduty
OpsCenter Alerts
Alert on: • Nodes Down • Metrics Exceeding Limit • Data Balance Issues • more…
Alerts > Manage Alerts > Add Alert

Reads and Writes

Latency
Company Confidential© 2014 DataStax, All Rights Reserved. 20
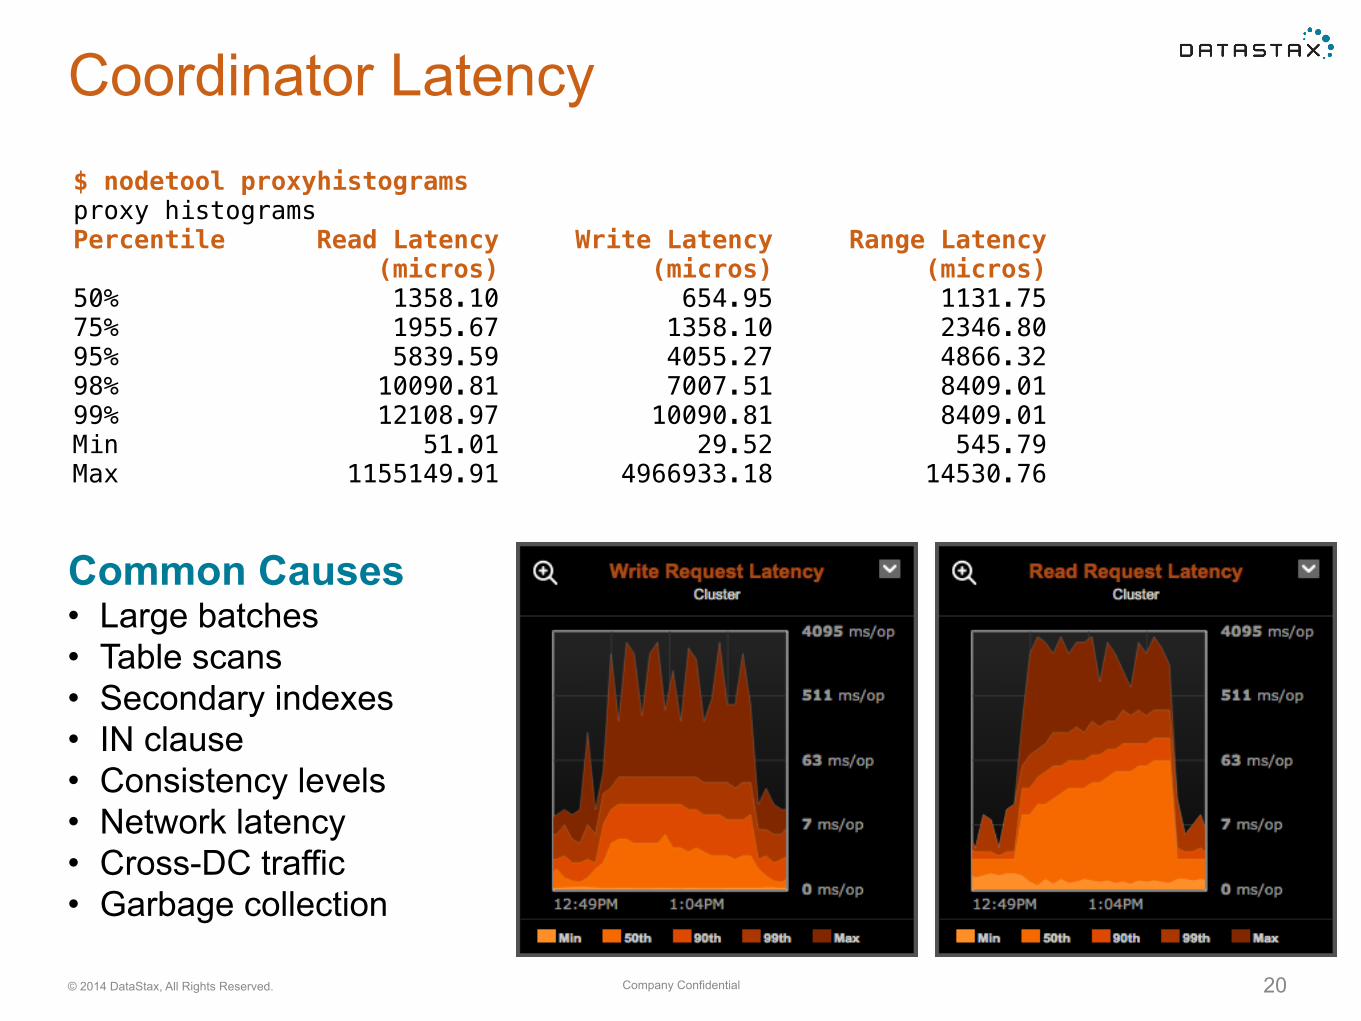
Coordinator Latency$ nodetool proxyhistograms proxy histograms Percentile Read Latency Write Latency Range Latency (micros) (micros) (micros) 50% 1358.10 654.95 1131.75 75% 1955.67 1358.10 2346.80 95% 5839.59 4055.27 4866.32 98% 10090.81 7007.51 8409.01 99% 12108.97 10090.81 8409.01 Min 51.01 29.52 545.79 Max 1155149.91 4966933.18 14530.76
Common Causes • Large batches • Table scans • Secondary indexes • IN clause • Consistency levels • Network latency • Cross-DC traffic • Garbage collection
Company Confidential© 2014 DataStax, All Rights Reserved. 21
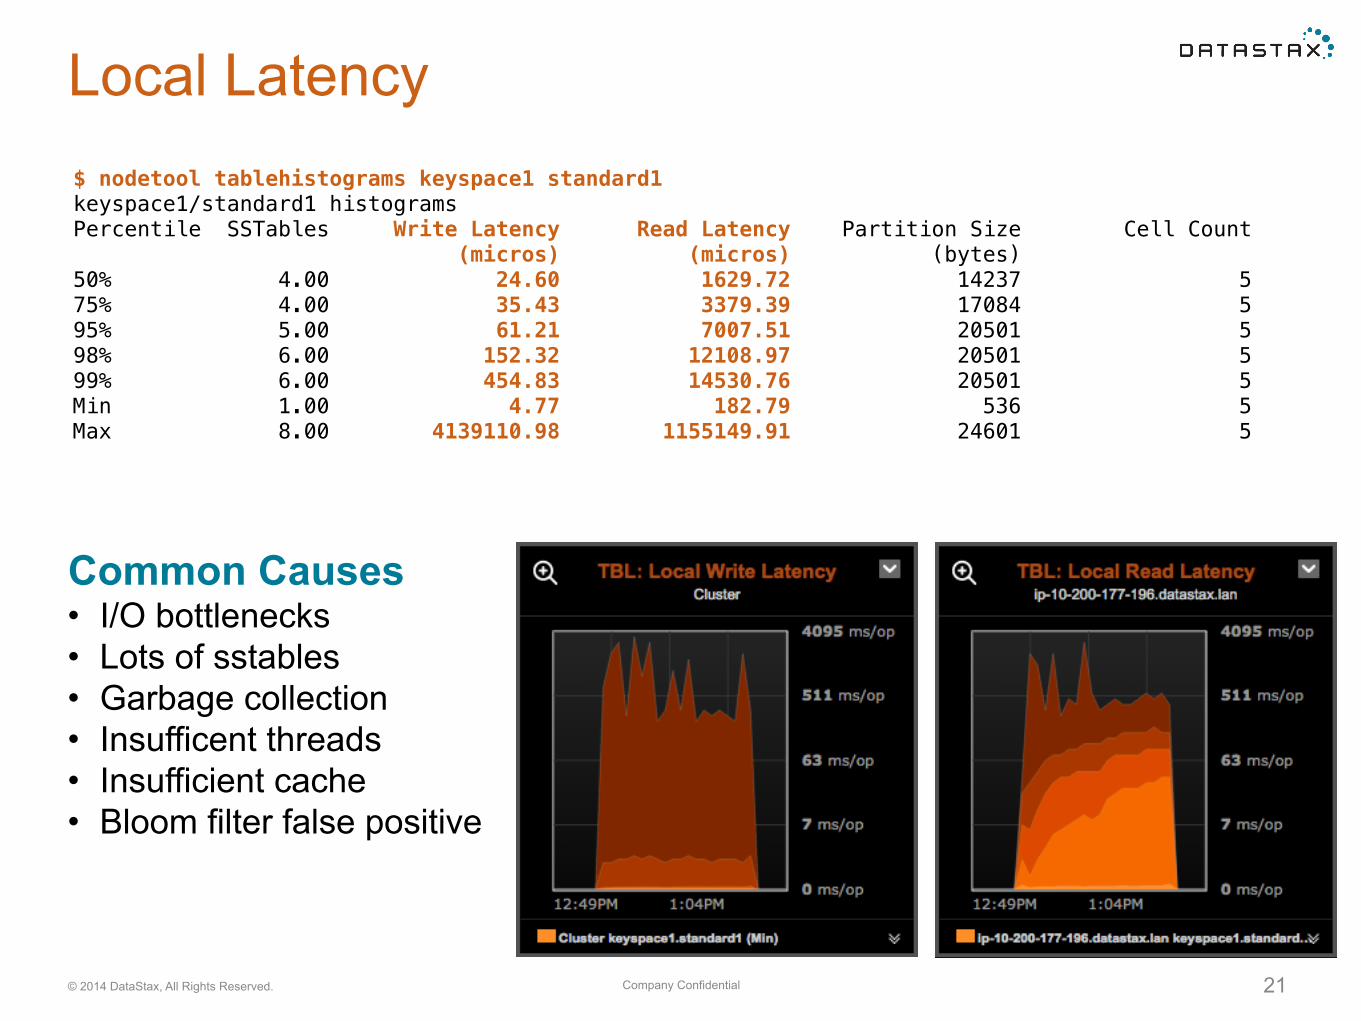
Local Latency$ nodetool tablehistograms keyspace1 standard1 keyspace1/standard1 histograms Percentile SSTables Write Latency Read Latency Partition Size Cell Count (micros) (micros) (bytes) 50% 4.00 24.60 1629.72 14237 5 75% 4.00 35.43 3379.39 17084 5 95% 5.00 61.21 7007.51 20501 5 98% 6.00 152.32 12108.97 20501 5 99% 6.00 454.83 14530.76 20501 5 Min 1.00 4.77 182.79 536 5 Max 8.00 4139110.98 1155149.91 24601 5
Common Causes • I/O bottlenecks • Lots of sstables • Garbage collection • Insufficent threads • Insufficient cache • Bloom filter false positive
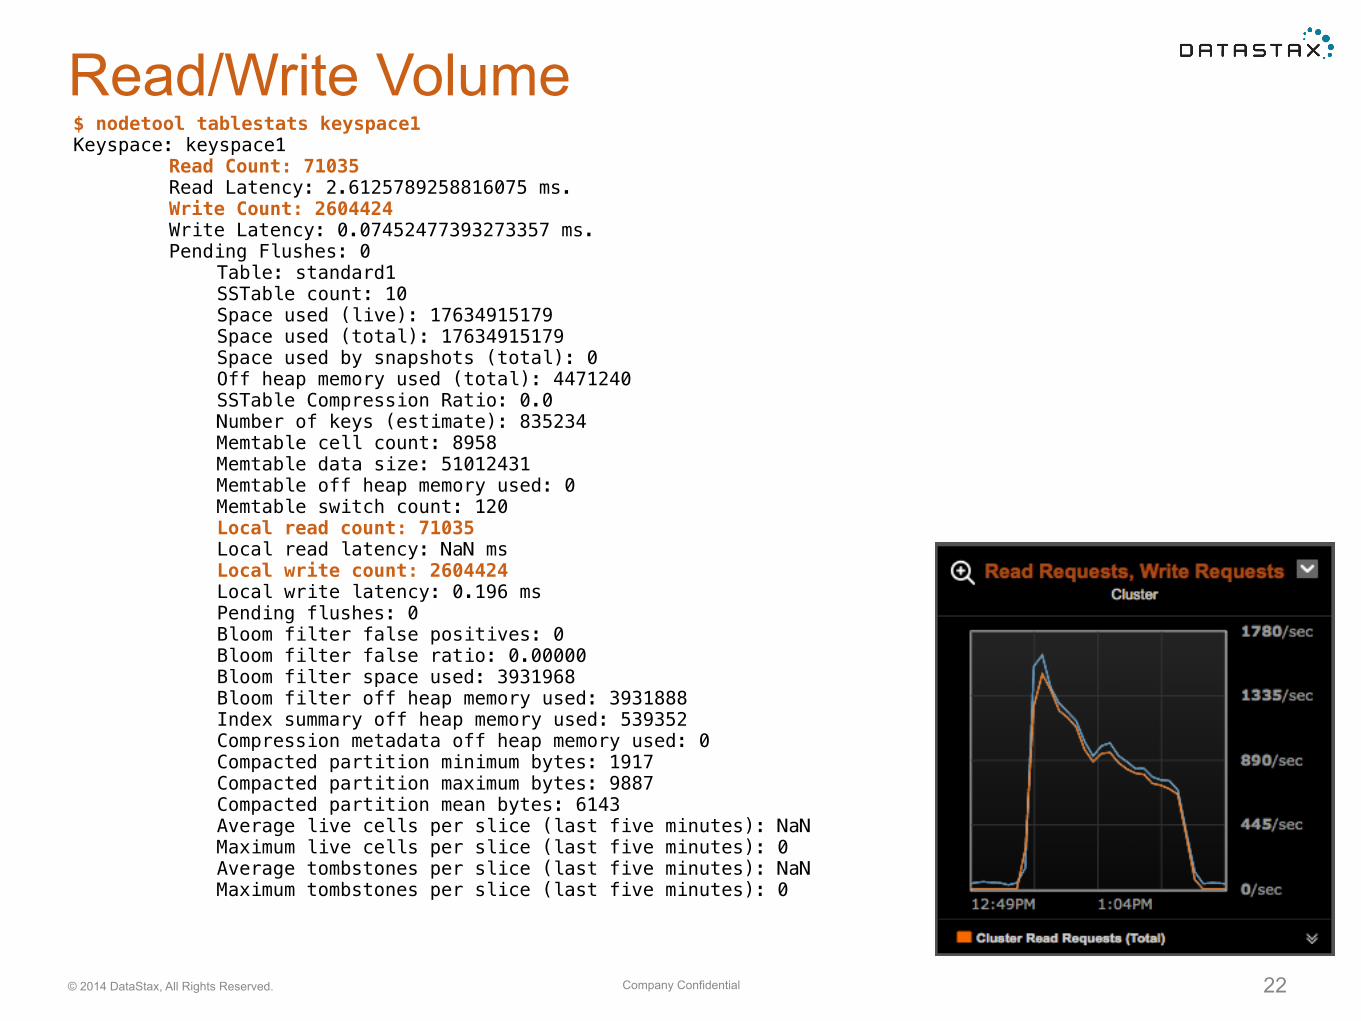
Company Confidential© 2014 DataStax, All Rights Reserved. 22
Read/Write Volume$ nodetool tablestats keyspace1 Keyspace: keyspace1 Read Count: 71035 Read Latency: 2.6125789258816075 ms. Write Count: 2604424 Write Latency: 0.07452477393273357 ms. Pending Flushes: 0 Table: standard1 SSTable count: 10 Space used (live): 17634915179 Space used (total): 17634915179 Space used by snapshots (total): 0 Off heap memory used (total): 4471240 SSTable Compression Ratio: 0.0 Number of keys (estimate): 835234 Memtable cell count: 8958 Memtable data size: 51012431 Memtable off heap memory used: 0 Memtable switch count: 120 Local read count: 71035 Local read latency: NaN ms Local write count: 2604424 Local write latency: 0.196 ms Pending flushes: 0 Bloom filter false positives: 0 Bloom filter false ratio: 0.00000 Bloom filter space used: 3931968 Bloom filter off heap memory used: 3931888 Index summary off heap memory used: 539352 Compression metadata off heap memory used: 0 Compacted partition minimum bytes: 1917 Compacted partition maximum bytes: 9887 Compacted partition mean bytes: 6143 Average live cells per slice (last five minutes): NaN Maximum live cells per slice (last five minutes): 0 Average tombstones per slice (last five minutes): NaN Maximum tombstones per slice (last five minutes): 0
Thread Pools and Timeouts
Company Confidential© 2014 DataStax, All Rights Reserved. 24
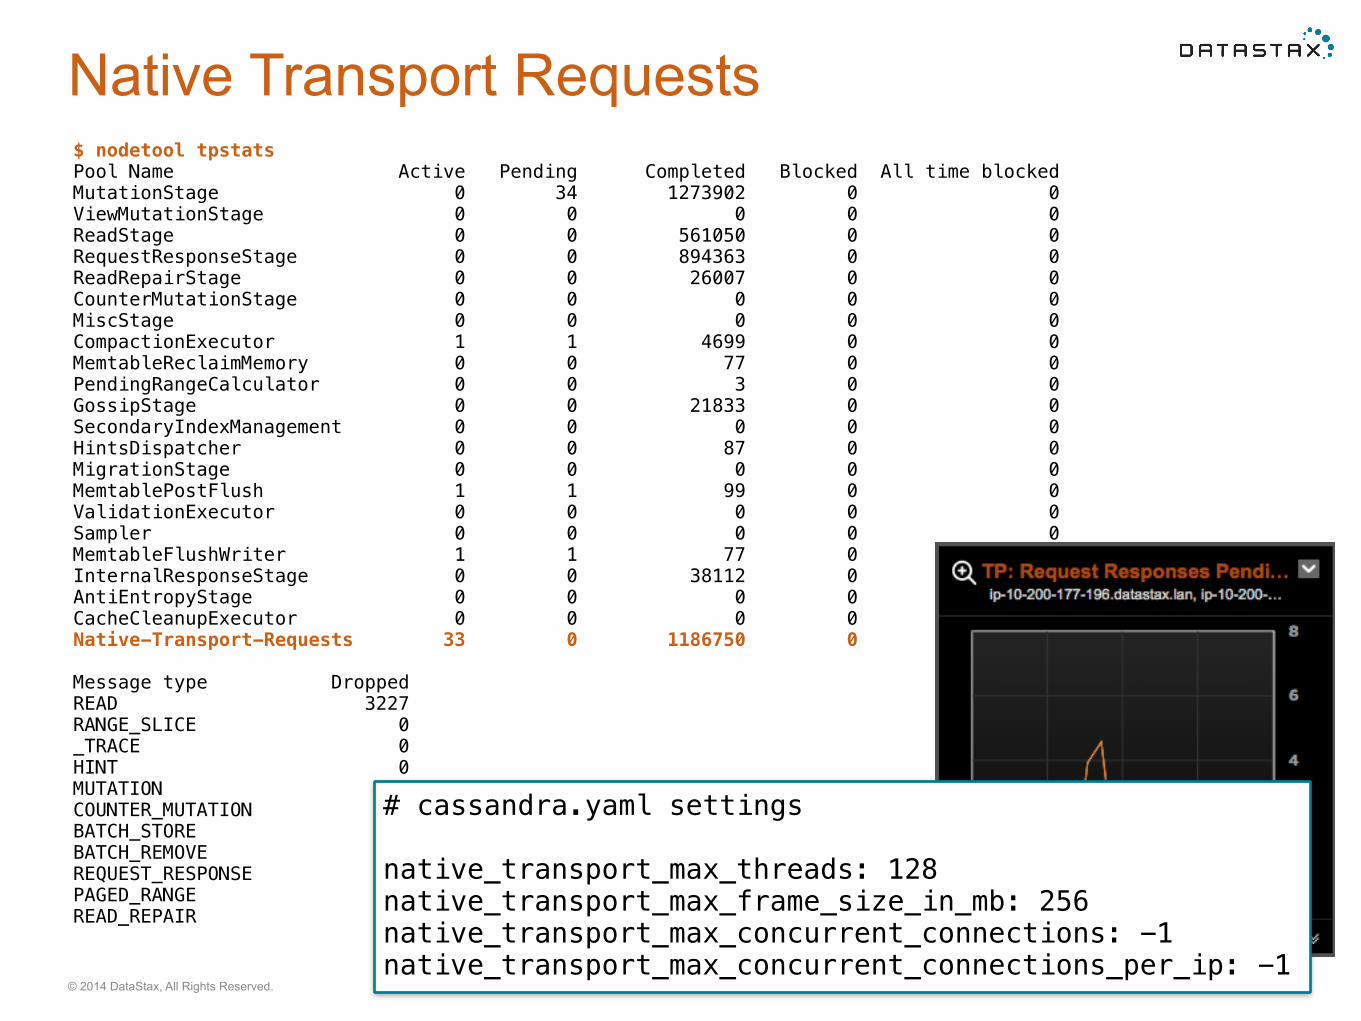
Native Transport Requests$ nodetool tpstats Pool Name Active Pending Completed Blocked All time blocked MutationStage 0 34 1273902 0 0 ViewMutationStage 0 0 0 0 0 ReadStage 0 0 561050 0 0 RequestResponseStage 0 0 894363 0 0 ReadRepairStage 0 0 26007 0 0 CounterMutationStage 0 0 0 0 0 MiscStage 0 0 0 0 0 CompactionExecutor 1 1 4699 0 0 MemtableReclaimMemory 0 0 77 0 0 PendingRangeCalculator 0 0 3 0 0 GossipStage 0 0 21833 0 0 SecondaryIndexManagement 0 0 0 0 0 HintsDispatcher 0 0 87 0 0 MigrationStage 0 0 0 0 0 MemtablePostFlush 1 1 99 0 0 ValidationExecutor 0 0 0 0 0 Sampler 0 0 0 0 0 MemtableFlushWriter 1 1 77 0 0 InternalResponseStage 0 0 38112 0 0 AntiEntropyStage 0 0 0 0 0 CacheCleanupExecutor 0 0 0 0 0 Native-Transport-Requests 33 0 1186750 0 9
Message type Dropped READ 3227 RANGE_SLICE 0 _TRACE 0 HINT 0 MUTATION 144 COUNTER_MUTATION 0 BATCH_STORE 0 BATCH_REMOVE 0 REQUEST_RESPONSE 10 PAGED_RANGE 0 READ_REPAIR 0
# cassandra.yaml settings
native_transport_max_threads: 128 native_transport_max_frame_size_in_mb: 256 native_transport_max_concurrent_connections: -1 native_transport_max_concurrent_connections_per_ip: -1
Company Confidential© 2014 DataStax, All Rights Reserved. 25
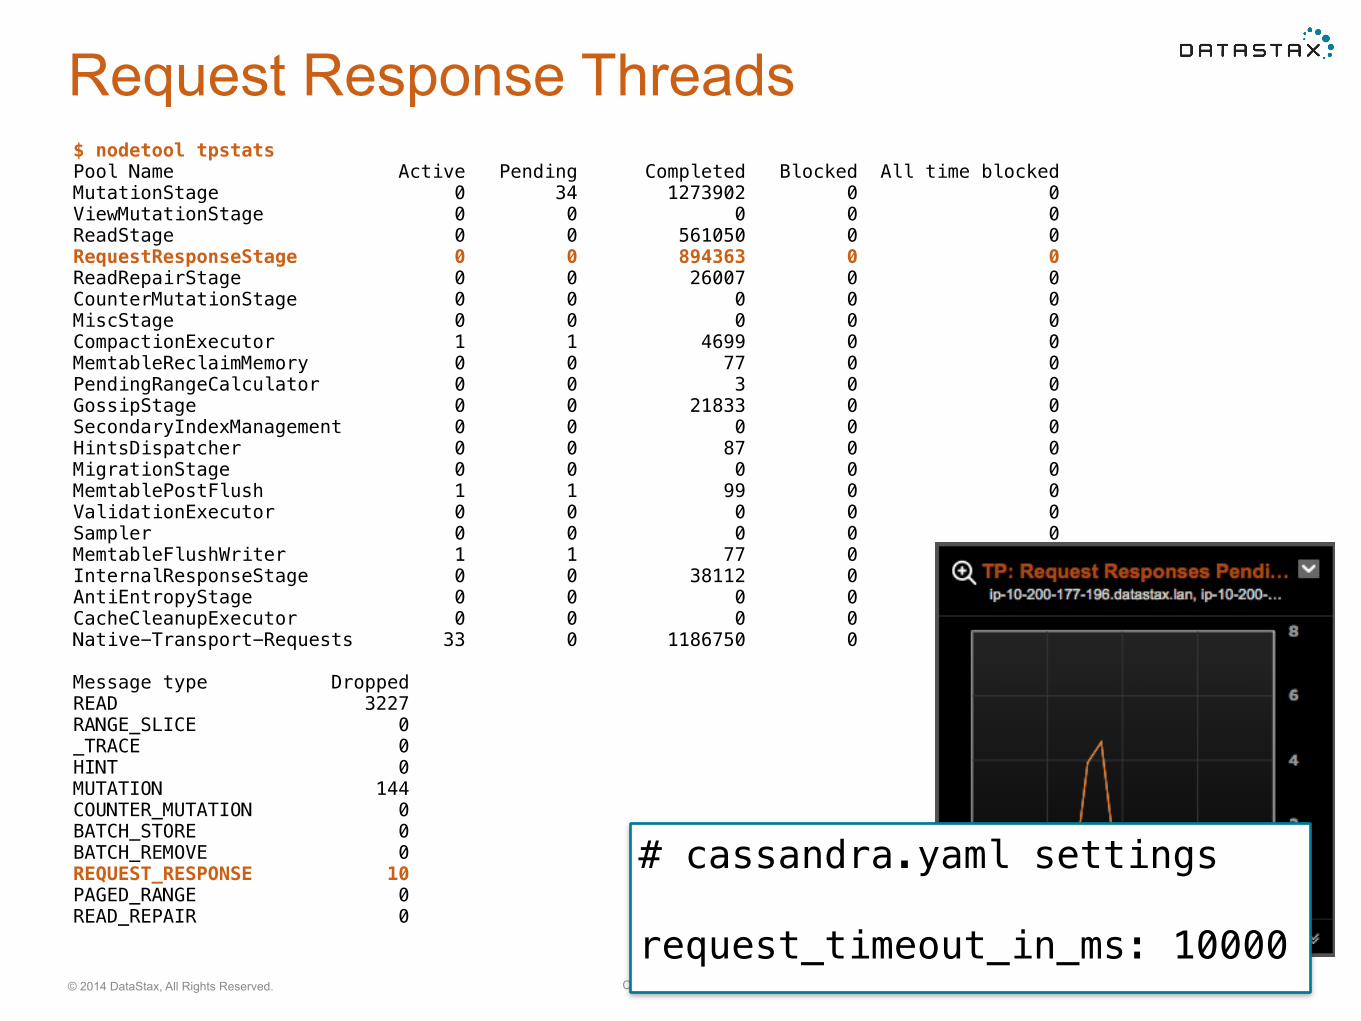
Request Response Threads$ nodetool tpstats Pool Name Active Pending Completed Blocked All time blocked MutationStage 0 34 1273902 0 0 ViewMutationStage 0 0 0 0 0 ReadStage 0 0 561050 0 0 RequestResponseStage 0 0 894363 0 0 ReadRepairStage 0 0 26007 0 0 CounterMutationStage 0 0 0 0 0 MiscStage 0 0 0 0 0 CompactionExecutor 1 1 4699 0 0 MemtableReclaimMemory 0 0 77 0 0 PendingRangeCalculator 0 0 3 0 0 GossipStage 0 0 21833 0 0 SecondaryIndexManagement 0 0 0 0 0 HintsDispatcher 0 0 87 0 0 MigrationStage 0 0 0 0 0 MemtablePostFlush 1 1 99 0 0 ValidationExecutor 0 0 0 0 0 Sampler 0 0 0 0 0 MemtableFlushWriter 1 1 77 0 0 InternalResponseStage 0 0 38112 0 0 AntiEntropyStage 0 0 0 0 0 CacheCleanupExecutor 0 0 0 0 0 Native-Transport-Requests 33 0 1186750 0 9
Message type Dropped READ 3227 RANGE_SLICE 0 _TRACE 0 HINT 0 MUTATION 144 COUNTER_MUTATION 0 BATCH_STORE 0 BATCH_REMOVE 0 REQUEST_RESPONSE 10 PAGED_RANGE 0 READ_REPAIR 0
# cassandra.yaml settings
request_timeout_in_ms: 10000
Company Confidential© 2014 DataStax, All Rights Reserved. 26
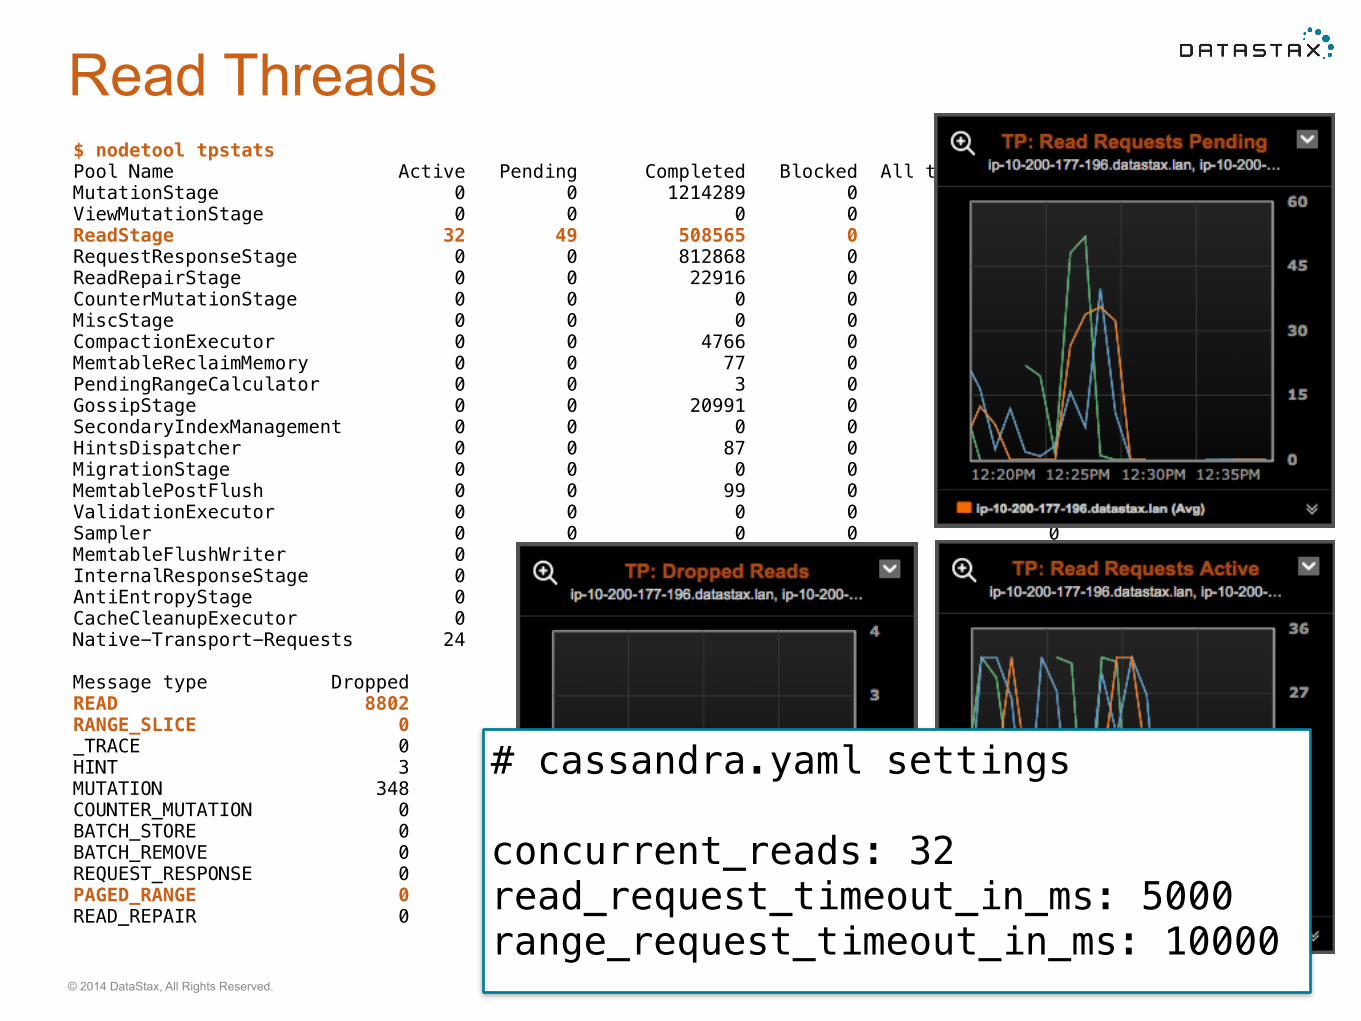
Read Threads$ nodetool tpstats Pool Name Active Pending Completed Blocked All time blocked MutationStage 0 0 1214289 0 0 ViewMutationStage 0 0 0 0 0 ReadStage 32 49 508565 0 0 RequestResponseStage 0 0 812868 0 0 ReadRepairStage 0 0 22916 0 0 CounterMutationStage 0 0 0 0 0 MiscStage 0 0 0 0 0 CompactionExecutor 0 0 4766 0 0 MemtableReclaimMemory 0 0 77 0 0 PendingRangeCalculator 0 0 3 0 0 GossipStage 0 0 20991 0 0 SecondaryIndexManagement 0 0 0 0 0 HintsDispatcher 0 0 87 0 0 MigrationStage 0 0 0 0 0 MemtablePostFlush 0 0 99 0 0 ValidationExecutor 0 0 0 0 0 Sampler 0 0 0 0 0 MemtableFlushWriter 0 0 77 0 0 InternalResponseStage 0 0 24619 0 0 AntiEntropyStage 0 0 0 0 0 CacheCleanupExecutor 0 0 0 0 0 Native-Transport-Requests 24 3 1047506 0 19
Message type Dropped READ 8802 RANGE_SLICE 0 _TRACE 0 HINT 3 MUTATION 348 COUNTER_MUTATION 0 BATCH_STORE 0 BATCH_REMOVE 0 REQUEST_RESPONSE 0 PAGED_RANGE 0 READ_REPAIR 0
# cassandra.yaml settings
concurrent_reads: 32 read_request_timeout_in_ms: 5000 range_request_timeout_in_ms: 10000
Company Confidential© 2014 DataStax, All Rights Reserved. 27
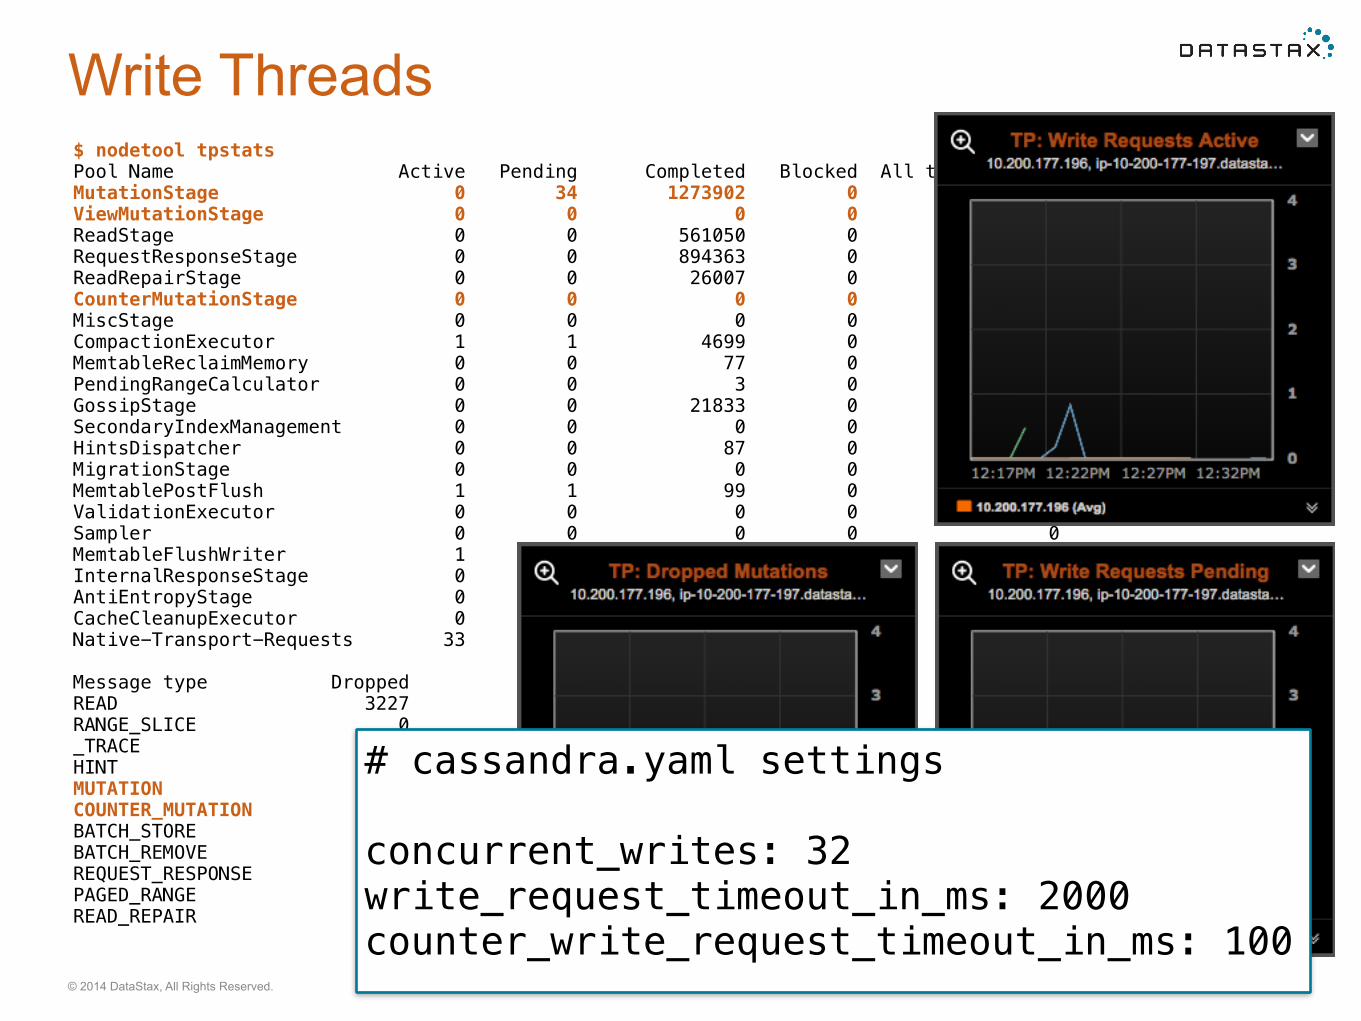
Write Threads$ nodetool tpstats Pool Name Active Pending Completed Blocked All time blocked MutationStage 0 34 1273902 0 0 ViewMutationStage 0 0 0 0 0 ReadStage 0 0 561050 0 0 RequestResponseStage 0 0 894363 0 0 ReadRepairStage 0 0 26007 0 0 CounterMutationStage 0 0 0 0 0 MiscStage 0 0 0 0 0 CompactionExecutor 1 1 4699 0 0 MemtableReclaimMemory 0 0 77 0 0 PendingRangeCalculator 0 0 3 0 0 GossipStage 0 0 21833 0 0 SecondaryIndexManagement 0 0 0 0 0 HintsDispatcher 0 0 87 0 0 MigrationStage 0 0 0 0 0 MemtablePostFlush 1 1 99 0 0 ValidationExecutor 0 0 0 0 0 Sampler 0 0 0 0 0 MemtableFlushWriter 1 1 77 0 0 InternalResponseStage 0 0 38112 0 0 AntiEntropyStage 0 0 0 0 0 CacheCleanupExecutor 0 0 0 0 0 Native-Transport-Requests 33 0 1186750 0 9
Message type Dropped READ 3227 RANGE_SLICE 0 _TRACE 0 HINT 0 MUTATION 144 COUNTER_MUTATION 0 BATCH_STORE 0 BATCH_REMOVE 0 REQUEST_RESPONSE 0 PAGED_RANGE 0 READ_REPAIR 0
# cassandra.yaml settings
concurrent_writes: 32 write_request_timeout_in_ms: 2000 counter_write_request_timeout_in_ms: 100
SSTables
Company Confidential© 2014 DataStax, All Rights Reserved. 29
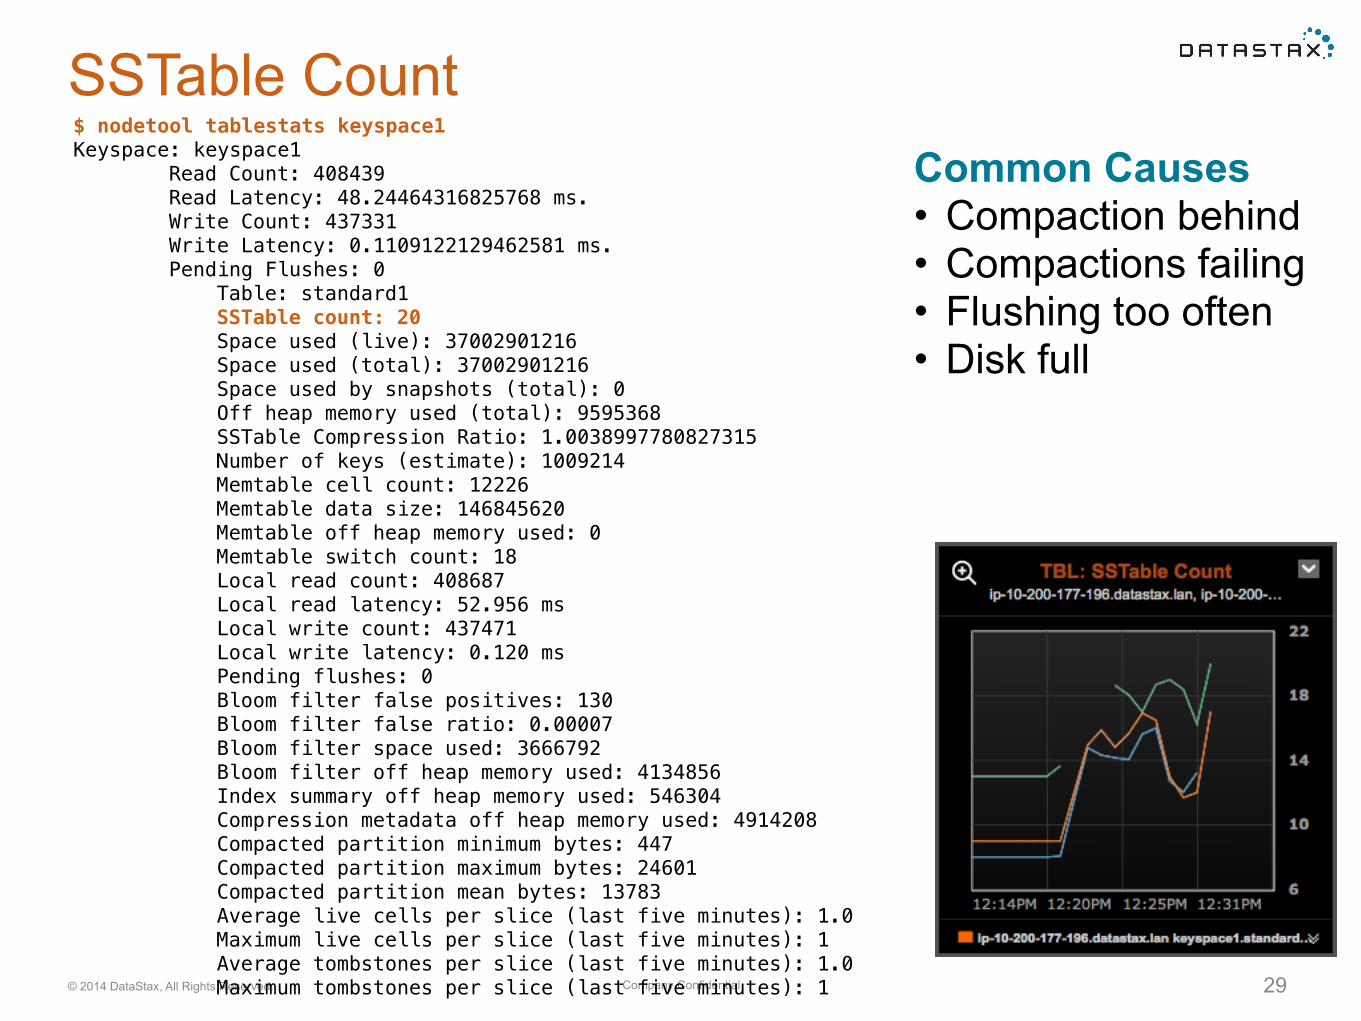
SSTable Count$ nodetool tablestats keyspace1 Keyspace: keyspace1 Read Count: 408439 Read Latency: 48.24464316825768 ms. Write Count: 437331 Write Latency: 0.1109122129462581 ms. Pending Flushes: 0 Table: standard1 SSTable count: 20 Space used (live): 37002901216 Space used (total): 37002901216 Space used by snapshots (total): 0 Off heap memory used (total): 9595368 SSTable Compression Ratio: 1.0038997780827315 Number of keys (estimate): 1009214 Memtable cell count: 12226 Memtable data size: 146845620 Memtable off heap memory used: 0 Memtable switch count: 18 Local read count: 408687 Local read latency: 52.956 ms Local write count: 437471 Local write latency: 0.120 ms Pending flushes: 0 Bloom filter false positives: 130 Bloom filter false ratio: 0.00007 Bloom filter space used: 3666792 Bloom filter off heap memory used: 4134856 Index summary off heap memory used: 546304 Compression metadata off heap memory used: 4914208 Compacted partition minimum bytes: 447 Compacted partition maximum bytes: 24601 Compacted partition mean bytes: 13783 Average live cells per slice (last five minutes): 1.0 Maximum live cells per slice (last five minutes): 1 Average tombstones per slice (last five minutes): 1.0 Maximum tombstones per slice (last five minutes): 1
Common Causes • Compaction behind • Compactions failing • Flushing too often • Disk full
Company Confidential© 2014 DataStax, All Rights Reserved. 30
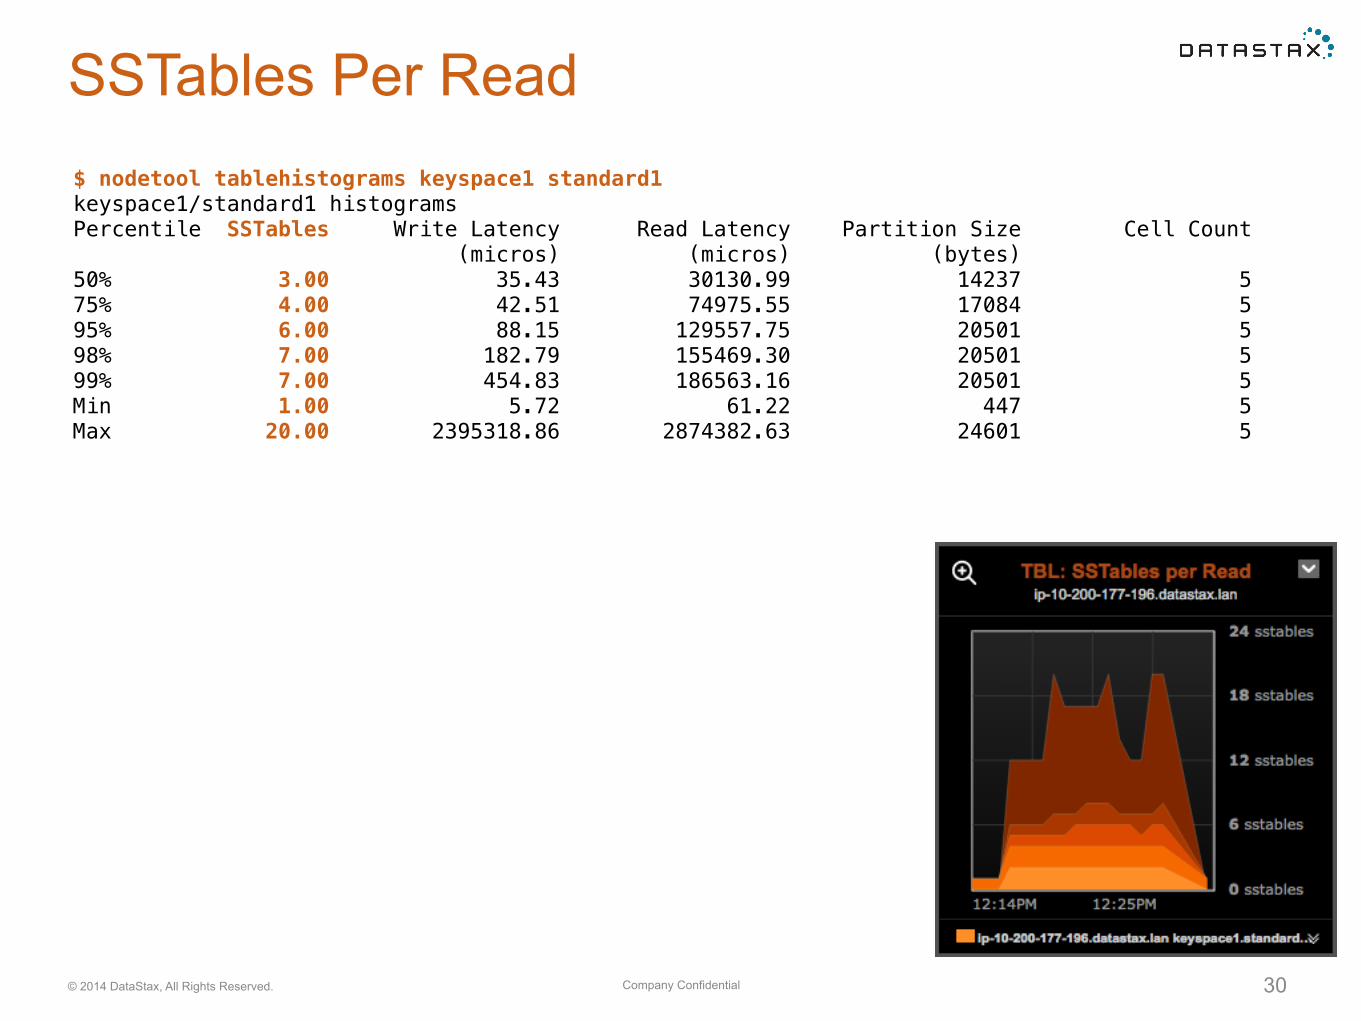
SSTables Per Read$ nodetool tablehistograms keyspace1 standard1 keyspace1/standard1 histograms Percentile SSTables Write Latency Read Latency Partition Size Cell Count (micros) (micros) (bytes) 50% 3.00 35.43 30130.99 14237 5 75% 4.00 42.51 74975.55 17084 5 95% 6.00 88.15 129557.75 20501 5 98% 7.00 182.79 155469.30 20501 5 99% 7.00 454.83 186563.16 20501 5 Min 1.00 5.72 61.22 447 5 Max 20.00 2395318.86 2874382.63 24601 5
Tombstones
Company Confidential© 2014 DataStax, All Rights Reserved. 32
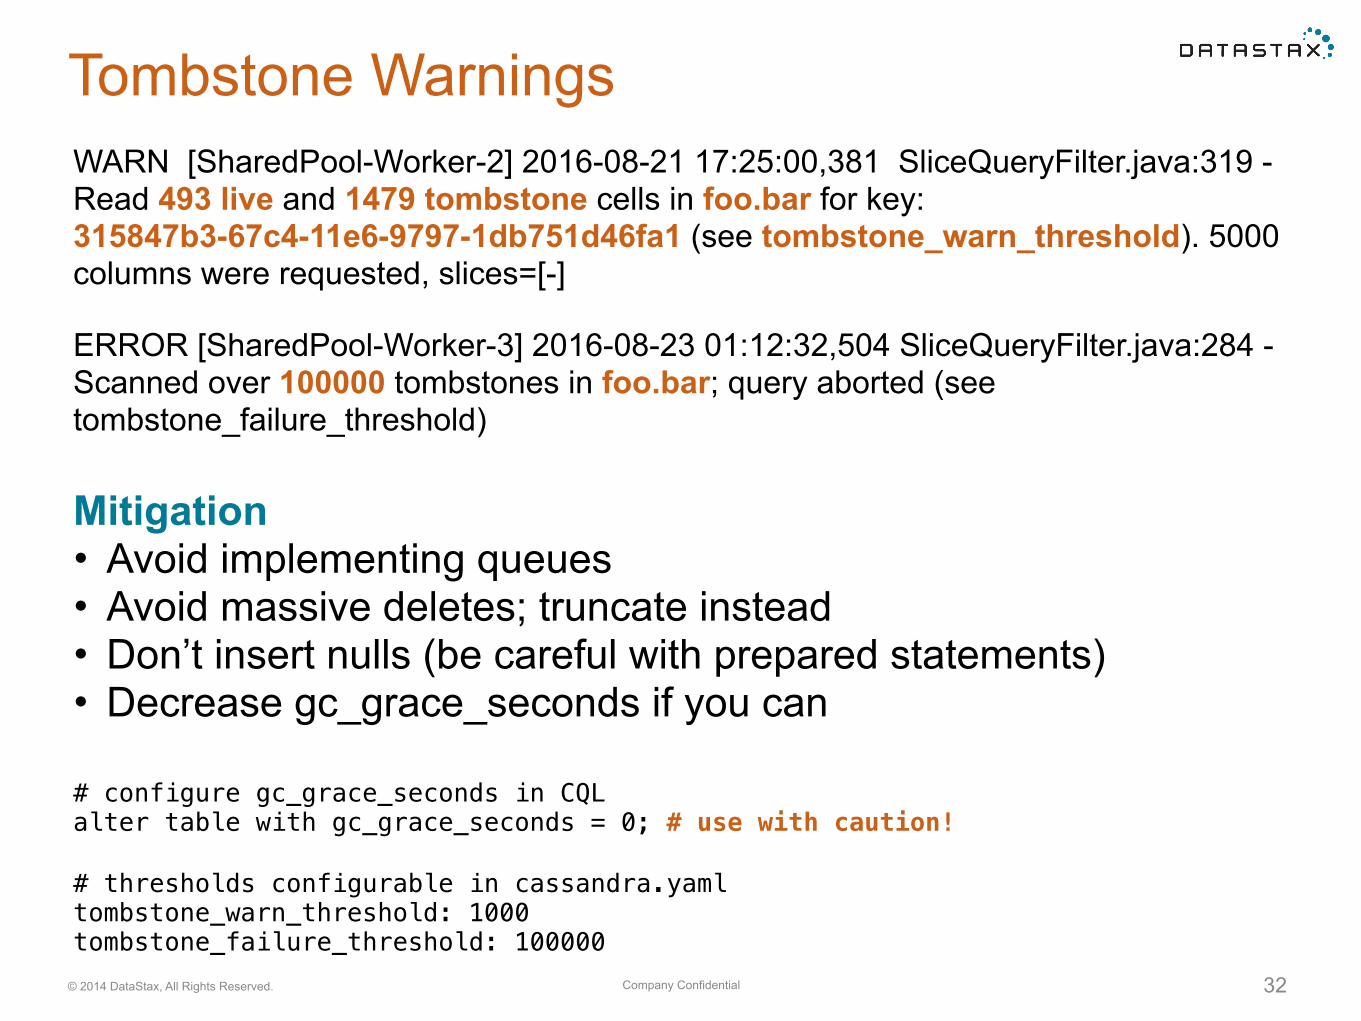
Tombstone WarningsWARN [SharedPool-Worker-2] 2016-08-21 17:25:00,381 SliceQueryFilter.java:319 - Read 493 live and 1479 tombstone cells in foo.bar for key: 315847b3-67c4-11e6-9797-1db751d46fa1 (see tombstone_warn_threshold). 5000 columns were requested, slices=[-]
# configure gc_grace_seconds in CQL alter table with gc_grace_seconds = 0; # use with caution!
Mitigation • Avoid implementing queues • Avoid massive deletes; truncate instead • Don’t insert nulls (be careful with prepared statements) • Decrease gc_grace_seconds if you can
ERROR [SharedPool-Worker-3] 2016-08-23 01:12:32,504 SliceQueryFilter.java:284 - Scanned over 100000 tombstones in foo.bar; query aborted (see tombstone_failure_threshold)
# thresholds configurable in cassandra.yaml tombstone_warn_threshold: 1000 tombstone_failure_threshold: 100000

System Resources
Company Confidential© 2014 DataStax, All Rights Reserved. 34
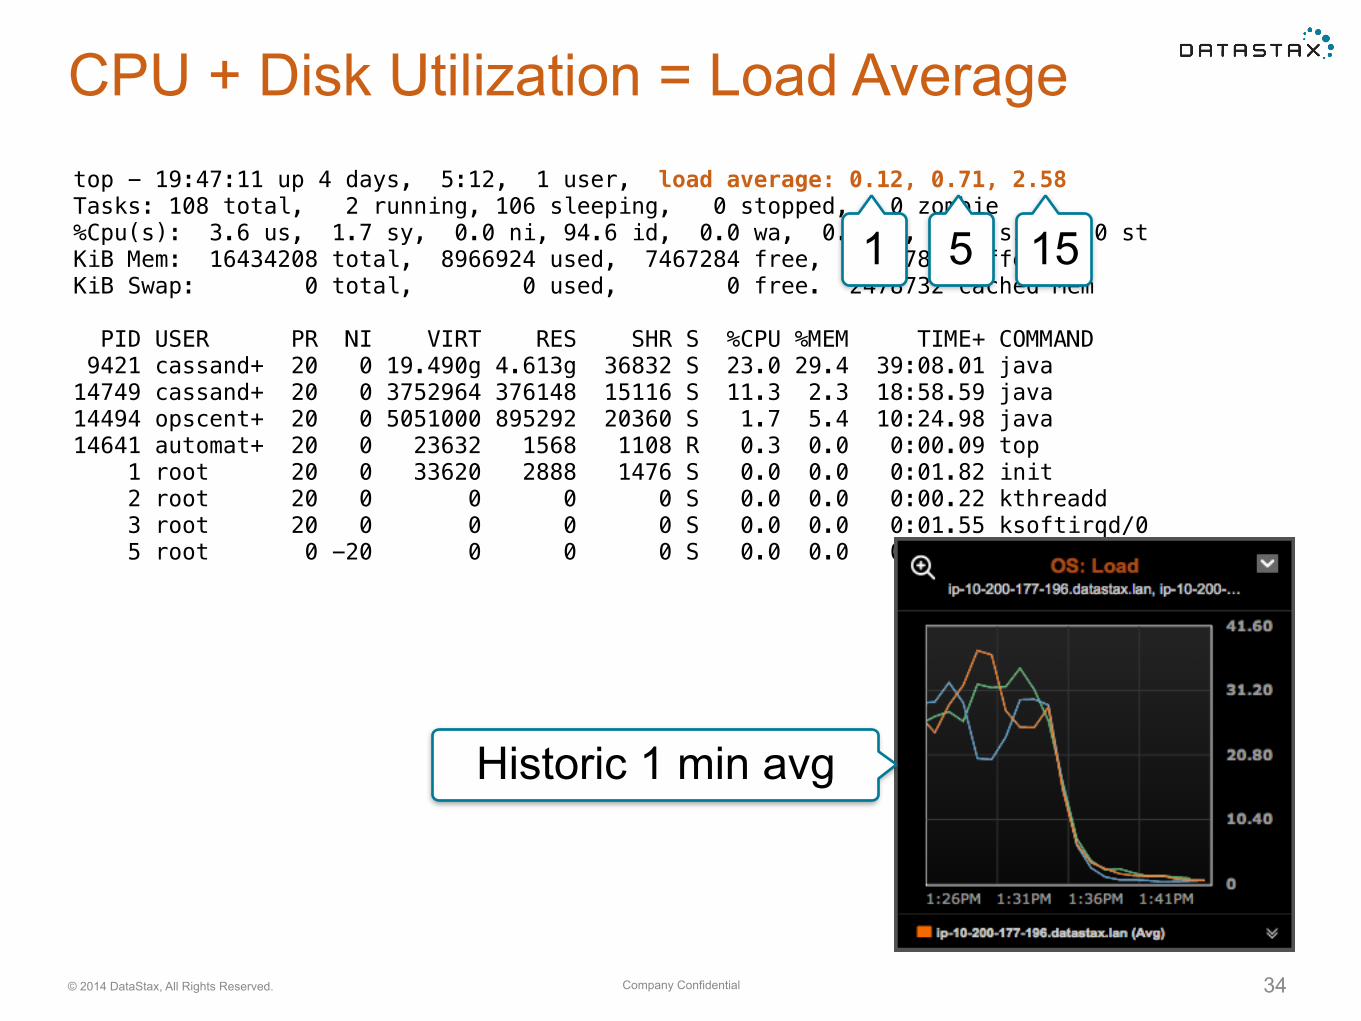
CPU + Disk Utilization = Load Averagetop - 19:47:11 up 4 days, 5:12, 1 user, load average: 0.12, 0.71, 2.58 Tasks: 108 total, 2 running, 106 sleeping, 0 stopped, 0 zombie %Cpu(s): 3.6 us, 1.7 sy, 0.0 ni, 94.6 id, 0.0 wa, 0.0 hi, 0.0 si, 0.0 st KiB Mem: 16434208 total, 8966924 used, 7467284 free, 98784 buffers KiB Swap: 0 total, 0 used, 0 free. 2478732 cached Mem
PID USER PR NI VIRT RES SHR S %CPU %MEM TIME+ COMMAND 9421 cassand+ 20 0 19.490g 4.613g 36832 S 23.0 29.4 39:08.01 java 14749 cassand+ 20 0 3752964 376148 15116 S 11.3 2.3 18:58.59 java 14494 opscent+ 20 0 5051000 895292 20360 S 1.7 5.4 10:24.98 java 14641 automat+ 20 0 23632 1568 1108 R 0.3 0.0 0:00.09 top 1 root 20 0 33620 2888 1476 S 0.0 0.0 0:01.82 init 2 root 20 0 0 0 0 S 0.0 0.0 0:00.22 kthreadd 3 root 20 0 0 0 0 S 0.0 0.0 0:01.55 ksoftirqd/0 5 root 0 -20 0 0 0 S 0.0 0.0 0:00.00 kworker/0:0H
1 5 15
Historic 1 min avg
CPU
Company Confidential© 2014 DataStax, All Rights Reserved. 36
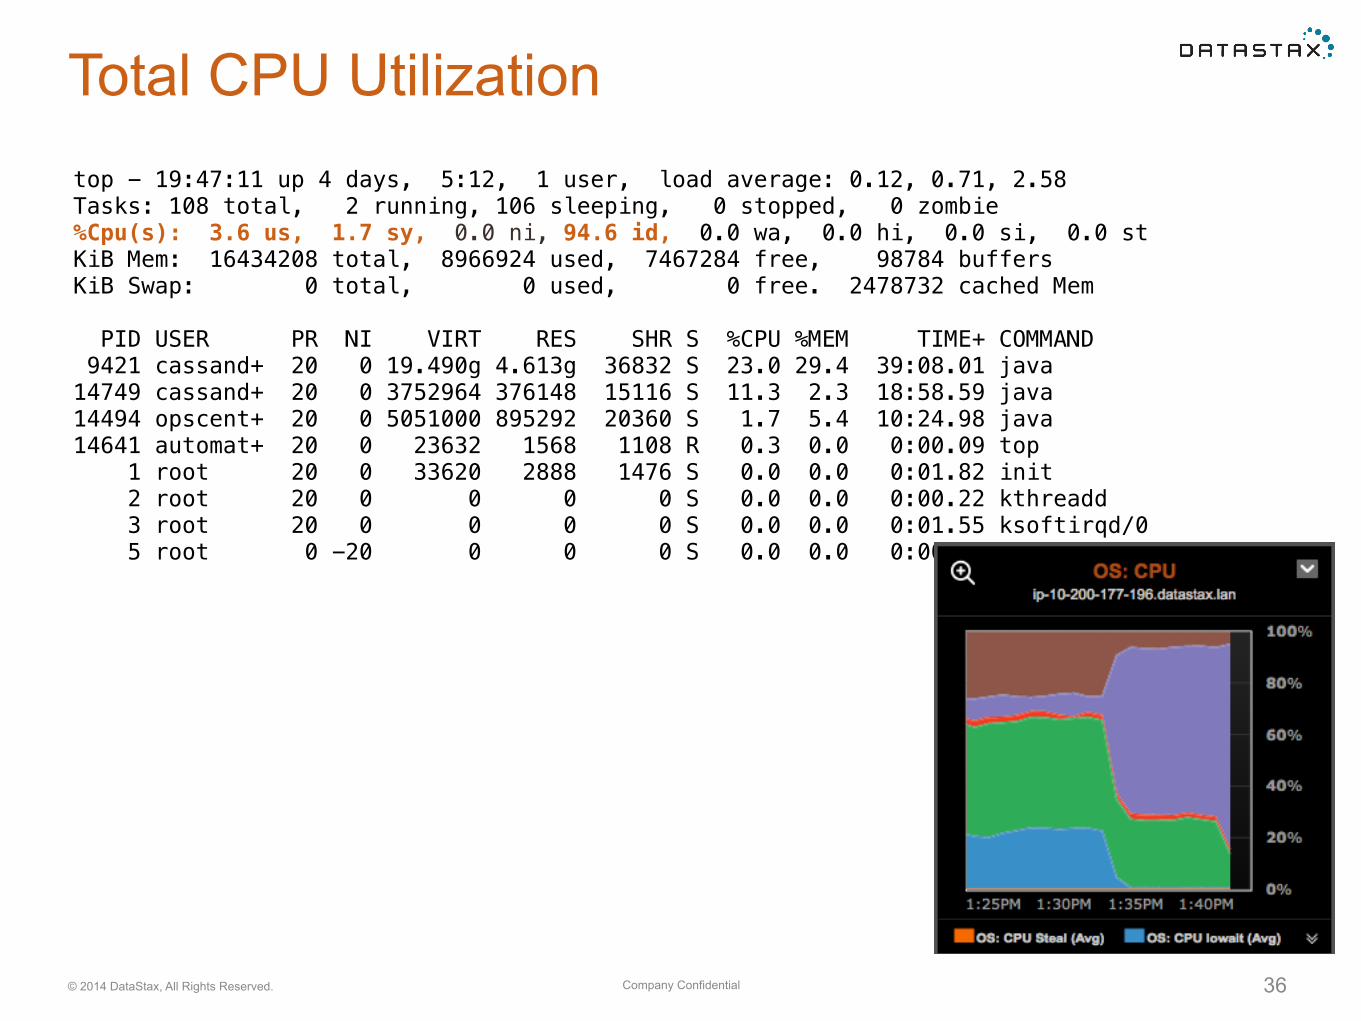
Total CPU Utilizationtop - 19:47:11 up 4 days, 5:12, 1 user, load average: 0.12, 0.71, 2.58 Tasks: 108 total, 2 running, 106 sleeping, 0 stopped, 0 zombie %Cpu(s): 3.6 us, 1.7 sy, 0.0 ni, 94.6 id, 0.0 wa, 0.0 hi, 0.0 si, 0.0 st KiB Mem: 16434208 total, 8966924 used, 7467284 free, 98784 buffers KiB Swap: 0 total, 0 used, 0 free. 2478732 cached Mem
PID USER PR NI VIRT RES SHR S %CPU %MEM TIME+ COMMAND 9421 cassand+ 20 0 19.490g 4.613g 36832 S 23.0 29.4 39:08.01 java 14749 cassand+ 20 0 3752964 376148 15116 S 11.3 2.3 18:58.59 java 14494 opscent+ 20 0 5051000 895292 20360 S 1.7 5.4 10:24.98 java 14641 automat+ 20 0 23632 1568 1108 R 0.3 0.0 0:00.09 top 1 root 20 0 33620 2888 1476 S 0.0 0.0 0:01.82 init 2 root 20 0 0 0 0 S 0.0 0.0 0:00.22 kthreadd 3 root 20 0 0 0 0 S 0.0 0.0 0:01.55 ksoftirqd/0 5 root 0 -20 0 0 0 S 0.0 0.0 0:00.00 kworker/0:0H
Company Confidential© 2014 DataStax, All Rights Reserved. 37
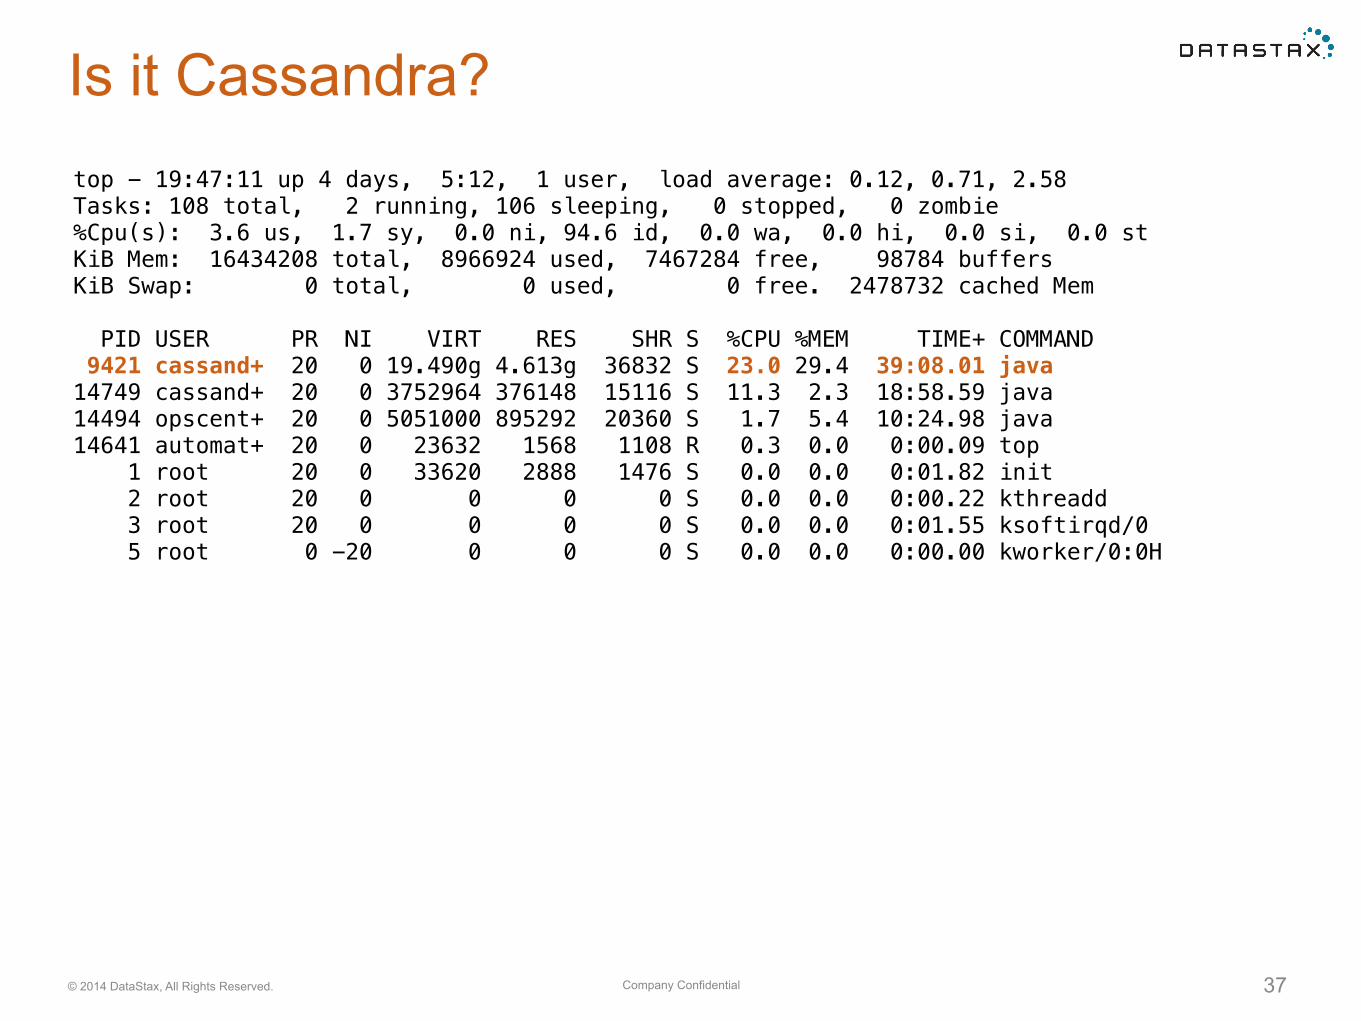
Is it Cassandra?top - 19:47:11 up 4 days, 5:12, 1 user, load average: 0.12, 0.71, 2.58 Tasks: 108 total, 2 running, 106 sleeping, 0 stopped, 0 zombie %Cpu(s): 3.6 us, 1.7 sy, 0.0 ni, 94.6 id, 0.0 wa, 0.0 hi, 0.0 si, 0.0 st KiB Mem: 16434208 total, 8966924 used, 7467284 free, 98784 buffers KiB Swap: 0 total, 0 used, 0 free. 2478732 cached Mem
PID USER PR NI VIRT RES SHR S %CPU %MEM TIME+ COMMAND 9421 cassand+ 20 0 19.490g 4.613g 36832 S 23.0 29.4 39:08.01 java 14749 cassand+ 20 0 3752964 376148 15116 S 11.3 2.3 18:58.59 java 14494 opscent+ 20 0 5051000 895292 20360 S 1.7 5.4 10:24.98 java 14641 automat+ 20 0 23632 1568 1108 R 0.3 0.0 0:00.09 top 1 root 20 0 33620 2888 1476 S 0.0 0.0 0:01.82 init 2 root 20 0 0 0 0 S 0.0 0.0 0:00.22 kthreadd 3 root 20 0 0 0 0 S 0.0 0.0 0:01.55 ksoftirqd/0 5 root 0 -20 0 0 0 S 0.0 0.0 0:00.00 kworker/0:0H
Company Confidential© 2014 DataStax, All Rights Reserved. 38
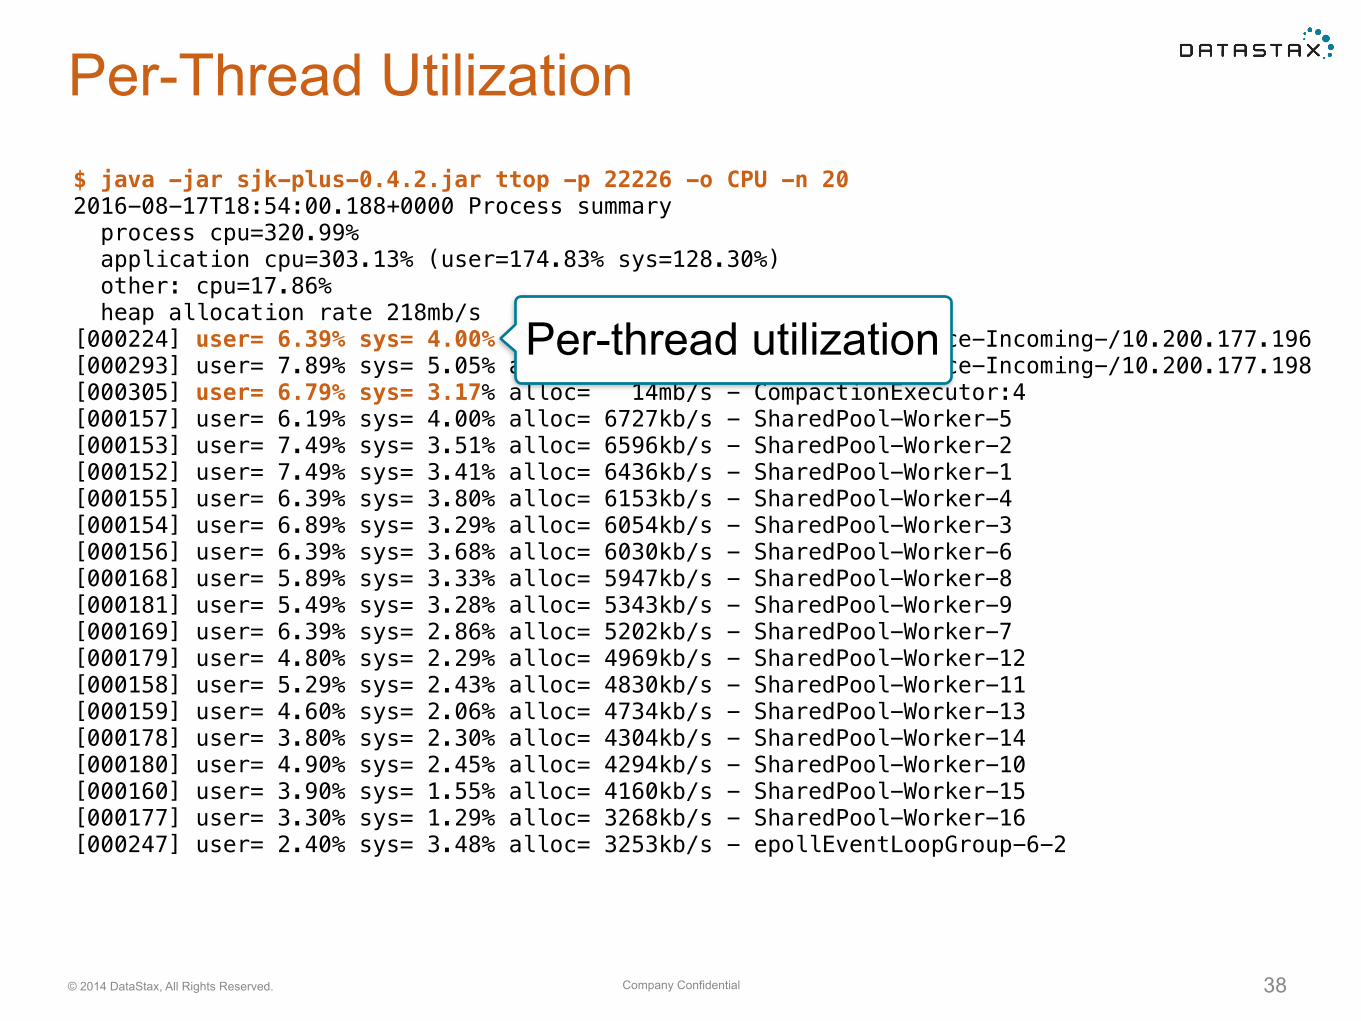
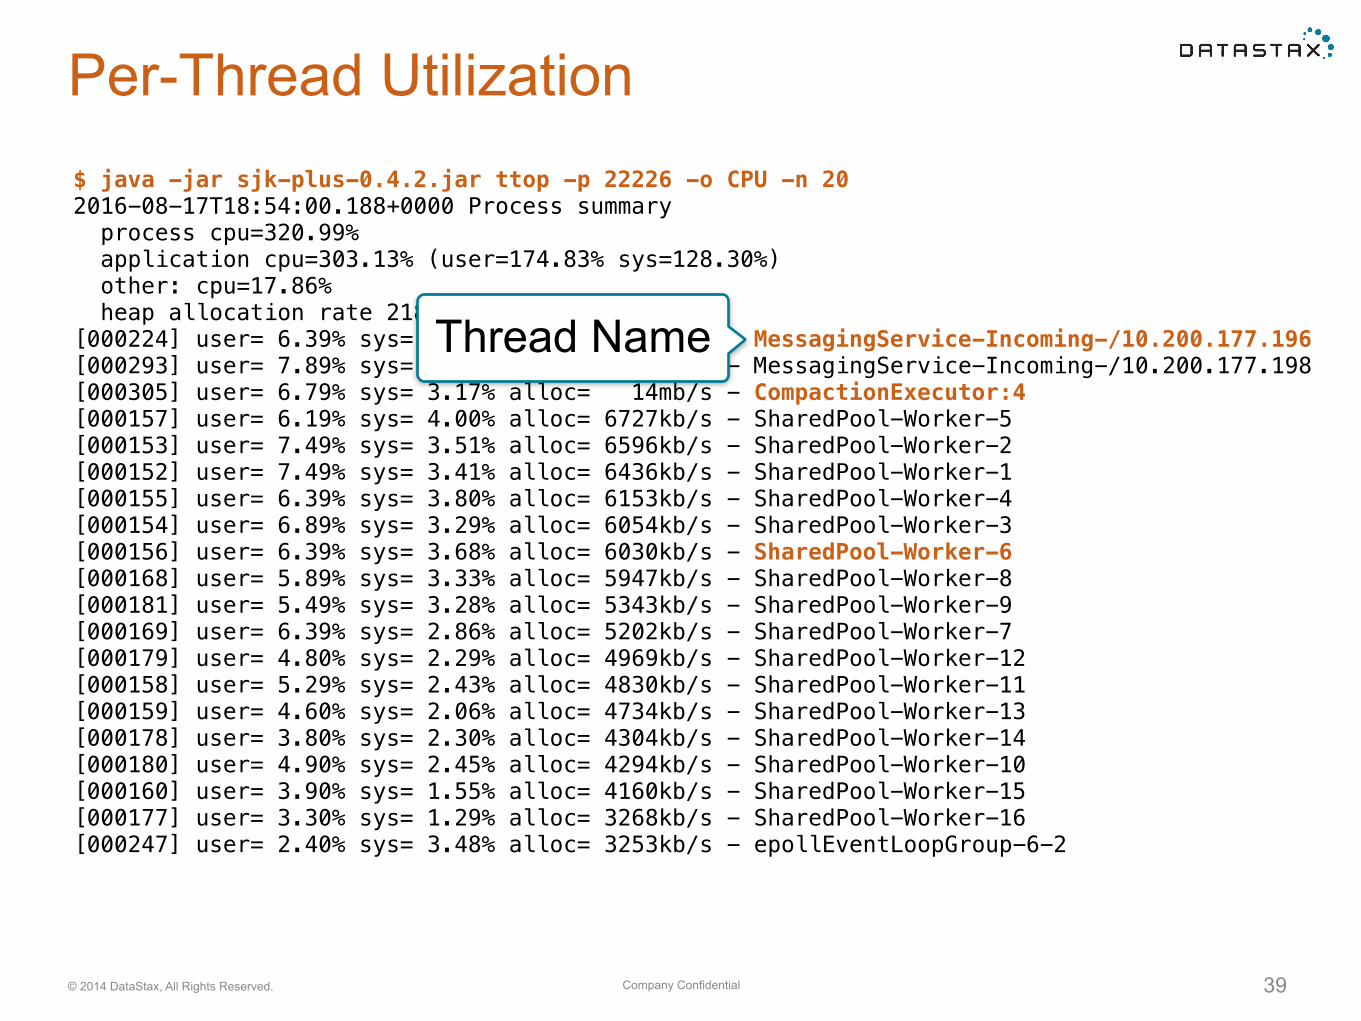
Per-Thread Utilization$ java -jar sjk-plus-0.4.2.jar ttop -p 22226 -o CPU -n 20 2016-08-17T18:54:00.188+0000 Process summary process cpu=320.99% application cpu=303.13% (user=174.83% sys=128.30%) other: cpu=17.86% heap allocation rate 218mb/s [000224] user= 6.39% sys= 4.00% alloc= 29mb/s - MessagingService-Incoming-/10.200.177.196 [000293] user= 7.89% sys= 5.05% alloc= 29mb/s - MessagingService-Incoming-/10.200.177.198 [000305] user= 6.79% sys= 3.17% alloc= 14mb/s - CompactionExecutor:4 [000157] user= 6.19% sys= 4.00% alloc= 6727kb/s - SharedPool-Worker-5 [000153] user= 7.49% sys= 3.51% alloc= 6596kb/s - SharedPool-Worker-2 [000152] user= 7.49% sys= 3.41% alloc= 6436kb/s - SharedPool-Worker-1 [000155] user= 6.39% sys= 3.80% alloc= 6153kb/s - SharedPool-Worker-4 [000154] user= 6.89% sys= 3.29% alloc= 6054kb/s - SharedPool-Worker-3 [000156] user= 6.39% sys= 3.68% alloc= 6030kb/s - SharedPool-Worker-6 [000168] user= 5.89% sys= 3.33% alloc= 5947kb/s - SharedPool-Worker-8 [000181] user= 5.49% sys= 3.28% alloc= 5343kb/s - SharedPool-Worker-9 [000169] user= 6.39% sys= 2.86% alloc= 5202kb/s - SharedPool-Worker-7 [000179] user= 4.80% sys= 2.29% alloc= 4969kb/s - SharedPool-Worker-12 [000158] user= 5.29% sys= 2.43% alloc= 4830kb/s - SharedPool-Worker-11 [000159] user= 4.60% sys= 2.06% alloc= 4734kb/s - SharedPool-Worker-13 [000178] user= 3.80% sys= 2.30% alloc= 4304kb/s - SharedPool-Worker-14 [000180] user= 4.90% sys= 2.45% alloc= 4294kb/s - SharedPool-Worker-10 [000160] user= 3.90% sys= 1.55% alloc= 4160kb/s - SharedPool-Worker-15 [000177] user= 3.30% sys= 1.29% alloc= 3268kb/s - SharedPool-Worker-16 [000247] user= 2.40% sys= 3.48% alloc= 3253kb/s - epollEventLoopGroup-6-2
Per-thread utilization
Company Confidential© 2014 DataStax, All Rights Reserved. 39
Per-Thread Utilization$ java -jar sjk-plus-0.4.2.jar ttop -p 22226 -o CPU -n 20 2016-08-17T18:54:00.188+0000 Process summary process cpu=320.99% application cpu=303.13% (user=174.83% sys=128.30%) other: cpu=17.86% heap allocation rate 218mb/s [000224] user= 6.39% sys= 4.00% alloc= 29mb/s - MessagingService-Incoming-/10.200.177.196 [000293] user= 7.89% sys= 5.05% alloc= 29mb/s - MessagingService-Incoming-/10.200.177.198 [000305] user= 6.79% sys= 3.17% alloc= 14mb/s - CompactionExecutor:4 [000157] user= 6.19% sys= 4.00% alloc= 6727kb/s - SharedPool-Worker-5 [000153] user= 7.49% sys= 3.51% alloc= 6596kb/s - SharedPool-Worker-2 [000152] user= 7.49% sys= 3.41% alloc= 6436kb/s - SharedPool-Worker-1 [000155] user= 6.39% sys= 3.80% alloc= 6153kb/s - SharedPool-Worker-4 [000154] user= 6.89% sys= 3.29% alloc= 6054kb/s - SharedPool-Worker-3 [000156] user= 6.39% sys= 3.68% alloc= 6030kb/s - SharedPool-Worker-6 [000168] user= 5.89% sys= 3.33% alloc= 5947kb/s - SharedPool-Worker-8 [000181] user= 5.49% sys= 3.28% alloc= 5343kb/s - SharedPool-Worker-9 [000169] user= 6.39% sys= 2.86% alloc= 5202kb/s - SharedPool-Worker-7 [000179] user= 4.80% sys= 2.29% alloc= 4969kb/s - SharedPool-Worker-12 [000158] user= 5.29% sys= 2.43% alloc= 4830kb/s - SharedPool-Worker-11 [000159] user= 4.60% sys= 2.06% alloc= 4734kb/s - SharedPool-Worker-13 [000178] user= 3.80% sys= 2.30% alloc= 4304kb/s - SharedPool-Worker-14 [000180] user= 4.90% sys= 2.45% alloc= 4294kb/s - SharedPool-Worker-10 [000160] user= 3.90% sys= 1.55% alloc= 4160kb/s - SharedPool-Worker-15 [000177] user= 3.30% sys= 1.29% alloc= 3268kb/s - SharedPool-Worker-16 [000247] user= 2.40% sys= 3.48% alloc= 3253kb/s - epollEventLoopGroup-6-2
Thread Name
Company Confidential© 2014 DataStax, All Rights Reserved. 40
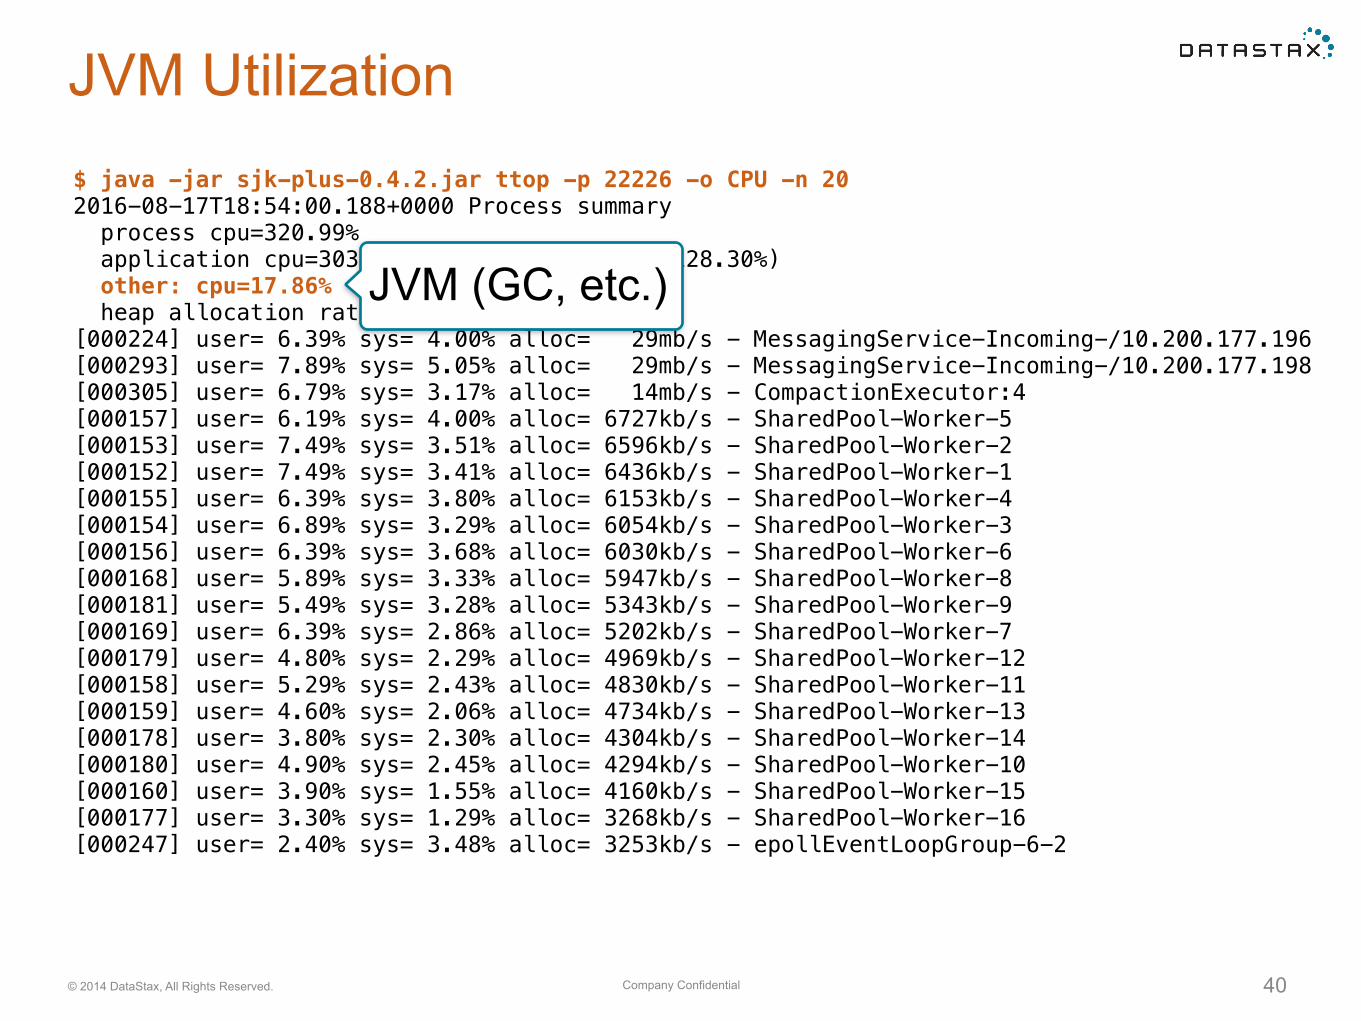
JVM Utilization$ java -jar sjk-plus-0.4.2.jar ttop -p 22226 -o CPU -n 20 2016-08-17T18:54:00.188+0000 Process summary process cpu=320.99% application cpu=303.13% (user=174.83% sys=128.30%) other: cpu=17.86% heap allocation rate 218mb/s [000224] user= 6.39% sys= 4.00% alloc= 29mb/s - MessagingService-Incoming-/10.200.177.196 [000293] user= 7.89% sys= 5.05% alloc= 29mb/s - MessagingService-Incoming-/10.200.177.198 [000305] user= 6.79% sys= 3.17% alloc= 14mb/s - CompactionExecutor:4 [000157] user= 6.19% sys= 4.00% alloc= 6727kb/s - SharedPool-Worker-5 [000153] user= 7.49% sys= 3.51% alloc= 6596kb/s - SharedPool-Worker-2 [000152] user= 7.49% sys= 3.41% alloc= 6436kb/s - SharedPool-Worker-1 [000155] user= 6.39% sys= 3.80% alloc= 6153kb/s - SharedPool-Worker-4 [000154] user= 6.89% sys= 3.29% alloc= 6054kb/s - SharedPool-Worker-3 [000156] user= 6.39% sys= 3.68% alloc= 6030kb/s - SharedPool-Worker-6 [000168] user= 5.89% sys= 3.33% alloc= 5947kb/s - SharedPool-Worker-8 [000181] user= 5.49% sys= 3.28% alloc= 5343kb/s - SharedPool-Worker-9 [000169] user= 6.39% sys= 2.86% alloc= 5202kb/s - SharedPool-Worker-7 [000179] user= 4.80% sys= 2.29% alloc= 4969kb/s - SharedPool-Worker-12 [000158] user= 5.29% sys= 2.43% alloc= 4830kb/s - SharedPool-Worker-11 [000159] user= 4.60% sys= 2.06% alloc= 4734kb/s - SharedPool-Worker-13 [000178] user= 3.80% sys= 2.30% alloc= 4304kb/s - SharedPool-Worker-14 [000180] user= 4.90% sys= 2.45% alloc= 4294kb/s - SharedPool-Worker-10 [000160] user= 3.90% sys= 1.55% alloc= 4160kb/s - SharedPool-Worker-15 [000177] user= 3.30% sys= 1.29% alloc= 3268kb/s - SharedPool-Worker-16 [000247] user= 2.40% sys= 3.48% alloc= 3253kb/s - epollEventLoopGroup-6-2
JVM (GC, etc.)

Memory
Company Confidential© 2014 DataStax, All Rights Reserved. 42
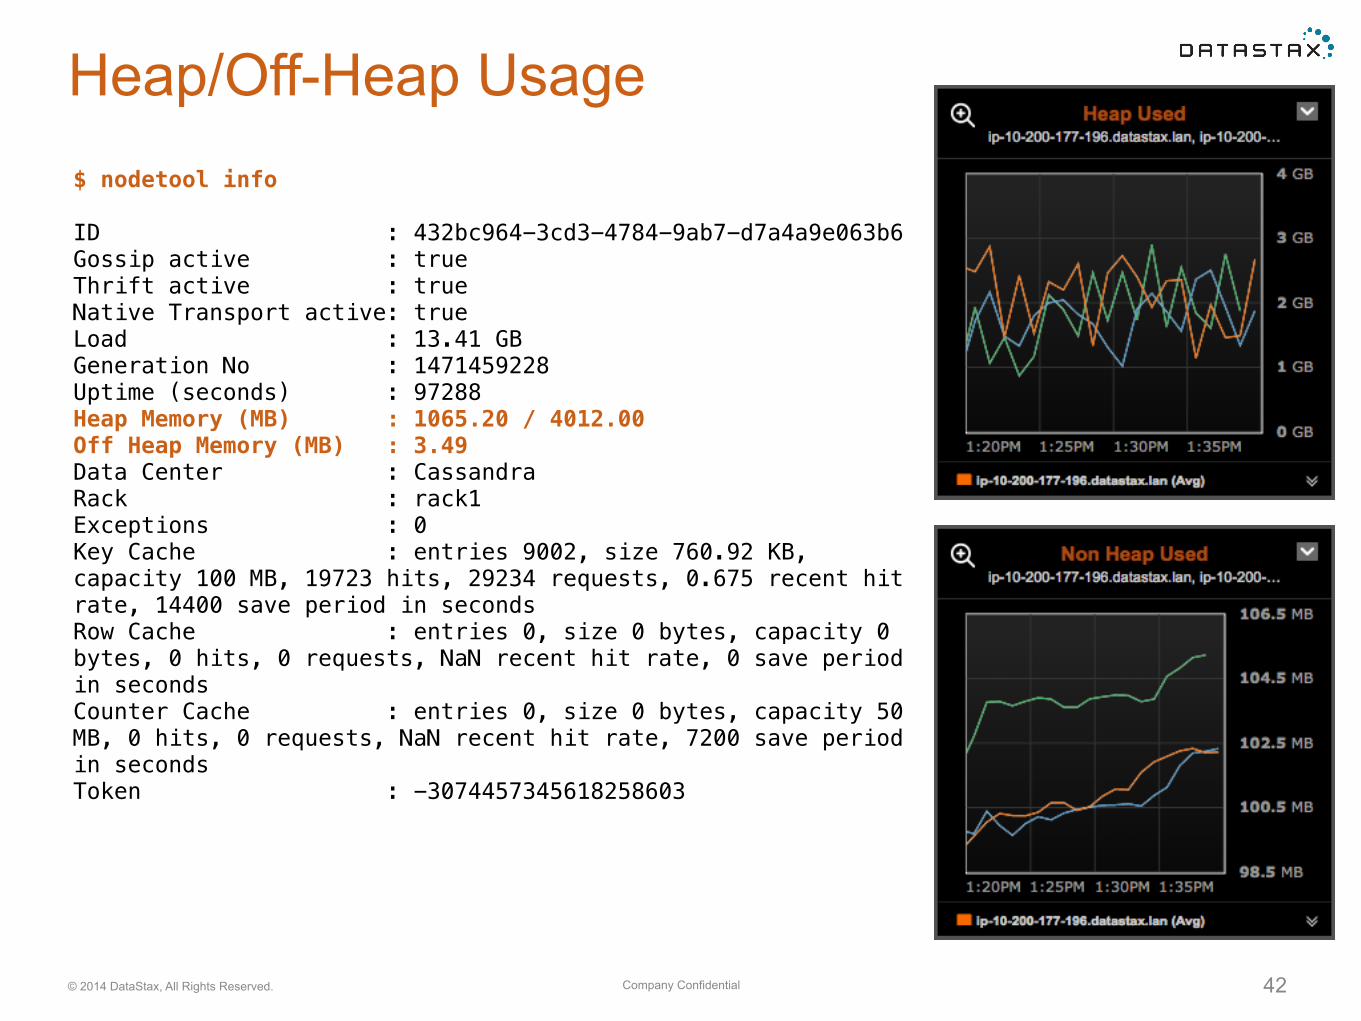
Heap/Off-Heap Usage$ nodetool info
ID : 432bc964-3cd3-4784-9ab7-d7a4a9e063b6 Gossip active : true Thrift active : true Native Transport active: true Load : 13.41 GB Generation No : 1471459228 Uptime (seconds) : 97288 Heap Memory (MB) : 1065.20 / 4012.00 Off Heap Memory (MB) : 3.49 Data Center : Cassandra Rack : rack1 Exceptions : 0 Key Cache : entries 9002, size 760.92 KB, capacity 100 MB, 19723 hits, 29234 requests, 0.675 recent hit rate, 14400 save period in seconds Row Cache : entries 0, size 0 bytes, capacity 0 bytes, 0 hits, 0 requests, NaN recent hit rate, 0 save period in seconds Counter Cache : entries 0, size 0 bytes, capacity 50 MB, 0 hits, 0 requests, NaN recent hit rate, 7200 save period in seconds Token : -3074457345618258603

Caches
Company Confidential© 2014 DataStax, All Rights Reserved. 44
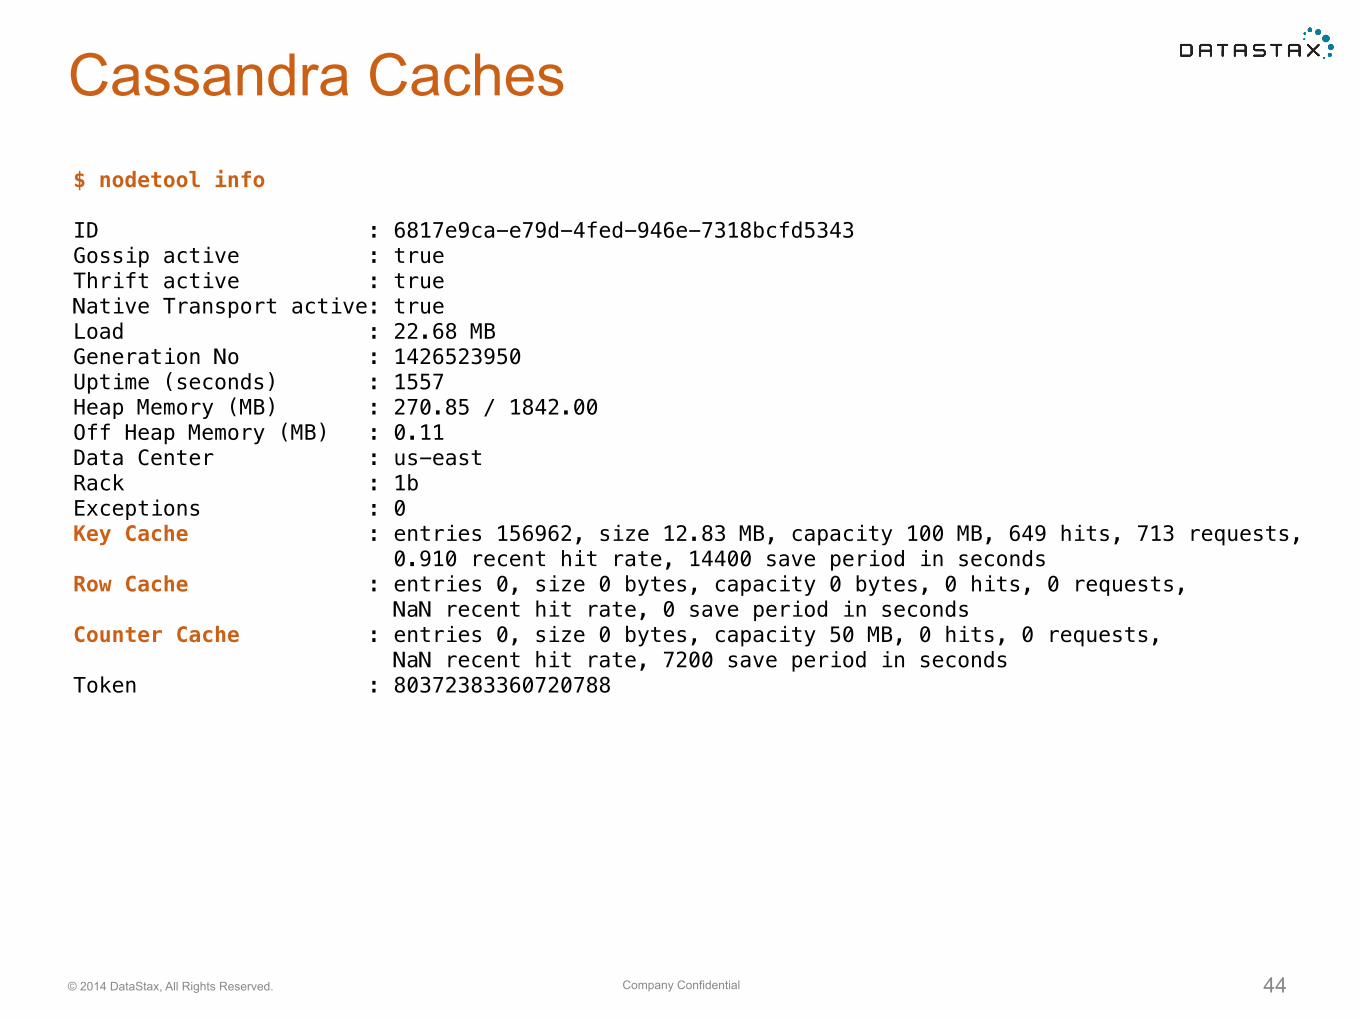
Cassandra Caches$ nodetool info
ID : 6817e9ca-e79d-4fed-946e-7318bcfd5343 Gossip active : true Thrift active : true Native Transport active: true Load : 22.68 MB Generation No : 1426523950 Uptime (seconds) : 1557 Heap Memory (MB) : 270.85 / 1842.00 Off Heap Memory (MB) : 0.11 Data Center : us-east Rack : 1b Exceptions : 0 Key Cache : entries 156962, size 12.83 MB, capacity 100 MB, 649 hits, 713 requests, 0.910 recent hit rate, 14400 save period in seconds Row Cache : entries 0, size 0 bytes, capacity 0 bytes, 0 hits, 0 requests, NaN recent hit rate, 0 save period in seconds Counter Cache : entries 0, size 0 bytes, capacity 50 MB, 0 hits, 0 requests, NaN recent hit rate, 7200 save period in seconds Token : 80372383360720788
Company Confidential© 2014 DataStax, All Rights Reserved. 45
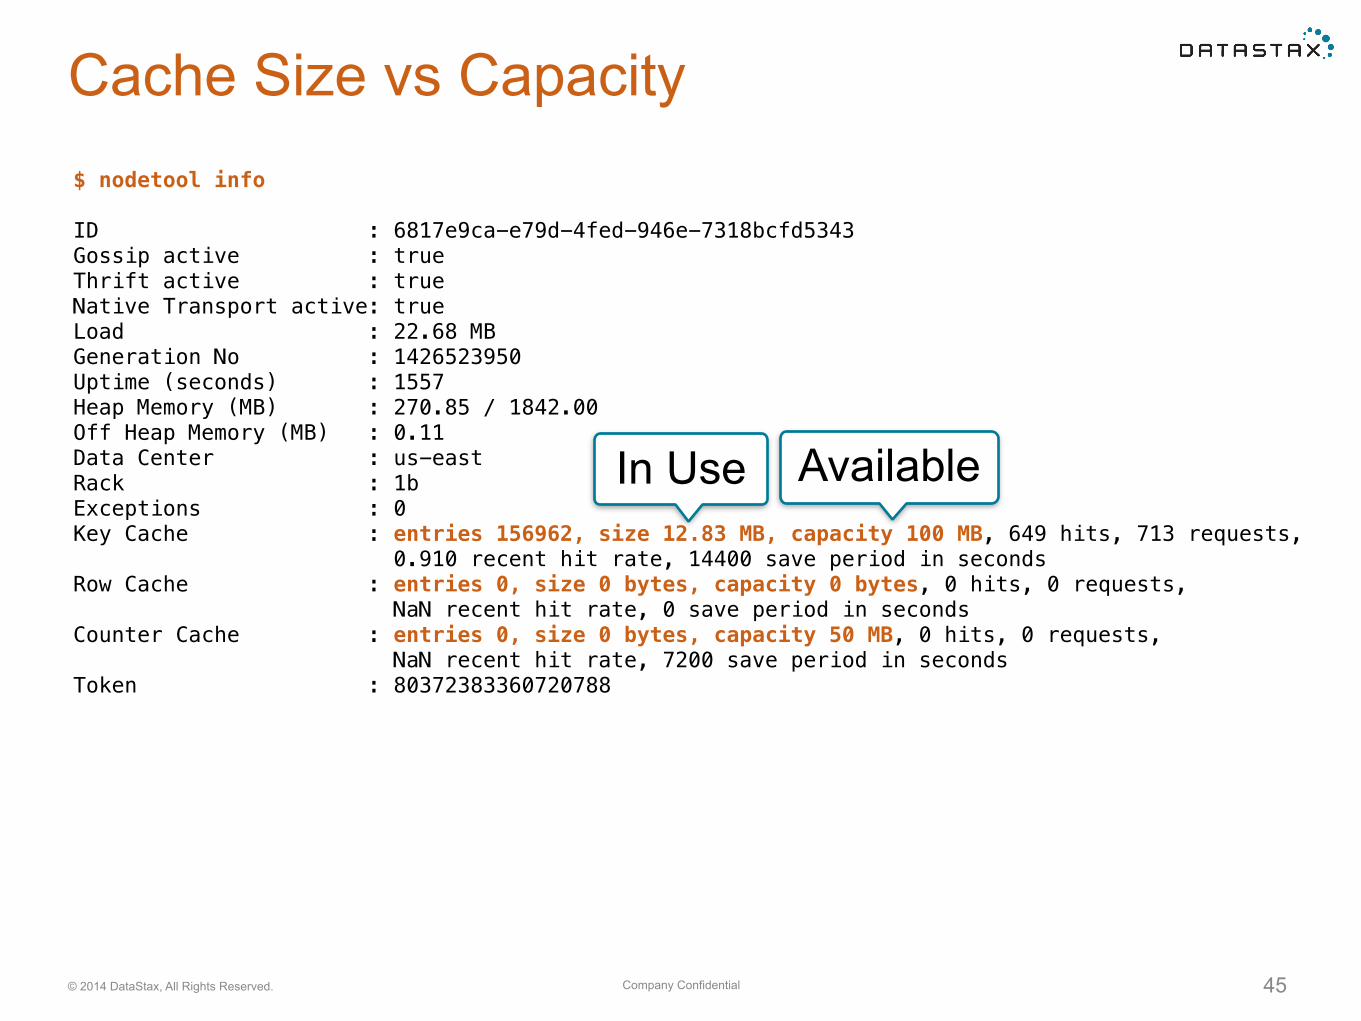
Cache Size vs Capacity$ nodetool info
ID : 6817e9ca-e79d-4fed-946e-7318bcfd5343 Gossip active : true Thrift active : true Native Transport active: true Load : 22.68 MB Generation No : 1426523950 Uptime (seconds) : 1557 Heap Memory (MB) : 270.85 / 1842.00 Off Heap Memory (MB) : 0.11 Data Center : us-east Rack : 1b Exceptions : 0 Key Cache : entries 156962, size 12.83 MB, capacity 100 MB, 649 hits, 713 requests, 0.910 recent hit rate, 14400 save period in seconds Row Cache : entries 0, size 0 bytes, capacity 0 bytes, 0 hits, 0 requests, NaN recent hit rate, 0 save period in seconds Counter Cache : entries 0, size 0 bytes, capacity 50 MB, 0 hits, 0 requests, NaN recent hit rate, 7200 save period in seconds Token : 80372383360720788
In Use Available
Company Confidential© 2014 DataStax, All Rights Reserved. 46
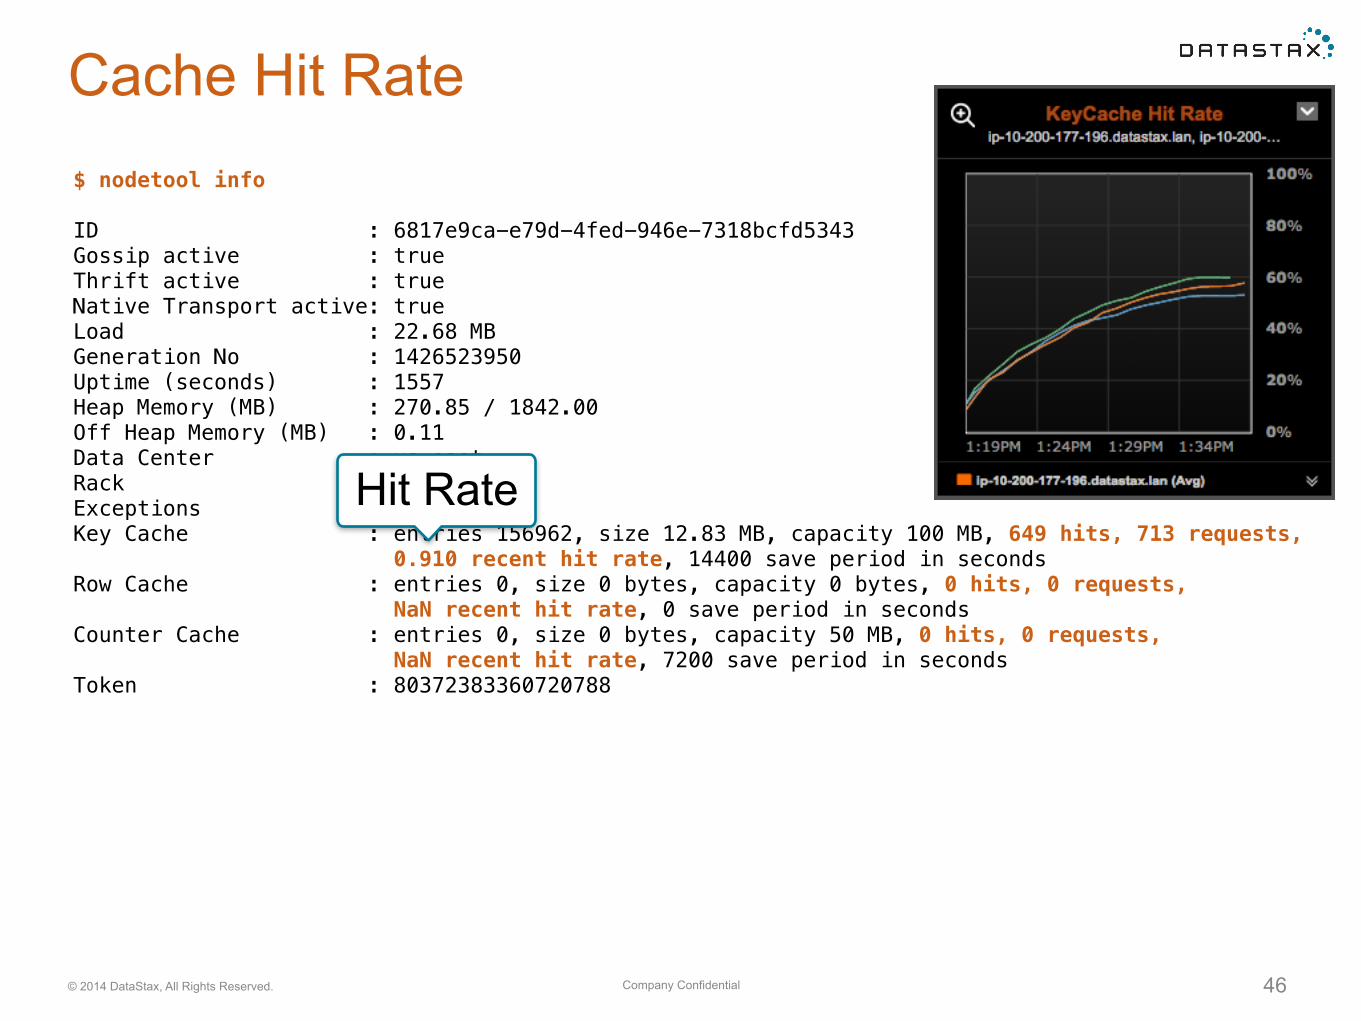
Cache Hit Rate$ nodetool info
ID : 6817e9ca-e79d-4fed-946e-7318bcfd5343 Gossip active : true Thrift active : true Native Transport active: true Load : 22.68 MB Generation No : 1426523950 Uptime (seconds) : 1557 Heap Memory (MB) : 270.85 / 1842.00 Off Heap Memory (MB) : 0.11 Data Center : us-east Rack : 1b Exceptions : 0 Key Cache : entries 156962, size 12.83 MB, capacity 100 MB, 649 hits, 713 requests, 0.910 recent hit rate, 14400 save period in seconds Row Cache : entries 0, size 0 bytes, capacity 0 bytes, 0 hits, 0 requests, NaN recent hit rate, 0 save period in seconds Counter Cache : entries 0, size 0 bytes, capacity 50 MB, 0 hits, 0 requests, NaN recent hit rate, 7200 save period in seconds Token : 80372383360720788
Hit Rate
Company Confidential© 2014 DataStax, All Rights Reserved. 47
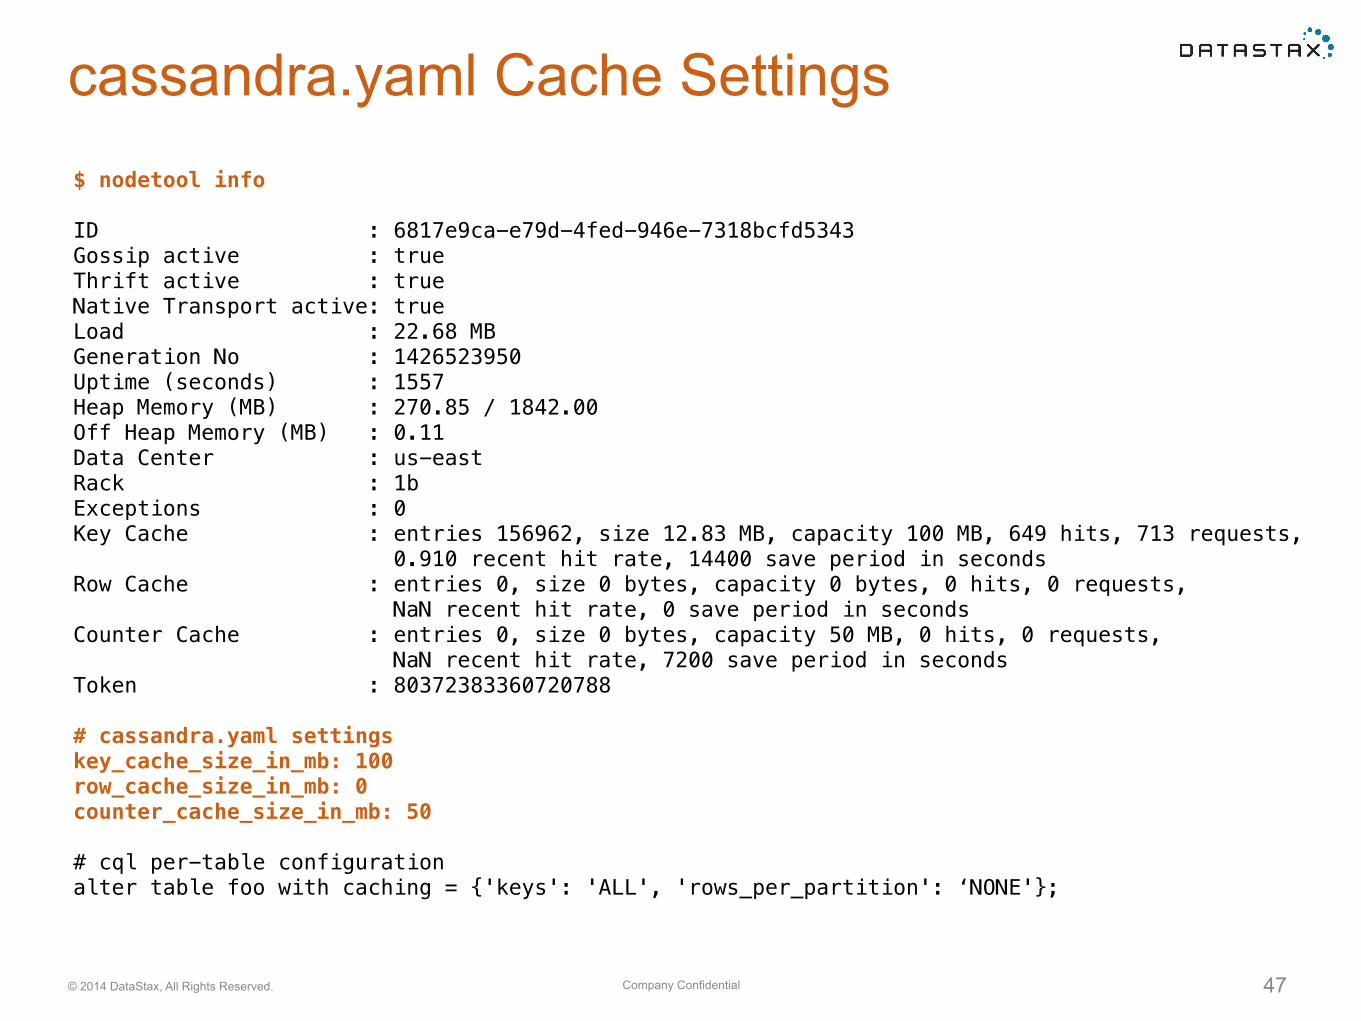
cassandra.yaml Cache Settings$ nodetool info
ID : 6817e9ca-e79d-4fed-946e-7318bcfd5343 Gossip active : true Thrift active : true Native Transport active: true Load : 22.68 MB Generation No : 1426523950 Uptime (seconds) : 1557 Heap Memory (MB) : 270.85 / 1842.00 Off Heap Memory (MB) : 0.11 Data Center : us-east Rack : 1b Exceptions : 0 Key Cache : entries 156962, size 12.83 MB, capacity 100 MB, 649 hits, 713 requests, 0.910 recent hit rate, 14400 save period in seconds Row Cache : entries 0, size 0 bytes, capacity 0 bytes, 0 hits, 0 requests, NaN recent hit rate, 0 save period in seconds Counter Cache : entries 0, size 0 bytes, capacity 50 MB, 0 hits, 0 requests, NaN recent hit rate, 7200 save period in seconds Token : 80372383360720788
# cassandra.yaml settings key_cache_size_in_mb: 100 row_cache_size_in_mb: 0 counter_cache_size_in_mb: 50
# cql per-table configuration alter table foo with caching = {'keys': 'ALL', 'rows_per_partition': ‘NONE'};
Company Confidential© 2014 DataStax, All Rights Reserved. 48
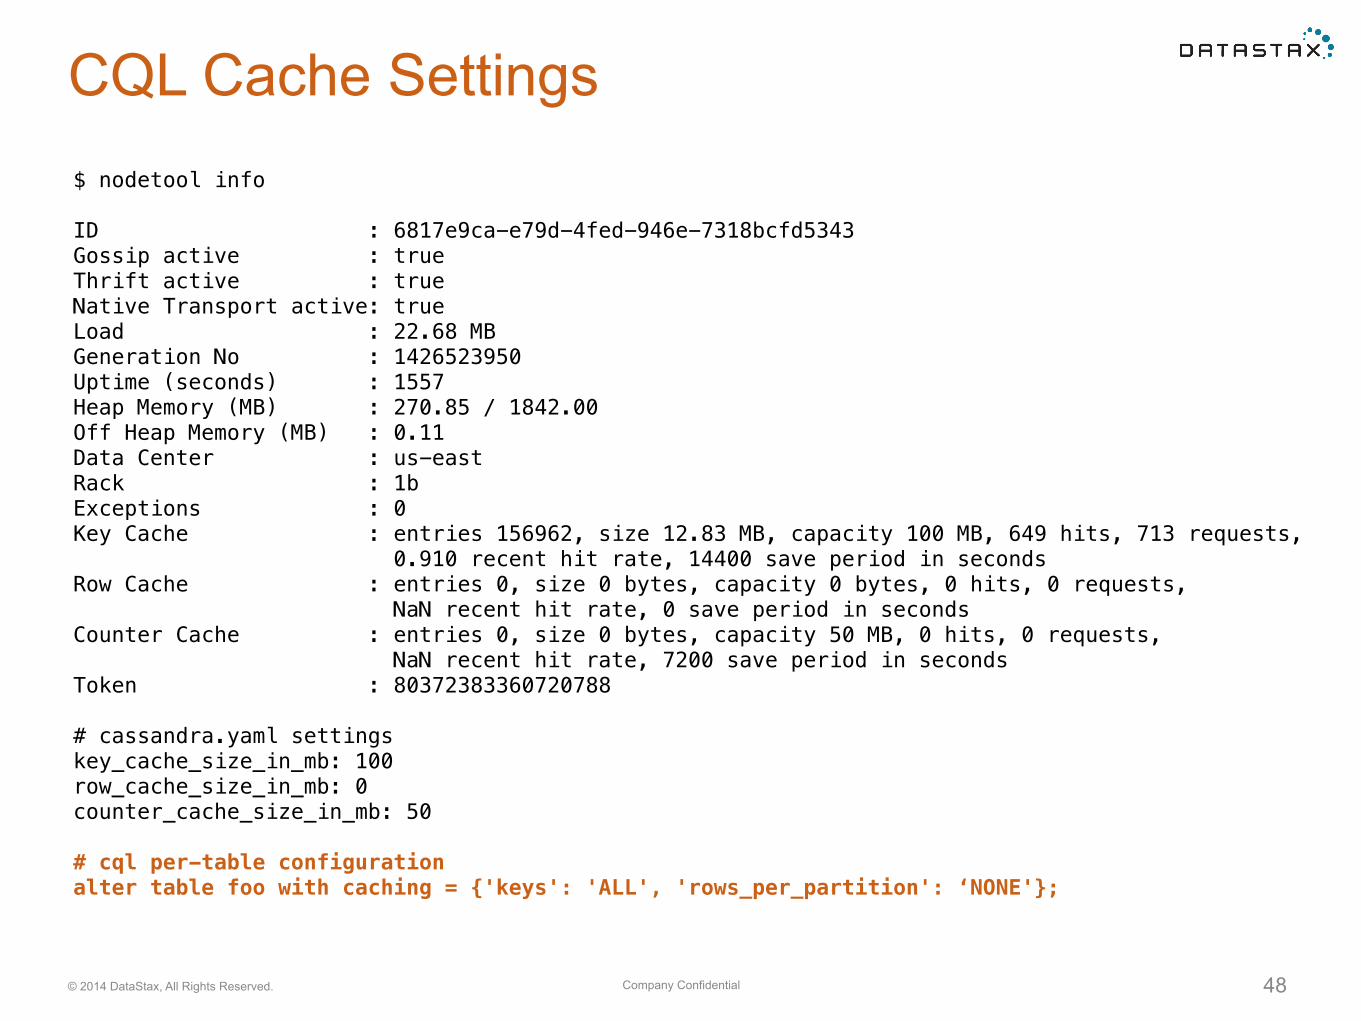
CQL Cache Settings$ nodetool info
ID : 6817e9ca-e79d-4fed-946e-7318bcfd5343 Gossip active : true Thrift active : true Native Transport active: true Load : 22.68 MB Generation No : 1426523950 Uptime (seconds) : 1557 Heap Memory (MB) : 270.85 / 1842.00 Off Heap Memory (MB) : 0.11 Data Center : us-east Rack : 1b Exceptions : 0 Key Cache : entries 156962, size 12.83 MB, capacity 100 MB, 649 hits, 713 requests, 0.910 recent hit rate, 14400 save period in seconds Row Cache : entries 0, size 0 bytes, capacity 0 bytes, 0 hits, 0 requests, NaN recent hit rate, 0 save period in seconds Counter Cache : entries 0, size 0 bytes, capacity 50 MB, 0 hits, 0 requests, NaN recent hit rate, 7200 save period in seconds Token : 80372383360720788
# cassandra.yaml settings key_cache_size_in_mb: 100 row_cache_size_in_mb: 0 counter_cache_size_in_mb: 50
# cql per-table configuration alter table foo with caching = {'keys': 'ALL', 'rows_per_partition': ‘NONE'};
Company Confidential© 2014 DataStax, All Rights Reserved. 49
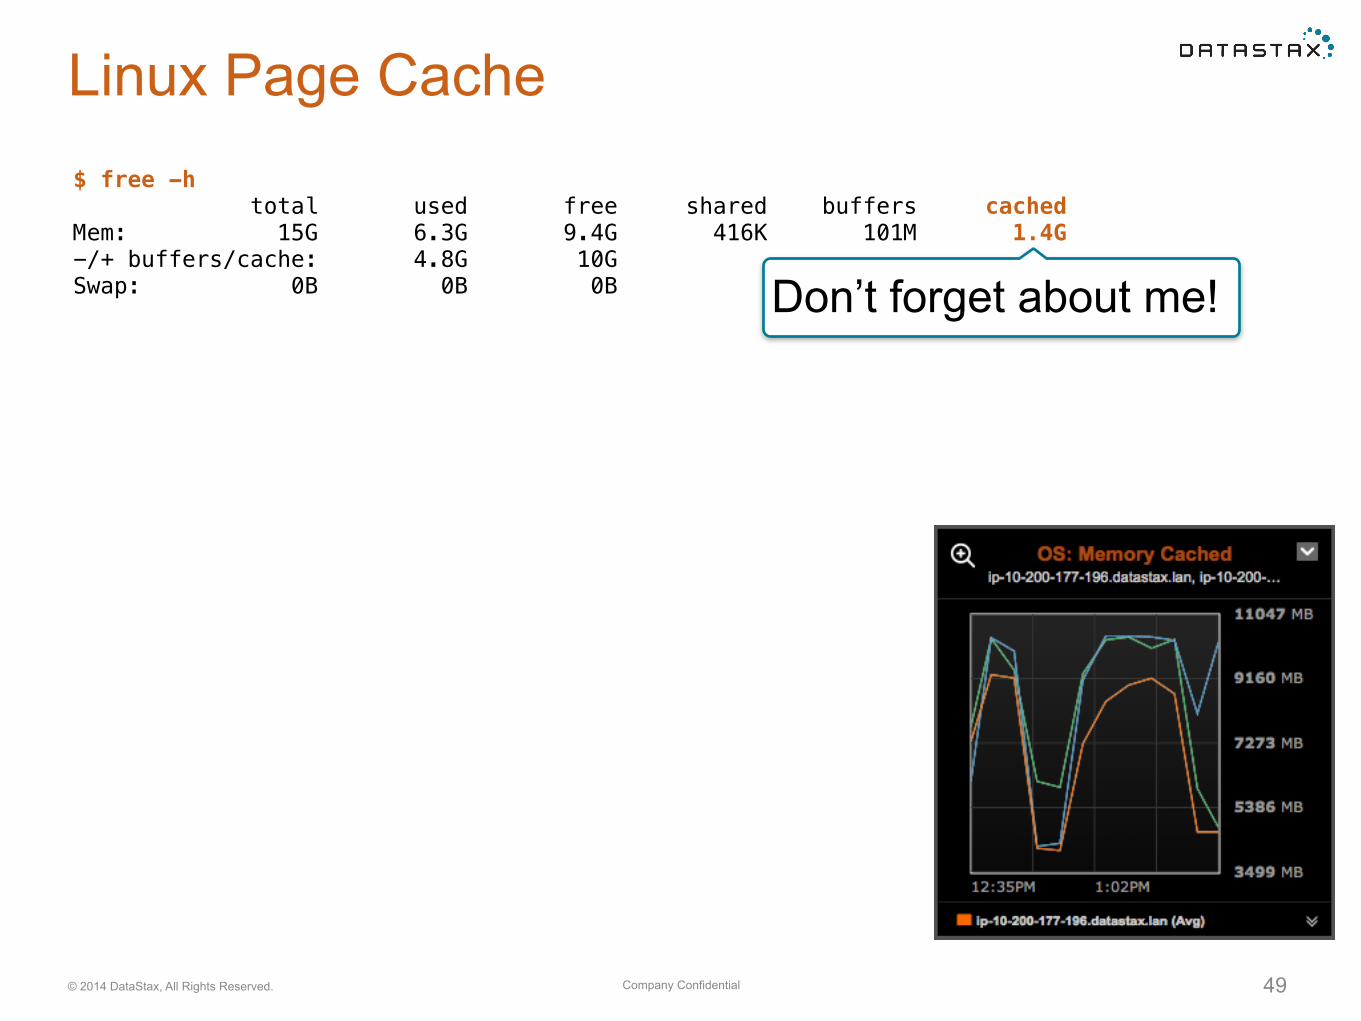
Linux Page Cache$ free -h total used free shared buffers cached Mem: 15G 6.3G 9.4G 416K 101M 1.4G -/+ buffers/cache: 4.8G 10G Swap: 0B 0B 0B Don’t forget about me!
Large Data Structures
Company Confidential© 2014 DataStax, All Rights Reserved. 51
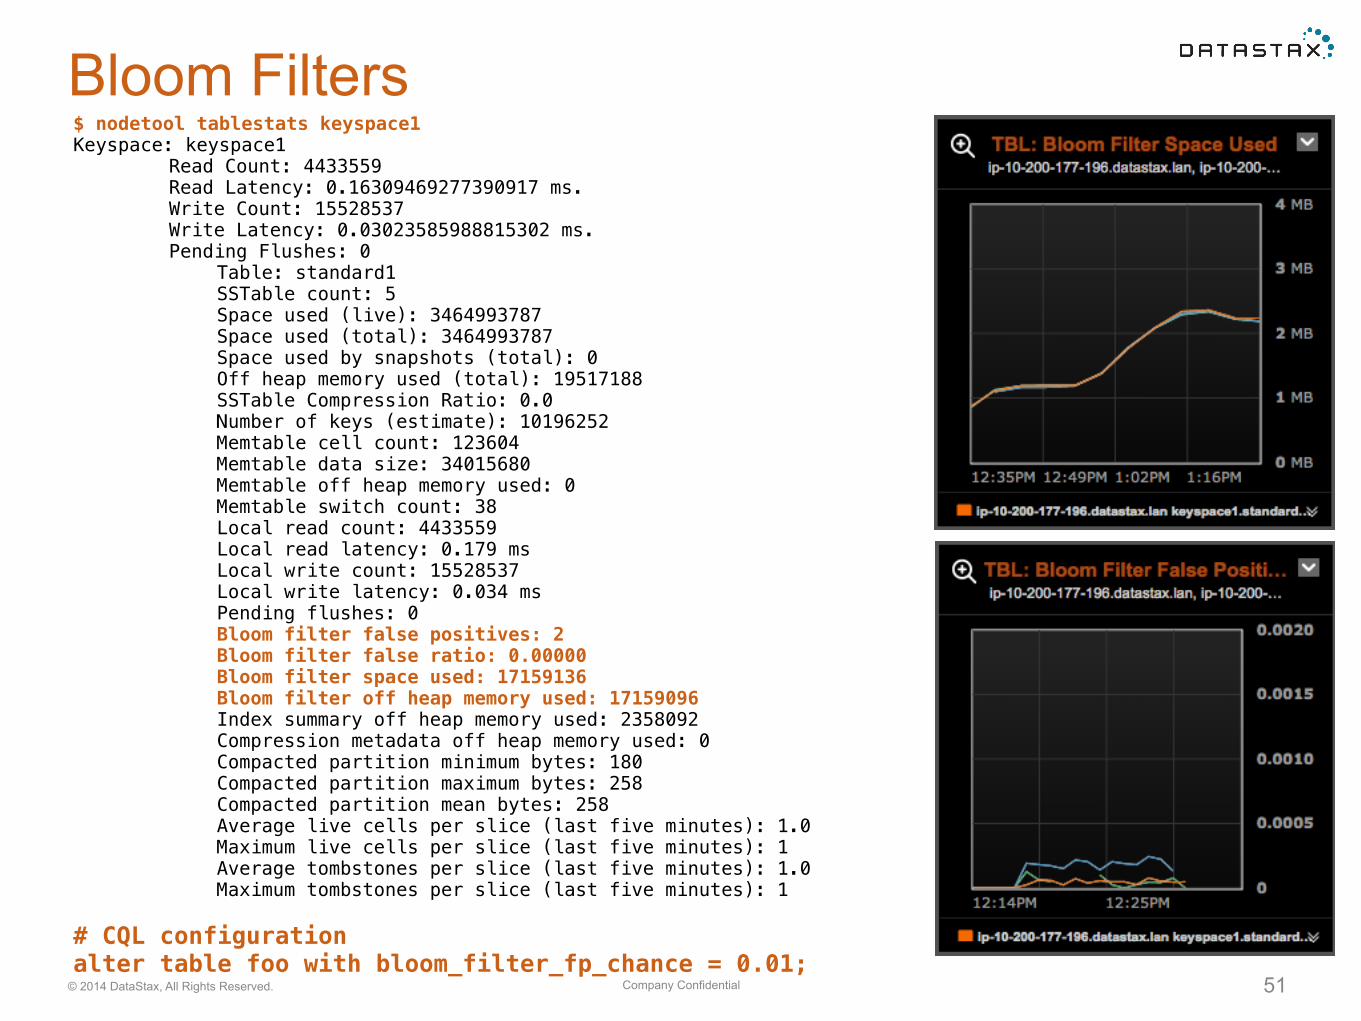
Bloom Filters$ nodetool tablestats keyspace1 Keyspace: keyspace1 Read Count: 4433559 Read Latency: 0.16309469277390917 ms. Write Count: 15528537 Write Latency: 0.03023585988815302 ms. Pending Flushes: 0 Table: standard1 SSTable count: 5 Space used (live): 3464993787 Space used (total): 3464993787 Space used by snapshots (total): 0 Off heap memory used (total): 19517188 SSTable Compression Ratio: 0.0 Number of keys (estimate): 10196252 Memtable cell count: 123604 Memtable data size: 34015680 Memtable off heap memory used: 0 Memtable switch count: 38 Local read count: 4433559 Local read latency: 0.179 ms Local write count: 15528537 Local write latency: 0.034 ms Pending flushes: 0 Bloom filter false positives: 2 Bloom filter false ratio: 0.00000 Bloom filter space used: 17159136 Bloom filter off heap memory used: 17159096 Index summary off heap memory used: 2358092 Compression metadata off heap memory used: 0 Compacted partition minimum bytes: 180 Compacted partition maximum bytes: 258 Compacted partition mean bytes: 258 Average live cells per slice (last five minutes): 1.0 Maximum live cells per slice (last five minutes): 1 Average tombstones per slice (last five minutes): 1.0 Maximum tombstones per slice (last five minutes): 1
# CQL configuration alter table foo with bloom_filter_fp_chance = 0.01;
Company Confidential© 2014 DataStax, All Rights Reserved. 52
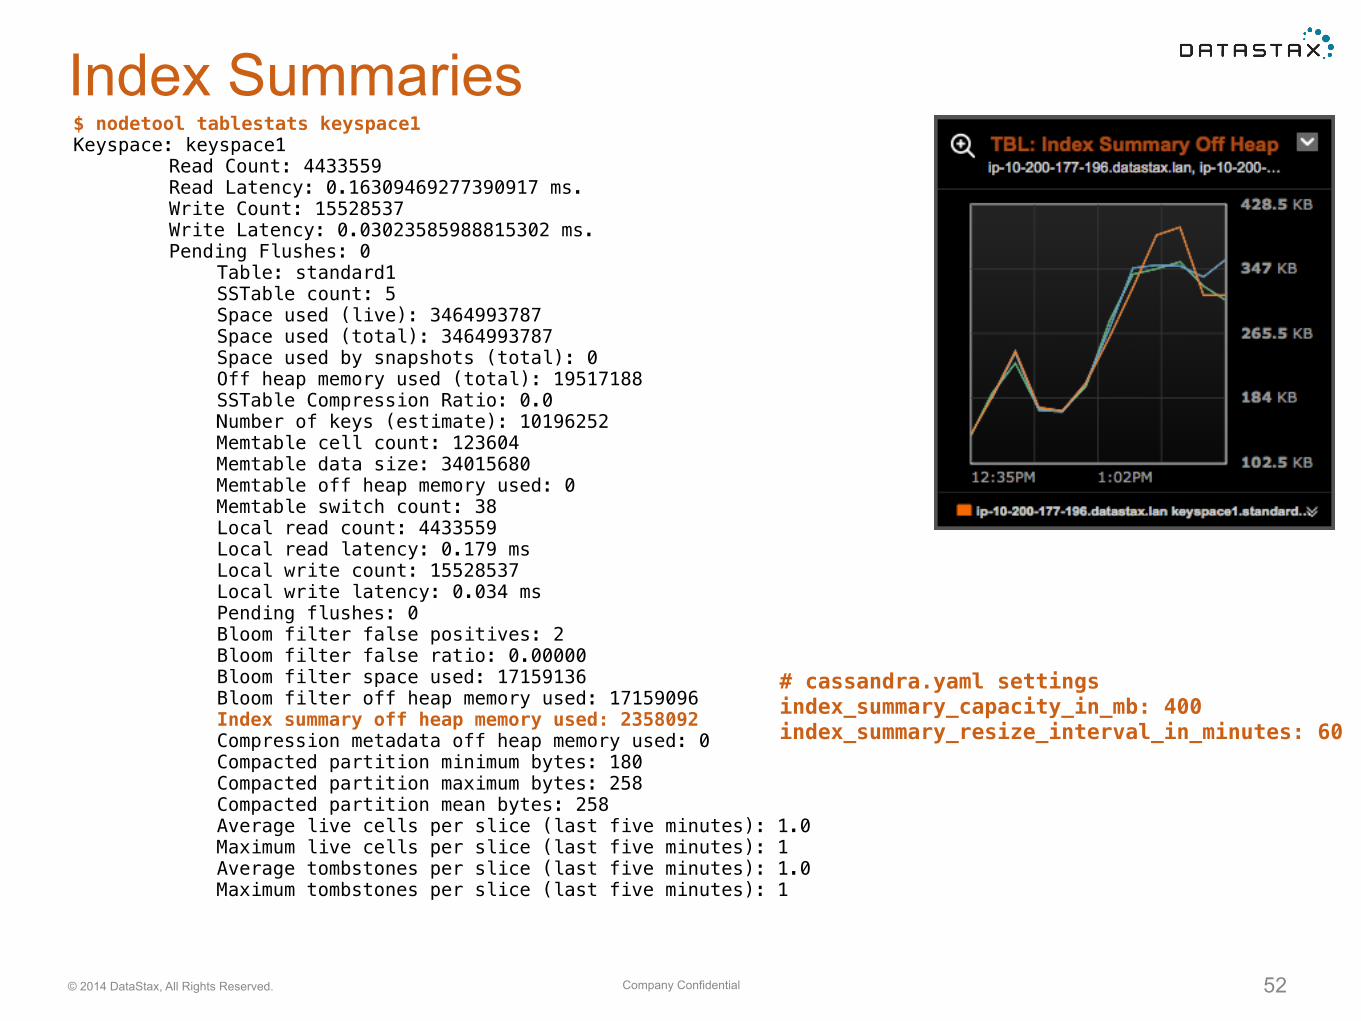
Index Summaries$ nodetool tablestats keyspace1 Keyspace: keyspace1 Read Count: 4433559 Read Latency: 0.16309469277390917 ms. Write Count: 15528537 Write Latency: 0.03023585988815302 ms. Pending Flushes: 0 Table: standard1 SSTable count: 5 Space used (live): 3464993787 Space used (total): 3464993787 Space used by snapshots (total): 0 Off heap memory used (total): 19517188 SSTable Compression Ratio: 0.0 Number of keys (estimate): 10196252 Memtable cell count: 123604 Memtable data size: 34015680 Memtable off heap memory used: 0 Memtable switch count: 38 Local read count: 4433559 Local read latency: 0.179 ms Local write count: 15528537 Local write latency: 0.034 ms Pending flushes: 0 Bloom filter false positives: 2 Bloom filter false ratio: 0.00000 Bloom filter space used: 17159136 Bloom filter off heap memory used: 17159096 Index summary off heap memory used: 2358092 Compression metadata off heap memory used: 0 Compacted partition minimum bytes: 180 Compacted partition maximum bytes: 258 Compacted partition mean bytes: 258 Average live cells per slice (last five minutes): 1.0 Maximum live cells per slice (last five minutes): 1 Average tombstones per slice (last five minutes): 1.0 Maximum tombstones per slice (last five minutes): 1
# cassandra.yaml settings index_summary_capacity_in_mb: 400 index_summary_resize_interval_in_minutes: 60
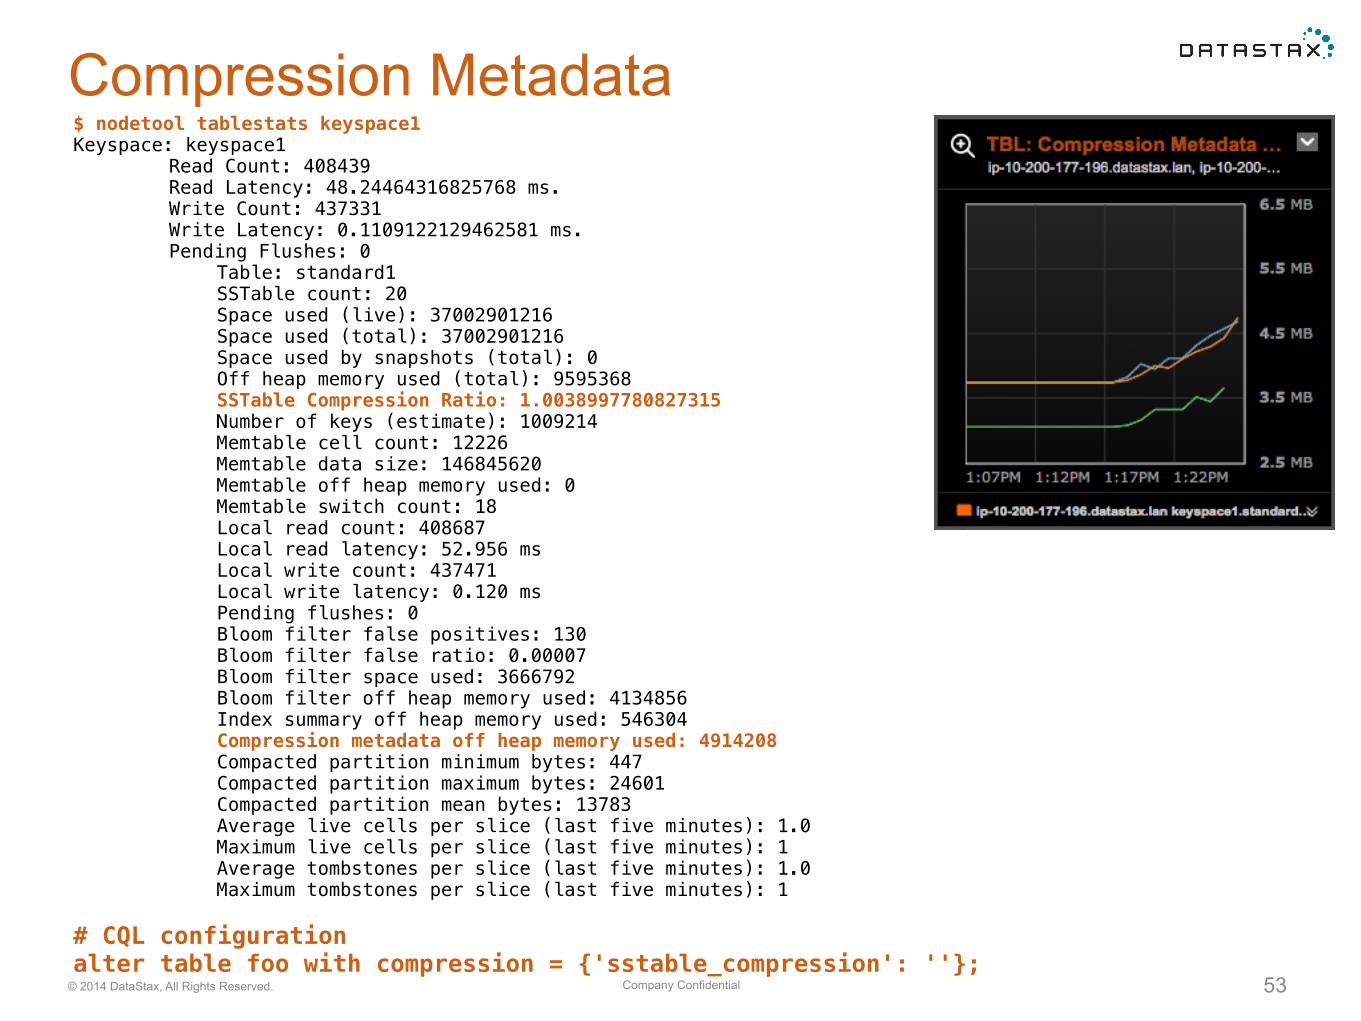
Company Confidential© 2014 DataStax, All Rights Reserved. 53
Compression Metadata$ nodetool tablestats keyspace1 Keyspace: keyspace1 Read Count: 408439 Read Latency: 48.24464316825768 ms. Write Count: 437331 Write Latency: 0.1109122129462581 ms. Pending Flushes: 0 Table: standard1 SSTable count: 20 Space used (live): 37002901216 Space used (total): 37002901216 Space used by snapshots (total): 0 Off heap memory used (total): 9595368 SSTable Compression Ratio: 1.0038997780827315 Number of keys (estimate): 1009214 Memtable cell count: 12226 Memtable data size: 146845620 Memtable off heap memory used: 0 Memtable switch count: 18 Local read count: 408687 Local read latency: 52.956 ms Local write count: 437471 Local write latency: 0.120 ms Pending flushes: 0 Bloom filter false positives: 130 Bloom filter false ratio: 0.00007 Bloom filter space used: 3666792 Bloom filter off heap memory used: 4134856 Index summary off heap memory used: 546304 Compression metadata off heap memory used: 4914208 Compacted partition minimum bytes: 447 Compacted partition maximum bytes: 24601 Compacted partition mean bytes: 13783 Average live cells per slice (last five minutes): 1.0 Maximum live cells per slice (last five minutes): 1 Average tombstones per slice (last five minutes): 1.0 Maximum tombstones per slice (last five minutes): 1
# CQL configuration alter table foo with compression = {'sstable_compression': ''};
Disk
Company Confidential© 2014 DataStax, All Rights Reserved. 55
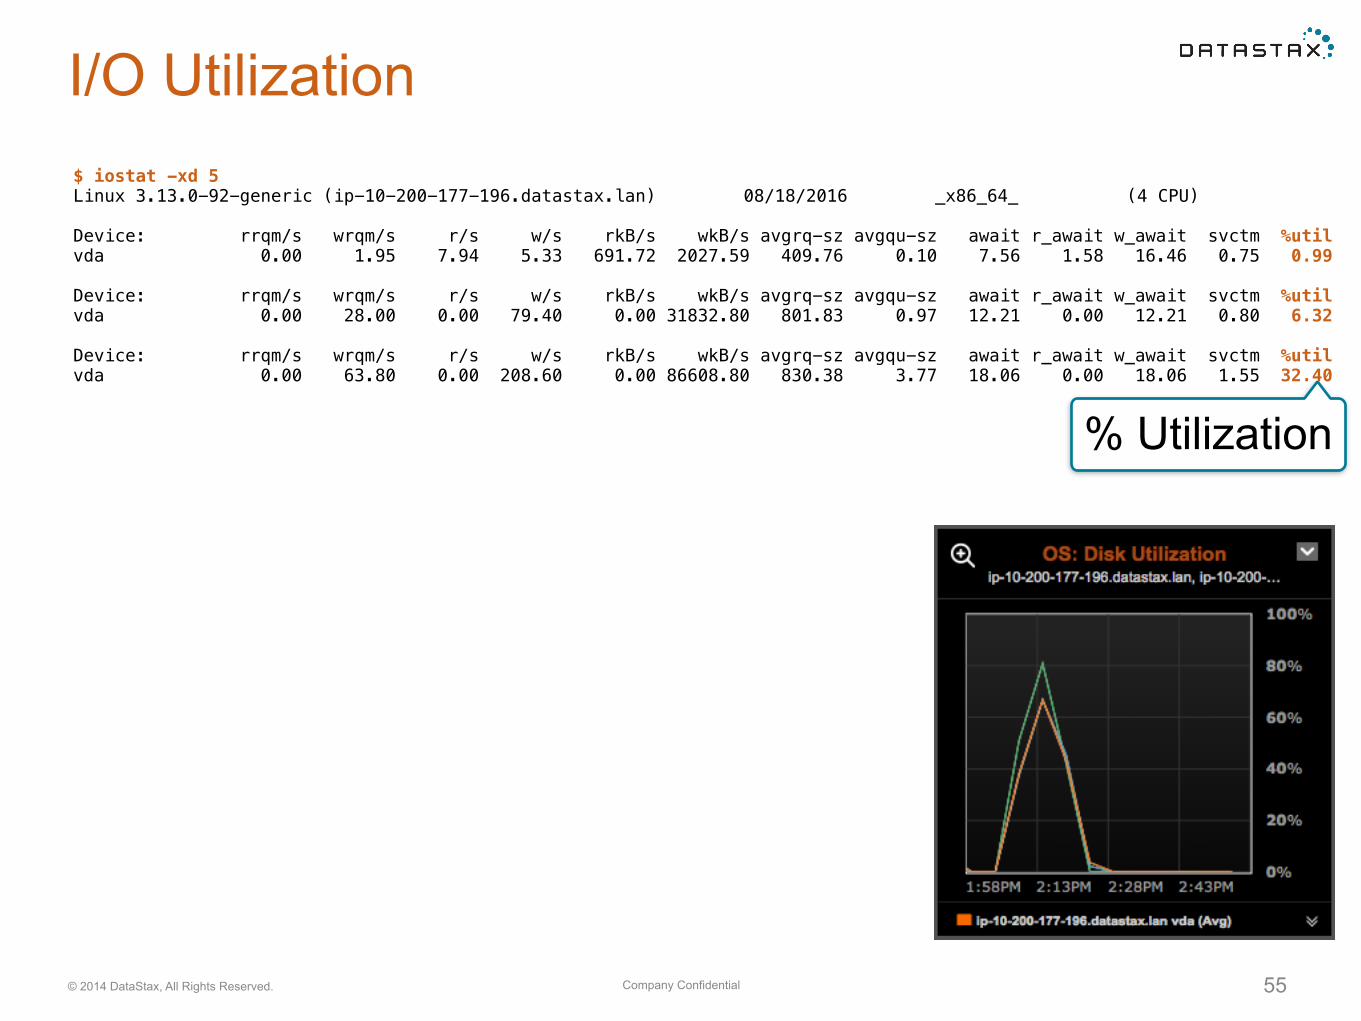
I/O Utilization$ iostat -xd 5 Linux 3.13.0-92-generic (ip-10-200-177-196.datastax.lan) 08/18/2016 _x86_64_ (4 CPU)
Device: rrqm/s wrqm/s r/s w/s rkB/s wkB/s avgrq-sz avgqu-sz await r_await w_await svctm %util vda 0.00 1.95 7.94 5.33 691.72 2027.59 409.76 0.10 7.56 1.58 16.46 0.75 0.99
Device: rrqm/s wrqm/s r/s w/s rkB/s wkB/s avgrq-sz avgqu-sz await r_await w_await svctm %util vda 0.00 28.00 0.00 79.40 0.00 31832.80 801.83 0.97 12.21 0.00 12.21 0.80 6.32
Device: rrqm/s wrqm/s r/s w/s rkB/s wkB/s avgrq-sz avgqu-sz await r_await w_await svctm %util vda 0.00 63.80 0.00 208.60 0.00 86608.80 830.38 3.77 18.06 0.00 18.06 1.55 32.40
% Utilization
Company Confidential© 2014 DataStax, All Rights Reserved. 56
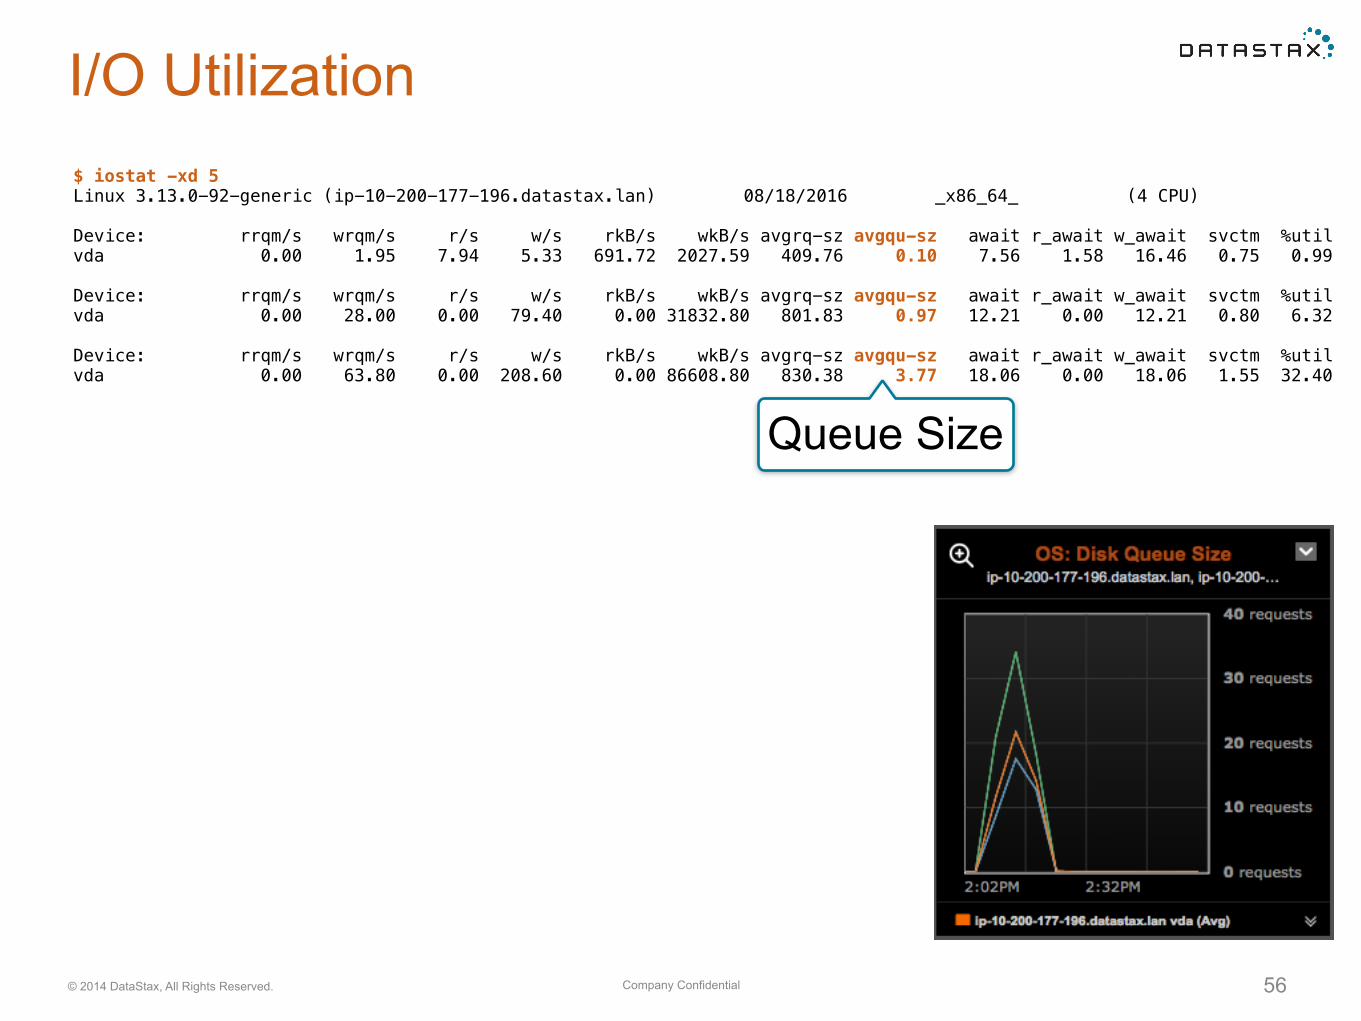
I/O Utilization$ iostat -xd 5 Linux 3.13.0-92-generic (ip-10-200-177-196.datastax.lan) 08/18/2016 _x86_64_ (4 CPU)
Device: rrqm/s wrqm/s r/s w/s rkB/s wkB/s avgrq-sz avgqu-sz await r_await w_await svctm %util vda 0.00 1.95 7.94 5.33 691.72 2027.59 409.76 0.10 7.56 1.58 16.46 0.75 0.99
Device: rrqm/s wrqm/s r/s w/s rkB/s wkB/s avgrq-sz avgqu-sz await r_await w_await svctm %util vda 0.00 28.00 0.00 79.40 0.00 31832.80 801.83 0.97 12.21 0.00 12.21 0.80 6.32
Device: rrqm/s wrqm/s r/s w/s rkB/s wkB/s avgrq-sz avgqu-sz await r_await w_await svctm %util vda 0.00 63.80 0.00 208.60 0.00 86608.80 830.38 3.77 18.06 0.00 18.06 1.55 32.40
Queue Size
Company Confidential© 2014 DataStax, All Rights Reserved. 57
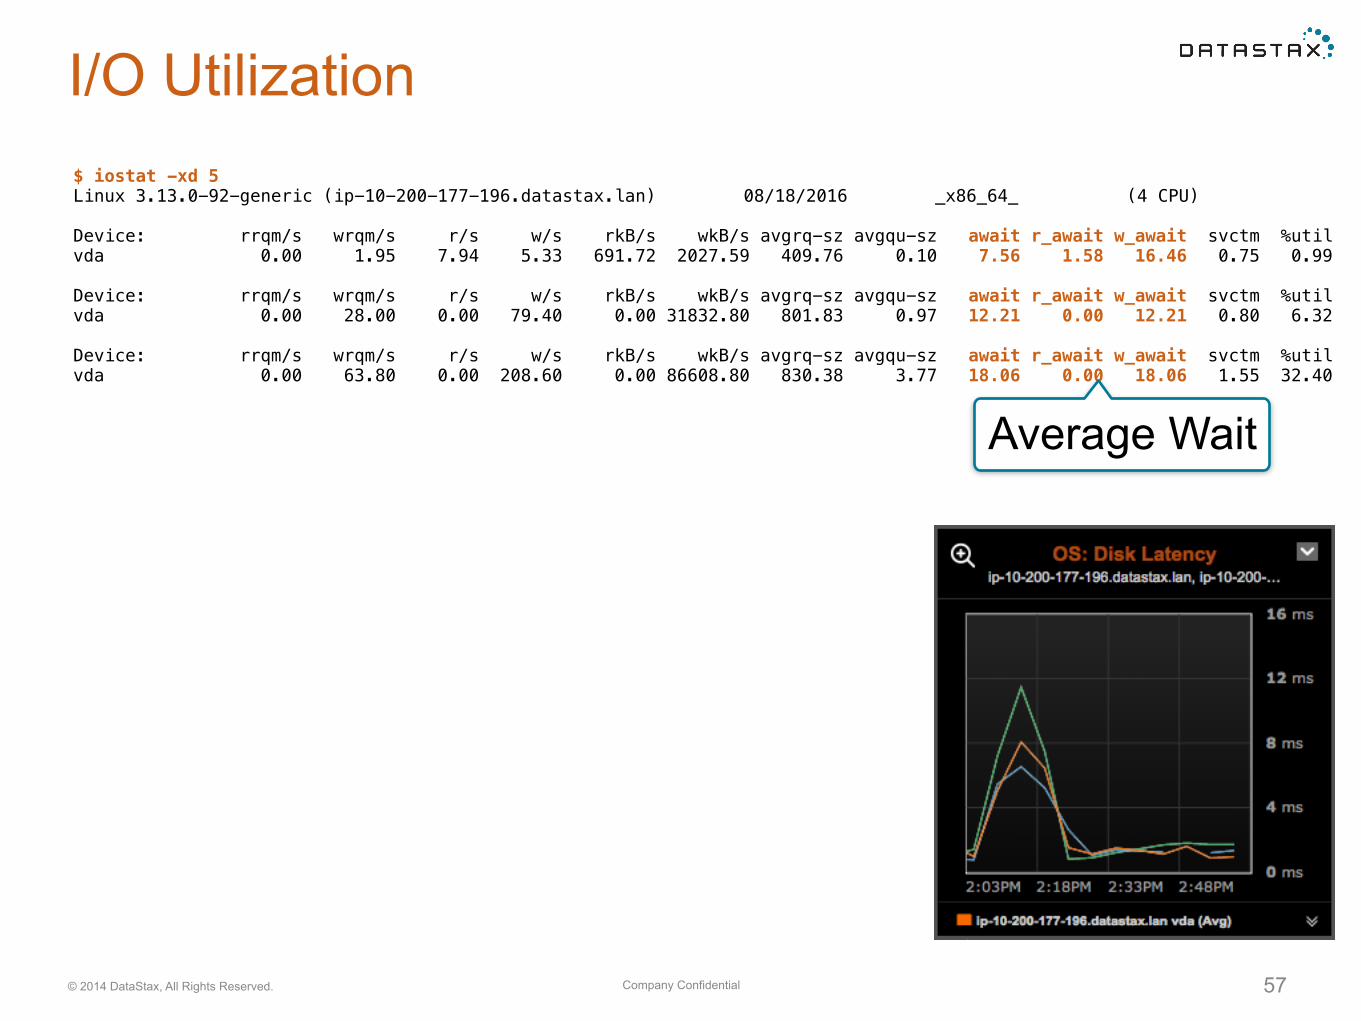
I/O Utilization$ iostat -xd 5 Linux 3.13.0-92-generic (ip-10-200-177-196.datastax.lan) 08/18/2016 _x86_64_ (4 CPU)
Device: rrqm/s wrqm/s r/s w/s rkB/s wkB/s avgrq-sz avgqu-sz await r_await w_await svctm %util vda 0.00 1.95 7.94 5.33 691.72 2027.59 409.76 0.10 7.56 1.58 16.46 0.75 0.99
Device: rrqm/s wrqm/s r/s w/s rkB/s wkB/s avgrq-sz avgqu-sz await r_await w_await svctm %util vda 0.00 28.00 0.00 79.40 0.00 31832.80 801.83 0.97 12.21 0.00 12.21 0.80 6.32
Device: rrqm/s wrqm/s r/s w/s rkB/s wkB/s avgrq-sz avgqu-sz await r_await w_await svctm %util vda 0.00 63.80 0.00 208.60 0.00 86608.80 830.38 3.77 18.06 0.00 18.06 1.55 32.40
Average Wait
Company Confidential© 2014 DataStax, All Rights Reserved. 58
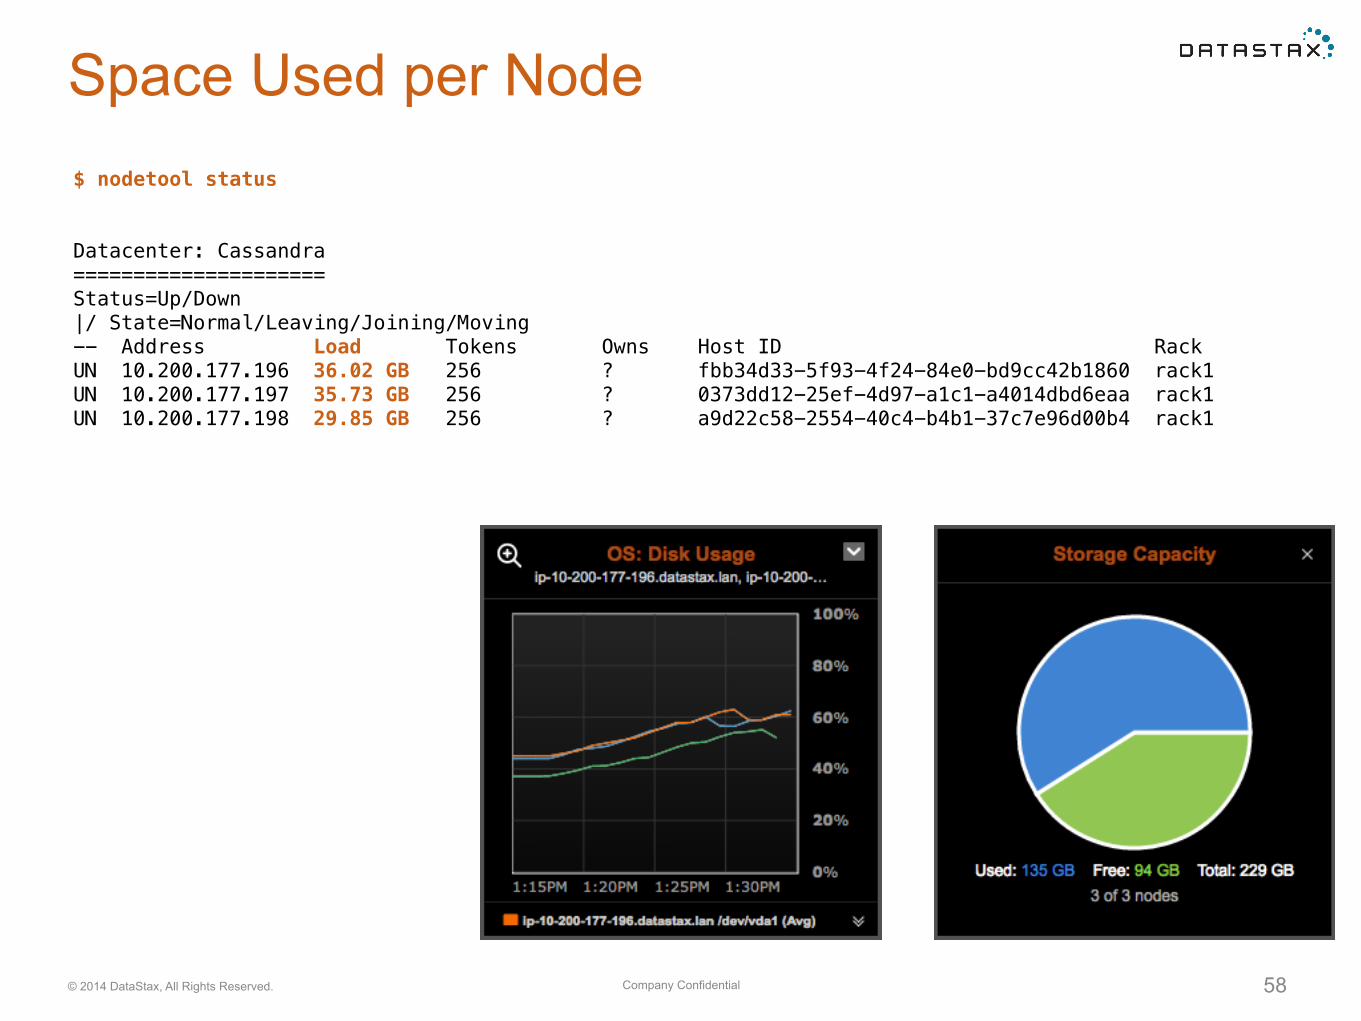
Space Used per Node$ nodetool status
Datacenter: Cassandra ===================== Status=Up/Down |/ State=Normal/Leaving/Joining/Moving -- Address Load Tokens Owns Host ID Rack UN 10.200.177.196 36.02 GB 256 ? fbb34d33-5f93-4f24-84e0-bd9cc42b1860 rack1 UN 10.200.177.197 35.73 GB 256 ? 0373dd12-25ef-4d97-a1c1-a4014dbd6eaa rack1 UN 10.200.177.198 29.85 GB 256 ? a9d22c58-2554-40c4-b4b1-37c7e96d00b4 rack1
Company Confidential© 2014 DataStax, All Rights Reserved. 59
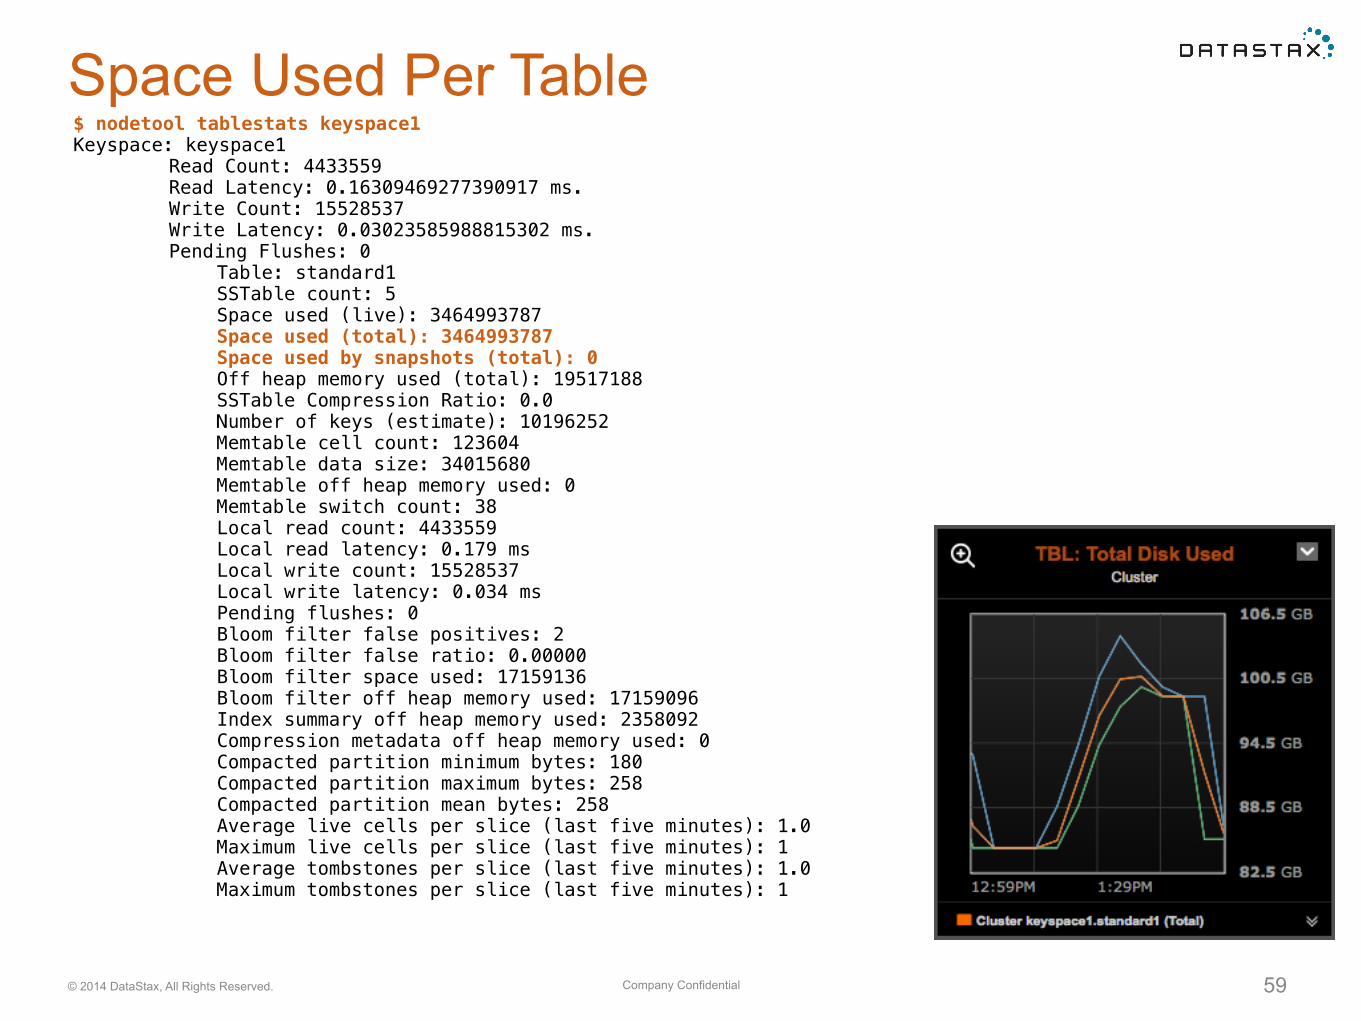
Space Used Per Table$ nodetool tablestats keyspace1 Keyspace: keyspace1 Read Count: 4433559 Read Latency: 0.16309469277390917 ms. Write Count: 15528537 Write Latency: 0.03023585988815302 ms. Pending Flushes: 0 Table: standard1 SSTable count: 5 Space used (live): 3464993787 Space used (total): 3464993787 Space used by snapshots (total): 0 Off heap memory used (total): 19517188 SSTable Compression Ratio: 0.0 Number of keys (estimate): 10196252 Memtable cell count: 123604 Memtable data size: 34015680 Memtable off heap memory used: 0 Memtable switch count: 38 Local read count: 4433559 Local read latency: 0.179 ms Local write count: 15528537 Local write latency: 0.034 ms Pending flushes: 0 Bloom filter false positives: 2 Bloom filter false ratio: 0.00000 Bloom filter space used: 17159136 Bloom filter off heap memory used: 17159096 Index summary off heap memory used: 2358092 Compression metadata off heap memory used: 0 Compacted partition minimum bytes: 180 Compacted partition maximum bytes: 258 Compacted partition mean bytes: 258 Average live cells per slice (last five minutes): 1.0 Maximum live cells per slice (last five minutes): 1 Average tombstones per slice (last five minutes): 1.0 Maximum tombstones per slice (last five minutes): 1
Uneven Data Distribution
Company Confidential© 2014 DataStax, All Rights Reserved. 61
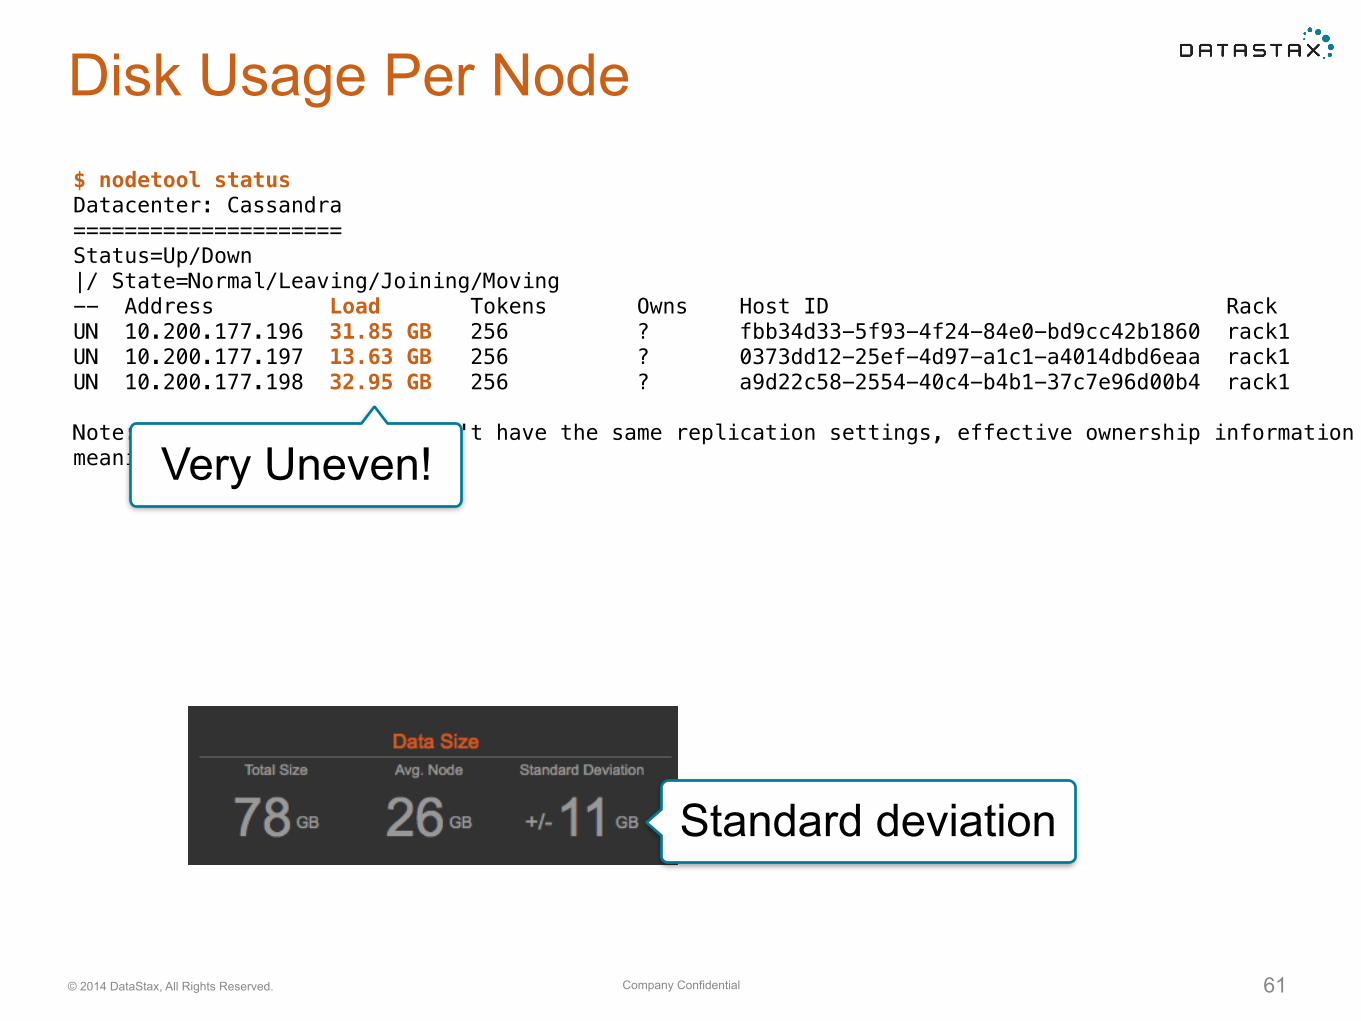
Disk Usage Per Node$ nodetool status Datacenter: Cassandra ===================== Status=Up/Down |/ State=Normal/Leaving/Joining/Moving -- Address Load Tokens Owns Host ID Rack UN 10.200.177.196 31.85 GB 256 ? fbb34d33-5f93-4f24-84e0-bd9cc42b1860 rack1 UN 10.200.177.197 13.63 GB 256 ? 0373dd12-25ef-4d97-a1c1-a4014dbd6eaa rack1 UN 10.200.177.198 32.95 GB 256 ? a9d22c58-2554-40c4-b4b1-37c7e96d00b4 rack1
Note: Non-system keyspaces don't have the same replication settings, effective ownership information is meaninglessVery Uneven!
Standard deviation
Company Confidential© 2014 DataStax, All Rights Reserved. 62
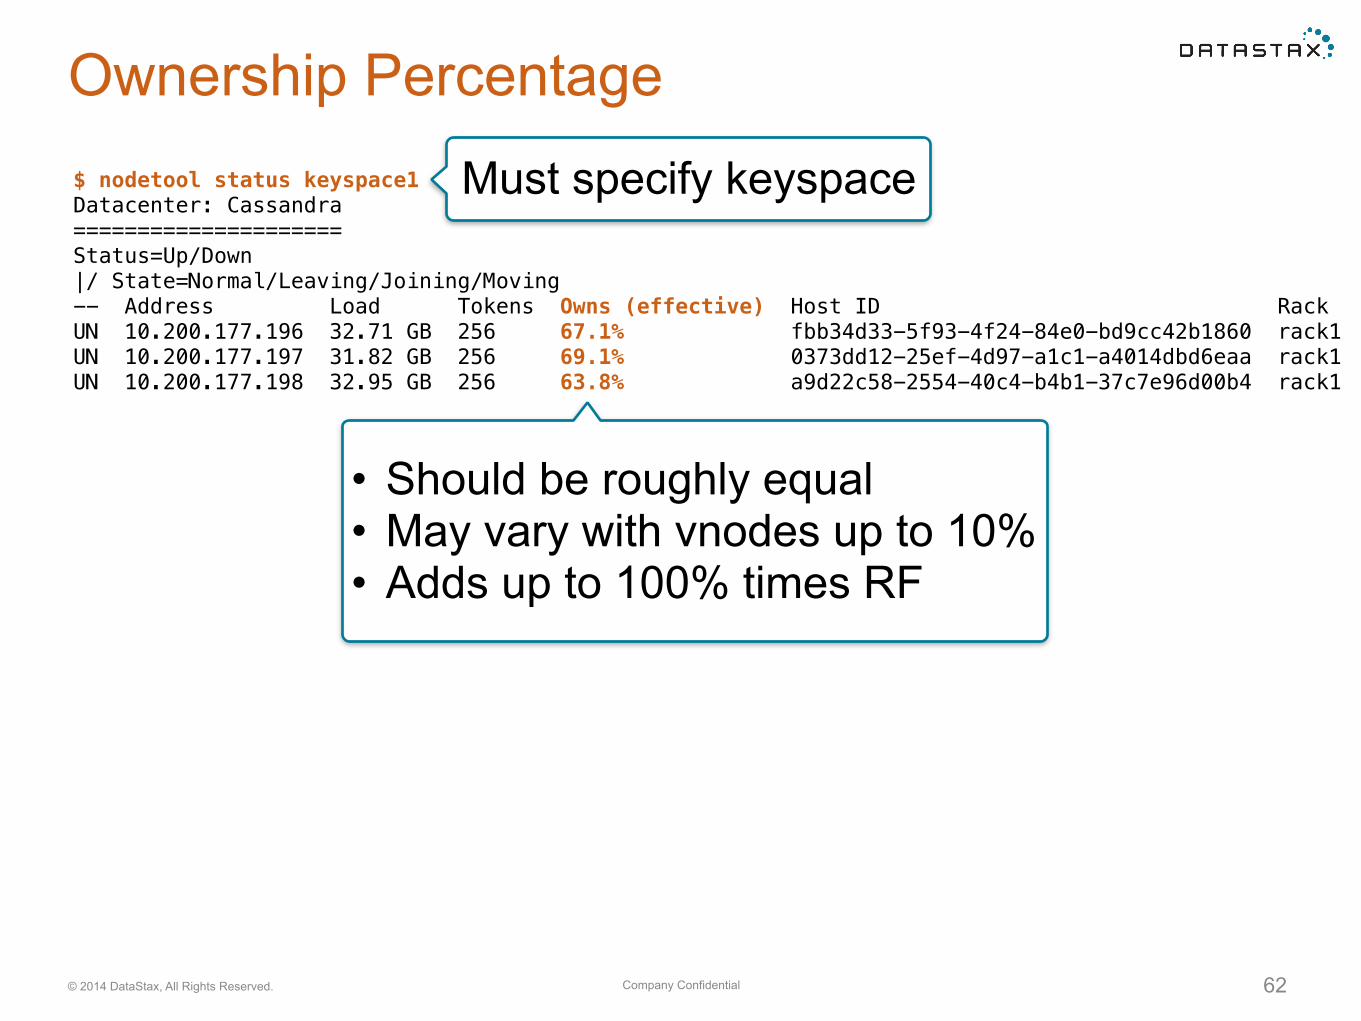
Ownership Percentage$ nodetool status keyspace1 Datacenter: Cassandra ===================== Status=Up/Down |/ State=Normal/Leaving/Joining/Moving -- Address Load Tokens Owns (effective) Host ID Rack UN 10.200.177.196 32.71 GB 256 67.1% fbb34d33-5f93-4f24-84e0-bd9cc42b1860 rack1 UN 10.200.177.197 31.82 GB 256 69.1% 0373dd12-25ef-4d97-a1c1-a4014dbd6eaa rack1 UN 10.200.177.198 32.95 GB 256 63.8% a9d22c58-2554-40c4-b4b1-37c7e96d00b4 rack1
• Should be roughly equal • May vary with vnodes up to 10% • Adds up to 100% times RF
Must specify keyspace
Company Confidential© 2014 DataStax, All Rights Reserved. 63
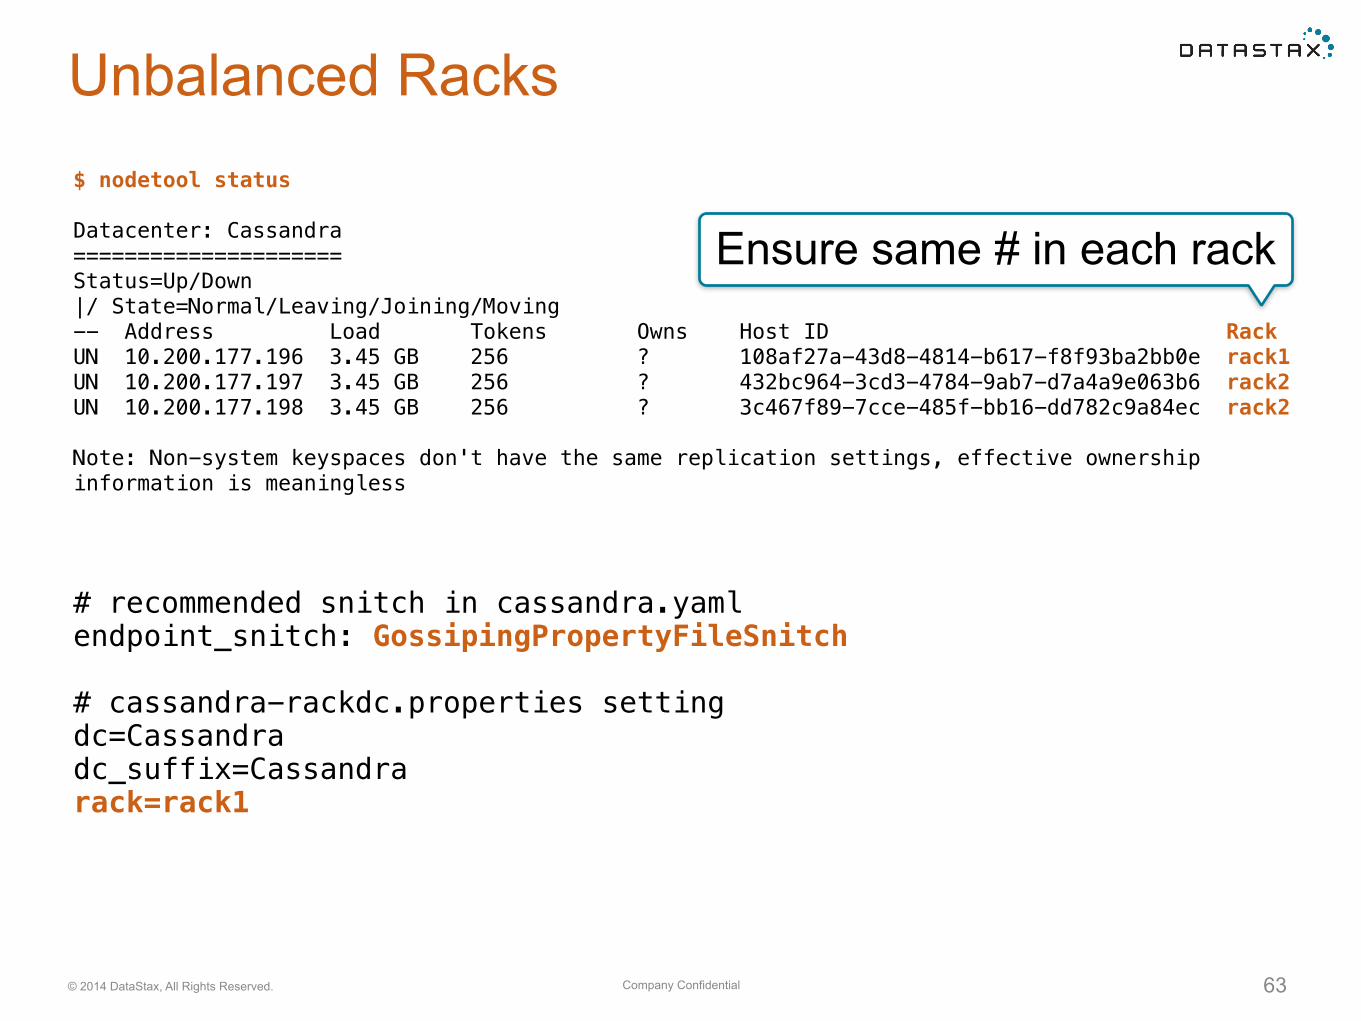
Unbalanced Racks$ nodetool status
Datacenter: Cassandra ===================== Status=Up/Down |/ State=Normal/Leaving/Joining/Moving -- Address Load Tokens Owns Host ID Rack UN 10.200.177.196 3.45 GB 256 ? 108af27a-43d8-4814-b617-f8f93ba2bb0e rack1 UN 10.200.177.197 3.45 GB 256 ? 432bc964-3cd3-4784-9ab7-d7a4a9e063b6 rack2 UN 10.200.177.198 3.45 GB 256 ? 3c467f89-7cce-485f-bb16-dd782c9a84ec rack2
Note: Non-system keyspaces don't have the same replication settings, effective ownership information is meaningless
# recommended snitch in cassandra.yaml endpoint_snitch: GossipingPropertyFileSnitch
# cassandra-rackdc.properties setting dc=Cassandra dc_suffix=Cassandra rack=rack1
Ensure same # in each rack
Company Confidential© 2014 DataStax, All Rights Reserved. 64
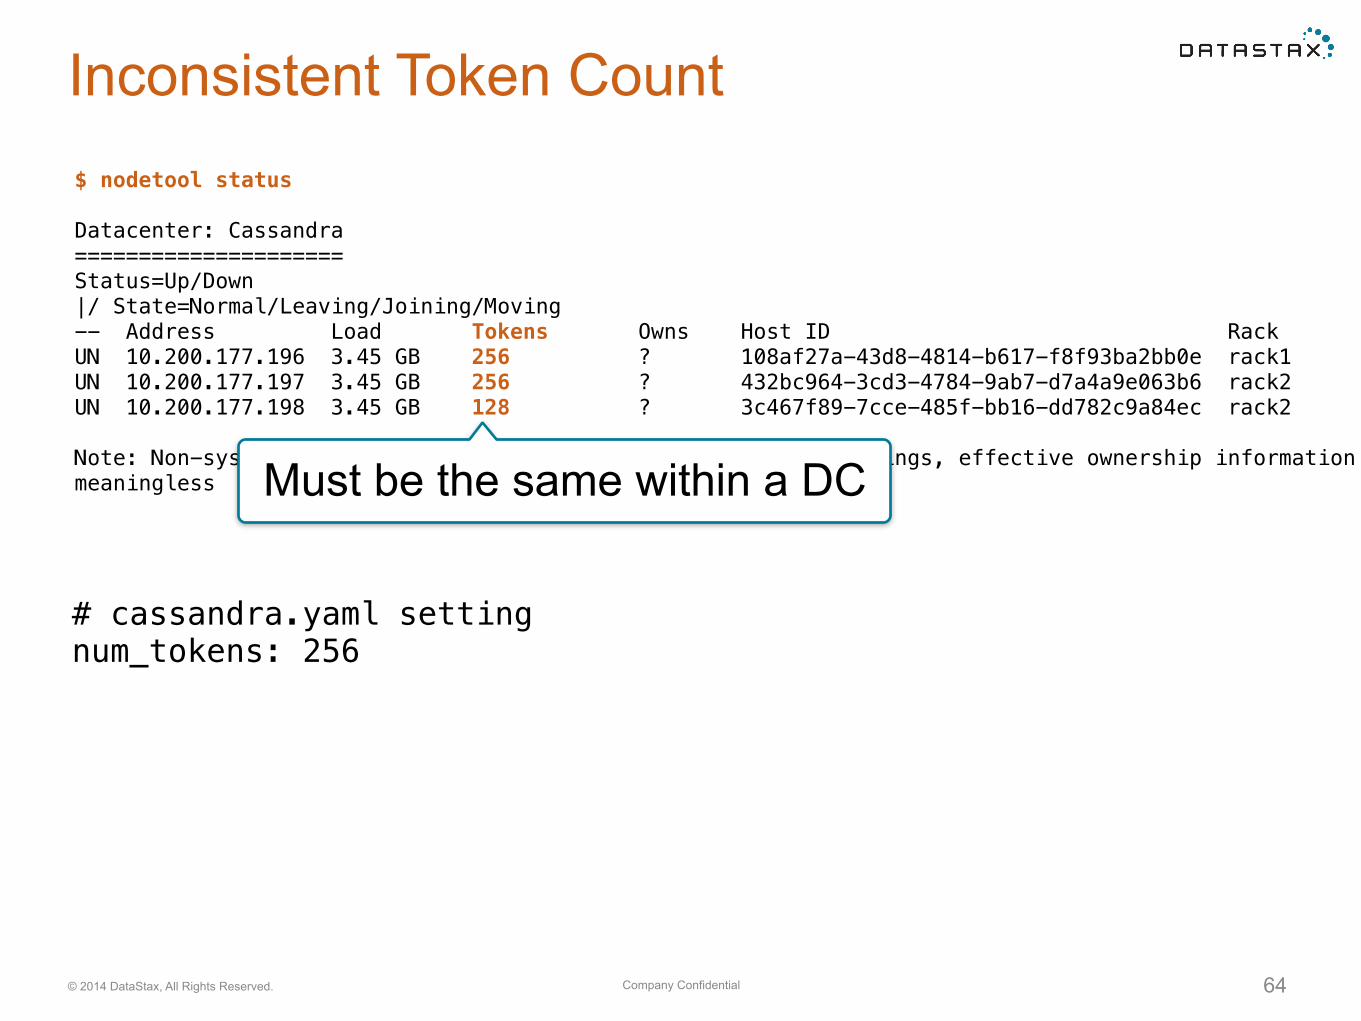
Inconsistent Token Count$ nodetool status
Datacenter: Cassandra ===================== Status=Up/Down |/ State=Normal/Leaving/Joining/Moving -- Address Load Tokens Owns Host ID Rack UN 10.200.177.196 3.45 GB 256 ? 108af27a-43d8-4814-b617-f8f93ba2bb0e rack1 UN 10.200.177.197 3.45 GB 256 ? 432bc964-3cd3-4784-9ab7-d7a4a9e063b6 rack2 UN 10.200.177.198 3.45 GB 128 ? 3c467f89-7cce-485f-bb16-dd782c9a84ec rack2
Note: Non-system keyspaces don't have the same replication settings, effective ownership information is meaningless
# cassandra.yaml setting num_tokens: 256
Must be the same within a DC
Company Confidential© 2014 DataStax, All Rights Reserved. 65
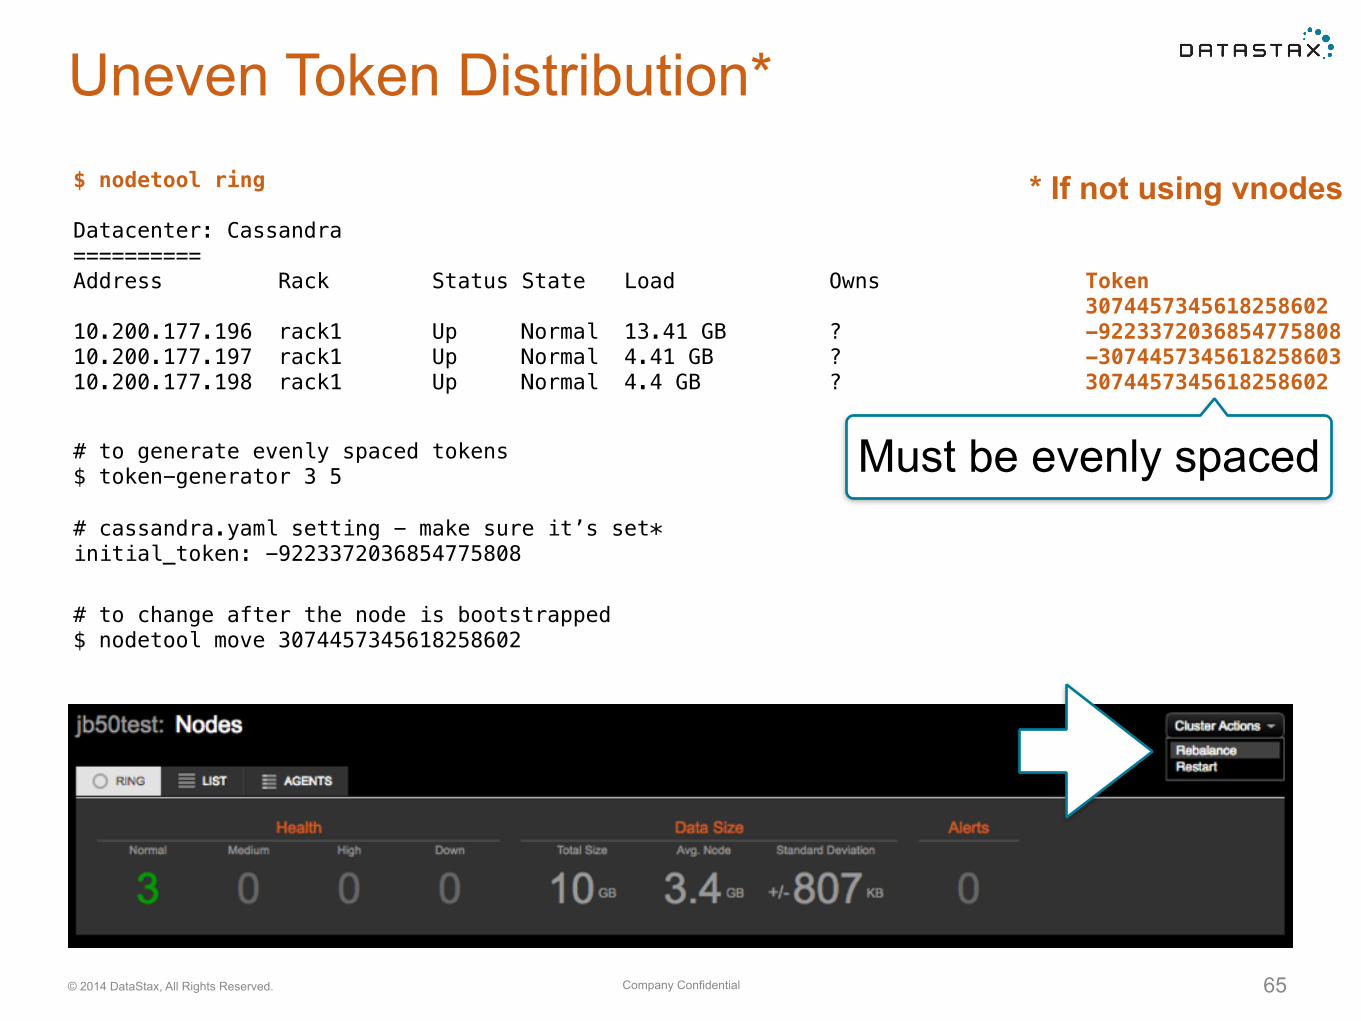
Uneven Token Distribution*$ nodetool ring
Datacenter: Cassandra ========== Address Rack Status State Load Owns Token 3074457345618258602 10.200.177.196 rack1 Up Normal 13.41 GB ? -9223372036854775808 10.200.177.197 rack1 Up Normal 4.41 GB ? -3074457345618258603 10.200.177.198 rack1 Up Normal 4.4 GB ? 3074457345618258602
# to change after the node is bootstrapped $ nodetool move 3074457345618258602
# cassandra.yaml setting - make sure it’s set* initial_token: -9223372036854775808
Must be evenly spaced# to generate evenly spaced tokens $ token-generator 3 5
* If not using vnodes

Company Confidential© 2014 DataStax, All Rights Reserved. 66
Partition Size and Cell Count$ nodetool tablehistograms keyspace1 standard1
foo/bar histograms Percentile SSTables Write Latency Read Latency Partition Size Cell Count (micros) (micros) (bytes) 50% 3.00 124.00 924.00 29521 149 75% 3.00 215.00 1331.00 61214 310 95% 3.00 642.00 2299.00 219342 924 98% 3.00 1109.00 3311.00 379022 1331 99% 3.00 1331.00 3973.00 454826 1916 Min 0.00 43.00 51.00 1332 11 Max 3.00 2759.00 42510.00 2346799 6866
Company Confidential© 2014 DataStax, All Rights Reserved. 67
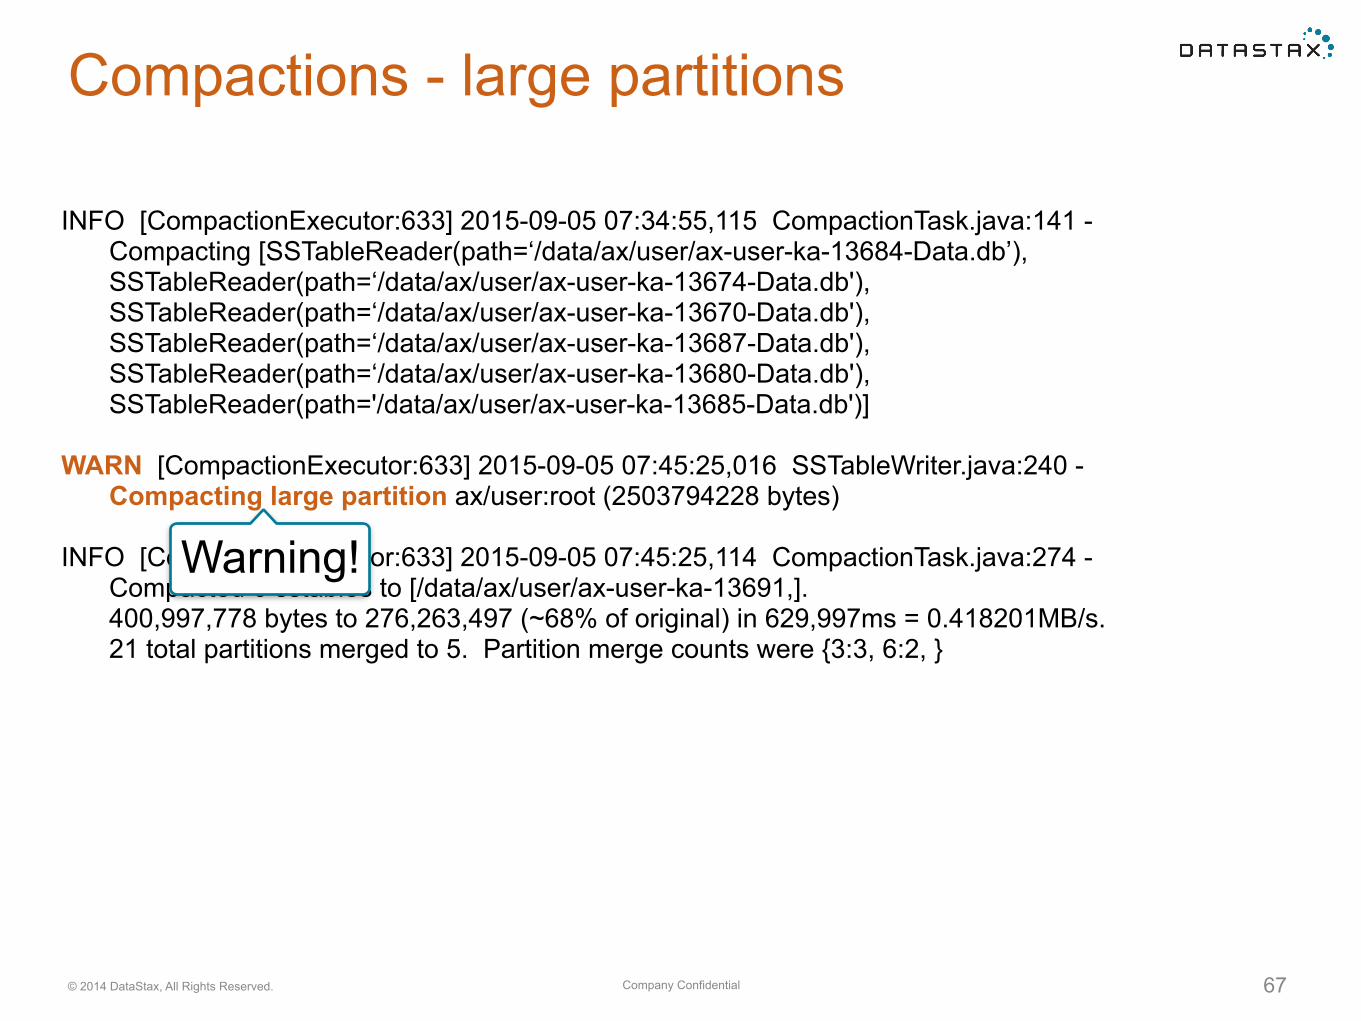
Compactions - large partitions
INFO [CompactionExecutor:633] 2015-09-05 07:34:55,115 CompactionTask.java:141 - Compacting [SSTableReader(path=‘/data/ax/user/ax-user-ka-13684-Data.db’), SSTableReader(path=‘/data/ax/user/ax-user-ka-13674-Data.db'), SSTableReader(path=‘/data/ax/user/ax-user-ka-13670-Data.db'), SSTableReader(path=‘/data/ax/user/ax-user-ka-13687-Data.db'), SSTableReader(path=‘/data/ax/user/ax-user-ka-13680-Data.db'), SSTableReader(path='/data/ax/user/ax-user-ka-13685-Data.db')]
WARN [CompactionExecutor:633] 2015-09-05 07:45:25,016 SSTableWriter.java:240 - Compacting large partition ax/user:root (2503794228 bytes)
INFO [CompactionExecutor:633] 2015-09-05 07:45:25,114 CompactionTask.java:274 - Compacted 6 sstables to [/data/ax/user/ax-user-ka-13691,]. 400,997,778 bytes to 276,263,497 (~68% of original) in 629,997ms = 0.418201MB/s. 21 total partitions merged to 5. Partition merge counts were {3:3, 6:2, }
Warning!
Company Confidential© 2014 DataStax, All Rights Reserved. 68
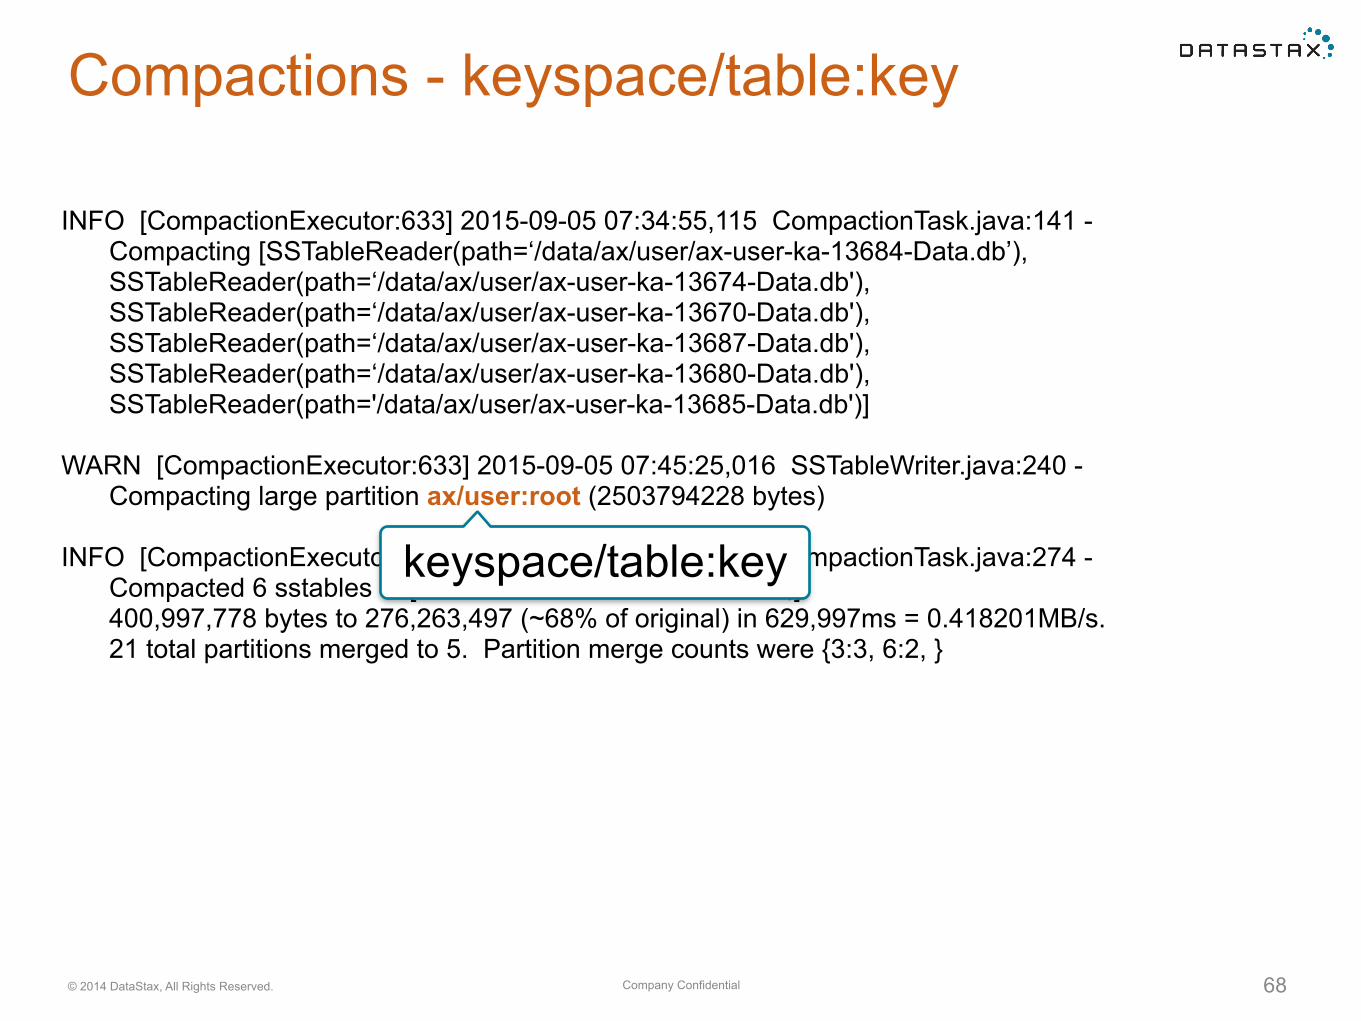
Compactions - keyspace/table:key
INFO [CompactionExecutor:633] 2015-09-05 07:34:55,115 CompactionTask.java:141 - Compacting [SSTableReader(path=‘/data/ax/user/ax-user-ka-13684-Data.db’), SSTableReader(path=‘/data/ax/user/ax-user-ka-13674-Data.db'), SSTableReader(path=‘/data/ax/user/ax-user-ka-13670-Data.db'), SSTableReader(path=‘/data/ax/user/ax-user-ka-13687-Data.db'), SSTableReader(path=‘/data/ax/user/ax-user-ka-13680-Data.db'), SSTableReader(path='/data/ax/user/ax-user-ka-13685-Data.db')]
WARN [CompactionExecutor:633] 2015-09-05 07:45:25,016 SSTableWriter.java:240 - Compacting large partition ax/user:root (2503794228 bytes)
INFO [CompactionExecutor:633] 2015-09-05 07:45:25,114 CompactionTask.java:274 - Compacted 6 sstables to [/data/ax/user/ax-user-ka-13691,]. 400,997,778 bytes to 276,263,497 (~68% of original) in 629,997ms = 0.418201MB/s. 21 total partitions merged to 5. Partition merge counts were {3:3, 6:2, }
keyspace/table:key
Company Confidential© 2014 DataStax, All Rights Reserved. 69
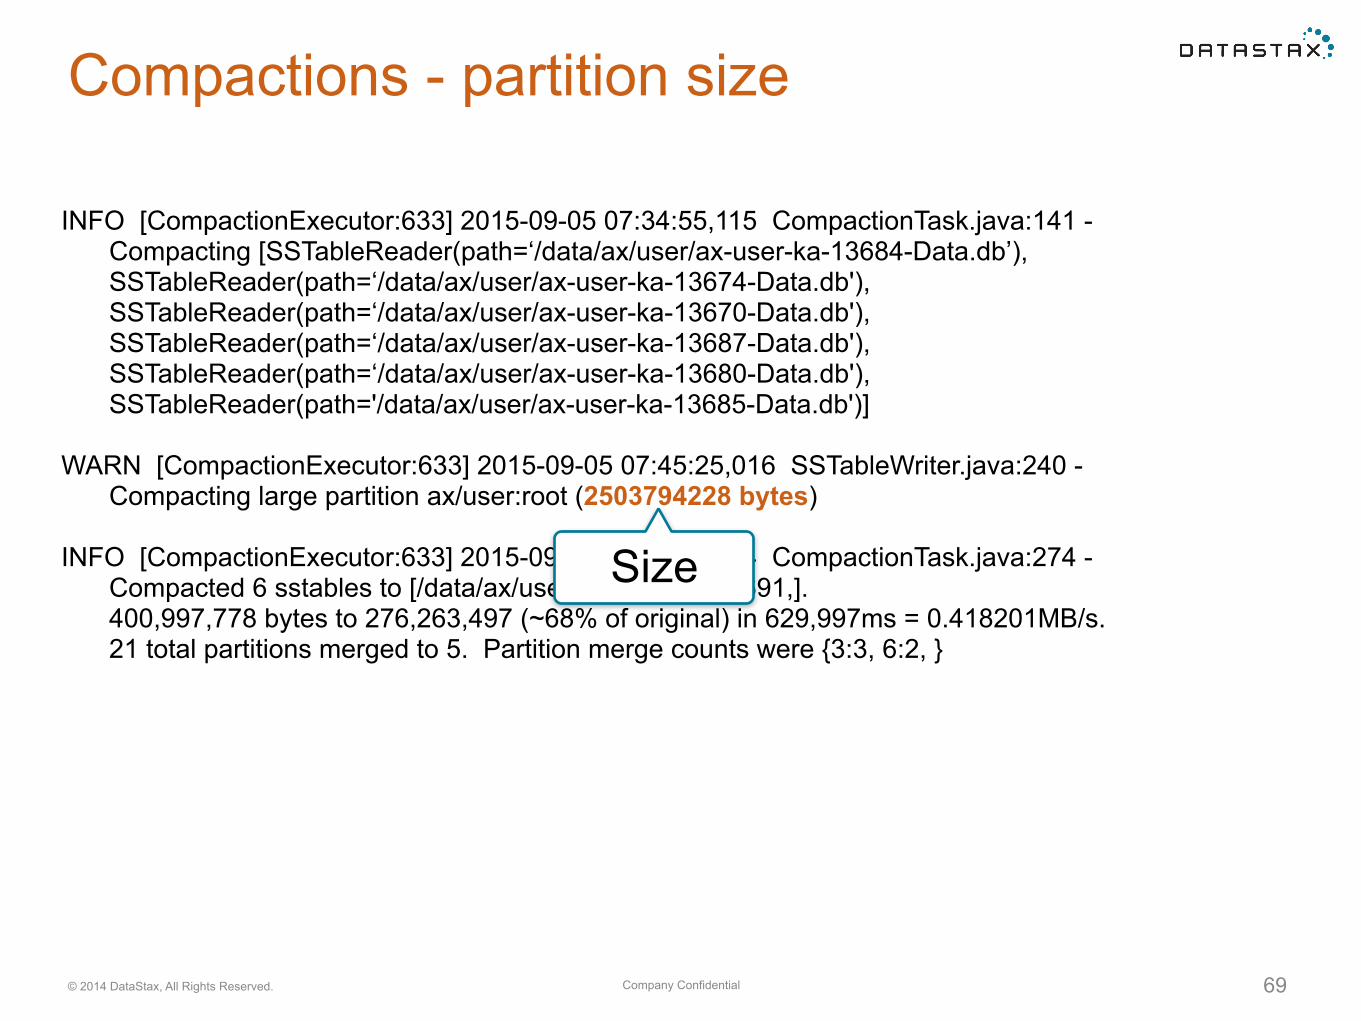
Compactions - partition size
INFO [CompactionExecutor:633] 2015-09-05 07:34:55,115 CompactionTask.java:141 - Compacting [SSTableReader(path=‘/data/ax/user/ax-user-ka-13684-Data.db’), SSTableReader(path=‘/data/ax/user/ax-user-ka-13674-Data.db'), SSTableReader(path=‘/data/ax/user/ax-user-ka-13670-Data.db'), SSTableReader(path=‘/data/ax/user/ax-user-ka-13687-Data.db'), SSTableReader(path=‘/data/ax/user/ax-user-ka-13680-Data.db'), SSTableReader(path='/data/ax/user/ax-user-ka-13685-Data.db')]
WARN [CompactionExecutor:633] 2015-09-05 07:45:25,016 SSTableWriter.java:240 - Compacting large partition ax/user:root (2503794228 bytes)
INFO [CompactionExecutor:633] 2015-09-05 07:45:25,114 CompactionTask.java:274 - Compacted 6 sstables to [/data/ax/user/ax-user-ka-13691,]. 400,997,778 bytes to 276,263,497 (~68% of original) in 629,997ms = 0.418201MB/s. 21 total partitions merged to 5. Partition merge counts were {3:3, 6:2, }
Size
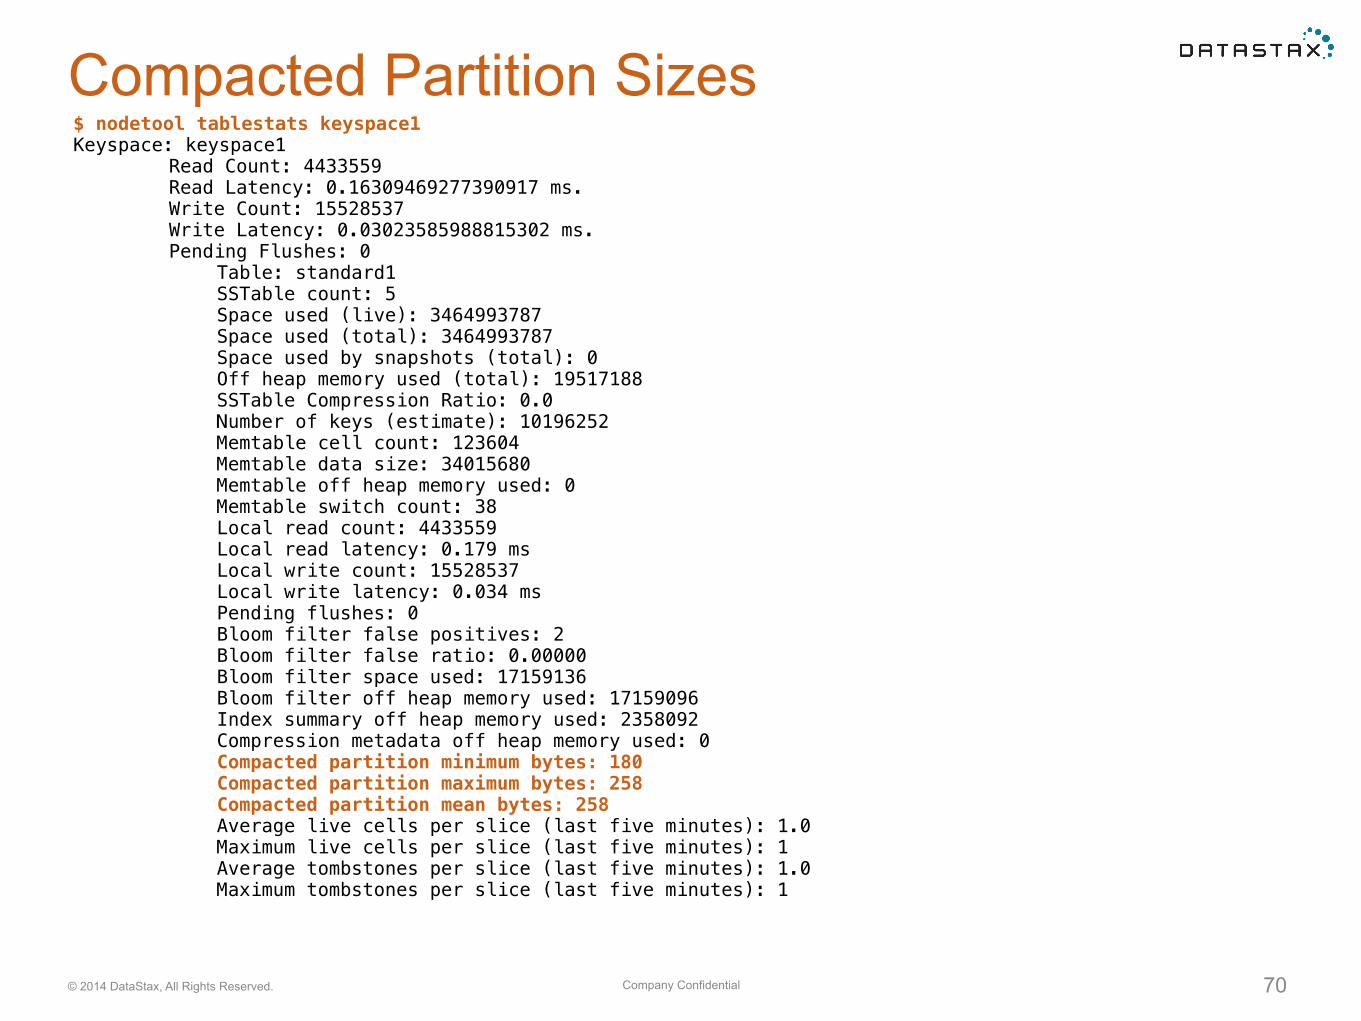
Company Confidential© 2014 DataStax, All Rights Reserved. 70
Compacted Partition Sizes$ nodetool tablestats keyspace1 Keyspace: keyspace1 Read Count: 4433559 Read Latency: 0.16309469277390917 ms. Write Count: 15528537 Write Latency: 0.03023585988815302 ms. Pending Flushes: 0 Table: standard1 SSTable count: 5 Space used (live): 3464993787 Space used (total): 3464993787 Space used by snapshots (total): 0 Off heap memory used (total): 19517188 SSTable Compression Ratio: 0.0 Number of keys (estimate): 10196252 Memtable cell count: 123604 Memtable data size: 34015680 Memtable off heap memory used: 0 Memtable switch count: 38 Local read count: 4433559 Local read latency: 0.179 ms Local write count: 15528537 Local write latency: 0.034 ms Pending flushes: 0 Bloom filter false positives: 2 Bloom filter false ratio: 0.00000 Bloom filter space used: 17159136 Bloom filter off heap memory used: 17159096 Index summary off heap memory used: 2358092 Compression metadata off heap memory used: 0 Compacted partition minimum bytes: 180 Compacted partition maximum bytes: 258 Compacted partition mean bytes: 258 Average live cells per slice (last five minutes): 1.0 Maximum live cells per slice (last five minutes): 1 Average tombstones per slice (last five minutes): 1.0 Maximum tombstones per slice (last five minutes): 1

Network
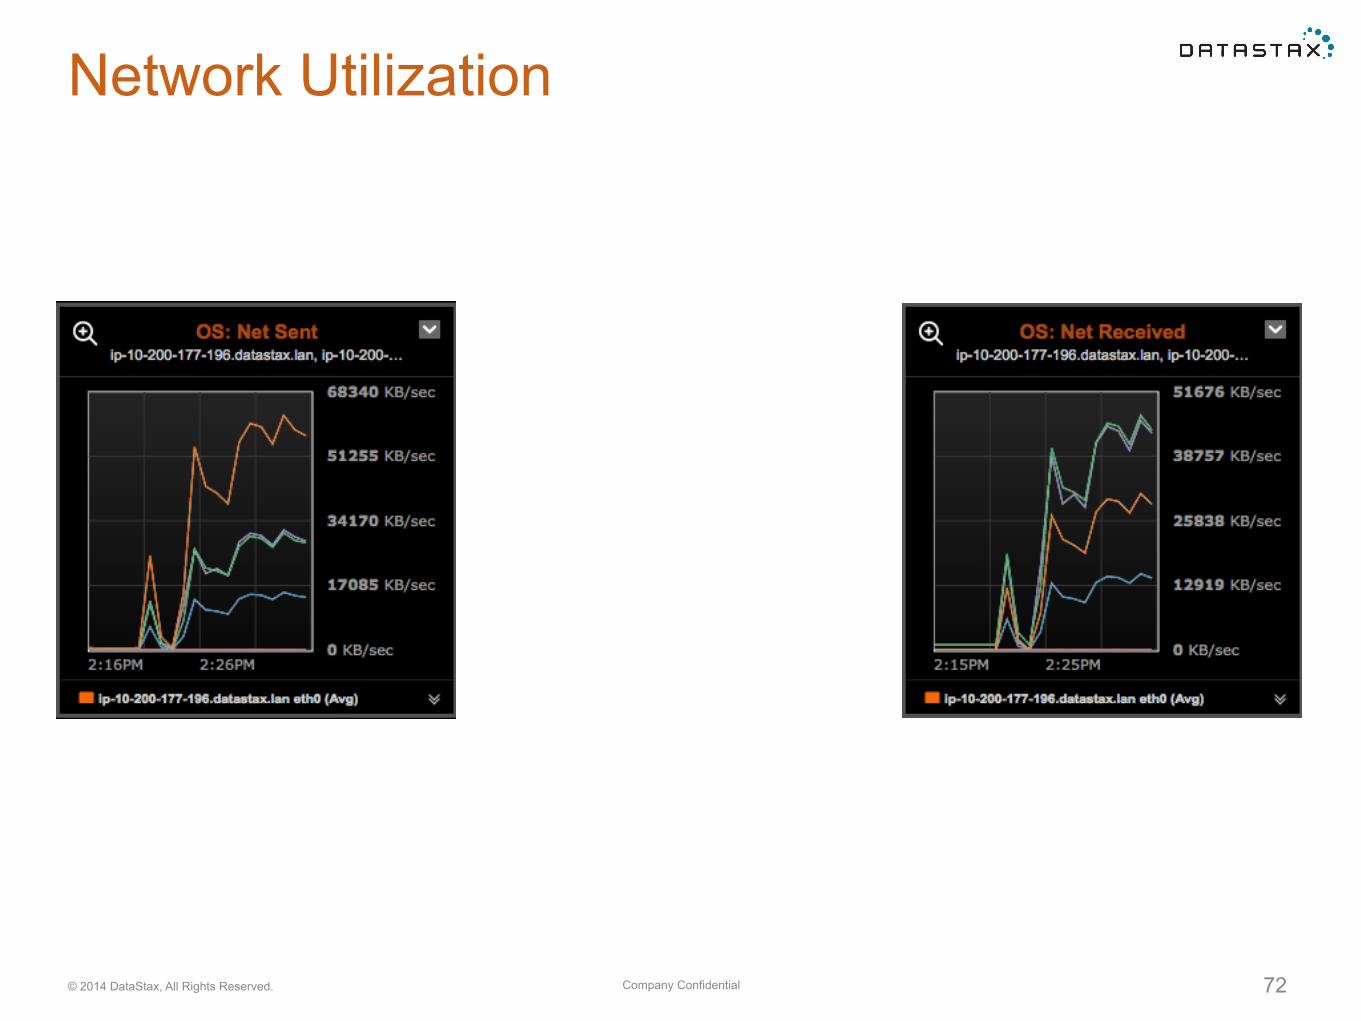
Company Confidential© 2014 DataStax, All Rights Reserved. 72
Network Utilization
Background Processes
Flushing
Company Confidential© 2014 DataStax, All Rights Reserved. 75
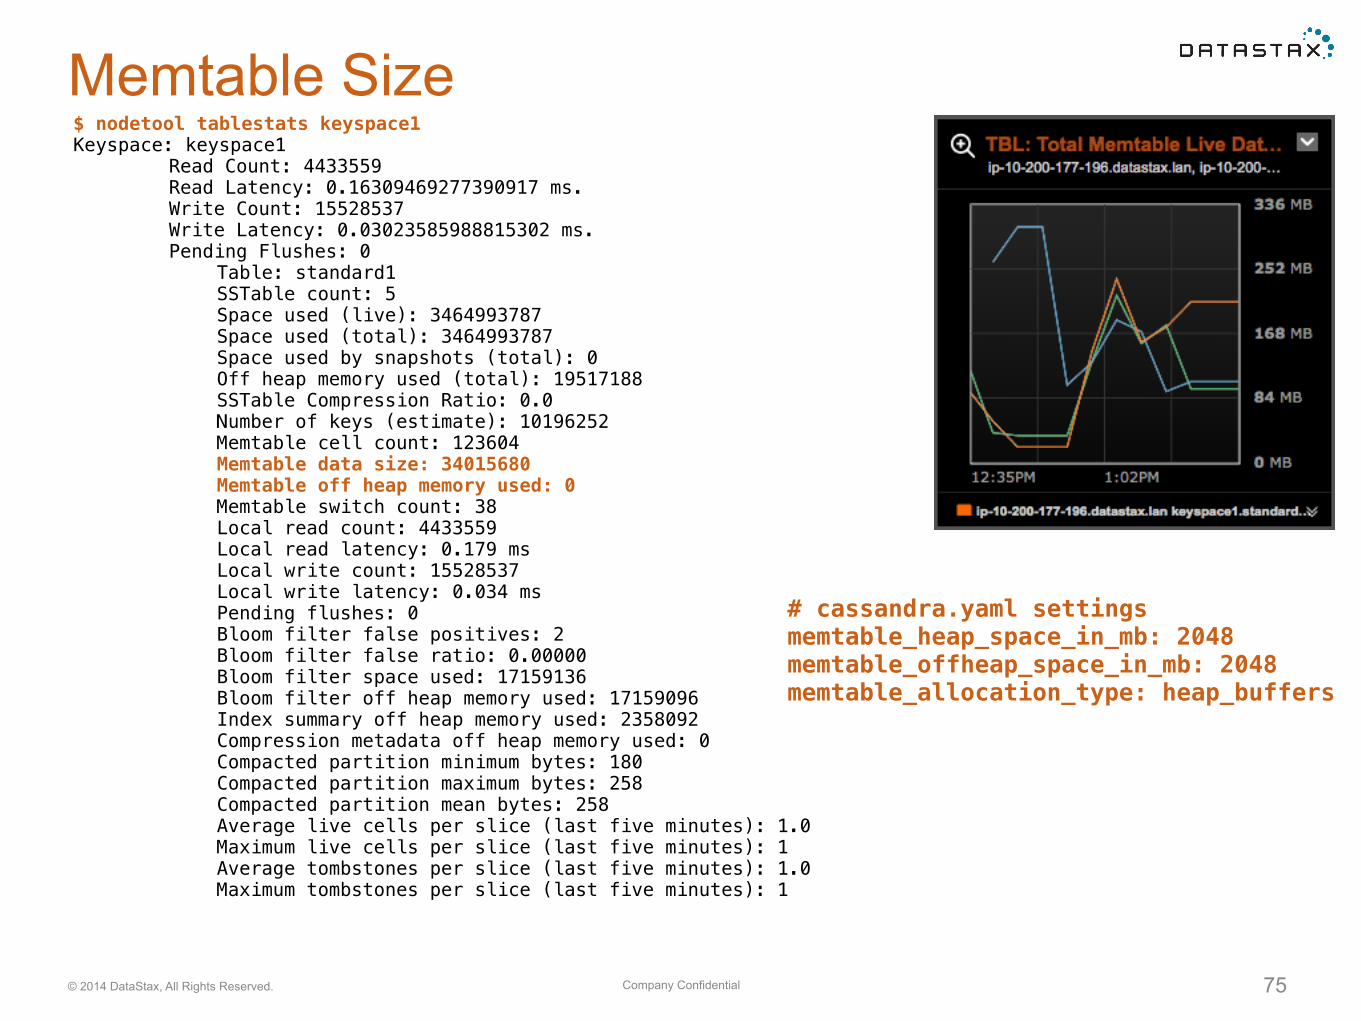
Memtable Size$ nodetool tablestats keyspace1 Keyspace: keyspace1 Read Count: 4433559 Read Latency: 0.16309469277390917 ms. Write Count: 15528537 Write Latency: 0.03023585988815302 ms. Pending Flushes: 0 Table: standard1 SSTable count: 5 Space used (live): 3464993787 Space used (total): 3464993787 Space used by snapshots (total): 0 Off heap memory used (total): 19517188 SSTable Compression Ratio: 0.0 Number of keys (estimate): 10196252 Memtable cell count: 123604 Memtable data size: 34015680 Memtable off heap memory used: 0 Memtable switch count: 38 Local read count: 4433559 Local read latency: 0.179 ms Local write count: 15528537 Local write latency: 0.034 ms Pending flushes: 0 Bloom filter false positives: 2 Bloom filter false ratio: 0.00000 Bloom filter space used: 17159136 Bloom filter off heap memory used: 17159096 Index summary off heap memory used: 2358092 Compression metadata off heap memory used: 0 Compacted partition minimum bytes: 180 Compacted partition maximum bytes: 258 Compacted partition mean bytes: 258 Average live cells per slice (last five minutes): 1.0 Maximum live cells per slice (last five minutes): 1 Average tombstones per slice (last five minutes): 1.0 Maximum tombstones per slice (last five minutes): 1
# cassandra.yaml settings memtable_heap_space_in_mb: 2048 memtable_offheap_space_in_mb: 2048 memtable_allocation_type: heap_buffers
Company Confidential© 2014 DataStax, All Rights Reserved. 76
Enqueueing Flushes
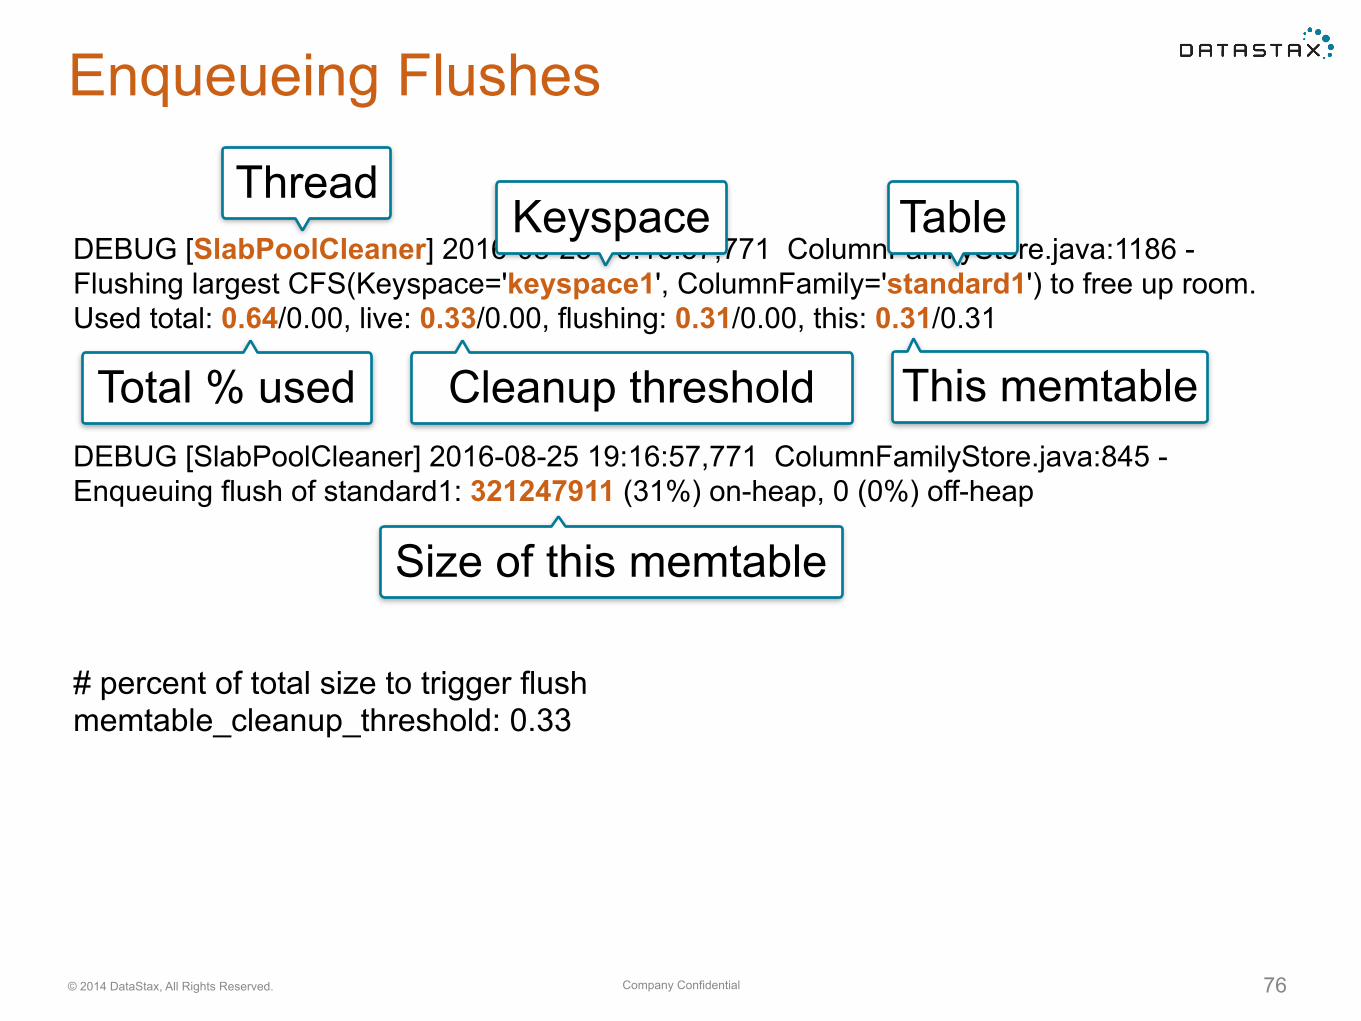
DEBUG [SlabPoolCleaner] 2016-08-25 19:16:57,771 ColumnFamilyStore.java:1186 - Flushing largest CFS(Keyspace='keyspace1', ColumnFamily='standard1') to free up room. Used total: 0.64/0.00, live: 0.33/0.00, flushing: 0.31/0.00, this: 0.31/0.31
DEBUG [SlabPoolCleaner] 2016-08-25 19:16:57,771 ColumnFamilyStore.java:845 - Enqueuing flush of standard1: 321247911 (31%) on-heap, 0 (0%) off-heap
Thread
Total % used This memtable
Keyspace Table
Size of this memtable
Cleanup threshold
# percent of total size to trigger flush memtable_cleanup_threshold: 0.33
Company Confidential© 2014 DataStax, All Rights Reserved. 77
Enqueueing Flushes
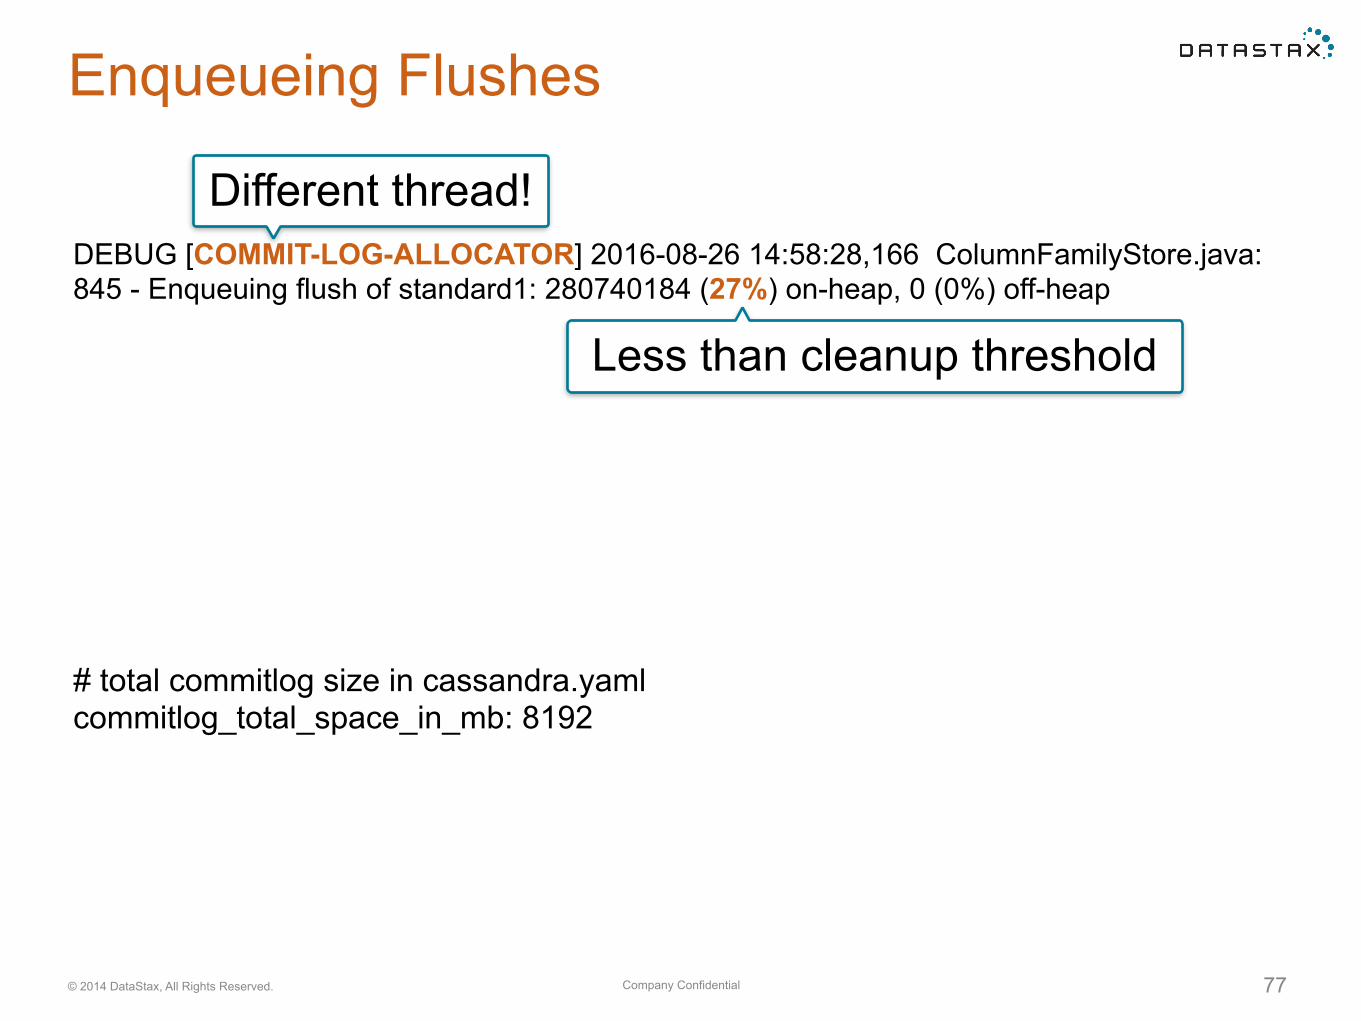
DEBUG [COMMIT-LOG-ALLOCATOR] 2016-08-26 14:58:28,166 ColumnFamilyStore.java:845 - Enqueuing flush of standard1: 280740184 (27%) on-heap, 0 (0%) off-heap
Different thread!
Less than cleanup threshold
# total commitlog size in cassandra.yaml commitlog_total_space_in_mb: 8192
Compaction
Company Confidential© 2014 DataStax, All Rights Reserved. 79
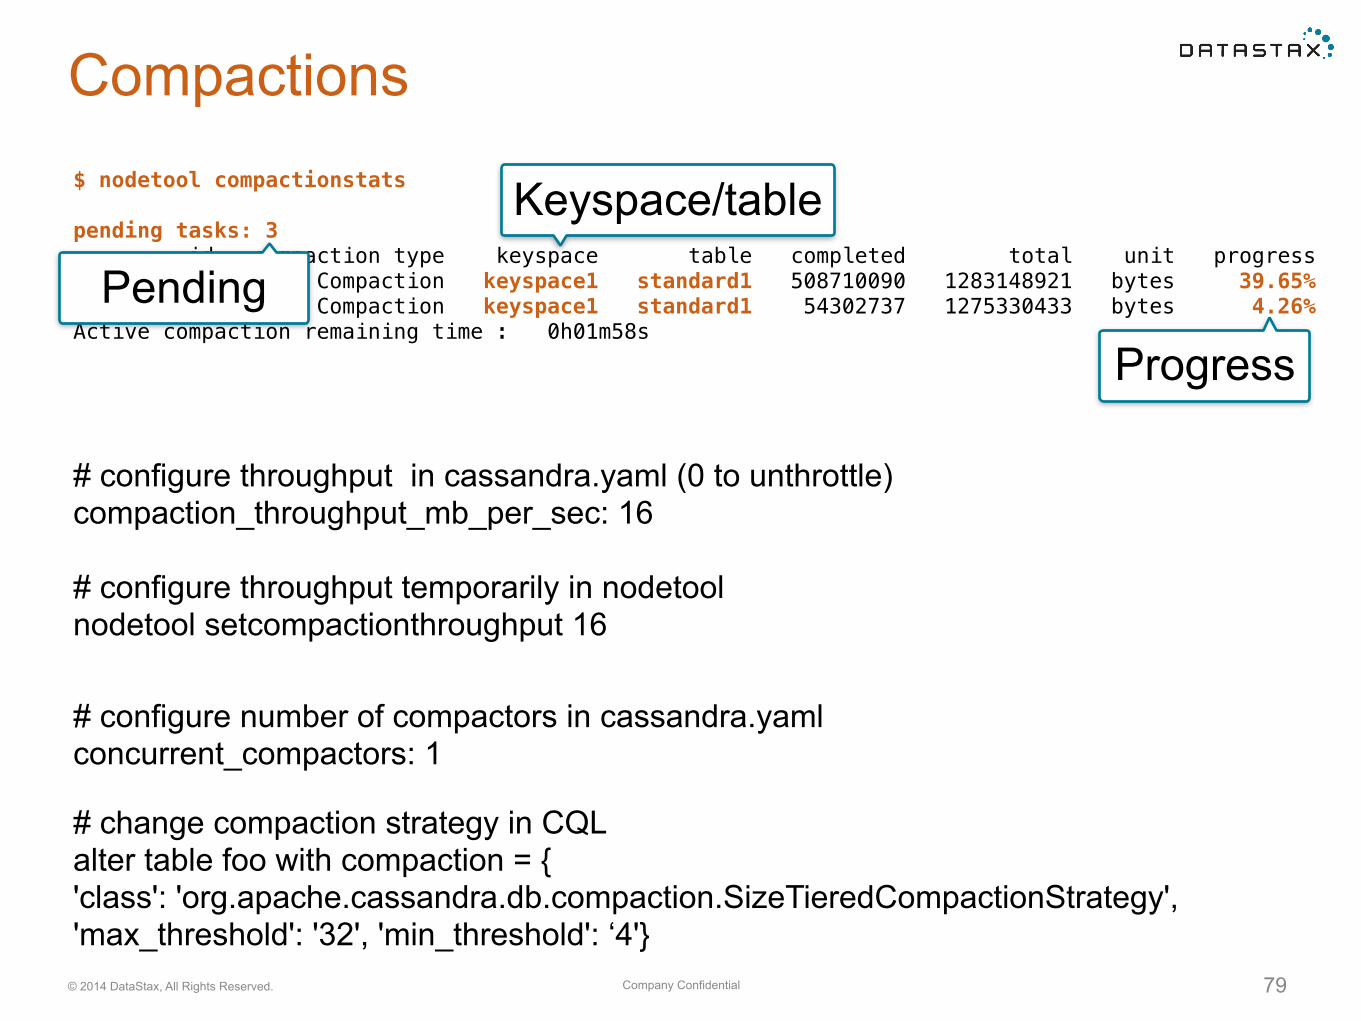
Compactions$ nodetool compactionstats
pending tasks: 3 id compaction type keyspace table completed total unit progress 31d86e00 Compaction keyspace1 standard1 508710090 1283148921 bytes 39.65% 423bd570 Compaction keyspace1 standard1 54302737 1275330433 bytes 4.26% Active compaction remaining time : 0h01m58s
Pending
Keyspace/table
Progress
# configure throughput in cassandra.yaml (0 to unthrottle) compaction_throughput_mb_per_sec: 16
# configure throughput temporarily in nodetool nodetool setcompactionthroughput 16
# configure number of compactors in cassandra.yaml concurrent_compactors: 1
# change compaction strategy in CQL alter table foo with compaction = { 'class': 'org.apache.cassandra.db.compaction.SizeTieredCompactionStrategy', 'max_threshold': '32', 'min_threshold': ‘4'}
Company Confidential© 2014 DataStax, All Rights Reserved. 80
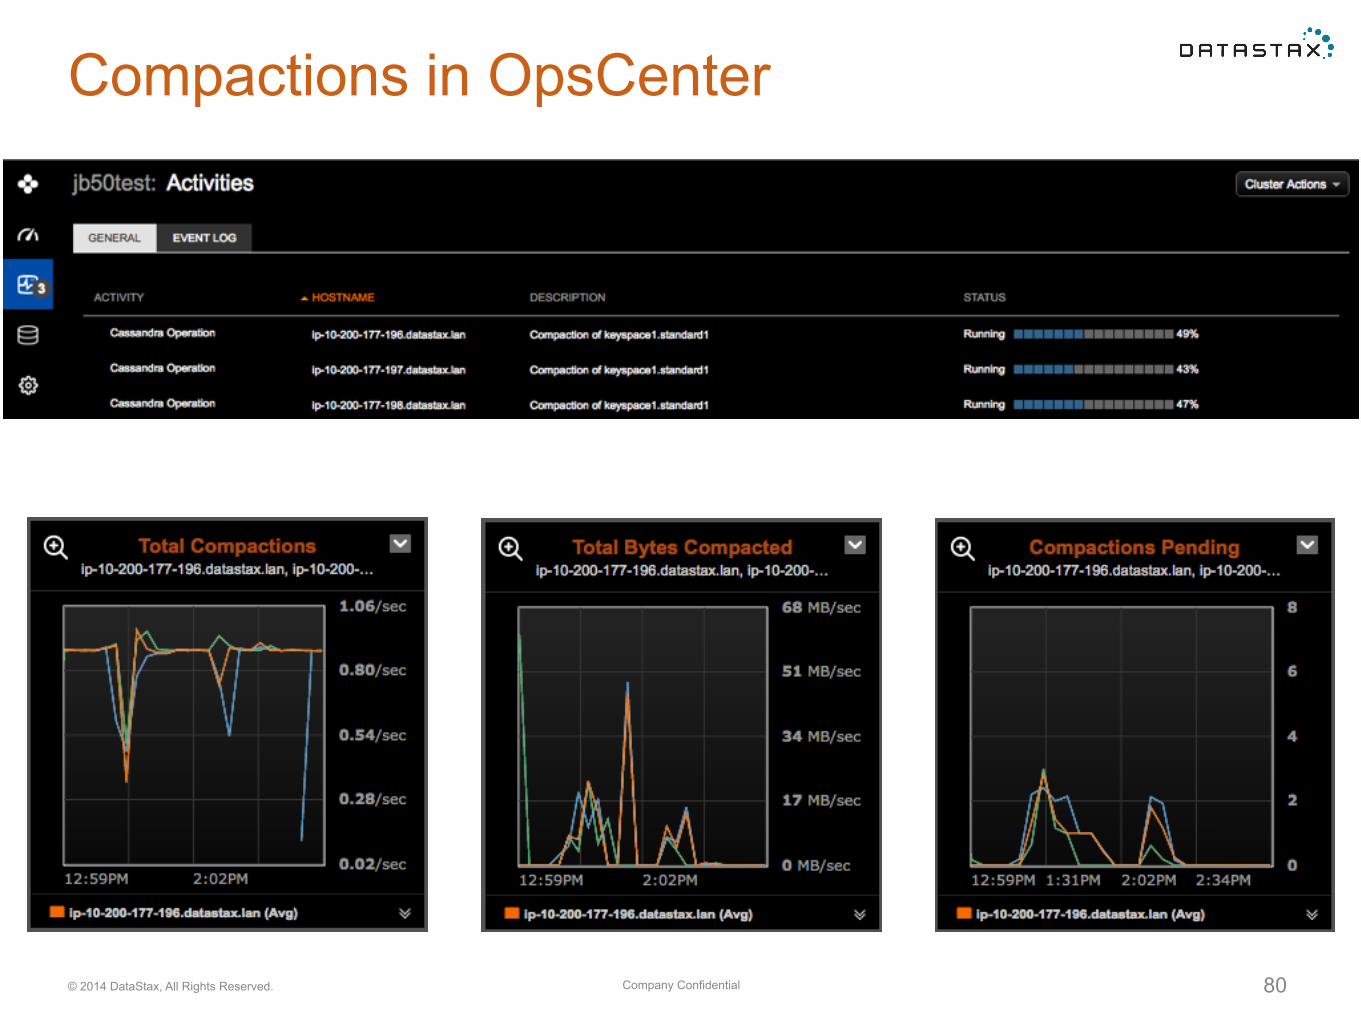
Compactions in OpsCenter$ nodetool compactionstats
pending tasks: 3 id compaction type keyspace table completed total unit progress 31d86e00 Compaction keyspace1 standard1 508710090 1283148921 bytes 39.65% 423bd570 Compaction keyspace1 standard1 54302737 1275330433 bytes 4.26% Active compaction remaining time : 0h01m58s

Garbage Collection
Company Confidential© 2014 DataStax, All Rights Reserved. 82
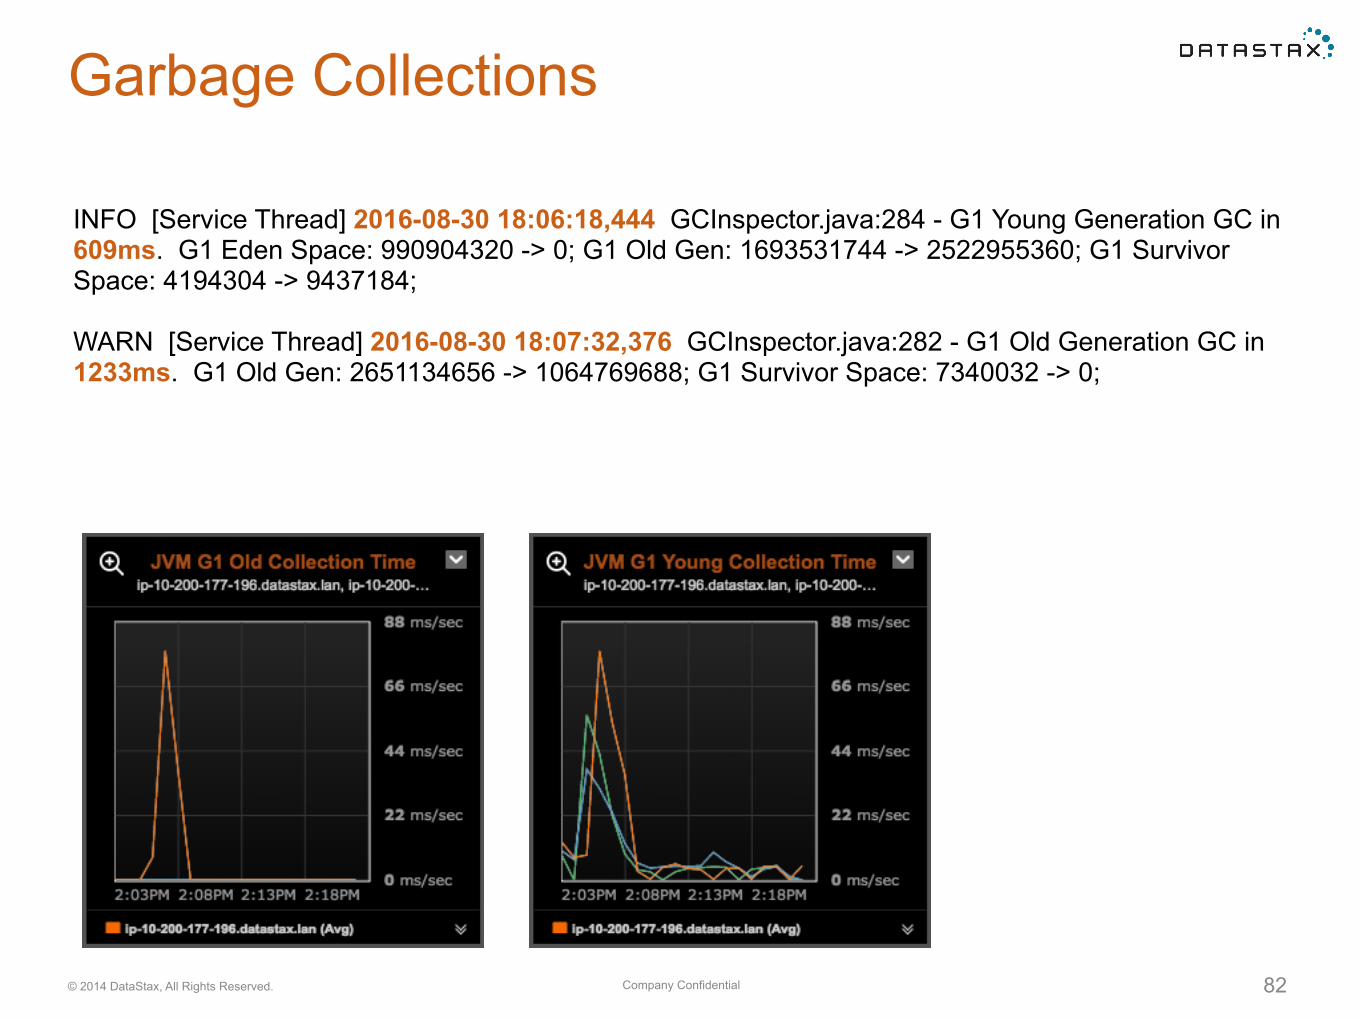
Garbage Collections
INFO [Service Thread] 2016-08-30 18:06:18,444 GCInspector.java:284 - G1 Young Generation GC in 609ms. G1 Eden Space: 990904320 -> 0; G1 Old Gen: 1693531744 -> 2522955360; G1 Survivor Space: 4194304 -> 9437184;
WARN [Service Thread] 2016-08-30 18:07:32,376 GCInspector.java:282 - G1 Old Generation GC in 1233ms. G1 Old Gen: 2651134656 -> 1064769688; G1 Survivor Space: 7340032 -> 0;
Company Confidential© 2014 DataStax, All Rights Reserved. 83
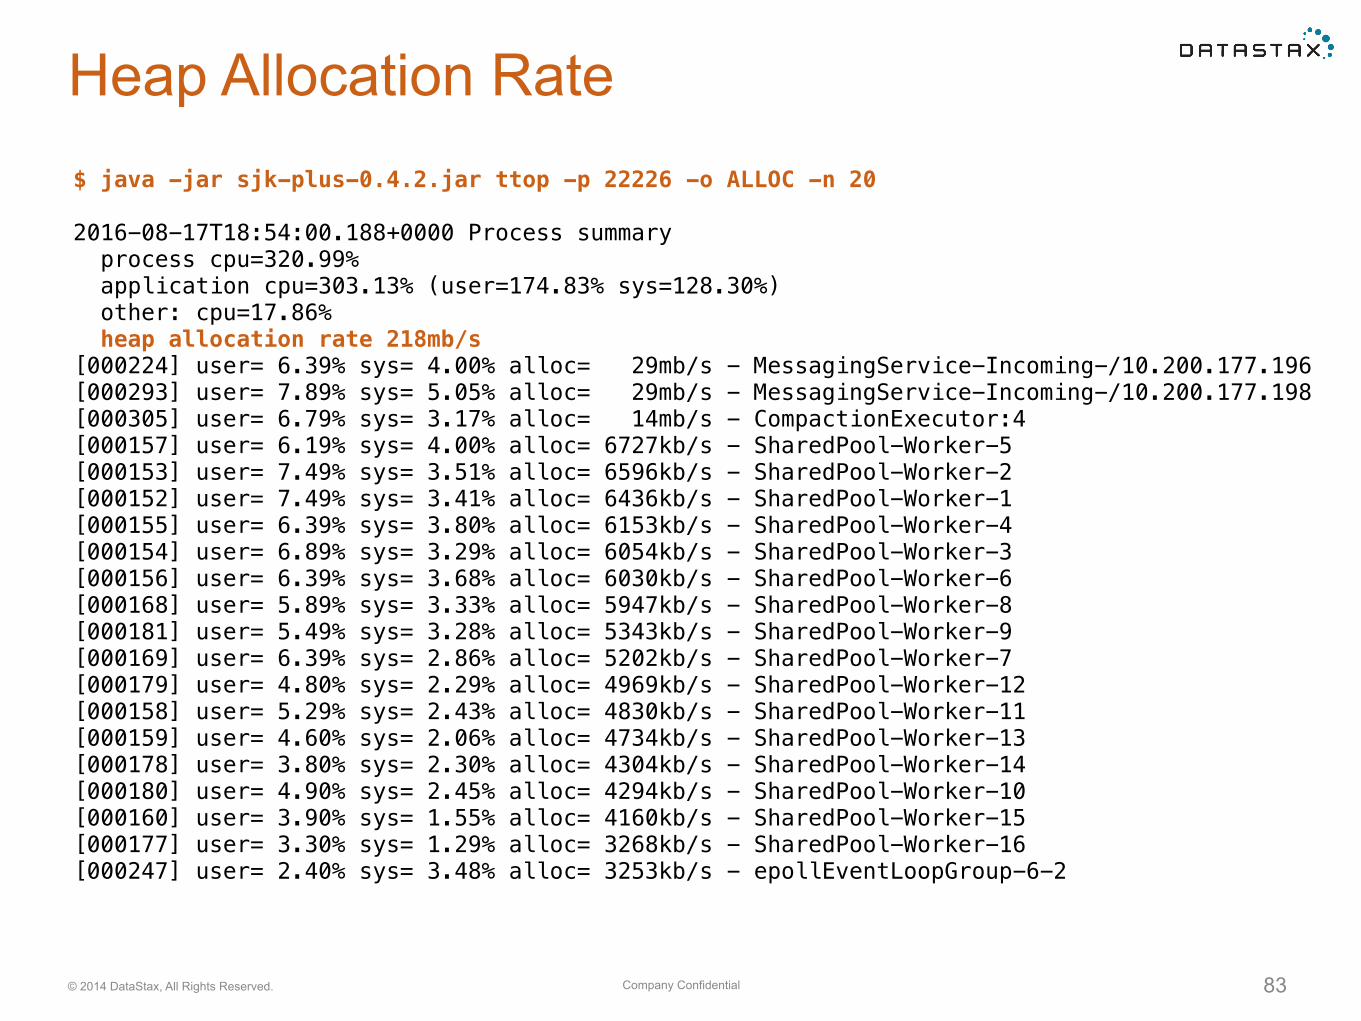
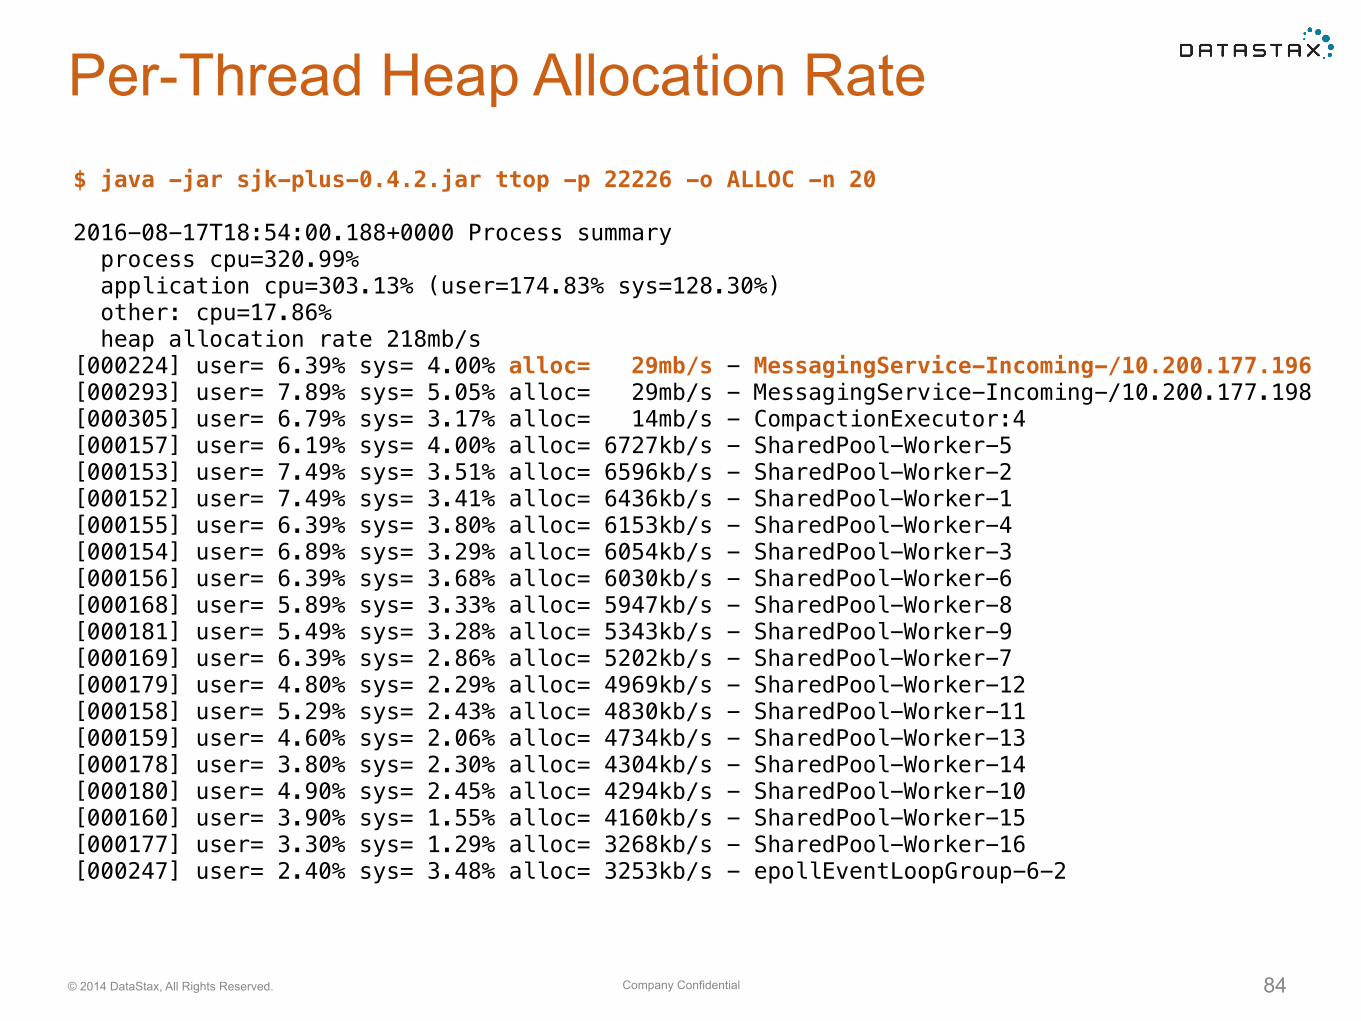
Heap Allocation Rate$ java -jar sjk-plus-0.4.2.jar ttop -p 22226 -o ALLOC -n 20
2016-08-17T18:54:00.188+0000 Process summary process cpu=320.99% application cpu=303.13% (user=174.83% sys=128.30%) other: cpu=17.86% heap allocation rate 218mb/s [000224] user= 6.39% sys= 4.00% alloc= 29mb/s - MessagingService-Incoming-/10.200.177.196 [000293] user= 7.89% sys= 5.05% alloc= 29mb/s - MessagingService-Incoming-/10.200.177.198 [000305] user= 6.79% sys= 3.17% alloc= 14mb/s - CompactionExecutor:4 [000157] user= 6.19% sys= 4.00% alloc= 6727kb/s - SharedPool-Worker-5 [000153] user= 7.49% sys= 3.51% alloc= 6596kb/s - SharedPool-Worker-2 [000152] user= 7.49% sys= 3.41% alloc= 6436kb/s - SharedPool-Worker-1 [000155] user= 6.39% sys= 3.80% alloc= 6153kb/s - SharedPool-Worker-4 [000154] user= 6.89% sys= 3.29% alloc= 6054kb/s - SharedPool-Worker-3 [000156] user= 6.39% sys= 3.68% alloc= 6030kb/s - SharedPool-Worker-6 [000168] user= 5.89% sys= 3.33% alloc= 5947kb/s - SharedPool-Worker-8 [000181] user= 5.49% sys= 3.28% alloc= 5343kb/s - SharedPool-Worker-9 [000169] user= 6.39% sys= 2.86% alloc= 5202kb/s - SharedPool-Worker-7 [000179] user= 4.80% sys= 2.29% alloc= 4969kb/s - SharedPool-Worker-12 [000158] user= 5.29% sys= 2.43% alloc= 4830kb/s - SharedPool-Worker-11 [000159] user= 4.60% sys= 2.06% alloc= 4734kb/s - SharedPool-Worker-13 [000178] user= 3.80% sys= 2.30% alloc= 4304kb/s - SharedPool-Worker-14 [000180] user= 4.90% sys= 2.45% alloc= 4294kb/s - SharedPool-Worker-10 [000160] user= 3.90% sys= 1.55% alloc= 4160kb/s - SharedPool-Worker-15 [000177] user= 3.30% sys= 1.29% alloc= 3268kb/s - SharedPool-Worker-16 [000247] user= 2.40% sys= 3.48% alloc= 3253kb/s - epollEventLoopGroup-6-2
Company Confidential© 2014 DataStax, All Rights Reserved. 84
Per-Thread Heap Allocation Rate$ java -jar sjk-plus-0.4.2.jar ttop -p 22226 -o ALLOC -n 20
2016-08-17T18:54:00.188+0000 Process summary process cpu=320.99% application cpu=303.13% (user=174.83% sys=128.30%) other: cpu=17.86% heap allocation rate 218mb/s [000224] user= 6.39% sys= 4.00% alloc= 29mb/s - MessagingService-Incoming-/10.200.177.196 [000293] user= 7.89% sys= 5.05% alloc= 29mb/s - MessagingService-Incoming-/10.200.177.198 [000305] user= 6.79% sys= 3.17% alloc= 14mb/s - CompactionExecutor:4 [000157] user= 6.19% sys= 4.00% alloc= 6727kb/s - SharedPool-Worker-5 [000153] user= 7.49% sys= 3.51% alloc= 6596kb/s - SharedPool-Worker-2 [000152] user= 7.49% sys= 3.41% alloc= 6436kb/s - SharedPool-Worker-1 [000155] user= 6.39% sys= 3.80% alloc= 6153kb/s - SharedPool-Worker-4 [000154] user= 6.89% sys= 3.29% alloc= 6054kb/s - SharedPool-Worker-3 [000156] user= 6.39% sys= 3.68% alloc= 6030kb/s - SharedPool-Worker-6 [000168] user= 5.89% sys= 3.33% alloc= 5947kb/s - SharedPool-Worker-8 [000181] user= 5.49% sys= 3.28% alloc= 5343kb/s - SharedPool-Worker-9 [000169] user= 6.39% sys= 2.86% alloc= 5202kb/s - SharedPool-Worker-7 [000179] user= 4.80% sys= 2.29% alloc= 4969kb/s - SharedPool-Worker-12 [000158] user= 5.29% sys= 2.43% alloc= 4830kb/s - SharedPool-Worker-11 [000159] user= 4.60% sys= 2.06% alloc= 4734kb/s - SharedPool-Worker-13 [000178] user= 3.80% sys= 2.30% alloc= 4304kb/s - SharedPool-Worker-14 [000180] user= 4.90% sys= 2.45% alloc= 4294kb/s - SharedPool-Worker-10 [000160] user= 3.90% sys= 1.55% alloc= 4160kb/s - SharedPool-Worker-15 [000177] user= 3.30% sys= 1.29% alloc= 3268kb/s - SharedPool-Worker-16 [000247] user= 2.40% sys= 3.48% alloc= 3253kb/s - epollEventLoopGroup-6-2

Repairs & Streaming
Company Confidential© 2014 DataStax, All Rights Reserved. 86
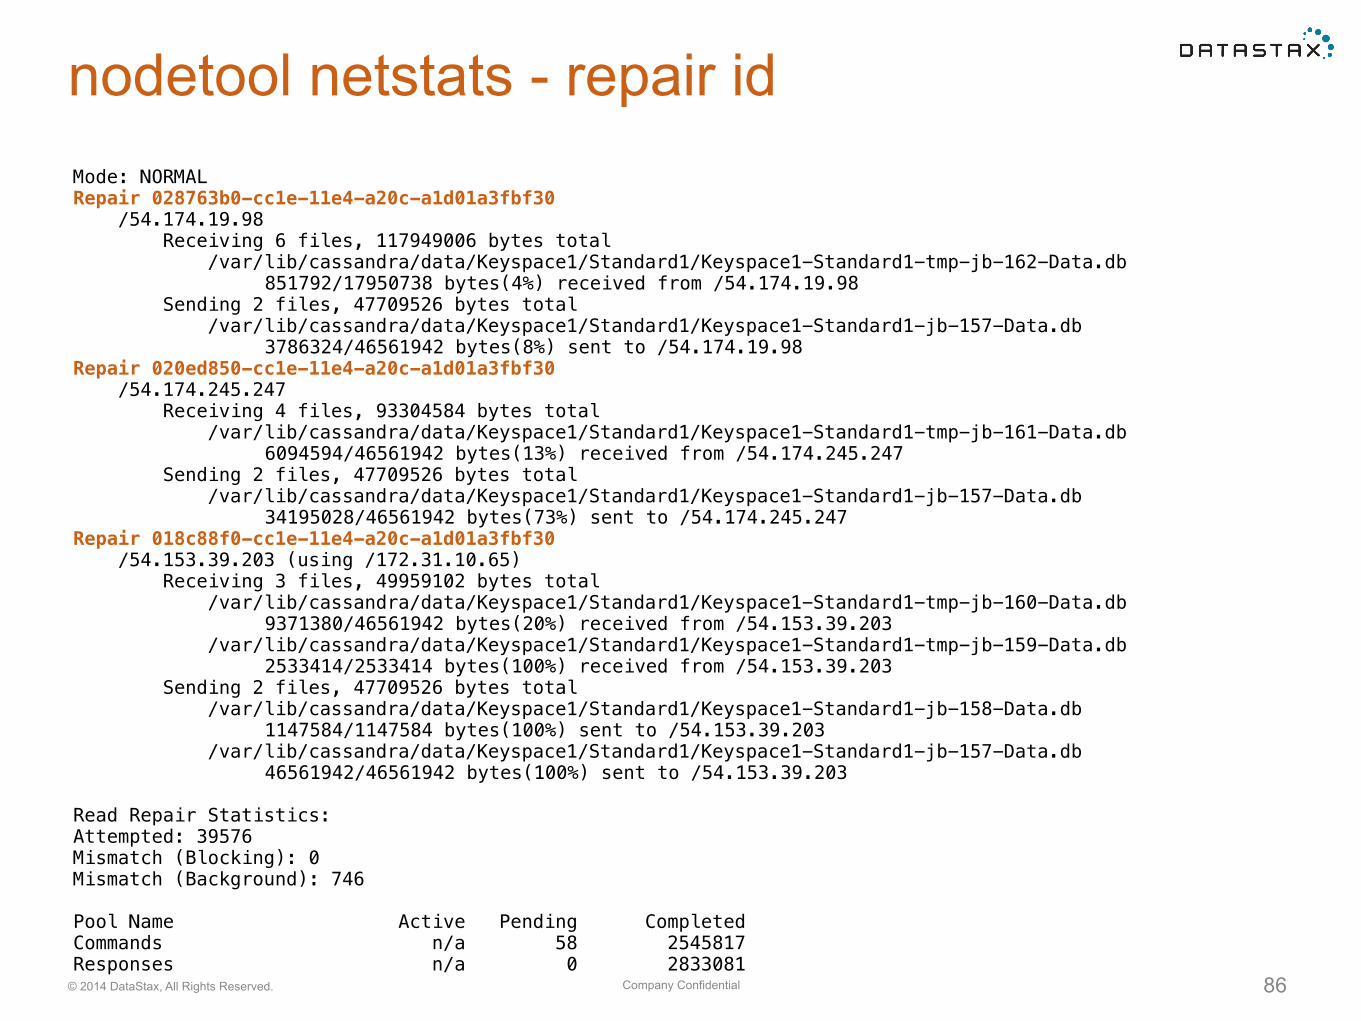
nodetool netstats - repair idMode: NORMAL Repair 028763b0-cc1e-11e4-a20c-a1d01a3fbf30 /54.174.19.98 Receiving 6 files, 117949006 bytes total /var/lib/cassandra/data/Keyspace1/Standard1/Keyspace1-Standard1-tmp-jb-162-Data.db
851792/17950738 bytes(4%) received from /54.174.19.98 Sending 2 files, 47709526 bytes total /var/lib/cassandra/data/Keyspace1/Standard1/Keyspace1-Standard1-jb-157-Data.db
3786324/46561942 bytes(8%) sent to /54.174.19.98 Repair 020ed850-cc1e-11e4-a20c-a1d01a3fbf30 /54.174.245.247 Receiving 4 files, 93304584 bytes total /var/lib/cassandra/data/Keyspace1/Standard1/Keyspace1-Standard1-tmp-jb-161-Data.db
6094594/46561942 bytes(13%) received from /54.174.245.247 Sending 2 files, 47709526 bytes total /var/lib/cassandra/data/Keyspace1/Standard1/Keyspace1-Standard1-jb-157-Data.db
34195028/46561942 bytes(73%) sent to /54.174.245.247 Repair 018c88f0-cc1e-11e4-a20c-a1d01a3fbf30 /54.153.39.203 (using /172.31.10.65) Receiving 3 files, 49959102 bytes total /var/lib/cassandra/data/Keyspace1/Standard1/Keyspace1-Standard1-tmp-jb-160-Data.db
9371380/46561942 bytes(20%) received from /54.153.39.203 /var/lib/cassandra/data/Keyspace1/Standard1/Keyspace1-Standard1-tmp-jb-159-Data.db
2533414/2533414 bytes(100%) received from /54.153.39.203 Sending 2 files, 47709526 bytes total /var/lib/cassandra/data/Keyspace1/Standard1/Keyspace1-Standard1-jb-158-Data.db
1147584/1147584 bytes(100%) sent to /54.153.39.203 /var/lib/cassandra/data/Keyspace1/Standard1/Keyspace1-Standard1-jb-157-Data.db
46561942/46561942 bytes(100%) sent to /54.153.39.203
Read Repair Statistics: Attempted: 39576 Mismatch (Blocking): 0 Mismatch (Background): 746
Pool Name Active Pending Completed Commands n/a 58 2545817 Responses n/a 0 2833081
Company Confidential© 2014 DataStax, All Rights Reserved. 87
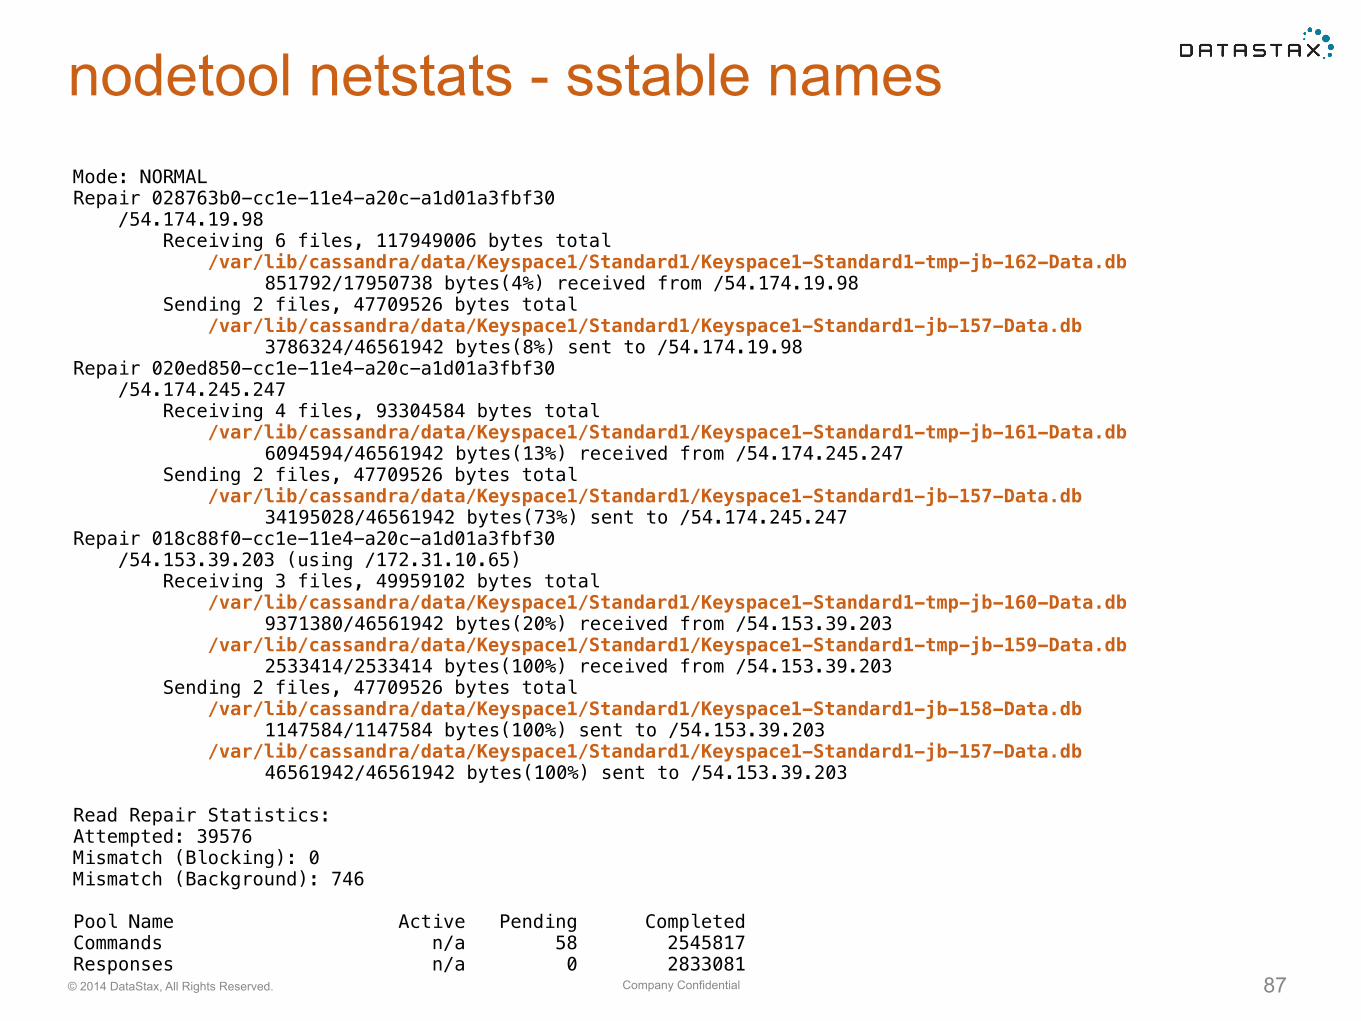
nodetool netstats - sstable namesMode: NORMAL Repair 028763b0-cc1e-11e4-a20c-a1d01a3fbf30 /54.174.19.98 Receiving 6 files, 117949006 bytes total /var/lib/cassandra/data/Keyspace1/Standard1/Keyspace1-Standard1-tmp-jb-162-Data.db
851792/17950738 bytes(4%) received from /54.174.19.98 Sending 2 files, 47709526 bytes total /var/lib/cassandra/data/Keyspace1/Standard1/Keyspace1-Standard1-jb-157-Data.db
3786324/46561942 bytes(8%) sent to /54.174.19.98 Repair 020ed850-cc1e-11e4-a20c-a1d01a3fbf30 /54.174.245.247 Receiving 4 files, 93304584 bytes total /var/lib/cassandra/data/Keyspace1/Standard1/Keyspace1-Standard1-tmp-jb-161-Data.db
6094594/46561942 bytes(13%) received from /54.174.245.247 Sending 2 files, 47709526 bytes total /var/lib/cassandra/data/Keyspace1/Standard1/Keyspace1-Standard1-jb-157-Data.db
34195028/46561942 bytes(73%) sent to /54.174.245.247 Repair 018c88f0-cc1e-11e4-a20c-a1d01a3fbf30 /54.153.39.203 (using /172.31.10.65) Receiving 3 files, 49959102 bytes total /var/lib/cassandra/data/Keyspace1/Standard1/Keyspace1-Standard1-tmp-jb-160-Data.db
9371380/46561942 bytes(20%) received from /54.153.39.203 /var/lib/cassandra/data/Keyspace1/Standard1/Keyspace1-Standard1-tmp-jb-159-Data.db
2533414/2533414 bytes(100%) received from /54.153.39.203 Sending 2 files, 47709526 bytes total /var/lib/cassandra/data/Keyspace1/Standard1/Keyspace1-Standard1-jb-158-Data.db
1147584/1147584 bytes(100%) sent to /54.153.39.203 /var/lib/cassandra/data/Keyspace1/Standard1/Keyspace1-Standard1-jb-157-Data.db
46561942/46561942 bytes(100%) sent to /54.153.39.203
Read Repair Statistics: Attempted: 39576 Mismatch (Blocking): 0 Mismatch (Background): 746
Pool Name Active Pending Completed Commands n/a 58 2545817 Responses n/a 0 2833081
Company Confidential© 2014 DataStax, All Rights Reserved. 88
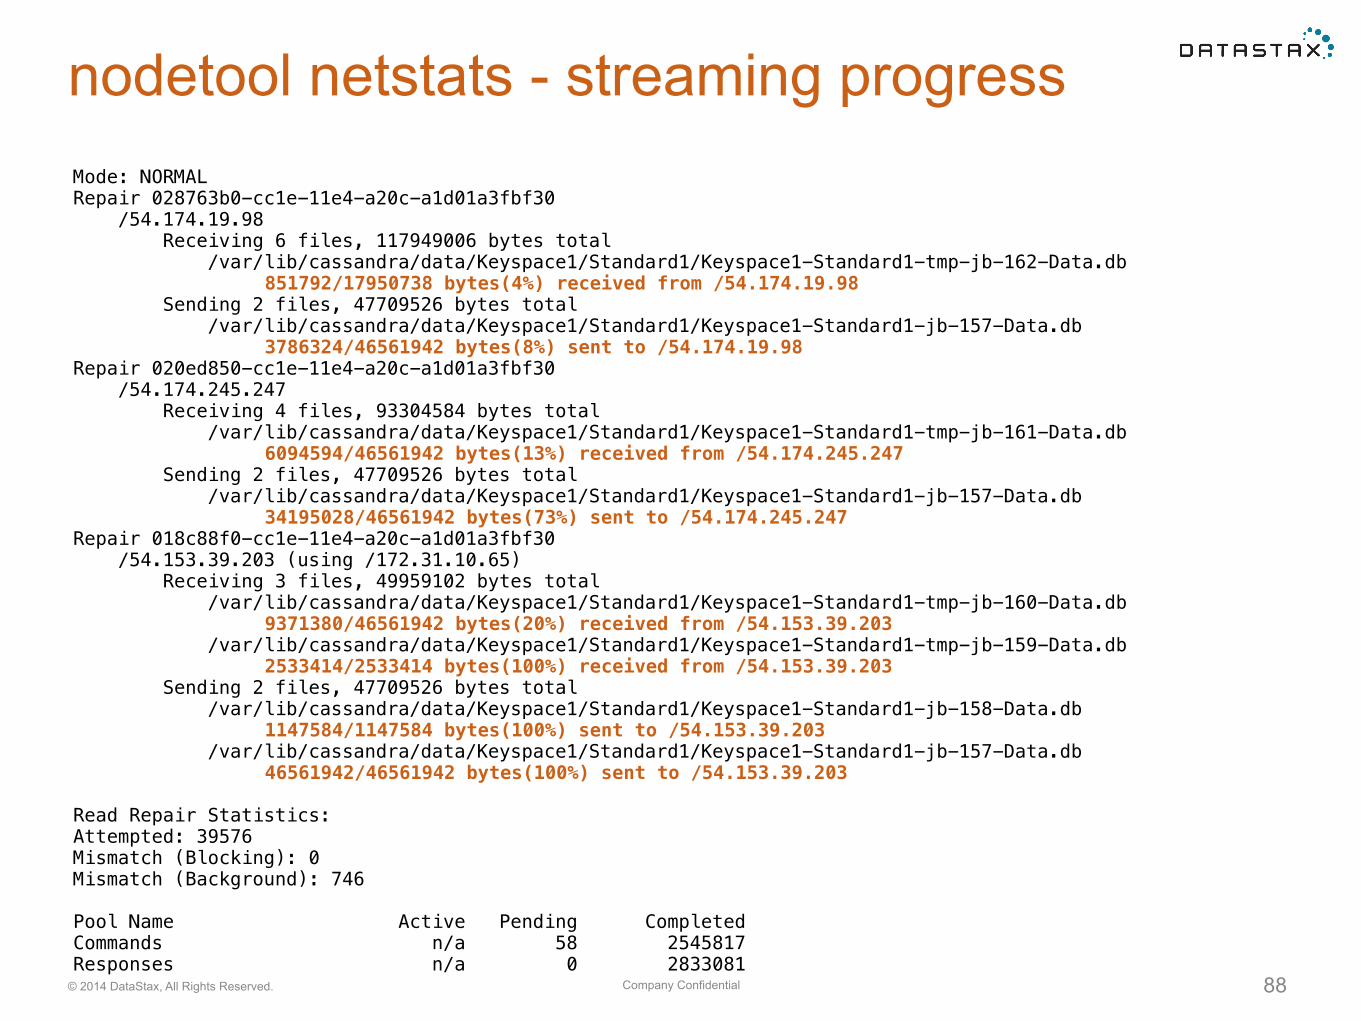
nodetool netstats - streaming progressMode: NORMAL Repair 028763b0-cc1e-11e4-a20c-a1d01a3fbf30 /54.174.19.98 Receiving 6 files, 117949006 bytes total /var/lib/cassandra/data/Keyspace1/Standard1/Keyspace1-Standard1-tmp-jb-162-Data.db
851792/17950738 bytes(4%) received from /54.174.19.98 Sending 2 files, 47709526 bytes total /var/lib/cassandra/data/Keyspace1/Standard1/Keyspace1-Standard1-jb-157-Data.db
3786324/46561942 bytes(8%) sent to /54.174.19.98 Repair 020ed850-cc1e-11e4-a20c-a1d01a3fbf30 /54.174.245.247 Receiving 4 files, 93304584 bytes total /var/lib/cassandra/data/Keyspace1/Standard1/Keyspace1-Standard1-tmp-jb-161-Data.db
6094594/46561942 bytes(13%) received from /54.174.245.247 Sending 2 files, 47709526 bytes total /var/lib/cassandra/data/Keyspace1/Standard1/Keyspace1-Standard1-jb-157-Data.db
34195028/46561942 bytes(73%) sent to /54.174.245.247 Repair 018c88f0-cc1e-11e4-a20c-a1d01a3fbf30 /54.153.39.203 (using /172.31.10.65) Receiving 3 files, 49959102 bytes total /var/lib/cassandra/data/Keyspace1/Standard1/Keyspace1-Standard1-tmp-jb-160-Data.db
9371380/46561942 bytes(20%) received from /54.153.39.203 /var/lib/cassandra/data/Keyspace1/Standard1/Keyspace1-Standard1-tmp-jb-159-Data.db
2533414/2533414 bytes(100%) received from /54.153.39.203 Sending 2 files, 47709526 bytes total /var/lib/cassandra/data/Keyspace1/Standard1/Keyspace1-Standard1-jb-158-Data.db
1147584/1147584 bytes(100%) sent to /54.153.39.203 /var/lib/cassandra/data/Keyspace1/Standard1/Keyspace1-Standard1-jb-157-Data.db
46561942/46561942 bytes(100%) sent to /54.153.39.203
Read Repair Statistics: Attempted: 39576 Mismatch (Blocking): 0 Mismatch (Background): 746
Pool Name Active Pending Completed Commands n/a 58 2545817 Responses n/a 0 2833081
Company Confidential© 2014 DataStax, All Rights Reserved. 89
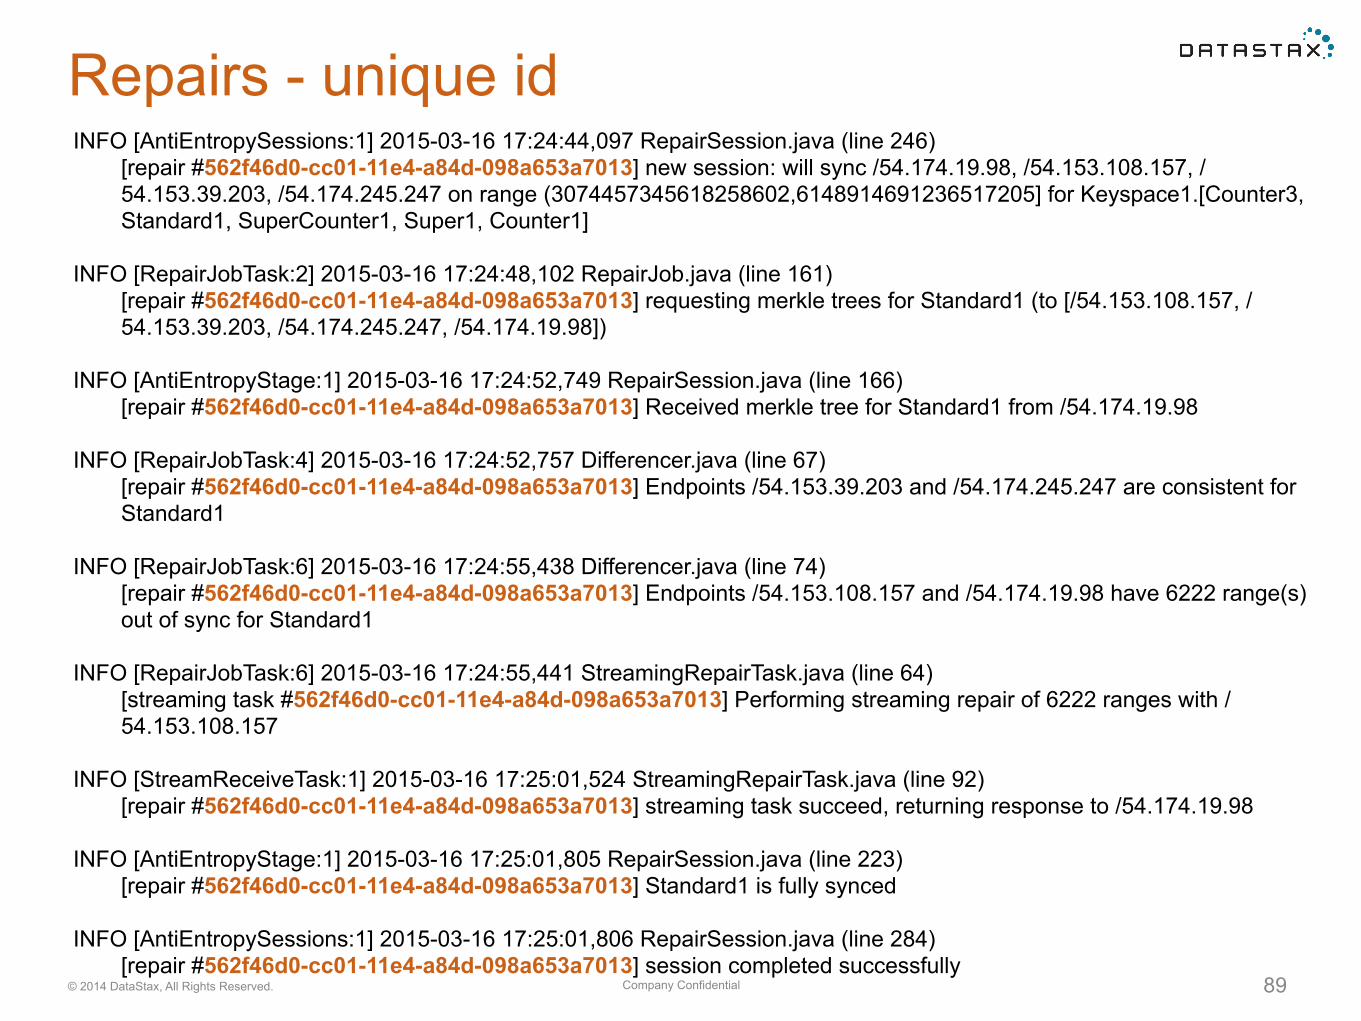
Repairs - unique idINFO [AntiEntropySessions:1] 2015-03-16 17:24:44,097 RepairSession.java (line 246)
[repair #562f46d0-cc01-11e4-a84d-098a653a7013] new session: will sync /54.174.19.98, /54.153.108.157, /54.153.39.203, /54.174.245.247 on range (3074457345618258602,6148914691236517205] for Keyspace1.[Counter3, Standard1, SuperCounter1, Super1, Counter1]
INFO [RepairJobTask:2] 2015-03-16 17:24:48,102 RepairJob.java (line 161) [repair #562f46d0-cc01-11e4-a84d-098a653a7013] requesting merkle trees for Standard1 (to [/54.153.108.157, /54.153.39.203, /54.174.245.247, /54.174.19.98])
INFO [AntiEntropyStage:1] 2015-03-16 17:24:52,749 RepairSession.java (line 166) [repair #562f46d0-cc01-11e4-a84d-098a653a7013] Received merkle tree for Standard1 from /54.174.19.98
INFO [RepairJobTask:4] 2015-03-16 17:24:52,757 Differencer.java (line 67) [repair #562f46d0-cc01-11e4-a84d-098a653a7013] Endpoints /54.153.39.203 and /54.174.245.247 are consistent for Standard1
INFO [RepairJobTask:6] 2015-03-16 17:24:55,438 Differencer.java (line 74) [repair #562f46d0-cc01-11e4-a84d-098a653a7013] Endpoints /54.153.108.157 and /54.174.19.98 have 6222 range(s) out of sync for Standard1
INFO [RepairJobTask:6] 2015-03-16 17:24:55,441 StreamingRepairTask.java (line 64) [streaming task #562f46d0-cc01-11e4-a84d-098a653a7013] Performing streaming repair of 6222 ranges with /54.153.108.157
INFO [StreamReceiveTask:1] 2015-03-16 17:25:01,524 StreamingRepairTask.java (line 92) [repair #562f46d0-cc01-11e4-a84d-098a653a7013] streaming task succeed, returning response to /54.174.19.98
INFO [AntiEntropyStage:1] 2015-03-16 17:25:01,805 RepairSession.java (line 223) [repair #562f46d0-cc01-11e4-a84d-098a653a7013] Standard1 is fully synced
INFO [AntiEntropySessions:1] 2015-03-16 17:25:01,806 RepairSession.java (line 284) [repair #562f46d0-cc01-11e4-a84d-098a653a7013] session completed successfully
Company Confidential© 2014 DataStax, All Rights Reserved. 90
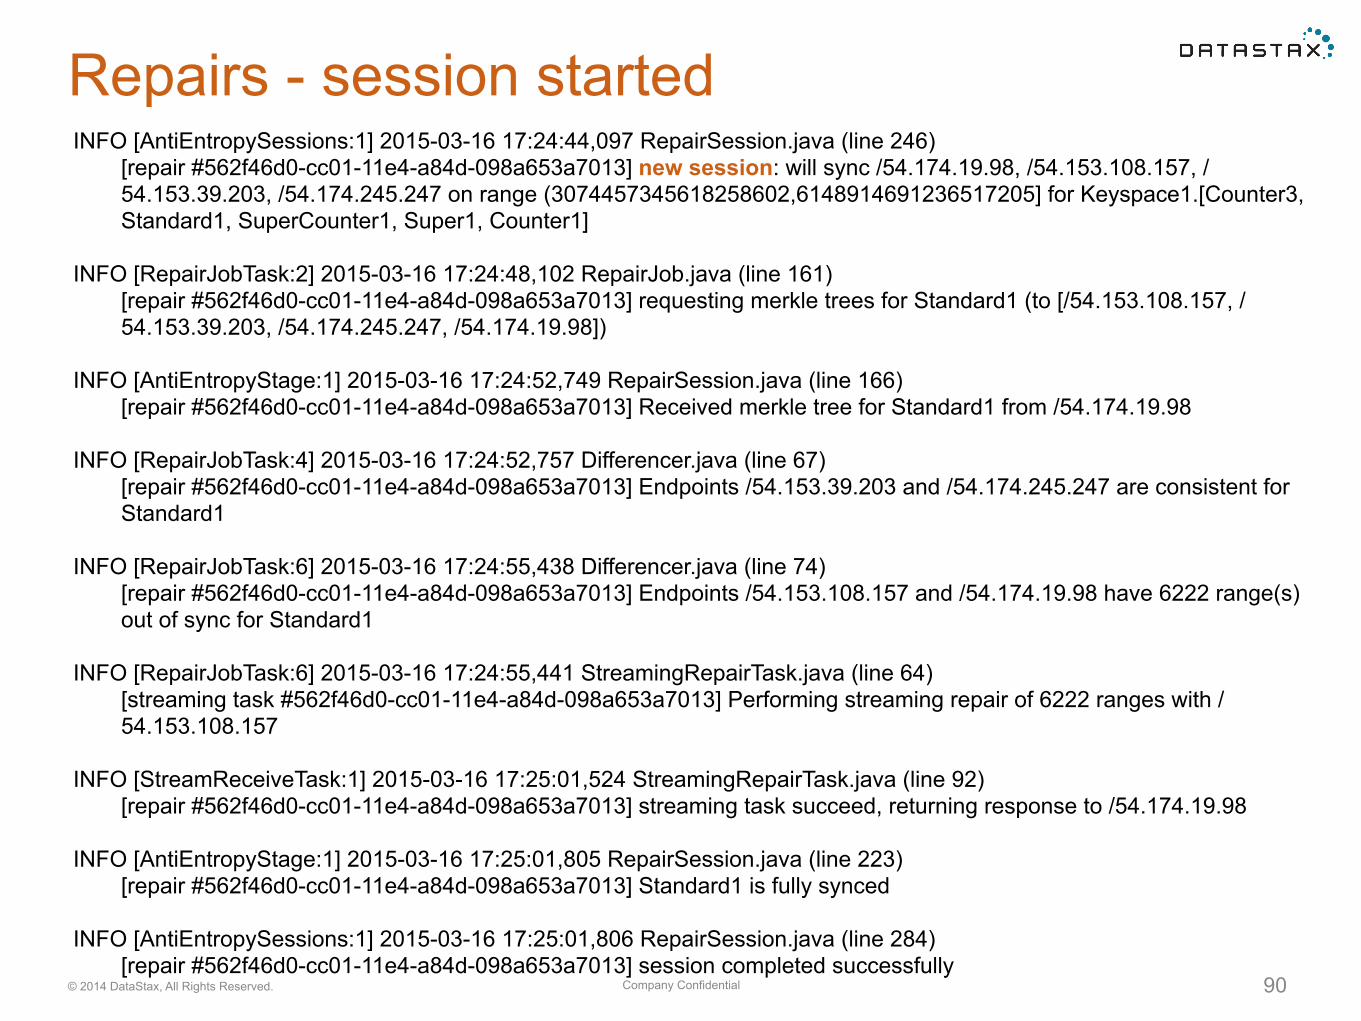
Repairs - session startedINFO [AntiEntropySessions:1] 2015-03-16 17:24:44,097 RepairSession.java (line 246)
[repair #562f46d0-cc01-11e4-a84d-098a653a7013] new session: will sync /54.174.19.98, /54.153.108.157, /54.153.39.203, /54.174.245.247 on range (3074457345618258602,6148914691236517205] for Keyspace1.[Counter3, Standard1, SuperCounter1, Super1, Counter1]
INFO [RepairJobTask:2] 2015-03-16 17:24:48,102 RepairJob.java (line 161) [repair #562f46d0-cc01-11e4-a84d-098a653a7013] requesting merkle trees for Standard1 (to [/54.153.108.157, /54.153.39.203, /54.174.245.247, /54.174.19.98])
INFO [AntiEntropyStage:1] 2015-03-16 17:24:52,749 RepairSession.java (line 166) [repair #562f46d0-cc01-11e4-a84d-098a653a7013] Received merkle tree for Standard1 from /54.174.19.98
INFO [RepairJobTask:4] 2015-03-16 17:24:52,757 Differencer.java (line 67) [repair #562f46d0-cc01-11e4-a84d-098a653a7013] Endpoints /54.153.39.203 and /54.174.245.247 are consistent for Standard1
INFO [RepairJobTask:6] 2015-03-16 17:24:55,438 Differencer.java (line 74) [repair #562f46d0-cc01-11e4-a84d-098a653a7013] Endpoints /54.153.108.157 and /54.174.19.98 have 6222 range(s) out of sync for Standard1
INFO [RepairJobTask:6] 2015-03-16 17:24:55,441 StreamingRepairTask.java (line 64) [streaming task #562f46d0-cc01-11e4-a84d-098a653a7013] Performing streaming repair of 6222 ranges with /54.153.108.157
INFO [StreamReceiveTask:1] 2015-03-16 17:25:01,524 StreamingRepairTask.java (line 92) [repair #562f46d0-cc01-11e4-a84d-098a653a7013] streaming task succeed, returning response to /54.174.19.98
INFO [AntiEntropyStage:1] 2015-03-16 17:25:01,805 RepairSession.java (line 223) [repair #562f46d0-cc01-11e4-a84d-098a653a7013] Standard1 is fully synced
INFO [AntiEntropySessions:1] 2015-03-16 17:25:01,806 RepairSession.java (line 284) [repair #562f46d0-cc01-11e4-a84d-098a653a7013] session completed successfully
Company Confidential© 2014 DataStax, All Rights Reserved. 91
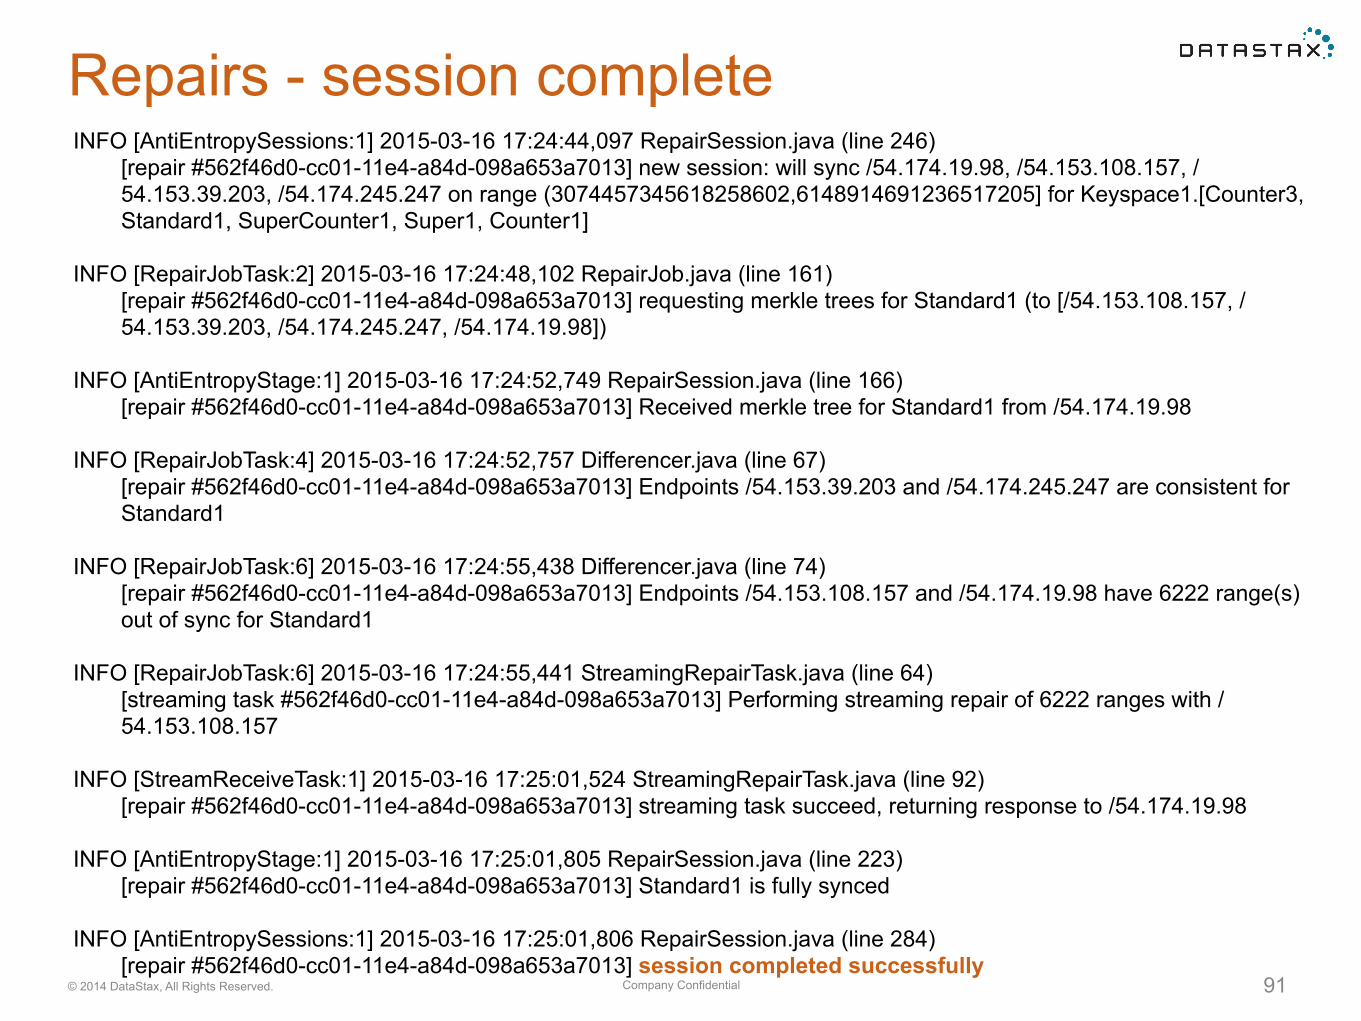
Repairs - session completeINFO [AntiEntropySessions:1] 2015-03-16 17:24:44,097 RepairSession.java (line 246)
[repair #562f46d0-cc01-11e4-a84d-098a653a7013] new session: will sync /54.174.19.98, /54.153.108.157, /54.153.39.203, /54.174.245.247 on range (3074457345618258602,6148914691236517205] for Keyspace1.[Counter3, Standard1, SuperCounter1, Super1, Counter1]
INFO [RepairJobTask:2] 2015-03-16 17:24:48,102 RepairJob.java (line 161) [repair #562f46d0-cc01-11e4-a84d-098a653a7013] requesting merkle trees for Standard1 (to [/54.153.108.157, /54.153.39.203, /54.174.245.247, /54.174.19.98])
INFO [AntiEntropyStage:1] 2015-03-16 17:24:52,749 RepairSession.java (line 166) [repair #562f46d0-cc01-11e4-a84d-098a653a7013] Received merkle tree for Standard1 from /54.174.19.98
INFO [RepairJobTask:4] 2015-03-16 17:24:52,757 Differencer.java (line 67) [repair #562f46d0-cc01-11e4-a84d-098a653a7013] Endpoints /54.153.39.203 and /54.174.245.247 are consistent for Standard1
INFO [RepairJobTask:6] 2015-03-16 17:24:55,438 Differencer.java (line 74) [repair #562f46d0-cc01-11e4-a84d-098a653a7013] Endpoints /54.153.108.157 and /54.174.19.98 have 6222 range(s) out of sync for Standard1
INFO [RepairJobTask:6] 2015-03-16 17:24:55,441 StreamingRepairTask.java (line 64) [streaming task #562f46d0-cc01-11e4-a84d-098a653a7013] Performing streaming repair of 6222 ranges with /54.153.108.157
INFO [StreamReceiveTask:1] 2015-03-16 17:25:01,524 StreamingRepairTask.java (line 92) [repair #562f46d0-cc01-11e4-a84d-098a653a7013] streaming task succeed, returning response to /54.174.19.98
INFO [AntiEntropyStage:1] 2015-03-16 17:25:01,805 RepairSession.java (line 223) [repair #562f46d0-cc01-11e4-a84d-098a653a7013] Standard1 is fully synced
INFO [AntiEntropySessions:1] 2015-03-16 17:25:01,806 RepairSession.java (line 284) [repair #562f46d0-cc01-11e4-a84d-098a653a7013] session completed successfully
Errors
Company Confidential© 2014 DataStax, All Rights Reserved. 93
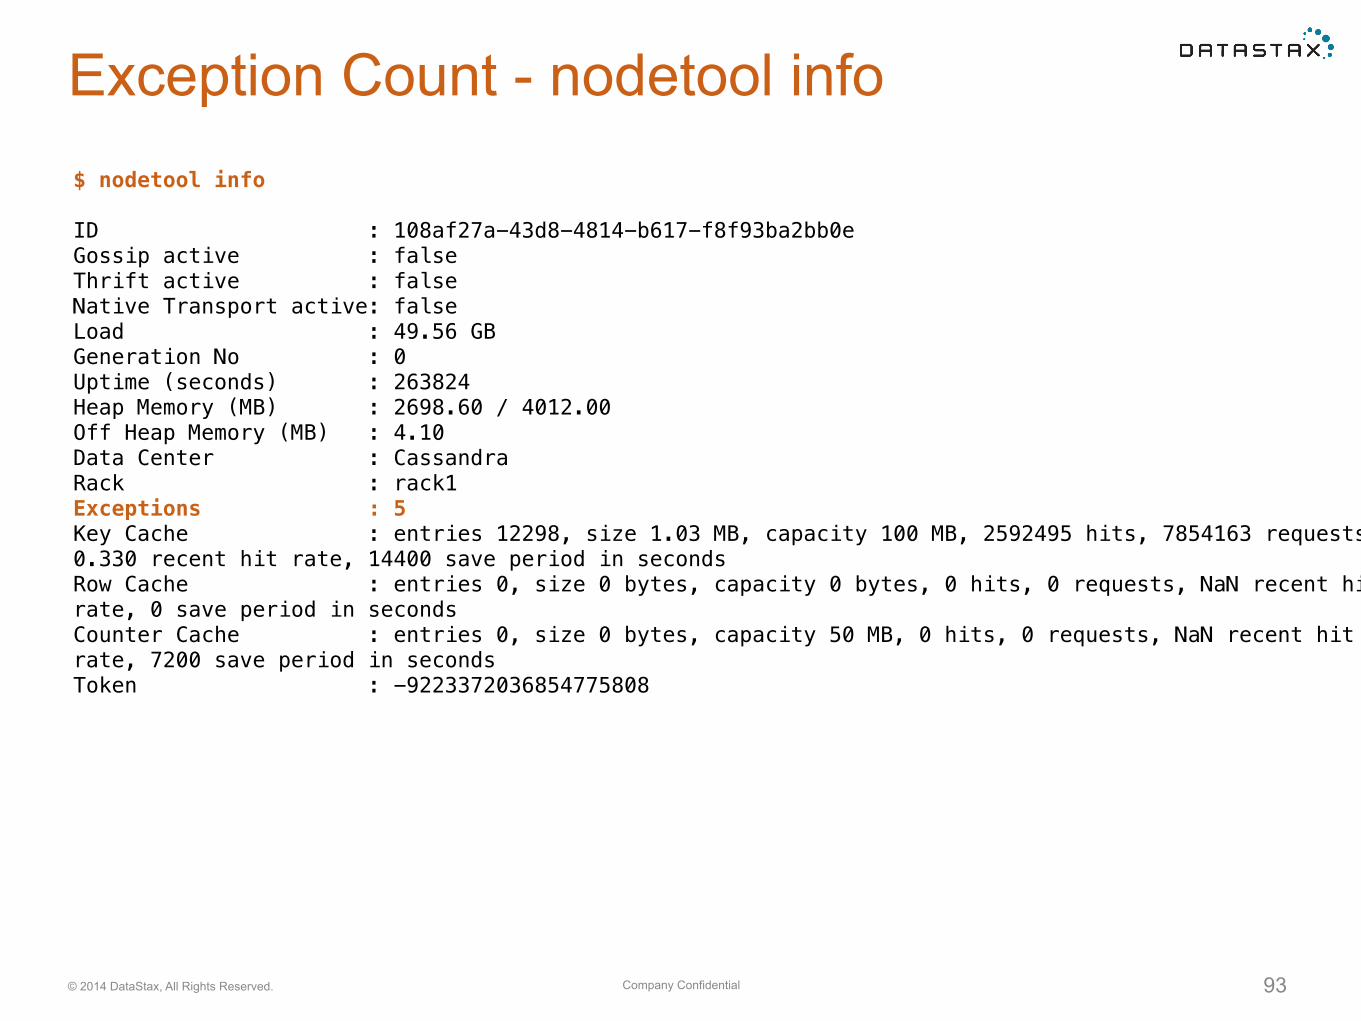
Exception Count - nodetool info$ nodetool info
ID : 108af27a-43d8-4814-b617-f8f93ba2bb0e Gossip active : false Thrift active : false Native Transport active: false Load : 49.56 GB Generation No : 0 Uptime (seconds) : 263824 Heap Memory (MB) : 2698.60 / 4012.00 Off Heap Memory (MB) : 4.10 Data Center : Cassandra Rack : rack1 Exceptions : 5 Key Cache : entries 12298, size 1.03 MB, capacity 100 MB, 2592495 hits, 7854163 requests, 0.330 recent hit rate, 14400 save period in seconds Row Cache : entries 0, size 0 bytes, capacity 0 bytes, 0 hits, 0 requests, NaN recent hit rate, 0 save period in seconds Counter Cache : entries 0, size 0 bytes, capacity 50 MB, 0 hits, 0 requests, NaN recent hit rate, 7200 save period in seconds Token : -9223372036854775808
Company Confidential© 2014 DataStax, All Rights Reserved. 94
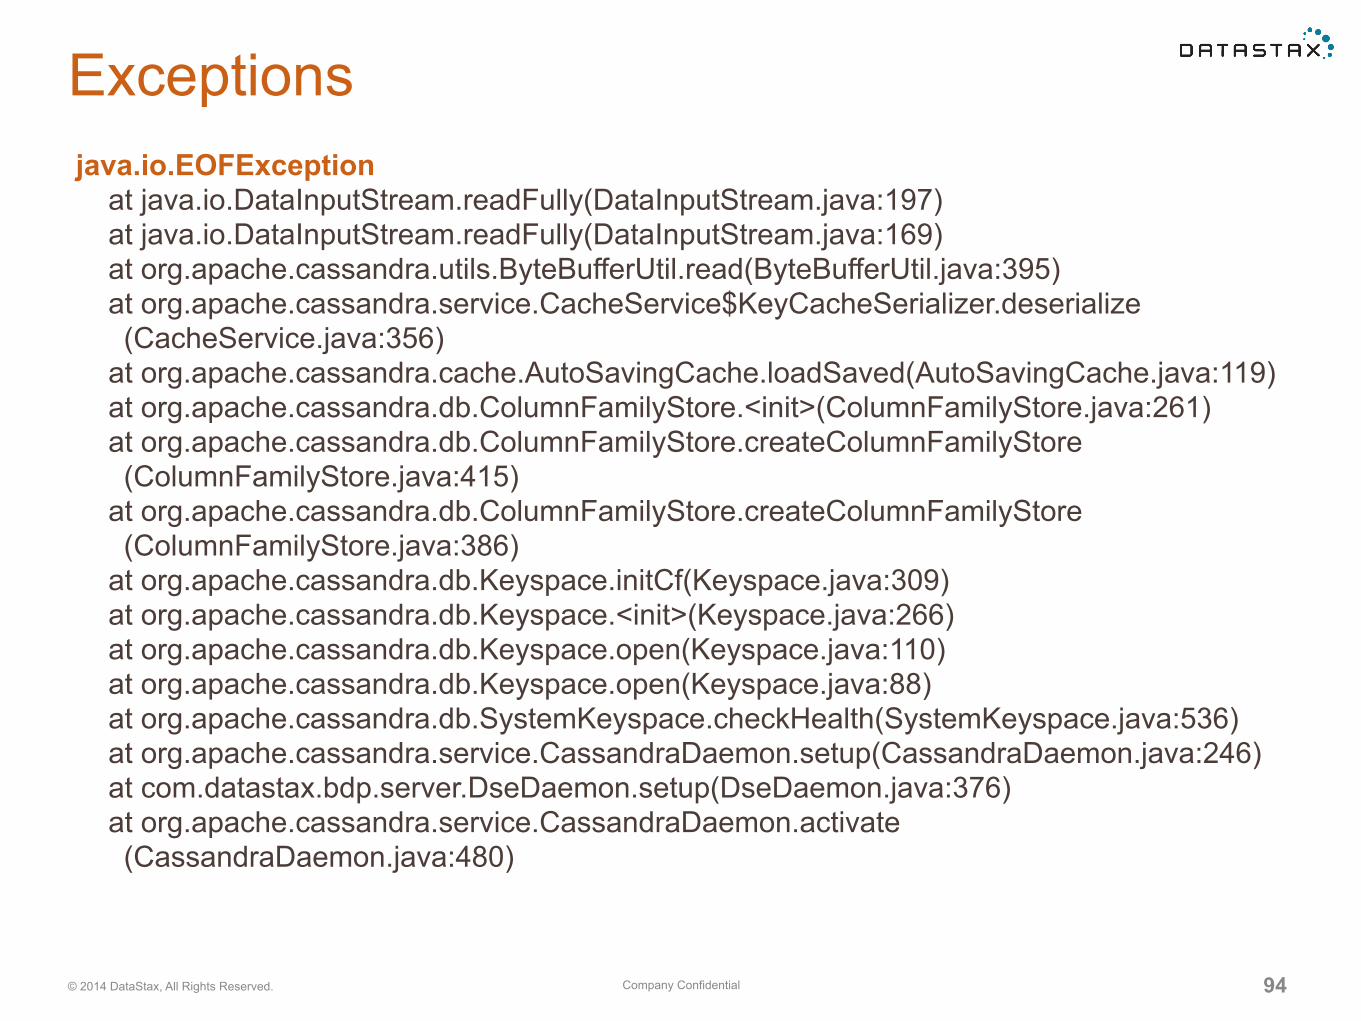
Exceptionsjava.io.EOFException at java.io.DataInputStream.readFully(DataInputStream.java:197) at java.io.DataInputStream.readFully(DataInputStream.java:169) at org.apache.cassandra.utils.ByteBufferUtil.read(ByteBufferUtil.java:395) at org.apache.cassandra.service.CacheService$KeyCacheSerializer.deserialize (CacheService.java:356) at org.apache.cassandra.cache.AutoSavingCache.loadSaved(AutoSavingCache.java:119) at org.apache.cassandra.db.ColumnFamilyStore.<init>(ColumnFamilyStore.java:261) at org.apache.cassandra.db.ColumnFamilyStore.createColumnFamilyStore (ColumnFamilyStore.java:415) at org.apache.cassandra.db.ColumnFamilyStore.createColumnFamilyStore (ColumnFamilyStore.java:386) at org.apache.cassandra.db.Keyspace.initCf(Keyspace.java:309) at org.apache.cassandra.db.Keyspace.<init>(Keyspace.java:266) at org.apache.cassandra.db.Keyspace.open(Keyspace.java:110) at org.apache.cassandra.db.Keyspace.open(Keyspace.java:88) at org.apache.cassandra.db.SystemKeyspace.checkHealth(SystemKeyspace.java:536) at org.apache.cassandra.service.CassandraDaemon.setup(CassandraDaemon.java:246) at com.datastax.bdp.server.DseDaemon.setup(DseDaemon.java:376) at org.apache.cassandra.service.CassandraDaemon.activate (CassandraDaemon.java:480)
Company Confidential© 2014 DataStax, All Rights Reserved. 95
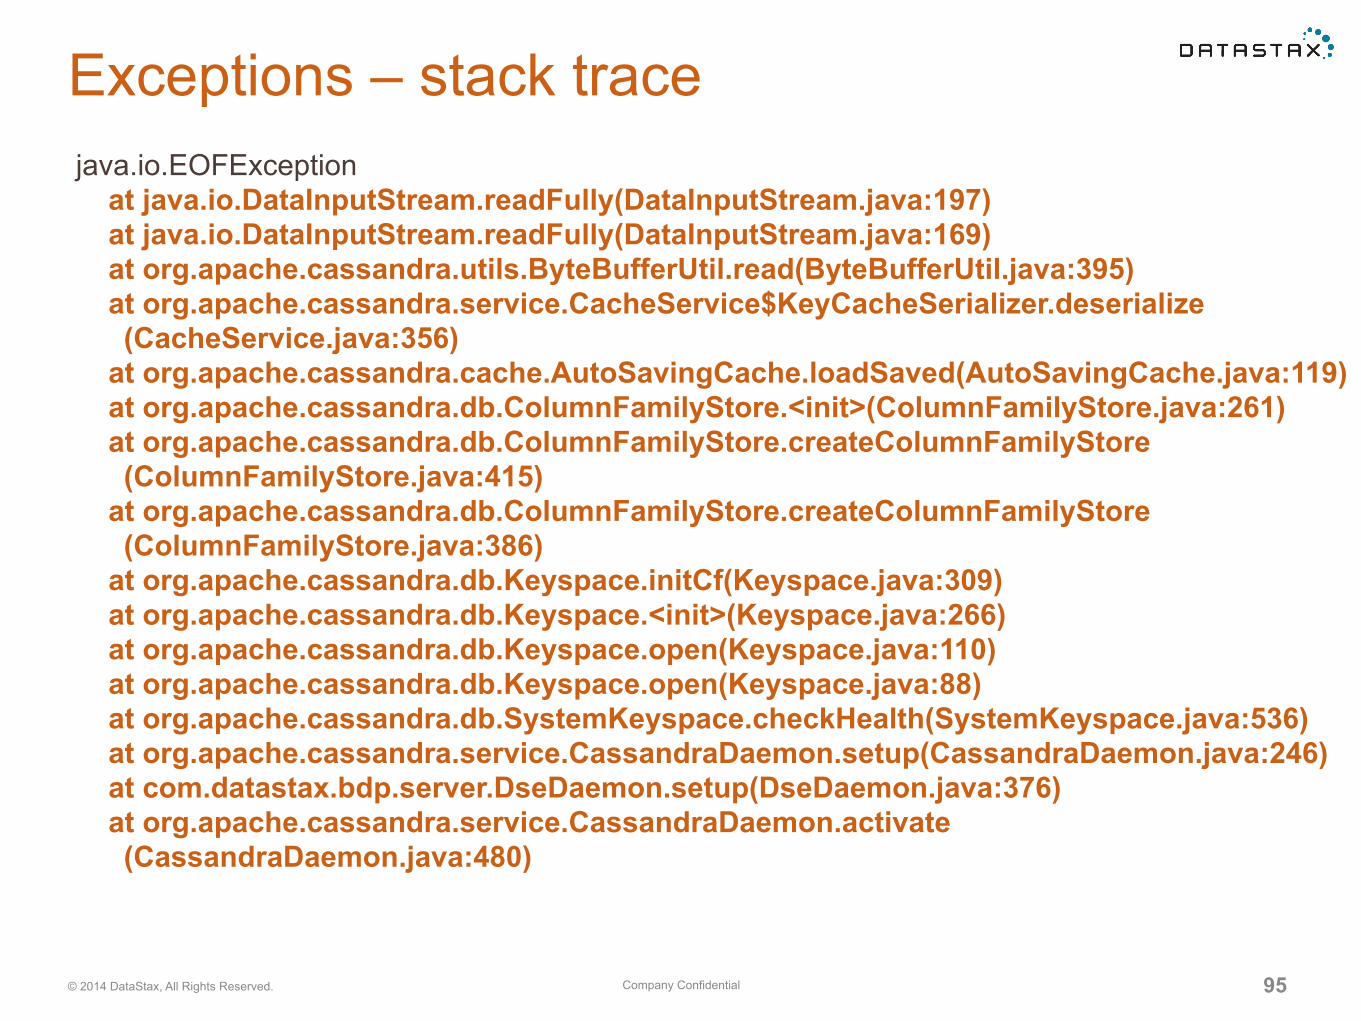
Exceptions – stack tracejava.io.EOFException at java.io.DataInputStream.readFully(DataInputStream.java:197) at java.io.DataInputStream.readFully(DataInputStream.java:169) at org.apache.cassandra.utils.ByteBufferUtil.read(ByteBufferUtil.java:395) at org.apache.cassandra.service.CacheService$KeyCacheSerializer.deserialize (CacheService.java:356) at org.apache.cassandra.cache.AutoSavingCache.loadSaved(AutoSavingCache.java:119) at org.apache.cassandra.db.ColumnFamilyStore.<init>(ColumnFamilyStore.java:261) at org.apache.cassandra.db.ColumnFamilyStore.createColumnFamilyStore (ColumnFamilyStore.java:415) at org.apache.cassandra.db.ColumnFamilyStore.createColumnFamilyStore (ColumnFamilyStore.java:386) at org.apache.cassandra.db.Keyspace.initCf(Keyspace.java:309) at org.apache.cassandra.db.Keyspace.<init>(Keyspace.java:266) at org.apache.cassandra.db.Keyspace.open(Keyspace.java:110) at org.apache.cassandra.db.Keyspace.open(Keyspace.java:88) at org.apache.cassandra.db.SystemKeyspace.checkHealth(SystemKeyspace.java:536) at org.apache.cassandra.service.CassandraDaemon.setup(CassandraDaemon.java:246) at com.datastax.bdp.server.DseDaemon.setup(DseDaemon.java:376) at org.apache.cassandra.service.CassandraDaemon.activate (CassandraDaemon.java:480)
Company Confidential© 2014 DataStax, All Rights Reserved. 96
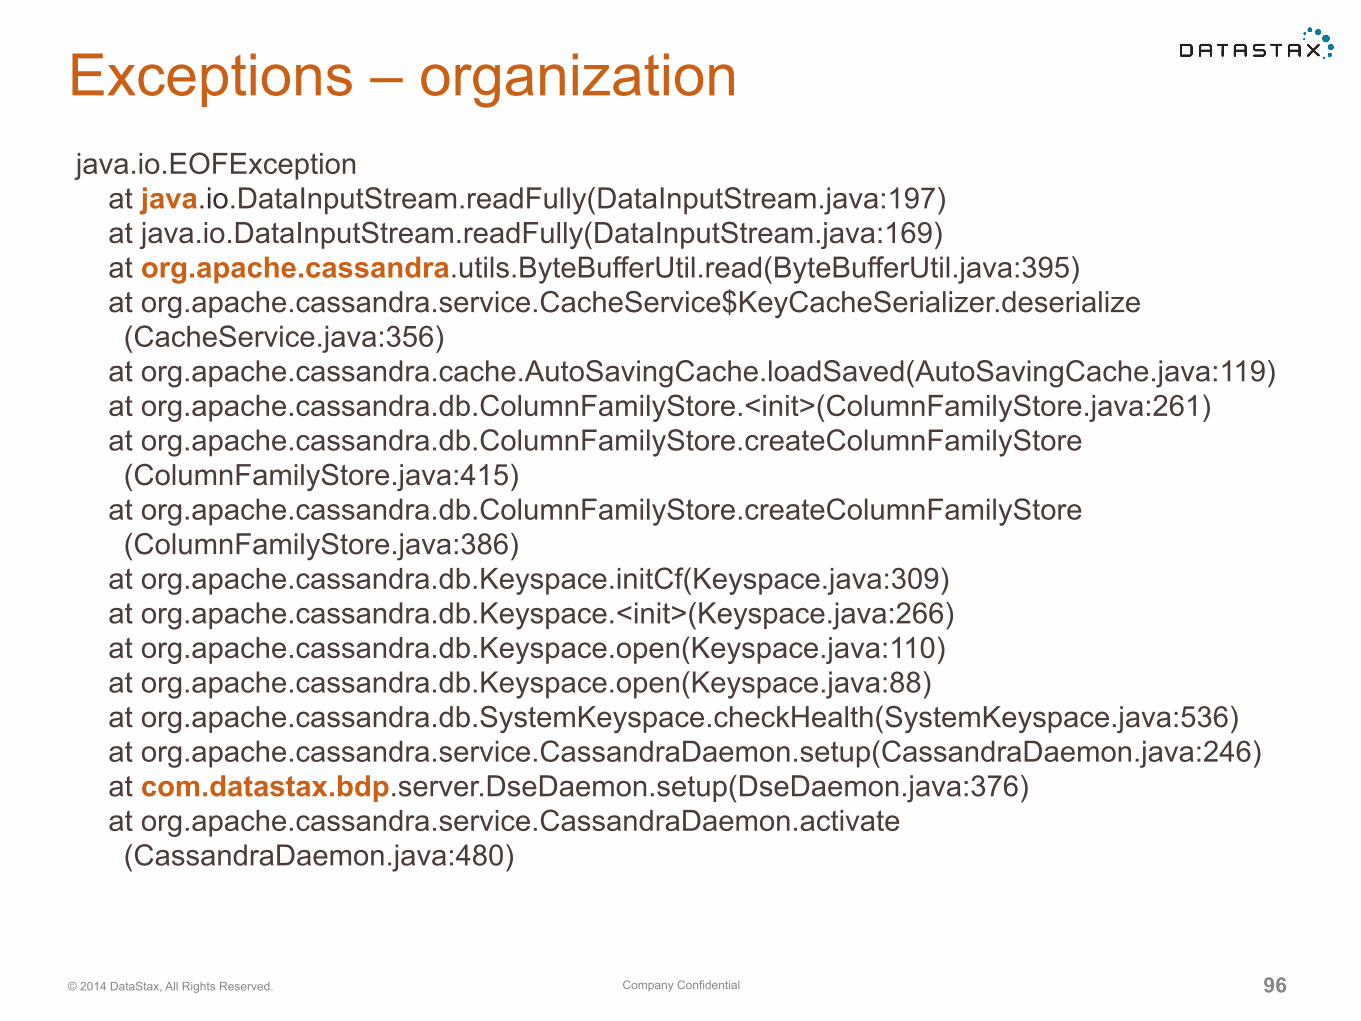
Exceptions – organizationjava.io.EOFException at java.io.DataInputStream.readFully(DataInputStream.java:197) at java.io.DataInputStream.readFully(DataInputStream.java:169) at org.apache.cassandra.utils.ByteBufferUtil.read(ByteBufferUtil.java:395) at org.apache.cassandra.service.CacheService$KeyCacheSerializer.deserialize (CacheService.java:356) at org.apache.cassandra.cache.AutoSavingCache.loadSaved(AutoSavingCache.java:119) at org.apache.cassandra.db.ColumnFamilyStore.<init>(ColumnFamilyStore.java:261) at org.apache.cassandra.db.ColumnFamilyStore.createColumnFamilyStore (ColumnFamilyStore.java:415) at org.apache.cassandra.db.ColumnFamilyStore.createColumnFamilyStore (ColumnFamilyStore.java:386) at org.apache.cassandra.db.Keyspace.initCf(Keyspace.java:309) at org.apache.cassandra.db.Keyspace.<init>(Keyspace.java:266) at org.apache.cassandra.db.Keyspace.open(Keyspace.java:110) at org.apache.cassandra.db.Keyspace.open(Keyspace.java:88) at org.apache.cassandra.db.SystemKeyspace.checkHealth(SystemKeyspace.java:536) at org.apache.cassandra.service.CassandraDaemon.setup(CassandraDaemon.java:246) at com.datastax.bdp.server.DseDaemon.setup(DseDaemon.java:376) at org.apache.cassandra.service.CassandraDaemon.activate (CassandraDaemon.java:480)

Company Confidential© 2014 DataStax, All Rights Reserved. 97
Exceptions – subsystemjava.io.EOFException at java.io.DataInputStream.readFully(DataInputStream.java:197) at java.io.DataInputStream.readFully(DataInputStream.java:169) at org.apache.cassandra.utils.ByteBufferUtil.read(ByteBufferUtil.java:395) at org.apache.cassandra.service.CacheService$KeyCacheSerializer.deserialize (CacheService.java:356) at org.apache.cassandra.cache.AutoSavingCache.loadSaved(AutoSavingCache.java:119) at org.apache.cassandra.db.ColumnFamilyStore.<init>(ColumnFamilyStore.java:261) at org.apache.cassandra.db.ColumnFamilyStore.createColumnFamilyStore (ColumnFamilyStore.java:415) at org.apache.cassandra.db.ColumnFamilyStore.createColumnFamilyStore (ColumnFamilyStore.java:386) at org.apache.cassandra.db.Keyspace.initCf(Keyspace.java:309) at org.apache.cassandra.db.Keyspace.<init>(Keyspace.java:266) at org.apache.cassandra.db.Keyspace.open(Keyspace.java:110) at org.apache.cassandra.db.Keyspace.open(Keyspace.java:88) at org.apache.cassandra.db.SystemKeyspace.checkHealth(SystemKeyspace.java:536) at org.apache.cassandra.service.CassandraDaemon.setup(CassandraDaemon.java:246) at com.datastax.bdp.server.DseDaemon.setup(DseDaemon.java:376) at org.apache.cassandra.service.CassandraDaemon.activate (CassandraDaemon.java:480)
Company Confidential© 2014 DataStax, All Rights Reserved. 98
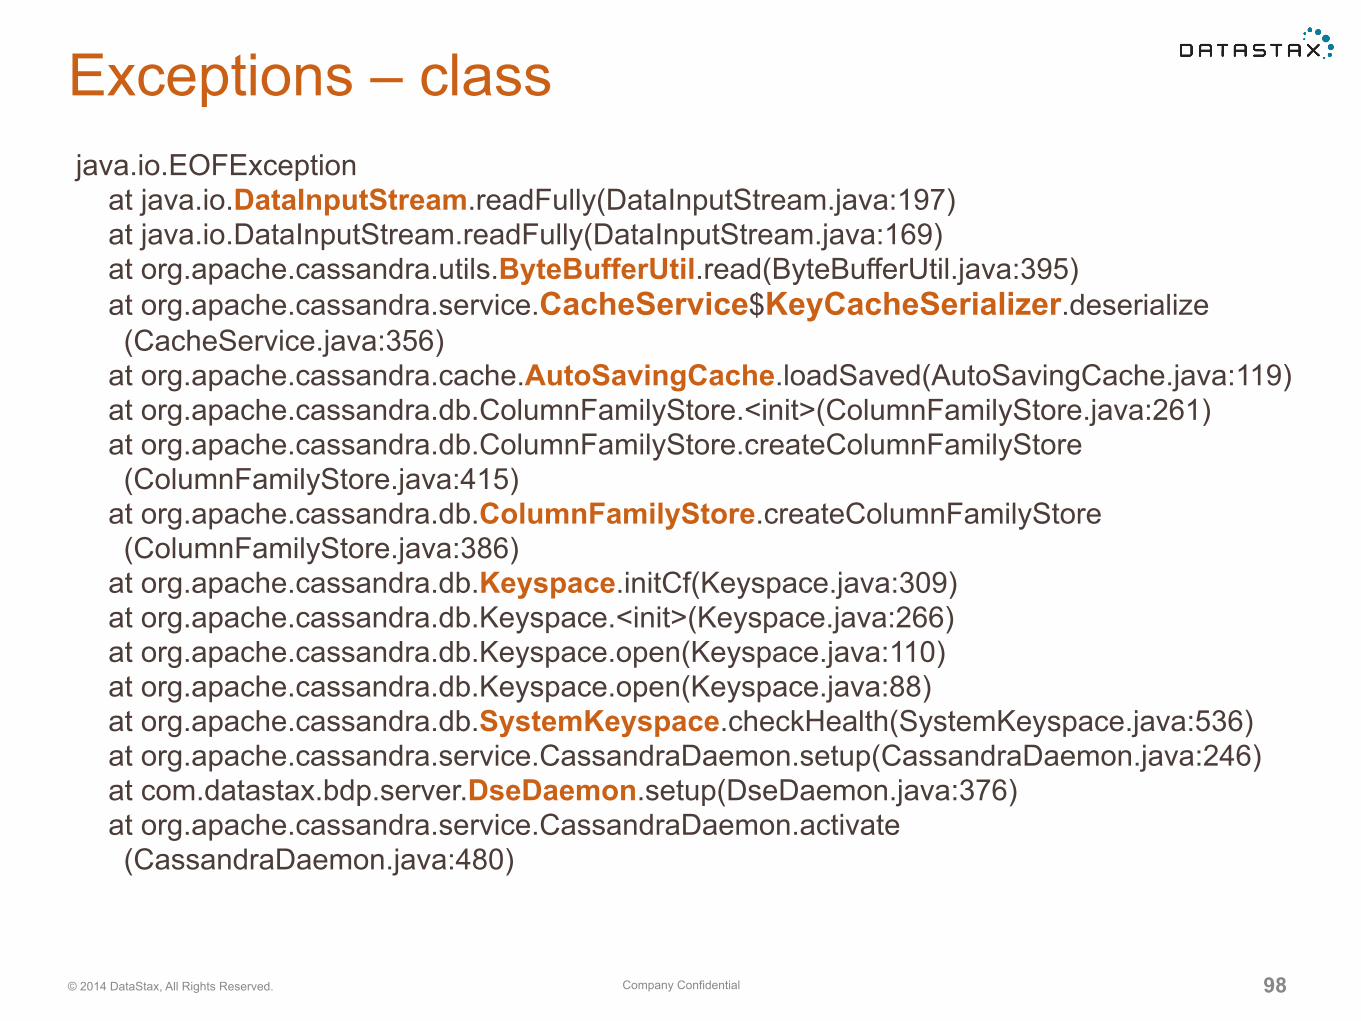
Exceptions – classjava.io.EOFException at java.io.DataInputStream.readFully(DataInputStream.java:197) at java.io.DataInputStream.readFully(DataInputStream.java:169) at org.apache.cassandra.utils.ByteBufferUtil.read(ByteBufferUtil.java:395) at org.apache.cassandra.service.CacheService$KeyCacheSerializer.deserialize (CacheService.java:356) at org.apache.cassandra.cache.AutoSavingCache.loadSaved(AutoSavingCache.java:119) at org.apache.cassandra.db.ColumnFamilyStore.<init>(ColumnFamilyStore.java:261) at org.apache.cassandra.db.ColumnFamilyStore.createColumnFamilyStore (ColumnFamilyStore.java:415) at org.apache.cassandra.db.ColumnFamilyStore.createColumnFamilyStore (ColumnFamilyStore.java:386) at org.apache.cassandra.db.Keyspace.initCf(Keyspace.java:309) at org.apache.cassandra.db.Keyspace.<init>(Keyspace.java:266) at org.apache.cassandra.db.Keyspace.open(Keyspace.java:110) at org.apache.cassandra.db.Keyspace.open(Keyspace.java:88) at org.apache.cassandra.db.SystemKeyspace.checkHealth(SystemKeyspace.java:536) at org.apache.cassandra.service.CassandraDaemon.setup(CassandraDaemon.java:246) at com.datastax.bdp.server.DseDaemon.setup(DseDaemon.java:376) at org.apache.cassandra.service.CassandraDaemon.activate (CassandraDaemon.java:480)
Company Confidential© 2014 DataStax, All Rights Reserved. 99
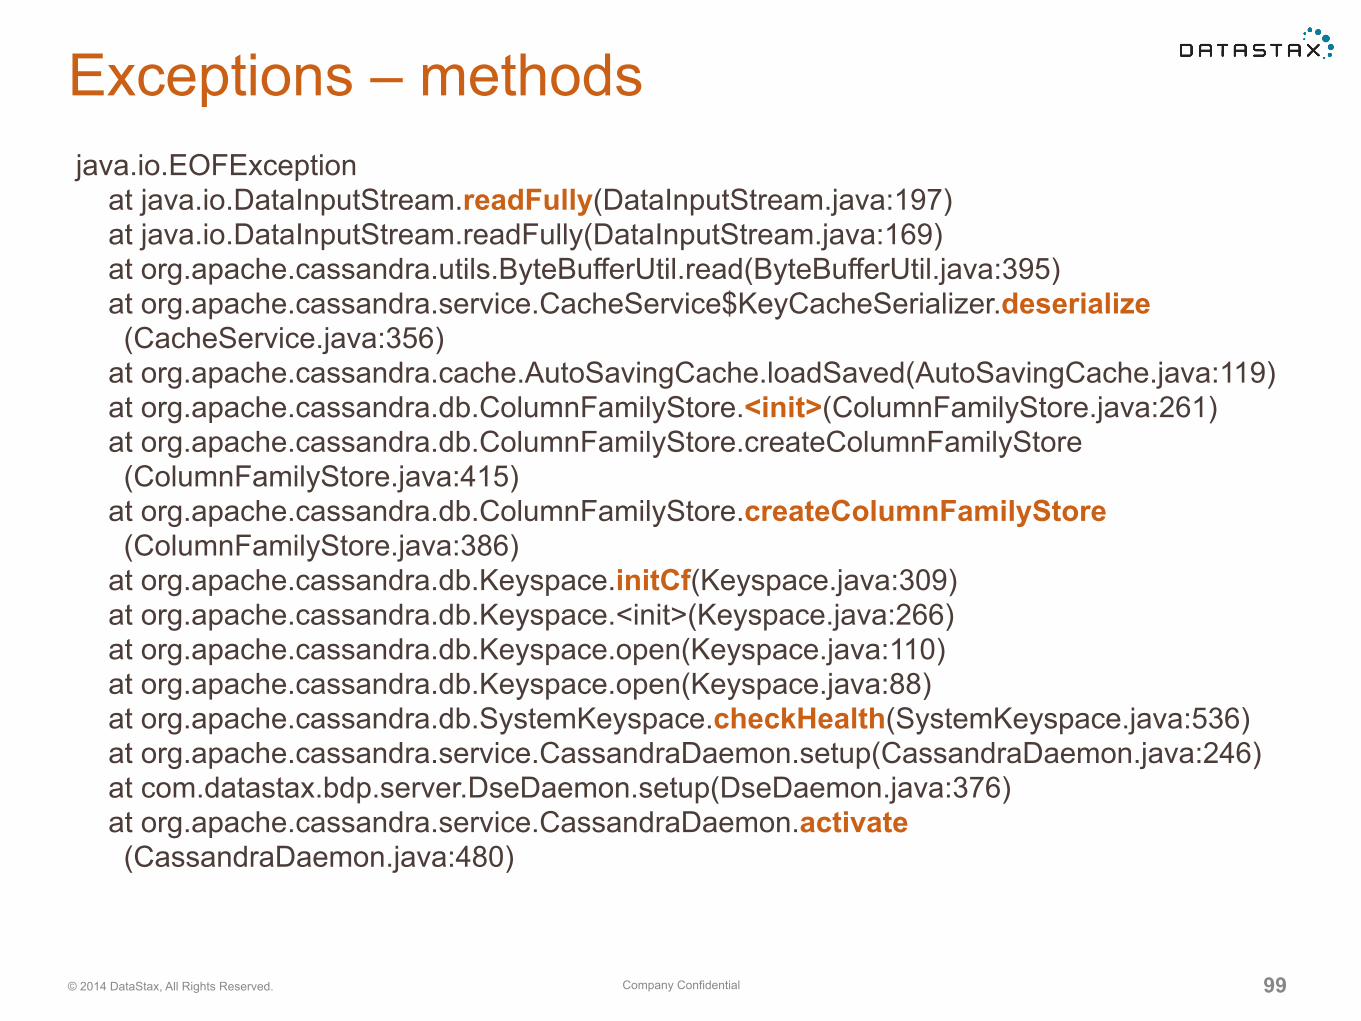
Exceptions – methodsjava.io.EOFException at java.io.DataInputStream.readFully(DataInputStream.java:197) at java.io.DataInputStream.readFully(DataInputStream.java:169) at org.apache.cassandra.utils.ByteBufferUtil.read(ByteBufferUtil.java:395) at org.apache.cassandra.service.CacheService$KeyCacheSerializer.deserialize (CacheService.java:356) at org.apache.cassandra.cache.AutoSavingCache.loadSaved(AutoSavingCache.java:119) at org.apache.cassandra.db.ColumnFamilyStore.<init>(ColumnFamilyStore.java:261) at org.apache.cassandra.db.ColumnFamilyStore.createColumnFamilyStore (ColumnFamilyStore.java:415) at org.apache.cassandra.db.ColumnFamilyStore.createColumnFamilyStore (ColumnFamilyStore.java:386) at org.apache.cassandra.db.Keyspace.initCf(Keyspace.java:309) at org.apache.cassandra.db.Keyspace.<init>(Keyspace.java:266) at org.apache.cassandra.db.Keyspace.open(Keyspace.java:110) at org.apache.cassandra.db.Keyspace.open(Keyspace.java:88) at org.apache.cassandra.db.SystemKeyspace.checkHealth(SystemKeyspace.java:536) at org.apache.cassandra.service.CassandraDaemon.setup(CassandraDaemon.java:246) at com.datastax.bdp.server.DseDaemon.setup(DseDaemon.java:376) at org.apache.cassandra.service.CassandraDaemon.activate (CassandraDaemon.java:480)
Company Confidential© 2014 DataStax, All Rights Reserved. 100
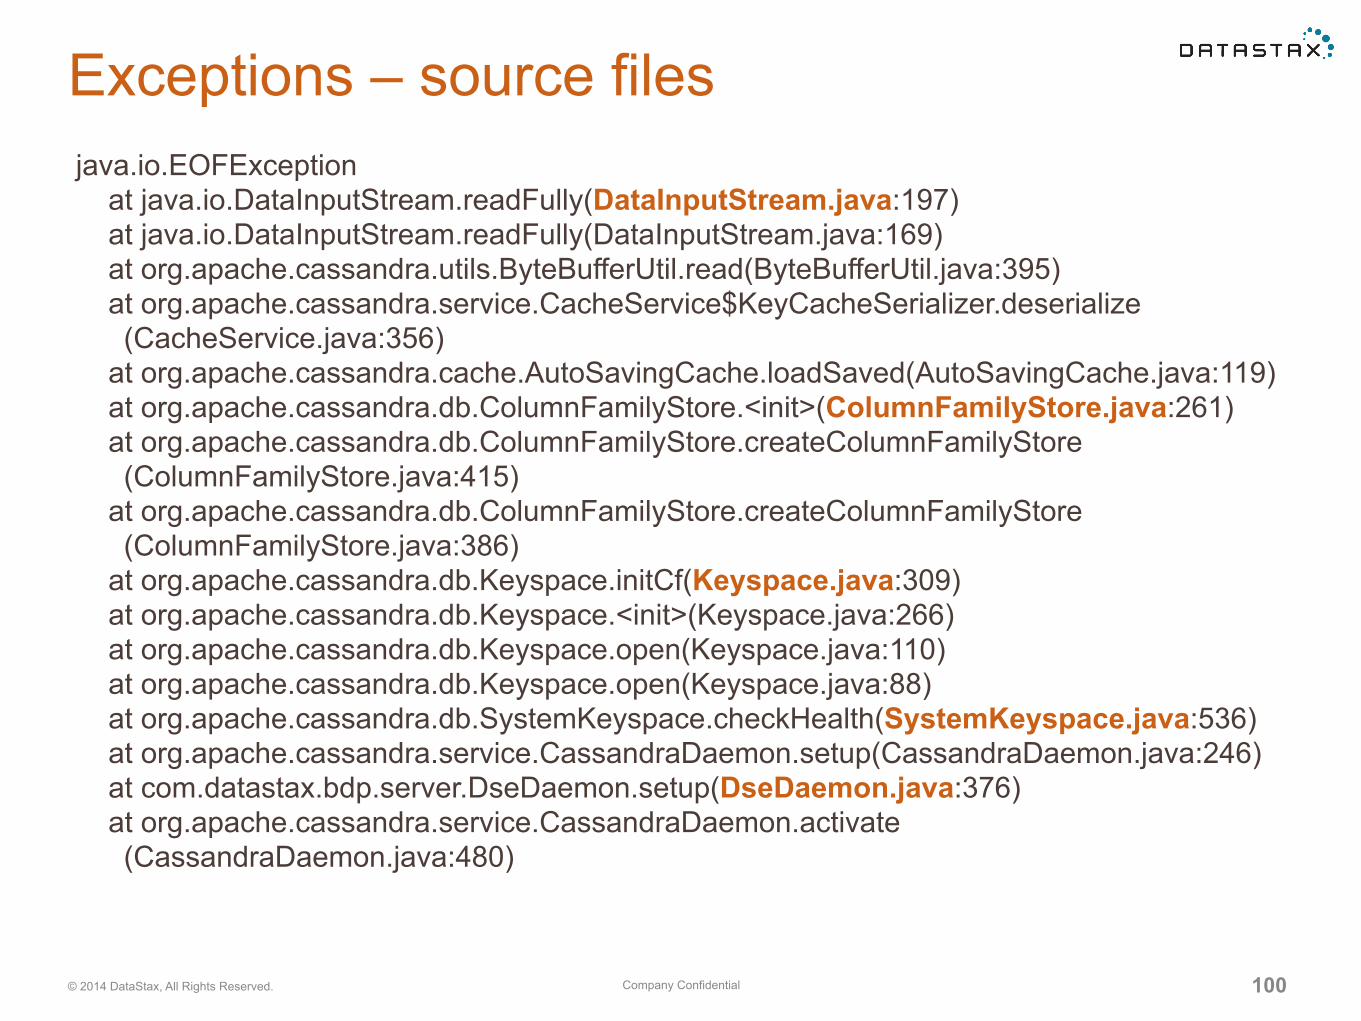
Exceptions – source filesjava.io.EOFException at java.io.DataInputStream.readFully(DataInputStream.java:197) at java.io.DataInputStream.readFully(DataInputStream.java:169) at org.apache.cassandra.utils.ByteBufferUtil.read(ByteBufferUtil.java:395) at org.apache.cassandra.service.CacheService$KeyCacheSerializer.deserialize (CacheService.java:356) at org.apache.cassandra.cache.AutoSavingCache.loadSaved(AutoSavingCache.java:119) at org.apache.cassandra.db.ColumnFamilyStore.<init>(ColumnFamilyStore.java:261) at org.apache.cassandra.db.ColumnFamilyStore.createColumnFamilyStore (ColumnFamilyStore.java:415) at org.apache.cassandra.db.ColumnFamilyStore.createColumnFamilyStore (ColumnFamilyStore.java:386) at org.apache.cassandra.db.Keyspace.initCf(Keyspace.java:309) at org.apache.cassandra.db.Keyspace.<init>(Keyspace.java:266) at org.apache.cassandra.db.Keyspace.open(Keyspace.java:110) at org.apache.cassandra.db.Keyspace.open(Keyspace.java:88) at org.apache.cassandra.db.SystemKeyspace.checkHealth(SystemKeyspace.java:536) at org.apache.cassandra.service.CassandraDaemon.setup(CassandraDaemon.java:246) at com.datastax.bdp.server.DseDaemon.setup(DseDaemon.java:376) at org.apache.cassandra.service.CassandraDaemon.activate (CassandraDaemon.java:480)
Company Confidential© 2014 DataStax, All Rights Reserved. 101
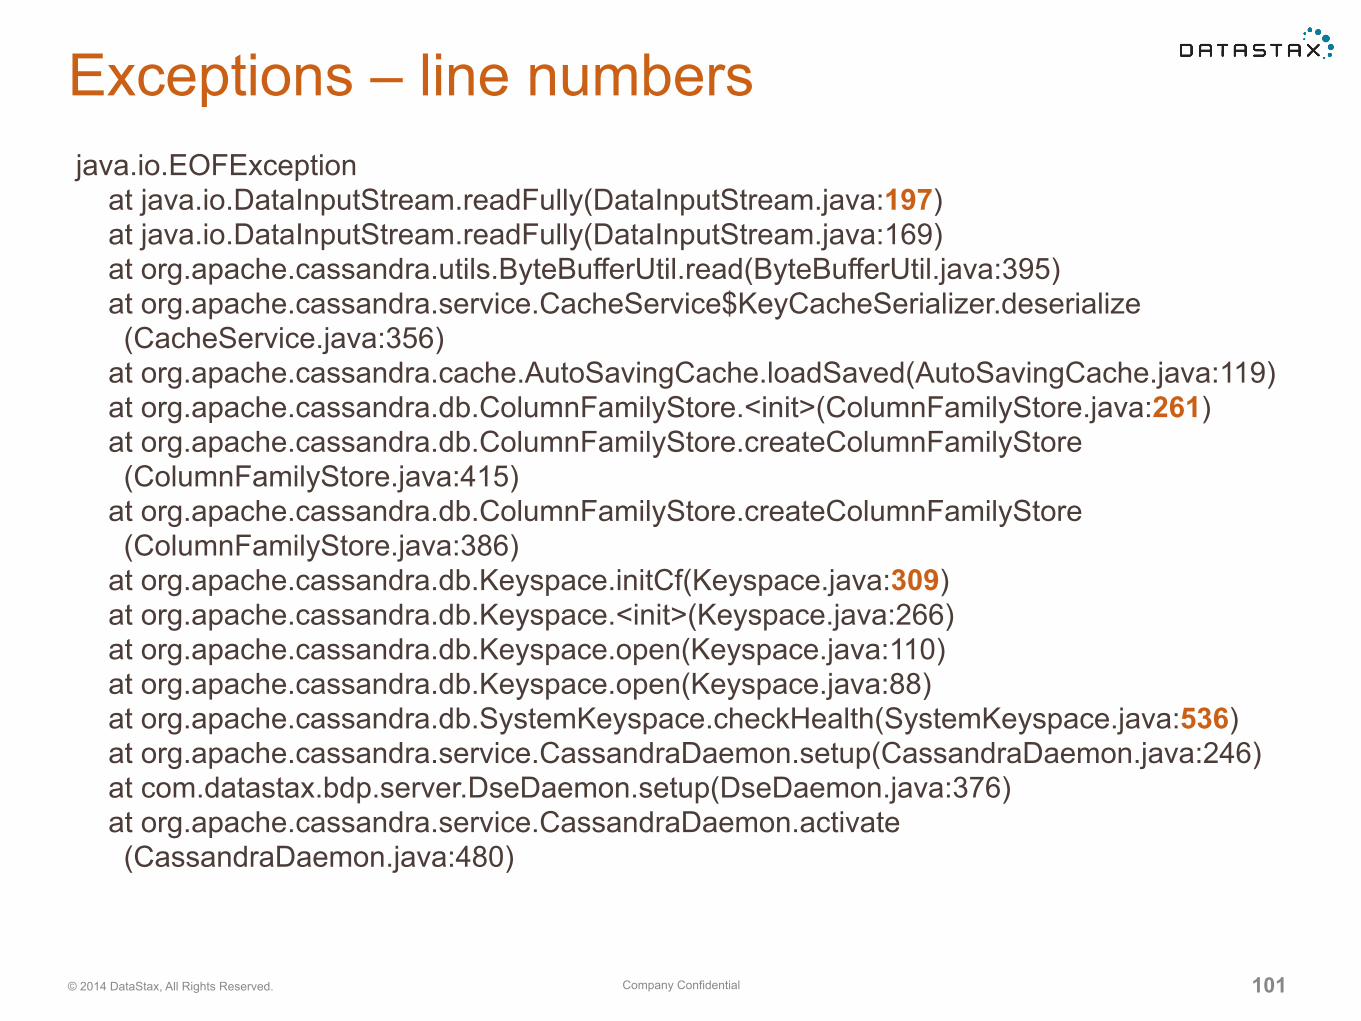
Exceptions – line numbersjava.io.EOFException at java.io.DataInputStream.readFully(DataInputStream.java:197) at java.io.DataInputStream.readFully(DataInputStream.java:169) at org.apache.cassandra.utils.ByteBufferUtil.read(ByteBufferUtil.java:395) at org.apache.cassandra.service.CacheService$KeyCacheSerializer.deserialize (CacheService.java:356) at org.apache.cassandra.cache.AutoSavingCache.loadSaved(AutoSavingCache.java:119) at org.apache.cassandra.db.ColumnFamilyStore.<init>(ColumnFamilyStore.java:261) at org.apache.cassandra.db.ColumnFamilyStore.createColumnFamilyStore (ColumnFamilyStore.java:415) at org.apache.cassandra.db.ColumnFamilyStore.createColumnFamilyStore (ColumnFamilyStore.java:386) at org.apache.cassandra.db.Keyspace.initCf(Keyspace.java:309) at org.apache.cassandra.db.Keyspace.<init>(Keyspace.java:266) at org.apache.cassandra.db.Keyspace.open(Keyspace.java:110) at org.apache.cassandra.db.Keyspace.open(Keyspace.java:88) at org.apache.cassandra.db.SystemKeyspace.checkHealth(SystemKeyspace.java:536) at org.apache.cassandra.service.CassandraDaemon.setup(CassandraDaemon.java:246) at com.datastax.bdp.server.DseDaemon.setup(DseDaemon.java:376) at org.apache.cassandra.service.CassandraDaemon.activate (CassandraDaemon.java:480)
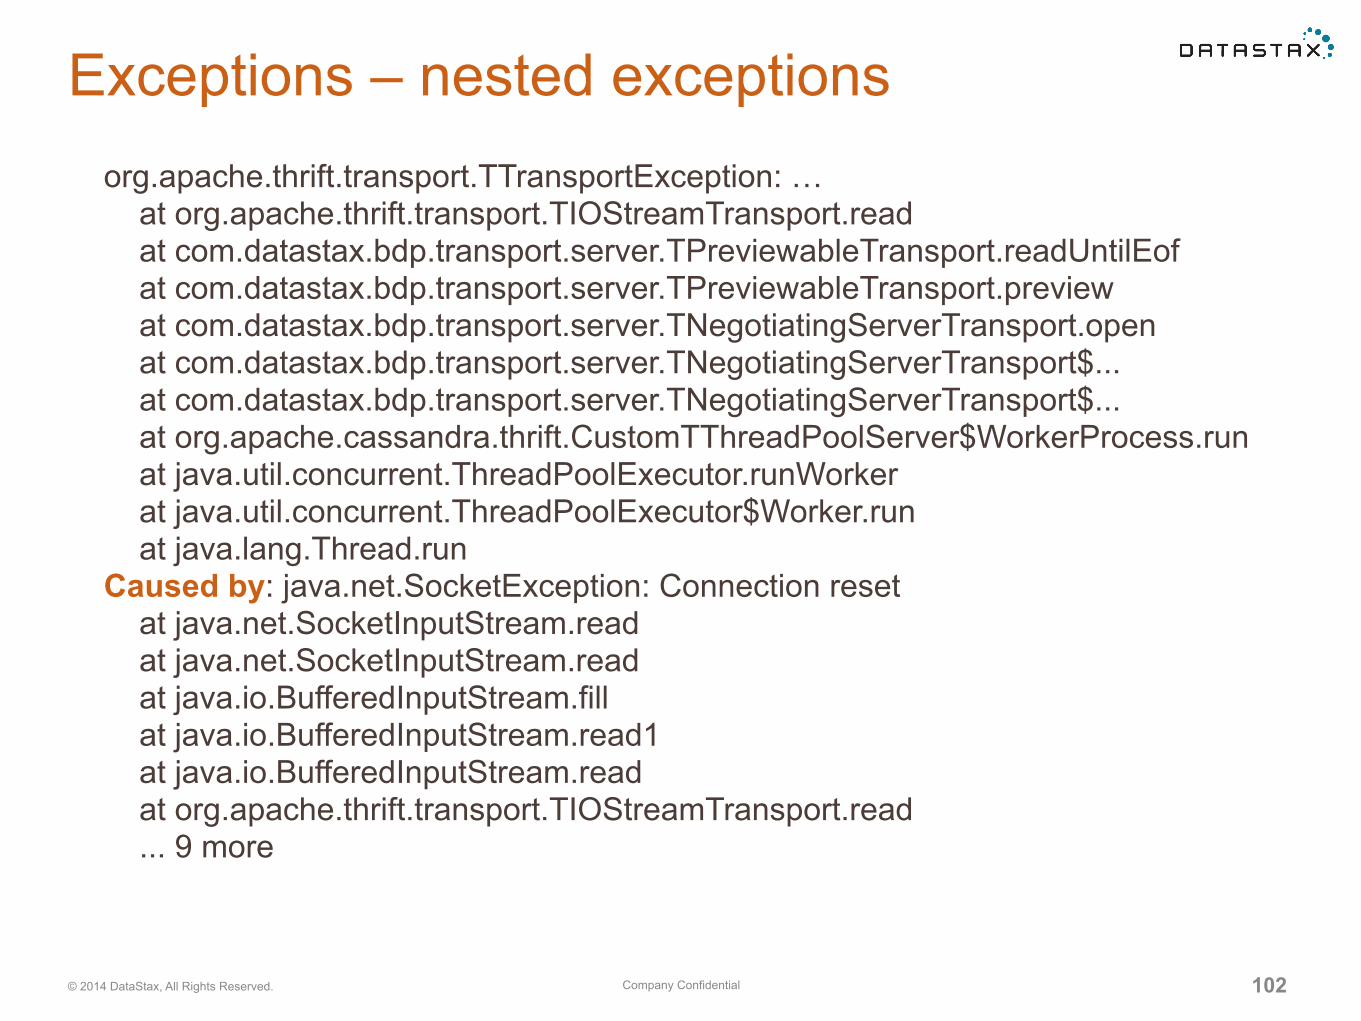
Company Confidential© 2014 DataStax, All Rights Reserved. 102
Exceptions – nested exceptionsorg.apache.thrift.transport.TTransportException: … at org.apache.thrift.transport.TIOStreamTransport.read at com.datastax.bdp.transport.server.TPreviewableTransport.readUntilEof at com.datastax.bdp.transport.server.TPreviewableTransport.preview at com.datastax.bdp.transport.server.TNegotiatingServerTransport.open at com.datastax.bdp.transport.server.TNegotiatingServerTransport$... at com.datastax.bdp.transport.server.TNegotiatingServerTransport$... at org.apache.cassandra.thrift.CustomTThreadPoolServer$WorkerProcess.run at java.util.concurrent.ThreadPoolExecutor.runWorker at java.util.concurrent.ThreadPoolExecutor$Worker.run at java.lang.Thread.run Caused by: java.net.SocketException: Connection reset at java.net.SocketInputStream.read at java.net.SocketInputStream.read at java.io.BufferedInputStream.fill at java.io.BufferedInputStream.read1 at java.io.BufferedInputStream.read at org.apache.thrift.transport.TIOStreamTransport.read ... 9 more

Company Confidential© 2014 DataStax, All Rights Reserved. 103
Exceptions – error messageorg.apache.thrift.transport.TTransportException: … at org.apache.thrift.transport.TIOStreamTransport.read at com.datastax.bdp.transport.server.TPreviewableTransport.readUntilEof at com.datastax.bdp.transport.server.TPreviewableTransport.preview at com.datastax.bdp.transport.server.TNegotiatingServerTransport.open at com.datastax.bdp.transport.server.TNegotiatingServerTransport$... at com.datastax.bdp.transport.server.TNegotiatingServerTransport$... at org.apache.cassandra.thrift.CustomTThreadPoolServer$WorkerProcess.run at java.util.concurrent.ThreadPoolExecutor.runWorker at java.util.concurrent.ThreadPoolExecutor$Worker.run at java.lang.Thread.run Caused by: java.net.SocketException: Connection reset at java.net.SocketInputStream.read at java.net.SocketInputStream.read at java.io.BufferedInputStream.fill at java.io.BufferedInputStream.read1 at java.io.BufferedInputStream.read at org.apache.thrift.transport.TIOStreamTransport.read ... 9 more
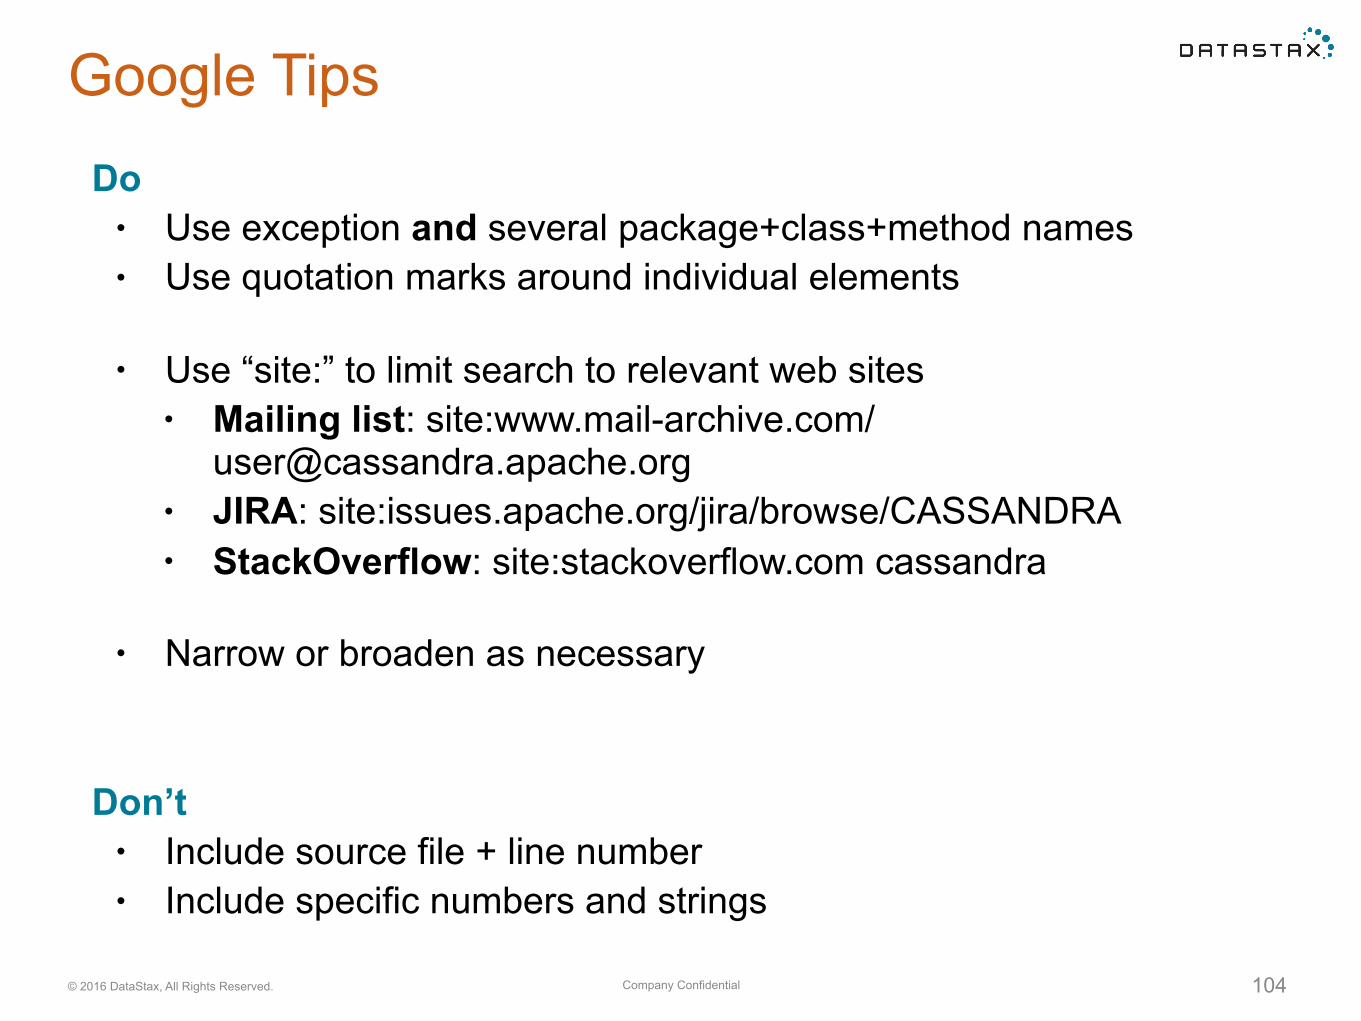
Company Confidential© 2016 DataStax, All Rights Reserved.
Google TipsDo
• Use exception and several package+class+method names • Use quotation marks around individual elements
• Use “site:” to limit search to relevant web sites • Mailing list: site:www.mail-archive.com/
[email protected] • JIRA: site:issues.apache.org/jira/browse/CASSANDRA • StackOverflow: site:stackoverflow.com cassandra
• Narrow or broaden as necessary
Don’t • Include source file + line number • Include specific numbers and strings
104
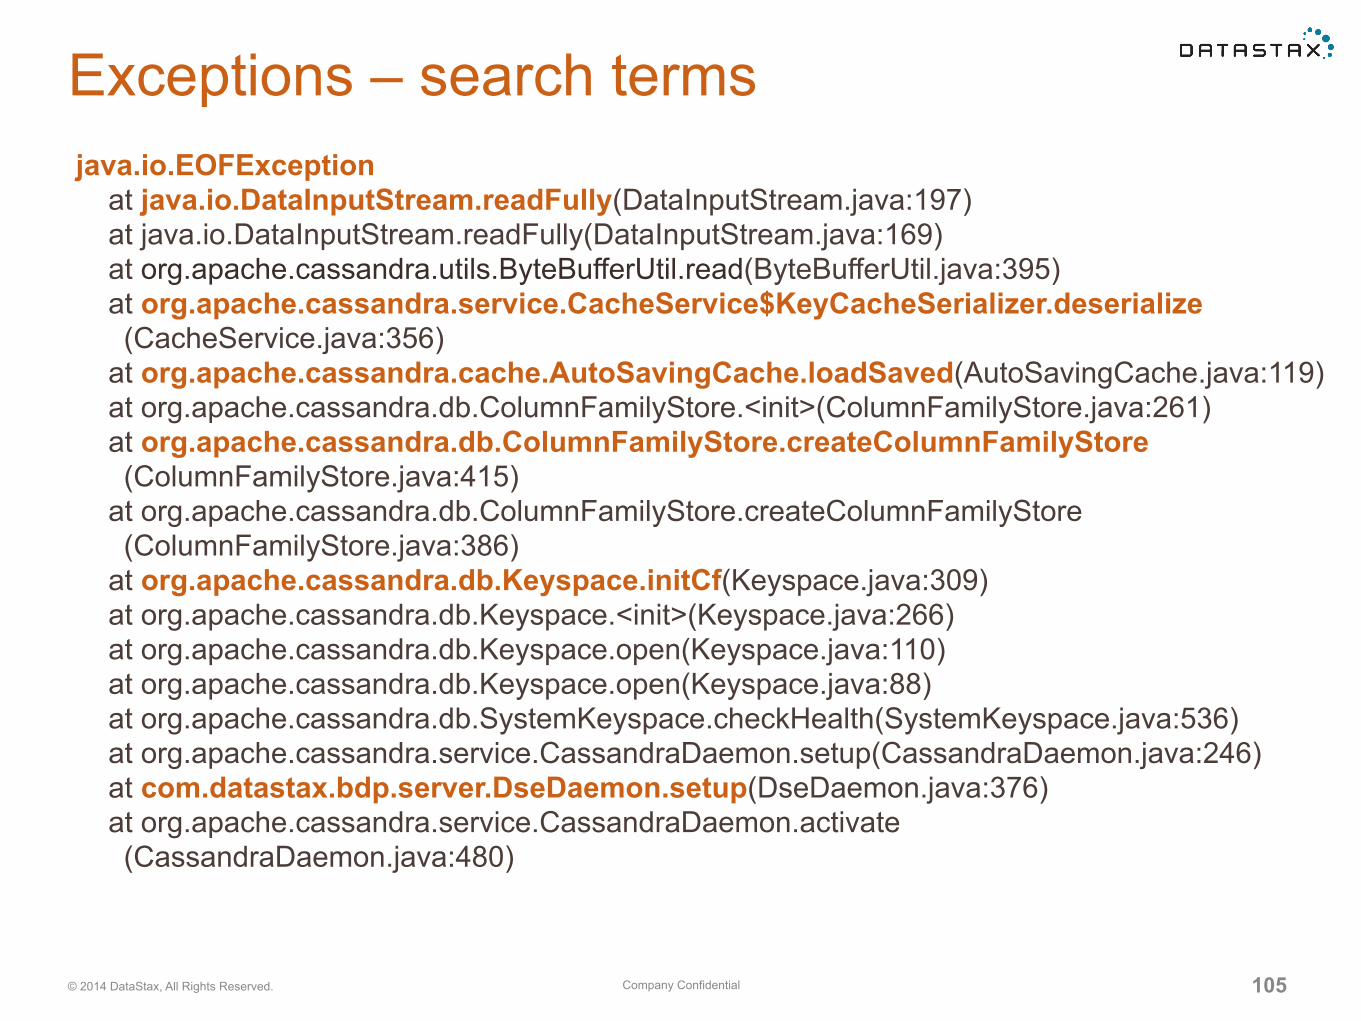
Company Confidential© 2014 DataStax, All Rights Reserved. 105
Exceptions – search termsjava.io.EOFException at java.io.DataInputStream.readFully(DataInputStream.java:197) at java.io.DataInputStream.readFully(DataInputStream.java:169) at org.apache.cassandra.utils.ByteBufferUtil.read(ByteBufferUtil.java:395) at org.apache.cassandra.service.CacheService$KeyCacheSerializer.deserialize (CacheService.java:356) at org.apache.cassandra.cache.AutoSavingCache.loadSaved(AutoSavingCache.java:119) at org.apache.cassandra.db.ColumnFamilyStore.<init>(ColumnFamilyStore.java:261) at org.apache.cassandra.db.ColumnFamilyStore.createColumnFamilyStore (ColumnFamilyStore.java:415) at org.apache.cassandra.db.ColumnFamilyStore.createColumnFamilyStore (ColumnFamilyStore.java:386) at org.apache.cassandra.db.Keyspace.initCf(Keyspace.java:309) at org.apache.cassandra.db.Keyspace.<init>(Keyspace.java:266) at org.apache.cassandra.db.Keyspace.open(Keyspace.java:110) at org.apache.cassandra.db.Keyspace.open(Keyspace.java:88) at org.apache.cassandra.db.SystemKeyspace.checkHealth(SystemKeyspace.java:536) at org.apache.cassandra.service.CassandraDaemon.setup(CassandraDaemon.java:246) at com.datastax.bdp.server.DseDaemon.setup(DseDaemon.java:376) at org.apache.cassandra.service.CassandraDaemon.activate (CassandraDaemon.java:480)
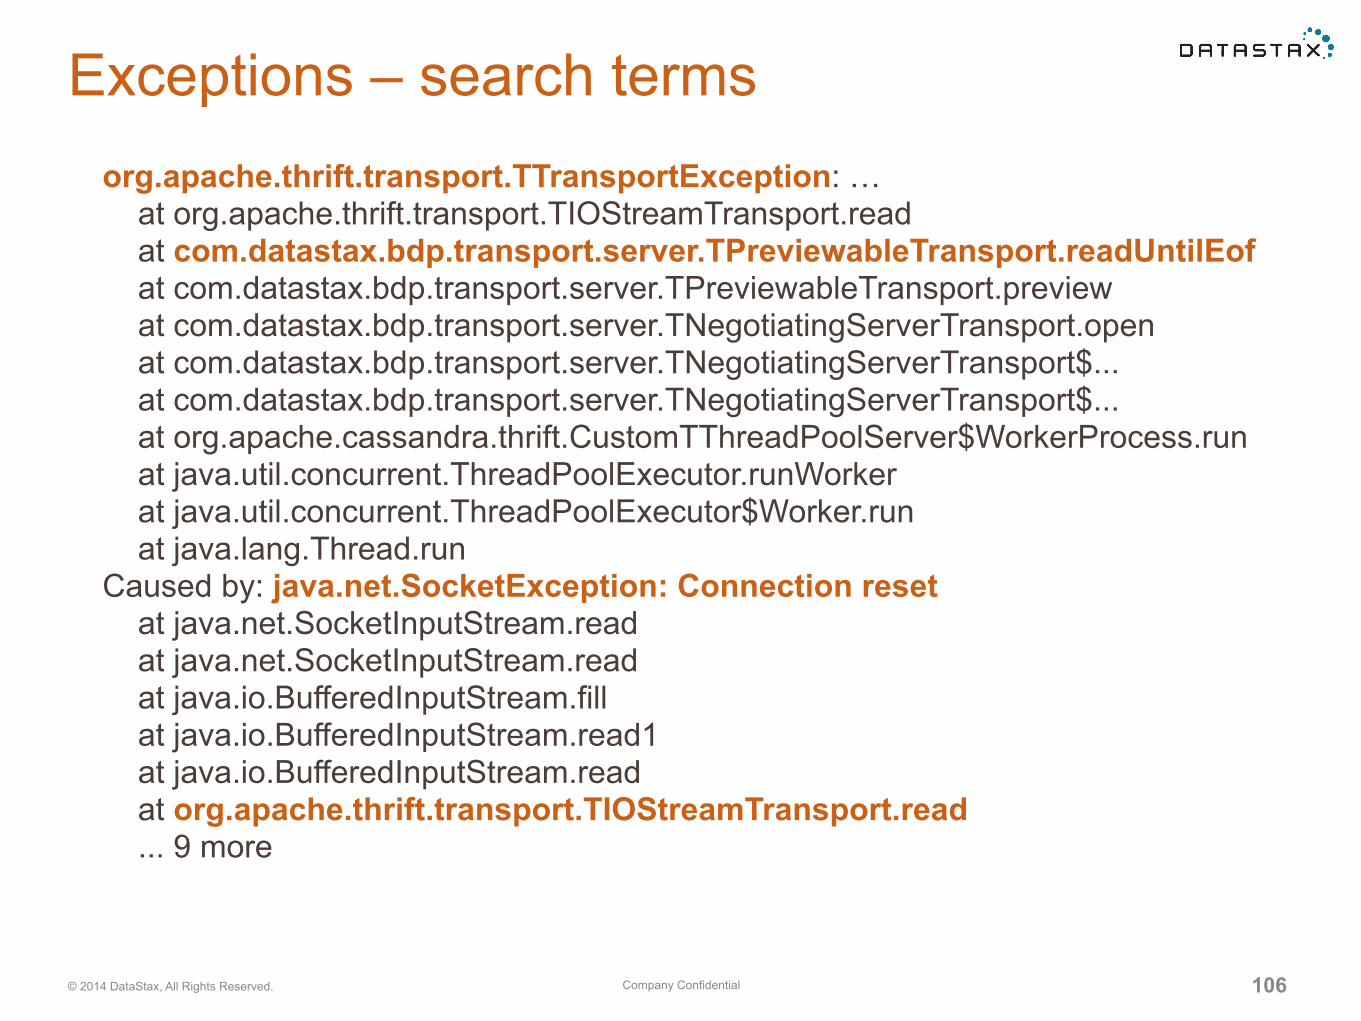
Company Confidential© 2014 DataStax, All Rights Reserved. 106
Exceptions – search termsorg.apache.thrift.transport.TTransportException: … at org.apache.thrift.transport.TIOStreamTransport.read at com.datastax.bdp.transport.server.TPreviewableTransport.readUntilEof at com.datastax.bdp.transport.server.TPreviewableTransport.preview at com.datastax.bdp.transport.server.TNegotiatingServerTransport.open at com.datastax.bdp.transport.server.TNegotiatingServerTransport$... at com.datastax.bdp.transport.server.TNegotiatingServerTransport$... at org.apache.cassandra.thrift.CustomTThreadPoolServer$WorkerProcess.run at java.util.concurrent.ThreadPoolExecutor.runWorker at java.util.concurrent.ThreadPoolExecutor$Worker.run at java.lang.Thread.run Caused by: java.net.SocketException: Connection reset at java.net.SocketInputStream.read at java.net.SocketInputStream.read at java.io.BufferedInputStream.fill at java.io.BufferedInputStream.read1 at java.io.BufferedInputStream.read at org.apache.thrift.transport.TIOStreamTransport.read ... 9 more

Thanks!


![DataStaxODBCdriverforApache ......[DataStax ODBC driver for Apache Cassandra and DataStax Enterprise with CQL connector 32-bit] Description=DataStax ODBC driver for Apache Cassandra](https://static.fdocuments.net/doc/165x107/5ec5d38556938a726220ac95/datastaxodbcdriverforapache-datastax-odbc-driver-for-apache-cassandra-and.jpg)


![DataStaxODBCdriverforApache ......[ODBC Drivers] DataStax ODBC driver for Apache Cassandra and DataStax Enterprise with CQL connector 32-bit=Installed DataStax ODBC driver for Apache](https://static.fdocuments.net/doc/165x107/5f4a5ecf88ed921a2d1ef791/datastaxodbcdriverforapache-odbc-drivers-datastax-odbc-driver-for-apache.jpg)