TROPICAL DEFORESTATION AND ITS IMPACT ON ... DEFORESTATION AND ITS IMPACT ON ENVIRONMENT AND QUALITY...
49
TROPICAL DEFORESTATION TROPICAL DEFORESTATION AND ITS IMPACT ON AND ITS IMPACT ON ENVIRONMENT AND QUALITY ENVIRONMENT AND QUALITY OF LIFE OF LIFE Sharifah Mastura Syed Abdullah & Mastura Mahmud Earth Observation Centre National University of Malaysia
-
Upload
trannguyet -
Category
Documents
-
view
229 -
download
3
Transcript of TROPICAL DEFORESTATION AND ITS IMPACT ON ... DEFORESTATION AND ITS IMPACT ON ENVIRONMENT AND QUALITY...

TROPICAL DEFORESTATION TROPICAL DEFORESTATION AND ITS IMPACT ON AND ITS IMPACT ON
ENVIRONMENT AND QUALITY ENVIRONMENT AND QUALITY OF LIFEOF LIFE
Sharifah Mastura Syed Abdullah & Mastura Mahmud
Earth Observation CentreNational University of Malaysia

2
Presentation OutlinePresentation Outline• Importance and conservation of tropical forests
• Causes of deforestation in Southeast Asia• Rate of deforestation• Drivers of deforestation
• Case study of deforestation in SEA• Research by SEARRIN
• Impacts of deforestation
• Conclusion
3
IntroductionIntroduction• In the 1990’s land use and land cover (LUCC)
dynamics have been recognised as a key research imperative in global environmental change research.
• LUCC has been blamed for causing serious modification of the land surfaces on earth.
• Understanding LUCC and the factors that drive them are thus of utmost importance for understanding, modelling and predicting global environmental change. This knowledge can be utilised in managing and responding to the change in a most positive way that would benefit mankind.
4
Importance of tropical forestsImportance of tropical forests• Tropical forests are homes to almost 50% of the
world’s species
• Forests help mitigate the impacts of global warming
• Forests are important as they play a role in the water recycle process and help balance the oxygen amount
• Many thousands of plants have been identified possessing anti-cancer properties
• Tropical forests provide precious wood for furniture, lumber and firewood; and
• Forests provide jobs and income for the people who live around them.

5
The extent of global tropical forests

6
Conservation of Tropical ForestsConservation of Tropical Forests• Tropical forests are rich in biodiversity with unique
and endangered species which are alive with the sounds of birds and animals.
• Tropical forests also play crucial roles for humans. They provide water, food, medicines, shelter and sources of livelihood for the communities that live in and around them.
• The forests also provide important environmental services for the planet. For instance, they function as temperature regulators by absorbing and storing carbon dioxide, and helps mitigate the impacts of global warming.
• Unfortunately, the fragile tropical ecosystem is under threat from deforestation, improper agricultural practices, tourism, development and forest fires.
7
The Tropical RainforestThe Tropical Rainforest• Rainforest in its natural state or dynamic equilibrium comprise
a mosaic of aging trees, clearing caused by storms, landslides, lightning or human activity with regenerating seedlings and area of mature and immature trees.
• They are genetically far more diverse with 50 to 200 or more tree species per hectare.
• Southeast Asia, with only 0.5% of the earth’s total land area probably has 10% of all the plant species.
• The fast pace of tropical deforestation occurring in Southeast Asia has challenged the very existence of the forests in the future if no serious efforts are taken to combat them.

8
Extent of Tropical DeforestationExtent of Tropical Deforestation
• The estimates of rainforest cover in nine countries in South East Asia (WRI, 1999):
• Indonesia with the largest land area of 181.16 million ha, recorded 94 million ha of rainforest cover and subjected to 1% annual change rate from 1981-1990.
• Malaysia has 16 million ha of rainforest but recorded higher change rate of 1.8%.
• Philippines and Thailand recorded highest annual change rate of 3.1% and 3.3% respectively.
• For the other countries the annual change rate of forest range from 0.4% to 1.4%.

9
Rainforest Cover & Annual Percent Change in SEA
0
10000
20000
30000
40000
50000
60000
70000
80000
90000
100000
Indones
iaMala
ysia
Myanmar
Laos
Phiipp
inesTha
iland
Vietna
mCam
bodia
Brune
i
Countries
Are
a (h
a)
0
0.5
1
1.5
2
2.5
3
3.5
haPercent

10
Satellite data analysis of forest areas and the Satellite data analysis of forest areas and the rate of deforestation in Southeast Asiarate of deforestation in Southeast Asia
1.371416.4998.21114.70Total
0.3283.8844.8248.71Myanmar
0.31193.7716.1519.92Vietnam
0.49265.8116.7422.56Thailand
0.15101.7616.5218.28Laos
0.11241.273.985.25Cambodia
Deforestation Rate Per
Year
% ChangeForest Area Change
Forest Area in 1985
Forest Area in
1973
Country

11
Discrepancies of forest statisticsDiscrepancies of forest statistics• Problems in documenting rainforest statistics differ in
different countries. United Nation bodies also derive their data from government statistics which in many cases register larger areas of forest.
• There is obviously lack of geographically reference data at high spatial resolution and derived from a single consistent method for the whole of Southeast Asia.
• Other areas of data difficulties include, distinguishing rates of new deforestation, abandonment and regrowth.
• Currently, the best method is via the use of satellite remote sensing method as it can resolve discrepancies in data output and spatial variations in rainforest cover statistics.

12
Tropical DeforestationTropical Deforestation• Definition of deforestation
Mather et al (1998) summarise it as:• ‘…The study of the causality of trend in forest cover…does
not readily yield the simplicity and elegance of explanation that would reward the ideal scientific endeavour. In the real word of human-driven change in land and land cover there are numerous problems and difficulties that confound such an endeavour. The field cannot be successfully tilled as a disciplinary preserve, and neither reductionism nor holism alone seems to offer the approach necessary for success’.

13
Tropical DeforestationTropical Deforestation
• Tropical deforestation includes both quantitative loss of woody vegetation as well as qualitative changes such as loss or reduction in species biodiversity.
• There are various degrees of tropical deforestation ranging from reductions in vigour and/or species diversity to a decline in regeneration, in the changes such as in species diversity, thinning altered regeneration or resistance to pest, diseases and invasion of undesirable species.
• Among the impacts of tropical deforestation are the altered local or regional hydrology, altered climate and serious environmental problems such as flood damage and siltation.

14
Annual Rate of DeforestationAnnual Rate of Deforestation
31610124 198726Philippines
51533328 198833Thailand
137652630Vietnam
401964447Burma
3962305463Malaysia
1291255758Laos
1,2125506161Indonesia
131156970Kampuchea
1981-901976-8019901980
Annual Deforestation Rates (1,000 ha/yr)
National Land AreaCovered By Forest (%)
Country
15
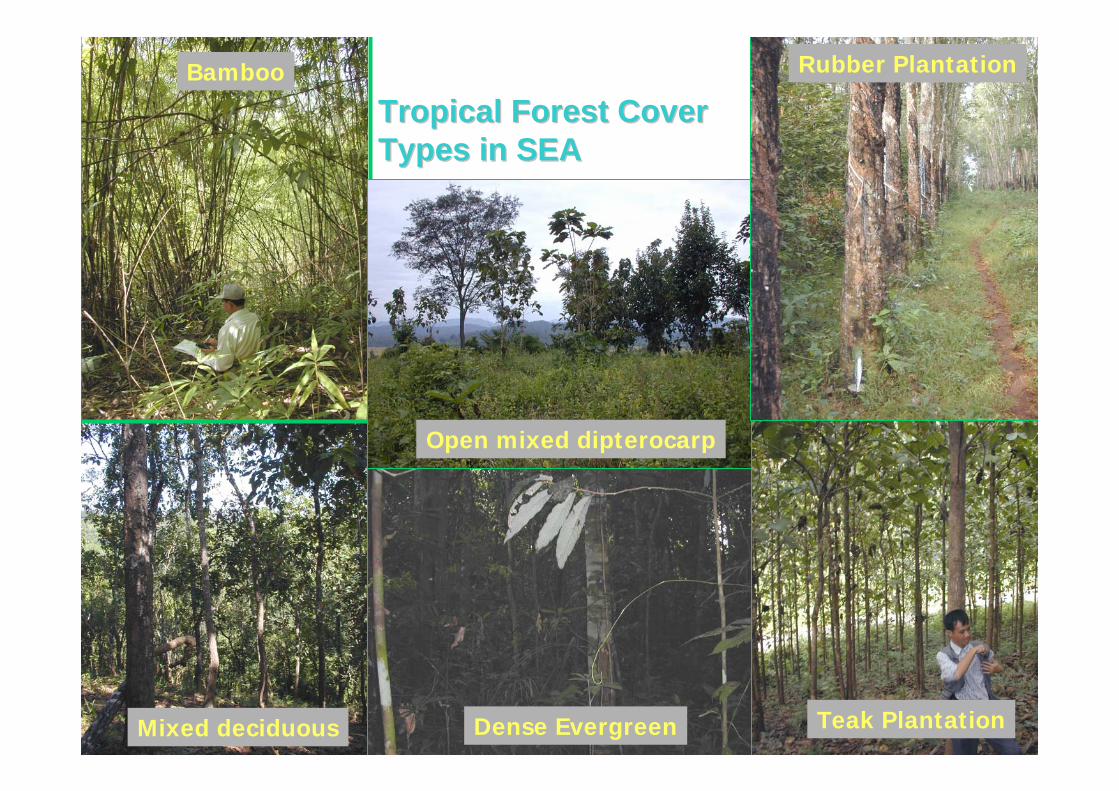
Tropical Forest Cover Tropical Forest Cover Types in SEATypes in SEA
Bamboo
Mixed deciduous Dense Evergreen Teak Plantation
Rubber Plantation
Open mixed dipterocarp

16
Drivers of DeforestationDrivers of Deforestation• Understanding the drivers of tropical deforestation
is not a straightforward case. For example in LUCC research, key questions have been to seek answers to what seems to be simple questions.
• These questions are:How much forest is lost in the study area over 10 year time period?What are the factors that cause forest to change to other land uses?What is the trend of future changes?
17
ContinueContinue• The causes attributed to deforestation are multivariate in
nature, interrelated and differ at local, national as well as regional scale.
• The drivers of tropical deforestation can be summed up as complex socio-economic processes that are impossible to isolate a single cause.
• It consists of a complex of social, political, economic, technological and cultural variables that constitute initial conditions in the human-environmental relations that are structural (or systematic) in nature.
• In terms of spatial scale, underlying drivers may operate directly at local level or indirectly from the national or global level.

18
Actions and factors in deforestationActions and factors in deforestation
3 clusters are involved in deforestation are:a) Proximate causes: Agricultural expansion
Wood extraction Expansion of infrastructure
b) Underlying causes: DemographicEconomicTechnologicalPolicy/ institutionalCultural or socio- political factors

19
ContinueContinue
c) Other factors (land characteristics, biophysical drivers, and social trigger events)
Land characteristicsBiophysical environmentWarHealth and economic crisis Government policy failures

20
(i) Population pressures(i) Population pressures
0.090.250.300.4232.55129.8110.177.929.95Vietnam
0.350.700.740.8651.0972.969.159.620.01Thailand
0.140.230.280.4129.82130.5105.272.120.99Philippines
0.230.810.971.3865.7680.967.647.617.83Myanmar
0.390.861.041.5332.8638.131.621.46.11Malaysia
0.191.662.264.3123.0813.910.25.31.76Laos
0.390.831.041.6417.6521.416.910.74.34Kampuchea
0.160.570.60.88181.16
318.3275.2206.579.54Indonesia
2050202520002050202520001950
Per Capita Crop Land,
2000
Per Capita Land (ha/person)
Land (106
ha)
Population (million)Country
Past and Projected population and land area in Southeast Asia

21
((ii) Improved infrastructure and utilities networkii) Improved infrastructure and utilities network
• Analyses of land use and road maps in the Philippines and Malaysia show that the closer the forest to the road the higher the rate of deforestation.
• 78% of the 2.1 million ha of forest within 1.5 km from the roads in 1934 was removed by 1988. On the other hand only 39.5% of forest between 15.0 and 16.5 km from the road were lost.
• In Malaysia, LUCC study showed that a kilometre increase in the distance of a pixel from a road network reduces the odds of forest clearing by a factor of 0.68.
• This means that access to road network increases the probability of land being cleared for other uses. Lambin and Giest (2001) showed that extension of infrastructure in combination with other proximate causes explained 110 out of 152 cases of deforestation (72%).

22
(iii)(iii) Land settlement schemeLand settlement scheme
• In Malaysia, land development scheme entails the conversion of forest into smallholdings. The scheme was carried out to alleviate poverty, overdependancy on rubber, ethnic and rural-urban disparity.
• The government implemented a drastic scheme to provide public assistance to the poor so that they are directly involved and benefit from the exploitation and development of the resources of the country.
• Between 1971-1980, 866,058 ha of forestland were cleared for agriculture. In 1980’s a further 647,374 ha were cleared for land development.
• A further 180,750 ha were cleared up to year 2000 (EPU 2000, 6th Malaysia Plan). The large conversion of forestland to agriculture has generated financial and economic returns and socio-economic benefits to the country. Poverty was reduced drastically at the expenses of the rainforest.
23
(iv) Large scale commercial agriculture(iv) Large scale commercial agriculture• In Southeast Asia, 80% of forest conversion is to agriculture.
• In 1980’s, 30% of the cultivated land area in the Philippines was converted to cash crop production for export of mainly bananas, pineapples and sugar cane.
• In the island of Negros, forest decreases by 20,000 ha which is gained by sugar estate that produce 68% of the Philippines sugar crop.
• In Thailand, between1973-1982, cassava exports to EEC rose from 1.5 million tons to 8 million tons. Other major plantationsinclude oil palm, peanuts, rubber and soybeans.
• In Peninsular Malaysia, between 1966-1990, plantation agriculture increased from 2.7 million ha to 4.7 million ha. Allagricultural gains were at the expense of forest land.

24
(v) Commercial logging, demand for timber, (v) Commercial logging, demand for timber, woodchips, pulps and forest productswoodchips, pulps and forest products
• In Malaysia, from 1986-1990, the annual felling rate of log increased by 5.8% to reach 41 million cu m in 1990, 43.5 million cu m in 1992 and 35 million in 1995 (a drop of 20% production in 3 years).
• Export of wood and wood based products in 1991 was RM 9.3 billion and 43% of it was logwood. Malaysia is the largest exporter of tropical hardwood logs in 1991. Sarawak accounted for 15.7 million cu m of log exported and the remaining was from Sabah.
• The government of Malaysia has banned export of logs. Downstream processing of wood based industry was encouraged. This is an attempt to reduce deforestation and damage due to the tropical rainforest. In Indonesia in 1985, 40% of the forestland was leased to timber companies for economic purposes.

25
(vi) Other factors(vi) Other factors• Shifting cultivation, which is associated to poverty
is the primary agent that brought about 40% to 95% of forest loss.
• Poverty represents demographic, economic, technological policy and institutional meanings namely resource-poor farming, survival economies, insufficient food production, chronic food deficit, limited land endowment, land scarcity, landlessness, low living standard, joblessness, social deprivation, and marginalization.

26
• In Southeast Asia poverty is an underlying social process of deforestation in 42% of the cases.
• As proximate factors, about half of the poverty-driven cases are associated with traditional and shifting cultivation, permanent small holder and subsistence farming.
• 80% of the poverty-driven cases are related to human factor under the sections of population dynamics and land scheme policy.

27
Example: hydroelectricity damsExample: hydroelectricity dams
• The forest is also under increasingly threat as Southeast Asian countries build hydroelectricity dams in rainforest areas such as the Kenyir and Bakun Dam (69, 500 ha) in Malaysia.
• No mitigating measures and reforestation programmes taken could compensate for the loss of pristine tropical forest.
• The net downstream impacts include degradation of the forest, erosion, water pollution and reduction on aquatic life, habitat fragmentation, reduction of habitat diversity and loss of regional biodiversity.
• Two totally protected species, 68 protected species of plant, 1,230 species of significant plants were lost. It is estimated that an annual cost of displacement of forest resources ranges from RM10 to 22 billion.

28
DEFORESTATION IN SOUTHEAST ASIA: LUCC DEFORESTATION IN SOUTHEAST ASIA: LUCC CASE STUDYCASE STUDY
• Southeast Asia Regional Research Network (SEARRIN) had involved in land use and land cover change research since 1976. Among the research activities are:
• Developing case studies to determine deforestation dynamics.
• Determining whether annual rates of deforestation have been significantly different from the decadal mean rate over 16 selected study areas.
• Developing diagnostic models of the deforestation process to better understand and quantify the deferential controls on the rate of deforestation and abandonment .

29
Site:1. Klang-Langat (10 yrs) 9. Mae Chaem (9 yrs)2. Kayan-Sempadi (10 yrs) 10. Lin Thin (11 yrs)3. Citarum (12 yrs) 11. Phusithan (10 yrs)4. East Kalimantan 1 (5 yrs) 12. Eastern Forest (11 yrs)5. East Kalimantan 2 (5 yrs) 13. Ao Sawi (11 yrs)6. Jambi (6 yrs) 14. Tamdao (24 yrs)7. Magat (9 yrs) 15. Kg. Cham (13 yrs)8. Puerto Princesa (10 yrs) 16. Nam Thuen (3 yrs)
SITES
-28.5
-15.38
5.951.75
-38.08
25.84
-10.4
-23.85
-0.002
-19.49
-2.38-1.98
9.52
-20.85-20.8
35.56
-50-40-30-20-10
010203040
1 2 3 4 5 6 7 8 9 10 11 12 13 14 15 16
FOREST LAND USE FOR 16 SITES
PERC
ENTA
GE (%
)

30
Significant Socioeconomic
variables
Population Dynamic Variables
54.5%
Agriculture & Economic Variables
18.2%
Economic Variables
13.6%
Policy Variables
9.1%
Road NetworkVariables
4.5%

31
Driving Forces of ChangeDriving Forces of Change
Population structurePopulation ageNumber of households with pick up trucksNumber of shopsNumber of rice millsNumber of households practising agriculture
Thailand
Number of households using charcoal as fuelNumber of households using wood as fuelFarm sizeLiteracy ratesAreas planted with permanent cropRural populationAreas planted with temporary cropsWoodland and forest in farm areas
Philippines
Rate growth in the number of school going childrenChange in the total number of school going childrenNumber of industrial establishments
Indonesia
Road distance from forest areasLand classes suitabilityPopulation densityAgricultural employmentForest reserve and non reserve areas
Malaysia
VariableCountry

32
Land use changes in Malaysia, Indonesia, VietnamLand use changes in Malaysia, Indonesia, Vietnam
1989-1999
1989-1998
1975-1999

33
Impact of tropical deforestationImpact of tropical deforestation
0102030405060708090
100
Burma
Indones
iaKam
puch
ea
Laos
Malays
iaPhilip
pinesThail
and
Vietna
m
Perc
ent (
%)
0
200,000
400,000
600,000
800,000
1,000,000
1,200,000
1,400,000
1,600,000
Are
a (k
m2 )
Habitat Loss (%)Original Wildlife Habitat (km2)Amount Remaining (km2)
Source: IUCN/UNEP, 1986

34
Landsat TMImage at offshoreOf the Klang riverIn Selangor,Malaysia
Soil erosion and sedimentation

35
Soil erosion and sedimentationSoil erosion and sedimentation
Total Suspended Sediment (mg/l)
160140120100806040200
Dig
ital P
ixel
Val
ue
100
80
60
40
20
0
band 1(0.45-0.52um)
band 2(0.52-0.60um)
band 3 (0.63-0.69um)
Satellite analysis on suspended sedimentsat the Klang river inSelangor, Malaysia.
Landsat TM bands 1,2, 3 showed 2 clusters:Bands 1 and 2 & 3.
High DN values Correspond to highTotal suspendedSediments.

36
• Excessive depositions of sediments in rivers and offshore can smother bentic organisms and cause shallowing effects.
• In the case of Klang and Langat rivers in Malaysia, depositions reduced storage capacity due to bottom deposition. Expensive dredging or frequent removal of the sediment were done.
• The river beds of lower reaches of Klang-Langat would be raised gradually and increase the frequency of downstream flooding.
• Approximately 1000,000 m3 sediments have been removed in the upstream reaches of Klang River.
• About 200,000 m3 and 400,000 m3 of silt have been removed from Batu River and Gombak River respectively. It was estimated that the silt removed from major tributaries of the Klang River amounted to approximately 300,000 m3 per annum.

37
Deforestation and the greenhouse effectDeforestation and the greenhouse effect• Deforestation and carbon emission effects have been
extensively documented.
• Forest absorbed carbon dioxide but deforestation adds considerable quantities of carbon dioxide to the atmosphere.
• Deforestation contributes between one 25% to 50% of the five billion tons released from burning of fossil fuel.
• The release of carbon attributed to land cover conversion is a major biogenic source of carbon in Southeast Asia.
• The current net flux of carbon from land cover conversion in the tropics is expected to rise if deforestation issues are not abated.

38Source: FAO-Global Resources Assessment 2005; Canadell et al. 2007, PNAS
Tropical Americas 0.6 Pg C y-1
Tropical Asia 0.6 Pg C y-1
Tropical Africa 0.3 Pg C y-1
2000-2005
Tropical deforestation13 Million hectares each year
Anthropogenic C Emissions: Land Use ChangeAnthropogenic C Emissions: Land Use Change
1.5 Pg C y-1
Born
eo, C
ourte
sy: V
iktor
Boe
hm
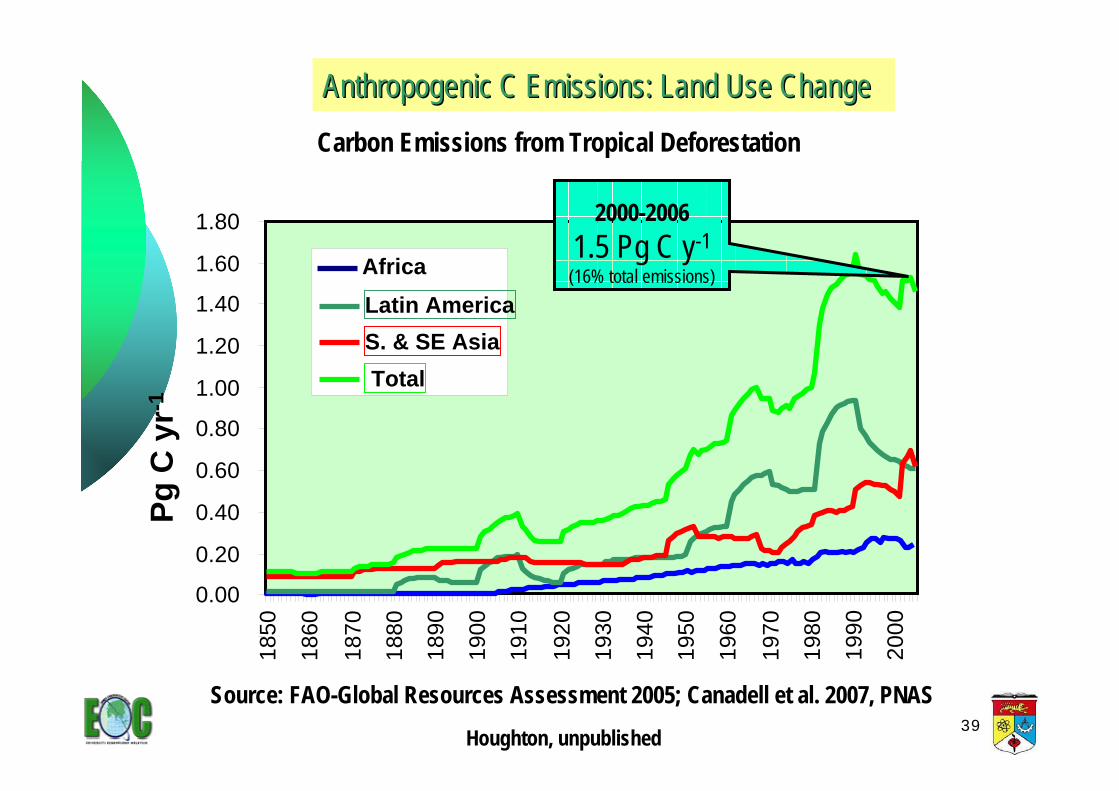
39Houghton, unpublished
Carbon Emissions from Tropical DeforestationPg
C y
r-1
0.00
0.20
0.40
0.60
0.80
1.00
1.20
1.40
1.60
1.80
1850
1860
1870
1880
1890
1900
1910
1920
1930
1940
1950
1960
1970
1980
1990
2000
AfricaLatin AmericaS. & SE Asia
Anthropogenic C Emissions: Land Use ChangeAnthropogenic C Emissions: Land Use Change
Total
2000-20061.5 Pg C y-1(16% total emissions)
Source: FAO-Global Resources Assessment 2005; Canadell et al. 2007, PNAS

40
Forest fires & transboundary hazeForest fires & transboundary haze• In Southeast Asia, uncontrolled burning from the large-scale
land clearing processes can result in transboundary haze, poor visibility and the degradation of the local air quality between the neighbouring countries.
• The haze events appear to be an annual event during the burning season, which occur from June to October.
• The 1997 haze caused by the forest fires in Indonesia was one of the notable events that caught the world’s attention due to its magnitude and its coincidence with the dry major El Nino event.

41
Forest fires at Doi Inthanon National Park, 21 February 2004, Thailand
in mixed deciduous forest

42
Greenhouse gas emitterGreenhouse gas emitter• Indonesia is rated as the world’s top three greenhouse gas
emitters in the world from land use change and deforestation, significantly by the release of carbon dioxide from deforestation.
• Deforestation and land conversion are the largest sources of emissions of the greenhouse gases, with forest fires accounting for 57% of the contribution.
• Indonesia has maintained its position as one of the top twenty emitters of greenhouse gases from land-use, land use change and forestry since 2000.
• This is due to the very large stock of carbon stored in the vegetation and soil that amounted to approximately 24 billion tons, and where deforestation accounts for 85% of the annual emissions of GHG in Indonesia.

43
FFPMPII PROJECT (JICA-PHKA: Indonesia & Japan)
March 2002 July 2002 August 2002
August 1997 September 1997 October 1997
44
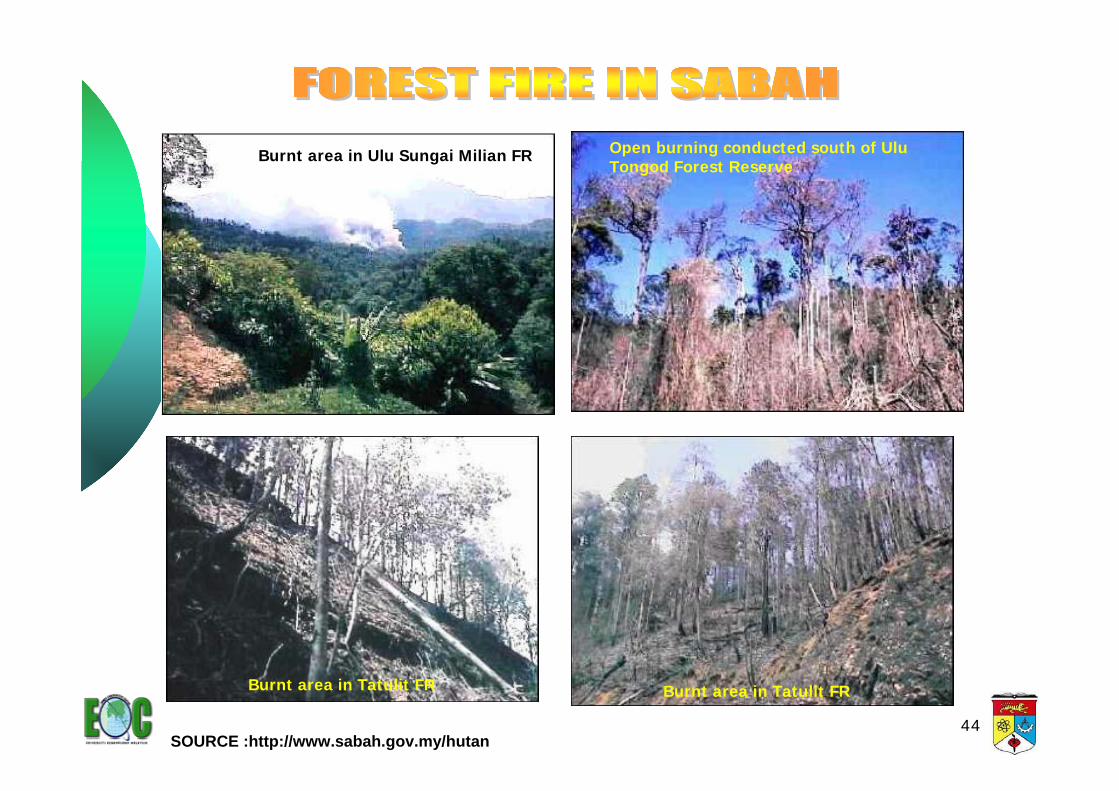
Burnt area in Tatulit FRBurnt area in Tatulit FR
Burnt area in Ulu Sungai Milian FR Open burning conducted south of UluTongod Forest Reserve
SOURCE :http://www.sabah.gov.my/hutan

45
Total hotspots in August 2005Total hotspots in August 2005Hotspots from MODISDuring August 2005

46

47
Estimates of gases and particulates in Aug 2005Estimates of gases and particulates in Aug 2005
-1.00E+07
1.00E+07
3.00E+07
5.00E+07
7.00E+07
9.00E+07
1.10E+08
1.30E+08
TSP CO NOx SOx TSP (<2.5mm)
Tons
Sumatera UtaraSumatera SelatanSumatera BaratRiauLampungJambiBengkulu Aceh
48
ConclusionConclusion• The dynamics of tropical deforestation are very complex. It
is multivariate in nature that are made up of interrelationship between proximate as well as underlying factors.
• The multivariate causes in tropical deforestation make it extremely difficult to develop a widely accepted and applicable policy that can manage the issues of deforestation.
• Current policies introduced to manage deforestation are often simplistic on the drivers of change or only understood part of the process.
• Therefore, any attempt to control and manage deforestation must be prepared to invest on the understanding of the causal factors.
• It is imperative that commitment and willpower of the people and decision makers be made for the survival of humans in the light of global warming.

49
TERIMA KASIHTERIMA KASIHTHANK YOUTHANK YOU
ARIGATOARIGATO