Tropical Cyclone Report Tropical Storm Grace 27 November … · Tropical Cyclone Report Tropical...
15
-1- Tropical Cyclone Report Tropical Storm Grace 30 August - 2 September 2003 Stacy R. Stewart National Hurricane Center 27 November 2003 Tropical Storm Grace was a short-lived tropical cyclone that developed over the western Gulf of Mexico. Grace moved inland along the upper Texas coast and produced little damage. a. Synoptic History A strong tropical wave, accompanied by a vigorous low pressure system, moved off the west coast of Africa on 19 August. Both conventional satellite data and QuikSCAT microwave wind data indicated that the wave came close several times over the next few days to developing into a tropical cyclone. Convection became most pronounced on 21 August when some outer banding features and a circular cirrus outflow pattern briefly developed. However, the rapid westward motion, exceeding 20 kt at times, may have disrupted the low-level circulation enough to prevent the convection from becoming concentrated near the center. The system also moved through a mid- to upper-level region of very dry air over the central tropical Atlantic, and by late on 22 August nearly all of the convection had dissipated. As the pre-Grace wave continued its westward trek, a second convective development phase occurred when the system slowed as it moved across the Lesser Antilles on 24-25 August. However, southwesterly upper-level shear ahead of a large upper-level trough located to the west disrupted the development process. Devoid of significant convection, the wave moved west-northwestward at 6-8 kt until it reached the northwestern Caribbean Sea on 28 August, when deep convection re-developed along the wave axis. When the tropical wave crossed the northern Yucatan Peninsula on 29 August, a broad low pressure area re-developed along the wave axis as it turned northwestward toward the Texas coast. While there was an abundance of deep convection associated with this system, the disturbance remained poorly organized until later that day when satellite classifications were initiated by the Tropical Analysis and Forecast Branch (TAFB) and the Satellite Analysis Branch (SAB). Convective organization continued to improve during the early morning hours of 30 August, and surface observations in conjunction with satellite intensity estimates indicated that tropical Depression Eleven had formed about 290 n mi east-southeast of Corpus Christi, Texas. The “best track” chart of the tropical cyclone’s path is given in Fig. 1, with the wind and pressure histories shown in Figs. 2 and 3, respectively. The best track positions and intensities are listed in Table 1. The depression initially showed some signs of interaction with an upper-level cold low, but this was short-lived and subsequent reconnaissance flights indicated that the cyclone was mostly tropical in nature. More specifically, a reconnaissance flight at 2125 UTC 30 August indicated the depression had likely strengthened into Tropical Storm Grace around 1800 UTC about 245 n mi east- southeast of Corpus Christi, Texas. The upper-low situated a few hundred miles to the west of Grace
Transcript of Tropical Cyclone Report Tropical Storm Grace 27 November … · Tropical Cyclone Report Tropical...
-1-
Tropical Cyclone ReportTropical Storm Grace
30 August - 2 September 2003
Stacy R. StewartNational Hurricane Center
27 November 2003
Tropical Storm Grace was a short-lived tropical cyclone that developed over the western Gulfof Mexico. Grace moved inland along the upper Texas coast and produced little damage.
a. Synoptic History
A strong tropical wave, accompanied by a vigorous low pressure system, moved off the westcoast of Africa on 19 August. Both conventional satellite data and QuikSCAT microwave wind dataindicated that the wave came close several times over the next few days to developing into a tropicalcyclone. Convection became most pronounced on 21 August when some outer banding features anda circular cirrus outflow pattern briefly developed. However, the rapid westward motion, exceeding20 kt at times, may have disrupted the low-level circulation enough to prevent the convection frombecoming concentrated near the center. The system also moved through a mid- to upper-level regionof very dry air over the central tropical Atlantic, and by late on 22 August nearly all of the convectionhad dissipated.
As the pre-Grace wave continued its westward trek, a second convective development phaseoccurred when the system slowed as it moved across the Lesser Antilles on 24-25 August. However,southwesterly upper-level shear ahead of a large upper-level trough located to the west disrupted thedevelopment process. Devoid of significant convection, the wave moved west-northwestward at 6-8kt until it reached the northwestern Caribbean Sea on 28 August, when deep convection re-developedalong the wave axis. When the tropical wave crossed the northern Yucatan Peninsula on 29 August,a broad low pressure area re-developed along the wave axis as it turned northwestward toward theTexas coast. While there was an abundance of deep convection associated with this system, thedisturbance remained poorly organized until later that day when satellite classifications were initiatedby the Tropical Analysis and Forecast Branch (TAFB) and the Satellite Analysis Branch (SAB).
Convective organization continued to improve during the early morning hours of 30 August,and surface observations in conjunction with satellite intensity estimates indicated that tropicalDepression Eleven had formed about 290 n mi east-southeast of Corpus Christi, Texas. The “besttrack” chart of the tropical cyclone’s path is given in Fig. 1, with the wind and pressure historiesshown in Figs. 2 and 3, respectively. The best track positions and intensities are listed in Table 1.
The depression initially showed some signs of interaction with an upper-level cold low, butthis was short-lived and subsequent reconnaissance flights indicated that the cyclone was mostlytropical in nature. More specifically, a reconnaissance flight at 2125 UTC 30 August indicated thedepression had likely strengthened into Tropical Storm Grace around 1800 UTC about 245 n mi east-southeast of Corpus Christi, Texas. The upper-low situated a few hundred miles to the west of Grace
-2-
was forecast by most of the various numerical models to move quickly westward. However, this didnot occur and, as a result, persistent southerly to southwesterly upper-level shear prevented the deepconvection from organizing around the low-level circulation. While remaining broad and somewhatdisorganized, Grace moved northwestward on 31 August at a faster forward speed of about 15 kt.
Due to the broad low-level inner wind field, it was difficult to pinpoint the exact location ofGrace in satellite imagery and by reconnaissance aircraft. In addition, a large surface high pressuresystem located over the southeastern United States was strengthened the pressure gradient and thelow-level wind field for several hundred miles northeast of the center. Grace was forecast to moveinland in the vicinity of Corpus Christi, Texas. However, the long fetch of strong southeasterly windsand cyclonic shear, in conjunction with several bursts of deep convection east of the original low-level center, may have caused the spin up of a new center about 100 n mi farther to the north. Thisnew circulation center of Grace moved inland near San Luis Pass, Texas on the southwestern tip ofGalveston Island at 1100 UTC 31 August 2003 with 35-kt winds. The original circulation weakenedand eventually dissipated before it made landfall. Grace continued to move northwestward andquickly weakened back to a tropical depression shortly after making landfall. Tropical DepressionGrace turned northward over northeastern Texas on 1 September and merged with a frontal zonenear the Arkansas-Oklahoma border early on 2 September.
b. Meteorological Statistics
Observations in Tropical Storm Grace (Figs. 2 and 3) include satellite-based Dvoraktechnique intensity estimates from the Tropical Analysis and Forecast Branch (TAFB), the SatelliteAnalysis Branch (SAB) and the U. S. Air Force Weather Agency (AFWA), as well as flight-leveland dropwindsonde observations from flights of the 53 Weather Reconnaissance Squadron of therd
U. S. Air Force Reserve Command.
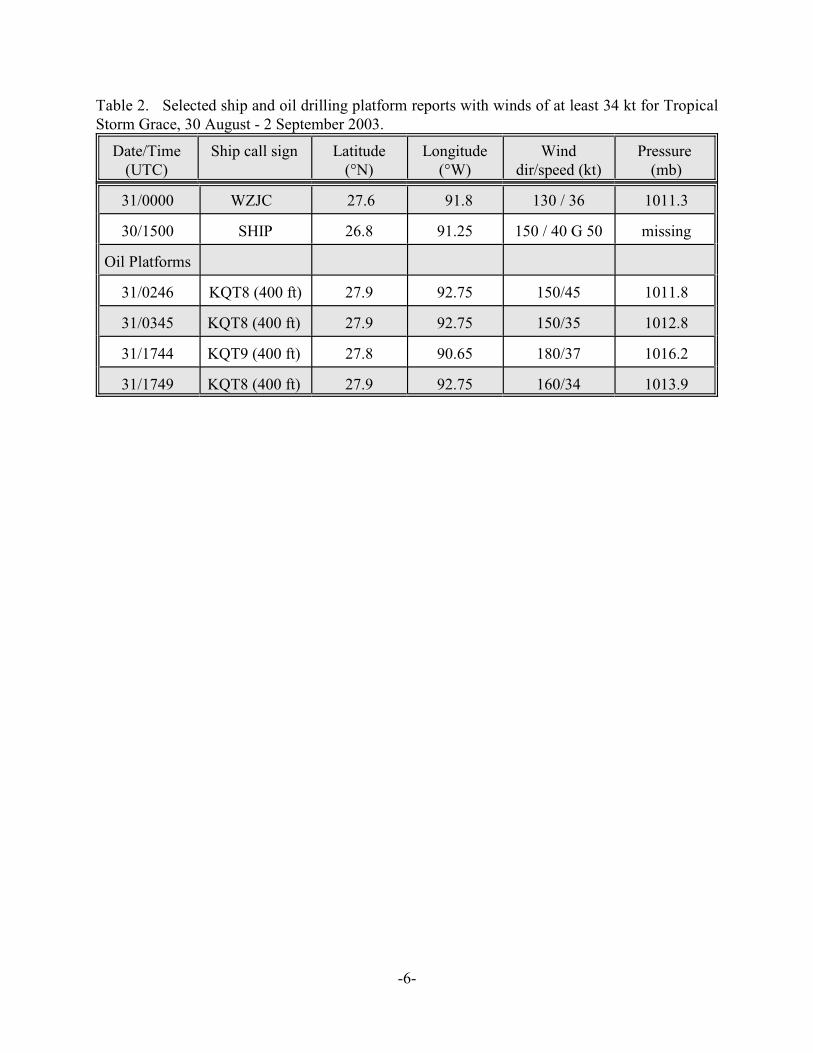
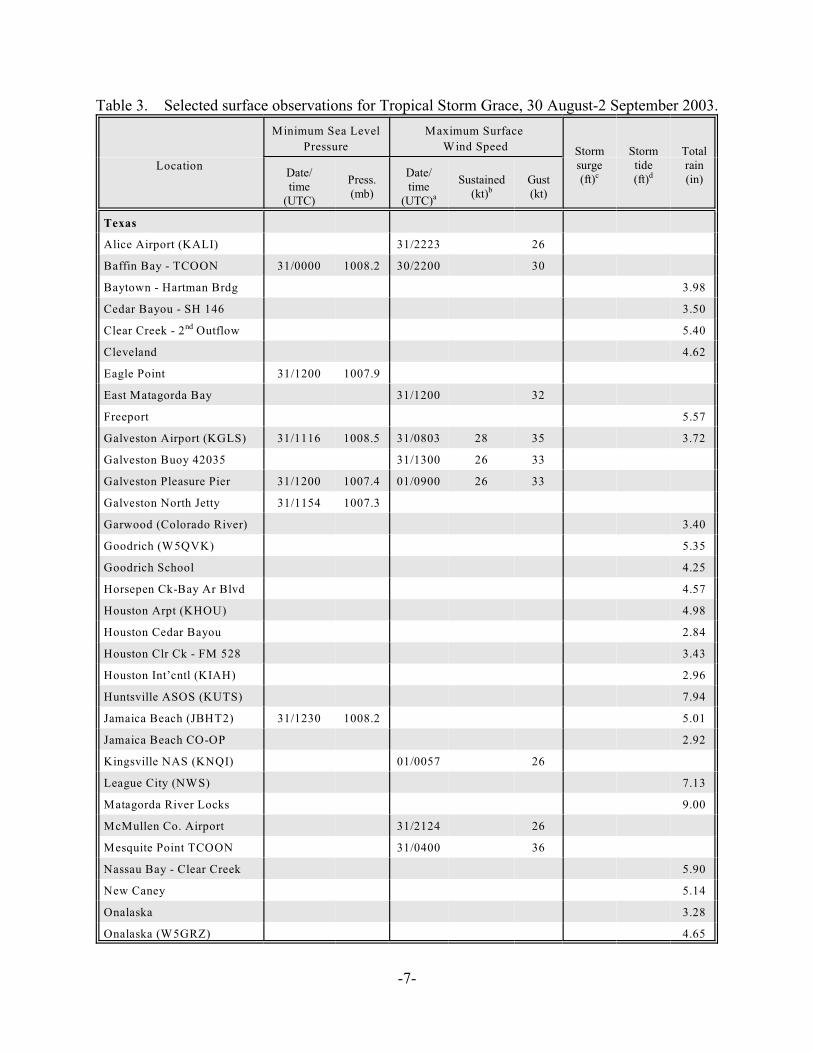
Two ships reported tropical storm force winds associated with Grace. Several oil drillingplatforms also observed tropical storm force winds, but these measurements were made severalhundred feet above the surface. The ship and oil platform reports of winds of tropical storm forceassociated with Grace are given in Table 2. Selected surface observations from land stations and databuoys are given in Table 3.
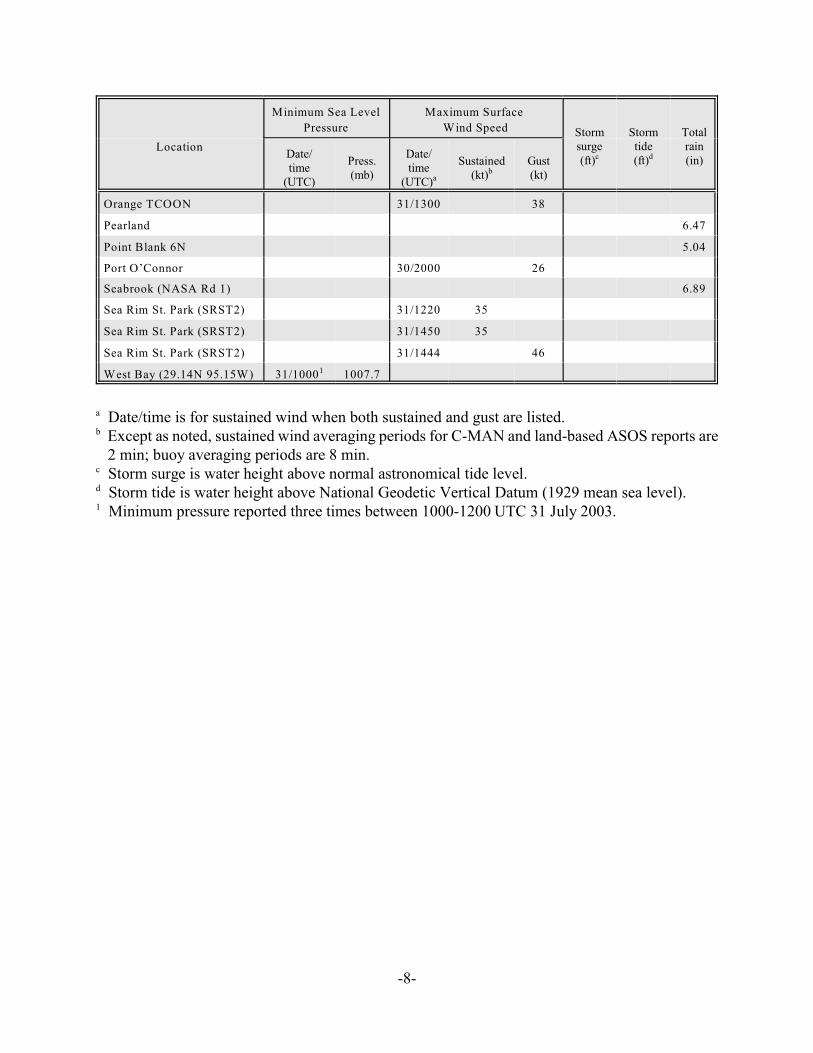
Grace's peak intensity of 35 kt was based on a blend of a reconnaissance 1500 ft flight-levelspot wind report of 43 kt, which converts to a surface wind value of approximately 34 kt, and twosustained 35-kt wind reports from the Sabine Pass (Sea Rim State Park – SRST5), Texas C-MANstation at 1000 UTC and 1200 UTC 31 August 2003. The 35-kt surface wind reports at Sabine Passwere also used to support the 35 kt intensity at landfall.
Maximum storm surge values were generally around 1-2 ft along the upper Texas coast,primarily on Galveston Island, and produced minimal effects.
Rainfall totals across the Houston metropolitan area and the upper Texas coast were in the3 to 5 in range with some isolated reports in excess of 9 in. Grace’s relatively fast forward speed of10-15 kt during and after landfall helped to minimize the heavy rainfall and flash flood threattypically associated with landfalling tropical cyclones.
All forecast verifications in this report include the depression stage of the cyclone. 1
National Hurricane Center verifications presented in these reports prior to 2003 did not includethe depression stage.
-3-
No tornadoes were reported.
c. Casualty and Damage Statistics
The main effect associated with Tropical Storm Grace was isolated heavy rainfall and someinland freshwater floods across the upper Texas coastal area, north of where the center of Gracemade landfall.
No deaths or casualties were reported in association with Grace. No monetary damagefigures are available and insured losses did not meet the $25 million threshold in order to berecorded by the American Insurance Services Group.
d. Forecast and Warning Critique
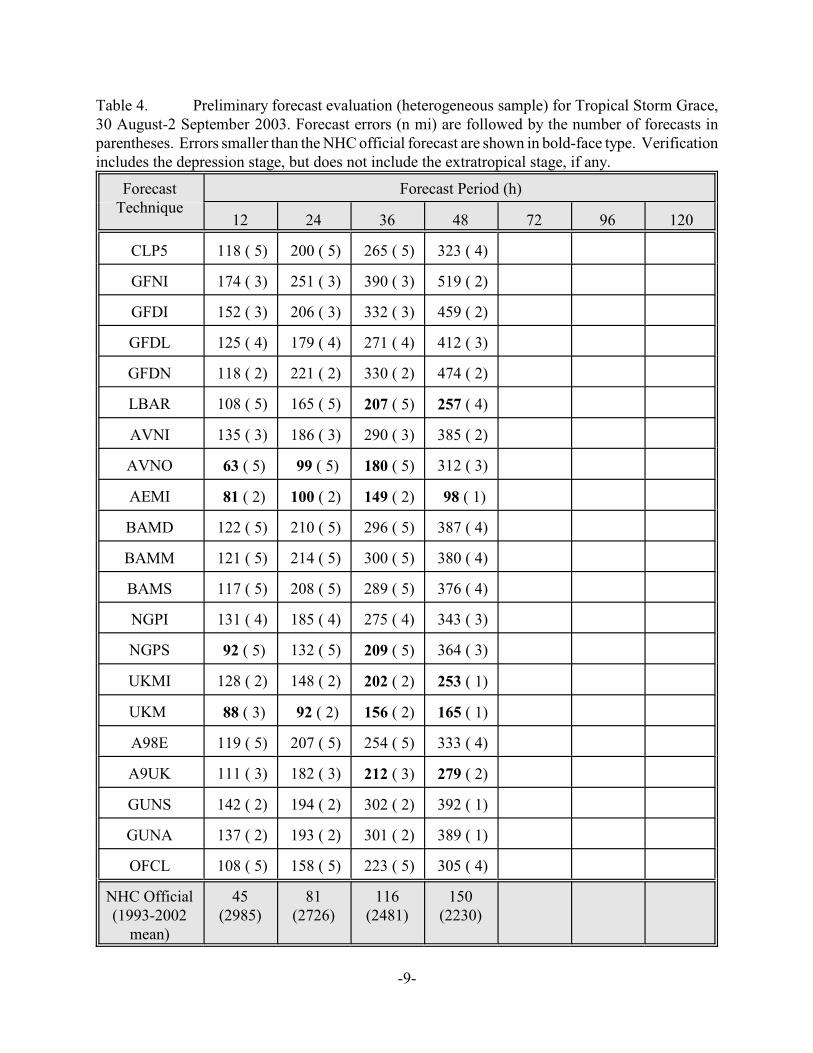
Average official track errors (with the number of cases in parentheses) for Grace were 108(5), 158 (5), 223 (5), and 305 (4) n mi for the 12, 24, 36, and 48 h forecasts, respectively . These1
errors are much greater than the average official track errors for the 10-yr period 1993-2002 of 45,81, 116, and 150 (Table 4). The significance is minimized due to the number of cases being small.The primary reason for the large official forecast (OFCL) errors was the re-development of the low-level center much farther north, near Galveston Island, where Grace eventually made landfall (Fig.4). The official forecast closely followed the consensus of the interpolated GFDL, UKMET,NOGAPS, and GFS/AVN (GFDI, UKMI, NGPI, and AVNI, known as GUNA) models, which alsoperformed poorly, and kept Grace farther south near Corpus Christi. However, it is noteworthy topoint out that the real-time operational global models, AVNO, NGPS, and UKM (used to generatethe interpolated models), as well as the interpolated 10-member GFS/AVN ensemble model,performed very well and correctly forecast a more northward landfall, albeit in the Freeport-Matagorda area. In contrast, the operational GFDL model performed rather poorly by taking Graceinland over and south of Corpus Christi, which resulted in a significant degradation in the GUNAconsensus forecasts. However, none of the NHC forecast models correctly predicted the landfall onGalveston Island.
Average official intensity errors were 5, 15, 5, and 3 kt for the 12, 24, 36, and 48 h forecasts,respectively. For comparison, the average official intensity errors over the 10-yr period 1993-2002are 6, 10, 13, and 15 kt, respectively. The higher than average 24 h intensity error was due to someslight intensification expected before. Instead, significant vertical shear remained across the Gracethroughout its lifetime while over water.
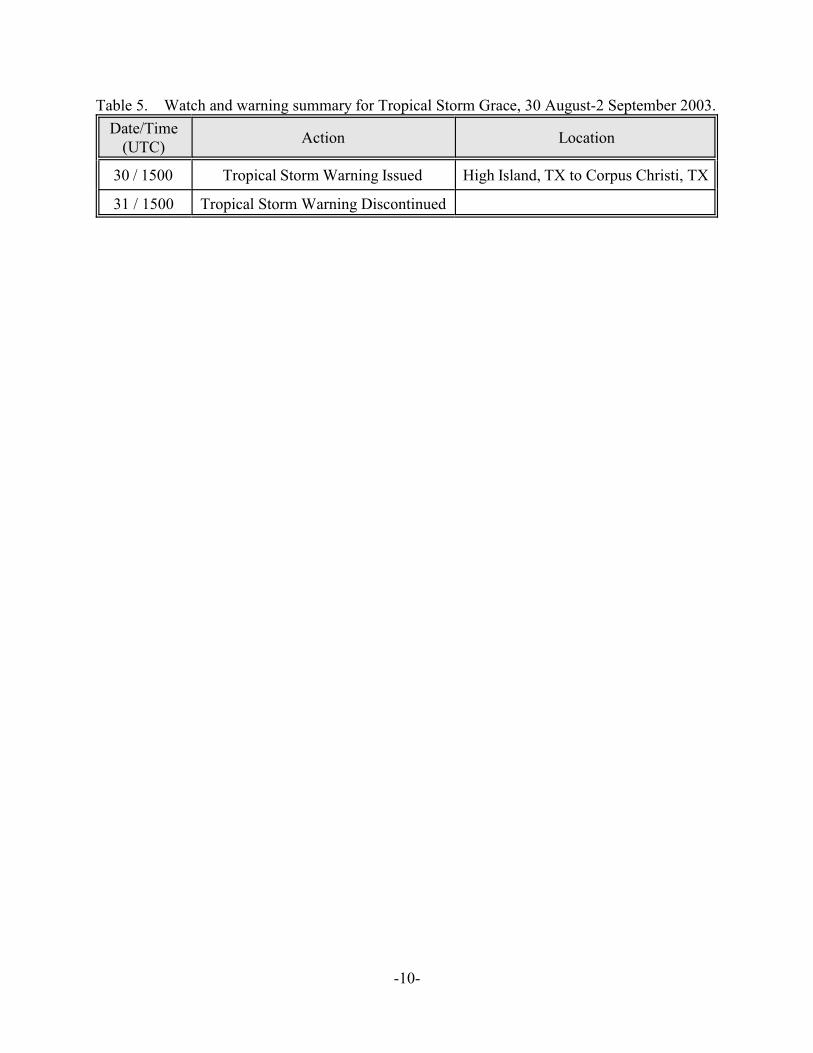
Table 5 lists the watches and warnings associated with Tropical Storm Grace.
Acknowledgments

-4-
Some of the data in this report was furnished by National Weather Service Offices inHouston/Galveston and Corpus Christi, Texas.
-5-
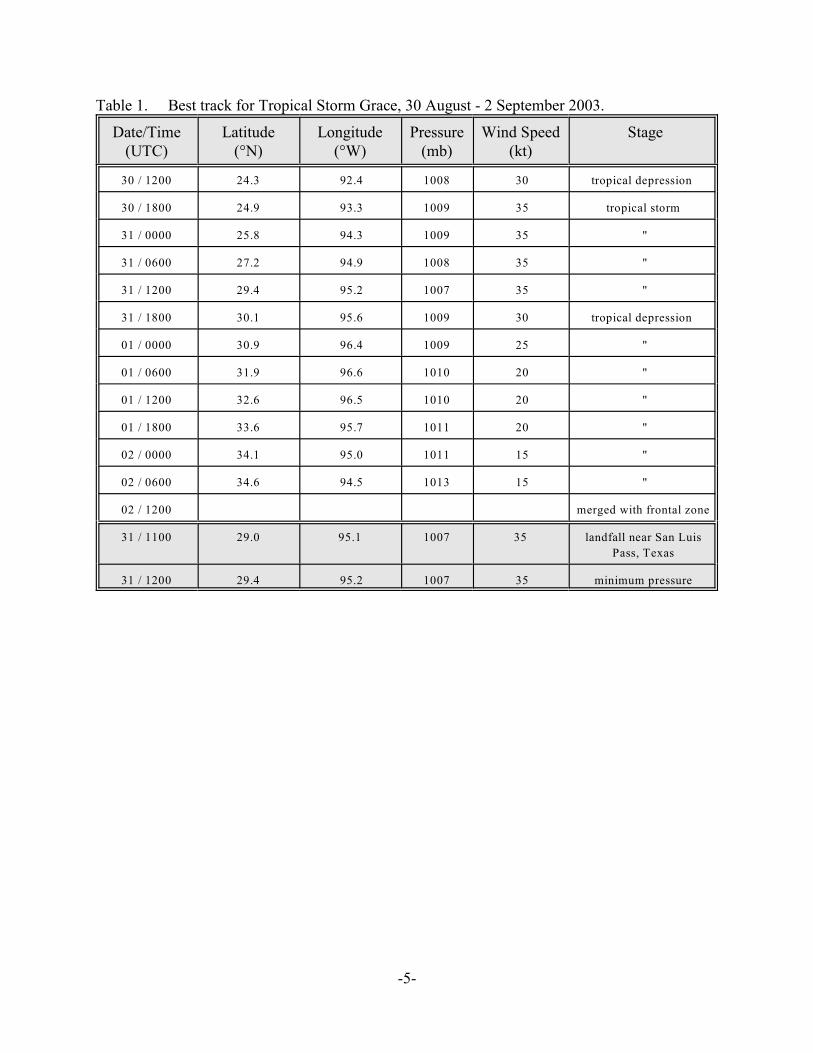
Table 1. Best track for Tropical Storm Grace, 30 August - 2 September 2003.
Date/Time(UTC)
Latitude(°N)
Longitude(°W)
Pressure(mb)
Wind Speed(kt)
Stage
30 / 1200 24.3 92.4 1008 30 tropical depression
30 / 1800 24.9 93.3 1009 35 tropical storm
31 / 0000 25.8 94.3 1009 35 "
31 / 0600 27.2 94.9 1008 35 "
31 / 1200 29.4 95.2 1007 35 "
31 / 1800 30.1 95.6 1009 30 tropical depression
01 / 0000 30.9 96.4 1009 25 "
01 / 0600 31.9 96.6 1010 20 "
01 / 1200 32.6 96.5 1010 20 "
01 / 1800 33.6 95.7 1011 20 "
02 / 0000 34.1 95.0 1011 15 "
02 / 0600 34.6 94.5 1013 15 "
02 / 1200 merged with frontal zone
31 / 1100 29.0 95.1 1007 35 landfall near San Luis
Pass, Texas
31 / 1200 29.4 95.2 1007 35 minimum pressure
-6-
Table 2. Selected ship and oil drilling platform reports with winds of at least 34 kt for TropicalStorm Grace, 30 August - 2 September 2003.
Date/Time(UTC)
Ship call sign Latitude(°N)
Longitude(°W)
Winddir/speed (kt)
Pressure (mb)
31/0000 WZJC 27.6 91.8 130 / 36 1011.3
30/1500 SHIP 26.8 91.25 150 / 40 G 50 missing
Oil Platforms
31/0246 KQT8 (400 ft) 27.9 92.75 150/45 1011.8
31/0345 KQT8 (400 ft) 27.9 92.75 150/35 1012.8
31/1744 KQT9 (400 ft) 27.8 90.65 180/37 1016.2
31/1749 KQT8 (400 ft) 27.9 92.75 160/34 1013.9
-7-
Table 3. Selected surface observations for Tropical Storm Grace, 30 August-2 September 2003.
Location
Minimum Sea Level
Pressure
Maximum Surface
Wind Speed Stormsurge(ft)c
Stormtide(ft)d
Totalrain(in)
Date/time
(UTC)
Press.(mb)
Date/time
(UTC)a
Sustained(kt)b
Gust(kt)
Texas
Alice Airport (KALI) 31/2223 26
Baffin Bay - TCOON 31/0000 1008.2 30/2200 30
Baytown - Hartman Brdg 3.98
Cedar Bayou - SH 146 3.50
Clear Creek - 2 Outflow 5.40nd
Cleveland 4.62
Eagle Point 31/1200 1007.9
East Matagorda Bay 31/1200 32
Freeport 5.57
Galveston Airport (KGLS) 31/1116 1008.5 31/0803 28 35 3.72
Galveston Buoy 42035 31/1300 26 33
Galveston Pleasure Pier 31/1200 1007.4 01/0900 26 33
Galveston North Jetty 31/1154 1007.3
Garwood (Colorado River) 3.40
Goodrich (W5QVK) 5.35
Goodrich School 4.25
Horsepen Ck-Bay Ar Blvd 4.57
Houston Arpt (KHOU) 4.98
Houston Cedar Bayou 2.84
Houston Clr Ck - FM 528 3.43
Houston Int’cntl (KIAH) 2.96
Huntsville ASOS (KUTS) 7.94
Jamaica Beach (JBHT2) 31/1230 1008.2 5.01
Jamaica Beach CO-OP 2.92
Kingsville NAS (KNQI) 01/0057 26
League City (NWS) 7.13
Matagorda River Locks 9.00
McMullen Co. Airport 31/2124 26
Mesquite Point TCOON 31/0400 36
Nassau Bay - Clear Creek 5.90
New Caney 5.14
Onalaska 3.28
Onalaska (W5GRZ) 4.65
Location
Minimum Sea Level
Pressure
Maximum Surface
Wind Speed Stormsurge(ft)c
Stormtide(ft)d
Totalrain(in)
Date/time
(UTC)
Press.(mb)
Date/time
(UTC)a
Sustained(kt)b
Gust(kt)
-8-
Orange TCOON 31/1300 38
Pearland 6.47
Point Blank 6N 5.04
Port O’Connor 30/2000 26
Seabrook (NASA Rd 1) 6.89
Sea Rim St. Park (SRST2) 31/1220 35
Sea Rim St. Park (SRST2) 31/1450 35
Sea Rim St. Park (SRST2) 31/1444 46
West Bay (29.14N 95.15W) 31/1000 1007.71
Date/time is for sustained wind when both sustained and gust are listed.a
Except as noted, sustained wind averaging periods for C-MAN and land-based ASOS reports areb
2 min; buoy averaging periods are 8 min. Storm surge is water height above normal astronomical tide level.c
Storm tide is water height above National Geodetic Vertical Datum (1929 mean sea level).d
Minimum pressure reported three times between 1000-1200 UTC 31 July 2003.1
-9-
Table 4. Preliminary forecast evaluation (heterogeneous sample) for Tropical Storm Grace,30 August-2 September 2003. Forecast errors (n mi) are followed by the number of forecasts inparentheses. Errors smaller than the NHC official forecast are shown in bold-face type. Verificationincludes the depression stage, but does not include the extratropical stage, if any.
ForecastTechnique
Forecast Period (h)
12 24 36 48 72 96 120
CLP5 118 ( 5) 200 ( 5) 265 ( 5) 323 ( 4)
GFNI 174 ( 3) 251 ( 3) 390 ( 3) 519 ( 2)
GFDI 152 ( 3) 206 ( 3) 332 ( 3) 459 ( 2)
GFDL 125 ( 4) 179 ( 4) 271 ( 4) 412 ( 3)
GFDN 118 ( 2) 221 ( 2) 330 ( 2) 474 ( 2)
LBAR 108 ( 5) 165 ( 5) 207 ( 5) 257 ( 4)
AVNI 135 ( 3) 186 ( 3) 290 ( 3) 385 ( 2)
AVNO 63 ( 5) 99 ( 5) 180 ( 5) 312 ( 3)
AEMI 81 ( 2) 100 ( 2) 149 ( 2) 98 ( 1)
BAMD 122 ( 5) 210 ( 5) 296 ( 5) 387 ( 4)
BAMM 121 ( 5) 214 ( 5) 300 ( 5) 380 ( 4)
BAMS 117 ( 5) 208 ( 5) 289 ( 5) 376 ( 4)
NGPI 131 ( 4) 185 ( 4) 275 ( 4) 343 ( 3)
NGPS 92 ( 5) 132 ( 5) 209 ( 5) 364 ( 3)
UKMI 128 ( 2) 148 ( 2) 202 ( 2) 253 ( 1)
UKM 88 ( 3) 92 ( 2) 156 ( 2) 165 ( 1)
A98E 119 ( 5) 207 ( 5) 254 ( 5) 333 ( 4)
A9UK 111 ( 3) 182 ( 3) 212 ( 3) 279 ( 2)
GUNS 142 ( 2) 194 ( 2) 302 ( 2) 392 ( 1)
GUNA 137 ( 2) 193 ( 2) 301 ( 2) 389 ( 1)
OFCL 108 ( 5) 158 ( 5) 223 ( 5) 305 ( 4)
NHC Official(1993-2002
mean)
45(2985)
81(2726)
116(2481)
150(2230)
-10-
Table 5. Watch and warning summary for Tropical Storm Grace, 30 August-2 September 2003.
Date/Time(UTC)
Action Location
30 / 1500 Tropical Storm Warning Issued High Island, TX to Corpus Christi, TX
31 / 1500 Tropical Storm Warning Discontinued
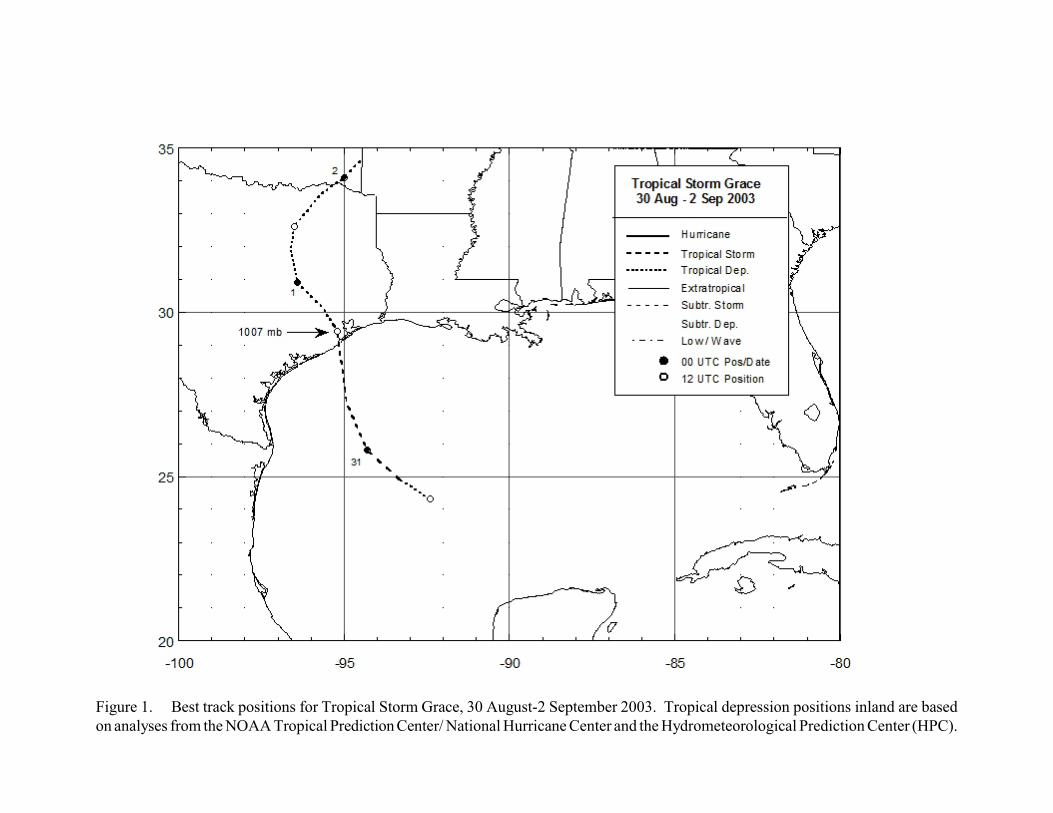
Figure 1. Best track positions for Tropical Storm Grace, 30 August-2 September 2003. Tropical depression positions inland are basedon analyses from the NOAA Tropical Prediction Center/ National Hurricane Center and the Hydrometeorological Prediction Center (HPC).
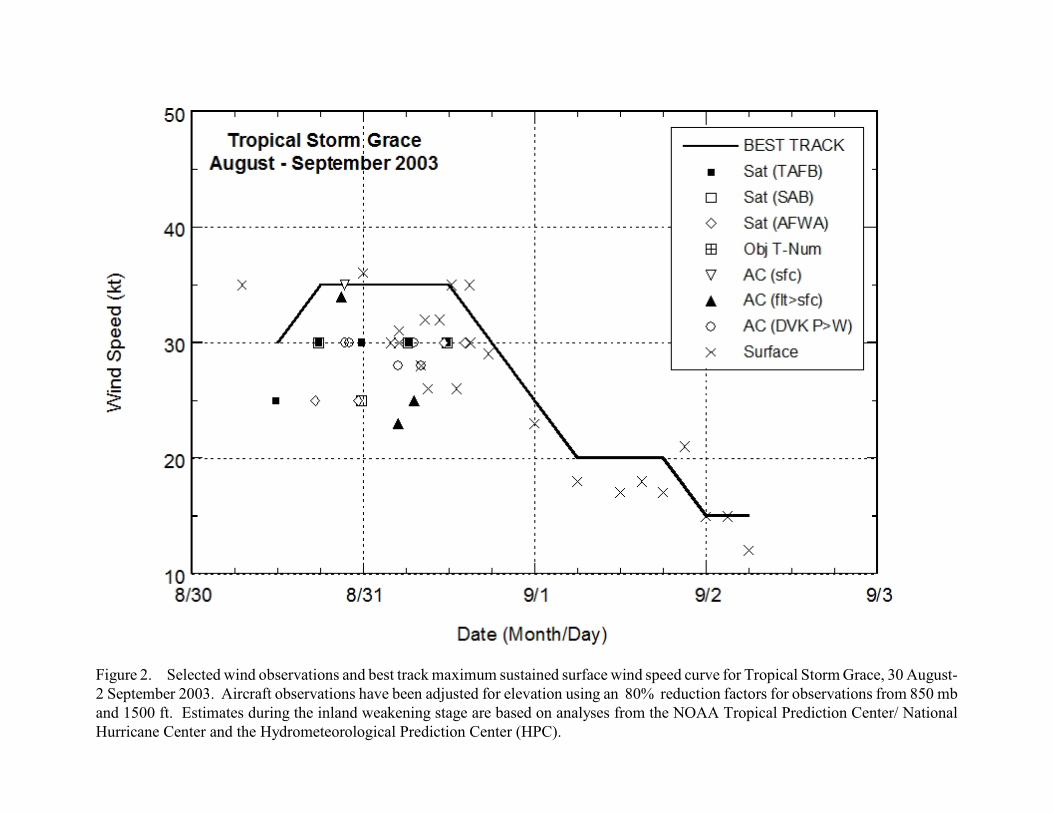
Figure 2. Selected wind observations and best track maximum sustained surface wind speed curve for Tropical Storm Grace, 30 August-2 September 2003. Aircraft observations have been adjusted for elevation using an 80% reduction factors for observations from 850 mband 1500 ft. Estimates during the inland weakening stage are based on analyses from the NOAA Tropical Prediction Center/ NationalHurricane Center and the Hydrometeorological Prediction Center (HPC).
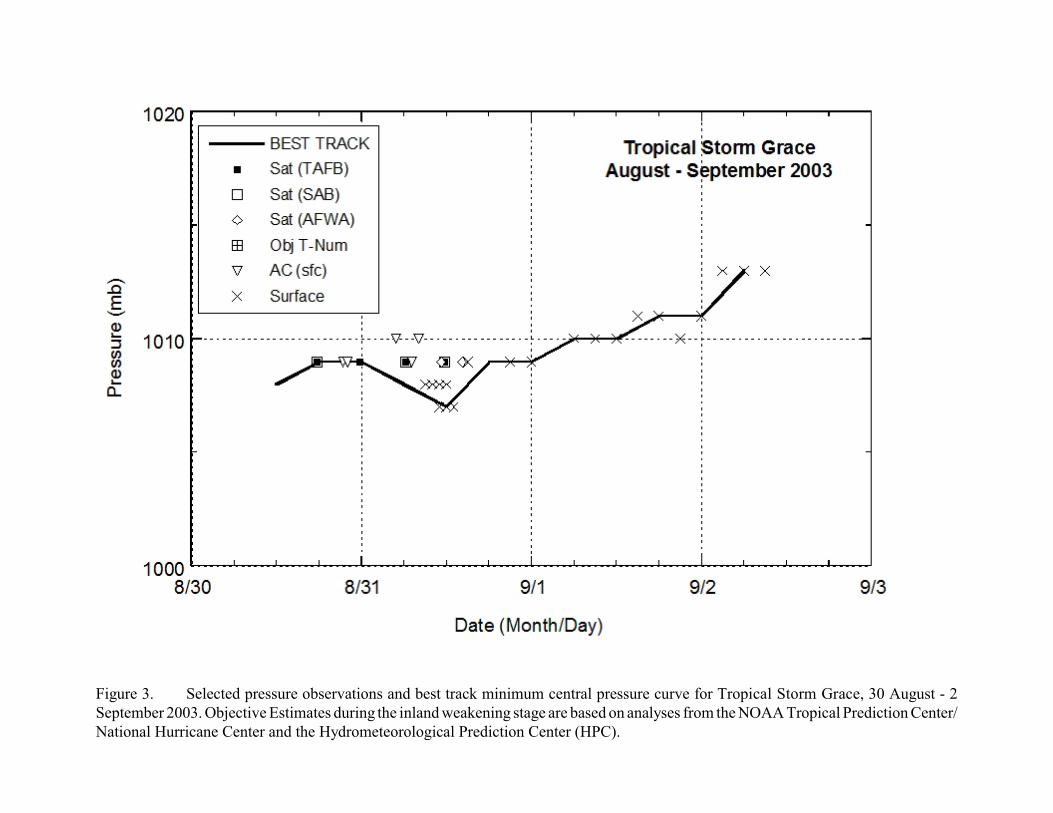
Figure 3. Selected pressure observations and best track minimum central pressure curve for Tropical Storm Grace, 30 August - 2September 2003. Objective Estimates during the inland weakening stage are based on analyses from the NOAA Tropical Prediction Center/National Hurricane Center and the Hydrometeorological Prediction Center (HPC).
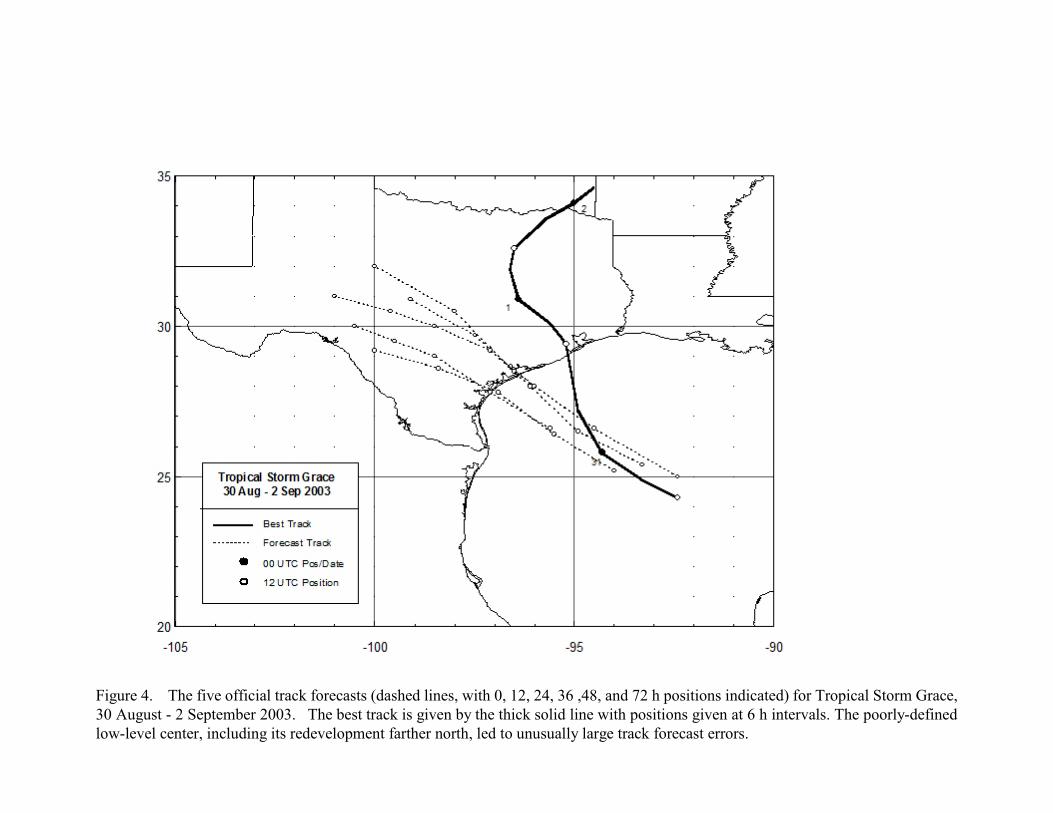
Figure 4. The five official track forecasts (dashed lines, with 0, 12, 24, 36 ,48, and 72 h positions indicated) for Tropical Storm Grace,30 August - 2 September 2003. The best track is given by the thick solid line with positions given at 6 h intervals. The poorly-definedlow-level center, including its redevelopment farther north, led to unusually large track forecast errors.