Tropical Cyclone Report Tropical Storm Bonnie (AL032010 ... · c. Casualty and Damage Statistics...
17
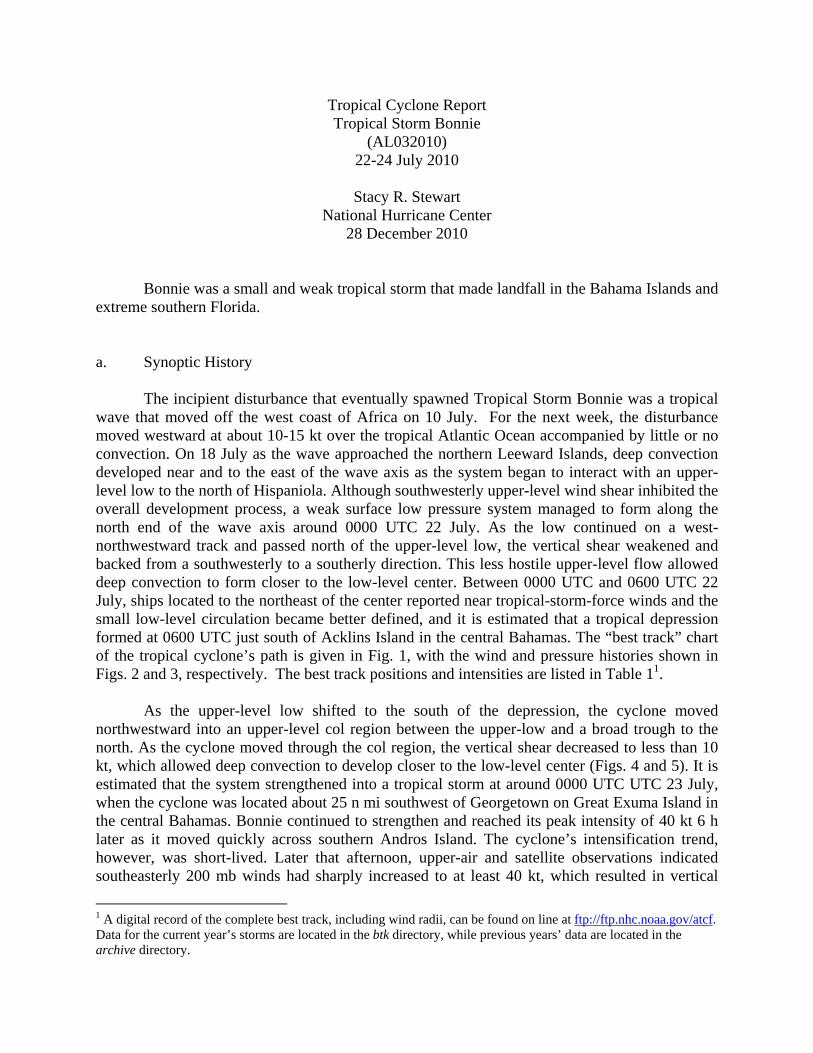
Tropical Cyclone Report Tropical Storm Bonnie (AL032010) 22-24 July 2010 Stacy R. Stewart National Hurricane Center 28 December 2010 Bonnie was a small and weak tropical storm that made landfall in the Bahama Islands and extreme southern Florida. a. Synoptic History The incipient disturbance that eventually spawned Tropical Storm Bonnie was a tropical wave that moved off the west coast of Africa on 10 July. For the next week, the disturbance moved westward at about 10-15 kt over the tropical Atlantic Ocean accompanied by little or no convection. On 18 July as the wave approached the northern Leeward Islands, deep convection developed near and to the east of the wave axis as the system began to interact with an upper- level low to the north of Hispaniola. Although southwesterly upper-level wind shear inhibited the overall development process, a weak surface low pressure system managed to form along the north end of the wave axis around 0000 UTC 22 July. As the low continued on a west- northwestward track and passed north of the upper-level low, the vertical shear weakened and backed from a southwesterly to a southerly direction. This less hostile upper-level flow allowed deep convection to form closer to the low-level center. Between 0000 UTC and 0600 UTC 22 July, ships located to the northeast of the center reported near tropical-storm-force winds and the small low-level circulation became better defined, and it is estimated that a tropical depression formed at 0600 UTC just south of Acklins Island in the central Bahamas. The “best track” chart of the tropical cyclone’s path is given in Fig. 1, with the wind and pressure histories shown in Figs. 2 and 3, respectively. The best track positions and intensities are listed in Table 1 1 . As the upper-level low shifted to the south of the depression, the cyclone moved northwestward into an upper-level col region between the upper-low and a broad trough to the north. As the cyclone moved through the col region, the vertical shear decreased to less than 10 kt, which allowed deep convection to develop closer to the low-level center (Figs. 4 and 5). It is estimated that the system strengthened into a tropical storm at around 0000 UTC UTC 23 July, when the cyclone was located about 25 n mi southwest of Georgetown on Great Exuma Island in the central Bahamas. Bonnie continued to strengthen and reached its peak intensity of 40 kt 6 h later as it moved quickly across southern Andros Island. The cyclone’s intensification trend, however, was short-lived. Later that afternoon, upper-air and satellite observations indicated southeasterly 200 mb winds had sharply increased to at least 40 kt, which resulted in vertical 1 A digital record of the complete best track, including wind radii, can be found on line at ftp://ftp.nhc.noaa.gov/atcf. Data for the current year’s storms are located in the btk directory, while previous years’ data are located in the archive directory.
Transcript of Tropical Cyclone Report Tropical Storm Bonnie (AL032010 ... · c. Casualty and Damage Statistics...
Tropical Cyclone Report Tropical Storm Bonnie
(AL032010) 22-24 July 2010
Stacy R. Stewart
National Hurricane Center 28 December 2010
Bonnie was a small and weak tropical storm that made landfall in the Bahama Islands and extreme southern Florida. a. Synoptic History
The incipient disturbance that eventually spawned Tropical Storm Bonnie was a tropical wave that moved off the west coast of Africa on 10 July. For the next week, the disturbance moved westward at about 10-15 kt over the tropical Atlantic Ocean accompanied by little or no convection. On 18 July as the wave approached the northern Leeward Islands, deep convection developed near and to the east of the wave axis as the system began to interact with an upper-level low to the north of Hispaniola. Although southwesterly upper-level wind shear inhibited the overall development process, a weak surface low pressure system managed to form along the north end of the wave axis around 0000 UTC 22 July. As the low continued on a west-northwestward track and passed north of the upper-level low, the vertical shear weakened and backed from a southwesterly to a southerly direction. This less hostile upper-level flow allowed deep convection to form closer to the low-level center. Between 0000 UTC and 0600 UTC 22 July, ships located to the northeast of the center reported near tropical-storm-force winds and the small low-level circulation became better defined, and it is estimated that a tropical depression formed at 0600 UTC just south of Acklins Island in the central Bahamas. The “best track” chart of the tropical cyclone’s path is given in Fig. 1, with the wind and pressure histories shown in Figs. 2 and 3, respectively. The best track positions and intensities are listed in Table 11.
As the upper-level low shifted to the south of the depression, the cyclone moved
northwestward into an upper-level col region between the upper-low and a broad trough to the north. As the cyclone moved through the col region, the vertical shear decreased to less than 10 kt, which allowed deep convection to develop closer to the low-level center (Figs. 4 and 5). It is estimated that the system strengthened into a tropical storm at around 0000 UTC UTC 23 July, when the cyclone was located about 25 n mi southwest of Georgetown on Great Exuma Island in the central Bahamas. Bonnie continued to strengthen and reached its peak intensity of 40 kt 6 h later as it moved quickly across southern Andros Island. The cyclone’s intensification trend, however, was short-lived. Later that afternoon, upper-air and satellite observations indicated southeasterly 200 mb winds had sharply increased to at least 40 kt, which resulted in vertical
1 A digital record of the complete best track, including wind radii, can be found on line at ftp://ftp.nhc.noaa.gov/atcf. Data for the current year’s storms are located in the btk directory, while previous years’ data are located in the archive directory.
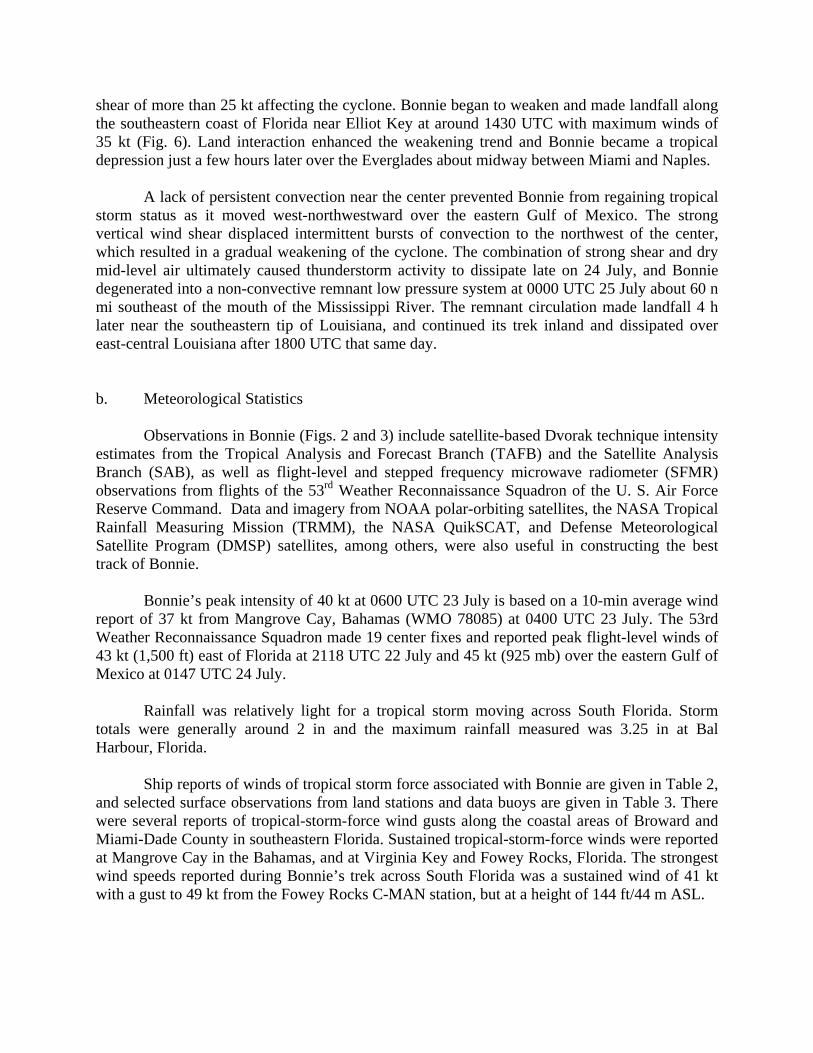
shear of more than 25 kt affecting the cyclone. Bonnie began to weaken and made landfall along the southeastern coast of Florida near Elliot Key at around 1430 UTC with maximum winds of 35 kt (Fig. 6). Land interaction enhanced the weakening trend and Bonnie became a tropical depression just a few hours later over the Everglades about midway between Miami and Naples.
A lack of persistent convection near the center prevented Bonnie from regaining tropical
storm status as it moved west-northwestward over the eastern Gulf of Mexico. The strong vertical wind shear displaced intermittent bursts of convection to the northwest of the center, which resulted in a gradual weakening of the cyclone. The combination of strong shear and dry mid-level air ultimately caused thunderstorm activity to dissipate late on 24 July, and Bonnie degenerated into a non-convective remnant low pressure system at 0000 UTC 25 July about 60 n mi southeast of the mouth of the Mississippi River. The remnant circulation made landfall 4 h later near the southeastern tip of Louisiana, and continued its trek inland and dissipated over east-central Louisiana after 1800 UTC that same day. b. Meteorological Statistics Observations in Bonnie (Figs. 2 and 3) include satellite-based Dvorak technique intensity estimates from the Tropical Analysis and Forecast Branch (TAFB) and the Satellite Analysis Branch (SAB), as well as flight-level and stepped frequency microwave radiometer (SFMR) observations from flights of the 53rd Weather Reconnaissance Squadron of the U. S. Air Force Reserve Command. Data and imagery from NOAA polar-orbiting satellites, the NASA Tropical Rainfall Measuring Mission (TRMM), the NASA QuikSCAT, and Defense Meteorological Satellite Program (DMSP) satellites, among others, were also useful in constructing the best track of Bonnie. Bonnie’s peak intensity of 40 kt at 0600 UTC 23 July is based on a 10-min average wind report of 37 kt from Mangrove Cay, Bahamas (WMO 78085) at 0400 UTC 23 July. The 53rd Weather Reconnaissance Squadron made 19 center fixes and reported peak flight-level winds of 43 kt (1,500 ft) east of Florida at 2118 UTC 22 July and 45 kt (925 mb) over the eastern Gulf of Mexico at 0147 UTC 24 July. Rainfall was relatively light for a tropical storm moving across South Florida. Storm totals were generally around 2 in and the maximum rainfall measured was 3.25 in at Bal Harbour, Florida. Ship reports of winds of tropical storm force associated with Bonnie are given in Table 2, and selected surface observations from land stations and data buoys are given in Table 3. There were several reports of tropical-storm-force wind gusts along the coastal areas of Broward and Miami-Dade County in southeastern Florida. Sustained tropical-storm-force winds were reported at Mangrove Cay in the Bahamas, and at Virginia Key and Fowey Rocks, Florida. The strongest wind speeds reported during Bonnie’s trek across South Florida was a sustained wind of 41 kt with a gust to 49 kt from the Fowey Rocks C-MAN station, but at a height of 144 ft/44 m ASL.
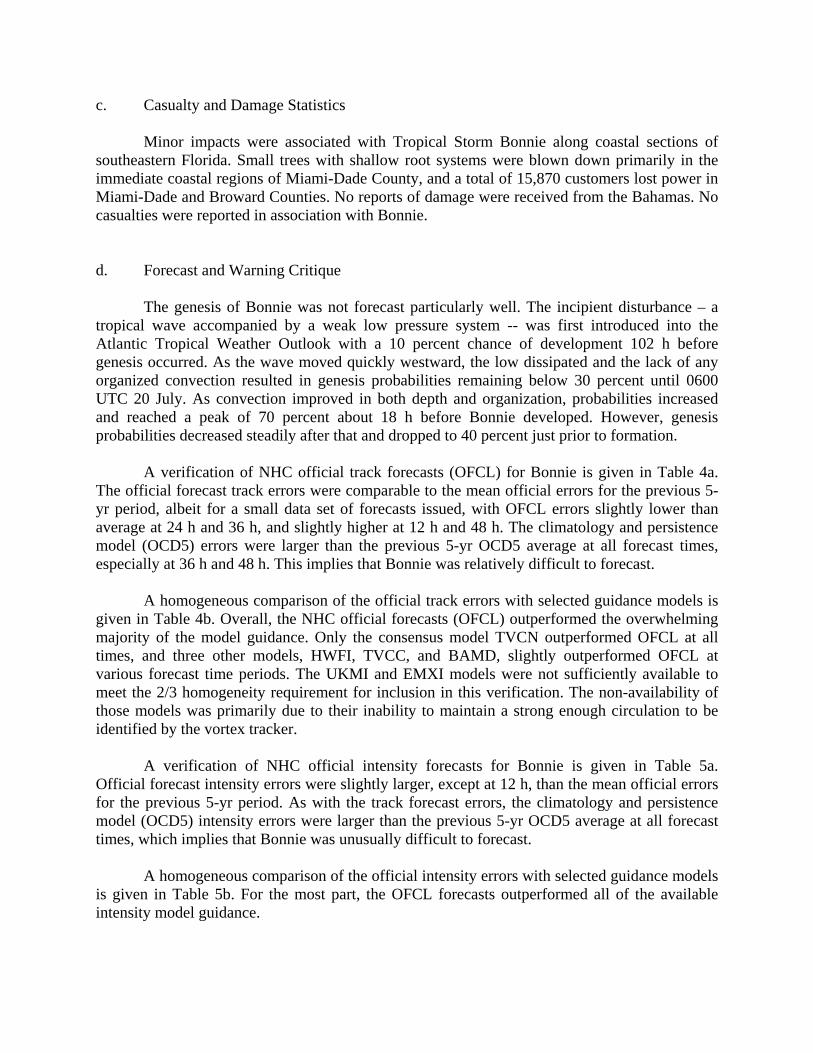
c. Casualty and Damage Statistics Minor impacts were associated with Tropical Storm Bonnie along coastal sections of southeastern Florida. Small trees with shallow root systems were blown down primarily in the immediate coastal regions of Miami-Dade County, and a total of 15,870 customers lost power in Miami-Dade and Broward Counties. No reports of damage were received from the Bahamas. No casualties were reported in association with Bonnie. d. Forecast and Warning Critique
The genesis of Bonnie was not forecast particularly well. The incipient disturbance – a tropical wave accompanied by a weak low pressure system -- was first introduced into the Atlantic Tropical Weather Outlook with a 10 percent chance of development 102 h before genesis occurred. As the wave moved quickly westward, the low dissipated and the lack of any organized convection resulted in genesis probabilities remaining below 30 percent until 0600 UTC 20 July. As convection improved in both depth and organization, probabilities increased and reached a peak of 70 percent about 18 h before Bonnie developed. However, genesis probabilities decreased steadily after that and dropped to 40 percent just prior to formation.
A verification of NHC official track forecasts (OFCL) for Bonnie is given in Table 4a.
The official forecast track errors were comparable to the mean official errors for the previous 5-yr period, albeit for a small data set of forecasts issued, with OFCL errors slightly lower than average at 24 h and 36 h, and slightly higher at 12 h and 48 h. The climatology and persistence model (OCD5) errors were larger than the previous 5-yr OCD5 average at all forecast times, especially at 36 h and 48 h. This implies that Bonnie was relatively difficult to forecast.
A homogeneous comparison of the official track errors with selected guidance models is
given in Table 4b. Overall, the NHC official forecasts (OFCL) outperformed the overwhelming majority of the model guidance. Only the consensus model TVCN outperformed OFCL at all times, and three other models, HWFI, TVCC, and BAMD, slightly outperformed OFCL at various forecast time periods. The UKMI and EMXI models were not sufficiently available to meet the 2/3 homogeneity requirement for inclusion in this verification. The non-availability of those models was primarily due to their inability to maintain a strong enough circulation to be identified by the vortex tracker.
A verification of NHC official intensity forecasts for Bonnie is given in Table 5a.
Official forecast intensity errors were slightly larger, except at 12 h, than the mean official errors for the previous 5-yr period. As with the track forecast errors, the climatology and persistence model (OCD5) intensity errors were larger than the previous 5-yr OCD5 average at all forecast times, which implies that Bonnie was unusually difficult to forecast.
A homogeneous comparison of the official intensity errors with selected guidance models
is given in Table 5b. For the most part, the OFCL forecasts outperformed all of the available intensity model guidance.
Watches and warnings associated with Bonnie are given in Table 6. Acknowledgments The Miami, FL National Weather Service Forecast Office (WFO) and the National Data Buoy Center provided post-storm reports and observations included in Table 3. The 53rd Weather Reconnaissance Squadron of the U. S. Air Force Reserve Command spent several hours gathering crucial in situ observational data on Bonnie.
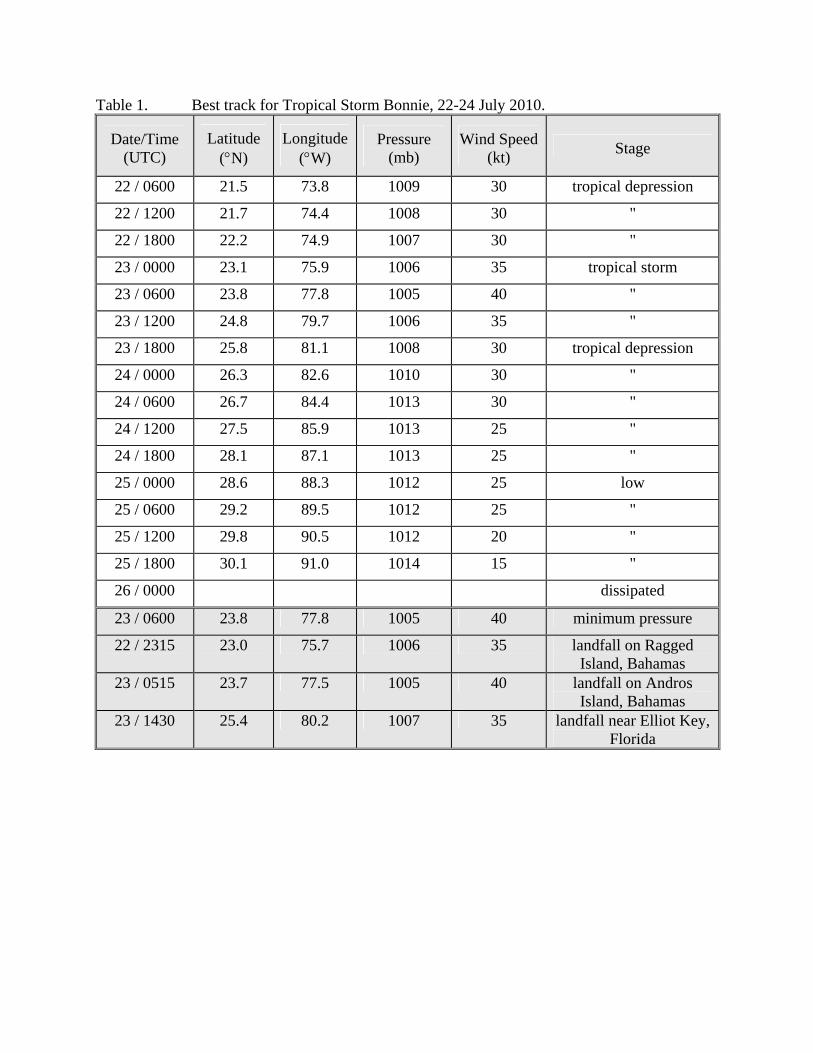
Table 1. Best track for Tropical Storm Bonnie, 22-24 July 2010.
Date/Time (UTC)
Latitude (N)
Longitude (W)
Pressure (mb)
Wind Speed (kt)
Stage
22 / 0600 21.5 73.8 1009 30 tropical depression
22 / 1200 21.7 74.4 1008 30 "
22 / 1800 22.2 74.9 1007 30 "
23 / 0000 23.1 75.9 1006 35 tropical storm
23 / 0600 23.8 77.8 1005 40 "
23 / 1200 24.8 79.7 1006 35 "
23 / 1800 25.8 81.1 1008 30 tropical depression
24 / 0000 26.3 82.6 1010 30 "
24 / 0600 26.7 84.4 1013 30 "
24 / 1200 27.5 85.9 1013 25 "
24 / 1800 28.1 87.1 1013 25 "
25 / 0000 28.6 88.3 1012 25 low
25 / 0600 29.2 89.5 1012 25 "
25 / 1200 29.8 90.5 1012 20 "
25 / 1800 30.1 91.0 1014 15 "
26 / 0000 dissipated
23 / 0600 23.8 77.8 1005 40 minimum pressure
22 / 2315 23.0 75.7 1006 35 landfall on Ragged Island, Bahamas
23 / 0515 23.7 77.5 1005 40 landfall on Andros Island, Bahamas
23 / 1430 25.4 80.2 1007 35 landfall near Elliot Key, Florida
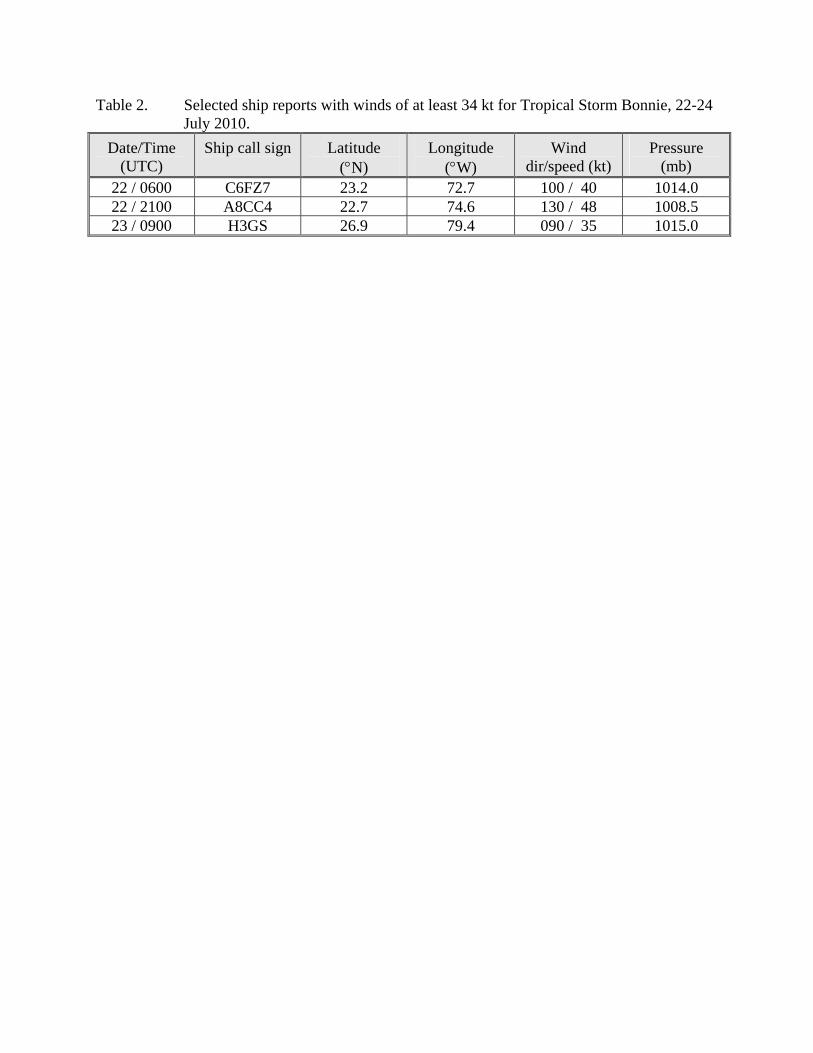
Table 2. Selected ship reports with winds of at least 34 kt for Tropical Storm Bonnie, 22-24 July 2010.
Date/Time (UTC)
Ship call sign
Latitude (N)
Longitude (W)
Wind dir/speed (kt)
Pressure (mb)
22 / 0600 C6FZ7 23.2 72.7 100 / 40 1014.0 22 / 2100 A8CC4 22.7 74.6 130 / 48 1008.5 23 / 0900 H3GS 26.9 79.4 090 / 35 1015.0
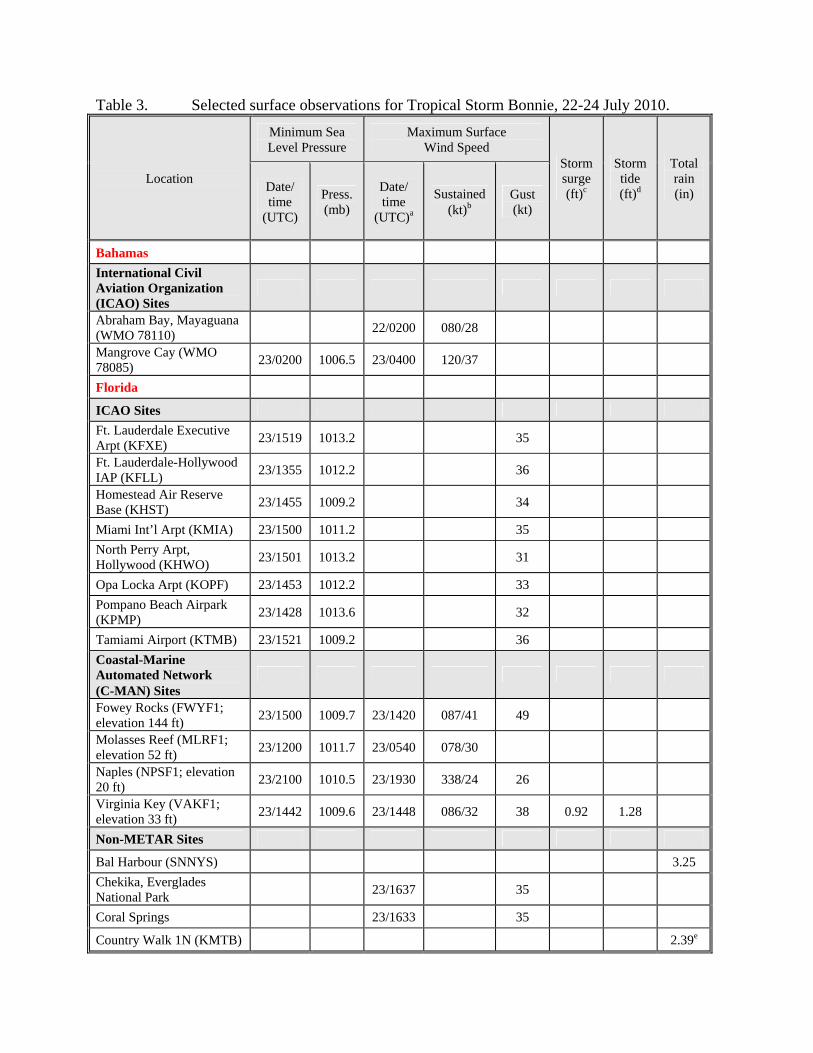
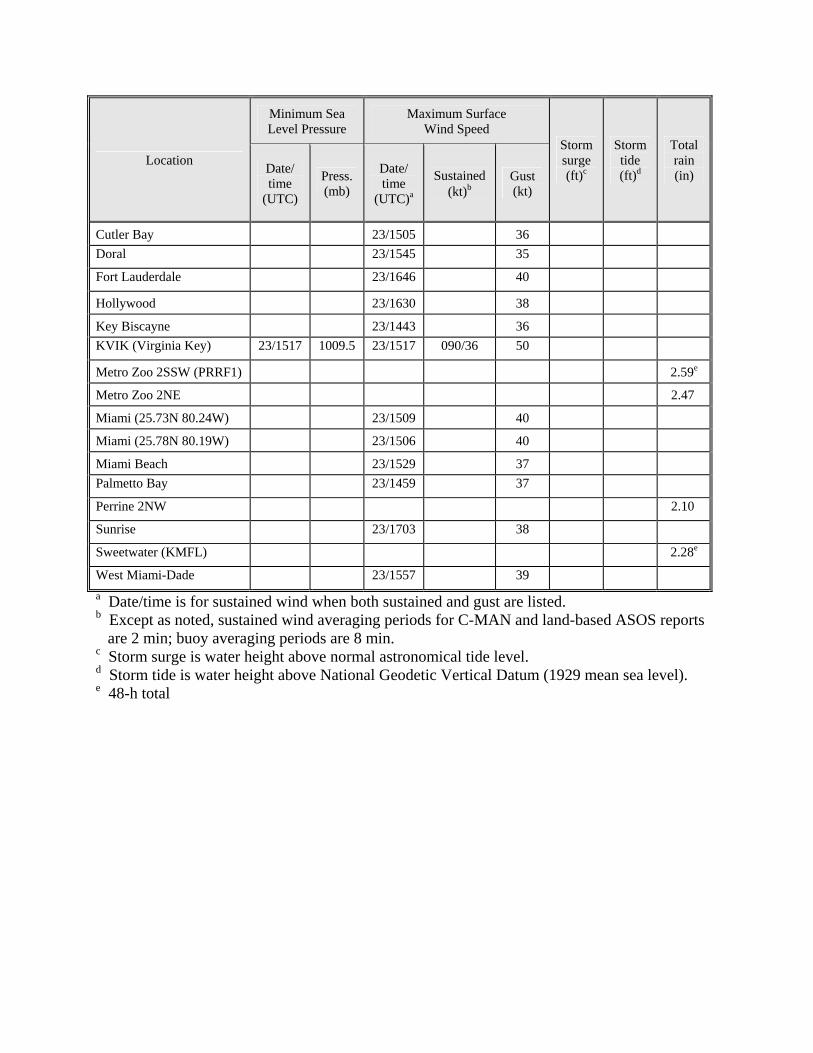
Table 3. Selected surface observations for Tropical Storm Bonnie, 22-24 July 2010.
Location
Minimum Sea Level Pressure
Maximum Surface Wind Speed
Storm surge (ft)c
Storm tide (ft)d
Total rain (in) Date/
time (UTC)
Press. (mb)
Date/ time
(UTC)a
Sustained (kt)b
Gust (kt)
Bahamas
International Civil Aviation Organization (ICAO) Sites
Abraham Bay, Mayaguana (WMO 78110)
22/0200 080/28
Mangrove Cay (WMO 78085)
23/0200 1006.5 23/0400 120/37
Florida
ICAO Sites
Ft. Lauderdale Executive Arpt (KFXE)
23/1519 1013.2 35
Ft. Lauderdale-Hollywood IAP (KFLL)
23/1355 1012.2 36
Homestead Air Reserve Base (KHST)
23/1455 1009.2 34
Miami Int’l Arpt (KMIA) 23/1500 1011.2 35
North Perry Arpt, Hollywood (KHWO)
23/1501 1013.2 31
Opa Locka Arpt (KOPF) 23/1453 1012.2 33
Pompano Beach Airpark (KPMP)
23/1428 1013.6 32
Tamiami Airport (KTMB) 23/1521 1009.2 36
Coastal-Marine Automated Network (C-MAN) Sites
Fowey Rocks (FWYF1; elevation 144 ft)
23/1500 1009.7 23/1420 087/41 49
Molasses Reef (MLRF1; elevation 52 ft)
23/1200 1011.7 23/0540 078/30
Naples (NPSF1; elevation 20 ft)
23/2100 1010.5 23/1930 338/24 26
Virginia Key (VAKF1; elevation 33 ft)
23/1442 1009.6 23/1448 086/32 38 0.92 1.28
Non-METAR Sites
Bal Harbour (SNNYS) 3.25
Chekika, Everglades National Park
23/1637 35
Coral Springs 23/1633 35
Country Walk 1N (KMTB) 2.39e
Location
Minimum Sea Level Pressure
Maximum Surface Wind Speed
Storm surge (ft)c
Storm tide (ft)d
Total rain (in) Date/
time (UTC)
Press. (mb)
Date/ time
(UTC)a
Sustained (kt)b
Gust (kt)
Cutler Bay 23/1505 36
Doral 23/1545 35
Fort Lauderdale 23/1646 40
Hollywood 23/1630 38
Key Biscayne 23/1443 36
KVIK (Virginia Key) 23/1517 1009.5 23/1517 090/36 50
Metro Zoo 2SSW (PRRF1) 2.59e
Metro Zoo 2NE 2.47
Miami (25.73N 80.24W) 23/1509 40
Miami (25.78N 80.19W) 23/1506 40
Miami Beach 23/1529 37
Palmetto Bay 23/1459 37 Perrine 2NW 2.10
Sunrise 23/1703 38
Sweetwater (KMFL) 2.28e
West Miami-Dade 23/1557 39 a Date/time is for sustained wind when both sustained and gust are listed. b Except as noted, sustained wind averaging periods for C-MAN and land-based ASOS reports
are 2 min; buoy averaging periods are 8 min. c Storm surge is water height above normal astronomical tide level. d Storm tide is water height above National Geodetic Vertical Datum (1929 mean sea level). e 48-h total
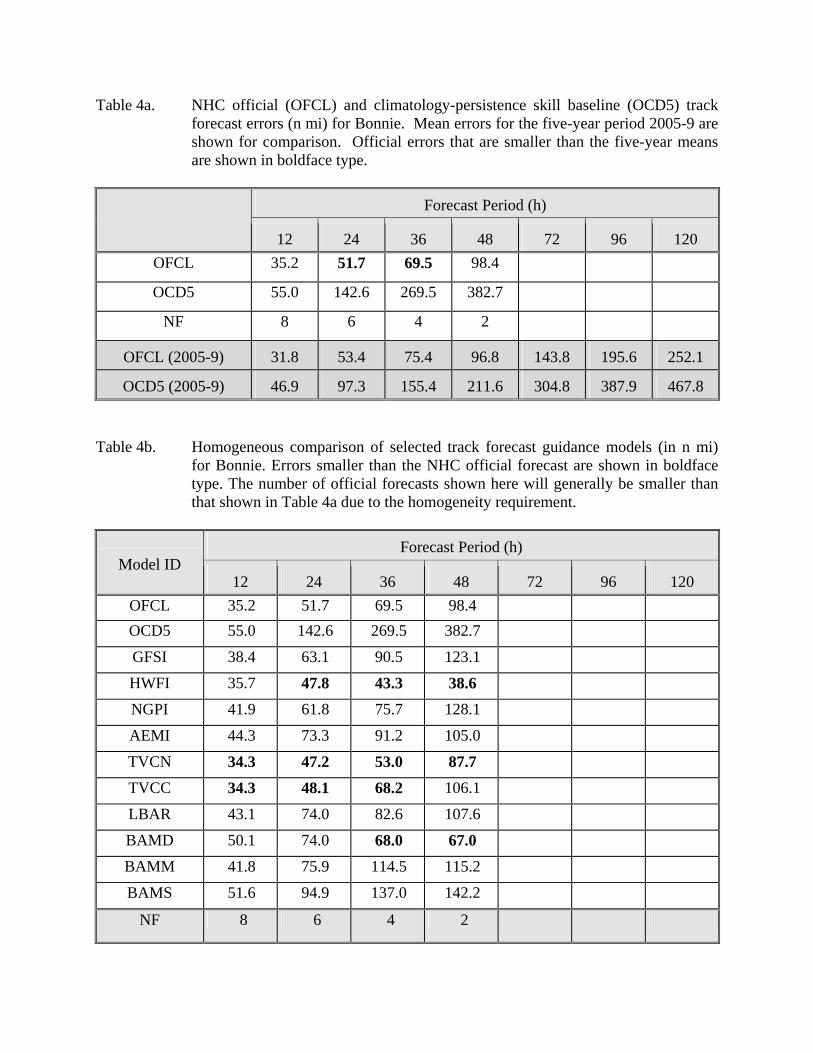
Table 4a. NHC official (OFCL) and climatology-persistence skill baseline (OCD5) track forecast errors (n mi) for Bonnie. Mean errors for the five-year period 2005-9 are shown for comparison. Official errors that are smaller than the five-year means are shown in boldface type.
Forecast Period (h)
12 24 36 48 72 96 120
OFCL 35.2 51.7 69.5 98.4
OCD5 55.0 142.6 269.5 382.7
NF 8 6 4 2
OFCL (2005-9) 31.8 53.4 75.4 96.8 143.8 195.6 252.1
OCD5 (2005-9) 46.9 97.3 155.4 211.6 304.8 387.9 467.8
Table 4b. Homogeneous comparison of selected track forecast guidance models (in n mi)
for Bonnie. Errors smaller than the NHC official forecast are shown in boldface type. The number of official forecasts shown here will generally be smaller than that shown in Table 4a due to the homogeneity requirement.
Model ID Forecast Period (h)
12 24 36 48 72 96 120
OFCL 35.2 51.7 69.5 98.4
OCD5 55.0 142.6 269.5 382.7
GFSI 38.4 63.1 90.5 123.1
HWFI 35.7 47.8 43.3 38.6
NGPI 41.9 61.8 75.7 128.1
AEMI 44.3 73.3 91.2 105.0
TVCN 34.3 47.2 53.0 87.7
TVCC 34.3 48.1 68.2 106.1
LBAR 43.1 74.0 82.6 107.6
BAMD 50.1 74.0 68.0 67.0
BAMM 41.8 75.9 114.5 115.2
BAMS 51.6 94.9 137.0 142.2
NF 8 6 4 2
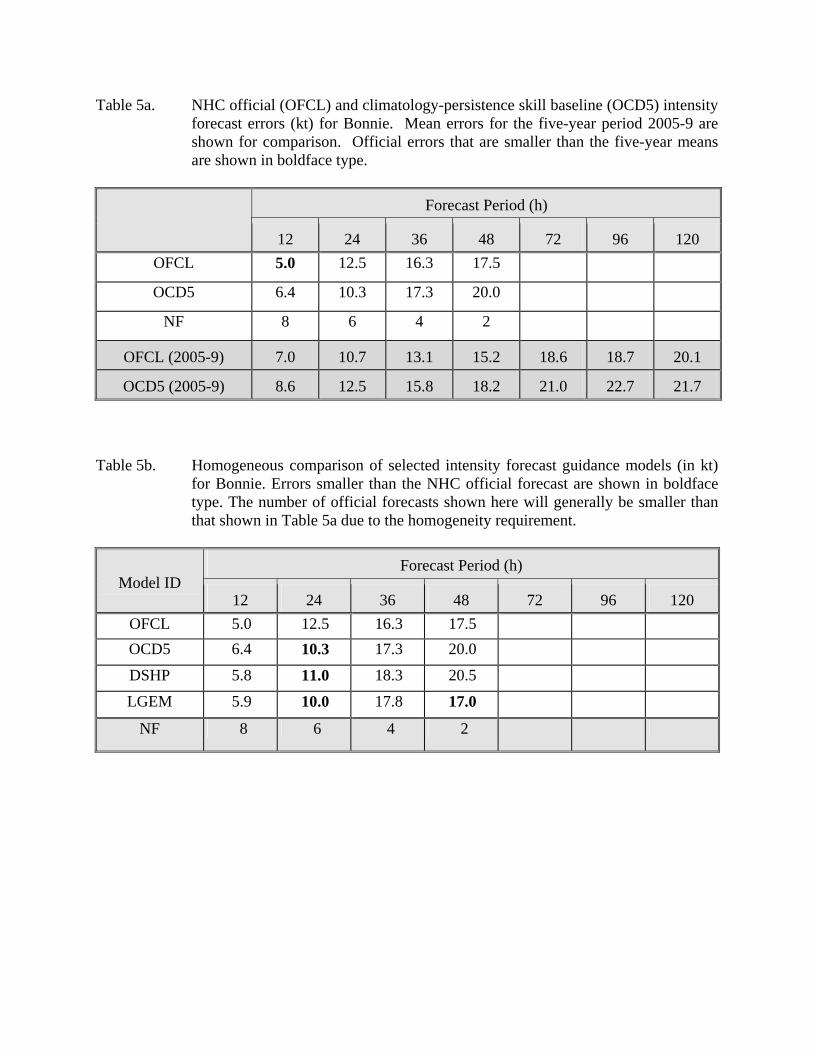
Table 5a. NHC official (OFCL) and climatology-persistence skill baseline (OCD5) intensity forecast errors (kt) for Bonnie. Mean errors for the five-year period 2005-9 are shown for comparison. Official errors that are smaller than the five-year means are shown in boldface type.
Forecast Period (h)
12 24 36 48 72 96 120
OFCL 5.0 12.5 16.3 17.5
OCD5 6.4 10.3 17.3 20.0
NF 8 6 4 2
OFCL (2005-9) 7.0 10.7 13.1 15.2 18.6 18.7 20.1
OCD5 (2005-9) 8.6 12.5 15.8 18.2 21.0 22.7 21.7
Table 5b. Homogeneous comparison of selected intensity forecast guidance models (in kt)
for Bonnie. Errors smaller than the NHC official forecast are shown in boldface type. The number of official forecasts shown here will generally be smaller than that shown in Table 5a due to the homogeneity requirement.
Model ID Forecast Period (h)
12 24 36 48 72 96 120
OFCL 5.0 12.5 16.3 17.5
OCD5 6.4 10.3 17.3 20.0
DSHP 5.8 11.0 18.3 20.5
LGEM 5.9 10.0 17.8 17.0
NF 8 6 4 2
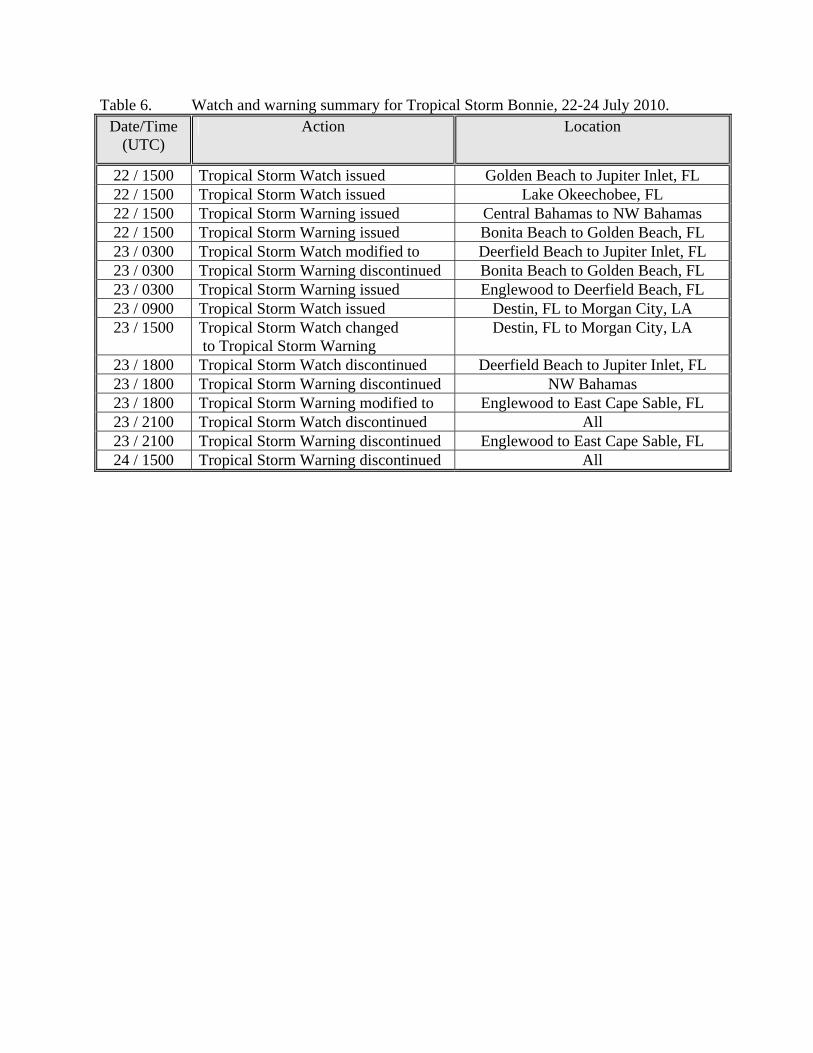
Table 6. Watch and warning summary for Tropical Storm Bonnie, 22-24 July 2010. Date/Time
(UTC) Action Location
22 / 1500 Tropical Storm Watch issued Golden Beach to Jupiter Inlet, FL 22 / 1500 Tropical Storm Watch issued Lake Okeechobee, FL 22 / 1500 Tropical Storm Warning issued Central Bahamas to NW Bahamas 22 / 1500 Tropical Storm Warning issued Bonita Beach to Golden Beach, FL 23 / 0300 Tropical Storm Watch modified to Deerfield Beach to Jupiter Inlet, FL 23 / 0300 Tropical Storm Warning discontinued Bonita Beach to Golden Beach, FL 23 / 0300 Tropical Storm Warning issued Englewood to Deerfield Beach, FL 23 / 0900 Tropical Storm Watch issued Destin, FL to Morgan City, LA 23 / 1500 Tropical Storm Watch changed
to Tropical Storm Warning Destin, FL to Morgan City, LA
23 / 1800 Tropical Storm Watch discontinued Deerfield Beach to Jupiter Inlet, FL 23 / 1800 Tropical Storm Warning discontinued NW Bahamas 23 / 1800 Tropical Storm Warning modified to Englewood to East Cape Sable, FL 23 / 2100 Tropical Storm Watch discontinued All 23 / 2100 Tropical Storm Warning discontinued Englewood to East Cape Sable, FL 24 / 1500 Tropical Storm Warning discontinued All
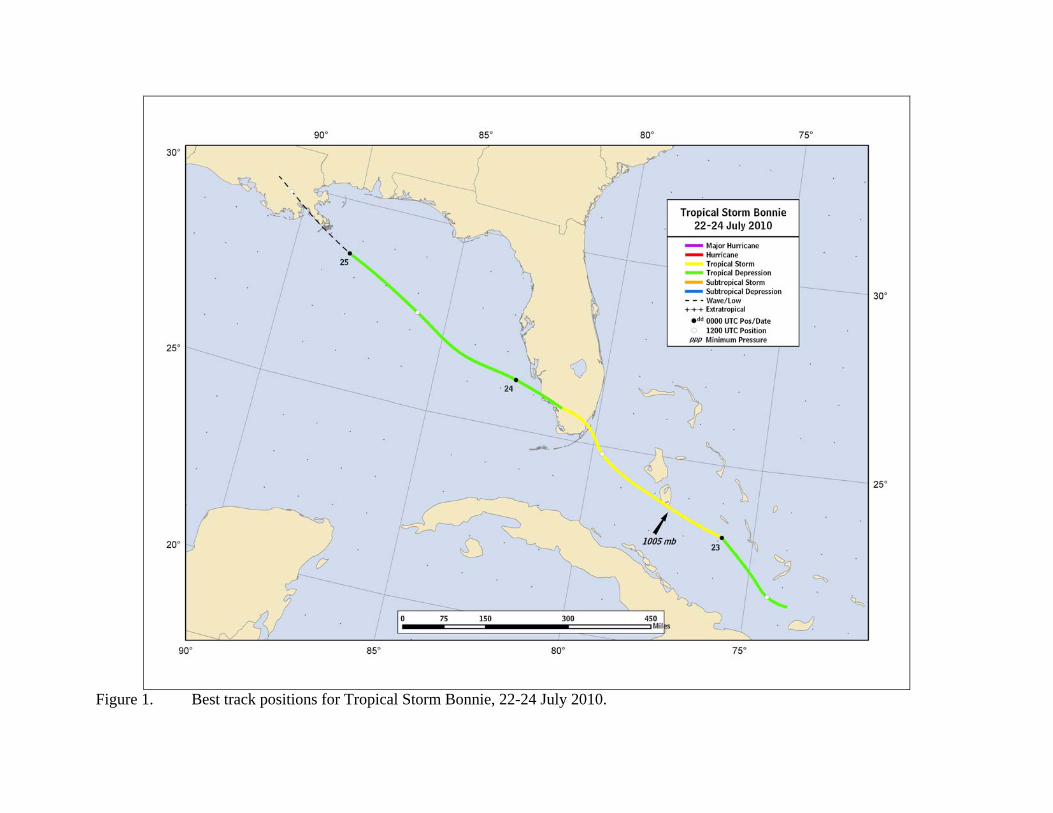
Figure 1. Best track positions for Tropical Storm Bonnie, 22-24 July 2010.
10
20
30
40
50
60
7/20 7/21 7/22 7/23 7/24 7/25 7/26
BEST TRACKSat (TAFB)Sat (SAB)ADTAC (sfc)AC (flt>sfc)AC (DVK P>W)ScatterometerSurfaceAMSU
Win
d Sp
eed
(kt)
Date (Month/Day)
Tropical Storm Bonnie22 - 24 July 2010
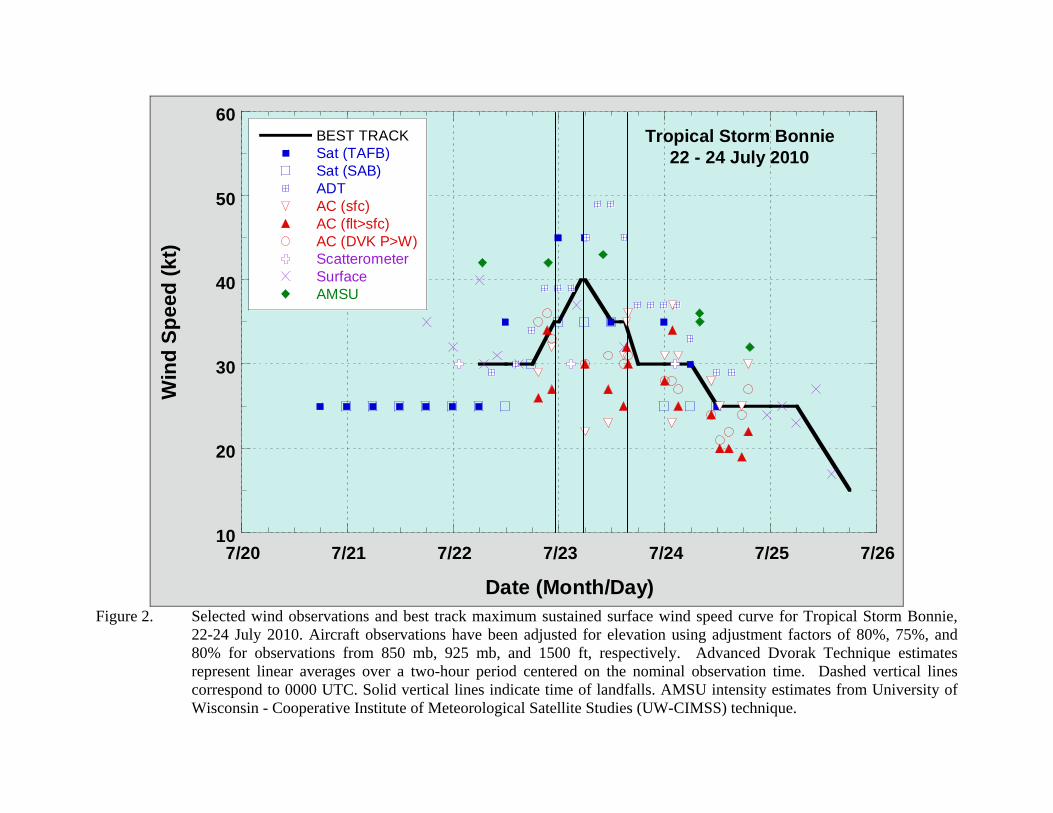
Figure 2. Selected wind observations and best track maximum sustained surface wind speed curve for Tropical Storm Bonnie,
22-24 July 2010. Aircraft observations have been adjusted for elevation using adjustment factors of 80%, 75%, and 80% for observations from 850 mb, 925 mb, and 1500 ft, respectively. Advanced Dvorak Technique estimates represent linear averages over a two-hour period centered on the nominal observation time. Dashed vertical lines correspond to 0000 UTC. Solid vertical lines indicate time of landfalls. AMSU intensity estimates from University of Wisconsin - Cooperative Institute of Meteorological Satellite Studies (UW-CIMSS) technique.
990
1000
1010
1020
7/20 7/21 7/22 7/23 7/24 7/25 7/26
BEST TRACKSat (TAFB)Sat (SAB)ADTAMSUAC (sfc)SurfaceKZC P-W
Pres
sure
(mb)
Date (Month/Day)
Tropical Storm Bonnie22 - 24 July 2010
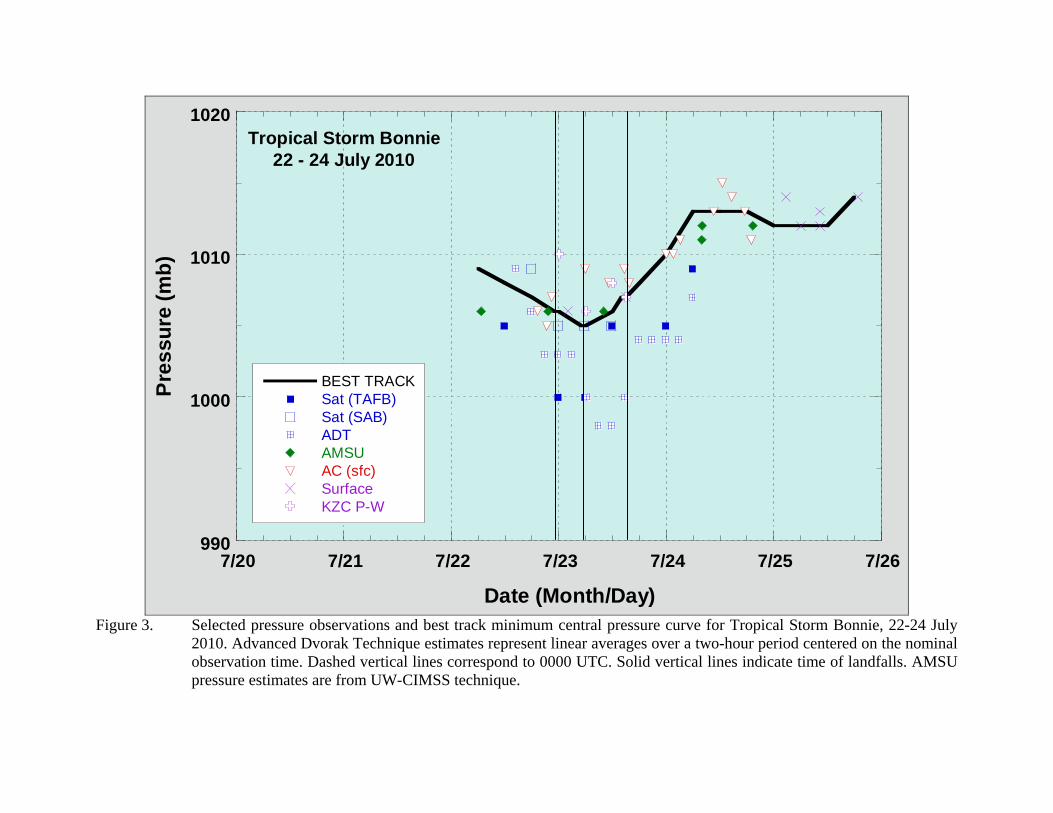
Figure 3. Selected pressure observations and best track minimum central pressure curve for Tropical Storm Bonnie, 22-24 July
2010. Advanced Dvorak Technique estimates represent linear averages over a two-hour period centered on the nominal observation time. Dashed vertical lines correspond to 0000 UTC. Solid vertical lines indicate time of landfalls. AMSU pressure estimates are from UW-CIMSS technique.
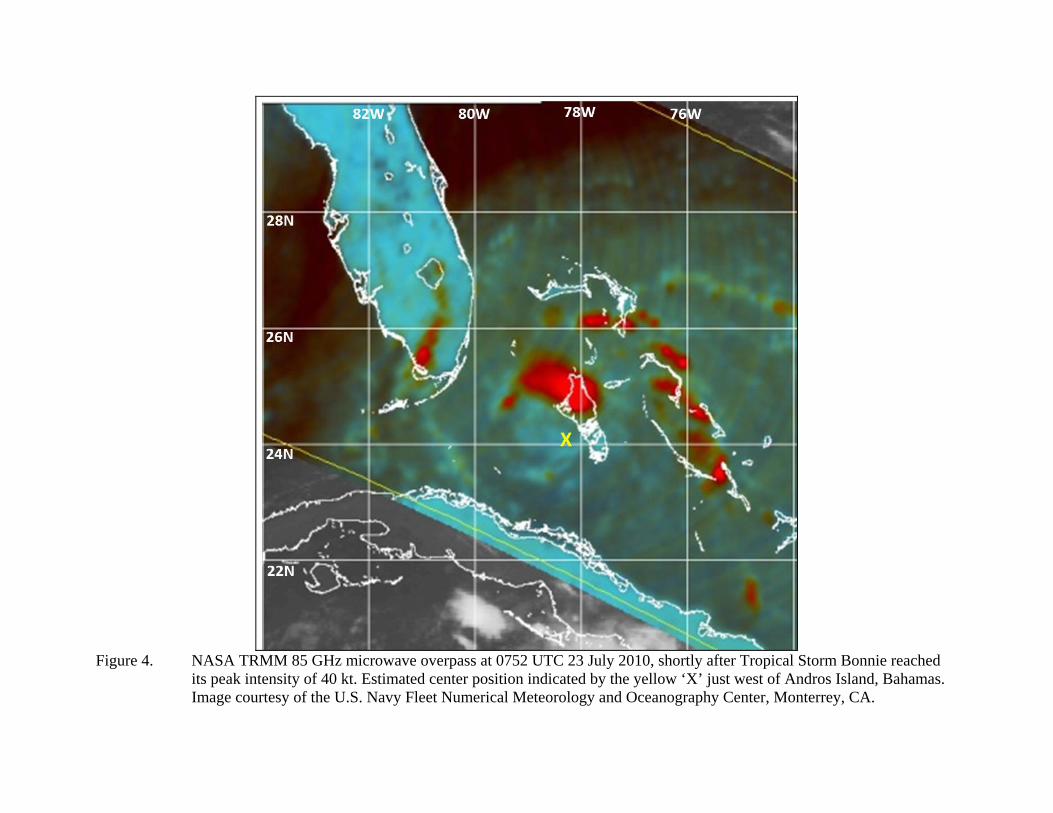
Figure 4. NASA TRMM 85 GHz microwave overpass at 0752 UTC 23 July 2010, shortly after Tropical Storm Bonnie reached
its peak intensity of 40 kt. Estimated center position indicated by the yellow ‘X’ just west of Andros Island, Bahamas. Image courtesy of the U.S. Navy Fleet Numerical Meteorology and Oceanography Center, Monterrey, CA.
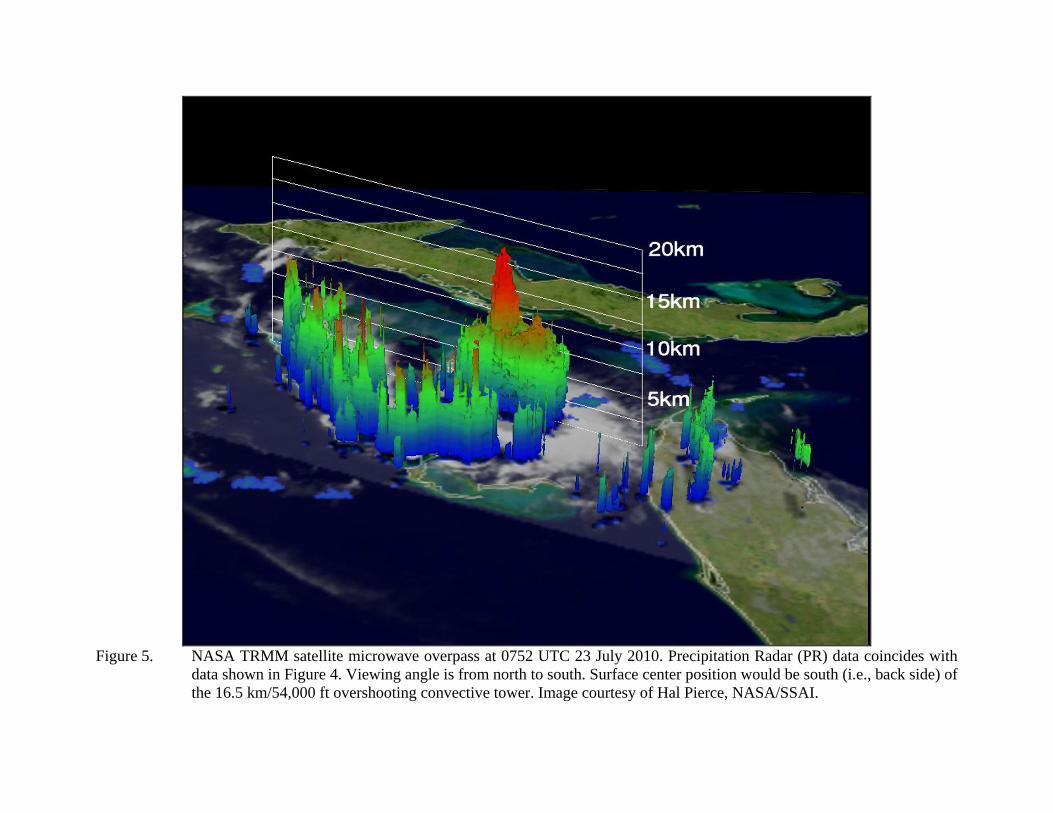
Figure 5. NASA TRMM satellite microwave overpass at 0752 UTC 23 July 2010. Precipitation Radar (PR) data coincides with
data shown in Figure 4. Viewing angle is from north to south. Surface center position would be south (i.e., back side) of the 16.5 km/54,000 ft overshooting convective tower. Image courtesy of Hal Pierce, NASA/SSAI.
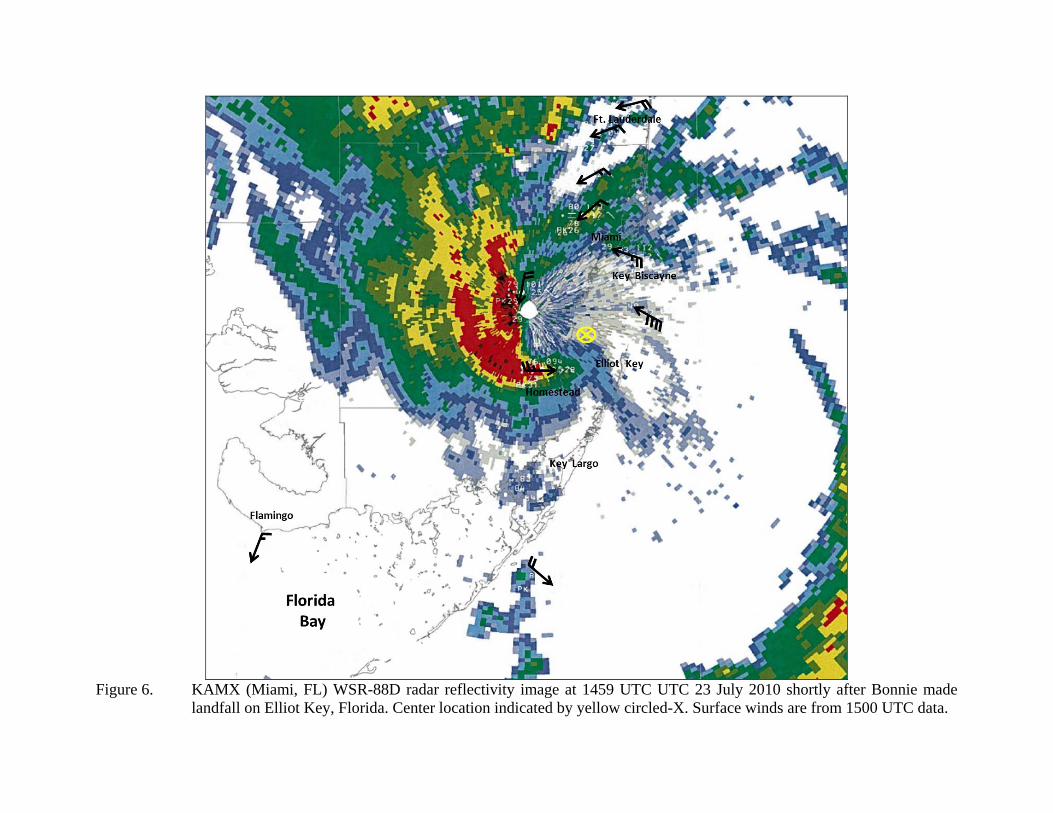
Figure 6. KAMX (Miami, FL) WSR-88D radar reflectivity image at 1459 UTC UTC 23 July 2010 shortly after Bonnie made
landfall on Elliot Key, Florida. Center location indicated by yellow circled-X. Surface winds are from 1500 UTC data.