Hurricane/Post-Tropical Cyclone Sandy Service Assessment - NOAA
1
Tropical Cyclone Report
Hurricane Rita
18-26 September 2005
Richard D. Knabb, Daniel P. Brown, and Jamie R. Rhome
National Hurricane Center
17 March 2006
Updated 14 September 2011 to include damage estimates from the National
Flood Insurance Program and to revise the total damage estimate
Updated 14 August 2006 for updated property damage cost estimates
and for a few storm surge observations
Rita was an intense hurricane that reached Category 5 strength (on the Saffir-Simpson
Hurricane Scale) over the central Gulf of Mexico, where it had the fourth-lowest central pressure
on record in the Atlantic basin. Although it weakened prior to making landfall as a Category 3
hurricane near the Texas/Louisiana border, Rita produced significant storm surge that devastated
coastal communities in southwestern Louisiana, and its winds, rain, and tornadoes caused
fatalities and a wide swath of damage from eastern Texas to Alabama. Additionally, Rita caused
floods due to storm surge in portions of the Florida Keys.
a. Synoptic History
Rita originated from a complex interaction between a tropical wave and the remnants of a
cold front. The tropical wave moved off the west coast of Africa on 7 September. It failed to
produce much deep convection as it traversed the tropical Atlantic during 8-12 September.
Convection briefly consolidated along the axis of the tropical wave late on 13 September about
800 miles east of the Lesser Antilles, but it soon diminished again. Meanwhile, a cold front had
pushed southward over the central Atlantic during 11-12 September and then became stationary
a couple hundred miles north of the Leeward Islands on 13 September. The southern extent of
the stationary front lost definition and became a remnant surface trough on 14 September. This
trough then drifted westward on 15 September and detached from the remainder of the
weakening front as strong high pressure built eastward over the western Atlantic. The detached
trough moved slowly westward to the north of Puerto Rico and the Virgin Islands on 16
September, producing a large but disorganized area of disturbed weather.
Accompanied by very limited convection, the tropical wave moved westward across the
Leeward Islands on 16 September and then merged with the surface trough north of Puerto Rico
early on 17 September. Shower and thunderstorm activity became more concentrated later that
day north of the Dominican Republic, and the area of disturbed weather was given its first
satellite classifications by the Tropical Analysis and Forecast Branch (TAFB) and the Satellite
Analysis Branch (SAB) at 1800 UTC 17 September. A continued gradual increase in
organization was aided by just enough relaxation of vertical shear, as a middle- to upper-
2
tropospheric low that had been positioned over the western Atlantic shifted westward over Cuba
and the northwestern Caribbean Sea. A tropical depression is estimated to have formed by 0000
UTC 18 September approximately 70 n mi east of Grand Turk in the Turks and Caicos.
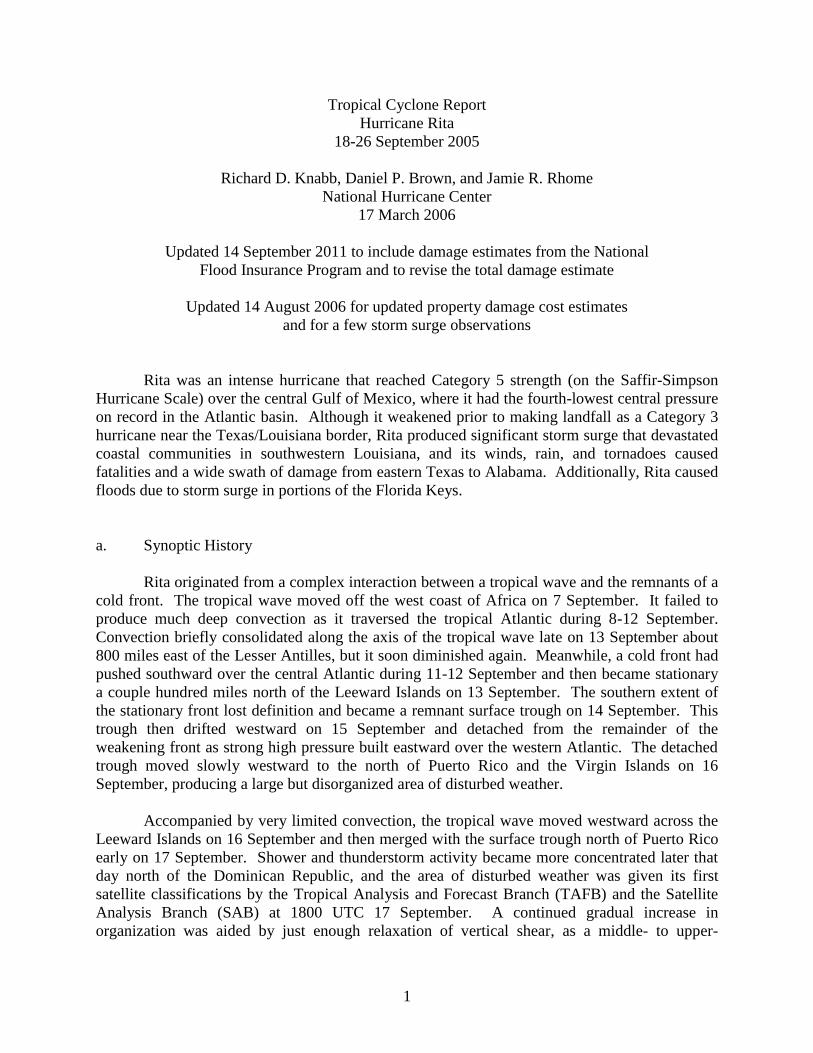
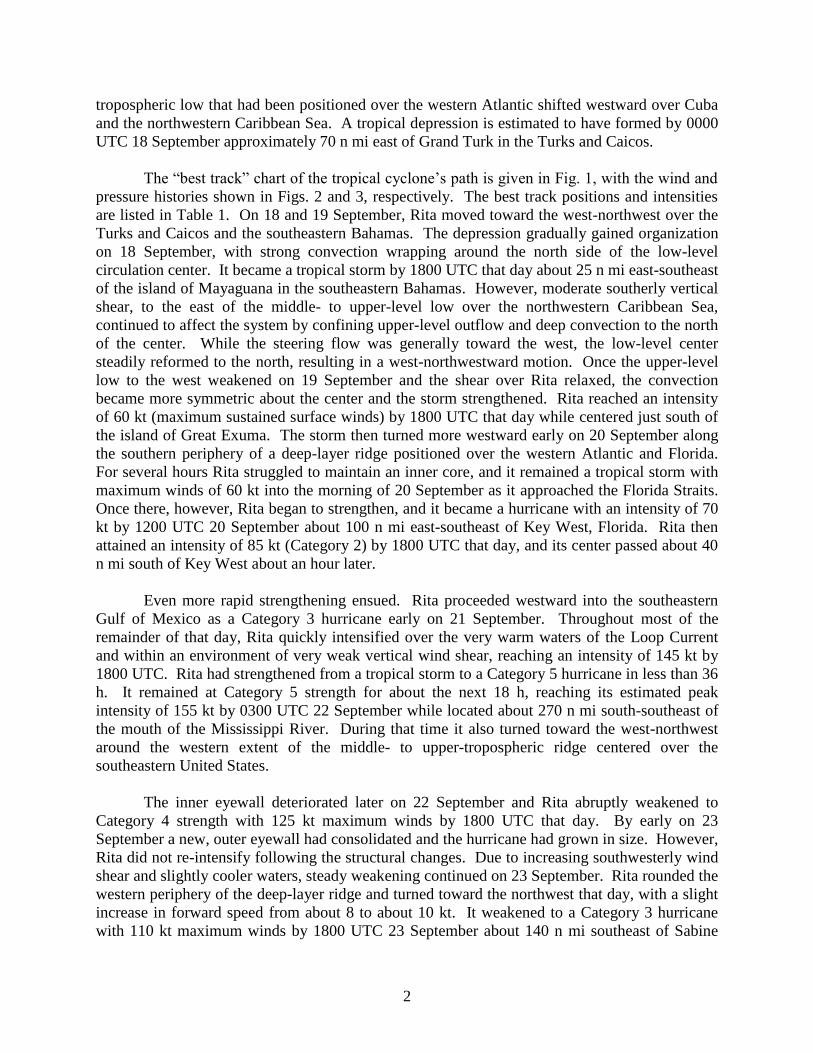
The “best track” chart of the tropical cyclone’s path is given in Fig. 1, with the wind and
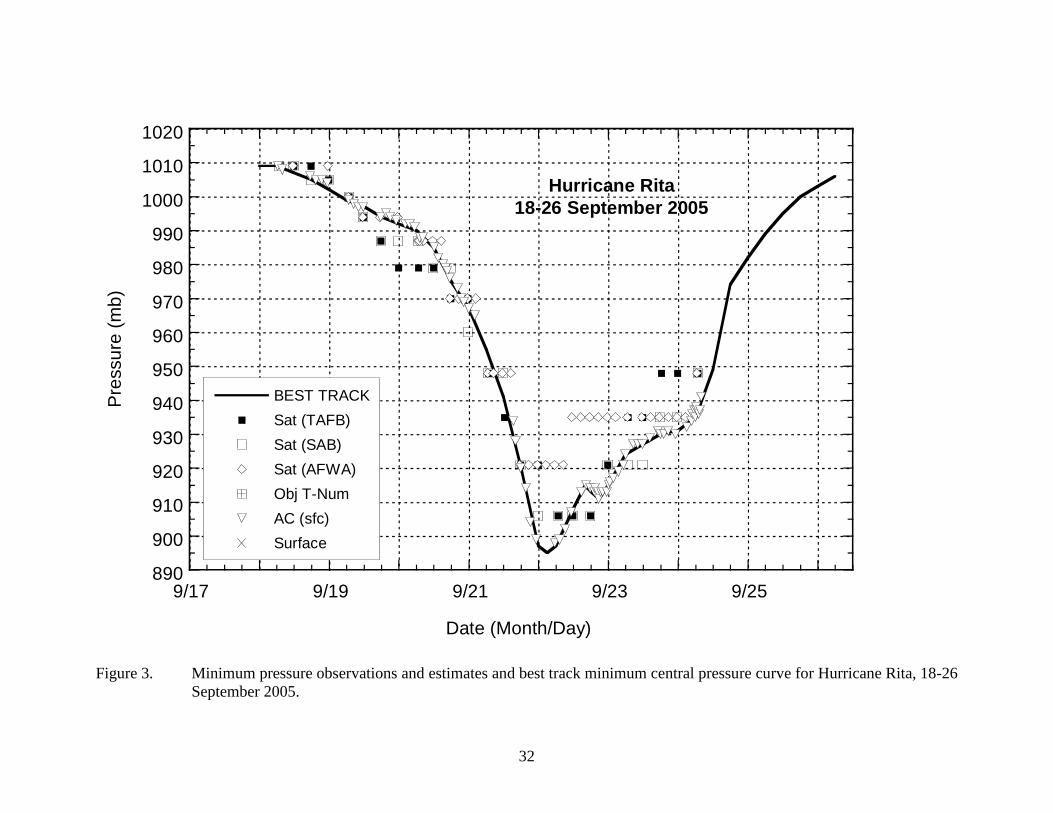
pressure histories shown in Figs. 2 and 3, respectively. The best track positions and intensities
are listed in Table 1. On 18 and 19 September, Rita moved toward the west-northwest over the
Turks and Caicos and the southeastern Bahamas. The depression gradually gained organization
on 18 September, with strong convection wrapping around the north side of the low-level
circulation center. It became a tropical storm by 1800 UTC that day about 25 n mi east-southeast
of the island of Mayaguana in the southeastern Bahamas. However, moderate southerly vertical
shear, to the east of the middle- to upper-level low over the northwestern Caribbean Sea,
continued to affect the system by confining upper-level outflow and deep convection to the north
of the center. While the steering flow was generally toward the west, the low-level center
steadily reformed to the north, resulting in a west-northwestward motion. Once the upper-level
low to the west weakened on 19 September and the shear over Rita relaxed, the convection
became more symmetric about the center and the storm strengthened. Rita reached an intensity
of 60 kt (maximum sustained surface winds) by 1800 UTC that day while centered just south of
the island of Great Exuma. The storm then turned more westward early on 20 September along
the southern periphery of a deep-layer ridge positioned over the western Atlantic and Florida.
For several hours Rita struggled to maintain an inner core, and it remained a tropical storm with
maximum winds of 60 kt into the morning of 20 September as it approached the Florida Straits.
Once there, however, Rita began to strengthen, and it became a hurricane with an intensity of 70
kt by 1200 UTC 20 September about 100 n mi east-southeast of Key West, Florida. Rita then
attained an intensity of 85 kt (Category 2) by 1800 UTC that day, and its center passed about 40
n mi south of Key West about an hour later.
Even more rapid strengthening ensued. Rita proceeded westward into the southeastern
Gulf of Mexico as a Category 3 hurricane early on 21 September. Throughout most of the
remainder of that day, Rita quickly intensified over the very warm waters of the Loop Current
and within an environment of very weak vertical wind shear, reaching an intensity of 145 kt by
1800 UTC. Rita had strengthened from a tropical storm to a Category 5 hurricane in less than 36
h. It remained at Category 5 strength for about the next 18 h, reaching its estimated peak
intensity of 155 kt by 0300 UTC 22 September while located about 270 n mi south-southeast of
the mouth of the Mississippi River. During that time it also turned toward the west-northwest
around the western extent of the middle- to upper-tropospheric ridge centered over the
southeastern United States.
The inner eyewall deteriorated later on 22 September and Rita abruptly weakened to
Category 4 strength with 125 kt maximum winds by 1800 UTC that day. By early on 23
September a new, outer eyewall had consolidated and the hurricane had grown in size. However,
Rita did not re-intensify following the structural changes. Due to increasing southwesterly wind
shear and slightly cooler waters, steady weakening continued on 23 September. Rita rounded the
western periphery of the deep-layer ridge and turned toward the northwest that day, with a slight
increase in forward speed from about 8 to about 10 kt. It weakened to a Category 3 hurricane
with 110 kt maximum winds by 1800 UTC 23 September about 140 n mi southeast of Sabine

3
Pass at the Texas/Louisiana border. Rita maintained Category 3 status up to the time of landfall
of the center, which occurred at 0740 UTC 24 September with an estimated intensity of 100 kt,
in extreme southwestern Louisiana just west of Johnson’s Bayou and just east of Sabine Pass.
Rita weakened after making landfall, remaining a hurricane until only about 1200 UTC
24 September when it was centered about 35 n mi north of Beaumont, Texas. As a steadily
weakening tropical storm, Rita proceeded northward, with its center moving roughly along the
Texas/Louisiana border during the remainder of that day. Rita weakened to a tropical depression
by 0600 UTC 25 September while centered over southwestern Arkansas and then turned
northeastward ahead of an approaching frontal system. The depression lost its organized
convection and degenerated to a remnant low early on 26 September over southeastern Illinois.
The low was absorbed into a frontal zone later that morning over the southern Great Lakes
region.
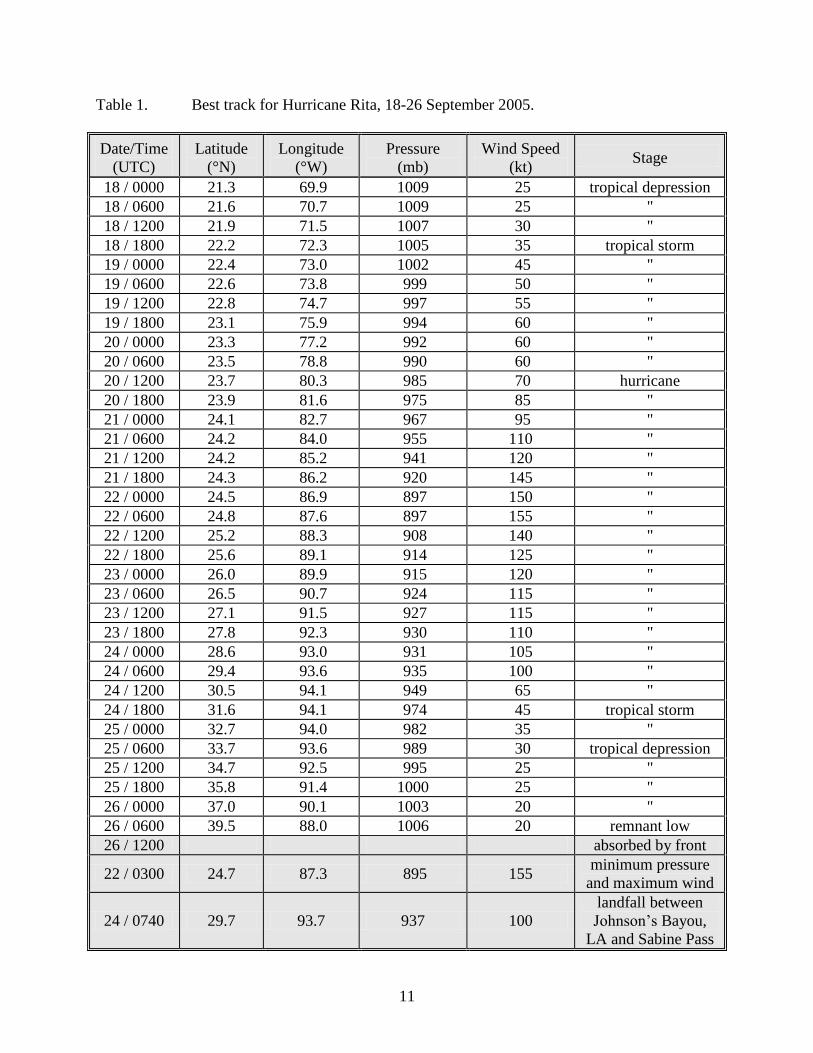
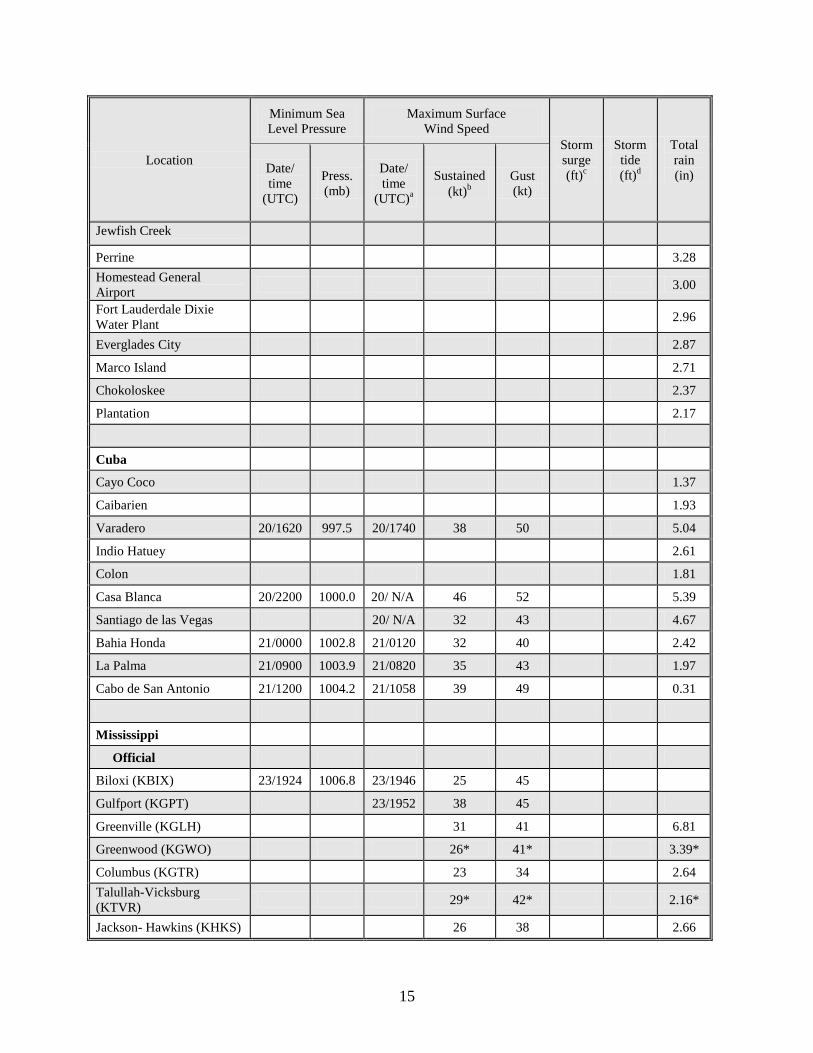
b. Meteorological Statistics
Observations in Rita (Figs. 2 and 3) include data from satellites, aircraft, airborne and
ground-based radars, conventional land-based surface and upper-air observing sites, Coastal-
Marine Automated Network (C-MAN) stations, National Ocean Service (NOS) stations, ocean
data buoys, and ships. Selected ship reports of winds of tropical storm force associated with Rita
are given in Table 2, and selected surface observations from land stations and from coastal and
fixed ocean data buoys are given in Table 3. Data from many Automated Surface Observing
System (ASOS) sites, C-MAN and NOS stations, and buoys are incomplete due to weather-
induced failures prior to or about the time when peak winds and minimum pressures occurred.
Satellite observations include geostationary satellite-based Dvorak Technique intensity
estimates from TAFB, SAB, and the U. S. Air Force Weather Agency (AFWA). Microwave
satellite data and imagery from National Oceanic and Atmospheric Administration (NOAA)
satellites, Defense Meteorological Satellite Program (DMSP) satellites, and National Aeronautics
and Space Administration (NASA) satellites, including the Tropical Rainfall Measuring Mission
(TRMM), QuikSCAT, and Aqua, were also useful in tracking Rita and assessing changes in its
internal structure.
Since Rita formed in the western Atlantic and spent its entire life span near or over land
areas, aircraft reconnaissance missions were tasked almost continuously from its genesis until
final landfall. Observations from aircraft include flight-level and dropwindsonde data from 16
operational missions into Rita that were conducted by the 53rd Weather Reconnaissance
Squadron of the U. S. Air Force Reserve Command, which produced 63 center fixes. Seven
missions were flown by the NOAA Aircraft Operations Center (AOC) WP-3D aircraft,
producing additional flight-level and dropwindsonde observations, 15 center fixes, surface wind
speed data from the Stepped Frequency Microwave Radiometer (SFMR) with post-storm
calibration conducted by the NOAA Hurricane Research Division (HRD), and airborne Doppler
radar-derived wind analyses also provided by HRD. Additionally, the NOAA G-IV jet
conducted eight synoptic surveillance missions around Rita during 19-23 September.

4
NWS WSR-88D Doppler radars at Key West, Florida and Lake Charles, Louisiana
provided center fixes on Rita. Velocity data from these radars were used to help estimate the
intensity of Rita when it was near or over land.
Several data sources indicate that Rita was a hurricane with maximum sustained surface
winds (one-minute average at 10 m elevation) of 70 kt by 1200 UTC 20 September, although it
probably first reached hurricane status an hour or two earlier. Radar imagery from the Key West
NWS WSR-88D shows that as Rita moved into the Florida Straits that morning it developed a
persistent eye, and the radar velocity data indicate that winds near 90 kt at about 5000 ft
(corresponding to about 70 kt at the surface using an average 80% adjustment from that altitude)
began about 1200 UTC. A surface wind estimate of 73 kt was then obtained at 1342 UTC from a
dropwindsonde, derived from the mean wind over the lowest 150 m of the sounding (labeled
‘LLM’ in Fig. 2). The intensity of 85 kt at 1800 UTC 20 September, near the time of the
center’s closest approach to Key West, is based on WSR-88D velocity data, a peak SFMR
surface wind speed measurement of 81 kt at 1605 UTC, and a few dropwindsondes that directly
measured surface (10 m) winds near 90 kt between about 1330 UTC and 2230 UTC. The
maximum winds in Rita remained just south of the Florida Keys, although sustained hurricane-
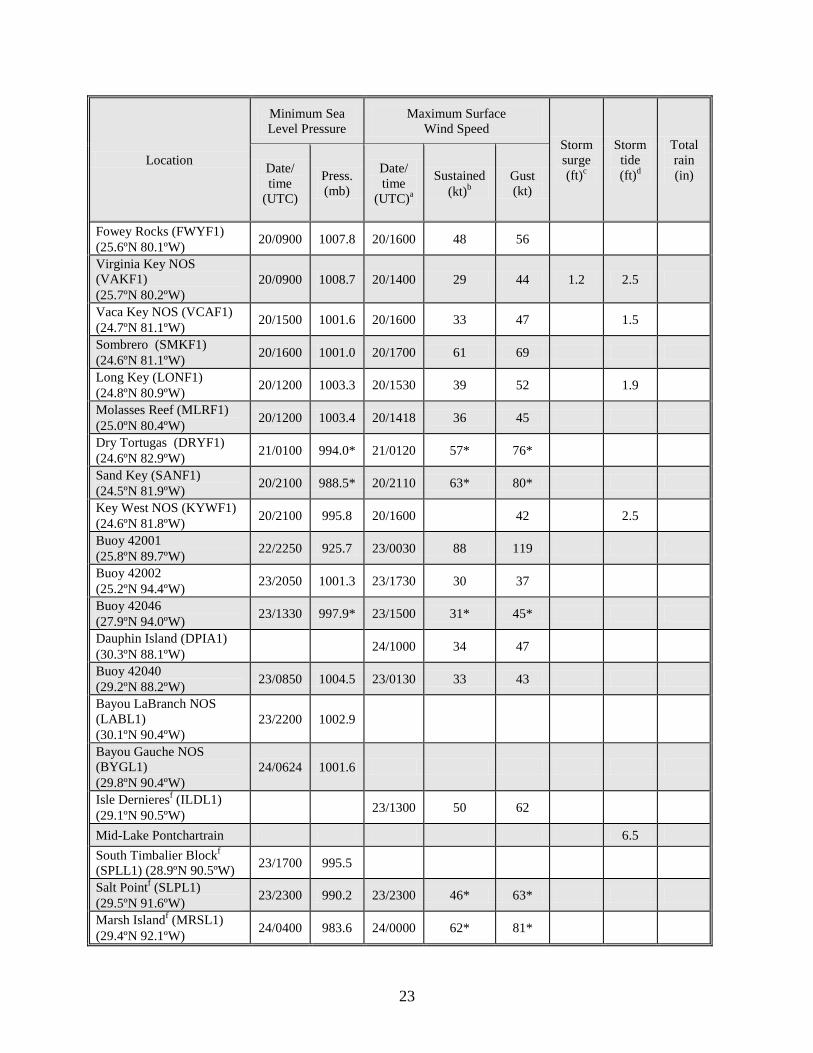
force winds might have impacted portions of the extreme lower Keys for a brief period. The
Sand Key C-MAN station, located about 6 n mi southwest of Key West but with an anemometer
height of 44 m, reported a 10-minute average wind of 63 kt at 2110 UTC, with an earlier peak
gust to 80 kt. A one-minute sustained wind was probably slightly stronger, and the actual peak
wind could have occurred after the instrument was destroyed around 2200 UTC. The Key West
International Airport later measured a two-minute sustained wind of 54 kt with a gust to 66 kt at
2314 UTC. Most of the remainder of the Keys experienced sustained winds and gusts of tropical
storm force (Table 3). Wind gusts of tropical storm force were experienced over much of the
extreme southern Florida peninsula south of Lake Okeechobee on 20 September. Several reports
of sustained winds of tropical storm force were received from western Cuba on 20 and 21
September while the center passed within about 40 n mi from the north coast of the island.
Aircraft and satellite data indicate that Rita intensified on 21 September from 95 kt
(Category 2) at 0000 UTC that day to 145 kt (Category 5) just 18 h later. The first wind
observation supporting Category 5 intensity was 138 kt at 1606 UTC from the SFMR, using a
post-season calibration based on dropwindsonde data to improve performance at extreme wind
speeds. The peak SFMR estimate was 146 kt at 1912 UTC 21 September, followed by a 144 kt
estimate at 1945 UTC. A 700-mb flight-level wind of 161 kt was measured near 1935 UTC,
corresponding to about 145 kt at the surface based on the average 90% adjustment from 700 mb.
Two dropwindsondes directly measured 10-m winds of 142 and 149 kt shortly after 1930 UTC
(Fig. 2).
Analysis of dropwindsonde observations indicates that the central pressure in Rita fell a
remarkable 70 mb in the 24-h period ending 0000 UTC 22 September (Fig. 3), when the pressure
had fallen to an estimated 897 mb with an estimated wind intensity of 150 kt. The best track
central pressure at that time is based upon a dropwindsonde observation at 2309 UTC 21
September of 899 mb, but with a surface wind of 32 kt; therefore, the actual central pressure was
likely a couple of mb lower. Following that penetration of the eye, the aircraft departed Rita and

5
no reconnaissance data were available during the subsequent six-hour period between about 2330
UTC 21 September and 0530 UTC 22 September.
When the next aircraft arrived, dropwindsondes in the eye measured 898 mb (with a
surface wind of 13 kt) at 0538 UTC and 899 mb (with a surface wind of 35 kt) at 0715 UTC.
Based on these data, the best track central pressure is also estimated at 897 mb at 0600 UTC 22
September. However, due to the roughly six-hour gap in aircraft data, the lowest pressure and
maximum winds that actually occurred in Rita are subject to speculation. Since the pressure was
falling until 0000 UTC and rising after 0600 UTC, the minimum pressure in Rita probably
occurred at about 0300 UTC 22 September and is estimated at 895 mb. This value represents the
fourth-lowest on record in the Atlantic basin best track database, behind 882 mb in Wilma
(2005), 888 mb in Gilbert (1988), and 892 mb in the 1935 Florida Keys hurricane. The
maximum 700-mb flight-level wind observed during Rita was 165 kt at 0538 UTC 22
September, corresponding to about 149 kt at the surface. However, the very limited temporal
and spatial sampling by aircraft during the period of minimum pressure increases the likelihood
that the actual maximum flight-level wind was not measured. The eye diameter as reported by
aircraft contracted from 20 n mi near 0000 UTC to 16 n mi near 0600 UTC, suggesting that
slight strengthening could have occurred during that time. Dvorak intensity estimates from both
TAFB and SAB were 155 kt at 0645 UTC 22 September, and that was the first time both
agencies provided an estimate that high (only SAB estimated 155 kt at 2345 UTC 21
September). Considering all of these factors, the peak best track intensity is set to 155 kt (just 5
kt greater than what was assessed operationally) and is estimated to have occurred at 0300 and
0600 UTC 22 September. Following two days of rapid strengthening, Rita had also become a
large hurricane, with 34-kt winds extending up to 160 n mi from the center at the time of peak
intensity.
The weakening of Rita during the last 48 h leading up to landfall was associated with
significant changes in its internal structure. Aircraft flight-level wind maxima and passive
microwave imagery reveal that on 22 September an outer eyewall developed while the inner
eyewall deteriorated. By early on 23 September, the original, inner eyewall was no longer
present, and the eye diameter had increased to about 30 n mi. This sequence of events is
depicted in Fig. 4 (panels B through E) by a series of passive microwave images from AMSR-E,
TRMM, and SSMI; for comparison, panel A shows Rita shortly after reaching Category 5
intensity on 21 September. One consequence of these structural changes was some additional
expansion of Rita’s wind field, and by early on 23 September, winds of tropical storm force
extended up to about 180 n mi from the center and hurricane-force winds extended up to about
75 n mi out. The central pressure only slowly climbed while Rita’s winds weakened over the
northwestern Gulf. However, due to the structural changes, the maximum sustained winds
decreased fairly quickly, especially in the first 24 h after peak intensity, as indicated by all
available aircraft data (Fig. 2).
The strongest 700-mb flight-level winds during the few hours leading up to landfall were
111-115 kt, east and northeast of the eye within the deep convection that remained north of the
center. These data correspond to surface winds of 100-104 kt using the average 90% adjustment.
However, WSR-88D velocity data from Lake Charles, Louisiana around the time of landfall
depict winds near the top of the boundary layer (about 500 m in altitude) of up to about 120 kt

6
over water near the coast and east of the eye. Based on an average 75% adjustment from that
altitude, these data would correspond to about 90 kt surface winds. Additionally, a
dropwindsonde at 0544 UTC provided an estimated 92 kt surface wind, derived from an average
80% adjustment of the 115 kt mean boundary layer wind speed in the profile. Based on these
various data, and since the maximum surface wind at landfall was likely not sampled by the
aircraft or radar, the landfall intensity is set to 100 kt. This intensity is 5 kt less than what was
assessed operationally but is still of Category 3 strength.
The central pressure at landfall is estimated at 937 mb based on dropwindsonde data just
a few minutes earlier. The landfall pressure and the 935 mb best track pressure at 0600 UTC 24
September are the lowest on record in the Atlantic basin for an intensity of 100 kt. Similar to
Katrina one month earlier, the relatively weak winds in Rita for such a low pressure result from
the broadening pressure field during its last 48 h over the Gulf of Mexico that spread the pressure
gradient over a much larger than average distance from the center, as confirmed by both surface
and aircraft observations.
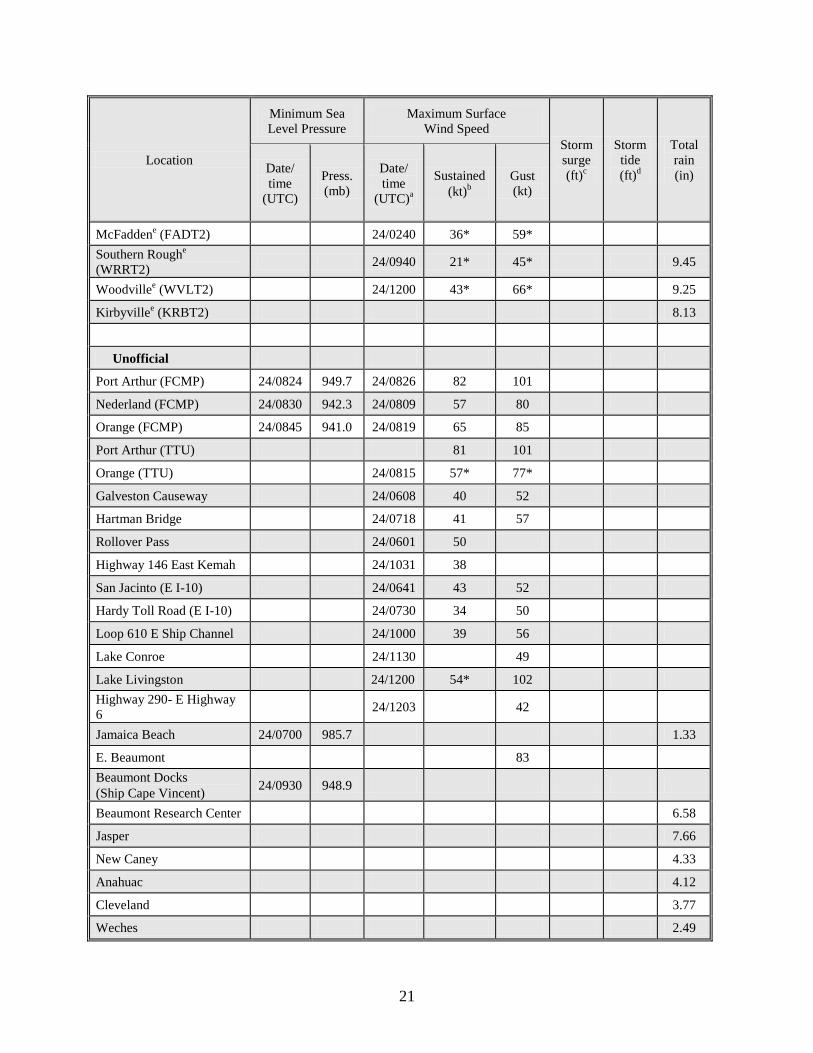
The strongest sustained wind reported from an official surface observing site was 71 kt
(with a gust to 86 kt) at the C-MAN station (anemometer height of 13 m) at Sabine River, Texas
near the Louisiana border at 0700 UTC 24 September. Sustained hurricane-force winds were
also reported at the Southeast Texas Regional Airport in Beaumont, Texas (70 kt) and at the
Calcasieu Pass, Louisiana NOS station (67 kt), although the latter became inoperative more than
two hours prior to landfall of the center of Rita. A variety of temporary instrumented towers in
extreme southeastern Texas also measured sustained hurricane-force winds, as strong as 82 kt,
with peak 3-second gusts up to about 100 kt (Table 3). All available data suggest that many
areas in extreme southeastern Texas and extreme southwestern Louisiana experienced Category
1 hurricane conditions, and a few areas experienced Category 2 hurricane conditions, with
Category 3 hurricane conditions being confined to a very small area east of the eye along the
immediate coast of extreme southwestern Louisiana. Due to its large size, Rita produced
sustained winds of tropical storm force in many portions of southeastern Louisiana (including
cities such as Baton Rouge) and southeastern Texas (including the Houston and Galveston areas)
(Table 3).
Despite having weakened, Rita was still a large Category 3 hurricane at landfall and
produced a very significant storm surge in southwestern Louisiana, an area very vulnerable to
surge. Since so many structures were completely destroyed, and because many gages failed up
to several hours before the center of the hurricane crossed the coast (see Table 3), measuring the
storm surge has been a daunting task. Only a few high water marks have been collected and
analyzed under the direction of the Federal Emergency Management Agency (FEMA). These
data along with unofficial visual estimates suggest that the storm surge in portions of the
Cameron, Louisiana area was as high as about 15 ft. Water was also pushed into Calcasieu Lake,
flooding portions of communities along its shoreline, such as Grand Lake, with a storm surge of
at least about 8 ft. The surge then propagated up the Calcasieu River and flooded portions of the
Lake Charles area, where in several locations the surge reached Interstate 10 (about 25 n mi from
the Gulf coast). Flood waters in downtown Lake Charles were as deep as about 6 ft in some
places. Farther east, most or all of Vermillion, Iberia, and St. Mary Parishes south of Highway
14 and U. S. 90 (several miles inland) were inundated by the storm surge, visually estimated at 8-

7
12 ft in some of these areas; a high water mark of nearly 12 ft was also observed in western St.
Mary Parish near the town of Louisa. The water crossed these highways in numerous locations
and was 3 to 6 ft deep in many homes.
Rita also produced storm surge, generally 4-7 ft based on gage data and a high water
mark observation, in coastal areas of southeastern Louisiana, flooding some areas that had
already been impacted by the surge from Hurricane Katrina about one month earlier. Some
flooding was also reported along Lake Pontchartrain in Slidell and Mandeville. Some local
drainage levees in southern Jefferson and southern Terrebonne Parishes were overtopped or
breached, as were a few repaired levees in the New Orleans area. While the additional flooding
was not as extensive as during Katrina, it contributed to prolonging the efforts, which lasted until
early October, to remove all floodwaters from the New Orleans area.
Just west of the landfall location of the circulation center, incomplete gage data suggest a
storm surge of at least 5 ft occurred at Sabine Pass. Gages that survived the event farther north
along Sabine Lake measured peak water levels of about 4-5 ft. Storm tides measured at gages
along much of the Texas coast were generally in the 3-5 foot range, and most of these peaks
occurred during the day on 23 September (the day prior to landfall). Some flooding occurred
later on 24 September after landfall of Rita’s center along the northern shores of Galveston
Island and the Bolivar Peninsula, as northerly winds pushed waters of Galveston Bay southward.
Sustained winds of tropical storm force produced by Rita also resulted in a surge of about 1.5 ft
on Lake Livingston, located in southeastern Texas about 60 miles north of Houston and about 50
miles west of the path of the center of the storm.
Rita also produced storm surge in the Florida Keys while its center passed just south of
the island chain on 20 September. Visual storm tide estimates suggest the maximum storm surge
in the Keys might have been about 4-5 ft along the south-facing shores of Key West and the
remaining lower Keys, and 3-4 ft along portions of the Atlantic shores of the middle and upper
Keys. The surge flooded the runway at Key West International Airport, and it penetrated up to
about four blocks inland along streets in Key West that were flooded to depths of about three ft.
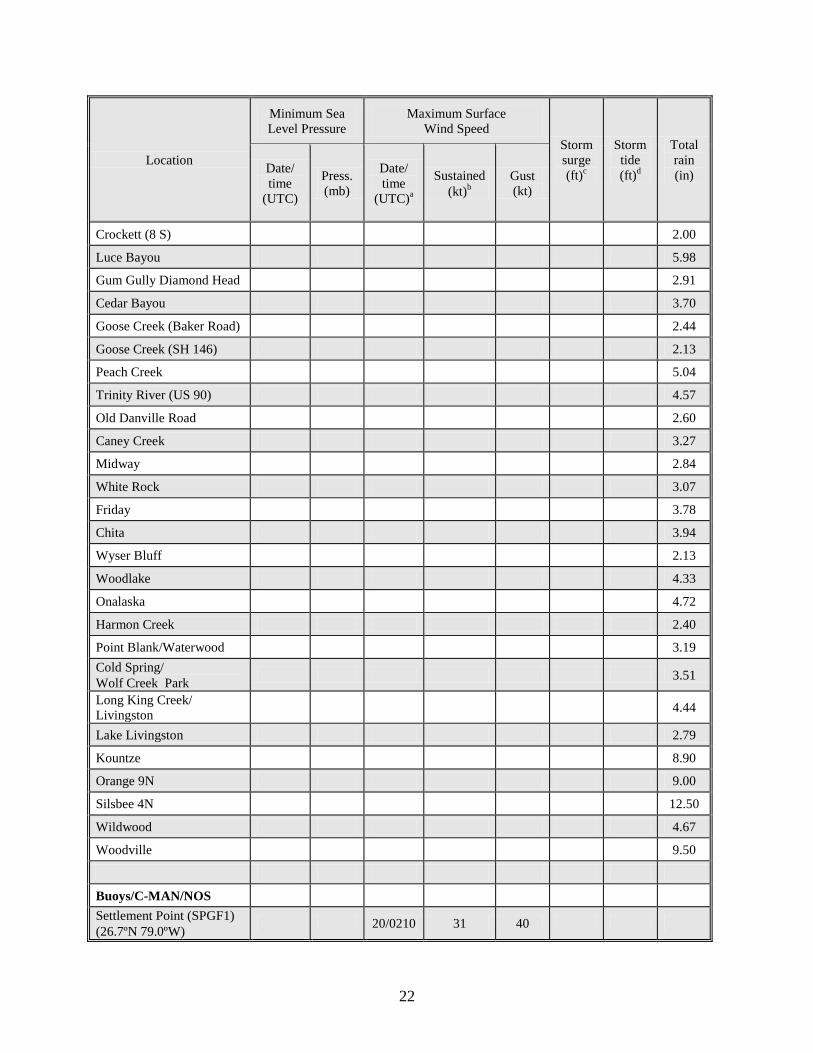
Storm total rainfall in the lower and middle Florida Keys was generally 2-4 in, with
greater than 6 in estimated by radar in portions of the Upper Keys. A few storm total amounts
exceeding 3 in were reported over the extreme southern Florida peninsula. Rita also produced
very heavy rains in many portions of Mississippi, Louisiana, and extreme eastern Texas. Storm
total amounts of 5-9 in were common in these areas, with some isolated maxima of 10-15 in.
Flash floods occurred in several areas, including the Big Black River basin of west-central
Mississippi. Several cities reported flooded streets due to heavy rains. Portions of Arkansas
received 3-6 in of rain from Rita.
At least 90 tornadoes were reported in association with Rita, mainly to the north and east
of the circulation center in portions of Alabama, Mississippi, Louisiana, and Arkansas. Rita
produced the most tornadoes (56) in a single event (of 48 h or less in duration) ever recorded in
the area of responsibility of the Jackson, Mississippi NWS forecast office (which also includes
portions of northeastern Louisiana and extreme southeastern Arkansas). Eleven tornadoes were
reported in other portions of Arkansas, and 23 tornadoes were reported in Alabama.

8
c. Casualty and Damage Statistics
The approach of Rita provoked one the largest evacuations in U. S. history. Media
reports indicate that the number of evacuees in Texas could have exceeded two million.
Additional evacuations involving smaller numbers took place in Louisiana.
Seven fatalities have been directly attributed to the forces of Rita. One was due to
drowning near Lake Charles, Louisiana; two people died in Hardin, Texas when a tree was
blown down onto their home; one person died when a tree fell on her home in Point Blank,
Texas; another person was killed by a falling tree in Angelina County, Texas; one person was
killed in a tornado near Isola, Mississippi; and one person drowned in a rip current at Miramar
Beach in the Florida panhandle on 24 September. At least 55 “indirect” fatalities have been
reported in Texas. Six of these occurred in Beaumont due to carbon monoxide poisoning. A bus
accident south of Dallas during the course of the evacuation killed more than 20 persons, mostly
elderly evacuees from a nursing home. Other persons died during the evacuation due to heat
exhaustion.
The storm surge of Rita devastated entire communities in coastal areas of southwestern
Louisiana, including Holly Beach, Cameron, Creole, and Grand Cheniere in Cameron Parish.
Almost every structure in these areas was destroyed, and some were completely swept away.
Severe beach erosion occurred at Holly Beach. Several miles inland from the Gulf along
Calcasieu Lake, numerous homes in the town of Grand Lake were damaged or destroyed. Many
portions of the Lake Charles area suffered substantial flood damage, including downtown and
some surrounding residential communities. In Vermillion Parish, dozens of homes and
businesses were flooded and damaged by storm surge, and most structures in the town of Pecan
Island were destroyed. Storm surge damage to homes and businesses in low-lying areas
extended eastward along the entire coast of Louisiana, although the impact in the New Orleans
area was not nearly as widespread as during Hurricane Katrina. In Jefferson County, Texas, west
of where the center made landfall and adjacent to Sabine Lake, the storm surge flooded several
homes, and some mobile homes floated away from their original locations. The surge on Lake
Livingston in southeastern Texas caused some damage to the Lake Livingston Dam. Rita also
caused some damage to homes and businesses due to storm surge in portions of the Florida Keys.
Rita’s winds, tornadoes, and fresh water floods caused damage to many other homes and
businesses over a large area including portions of Louisiana, eastern Texas, Mississippi,
Alabama, Arkansas, and the Florida Keys. Rita caused wide swaths of downed trees and power
lines, leaving well over one million customers in these areas without electrical service, some for
days or even weeks. Oil and gas production and refining in the northwestern Gulf of Mexico
region was disrupted by Rita (largely due to evacuations), but the impacts were not as severe as
those farther east due to Hurricane Katrina. The most recent available estimate by the American
Insurance Services Group of the insured property damage in the United States caused by Rita is
$5.627 billion. Doubling this figure to account for uninsured losses and adding the $783 million
in insured losses from the National Flood Insurance Program (NFIP), yields a rough estimate for
total damage of about $12.037 billion.

9
d. Forecast and Warning Critique
Development of the system that eventually became Rita was well-anticipated in the
Atlantic Tropical Weather Outlook (TWO) products issued by the NHC. The system was first
mentioned in the TWO, along with the expectation that upper-level winds would become more
conducive for its development, more than 48 h prior to genesis. An increased potential for the
formation of a tropical depression was conveyed more than 24 h prior to genesis.
Average official (OFCL) track forecast errors in nautical miles (n mi) (with number of
cases in parentheses) for Rita were 27 (29), 54 (29), 76 (27), 93 (25), 120 (21), 164 (17), and 197
(13) for the 12, 24, 36, 48, 72, 96, and 120 h forecasts, respectively. These forecast errors are
considerably smaller than the corresponding average official Atlantic track errors for the 10-year
period 1995-20041: 42, 75, 107, 138, 202, 236, and 310 n mi (Table 4). However, OFCL errors
varied widely during the life span of Rita. Official forecasts issued on 18-19 September, when
Rita was a tropical depression and then a tropical storm, had exceptionally small errors, quite
accurately forecasting Rita’s path through the Florida Straits and into the central Gulf followed
by a turn toward the northwest. Official forecasts issued on 20-21 September, however, were
more biased to the south and were late in forecasting Rita’s turn toward the northwest. Then, on
22-23 September, official forecasts within about 48 h of final landfall were once again quite
accurate, except for incorrectly anticipating Rita to stall within a couple of days after moving
inland (as did all of the reliable models). The significant changes in OFCL errors were
essentially concurrent with two fairly dramatic changes in the track guidance. The model
forecasts shifted south early on 20 September but then back north early on 22 September, and
since these changes were in general unanimous among the reliable models, the official forecasts
trended toward the guidance in both instances. However, in part because the official track
forecasts were changed fairly conservatively, they had average errors beyond 36 h that were
smaller than any of the consensus guidance including GUNA, CONU, and the Florida State
University Superensemble (FSSE). The official track forecasts also had smaller errors at all
forecast times than the interpolated NOGAPS (NGPI), GFDN (GFDI), and UK Met Office
(UKMI) models. The NWS dynamical models performed rather well during Rita. The
interpolated GFDL (GFDI) slightly outperformed OFCL at 72-120 h, while the interpolated GFS
(GFSI) had smaller errors than OFCL out to 48 h and at 120 h (Table 4).
Average official intensity errors during Rita (including depression stage) were 11, 16, 18,
20, 29, 23, and 18 kt for the 12, 24, 36, 48, 72, 96, and 120 h forecasts respectively. The errors
through 72 h are considerably larger than the corresponding Atlantic 10-year (1995-2004)
averages of 6, 10, 12, 15, and 18 kt. The rapid intensification of Rita during 20-21 September,
from a tropical storm to a Category 5 hurricane in less than 36 h, was not anticipated in official
intensity forecasts (although a slower strengthening to major hurricane status was forecast). The
observed rate of weakening after peak intensity also was not anticipated. Obviously, forecasting
such rapid intensity changes remains an operational challenge. However, official forecasts
issued on 19 September, when Rita was still a tropical storm, did anticipate Rita to be at or near
Category 2 hurricane strength before passing by the Florida Keys the next day. Also, every
1 Errors given for the 96 and 120 h periods are averages over the four-year period 2001-4.

10
official forecast issued within about four days of final landfall indicated Rita would be a major
hurricane (at least Category 3 intensity) upon reaching the coast in the northwestern Gulf of
Mexico. Official intensity forecasts generally had smaller average errors than most of the
objective intensity guidance; exceptions were that the SHIPS model (with inland decay
component included) had smaller errors at 48, 72, and 96 h, and the FSSE had smaller errors at
72 and 96 h. The smaller SHIPS errors at 48-96 h are mostly due to its forecasts of more
weakening after Rita’s peak intensity than was indicated in the official intensity forecasts.
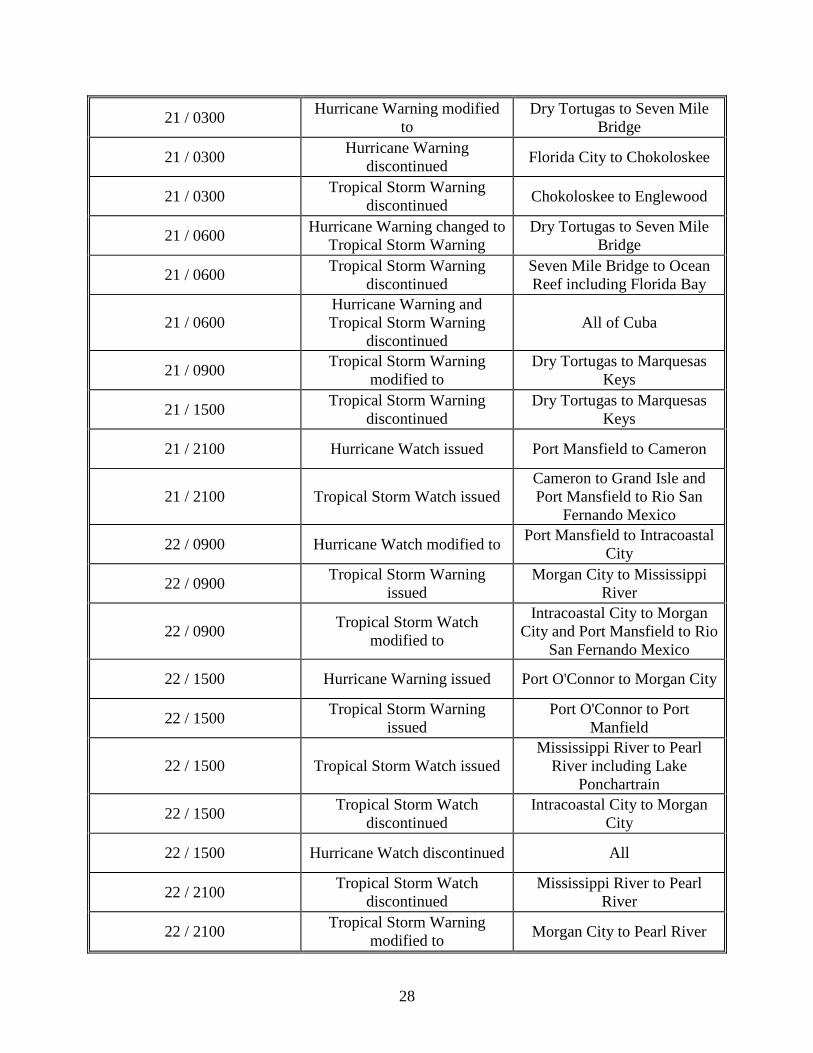
Table 5 lists the watches and warnings issued for Rita. Hurricane watches and warnings
for the United States were issued well in advance of the arrival of hurricane conditions. The
hurricane watch for the Florida Keys was issued roughly 48 h before the center of Rita passed
near the Keys and produced hurricane-force winds (at least in gusts) in Key West and storm
surge flooding in many portions of the Keys. The hurricane watch for the Keys was upgraded to
a warning about 36 h in advance. The initial hurricane watch for the northwestern Gulf coast,
which included most of the Texas coast and extreme southwestern Louisiana as far east as
Cameron, was issued about 58 h prior to landfall of the circulation center near the
Texas/Louisiana border. The hurricane watch was later extended eastward to Intracoastal City,
Louisiana about 46 h before landfall of the center. A portion of the hurricane watch area was
upgraded to a warning about 40 h in advance, and Rita made landfall near the center of that
warning area. These long lead times were necessary to account for the large size of Rita and for
the need to complete preparations prior to the arrival of winds of tropical storm force. It is
important to note that the hurricane watch and warning areas had to be as large as they were, not
only due to Rita’s size but also due to the uncertainty in the track forecast at the time the watches
and warnings were issued. The fact that Rita made landfall near the eastern edge rather than the
middle of the initial hurricane watch area underscores the need to take into account forecast
uncertainty and for preparation to occur throughout the entire watch and warning areas.
e. Acknowledgements
Some of the aircraft reconnaissance data in this report were processed, interpreted, and
furnished by NOAA’s Hurricane Research Division (HRD). Special appreciation is extended to
Dr. Peter Black (HRD) and Mr. Eric Ulhorn (HRD) for their analysis of this data. Mr. Colin
McAdie (NHC) provided access to and insightful analysis of archived WSR-88D radar data
provided by the NWS Forecast Office in Lake Charles, Louisiana. Most of the surface
observations in this report were provided by the National Data Buoy Center (NDBC) and by
several NWS Forecast Offices in Florida, Mississippi, Louisiana, and Texas. Dr. Stephen Baig
(NHC Storm Surge Team Leader) and Lt. Jennifer Pralgo (NOAA Commissioned Corps Officer
at NHC) provided storm surge data that were collected and analyzed under the direction of the
Federal Emergency Management Agency (FEMA). Appreciation is also extended to NHC
Hurricane Specialists Lixion Avila, Jack Beven, James Franklin, Richard Pasch, and Stacy
Stewart, to NHC Deputy Director Ed Rappaport, and to NHC Director Max Mayfield for their
valuable input to this report.
11
Table 1. Best track for Hurricane Rita, 18-26 September 2005.
Date/Time
(UTC)
Latitude
(°N)
Longitude
(°W)
Pressure
(mb)
Wind Speed
(kt) Stage
18 / 0000 21.3 69.9 1009 25 tropical depression
18 / 0600 21.6 70.7 1009 25 "
18 / 1200 21.9 71.5 1007 30 "
18 / 1800 22.2 72.3 1005 35 tropical storm
19 / 0000 22.4 73.0 1002 45 "
19 / 0600 22.6 73.8 999 50 "
19 / 1200 22.8 74.7 997 55 "
19 / 1800 23.1 75.9 994 60 "
20 / 0000 23.3 77.2 992 60 "
20 / 0600 23.5 78.8 990 60 "
20 / 1200 23.7 80.3 985 70 hurricane
20 / 1800 23.9 81.6 975 85 "
21 / 0000 24.1 82.7 967 95 "
21 / 0600 24.2 84.0 955 110 "
21 / 1200 24.2 85.2 941 120 "
21 / 1800 24.3 86.2 920 145 "
22 / 0000 24.5 86.9 897 150 "
22 / 0600 24.8 87.6 897 155 "
22 / 1200 25.2 88.3 908 140 "
22 / 1800 25.6 89.1 914 125 "
23 / 0000 26.0 89.9 915 120 "
23 / 0600 26.5 90.7 924 115 "
23 / 1200 27.1 91.5 927 115 "
23 / 1800 27.8 92.3 930 110 "
24 / 0000 28.6 93.0 931 105 "
24 / 0600 29.4 93.6 935 100 "
24 / 1200 30.5 94.1 949 65 "
24 / 1800 31.6 94.1 974 45 tropical storm
25 / 0000 32.7 94.0 982 35 "
25 / 0600 33.7 93.6 989 30 tropical depression
25 / 1200 34.7 92.5 995 25 "
25 / 1800 35.8 91.4 1000 25 "
26 / 0000 37.0 90.1 1003 20 "
26 / 0600 39.5 88.0 1006 20 remnant low
26 / 1200 absorbed by front
22 / 0300 24.7 87.3 895 155 minimum pressure
and maximum wind
24 / 0740 29.7 93.7 937 100
landfall between
Johnson’s Bayou,
LA and Sabine Pass

12
Table 2. Selected ship reports with winds of at least 34 kt for Hurricane Rita, 18-26
September 2005.
Date/Time
(UTC) Ship call sign Latitude (°N)
Longitude
(°W)
Wind
dir/speed (kt) Pressure (mb)
18 / 1500 KCGH 22.1 70.5 120 / 35 1009.5
19 / 0300 WGJT 24.6 73.7 060 / 35 1012.4
19 / 0600 3FPS9 24.7 73.9 080 / 35 1011.0
19 / 0700 WGJT 24.0 72.9 090 / 40 1009.6
19 / 0900 3FPS9 24.2 73.2 060 / 54 1009.0
19 / 1200 WJBJ 24.0 68.2 110 / 35 1014.0
19 / 1800 WJBJ 22.5 67.7 120 / 44 1013.0
19 / 2100 A8FS4 24.7 74.7 110 / 37 1008.5
20 / 0000 A8FS4 25.6 74.6 080 / 35 1012.0
21 / 0600 PFEI 26.7 83.5 050 / 37 1009.5
21 / 0900 PFEI 26.0 83.4 070 / 41 1005.5
21 / 1500 V7HC8 27.5 90.4 020 / 40 1010.0
21 / 1700 C6FM5 23.5 83.8 160 / 38 1006.5
21 / 1800 KSYP 22.8 84.5 180 / 36 1003.1
21 / 1800 VRWF2 23.0 84.3 180 / 38 1004.5
21 / 1800 V7HC9 28.0 88.3 050 / 35 1011.2
21 / 2100 WCBP 28.1 88.6 050 / 35 1009.0
21 / 2100 V7HC9 28.1 88.1 050 / 35 1009.1
22 / 0300 V7HC6 27.0 90.5 030 / 35 1007.5
22 / 0300 V7HD2 28.0 86.8 070 / 39 1011.0
22 / 0600 V7HC6 27.3 90.4 040 / 35 1006.1
22 / 0600 V7HD2 28.0 86.9 090 / 40 1009.0
22 / 0600 V7HC9 28.2 87.8 050 / 35 1009.1
22 / 0900 V7HC6 27.6 90.3 040 / 35 1003.6
22 / 0900 ZIYE7 27.7 85.7 080 / 37 1005.0
22 / 0900 V7HD2 28.0 87.0 100 / 40 1008.0
22 / 0900 V7HD3 28.3 87.9 110 / 44 1002.0
22 / 0900 V7HC9 28.3 87.7 090 / 40 1007.8
22 / 1200 ZIYE7 27.1 85.2 080 / 37 1007.0
22 / 1200 V7HC9 28.3 87.7 030 / 47 1007.5
22 / 1500 C6KJ5 23.2 86.5 180 / 35 1003.7
22 / 1500 PDHU 27.7 90.8 050 / 41 1005.0
22 / 1500 KRPB 28.0 85.3 120 / 35 1010.0
22 / 1700 V7HD2 27.9 87.0 100 / 52 1009.5
22 / 1800 C6KJ5 23.7 86.0 180 / 35 1004.0
22 / 1800 WCBP 27.3 85.4 100 / 45 1008.0
22 / 1800 V7HC6 28.0 89.7 060 / 39 1002.8
23 / 0200 V7HD3 28.1 86.6 120 / 40 1004.0
23 / 0600 WCBP 25.6 84.2 130 / 45 1009.0

13
23 / 1200 C6KJ5 27.1 86.7 130 / 35 1007.0
23 / 1500 V7HD2 27.7 86.4 130 / 37 1013.0
23 / 1800 V7HC6 28.0 89.7 060 / 39 1002.8
24 / 1800 C6KJ5 29.0 87.5 140 / 37 1012.2

14
Table 3. Selected surface observations for Hurricane Rita, 18-26 September 2005.
Location
Minimum Sea
Level Pressure
Maximum Surface
Wind Speed
Storm
surge
(ft)c
Storm
tide
(ft)d
Total
rain
(in) Date/
time
(UTC)
Press.
(mb)
Date/
time
(UTC)a
Sustained
(kt)b
Gust
(kt)
Florida
Official
Key West (KEYW) 20/2032 995.3 20/2314 54 66 e 5.0 2.05
Marathon (KMTH) 20/1505 1001.9 20/1418 36 45 2.58
Big Pine Key 20/1820 30 44
West Kendall (KTMB) 20/1239 1008.6 20/1330 32 40 3.29
Miami (KMIA) 20/0915 1009.3 20/1408 26 43
Miami Beach (KMBF) 20/2027 1008.0 20/1357 34 50
Opa Locka (KOPF) 20/0853 1009.3 21/0244 25 34 1.27
Pembroke Pines (KHWO) 20/0934 1011.0 20/0813 31 42 1.55
Fort Lauderdale (KFLL) 20/0853 1009.3 20/0808 31 48 3.00
Pompano Beach (KPMP) 20/0826 1010.6 20/1353 25 47 0.72
Naples (KAPF) 20/2011 1008.6 21/0031 33 39 1.07
Naples Pier
(NOS tide gauge) 1.5 2.0
Fort Myers (KRSW) 20/2053 1009.3 20/1108 32 38 0.76
Fort Myers (KFMY) 20/2053 1009.8 20/1028 28 35 0.91
Punta Gorda (KPGD) 20/2053 1011.5 20/1156 31 36 1.20
Tenrawe 5.13
Chekika Evergladese 3.80
Oasis Ranger Statione 2.03
Unofficial
Key West
Southernmost Point 20/2115 56 e 4.5
Cudjoe Key 20/1542 56 e 3.0
Tavernier 3.88
Key Largo
(Pennekamp State Park) 4.26
Middle and Upper Keys e 3-4
North Key Largo and e 2.0
15
Location
Minimum Sea
Level Pressure
Maximum Surface
Wind Speed
Storm
surge
(ft)c
Storm
tide
(ft)d
Total
rain
(in) Date/
time
(UTC)
Press.
(mb)
Date/
time
(UTC)a
Sustained
(kt)b
Gust
(kt)
Jewfish Creek
Perrine 3.28
Homestead General
Airport 3.00
Fort Lauderdale Dixie
Water Plant 2.96
Everglades City 2.87
Marco Island 2.71
Chokoloskee 2.37
Plantation 2.17
Cuba
Cayo Coco 1.37
Caibarien 1.93
Varadero 20/1620 997.5 20/1740 38 50 5.04
Indio Hatuey 2.61
Colon 1.81
Casa Blanca 20/2200 1000.0 20/ N/A 46 52 5.39
Santiago de las Vegas 20/ N/A 32 43 4.67
Bahia Honda 21/0000 1002.8 21/0120 32 40 2.42
La Palma 21/0900 1003.9 21/0820 35 43 1.97
Cabo de San Antonio 21/1200 1004.2 21/1058 39 49 0.31
Mississippi
Official
Biloxi (KBIX) 23/1924 1006.8 23/1946 25 45
Gulfport (KGPT) 23/1952 38 45
Greenville (KGLH) 31 41 6.81
Greenwood (KGWO) 26* 41* 3.39*
Columbus (KGTR) 23 34 2.64
Talullah-Vicksburg
(KTVR) 29* 42* 2.16*
Jackson- Hawkins (KHKS) 26 38 2.66
16
Location
Minimum Sea
Level Pressure
Maximum Surface
Wind Speed
Storm
surge
(ft)c
Storm
tide
(ft)d
Total
rain
(in) Date/
time
(UTC)
Press.
(mb)
Date/
time
(UTC)a
Sustained
(kt)b
Gust
(kt)
Meridian Key (KMEI) 23 36 2.38
Meridian NAS 4.34
Natchez (KHEZ) 26* 40* 5.56*
Unofficial
Newton 38 3.11
Bude-Frankline 35 4.07
Tombigbee National
Forrest (Choctaw County) e
3.52
Delta Road (Sharkey
County) e
3.94
Warren Countye 4.83
Lauderdale Countye 4.16
Holmes Countye 3.12
Highway 43-Madison
Countye
3.50
Louisiana
Official
Slidell (KASD) 23/2141 1005.1 24/1838 30 38 0.64
New Orleans (KMSY) 23/2153 1002.4 24/1840 30 42 2.07
Belle Chase (KNBG) 23/2355 1003.7 24/0915 37
Baton Rouge (KBTR) 24/0558 997.6 24/1643 36 46 9.30
Lake Pontchartrain
Mid Lake 6.5
Rigoletes 4.48
Barataria Bay 7.34
Bayou Barataria Lafitte 5.80
Bayou Grand Caillou 7.10
Caillou Lake 6.95*
GIWW at Houma 4.32
Point Fourchon 5.00
Fullerton (KBKB) 24/1219 992.2 24/1819 26 40 6.14
Allen Parish Airport
(KL42) 24/0320 998.3* 24/0020 22* 42*

17
Location
Minimum Sea
Level Pressure
Maximum Surface
Wind Speed
Storm
surge
(ft)c
Storm
tide
(ft)d
Total
rain
(in) Date/
time
(UTC)
Press.
(mb)
Date/
time
(UTC)a
Sustained
(kt)b
Gust
(kt)
Beauregard Regional
(KDRI) 24/1101 980.4* 24/0821 31* 54*
Alexandria (KAEX) 24/1404 991.5 24/1543 43 54
Alexandria Esler Regional
(KESF) 24/1425 994.6 24/1410 31 40 4.06
Jasper County Bell Field
(KJAS) 24/0525 996.6* 24/0205 24* 37*
Fort Polk AAF (KPOE) 24/1200 983.8 24/1400 32 51 6.14
Lake Charles (KLCH) 24/0806 968.2 24/0208 50* 64* 7.68
Lake Charles (NWS) 24/0820 83
Lafayette (KLFT) 24/0817 992.2 24/1321 44 51 6.24
Orange County Airport
(KORG) 24/0428 983.4* 24/0428 31* 47*
Acadiana (KARA) 24/0801 992.9 24/2311 34 51
Salt Point 23/2153 993.0* 23/2153 19* 38*
Alexandria Dean Lee
Research Station (ALDL1) 24/1017 991.8 24/1605 40 54 6.79
Crowley Rice Research
Station (CRRL1) 24/1805 47* 64* 8.33
Jeanerette Iberia Research
Station (JNRL1) 23/2153 24* 37*
Lake Charles Calcasieu
Parish Ag. Center (LCPL1) 24/0717 965.5 24/0745 66 83 8.77
Rd. Research Farm Port
Barre (RDRL1) 24/0918 992.5 24/1245 40 61 7.80
Rosepine Research Station
(RPRL1) 24/0942 978.9 24/0819 41 59
Baton Rouge (Ben Hur) 24/1116 996.1 24/0220 35 50 7.47
Baton Rouge (Burden) 24/0420 998.3 23/2053 22 34 9.10
Franklinton 24/1010 998.2 24/1323 29 41
Houma 24/0231 996.7 24/0232 38 50 2.62
Hammond 24/1020 1002.7 24/1654 29 39 1.85
Livingston 24/0649 999.6 24/1635 25 35 6.50
St. Gabriel 24/0303 996.4 24/0211 35 50 5.00
Camerone (CLCL1) 24/0620 63* 94* 8.13
Dove Fielde (VRNL1) 24/0900 23 46 7.51
Evangeline/Gardnere
(GARL1) 24/2100 23 42 7.93

18
Location
Minimum Sea
Level Pressure
Maximum Surface
Wind Speed
Storm
surge
(ft)c
Storm
tide
(ft)d
Total
rain
(in) Date/
time
(UTC)
Press.
(mb)
Date/
time
(UTC)a
Sustained
(kt)b
Gust
(kt)
Lacassinee (LACL1) 24/0245 38* 62*
Vernone (LEVL1) 24/1000 22 43 7.96
Western St. Mary Parish
near Louisa 11.95
Central Plaquemines Parish 6.29
North-central Cameron
Parish just east of
Calcasieu Lake
8.11
Unofficial
Johnsons Bayou (ULM) 24/0739 939.1 24/0724 61 79
Lake Charles Port
(Ship Atlantic Forest) 24/0900 967.8
Cameron 24/0500 950
St. Joseph-Tensas 37 6.90
Winnsboro-Franklin 43 5.15
Hebert’s Marina
Grand Lake 116
Iberia Parish OEP 52
Bayou Sorrel Lock 5.21
Convent 7.60
Donaldsonville 3.63
Lutcher 4.48
N.O Audubon Park 2.29
Reserve 4.66
Baton Rouge Concord 7.91
Baton Rouge Sherwood 9.80
Bayou Manchac 10.11
Bogalusa 2.61
Brusly 5.91
Franklinton 2.02
Greenwell Springs 5.56
Livingston 6.94
Oaknolia 5.24

19
Location
Minimum Sea
Level Pressure
Maximum Surface
Wind Speed
Storm
surge
(ft)c
Storm
tide
(ft)d
Total
rain
(in) Date/
time
(UTC)
Press.
(mb)
Date/
time
(UTC)a
Sustained
(kt)b
Gust
(kt)
Plaquemine 5.31
Pontchatoula 5.65
Laplace (5 NE) 12.42
Baton Rouge (Joor Road) 6.35
Holden 5.02
Baptist 4.78
Lake Charles 100
Grand Lake 116
Abbeville 7.39
Beaver Fire Tower 8.25
Alexandria 7.68
Alexandria Power Plant 7.60
Boyce 7SW 7.40
Boyce 3WNW 5.30
Bunkie 16.00
Butte La Rose 6.99
Carencro 7.05
Crowley 2SW 8.32
Deridder 14.00
Eunice 8.72
Franklin 3.25
Grand Coteau 8.65
Elmer (2 SW) 7.68
Jeanerette 5NW 9.21
Leesville 4.90
Lafayatte 8.60
Marksville 8.37
Moss Bluff 8.64
Oakdale 3.00
Opelousas 9.85
Red River Lock 2 8.10

20
Location
Minimum Sea
Level Pressure
Maximum Surface
Wind Speed
Storm
surge
(ft)c
Storm
tide
(ft)d
Total
rain
(in) Date/
time
(UTC)
Press.
(mb)
Date/
time
(UTC)a
Sustained
(kt)b
Gust
(kt)
St Martinville 3 SW 8.13
Sulphur 9.49
Jennings 9.75
Lafayette 8.60
LSU Dean Lee Alexandria 7.98
Old Town Bay 8.40
Ragley 8.50
Sam Houston Jones
State Park 7.92
St. Martinville 8.13
Texas
Official
Beaumont (KBPT) 24/0809 952.3 24/0833 70 91 8.89
Houston (KIAH) 24/1047 988.1 24/0630 39 53 0.87
Houston Hobby Airport
(KHOU) 24/0827 988.8 24/0625 38 48 1.02
Galveston (KGLS) 24/0142 994.6* 24/0142 39* 54*
Angleton (KLBX) 24/0949 992.9 24/0434 28 38
Pearland (KLVJ) 24/0459 991.9 24/0417 33 41 0.28
Sugarland (KSGR) 24/0934 993.2 24/0750 33 44 0.44
Tomball (KDWH) 24/0938 990.9 24/0145 27 38
Conroe (KCXO) 24/1540 990.9 24/1619 33 48
College Station (KCLL) 24/1420 997.3 24/1914 31 41
Huntsville (KUTS) 24/1420 991.5 24/1644 30 41
Rollover Pass (NOS) 4.58
South Jetty 2.98
Rainbow Bridge (TCOON) 7.93
Clear Creek/Seabrook 3.23
East Matagorda Bay 4.53
Battleship Texas St. Park 3.21
Manchester Houston 3.38
21
Location
Minimum Sea
Level Pressure
Maximum Surface
Wind Speed
Storm
surge
(ft)c
Storm
tide
(ft)d
Total
rain
(in) Date/
time
(UTC)
Press.
(mb)
Date/
time
(UTC)a
Sustained
(kt)b
Gust
(kt)
McFaddene (FADT2) 24/0240 36* 59*
Southern Roughe
(WRRT2) 24/0940 21* 45* 9.45
Woodvillee (WVLT2) 24/1200 43* 66* 9.25
Kirbyvillee (KRBT2) 8.13
Unofficial
Port Arthur (FCMP) 24/0824 949.7 24/0826 82 101
Nederland (FCMP) 24/0830 942.3 24/0809 57 80
Orange (FCMP) 24/0845 941.0 24/0819 65 85
Port Arthur (TTU) 81 101
Orange (TTU) 24/0815 57* 77*
Galveston Causeway 24/0608 40 52
Hartman Bridge 24/0718 41 57
Rollover Pass 24/0601 50
Highway 146 East Kemah 24/1031 38
San Jacinto (E I-10) 24/0641 43 52
Hardy Toll Road (E I-10) 24/0730 34 50
Loop 610 E Ship Channel 24/1000 39 56
Lake Conroe 24/1130 49
Lake Livingston 24/1200 54* 102
Highway 290- E Highway
6 24/1203 42
Jamaica Beach 24/0700 985.7 1.33
E. Beaumont 83
Beaumont Docks
(Ship Cape Vincent) 24/0930 948.9
Beaumont Research Center 6.58
Jasper 7.66
New Caney 4.33
Anahuac 4.12
Cleveland 3.77
Weches 2.49
22
Location
Minimum Sea
Level Pressure
Maximum Surface
Wind Speed
Storm
surge
(ft)c
Storm
tide
(ft)d
Total
rain
(in) Date/
time
(UTC)
Press.
(mb)
Date/
time
(UTC)a
Sustained
(kt)b
Gust
(kt)
Crockett (8 S) 2.00
Luce Bayou 5.98
Gum Gully Diamond Head 2.91
Cedar Bayou 3.70
Goose Creek (Baker Road) 2.44
Goose Creek (SH 146) 2.13
Peach Creek 5.04
Trinity River (US 90) 4.57
Old Danville Road 2.60
Caney Creek 3.27
Midway 2.84
White Rock 3.07
Friday 3.78
Chita 3.94
Wyser Bluff 2.13
Woodlake 4.33
Onalaska 4.72
Harmon Creek 2.40
Point Blank/Waterwood 3.19
Cold Spring/
Wolf Creek Park 3.51
Long King Creek/
Livingston 4.44
Lake Livingston 2.79
Kountze 8.90
Orange 9N 9.00
Silsbee 4N 12.50
Wildwood 4.67
Woodville 9.50
Buoys/C-MAN/NOS
Settlement Point (SPGF1)
(26.7ºN 79.0ºW) 20/0210 31 40
23
Location
Minimum Sea
Level Pressure
Maximum Surface
Wind Speed
Storm
surge
(ft)c
Storm
tide
(ft)d
Total
rain
(in) Date/
time
(UTC)
Press.
(mb)
Date/
time
(UTC)a
Sustained
(kt)b
Gust
(kt)
Fowey Rocks (FWYF1)
(25.6ºN 80.1ºW) 20/0900 1007.8 20/1600 48 56
Virginia Key NOS
(VAKF1)
(25.7ºN 80.2ºW)
20/0900 1008.7 20/1400 29 44 1.2 2.5
Vaca Key NOS (VCAF1)
(24.7ºN 81.1ºW) 20/1500 1001.6 20/1600 33 47 1.5
Sombrero (SMKF1)
(24.6ºN 81.1ºW) 20/1600 1001.0 20/1700 61 69
Long Key (LONF1)
(24.8ºN 80.9ºW) 20/1200 1003.3 20/1530 39 52 1.9
Molasses Reef (MLRF1)
(25.0ºN 80.4ºW) 20/1200 1003.4 20/1418 36 45
Dry Tortugas (DRYF1)
(24.6ºN 82.9ºW) 21/0100 994.0* 21/0120 57* 76*
Sand Key (SANF1)
(24.5ºN 81.9ºW) 20/2100 988.5* 20/2110 63* 80*
Key West NOS (KYWF1)
(24.6ºN 81.8ºW) 20/2100 995.8 20/1600 42 2.5
Buoy 42001
(25.8ºN 89.7ºW) 22/2250 925.7 23/0030 88 119
Buoy 42002
(25.2ºN 94.4ºW) 23/2050 1001.3 23/1730 30 37
Buoy 42046
(27.9ºN 94.0ºW) 23/1330 997.9* 23/1500 31* 45*
Dauphin Island (DPIA1)
(30.3ºN 88.1ºW) 24/1000 34 47
Buoy 42040
(29.2ºN 88.2ºW) 23/0850 1004.5 23/0130 33 43
Bayou LaBranch NOS
(LABL1)
(30.1ºN 90.4ºW)
23/2200 1002.9
Bayou Gauche NOS
(BYGL1)
(29.8ºN 90.4ºW)
24/0624 1001.6
Isle Dernieresf (ILDL1)
(29.1ºN 90.5ºW) 23/1300 50 62
Mid-Lake Pontchartrain 6.5
South Timbalier Blockf
(SPLL1) (28.9ºN 90.5ºW) 23/1700 995.5
Salt Pointf (SLPL1)
(29.5ºN 91.6ºW) 23/2300 990.2 23/2300 46* 63*
Marsh Islandf (MRSL1)
(29.4ºN 92.1ºW) 24/0400 983.6 24/0000 62* 81*

24
Location
Minimum Sea
Level Pressure
Maximum Surface
Wind Speed
Storm
surge
(ft)c
Storm
tide
(ft)d
Total
rain
(in) Date/
time
(UTC)
Press.
(mb)
Date/
time
(UTC)a
Sustained
(kt)b
Gust
(kt)
Calcasieu Pass NOS
(CAPL1)
(29.8ºN 93.3ºW)
24/0112 983.0* 24/0518 67* 97* 5.50*
Sabine Pass North NOS
(SBPT2) (29.7ºN 93.9ºW) 24/0542 967.8* 24/0500 55* 70* 8.12*
Sabine Pass (SRST2)
(29.7ºN 94.1ºW) 24/0800 951.3 24/0700 71 86 6.37*
Buoy 42035
(29.3ºN 94.4ºW) 24/0650 972.3 24/0450 54 66
Port Arthur (TCOON) 24/0800 61 82 9.24
Galveston Pleasure Pier
NOS (GPST2)
(29.3ºN 94.8ºW)
24/0700 983.5 24/0600 41 57 4.69
Galveston Bay Entrance
North Jetty NOS/TCOON 24/0800 979.9 24/0300 51 64 3.98
Galveston Pier 21 NOS
(GTOT2) (29.3ºN 94.8ºW) 24/0818 984.7 3.59
Eagle Point NOS (EPTT2)
(29.5ºN 94.9ºW) 24/0800 984.3 24/0224 34 48 3.67
Morgans Point NOS
(MGPT2) (29.7ºN 95.0ºW) 24/0942 982.9 24/0836 43 64 3.04
Buoy 42019
(27.9ºN 95.4ºW) 24/0050 995.9 24/0110 34 49
a Date/time is for sustained wind when both sustained and gust are listed.
b Except as noted, sustained wind averaging periods for C-MAN and land-based ASOS reports
are 2 min; buoy averaging periods are 8 min; NOS station averaging periods are 6 min.
c Storm surge is water height above normal astronomical tide level.
d Storm tide is water height above National Geodetic Vertical Datum (1929 mean sea level).
e Remote Automated Weather Station (RAWS)
f Louisiana State University (LSU) Coastal Studies Institute Station
* Incomplete data

25
Table 4. Preliminary forecast evaluation (heterogeneous sample) for Hurricane Rita, 18-26
September 2005. Forecast errors (n mi) are followed by the number of forecasts
in parentheses. Errors smaller than the NHC official forecast are shown in bold-
face type. Verification includes the depression stage. Models not available at the
time the official forecasts were made are indicated by (*).
Forecast
Technique
Forecast Period (h)
12 24 36 48 72 96 120
CLP5 36 (29) 79 (29) 138 (27) 194 (25) 288 (21) 446 (17) 655 (13)
GFNI 37 (26) 78 (26) 108 (24) 149 (22) 223 (18) 385 (14) 582 (10)
GFDI 29 (28) 55 (28) 78 (27) 95 (25) 118 (21) 163 (17) 176 (13)
GFDL* 24 (26) 45 (26) 63 (26) 91 (25) 119 (21) 166 (17) 204 (13)
GFDN* 37 (26) 72 (26) 110 (25) 147 (23) 216 (19) 356 (15) 536 (11)
GFSI 24 (27) 41 (27) 64 (25) 90 (23) 133 (19) 182 (15) 190 (11)
GFSO* 23 (29) 38 (28) 55 (26) 78 (24) 118 (20) 172 (16) 199 (12)
AEMI 23 (27) 46 (27) 70 (25) 102 (23) 146 (19) 178 (15) 189 (11)
NGPI 29 (26) 56 (26) 87 (24) 119 (22) 170 (18) 271 (14) 445 (10)
NGPS* 34 (28) 57 (27) 85 (25) 119 (23) 167 (19) 263 (14) 406 (11)
UKMI 32 (28) 58 (28) 84 (26) 115 (24) 191 (20) 277 (16) 316 (12)
UKM* 31 (15) 49 (15) 71 (14) 100 (13) 170 (11) 249 ( 9) 311 ( 7)
A98E 34 (29) 63 (29) 82 (27) 100 (25) 151 (21) 179 (17) 244 (13)
A9UK 36 (15) 64 (15) 94 (14) 121 (13) 151 (11)
BAMD 23 (29) 40 (29) 57 (27) 74 (25) 134 (21) 182 (17) 176 (13)
BAMM 33 (28) 67 (28) 96 (26) 118 (24) 186 (21) 219 (17) 193 (13)
BAMS 40 (27) 78 (27) 112 (25) 148 (24) 221 (21) 248 (17) 256 (13)
CONU 27 (28) 52 (28) 75 (26) 102 (24) 150 (20) 229 (16) 271 (12)
GUNA 24 (25) 45 (25) 70 (24) 96 (22) 138 (18) 192 (14) 206 (10)
FSSE 24 (25) 48 (25) 70 (23) 100 (22) 150 (18) 208 (14) 209 (10)
OFCL 27 (29) 54 (29) 76 (27) 93 (25) 120 (21) 164 (17) 197 (13)
NHC Official
(1995-2004
mean)1
42
(3400)
75
(3116)
107
(2848)
138
(2575)
202
(2117)
236
(649)
310
(535)
1 Errors given for the 96 and 120 h periods are averages over the four-year period 2001-04.

26
Table 5. Watch and warning summary for Hurricane Rita, 18-26 September 2005.
Date/Time (UTC) Action Location
18 / 0300 Tropical Storm Warning
issued
Southeast and Central
Bahamas including the Turks
and Caicos
18 / 0300 Hurricane Watch issued Northwest Bahamas
18 / 1500 Hurricane Watch issued Ocean Reef to Dry Tortugas
including Florida Bay
18 / 2100 Tropical Storm Watch issued Deerfield Beach to
East Cape Sable
18 / 2100 Tropical Storm Watch issued Ciego de Avila to Cienfuegos
18 / 2100 Hurricane Watch issued Villa Clara to Pinar del Rio
19 / 0300
Tropical Storm Watch
changed to Tropical Storm
Warning/Hurricane Watch
Deerfield Beach to
East Cape Sable
19 / 0300 Hurricane Watch changed to
Hurricane Warning
Ocean Reef to Dry Tortugas
including Florida Bay
19 / 0300 Tropical Storm Watch issued East Cape Sable to
Chokoloskee
19 / 0600 Hurricane Watch upgraded to
Hurricane Warning
Northwest Bahamas excluding
Grand Bahama and the
Abacos
19 / 0600 Hurricane Watch changed to
Tropical Storm Warning
Grand Bahama and the
Abacos
19/1200 Hurricane Warning issued Exumas and Andros Island
19/1500
Tropical Storm
Warning/Hurricane Watch
changed to Hurricane Warning
Golden Beach to
East Cape Sable
19/1500 Hurricane Warning upgraded
to Hurricane Warning Villa Clara to Matanzas
19 / 1500 Hurricane Watch modified to Ciudad de Habana to Pinar del
Rio
19/1500 Tropical Storm Warning
issued
Jupiter Inlet to Deerfield
Beach
19 / 1500 Hurricane Watch modified to Deerfield Beach to Golden
Beach
19 / 1500 Tropical Storm Watch
changed to Hurricane Watch
East Cape Sable to
Chokoloskee

27
19 / 1500 Tropical Storm Watch issued Chokoloskee to Englewood
19 / 1800 Tropical Storm Warning
discontinued Turks and Caicos
19 / 2100 Tropical Storm Watch
discontinued Ciego de Avila to Cienfuegos
19 / 2100 Tropical Storm Warning
issued Lake Okeechobee
19 / 2100 Tropical Storm Warning
issued
Ciego de Avila to Pinar del
Rio
19 / 2100 Hurricane Watch discontinued Ciudad de Habana to Pinar del
Rio
19 / 2100 Hurricane Warning modified
to Villa Clara to La Habana
20 / 0000 Tropical Storm Warning
discontinued Southeast Bahamas
20 / 0300
Tropical Storm Watch
changed to Tropical Storm
Warning
Chokoloskee to Englewood
20 / 0300 Hurricane Watch discontinued East Cape Sable to
Chokoloskee
20 / 0300 Hurricane Warning modified
to Golden Beach to Chokoloskee
20 / 0900 Tropical Storm Warning
discontinued Central Bahamas
20 / 0900
Hurricane Warning
downgraded to Tropical Storm
Warning
Exumas and Andros Island
20 / 1500 Tropical Storm Warning
discontinued All of the Northwest Bahamas
20 / 1500 Hurricane Watch discontinued All
20 / 1500 Hurricane Warning modified
to Matanzas to La Habana
20 / 1800 Tropical Storm Warning
modified to
Jupiter Inlet to Florida City
and Lake Okeechobee
20 / 1800 Hurricane Warning modified
to
Florida City to Chokoloskee
and all Florida Keys including
Florida Bay
20 / 2100 Tropical Storm Warning
discontinued
Jupiter Inlet to Florida City
and Lake Okeechobee
21 / 0300 Hurricane Warning changed to
Tropical Storm Warning
Seven Mile Bridge to Ocean
Reef including Florida Bay
28
21 / 0300 Hurricane Warning modified
to
Dry Tortugas to Seven Mile
Bridge
21 / 0300 Hurricane Warning
discontinued Florida City to Chokoloskee
21 / 0300 Tropical Storm Warning
discontinued Chokoloskee to Englewood
21 / 0600 Hurricane Warning changed to
Tropical Storm Warning
Dry Tortugas to Seven Mile
Bridge
21 / 0600 Tropical Storm Warning
discontinued
Seven Mile Bridge to Ocean
Reef including Florida Bay
21 / 0600
Hurricane Warning and
Tropical Storm Warning
discontinued
All of Cuba
21 / 0900 Tropical Storm Warning
modified to
Dry Tortugas to Marquesas
Keys
21 / 1500 Tropical Storm Warning
discontinued
Dry Tortugas to Marquesas
Keys
21 / 2100 Hurricane Watch issued Port Mansfield to Cameron
21 / 2100 Tropical Storm Watch issued
Cameron to Grand Isle and
Port Mansfield to Rio San
Fernando Mexico
22 / 0900 Hurricane Watch modified to Port Mansfield to Intracoastal
City
22 / 0900 Tropical Storm Warning
issued
Morgan City to Mississippi
River
22 / 0900 Tropical Storm Watch
modified to
Intracoastal City to Morgan
City and Port Mansfield to Rio
San Fernando Mexico
22 / 1500 Hurricane Warning issued Port O'Connor to Morgan City
22 / 1500 Tropical Storm Warning
issued
Port O'Connor to Port
Manfield
22 / 1500 Tropical Storm Watch issued
Mississippi River to Pearl
River including Lake
Ponchartrain
22 / 1500 Tropical Storm Watch
discontinued
Intracoastal City to Morgan
City
22 / 1500 Hurricane Watch discontinued All
22 / 2100 Tropical Storm Watch
discontinued
Mississippi River to Pearl
River
22 / 2100 Tropical Storm Warning
modified to Morgan City to Pearl River

29
23 / 0900 Tropical Storm Watch
discontinued
Port Mansfield to Rio San
Fernando Mexico
23 / 1500 Tropical Storm Warning
modified to Port O'Connor to Port Aransas
23 / 2100 Hurricane Warning modified
to Sargent to Morgan City
23 / 2100 Tropical Storm Warning
modified to
Morgan City to Mouth of
Pearl River including Lake
Ponchartrain and Sargent to
Port Aransas
24/0900 Tropical Storm Warning
discontinued
Port Aransas to Port
O’ Connor
24 / 1200 Hurricane Warning modified
to High Island to Morgan City
24 / 1500 Hurricane Warning changed to
Tropical Storm Warning High Island to Morgan City
24 / 1500 Tropical Storm Warning
modified to High Island to Morgan City
24 / 1500 Tropical Storm Warning
discontinued Sargent to Port O'Connor
25 / 0000 Tropical Storm Warning
discontinued All

30
20
25
30
35
40
45
-100 -95 -90 -85 -80 -75 -70 -65
Hurricane Rita
18-26 September 2005
Hurricane
Tropical Storm
Tropical Dep.
Extratropical
Subtr. Storm
Subtr. Dep.
00 UTC Pos/Date
12 UTC Position
Low / Wave
PPP Min. press (mb)
25
24
23
2221
20 19
18
26
895 mb
937 mb
Figure 1. Best track positions for Hurricane Rita, 18-26 September 2005.

31
20
30
40
50
60
70
80
90
100
110
120
130
140
150
160
170
9/17 9/19 9/21 9/23 9/25
Hurricane Rita
18-26 September 2005
BEST TRACK
Sat (TAFB)
Sat (SAB)
Sat (AFWA)
Obj T-Num
AC (sfc)
AC (flt>sfc)
AC (DVK P>W)
Surface
Drop (sfc)
Drop (LLM xtrp)
Drop (MBL xtrp)
Win
d S
pe
ed
(kt)
Date (Month/Day)
Figure 2. Selected wind observations and estimates and best track maximum sustained surface wind speed curve for Hurricane
Rita, 18-26 September 2005. Aircraft observations have been adjusted for elevation using 90%, 80%, and 80%
reduction factors for observations from 700 mb, 850 mb, and 1500 ft, respectively. Dropwindsonde observations
include actual 10 m winds (sfc), as well as surface estimates derived from the mean wind over the lowest 150 m of the
wind sounding (LLM), and from the sounding boundary layer mean (MBL).
32
890
900
910
920
930
940
950
960
970
980
990
1000
1010
1020
9/17 9/19 9/21 9/23 9/25
Hurricane Rita
18-26 September 2005
BEST TRACK
Sat (TAFB)
Sat (SAB)
Sat (AFWA)
Obj T-Num
AC (sfc)
Surface
Pre
ssu
re (
mb
)
Date (Month/Day)
Figure 3. Minimum pressure observations and estimates and best track minimum central pressure curve for Hurricane Rita, 18-26
September 2005.

33
A B C
D E
Images provided by the Fleet
Numerical Meteorology and
Oceanography Center (FNMOC).
Figure 4. Series (in order A-E) of 85-91 GHz passive microwave images of Hurricane Rita during 21-23 September 2005.