Tropical blackwater biogeochemistry: The Siak River in...
121
Tropical blackwater biogeochemistry: The Siak River in Central Sumatra, Indonesia Dissertation zur Erlangung des Doktorgrades der Naturwissenschaften (Dr. rer. nat.) vorgelegt von Antje Baum Bremen 2008
Transcript of Tropical blackwater biogeochemistry: The Siak River in...
Tropical blackwater biogeochemistry: The Siak River in Central Sumatra, Indonesia
Dissertation
zur Erlangung des Doktorgrades
der Naturwissenschaften (Dr. rer. nat.)
vorgelegt von
Antje Baum
Bremen 2008
Advisory Committee:
1. Reviewer: Dr. Tim Rixen
Center for Tropical Marine Ecology (ZMT), Bremen, Germany
2. Reviewer: Prof. Dr. Wolfgang Balzer
University of Bremen
1. Examiner: Prof. Dr. Venugopalan Ittekkot
Center for Tropical Marine Ecology (ZMT), Bremen, Germany
2. Examiner: Dr. Daniela Unger
Center for Tropical Marine Ecology (ZMT), Bremen, Germany
I
Contents
Summary .................................................................................................................... III
Zusammenfassung...................................................................................................VII
1. Introduction........................................................................................................ 11
2. Published and submitted papers..................................................................... 15
2.1. Sources of dissolved inorganic nutrients in the peat-draining river Siak,
Central Sumatra, Indonesia ................................................................................... 15
2.2. The Siak, a tropical black water river in central Sumatra on the verge of
anoxia ..................................................................................................................... 31
2.3. Relevance of peat draining rivers in central Sumatra for riverine input of
dissolved organic carbon into the ocean ................................................................ 55
2.4. DOC discharges from the Indonesian blackwater river Siak and its estuary
into the Malacca Strait and their role as DOC source for the Indian Ocean .......... 69
3. General conclusions ......................................................................................... 83
4. Future perspectives .......................................................................................... 85
5. References ......................................................................................................... 87
Appendix ................................................................................................................... 99

II
III
Summary
The most studied tropical blackwater rivers are tributaries of the Orinoco and
Amazon such as the Rio Negro in South America. The dark-brown colour of
blackwater rivers results from high concentrations of dissolved organic matter that is
leached from organic-rich soils within the river drainage basins. The catchment areas
of the blackwater rivers in South America are mainly covered by mineral soils
(ferralsols), which feature high contents of organic matter in the upper soil horizons.
Blackwater rivers in South East Asia by contrast drain catchments that are dominated
by organic soils (dystric histosols), commonly referred to as tropical peat.
Approximately 83% of the South East Asian peatsoils are located in Indonesia,
mainly on the islands Sumatra, Borneo and Irian Jaya and hold ~3% of the global
carbon stored in soils. During the last few decades, deforestation and drainage of
peat swamp forests have become common land-use practices in Indonesia mainly for
the establishment of oil palm estates resulting in the dissolution of Indonesian
peatsoils and enhanced CO2-emissons.
The main objectives of this work were to investigate potential environmental impacts
of land-use changes on the peat-draining Siak River (Central Sumatra) and to assess
the role of Indonesian rivers as source of dissolved organic carbon (DOC) into the
ocean.
This work was carried out within the framework of the Indonesian/German
cooperation SPICE (Science for the Protection of Indonesian Coastal Marine
Ecosystems) and included four expeditions to the Siak River.
Collected samples were analysed for dissolved inorganic nutrients, DOC, oxygen and
amino acids (Appendix). In addition particulate carbon and nitrogen as well as their
isotopic compositions were determined in river, soil and terrestrial plant samples
(Appendix). DOC decomposition experiments were carried out and annual freshwater
discharges of the Siak were determined by in situ measurements as well as by
evaluation of precipitation and evaporation data. Based on geographical information
IV Summary
systems (GIS) a digital terrain model was established to provide essential
hydrological information on the river catchment.
The low nutrient concentrations measured in the Siak relative to other rivers not only
in Indonesia but world-wide may be attributed to leaching of nutrient-poor peatlands.
Nevertheless, there are clear indications that nutrient concentrations in the vicinity of
cities, villages and industrial sites were considerably enhanced. Furthermore,
washout of fertilizers could be observed during one of the expeditions. Nutrient data
measured in a peat-draining river in South Sumatra, which was sampled prior to the
main cultivation of oil palms in the 1970s, revealed nutrient concentrations which are
much lower than those measured in the Siak. This suggests that nutrient
concentrations in the Siak doubled during the last few decades as observed also in
other rivers world-wide.
Contrary to the nutrient concentrations DOC in the Siak and its tributaries was mainly
derived from leaching of the surrounding peatsoils. Due to massive land-use changes
leaching could not be considered as natural. Although leaching is assumed to be
enhanced the anthropogenic impact is not quantified yet. However, the
concentrations that were measured in this study are among the highest riverine DOC
concentrations reported so far. The highest concentrations were observed after dry
seasons when increasing precipitation rates led to enhanced leaching from soils.
The decomposition of DOC was the main factor influencing the oxygen
concentrations in the Siak. According to model results an increase in the DOC
concentrations of ~15% would be sufficient to produce anoxic conditions in the Siak.
The average annual river discharge of the Siak into the river estuary was calculated
to be 0.38 ± 0.1 Tg C yr-1 (Tg = 1012 g) where additional DOC inputs into the Siak
Estuary derived from peatsoil leaching resulted in an overall discharge of the Siak
into the coastal ocean of 0.5 ± 0.3 Tg C yr-1. The DOC discharge of the Siak and
other peat-draining rivers increased the DOC concentration in the Malacca Strait by
approximately 130 μmol L-1, which resulted in a terrestrial DOC discharge of the
Malacca Strait into the Indian Ocean of ~6.4 Tg C yr-1. Therewith ~33% of the
Indonesian DOC discharge which has been extrapolated to be ~21 Tg C yr-1 seems

Summary V
to be exported via the Malacca Strait into the ocean. This demonstrates that the
numerous small Indonesian rivers are as important as the Amazon with respect to
the input of terrestrial-derived DOC into the ocean.

VI
VII
Zusammenfassung
Der wohl bekannteste tropische Schwarzwasserfluss ist der Rio Negro, einer der
größten Nebenflüsse des Amazonas in Südamerika. Zusammen mit weiteren
Nebenflüssen des Amazonas und Orinocos (Südamerika) gehört er zu den am
intensivsten untersuchten Schwarzwasserflüssen weltweit. Schwarzwasserflüsse
entwässern Einzugsgebiete, deren Böden einen hohen Anteil an organischem
Material aufweisen, dessen Auswaschung wiederum zur dunkel-braunen Färbung
des Flusswassers führt. Die Flusseinzugsgebiete der südamerikanischen Flüsse
Amazonas und Orinoco sind zu großen Teilen von mineralischen Böden
(Ferralsolen) dominiert, deren Oberböden häufig einen hohen Anteil an organischer
Substanz aufweisen. In Süd-Ost-Asien hingegen entwässern Schwarzwasserflüsse
hauptsächlich Einzugsgebiete mit einem sehr hohen Anteil an organischen
Torfböden, die als dystrische Histosole klassifiziert werden. Etwa 83% der Torfböden
Süd-Ost-Asiens liegen auf den indonesischen Inseln Sumatra, Borneo und Irian Jaya
und speichern etwa 3% des weltweit in Böden gebundenen Kohlenstoffs. Im Zuge
der Errichtung von Ölpalmplantagen hat die Abholzung von Torfwäldern und
Entwässerung von Torfböden in Indonesien in den vergangenen Jahrzehnten
drastisch zugenommen. Ein verstärkter Abbau dieser organischen Böden und eine
damit einhergehende Erhöhung von CO2-Emissionen sind die Folgen.
Es war daher Ziel dieser Arbeit, mögliche Auswirkungen der Landnutzungs-
veränderungen auf den Fluss Siak (Zentral-Sumatra), dessen Einzugsgebiet einen
hohen Anteil solcher Torfböden aufweist und zudem stark anthropogen geprägt ist,
zu untersuchen. Ferner sollte die Bedeutung indonesischer Flüsse als Quelle von
gelöstem organischen Kohlenstoff (DOC) für den marinen DOC-Pool bewertet
werden.
Die vorliegende Arbeit wurde im Rahmen des indonesisch-deutschen Projektes
SPICE (Science for the Protection of Indonesian Coastal Marine Ecosystems)
erstellt. Im Zeitraum von 2004 bis 2006 wurden vier Expeditionen zur Beprobung des
Siak durchgeführt.
VIII Zusammenfassung
Die im Rahmen der Ausfahrten genommenen Proben wurden auf gelöste
anorganische Nährstoffe, DOC, Sauerstoff und Aminosäuren analysiert (Appendix).
Des Weiteren wurden Kohlenstoff- und Stickstoffkonzentrationen sowie deren stabile
Isotope von suspendiertem Flussmaterial, Boden- und Pflanzenproben bestimmt
(Appendix). Zudem wurden Experimente zum Abbau von DOC im Fluss
durchgeführt. Der jährliche Frischwasserabfluss des Siak wurde durch In-situ-
Messungen bestimmt und mittels der Auswertung von Niederschlags- und
Verdunstungsdaten validiert. Mit Hilfe geographischer Informationssysteme (GIS)
wurde ein digitales Geländemodell erstellt, aus dem wichtige hydrologische
Kenndaten des Flusseinzugsgebietes abgeleitet werden konnten.
Die Nährstoffkonzentrationen im Siak sind sowohl im Vergleich mit anderen Flüssen
Indonesiens als auch weltweit betrachtet gering, was auf die Auswaschung aus den
nährstoffarmen Torfböden im Flusseinzugsgebiet zurückzuführen ist. In der Nähe
von Städten und Industriestandorten wurden jedoch anthropogen erhöhte
Nährstoffkonzentrationen festgestellt. Die Auswaschung von Stickstoffdünger hatte
während einer Expedition zu einem zusätzlichen Eintrag an Nährstoffen in den Siak
geführt. Im Vergleich zu Nährstoffkonzentrationen eines im Süden Sumatras
gelegenen Schwarzwasserfluss aus den 1970er Jahren, sind die im Siak ermittelten
Werte deutlich erhöht. Es ist daher anzunehmen, dass die Nährstoffkonzentrationen
infolge der Intensivierung der Landnutzung in den Flusseinzugsgebieten deutlich
angestiegen sind, was wiederum auch bereits in anderen Flüssen nicht nur in den
Tropen beobachtet worden ist.
Im Gegensatz zu den Nährstoffen wurde der im Siak gemessene DOC hauptsächlich
aus den Torfböden im Flusseinzugsgebiet ausgewaschen. Die Auswaschung aus
den Böden ist aufgrund der starken anthropogenen Nutzung der Torfböden jedoch
längst kein rein natürlicher Prozess mehr. Zwar ist eine anthropogene Verstärkung
der Auswaschung anzunehmen, eine Quantifizierung dieser war jedoch bislang noch
nicht möglich. Im weltweiten Vergleich zählen die ermittelten DOC-Konzentrationen
im Siak zu den am höchsten gemessenen Konzentrationen überhaupt. Die höchsten
DOC-Konzentrationen wurden am Ende von Trockenzeiten beobachtet, wo es
aufgrund ansteigender Niederschlagsraten zu einer erhöhten Auswaschung der
Torfböden gekommen war.
Zusammenfassung IX
Der Abbau des DOC im Siak scheint maßgeblich bestimmend für die
Sauerstoffkonzentration im Fluss. Basierend auf Modellrechnungen würde bereits
eine Zunahme der DOC-Konzentration von ~15% zu ausgeprägten anoxischen
Zonen führen.
Jährlich werden 0,38 ± 0,1 Tg (Tg = 1012 g) DOC ins Ästuar des Siak transportiert.
Die zusätzliche Auswaschung von DOC aus Torfböden im Einzugsgebiet des
Ästuars erhöht den jährlichen Export in den Küstenozean auf 0,5 ± 0,3 Tg C pro
Jahr. Der eingetragene DOC des Siak sowie weiterer in den Küstenozean
mündender Schwarzwasserflüsse führt zu einem Anstieg der DOC-Konzentration in
der Malacca Straße um ~130 μmol L-1. Multipliziert mit dem Frischwassereintrag
exportiert die Malacca Straße demnach jährlich etwa 6,4 Tg terrestrischen DOC in
den Indischen Ozean. Somit werden etwa 33% der DOC-Fracht Indonesiens, die auf
Basis des DOC Exports des Siak auf ca. 21 Tg C pro Jahr abgeschätzt wurde, über
die Malacca Straße in den Indischen Ozean transportiert. Damit ist der DOC-Eintrag
aller Flüsse Indonesiens in den Ozean in etwa mit der DOC-Fracht des Amazonas
gleichzusetzen.

X
11
1. Introduction
The most famous and intensive studied blackwater rivers in the tropics are tributaries
of the large South American rivers Orinoco and Amazon such as the Rio Negro
which is the largest blackwater river worldwide (Ertel et al., 1986; Richey et al., 1990;
Hedges et al., 1994; Battin, 1998; Hedges et al., 2000). The dark-brown river colour
is caused by humic substances which are leached from organic rich soils located in
the river catchments. South American blackwater rivers drain mainly mineral soils
(ferralsols) with high contents of organic matter in the upper soil horizons. These
strongly weathered soils are widespread in the tropical regions of South America and
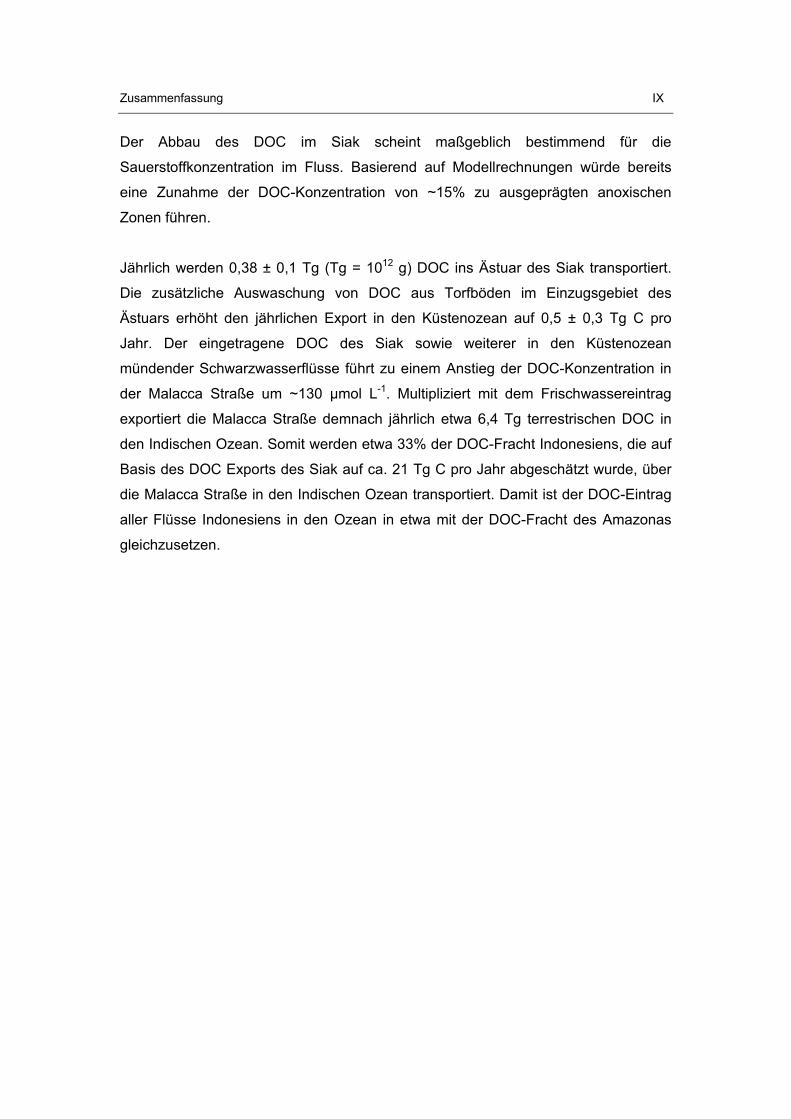
Africa (Fig. 1).
Fig. 1: Global distribution of Ferralsols (red areas) and Histosols (green areas) according to (FAO/UNESCO, 2003)
In addition to these soils, South East Asia shows also large areas covered by dystric
histosols, which according to the FAO are also considered as peatsoils and consist
largely of decomposed trees. The organic matter content exceeds 50% in the upper
80 cm and pH values are <5.5 (FAO/UNESCO, 2003).
Approximately 83% of the SE Asian peatsoils (2-3.3 * 105 km2) are located in
Indonesia, mainly on the islands Irian Jaya, Borneo and Sumatra (Rieley et al.,
1996a). With a peat layer thickness of up to 40 m and 26-50 Gt C, Indonesian peat
12 Introduction
soils present a vast reservoir of organic carbon and store approximately 3% of the
global carbon stored in soils (Post et al., 1982; Rieley et al., 1996a; Rieley et al.,
1996b; Rieley and Setiadi, 1997; Page et al., 1999; Page et al., 2002; Hooijer et al.,
2006).
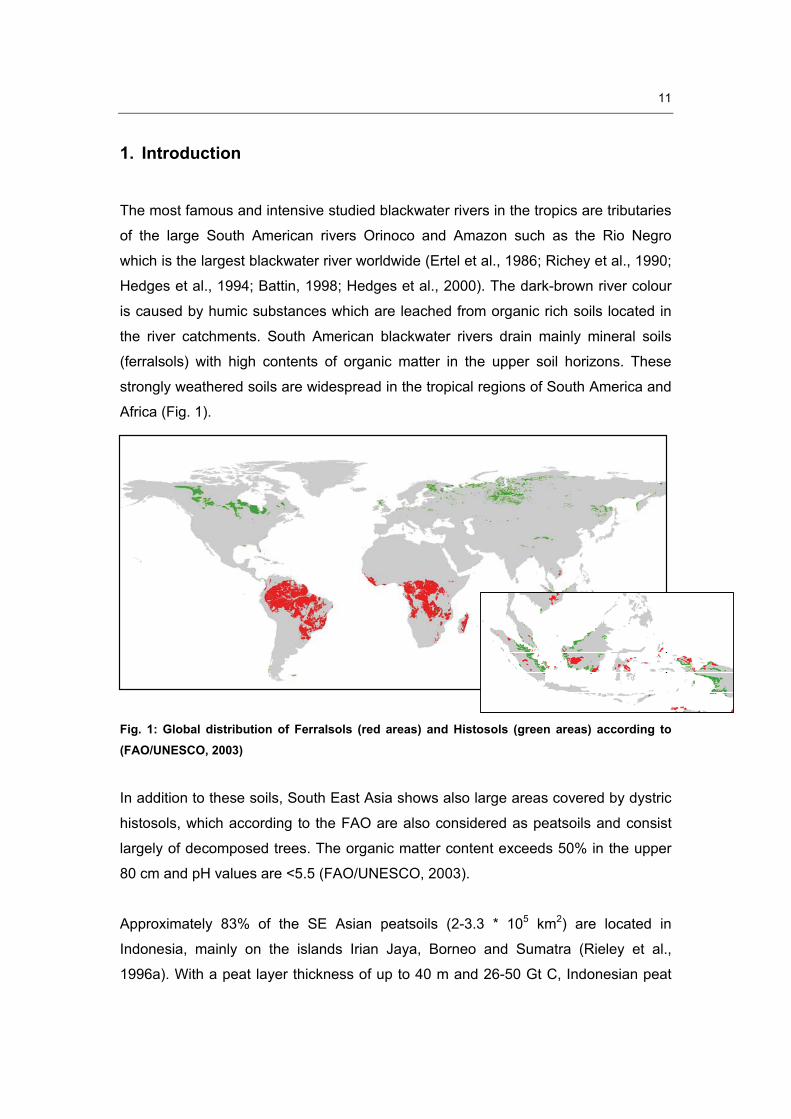
Fig. 2: Indonesian peat soil coverage (Data source: FAO/UNESCO, 2003)
In contrast to South America, Indonesia has no major rivers as it consists of
numerous small volcanic and coral islands. Thus, Indonesian peatsoils are drained
by various small lowland rivers which contribute ~11% (135,000 m3s-1) to the global
freshwater export and therefore are comparable to the Amazon accounting for ~15%
(183,000 m3s-1) (Richey et al., 1991; Syvitski et al., 2005).
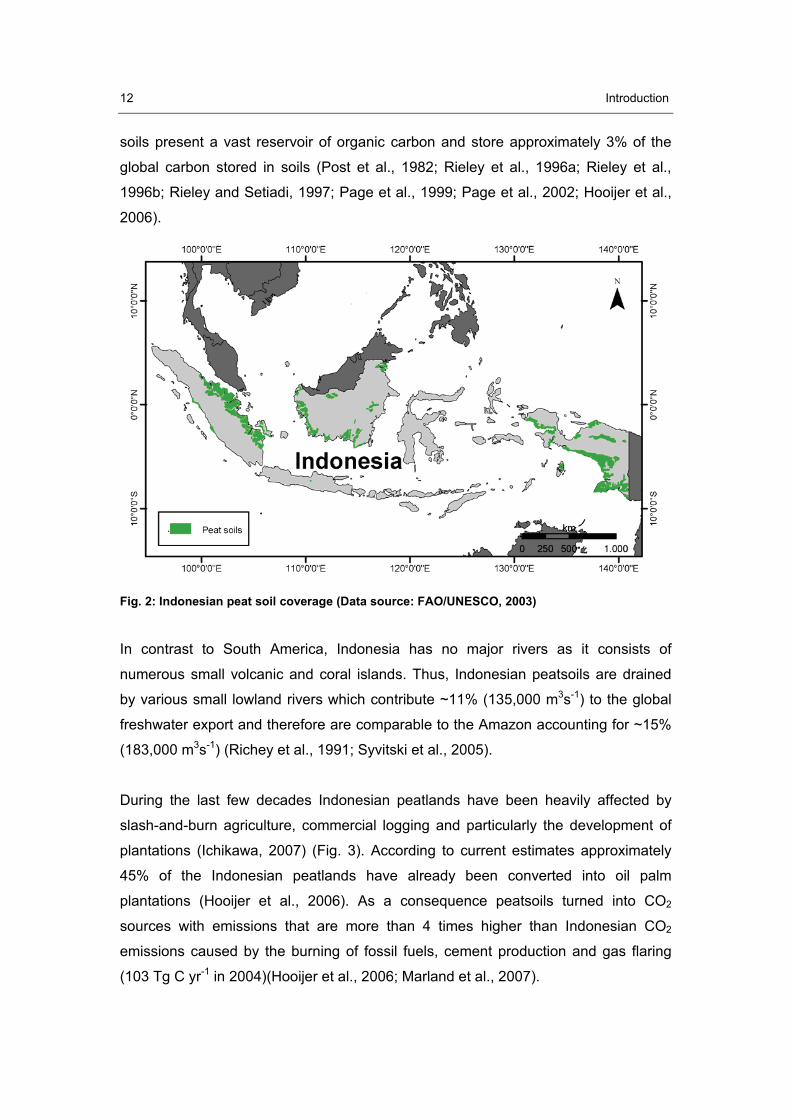
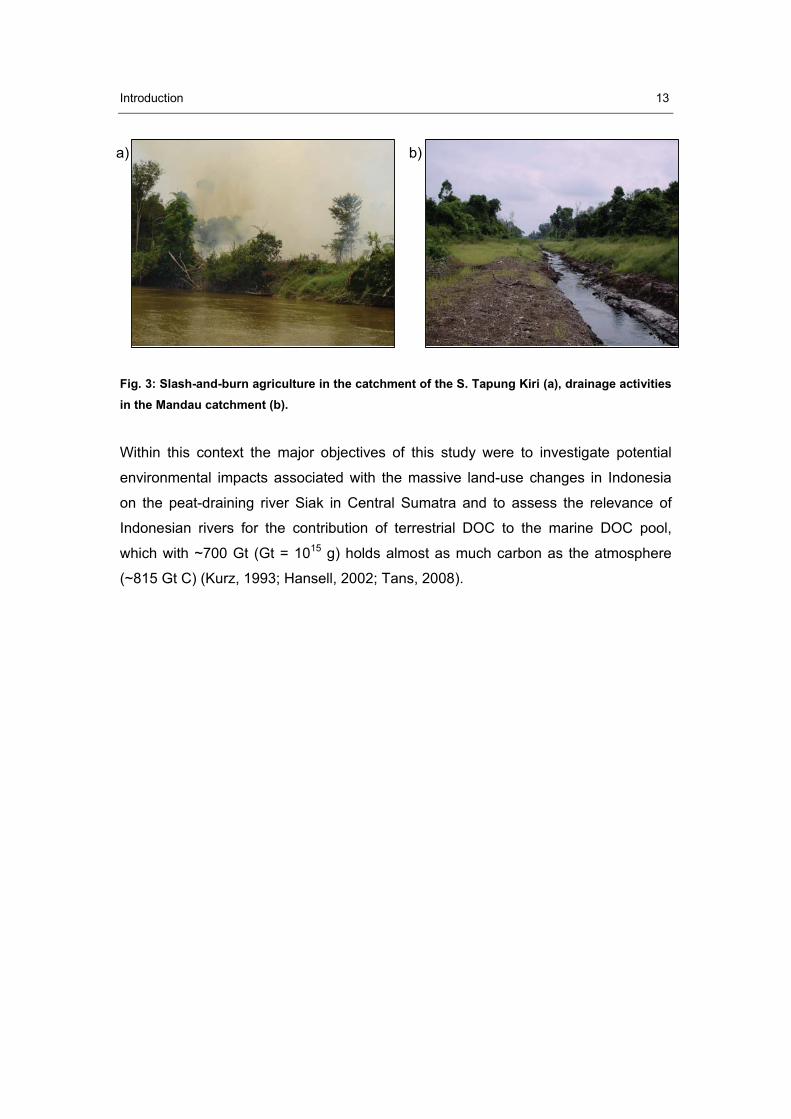
During the last few decades Indonesian peatlands have been heavily affected by
slash-and-burn agriculture, commercial logging and particularly the development of
plantations (Ichikawa, 2007) (Fig. 3). According to current estimates approximately
45% of the Indonesian peatlands have already been converted into oil palm
plantations (Hooijer et al., 2006). As a consequence peatsoils turned into CO2
sources with emissions that are more than 4 times higher than Indonesian CO2
emissions caused by the burning of fossil fuels, cement production and gas flaring
(103 Tg C yr-1 in 2004)(Hooijer et al., 2006; Marland et al., 2007).
Introduction 13
Fig. 3: Slash-and-burn agriculture in the catchment of the S. Tapung Kiri (a), drainage activities in the Mandau catchment (b).
Within this context the major objectives of this study were to investigate potential
environmental impacts associated with the massive land-use changes in Indonesia
on the peat-draining river Siak in Central Sumatra and to assess the relevance of
Indonesian rivers for the contribution of terrestrial DOC to the marine DOC pool,
which with ~700 Gt (Gt = 1015 g) holds almost as much carbon as the atmosphere
(~815 Gt C) (Kurz, 1993; Hansell, 2002; Tans, 2008).
a) b)

14
Published and submitted papers 15
2. Published and submitted papers
2.1. Sources of dissolved inorganic nutrients in the peat-draining river Siak,
Central Sumatra, Indonesia
Antje Bauma, Tim Rixena, Gerd Liebezeitb, Ralf Wöstmannb, Christine Josec, Joko
Samiajic
aCenter for Tropical Marine Ecology, Fahrenheitstrasse 6, 28359 Bremen, Germany
bResearch Centre Terramare, Schleusenstrasse 1, 26382 Wilhelmshaven, Germany
cUniversity of Riau, Jl. Simpang Panam Km 12.5, Pekanbaru, Riau, Indonesia
Biogeochemistry, submitted 3 June 2008
Abstract Dissolved inorganic nutrients (NO3
-, NO2-, NH4
+, PO43-) of the peat-draining Siak
River in Central Sumatra were determined during four campaigns between 2004 and
2006. Concentrations of dissolved inorganic nitrogen (DIN) varied between 5.8 and
65.1 μmol L-1. Enhanced DIN concentrations associated with high proportions of
NH4+ indicated increased wastewater discharges in the populated areas of the
drainage basin. The highest DIN concentrations were observed in March 2004 where
nitrogen-fertilization of oil palm plantations was followed by heavy rainfall which
resulted in enhanced leaching. Although locally water hyacinths act as nitrogen sink
nutrient uptake by freshwater plankton in general seems to play a minor role in the
Siak due to light limiting conditions. Overall the phosphate (PO43-) concentrations
varied between 0.2 and 17.7 μmol L-1 with occasional concentration peaks of up to
197 μmol L-1 near industrial areas, reflecting anthropogenic origin. Increased
leaching as a result of anthropogenic activities and wastewater discharges could
have doubled the DIN concentrations in the Siak as suggested by comparison of the
Siak data with those of a peat-draining river in South Sumatra measured in the
1970s.
Keywords: leaching, nutrients, Sumatra (Indonesia), peat, wastewater
16 Published and submitted papers
Introduction Estuaries and coastal oceans represent the land-sea interface where interactions
between continents, atmosphere and open ocean take place (Mantoura et al., 1991).
Increases in human activities in river catchments have led to major changes of river
discharges (Vollenweider, 1992; Carpenter et al., 1998; Van Drecht et al., 2003;
Billen and Garnier, 2007). As a result of agricultural, industrial, domestic wastewater
discharges as well as soil leaching caused by land-use changes over the last few
decades, riverine nutrient deliveries by rivers into the coastal ocean have increased
by a factor of 1.5 to 2 (Meybeck, 1982; Vollenweider, 1992; Rabouille et al., 2001;
Bouwman et al., 2005; Dumont et al., 2005).
Slash-and-burn agriculture, commercial logging and the development of plantations
have led to an enormous forest loss in South East Asia (Ichikawa, 2007). In
Indonesia, where ~83% of the SE Asian peatsoils are located, the area of peatlands
converted into timber and mostly oil palm plantations nearly tripled between 1985 to
1998 (Page and Rieley, 1998; Hooijer et al., 2006; Murdiyarso and Adiningsih, 2007).
This present study aims at the investigation of processes controlling nutrient
dynamics in the peat-draining river Siak in Central Sumatra.
Study area With a length of ~370 km and a catchment area of ~11.500 km2 the Siak is one of the
major rivers draining the Central Sumatran lowlands. It originates at the confluence of
the two headstreams S. Tapung Kanan and S. Tapung Kiri. The S. Tapung Kanan
and the major tributary Mandau rise in the peat-dominated lowlands while the S.
Tapung Kiri originates at the foot of the Central Sumatran Mountains (Fig. 1). The
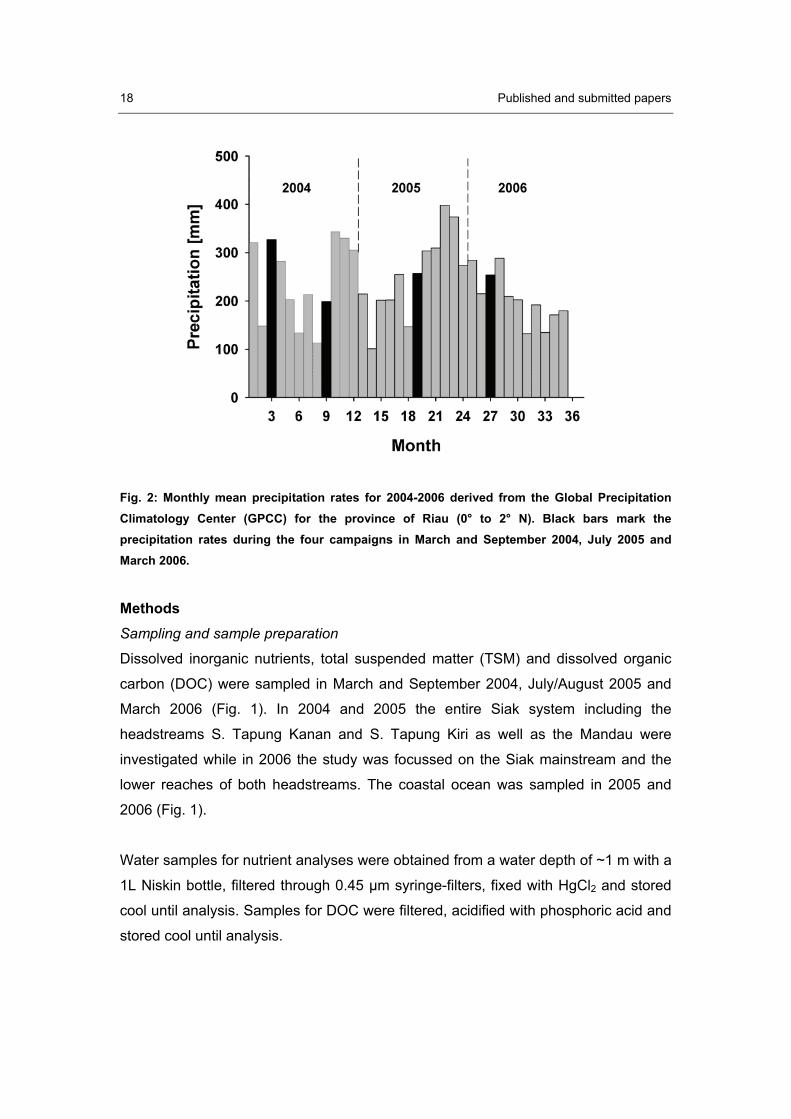
monthly rainfall in the Siak catchment ranges between 101 and 398 mm resulting in a
mean annual freshwater discharge of ~370 m3s-1 (Fig. 2) (GPCC, 2005; Baum et al.,
2007). Approximately 45% of the Siak catchment is covered by tropical peatsoils; the
vegetation is dominated by lowland forests and shrubs as well as by oil palm and
rubber plantations (Laumonier, 1997).
Published and submitted papers 17
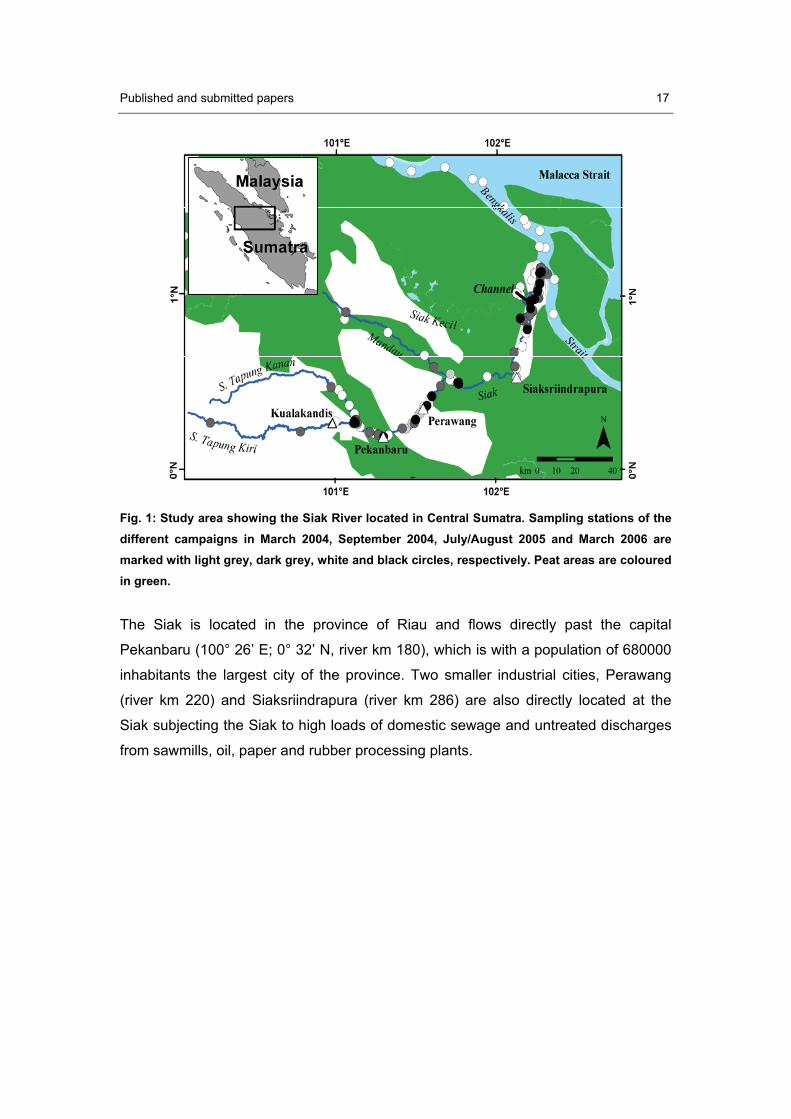
Fig. 1: Study area showing the Siak River located in Central Sumatra. Sampling stations of the different campaigns in March 2004, September 2004, July/August 2005 and March 2006 are marked with light grey, dark grey, white and black circles, respectively. Peat areas are coloured in green.
The Siak is located in the province of Riau and flows directly past the capital
Pekanbaru (100° 26’ E; 0° 32’ N, river km 180), which is with a population of 680000
inhabitants the largest city of the province. Two smaller industrial cities, Perawang
(river km 220) and Siaksriindrapura (river km 286) are also directly located at the
Siak subjecting the Siak to high loads of domestic sewage and untreated discharges
from sawmills, oil, paper and rubber processing plants.
18 Published and submitted papers
Fig. 2: Monthly mean precipitation rates for 2004-2006 derived from the Global Precipitation Climatology Center (GPCC) for the province of Riau (0° to 2° N). Black bars mark the precipitation rates during the four campaigns in March and September 2004, July 2005 and March 2006.
Methods Sampling and sample preparation
Dissolved inorganic nutrients, total suspended matter (TSM) and dissolved organic
carbon (DOC) were sampled in March and September 2004, July/August 2005 and
March 2006 (Fig. 1). In 2004 and 2005 the entire Siak system including the
headstreams S. Tapung Kanan and S. Tapung Kiri as well as the Mandau were
investigated while in 2006 the study was focussed on the Siak mainstream and the
lower reaches of both headstreams. The coastal ocean was sampled in 2005 and
2006 (Fig. 1).
Water samples for nutrient analyses were obtained from a water depth of ~1 m with a
1L Niskin bottle, filtered through 0.45 μm syringe-filters, fixed with HgCl2 and stored
cool until analysis. Samples for DOC were filtered, acidified with phosphoric acid and
stored cool until analysis.
Published and submitted papers 19
TSM was collected by filtering water through pre-combusted glass-fibre-filters
(Whatmann GF/F). The filters were dried at 40° C and analysed for particulate
organic carbon (POC), particulate organic nitrogen (PON) as well as stable carbon
(�13C) and nitrogen isotopes (�15N).
Plant samples (leaves) were collected along the river banks of the Siak and its
tributaries during the expedition in July/August 2005. Plant samples were dried at
40°C, homogenised and analysed for POC, PON, �13C and �15N.
Analyses
Dissolved inorganic nutrients and dissolved oxygen
Dissolved inorganic nutrients (NO3-, NO2
-, NH4+, PO4
3-) were analysed
spectrophotometrically using a continuous flow autoanalyser (Skalar-SAN-plus).
Dissolved oxygen concentrations were determined by Winkler titration using the
method described by Grasshoff et al. (1999).
Particulate organic carbon and nitrogen (POC and PON)
POC and PON analyses were carried out with a Carlo Erba NA 2100 element
analyser by high temperature combustion. Prior to the analysis of POC GF/F filters
containing total suspended matter (TSM) were acidified with 1N HCl to remove
inorganic carbon and dried at 40° C.
Stable carbon (�13C) and nitrogen isotopes (�15N)
Carbon and nitrogen isotopic compositions were determined in a Finnigan Delta Plus
gas isotope ratio mass spectrometer following high temperature combustion in a
Flash 1112 EA elemental analyser. Carbonate was removed prior to the combustion
from the samples as described above for POC. �13C and �15N values are reported in
‰ relative to PDB standard and N2 in atmospheric air, respectively.
Dissolved organic carbon (DOC)
DOC was analysed by means of high temperature catalytic oxidation using a
Dohrman DC-190 Total Organic Carbon Analyser equipped with a platinum catalyst.
Before injection into the furnace, the acidified samples were decarbonated by purging
with oxygen. The evolving CO2 was purified, dried and detected by a non-dispersive
20 Published and submitted papers
infrared detection system. Calibration was carried out using potassium phthalate
dissolved in MilliQ water.
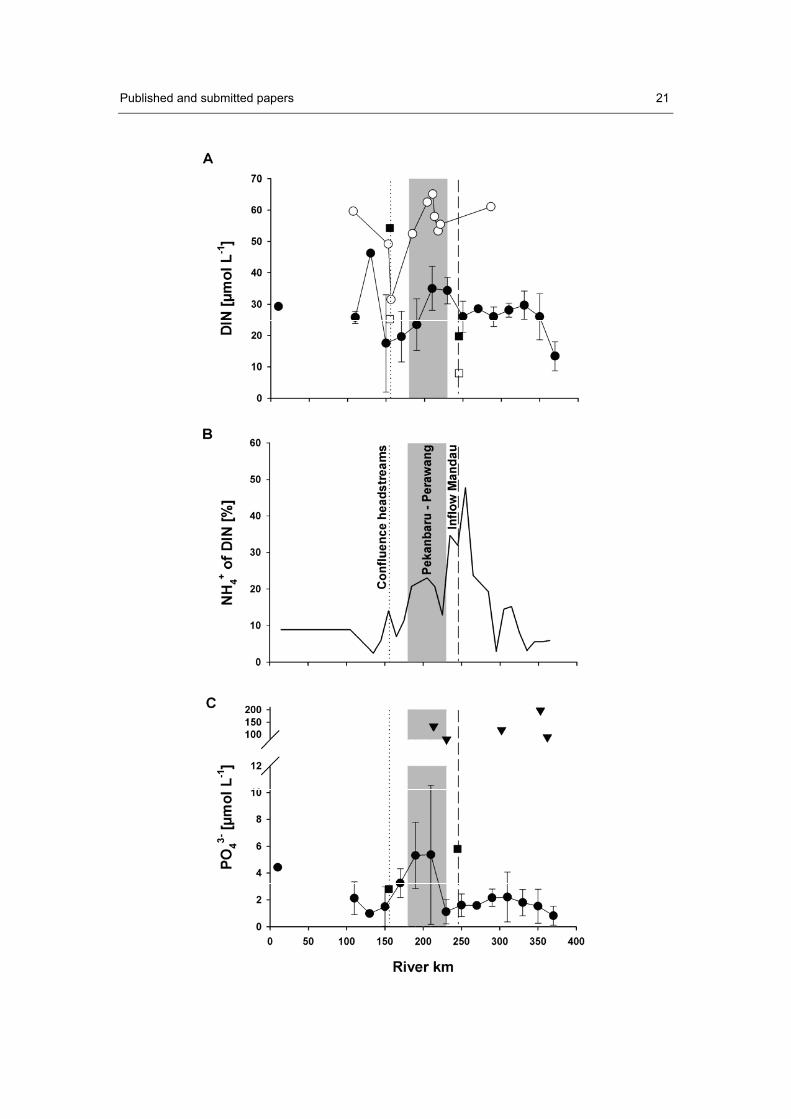
Results and Discussion Dissolved inorganic nitrogen (DIN)
DIN concentrations displayed low variations between September 2004, July/August
2005 and March 2006 as indicated by the error bars shown in Fig. 3a while
concentrations measured during the expedition in March 2004 were twice as high
(Fig. 3a). Nonetheless, the trend of DIN concentrations was similar during all
expeditions showing enhanced concentrations in the lower reaches of the S. Tapung
Kiri (river km 0 to 155) and the densely populated zone between Pekanbaru and
Perawang (river km ~180-230) (Fig. 3a). Lower DIN concentrations were measured
at the confluence of the headstreams S. Tapung Kiri and S. Tapung Kanan (river km
~155) and in the Siak Estuary (river km ~325-370). Since the S. Tapung Kiri and the
S. Tapung Kanan revealed mean DIN concentrations of 36.1 and 32.0 μmol L-1,
respectively (Tab. 1), mixing of the two water masses cannot explain the observed
decrease in DIN at the S. Tapung Kiri and the S. Tapung Kanan junction.
Nutrient uptake by freshwater plankton is generally assumed to be an important DIN
sink in rivers. However, the dark-brown water of the Siak reduces the light
penetration to depths of < 20 cm which limits photosynthesis and subsequent growth
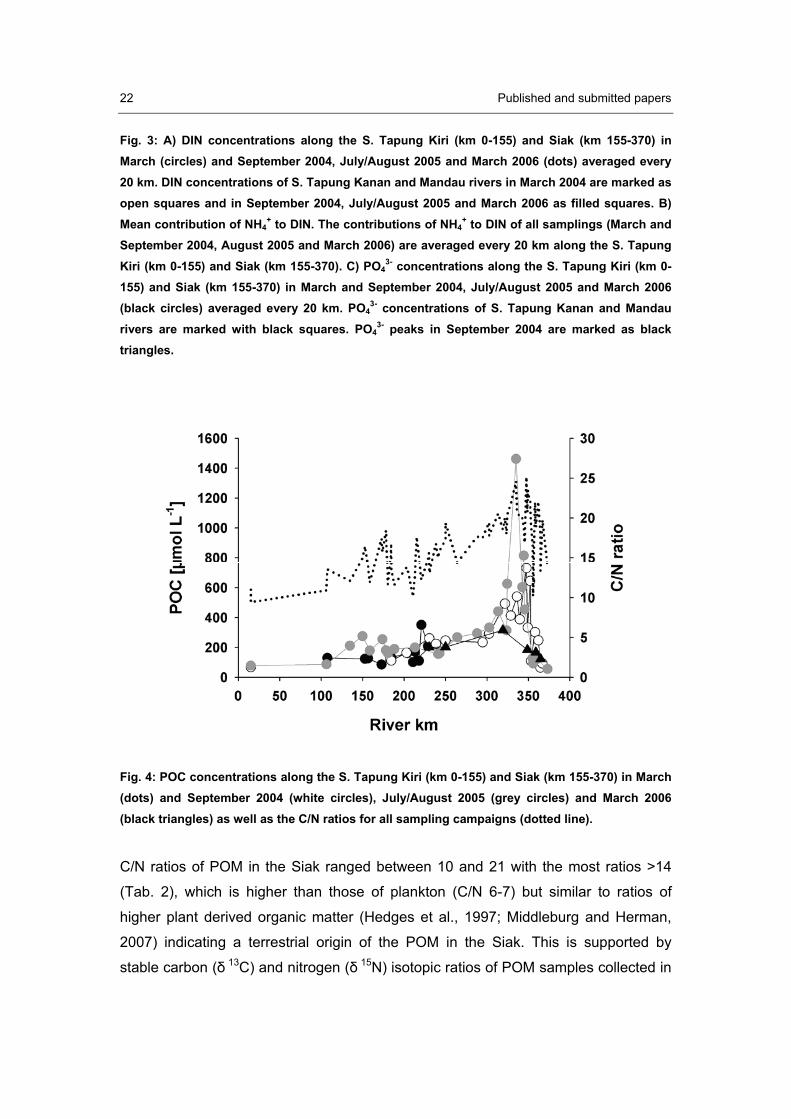
of plankton (Baum et al., 2007). Furthermore, the POC concentrations with a mean
value of 176 μmol L-1 are lower compared to other major rivers (Ludwig et al., 1996).
However, a pronounced concentration peak occurred in the Siak Estuary close to a
channel which was cut through peatlands to improve the local infrastructure by
connecting the Siak and the Siak Kecil (Fig. 1, 4).
Published and submitted papers 21
22 Published and submitted papers
Fig. 3: A) DIN concentrations along the S. Tapung Kiri (km 0-155) and Siak (km 155-370) in March (circles) and September 2004, July/August 2005 and March 2006 (dots) averaged every 20 km. DIN concentrations of S. Tapung Kanan and Mandau rivers in March 2004 are marked as open squares and in September 2004, July/August 2005 and March 2006 as filled squares. B) Mean contribution of NH4
+ to DIN. The contributions of NH4+ to DIN of all samplings (March and
September 2004, August 2005 and March 2006) are averaged every 20 km along the S. Tapung Kiri (km 0-155) and Siak (km 155-370). C) PO4
3- concentrations along the S. Tapung Kiri (km 0-155) and Siak (km 155-370) in March and September 2004, July/August 2005 and March 2006 (black circles) averaged every 20 km. PO4
3- concentrations of S. Tapung Kanan and Mandau rivers are marked with black squares. PO4
3- peaks in September 2004 are marked as black triangles.
Fig. 4: POC concentrations along the S. Tapung Kiri (km 0-155) and Siak (km 155-370) in March (dots) and September 2004 (white circles), July/August 2005 (grey circles) and March 2006 (black triangles) as well as the C/N ratios for all sampling campaigns (dotted line).
C/N ratios of POM in the Siak ranged between 10 and 21 with the most ratios >14
(Tab. 2), which is higher than those of plankton (C/N 6-7) but similar to ratios of
higher plant derived organic matter (Hedges et al., 1997; Middleburg and Herman,
2007) indicating a terrestrial origin of the POM in the Siak. This is supported by
stable carbon (� 13C) and nitrogen (� 15N) isotopic ratios of POM samples collected in
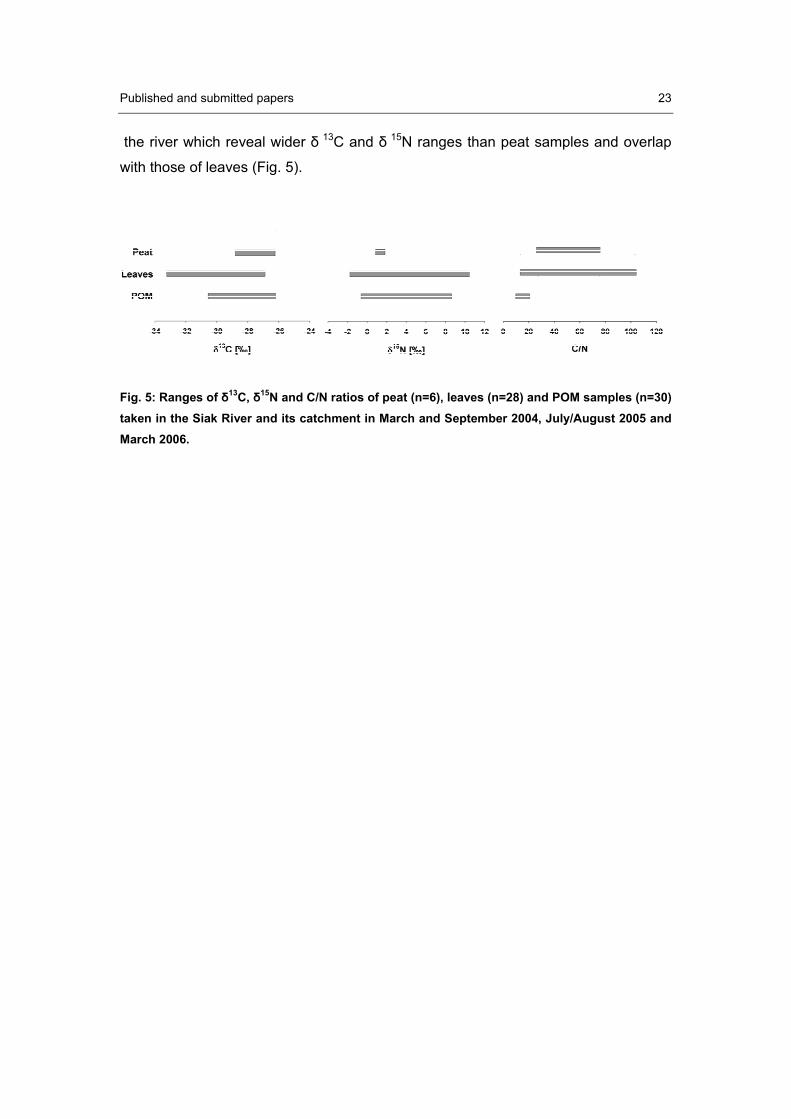
Published and submitted papers 23
the river which reveal wider � 13C and � 15N ranges than peat samples and overlap
with those of leaves (Fig. 5).
Fig. 5: Ranges of �13C, �15N and C/N ratios of peat (n=6), leaves (n=28) and POM samples (n=30) taken in the Siak River and its catchment in March and September 2004, July/August 2005 and March 2006.
24
Pub
lishe
d an
d su
bmitt
ed p
aper
s
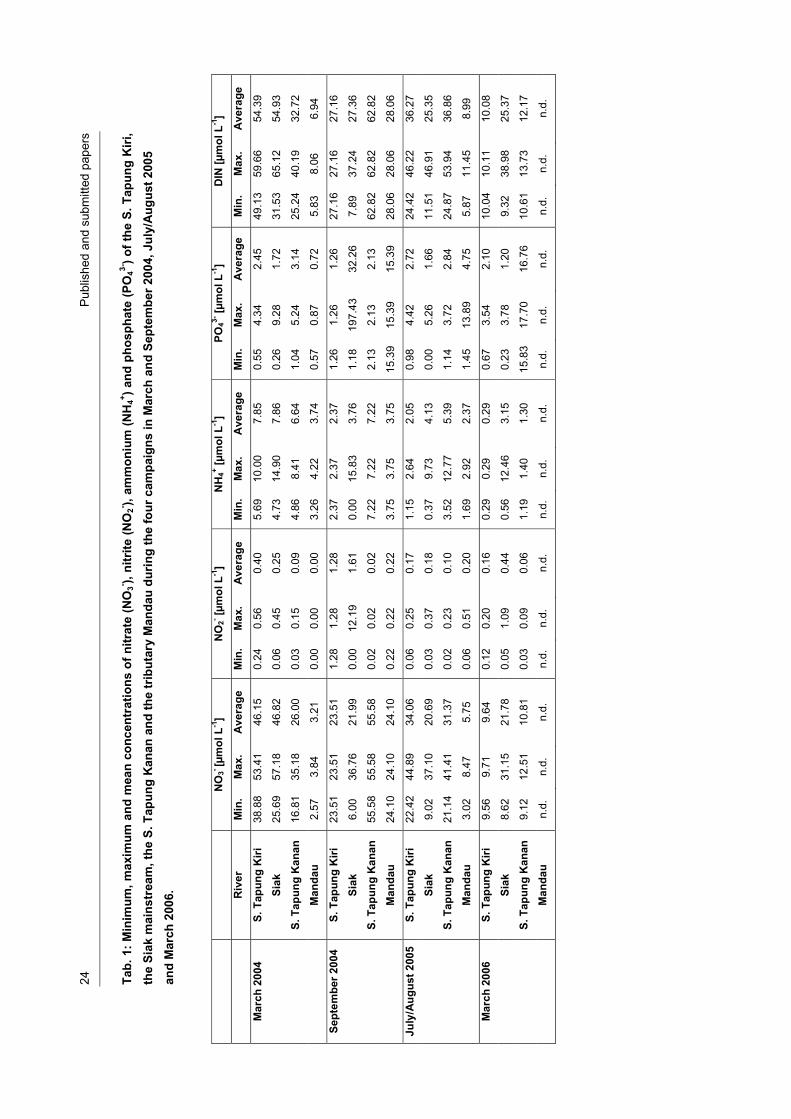
Tab.
1: M
inim
um, m
axim
um a
nd m
ean
conc
entr
atio
ns o
f nitr
ate
(NO
3- ), ni
trite
(NO
2- ), am
mon
ium
(NH
4+ ) and
pho
spha
te (P
O43-
) of t
he S
. Tap
ung
Kiri
, th
e Si
ak m
ains
trea
m, t
he S
. Tap
ung
Kan
an a
nd th
e tr
ibut
ary
Man
dau
durin
g th
e fo
ur c
ampa
igns
in M
arch
and
Sep
tem
ber 2
004,
Jul
y/A
ugus
t 200
5
and
Mar
ch 2
006.
NO
3- [μm
ol L
-1]
NO
2- [μm
ol L
-1]
NH
4+ [μm
ol L
-1]
PO43-
[μm
ol L
-1]
DIN
[μm
ol L
-1]
R
iver
M
in.
Max
. A
vera
ge
Min
. M
ax.
Ave
rage
M
in.
Max
. A
vera
ge
Min
. M
ax.
Ave
rage
M
in.
Max
. A
vera
ge
Mar
ch 2
004
S. T
apun
g K
iri
38.8
8 53
.41
46.1
5 0.
24
0.56
0.
40
5.69
10
.00
7.85
0.
55
4.34
2.
45
49.1
3 59
.66
54.3
9
Si
ak
25.6
9 57
.18
46.8
2 0.
06
0.45
0.
25
4.73
14
.90
7.86
0.
26
9.28
1.
72
31.5
3 65
.12
54.9
3
S.
Tap
ung
Kan
an
16.8
1 35
.18
26.0
0 0.
03
0.15
0.
09
4.86
8.
41
6.64
1.
04
5.24
3.
14
25.2
4 40
.19
32.7
2
M
anda
u 2.
57
3.84
3.
21
0.00
0.
00
0.00
3.
26
4.22
3.
74
0.57
0.
87
0.72
5.
83
8.06
6.
94
Sept
embe
r 200
4 S.
Tap
ung
Kiri
23
.51
23.5
1 23
.51
1.28
1.
28
1.28
2.
37
2.37
2.
37
1.26
1.
26
1.26
27
.16
27.1
6 27
.16
Si
ak
6.00
36
.76
21.9
9 0.
00
12.1
9 1.
61
0.00
15
.83
3.76
1.
18
197.
43
32.2
6 7.
89
37.2
4 27
.36
S.
Tap
ung
Kan
an
55.5
8 55
.58
55.5
8 0.
02
0.02
0.
02
7.22
7.
22
7.22
2.
13
2.13
2.
13
62.8
2 62
.82
62.8
2
M
anda
u 24
.10
24.1
0 24
.10
0.22
0.
22
0.22
3.
75
3.75
3.
75
15.3
9 15
.39
15.3
9 28
.06
28.0
6 28
.06
July
/Aug
ust 2
005
S. T
apun
g K
iri
22.4
2 44
.89
34.0
6 0.
06
0.25
0.
17
1.15
2.
64
2.05
0.
98
4.42
2.
72
24.4
2 46
.22
36.2
7
Si
ak
9.02
37
.10
20.6
9 0.
03
0.37
0.
18
0.37
9.
73
4.13
0.
00
5.26
1.
66
11.5
1 46
.91
25.3
5
S.
Tap
ung
Kan
an
21.1
4 41
.41
31.3
7 0.
02
0.23
0.
10
3.52
12
.77
5.39
1.
14
3.72
2.
84
24.8
7 53
.94
36.8
6
M
anda
u 3.
02
8.47
5.
75
0.06
0.
51
0.20
1.
69
2.92
2.
37
1.45
13
.89
4.75
5.
87
11.4
5 8.
99
Mar
ch 2
006
S. T
apun
g K
iri
9.56
9.
71
9.64
0.
12
0.20
0.
16
0.29
0.
29
0.29
0.
67
3.54
2.
10
10.0
4 10
.11
10.0
8
Si
ak
8.62
31
.15
21.7
8 0.
05
1.09
0.
44
0.56
12
.46
3.15
0.
23
3.78
1.
20
9.32
38
.98
25.3
7
S.
Tap
ung
Kan
an
9.12
12
.51
10.8
1 0.
03
0.09
0.
06
1.19
1.
40
1.30
15
.83
17.7
0 16
.76
10.6
1 13
.73
12.1
7
M
anda
u n.
d.
n.d.
n.
d.
n.d.
n.
d.
n.d.
n.
d.
n.d.
n.
d.
n.d.
n.
d.
n.d.
n.
d.
n.d.
n.
d.
Published and submitted papers 25
Therefore it is assumed that POM in the Siak originates largely from leaves of the
riparian vegetation, except for the sites that exhibited pronounced POM peaks. Here
lighter �15N (mean 1.3 ‰) and slight increases in �13C values (mean -29 ‰) are
indicative of enhanced input of peat-derived organic matter most likely as a result of
peat-erosion along the channel banks. However, lower POM concentrations which
are mainly of terrestrial origin in combination with light limiting conditions suggest that
the role of primary producers in the consumption of nutrients in the Siak as well as in
its estuary is not significant. Thus, decreasing DIN concentrations with increasing
salinities suggest that dilution of river water with nutrient-poor ocean water is the
main factor reducing the DIN concentrations in the Siak Estuary.
Water hyacinths (Eichhornia crassipes) which are known for their high nutrient
removal (Reddy and D'Angelo, 1990) were abundant especially at the S. Tapung Kiri
and S. Tapung Kanan junction. Accordingly, it is assumed that DIN uptake by the
water hyacinths could have decreased the DIN concentrations at this site.
Nitrate (NO3-) contributed up to 85 % to DIN in the Siak except at the Mandau
junction and within the densely populated and industrialised area between
Pekanbaru and Perawang (Fig. 3b). In the Mandau, up to 59 % of DIN consisted of
NH4+. The Mandau is a classic blackwater river with low oxygen (0.8 to 3.2 mg L-1,
mean = 1.7 mg L-1) and high DOC contents, which results from leaching of the
adjacent peatsoils covering up to 48 % of its catchment (Baum et al., 2007). In such
environments the lack of oxygen reduces nitrification (Reddy and D'Angelo, 1994;
Kieckbusch and Schrautzer, 2007). This could explain the high proportion of NH4+ in
the Mandau and in the Siak at the Mandau junction (river km ~245) (Fig. 3b). The
other site at which NH4+ contributed significantly to DIN (up to ~23 %) was the
densely populated and industrialised area between Pekanbaru and Perawang (Fig.
3b). Compared to the Mandau oxygen contents were slightly higher (1 to 3.7 mg L-1,
mean = 2.6 mg L-1) in this area. In wastewater channels that discharge directly into
the Siak, DIN concentrations were extremely high (~565-1,877 μmol L-1) (Tab. 3) and
NH4+ contributed 63-96 % to DIN. Thus, the increased percentage in NH4
+ of the total
DIN and the overall enhanced DIN concentrations were most likely the result of
wastewater inputs in the area between Pekanbaru and Perawang (Fig. 3a, b).
26
Pub
lishe
d an
d su
bmitt
ed p
aper
s
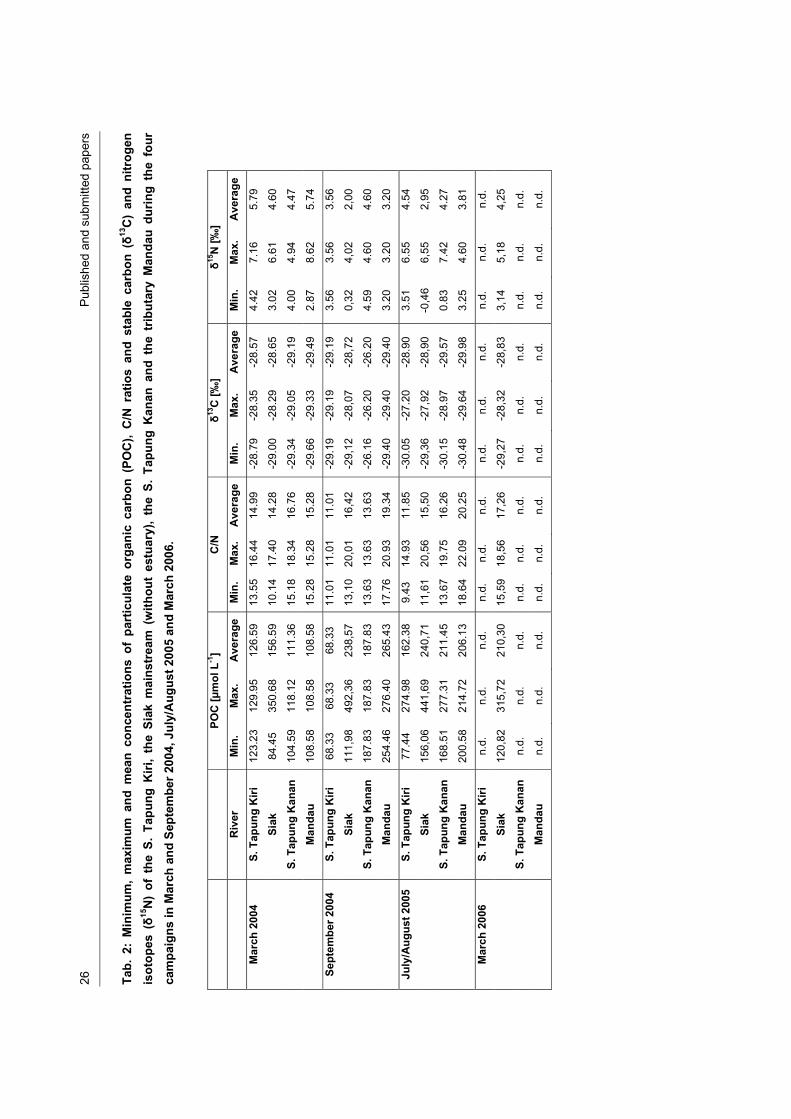
Tab.
2:
Min
imum
, m
axim
um a
nd m
ean
conc
entr
atio
ns o
f pa
rtic
ulat
e or
gani
c ca
rbon
(PO
C),
C/N
rat
ios
and
stab
le c
arbo
n (�
13C
) an
d ni
trog
en
isot
opes
(�15
N)
of t
he S
. Ta
pung
Kiri
, th
e Si
ak m
ains
trea
m (
with
out
estu
ary)
, th
e S.
Tap
ung
Kan
an a
nd t
he t
ribut
ary
Man
dau
durin
g th
e fo
ur
cam
paig
ns in
Mar
ch a
nd S
epte
mbe
r 200
4, J
uly/
Aug
ust 2
005
and
Mar
ch 2
006.
POC
[μm
ol L
-1]
C/N
�13
C [‰
] �15
N [‰
]
R
iver
M
in.
Max
. A
vera
ge
Min
. M
ax.
Ave
rage
M
in.
Max
. A
vera
ge
Min
. M
ax.
Ave
rage
Mar
ch 2
004
S. T
apun
g K
iri
123.
23
129.
95
126.
59
13.5
516
.44
14.9
9 -2
8.79
-2
8.35
-2
8.57
4.
42
7.16
5.
79
Si
ak
84.4
5 35
0.68
15
6.59
10
.14
17.4
014
.28
-29.
00
-28.
29
-28.
65
3.02
6.
61
4.60
S.
Tap
ung
Kan
an
104.
59
118.
12
111.
36
15.1
818
.34
16.7
6 -2
9.34
-2
9.05
-2
9.19
4.
00
4.94
4.
47
M
anda
u 10
8.58
10
8.58
10
8.58
15
.28
15.2
815
.28
-29.
66
-29.
33
-29.
49
2.87
8.
62
5.74
Sept
embe
r 200
4 S.
Tap
ung
Kiri
68
.33
68.3
3 68
.33
11.0
111
.01
11.0
1 -2
9.19
-2
9.19
-2
9.19
3.
56
3.56
3.
56
Si
ak
111,
98
492,
36
238,
57
13,1
020
,01
16,4
2 -2
9,12
-2
8,07
-2
8,72
0,
32
4,02
2,
00
S.
Tap
ung
Kan
an
187.
83
187.
83
187.
83
13.6
313
.63
13.6
3 -2
6.16
-2
6.20
-2
6.20
4.
59
4.60
4.
60
M
anda
u 25
4.46
27
6.40
26
5.43
17
.76
20.9
319
.34
-29.
40
-29.
40
-29.
40
3.20
3.
20
3.20
July
/Aug
ust 2
005
S. T
apun
g K
iri
77.4
4 27
4.98
16
2.38
9.
43
14.9
311
.85
-30.
05
-27.
20
-28.
90
3.51
6.
55
4.54
Si
ak
156,
06
441,
69
240,
71
11,6
120
,56
15,5
0 -2
9,36
-2
7,92
-2
8,90
-0
,46
6,55
2,
95
S.
Tap
ung
Kan
an
168.
51
277.
31
211.
45
13.6
719
.75
16.2
6 -3
0.15
-2
8.97
-2
9.57
0.
83
7.42
4.
27
M
anda
u 20
0.58
21
4.72
20
6.13
18
.64
22.0
920
.25
-30.
48
-29.
64
-29.
98
3.25
4.
60
3.81
Mar
ch 2
006
S. T
apun
g K
iri
n.d.
n.
d.
n.d.
n.
d.
n.d.
n.
d.
n.d.
n.
d.
n.d.
n.
d.
n.d.
n.
d.
Si
ak
120,
82
315,
72
210,
30
15,5
918
,56
17,2
6 -2
9,27
-2
8,32
-2
8,83
3,
14
5,18
4,
25
S.
Tap
ung
Kan
an
n.d.
n.
d.
n.d.
n.
d.
n.d.
n.
d.
n.d.
n.
d.
n.d.
n.
d.
n.d.
n.
d.
M
anda
u n.
d.
n.d.
n.
d.
n.d.
n.
d.
n.d.
n.
d.
n.d.
n.
d.
n.d.
n.
d.
n.d.
Published and submitted papers 27
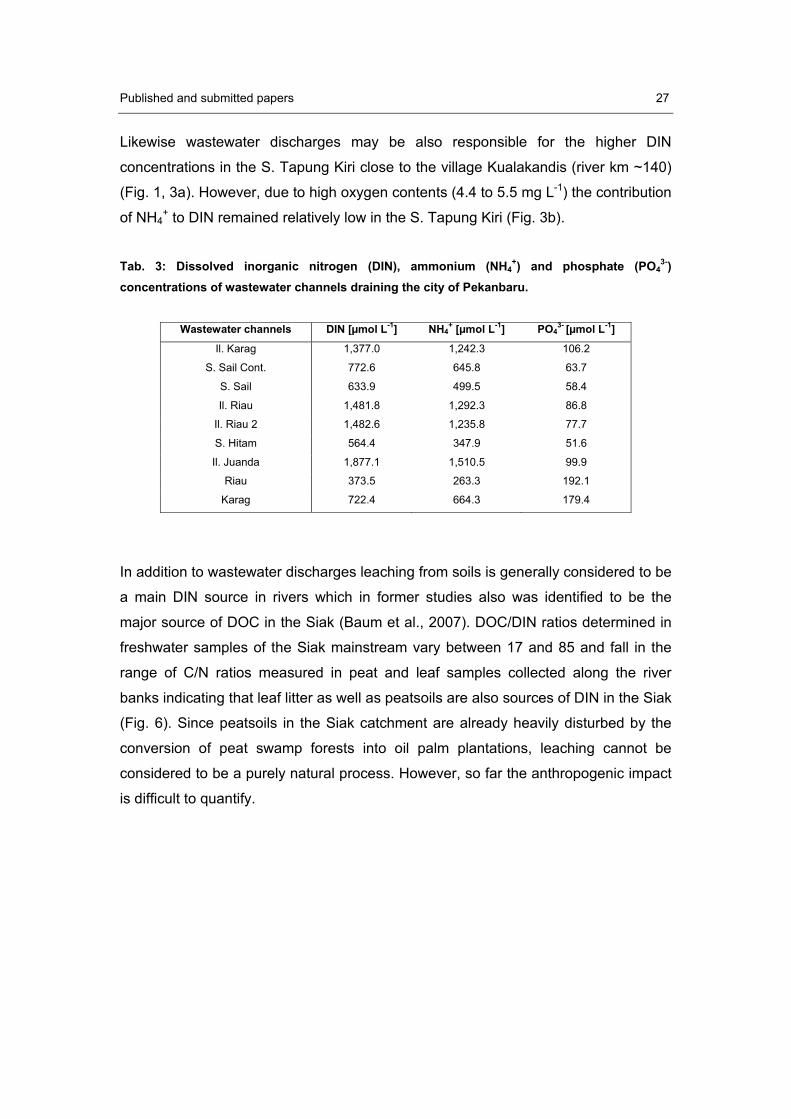
Likewise wastewater discharges may be also responsible for the higher DIN
concentrations in the S. Tapung Kiri close to the village Kualakandis (river km ~140)
(Fig. 1, 3a). However, due to high oxygen contents (4.4 to 5.5 mg L-1) the contribution
of NH4+ to DIN remained relatively low in the S. Tapung Kiri (Fig. 3b).
Tab. 3: Dissolved inorganic nitrogen (DIN), ammonium (NH4
+) and phosphate (PO43-)
concentrations of wastewater channels draining the city of Pekanbaru.
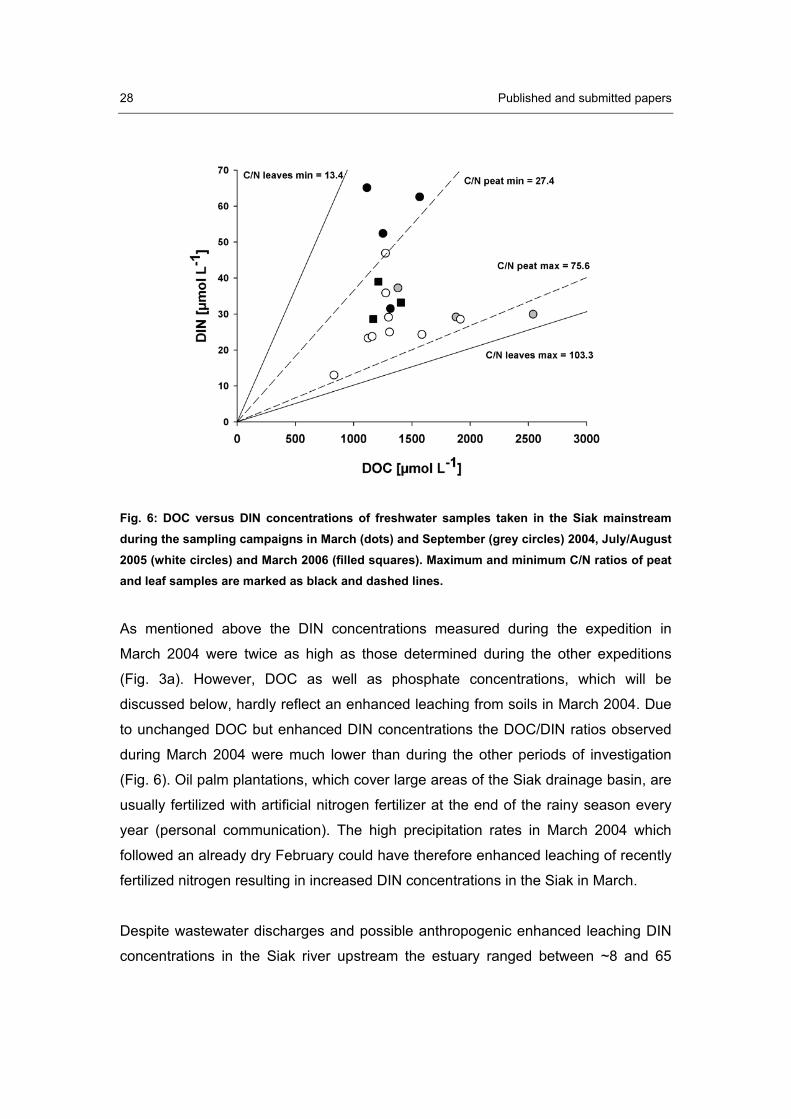
In addition to wastewater discharges leaching from soils is generally considered to be
a main DIN source in rivers which in former studies also was identified to be the
major source of DOC in the Siak (Baum et al., 2007). DOC/DIN ratios determined in
freshwater samples of the Siak mainstream vary between 17 and 85 and fall in the
range of C/N ratios measured in peat and leaf samples collected along the river
banks indicating that leaf litter as well as peatsoils are also sources of DIN in the Siak
(Fig. 6). Since peatsoils in the Siak catchment are already heavily disturbed by the
conversion of peat swamp forests into oil palm plantations, leaching cannot be
considered to be a purely natural process. However, so far the anthropogenic impact
is difficult to quantify.
Wastewater channels DIN [μmol L-1] NH4+ [μmol L-1] PO4
3- [μmol L-1]
Il. Karag 1,377.0 1,242.3 106.2
S. Sail Cont. 772.6 645.8 63.7
S. Sail 633.9 499.5 58.4
Il. Riau 1,481.8 1,292.3 86.8
Il. Riau 2 1,482.6 1,235.8 77.7
S. Hitam 564.4 347.9 51.6
Il. Juanda 1,877.1 1,510.5 99.9
Riau 373.5 263.3 192.1
Karag 722.4 664.3 179.4
28 Published and submitted papers
Fig. 6: DOC versus DIN concentrations of freshwater samples taken in the Siak mainstream during the sampling campaigns in March (dots) and September (grey circles) 2004, July/August 2005 (white circles) and March 2006 (filled squares). Maximum and minimum C/N ratios of peat and leaf samples are marked as black and dashed lines.
As mentioned above the DIN concentrations measured during the expedition in
March 2004 were twice as high as those determined during the other expeditions
(Fig. 3a). However, DOC as well as phosphate concentrations, which will be
discussed below, hardly reflect an enhanced leaching from soils in March 2004. Due
to unchanged DOC but enhanced DIN concentrations the DOC/DIN ratios observed
during March 2004 were much lower than during the other periods of investigation
(Fig. 6). Oil palm plantations, which cover large areas of the Siak drainage basin, are
usually fertilized with artificial nitrogen fertilizer at the end of the rainy season every
year (personal communication). The high precipitation rates in March 2004 which
followed an already dry February could have therefore enhanced leaching of recently
fertilized nitrogen resulting in increased DIN concentrations in the Siak in March.
Despite wastewater discharges and possible anthropogenic enhanced leaching DIN
concentrations in the Siak river upstream the estuary ranged between ~8 and 65
Published and submitted papers 29
μmol L-1 (Tab. 1, Fig. 3a) which is much lower than the concentrations measured in
non-blackwater rivers in Indonesia (>100 μmol L-1) (Jennerjahn et al., 2004). DIN
concentrations measured in the peat-draining South Sumatran river Musi in 1973/74
prior to the main deforestation were reported to range between 0.7 and 14.3 μmol L-1
(Kobayashi et al., 1979) which indicates that changes in land-use and wastewater
discharges could have led to a substantial rise in DIN levels in the Siak.
Phosphate (PO43-)
Overall phosphate (PO43-) concentrations ranged between 0.2 and 17.7 μmol L-1 and
exhibited a similar distribution pattern as DIN concentrations during all campaigns
(Tab. 1, Fig. 3c) with enhanced concentrations between Pekanbaru and Perawang
(river km ~180-230). Since the Pekanbaru wastewater channels reveal a mean PO43-
concentration of 102 μmol L-1 (Tab. 3) it could also be assumed that wastewater
discharges increased the PO43- concentrations in this area. Even higher PO4
3-
concentrations of up to 197 μmol L-1 were measured near industrial sites located
upstream Pekanbaru (Fig. 3c). Since these locally restricted PO43- peaks were hardly
reflected in the DIN concentrations they were probably caused by industrial rather
than by urban wastewater discharges. Probably this industrial sewage contains lower
amounts of DIN than urban wastewaters. PO43- peaks were most pronounced in
September 2004 and may be attributed to reduced dilution of wastewater in the rivers
probably due to low river discharges and precipitation rates (Baum et al., 2007)(Fig.
2).
Conclusions As expected for a classical blackwater river, nutrient concentrations are much lower
in the Siak than in non-blackwater rivers in Indonesia and world-wide. Although
nutrient uptake by water hyacinths might act locally as a nutrient sink, nutrient uptake
by freshwater plankton seems to play only a minor role in the Siak. Industrial and
urban wastewater discharges as well as anthropogenic affected soil leaching and
washout of nitrogen fertilizer are the main nutrient sources in the Siak. Despite
nutrient concentrations that are low compared to non-blackwater rivers, human
impact could have doubled the DIN concentration in the Siak as indicated by
comparison of the Siak data with those measured prior to the main deforestation in
the South Sumatran peat-draining Musi River.
30 Published and submitted papers
Acknowledgements We would like to thank all students and scientists from the University of Riau
(Pekanbaru, Sumatra) for their help during our field and laboratory work. Particularly
we would thank Csilla Kovacs for her valuable support during the expeditions and in
the lab. We are also grateful to Venugopalan Ittekkot and Esther Borell for their
useful comments on the manuscript and proofreading. We also acknowledge
financial support through the Federal German Ministry for Education, Science,
Research and Technology (BMBF, Bonn) (Grant No. 03F0392C-ZMT, Grant No.
03F0392B-Terramare).
Published and submitted papers 31
2.2. The Siak, a tropical black water river in central Sumatra on the verge of
anoxia
Tim Rixena, Antje Bauma, Thomas Pohlmannb, Wolfgang Balzerc, Joko Samiajid,
Christine Josed
a Zentrum für Marine Tropenökologie, Fahrenheitstr. 6, 28359 Bremen, Germany b Zentrum für Meeres- und Klimaforschung, Institut für Meereskunde, Universität Hamburg, Bundesstr.
53, 20146 Hamburg, Germany cUniversität Bremen, FB2 Meereschemie (UBMCh), Postfach 330440, 28334 Bremen, Germany dUniversity of Riau, Jl. Simpang Panam Km 12.5, Pekanbaru, Riau, Indonesia
Biogeochemistry, submitted 10 June 2008
Abstract The Siak is a black water river in central Sumatra, Indonesia, which owes its brown
color to dissolved organic matter (DOM) leached from surrounding, heavily disturbed
peat soils. The dissolved organic carbon (DOC) concentrations measured during five
expeditions in the Siak between 2004 and 2006 are among the highest reported
world wide. The DOM decomposition appeared to be a main factor influencing the
oxygen concentration in the Siak which showed values down to 12 μmol l-1. Results
derived from a developed box-diffusion model indicated that in addition to the DOC
concentration and the associated DOM decomposition the water-depth also plays a
crucial role in regulating the oxygen levels in the river. The water-depth could affect
the oxygen input across the air-water interface and the oxygen consumption in the
total water column because of its impact on the turbulence in the aquatic boundary
layer and the volume of water in the river. Model results imply furthermore that a
reduced water-depth could counteract an increased oxygen consumption caused by
an enhanced DOM leaching during the transition from dry to wet periods. This buffer
mechanism seems to be close to its limits as indicated by sensitivity studies which
showed in line with measured data that an increase of the DOC concentrations by
~15% could already lead to anoxic conditions in the Siak. This emphasizes the
32 Published and submitted papers
sensitivity of the Siak against further peat soil degradation, which is assumed to
increase DOC concentrations in the rivers.
Keywords: anoxia, black water river, peat, Sumatra
Introduction In recent years there has been an increasing number of reports on anoxic (zero
oxygen) and hypoxic (oxygen concentration < 5 μmol l-1) events occurring in
estuaries and coastal zones (Turner and Rabalais, 1994; Rabalais, 1999; Naqvi et
al., 2000; Diaz, 2001). These events were often caused by eutrophication but there
are also natural processes such as black water events that lead to anoxic and
hypoxic conditions in rivers and estuaries (Hamilton et al., 1997; Howitt et al., 2007).
Black water events are flood events during which an enhanced leaching of DOM from
leaf litter colors the water dark brown; the subsequent decay thereof reduces the
oxygen concentration in the water. Although oxygen consumption is generally
considered to be the main cause of low oxygen levels in aquatic systems, the oxygen
concentrations in the water are the product of a complex interplay between oxygen
consumption and ventilation (Paerl, 2006). This interplay has not yet been studied in
black water rivers draining the Indonesian peat lands.
Indonesia holds approximately 56% of the tropical peat soils (~20.0 1010 m2)(Rieley
et al., 1996a) that sequestered as much organic carbon (10 – 30 Tg C yr-1) as the
global deep sea sediments in their original state (Sorensen, 1993; Jahnke, 1996).
Today approximately 45% of the former Indonesian peat swamp forest has been lost
and large parts of the peat lands have been converted into rubber estates and
particularly oil palm estates (Angelsen, 1995; Harrison et al., 2005). Due to aerobic
peat decomposition and fires kindled by common agricultural slash-and-burn
practices, disturbed peat lands turned into CO2 sources. Current estimates on CO2
emissions from drained Indonesian peat lands are at >485 Tg C yr-1 and thus even >
4 times higher than the Indonesian CO2 emissions caused by burning fossil fuel,
cement production and gas flaring (103 Tg C yr-1 in 2004)(Marland et al., 2007). The
dramatic destabilization of Indonesian peat lands and the resulting mobilization of
carbon emphasize the need to assess the vulnerability of tropical peat-draining rivers
Published and submitted papers 33
such as the Siak in central Sumatra against associated environmental changes (Fig.
1). Therefore five expeditions to the Siak were carried out between 2004 and 2006
during which DOC, oxygen, salinity and temperature were measured along the river.
Furthermore, DOM decomposition experiments were conducted and a box-diffusion
developed in order to study the oxygen dynamic in the river.
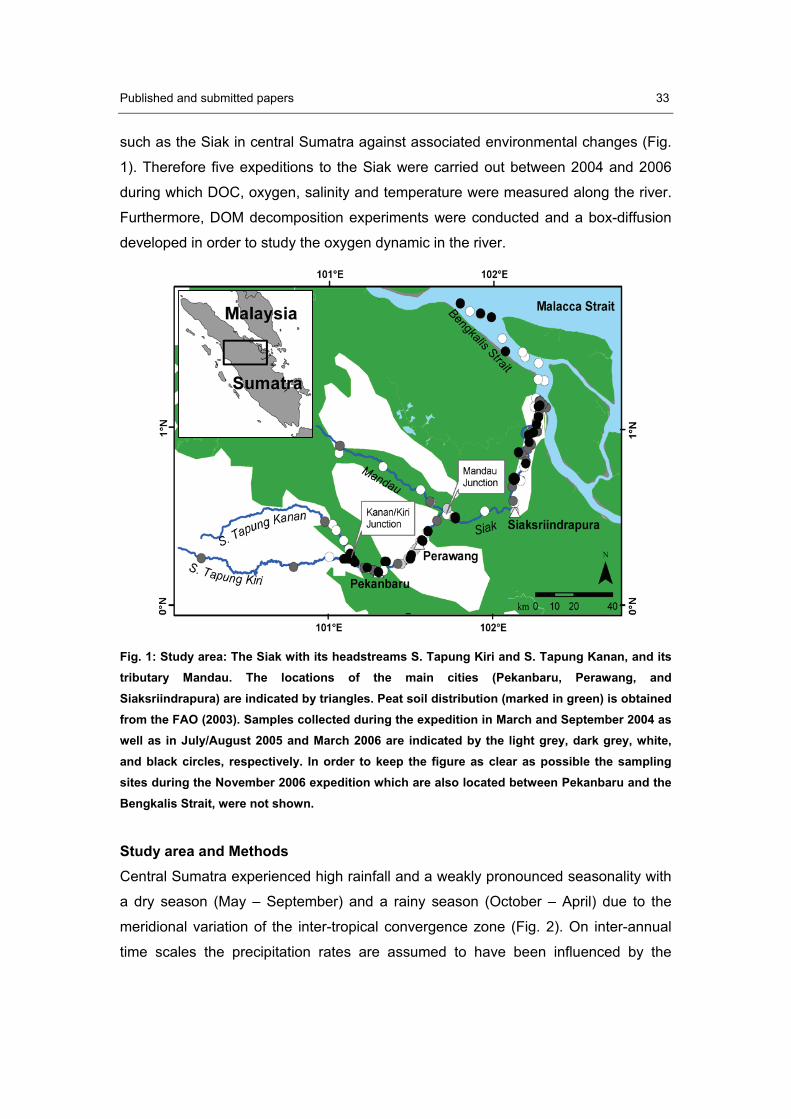
Fig. 1: Study area: The Siak with its headstreams S. Tapung Kiri and S. Tapung Kanan, and its tributary Mandau. The locations of the main cities (Pekanbaru, Perawang, and Siaksriindrapura) are indicated by triangles. Peat soil distribution (marked in green) is obtained from the FAO (2003). Samples collected during the expedition in March and September 2004 as well as in July/August 2005 and March 2006 are indicated by the light grey, dark grey, white, and black circles, respectively. In order to keep the figure as clear as possible the sampling sites during the November 2006 expedition which are also located between Pekanbaru and the Bengkalis Strait, were not shown.
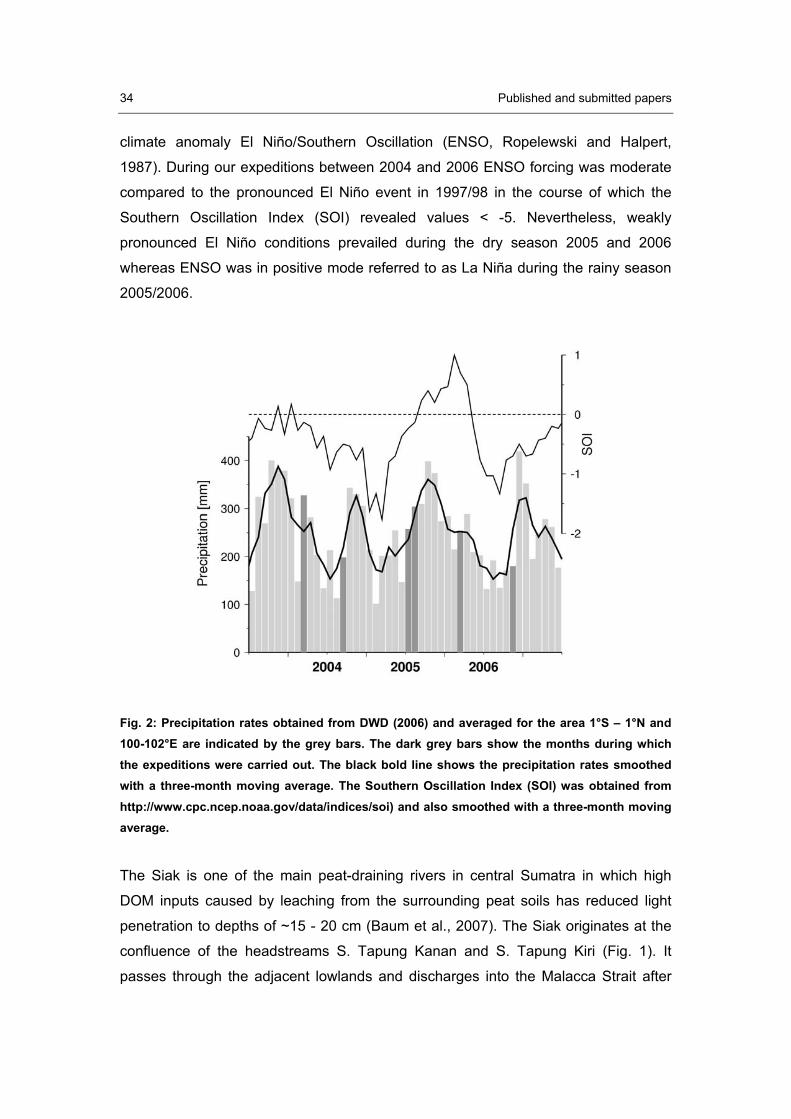
Study area and Methods Central Sumatra experienced high rainfall and a weakly pronounced seasonality with
a dry season (May – September) and a rainy season (October – April) due to the
meridional variation of the inter-tropical convergence zone (Fig. 2). On inter-annual
time scales the precipitation rates are assumed to have been influenced by the
34 Published and submitted papers
climate anomaly El Niño/Southern Oscillation (ENSO, Ropelewski and Halpert,
1987). During our expeditions between 2004 and 2006 ENSO forcing was moderate
compared to the pronounced El Niño event in 1997/98 in the course of which the
Southern Oscillation Index (SOI) revealed values < -5. Nevertheless, weakly
pronounced El Niño conditions prevailed during the dry season 2005 and 2006
whereas ENSO was in positive mode referred to as La Niña during the rainy season
2005/2006.
Fig. 2: Precipitation rates obtained from DWD (2006) and averaged for the area 1°S – 1°N and 100-102°E are indicated by the grey bars. The dark grey bars show the months during which the expeditions were carried out. The black bold line shows the precipitation rates smoothed with a three-month moving average. The Southern Oscillation Index (SOI) was obtained from http://www.cpc.ncep.noaa.gov/data/indices/soi) and also smoothed with a three-month moving average.
The Siak is one of the main peat-draining rivers in central Sumatra in which high
DOM inputs caused by leaching from the surrounding peat soils has reduced light
penetration to depths of ~15 - 20 cm (Baum et al., 2007). The Siak originates at the
confluence of the headstreams S. Tapung Kanan and S. Tapung Kiri (Fig. 1). It
passes through the adjacent lowlands and discharges into the Malacca Strait after

Published and submitted papers 35
370 km. The S. Tapung Kanan and the Mandau, the main tributaries of the Siak,
originate in the peat swamps and join the Siak at river km 155 and 245, respectively.
The Siak catchment (11.500 km2) consists to approximately 45% of peat lands which
have largely been converted into palm oil and rubber estates as well as shrub lands
(Laumonier, 1997).
Tab.1: Sampling period, mean water temperatures, precipitation rates obtained from (DWD, 2006, see Fig. 2), water discharges as derived from the precipitation rates (see Baum et al. (2007), for more detailed information), DOC riverine end-member concentrations as indicated by the regression equations shown in Fig. 4a.
Sampling period Temp. Precipit. Discharge DOC
Month Year [°C] [mm] [m³s-1] [μmol l-1]
March 2004 29.4 327 645 1866*
September 2004 30.1 199 391/99** 2195
July/August 2005 29.5 304 599 2247
March 2006 30.5 254 500 1613
November 2006 29.7 180 355 1793
mean 29.8 253 498/440 1942
* This riverine DOC end-member concentration was estimated based on DOC concentrations measured in the Siak upstream the estuary as no samples were taken in the estuary during the expedition in March 2004 (see Baum et al., 2007). ** The measured water discharge was 99 m3 s-1 (see Baum et al. 2007).
During the five expeditions to the Siak between 2004 and 2006 (Tab. 1) water
samples for determining DOC, dissolved oxygen and salinity were taken using a
Niskin bottle at a water-depth of one meter along the river (Fig. 1, 3). All samples
were taken during day time. The DOC samples were filtered through 0.45 μm filters
into pre-combusted 20 ml FIOLAX ampoules. The samples were subsequently
acidified (20% phosphoric acid) to a pH value of ~2, sealed, and stored at ~4°C in
darkness until they were analyzed after the expeditions. DOC was analyzed using a
high temperature catalytic oxidation method (Dohrman DC-190 analyzer). Oxygen
concentrations were determined using Winkler titration and salinity was measured by
a WTW Tetra Con 325_3. A more detailed description of the methods applied is
given by Baum et al. (2007). During the third expedition, oxygen, salinity and
temperature profiles were also obtained using a Sea-Bird SBE19plus. Due to
36 Published and submitted papers
logistical constraints the sampling campaign was restricted to the upper course of the
Siak in March 2004 and oxygen concentrations could not be measured during the
last expedition in November 2006.
In March 2006, a DOM microbial and photochemical degradation experiment was
initiated for which water was collected a few km downstream the Mandau junction
(Fig. 1). The water collected was immediately filled into eight ~ 20 ml FIOLAX
ampoules. The half-filled ampoules were sealed and exposed to sunlight until they
were opened and preserved as the other DOC samples. The DOC concentrations
measured in each of the incubated ampoules were plotted against the time at which
the ampoules were opened (Fig 4). Since we left the study site after 336 hrs (14
days), the remaining incubated sample was exposed to artificial sunlight (Ocean light
150 HQ I) until it was analyzed after 3148 hrs (131 days). The UV-transmittance of
the FIOLAX glass ampoules was determined using a spectrophotometer (Libra S12)
with sensors for UV-A (315 to 400 nm) and UV-B (280 to 315 nm). The results
showed that ~5% of the UV-A and ~38% of the UV-B irradiance were absorbed by
the glass ampoules. Since the UV absorption and the artificial sunlight could have
reduced the photochemical degradation, the DOM decay determined in the
experiment must be considered to be an underestimate rather than an overestimate.
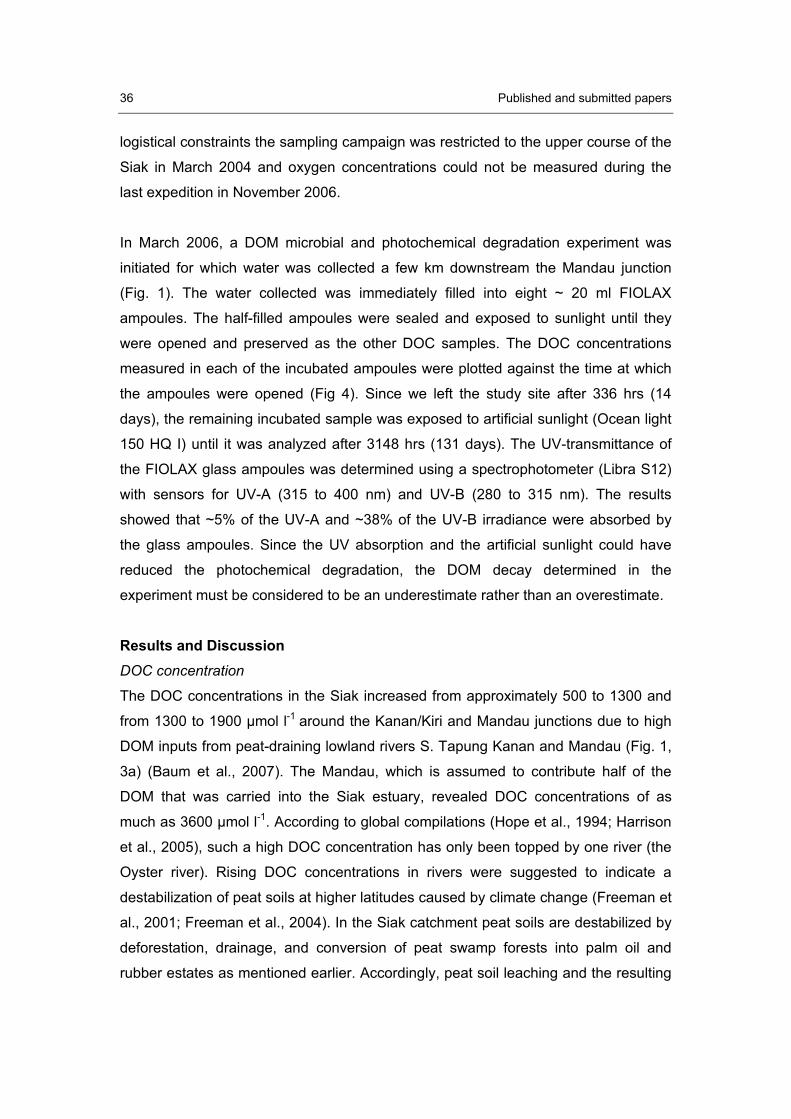
Results and Discussion DOC concentration
The DOC concentrations in the Siak increased from approximately 500 to 1300 and
from 1300 to 1900 μmol l-1 around the Kanan/Kiri and Mandau junctions due to high
DOM inputs from peat-draining lowland rivers S. Tapung Kanan and Mandau (Fig. 1,
3a) (Baum et al., 2007). The Mandau, which is assumed to contribute half of the
DOM that was carried into the Siak estuary, revealed DOC concentrations of as
much as 3600 μmol l-1. According to global compilations (Hope et al., 1994; Harrison
et al., 2005), such a high DOC concentration has only been topped by one river (the
Oyster river). Rising DOC concentrations in rivers were suggested to indicate a
destabilization of peat soils at higher latitudes caused by climate change (Freeman et
al., 2001; Freeman et al., 2004). In the Siak catchment peat soils are destabilized by
deforestation, drainage, and conversion of peat swamp forests into palm oil and
rubber estates as mentioned earlier. Accordingly, peat soil leaching and the resulting
Published and submitted papers 37
high DOC concentrations in the Siak and its tributaries can not be considered natural.
On the other hand an anthropogenic enhanced leaching as seen in other studies
(Holden et al., 2004; Holden, 2005) is very difficult to quantify as there is no data
available on the Siak prior to the main deforestations.
Fig. 3: DOC (a) and oxygen concentrations (b) measured at a water-depth of 1 m versus river-km. The river-km zero represents the origin of the S. Tapung Kiri in the highlands. At river-km 320 increasing salinity indicates the beginning of the estuary (salinity data are not shown) and at river-km 370 the Siak discharges into the Malacca Strait. The Kanan/Kiri and the Mandau junctions are at river-km 155 and 245. The mean oxygen and DOC concentrations in the Mandau and S. Tapung Kanan are shown by the large black squares. Data measured during the first, second, third, fourth and fifth expeditions are indicated by stars, diamonds, squares, circles and open circles. The averaged DOC and oxygen concentrations are shown by the grey lines and the broken line in ‘b’ indicates the mean oxygen saturation concentrations calculated after Benson and Krause Jr. (1984).
38 Published and submitted papers
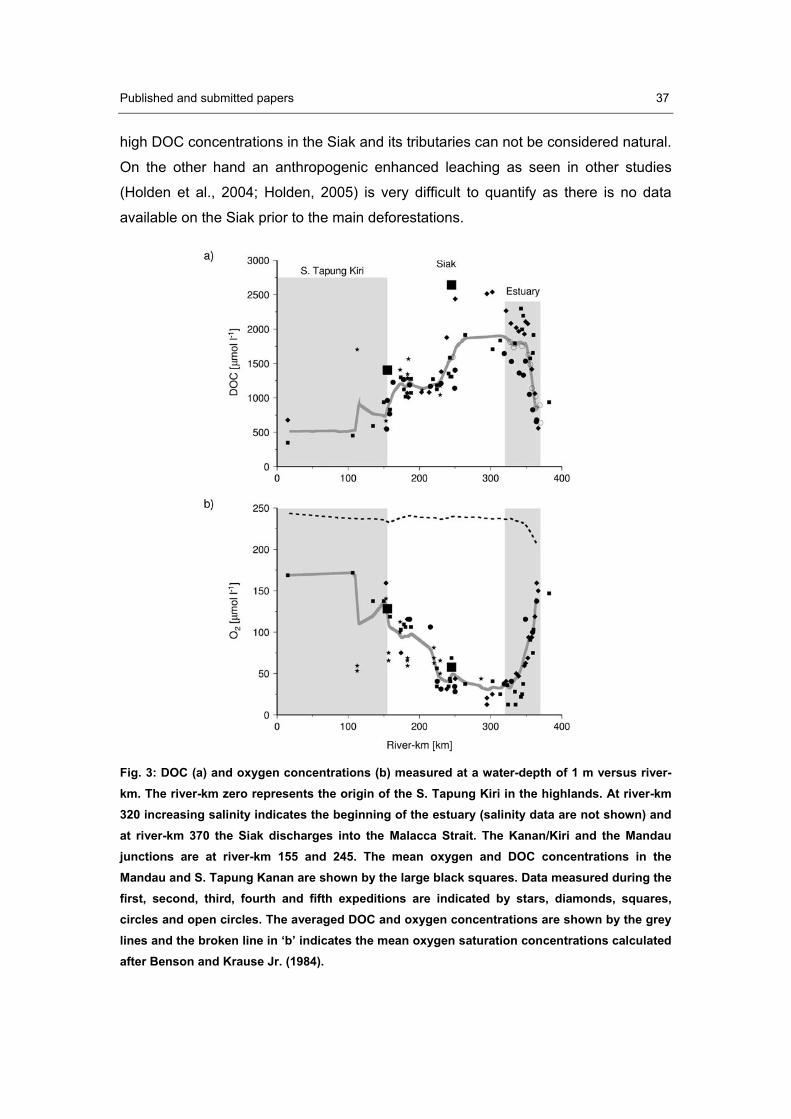
In the estuary, decreasing DOC concentrations correlating to increasing salinity
suggested that dilution of the DOM-rich Siak water by DOM-poor ocean water was an
important factor controlling the DOC concentration in the estuary (Fig. 5).
Fig. 5: DOC concentrations (circles – Sep. 2004, July/August 2005; squares - March 2006, triangles – November 2006) versus salinity. DOC concentrations at the zero intercept of the y-axis are considered as the riverine DOC end-member concentrations (see Tab. 1).
The zero intercept of the y-axis as shown by the regression equation is often
considered as riverine DOC end-member concentration (e.g., Mantoura and
Woodward, 1983; Alvarez-Salgado and Miller, 1998; Miller, 1999). Since no data was
available on the estuary in March 2004, the riverine DOC end-member
concentrations were estimated to be 1866 μmol l-1 based on the DOC concentrations
measured close to the Mandau junction (Baum et al., 2007). However, the DOC end-
member concentrations determined during the expeditions varied between 1613 and
2247 μmol l-1 whereas reduced DOC end-member concentrations were obtained at
the end of the rainy season in March 2004 and 2006 and during the dry season 2006
(Fig. 2, Tab.1). Enhanced DOC end-member concentrations were measured at the
Published and submitted papers 39
end of the dry season in September 2004 and in July/August 2005 suggesting, as
also observed in other studies (Hamilton et al., 1997), that increasing precipitation
rates enhance DOM leaching from soils, especially after dry periods. During the
expedition in September 2004, a low ground water level still attested to the preceding
dry period and the water discharge measured was significantly lower than the one
derived from the precipitation rates (see Tab. 1). It was therefore assumed that the
increasing precipitation rates were still filling up the ground water reservoir (Baum et
al., 2007).
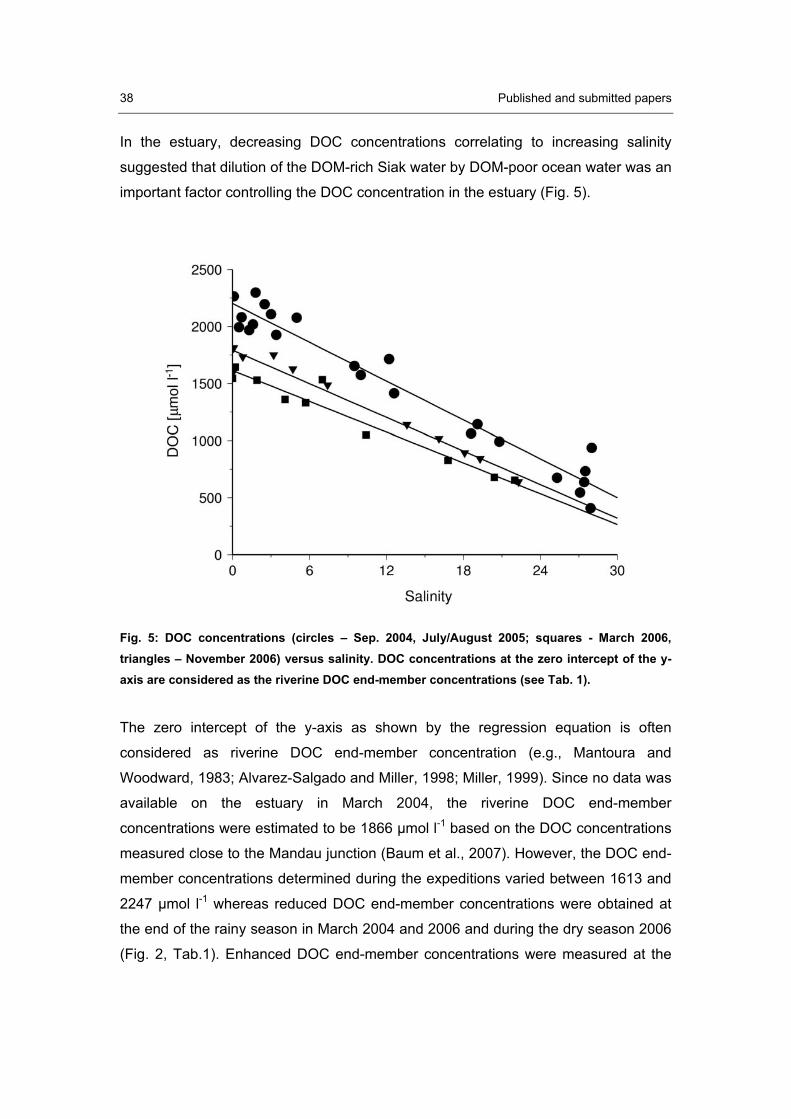
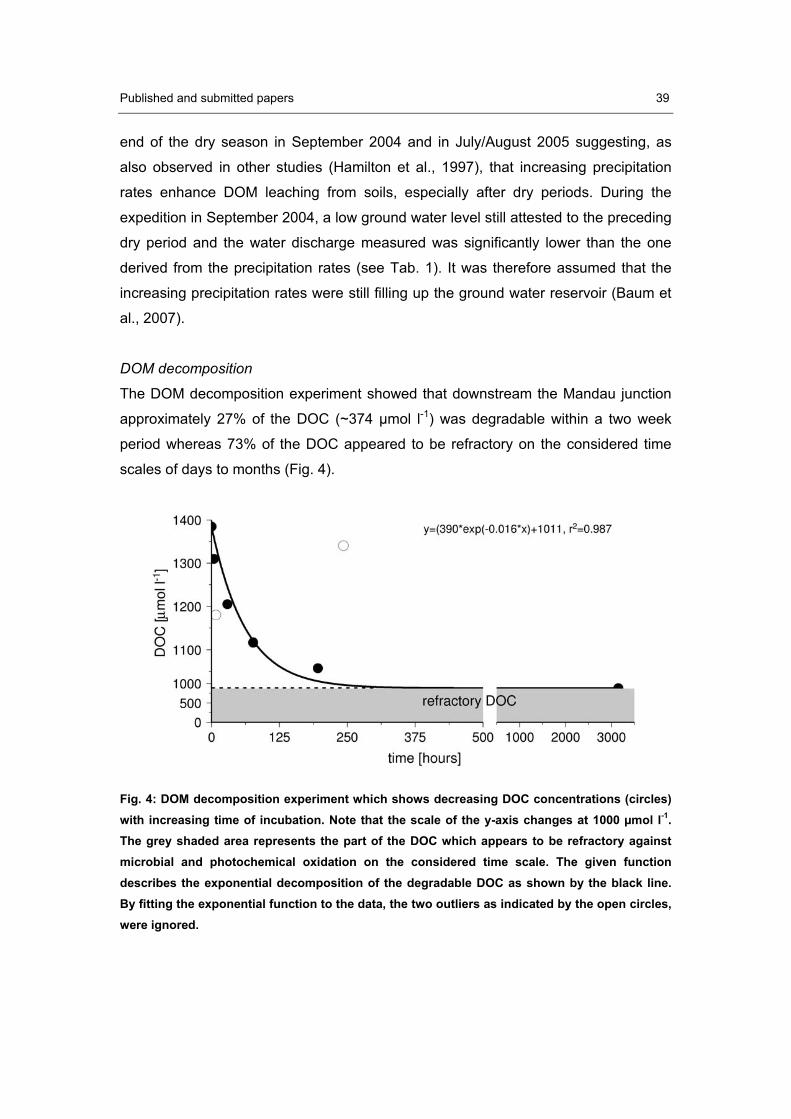
DOM decomposition
The DOM decomposition experiment showed that downstream the Mandau junction
approximately 27% of the DOC (~374 μmol l-1) was degradable within a two week
period whereas 73% of the DOC appeared to be refractory on the considered time
scales of days to months (Fig. 4).
Fig. 4: DOM decomposition experiment which shows decreasing DOC concentrations (circles) with increasing time of incubation. Note that the scale of the y-axis changes at 1000 μmol l-1. The grey shaded area represents the part of the DOC which appears to be refractory against microbial and photochemical oxidation on the considered time scale. The given function describes the exponential decomposition of the degradable DOC as shown by the black line. By fitting the exponential function to the data, the two outliers as indicated by the open circles, were ignored.
40 Published and submitted papers
Since peat reveals a ratio between organic carbon and oxygen (C/O ratio) of ~2.7
(Cameron et al., 1989), it was assumed that only 0.8 mol of dissolved oxygen was
consumed during oxidation of one mol of peat-derived DOM (DOM + 0.8 O2 -> CO2).
Consequently the DOM decomposition rate (eq. 2) can be converted into the oxygen
consumption rate (COxygen) by multiplying it by 0.8:
ttDOCCOxygen �
��
)(*8.0 (3)
According to eq. 1 – 3, a mean DOC concentration of ~ 1500 μmol l-1 (DOCt0) as
derived from the data measured in the Siak upstream the estuary (Fig. 3 a),
suggests, for example, a mean oxygen consumption rate of ~ 5.1 μmol l-1 hr-1. Such
an oxygen consumption rate is ~3 times higher than those determined in the Amazon
river (1.7 μmol l-1 hr-1 (Devol et al., 1987) and must even be considered as an
underestimate as indicated above. However, such a high DOC decomposition rate
implies that the DOC concentrations should have decreased with the water travel
time in the Siak river. Instead, the DOC concentrations increased from headwater to
estuary, suggesting that DOC inputs exceeded the DOC decay; this imbalance was
most pronounced at the Kanan/Kiri and the Mandau junctions mentioned above (Fig.
3a).
Oxygen concentrations
Oxygen concentrations decreased from ~170 μmol l-1 in the S. Tapung Kiri to 12
μmol l-1 at the beginning of the Siak estuary (Fig. 3b) and revealed hardly any vertical
gradients as seen in the oxygen profiles obtained by the Sea-Bird19plus CTD during
the expedition in July/August 2005 (Fig. 6).
Published and submitted papers 41
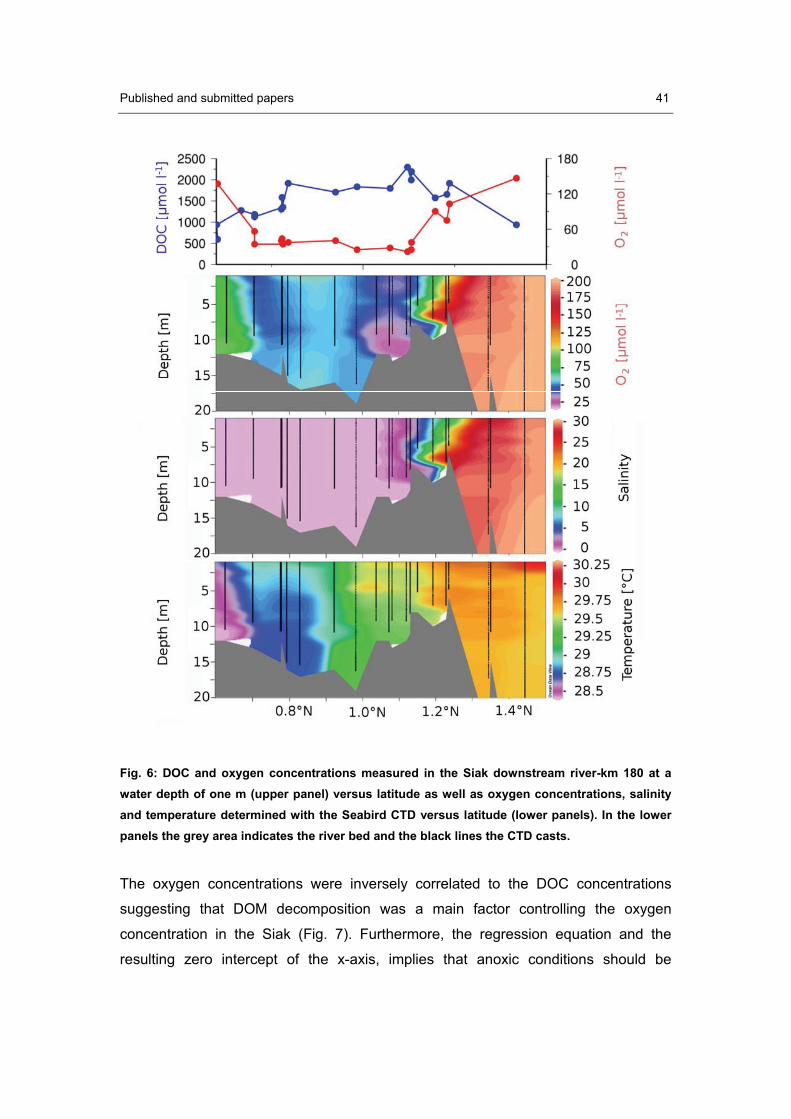
Fig. 6: DOC and oxygen concentrations measured in the Siak downstream river-km 180 at a water depth of one m (upper panel) versus latitude as well as oxygen concentrations, salinity and temperature determined with the Seabird CTD versus latitude (lower panels). In the lower panels the grey area indicates the river bed and the black lines the CTD casts.
The oxygen concentrations were inversely correlated to the DOC concentrations
suggesting that DOM decomposition was a main factor controlling the oxygen
concentration in the Siak (Fig. 7). Furthermore, the regression equation and the
resulting zero intercept of the x-axis, implies that anoxic conditions should be
42 Published and submitted papers
established in the Siak when the DOC reaches concentrations of ~2852 μmol l-1.
(=145.48/0.051; see equation given in figure 7). In the Paraguay river, for example,
an enhanced DOM leaching after a dry period and the resulting increase of the DOC
concentrations from ~ 700 to 925 μmol l-1 was already sufficient to produce an anoxic
event and an associated fish kill (Hamilton et al., 1997). There are also reports of
mass fish mortalities in the Siak but so far we were not able to observe such an
event.
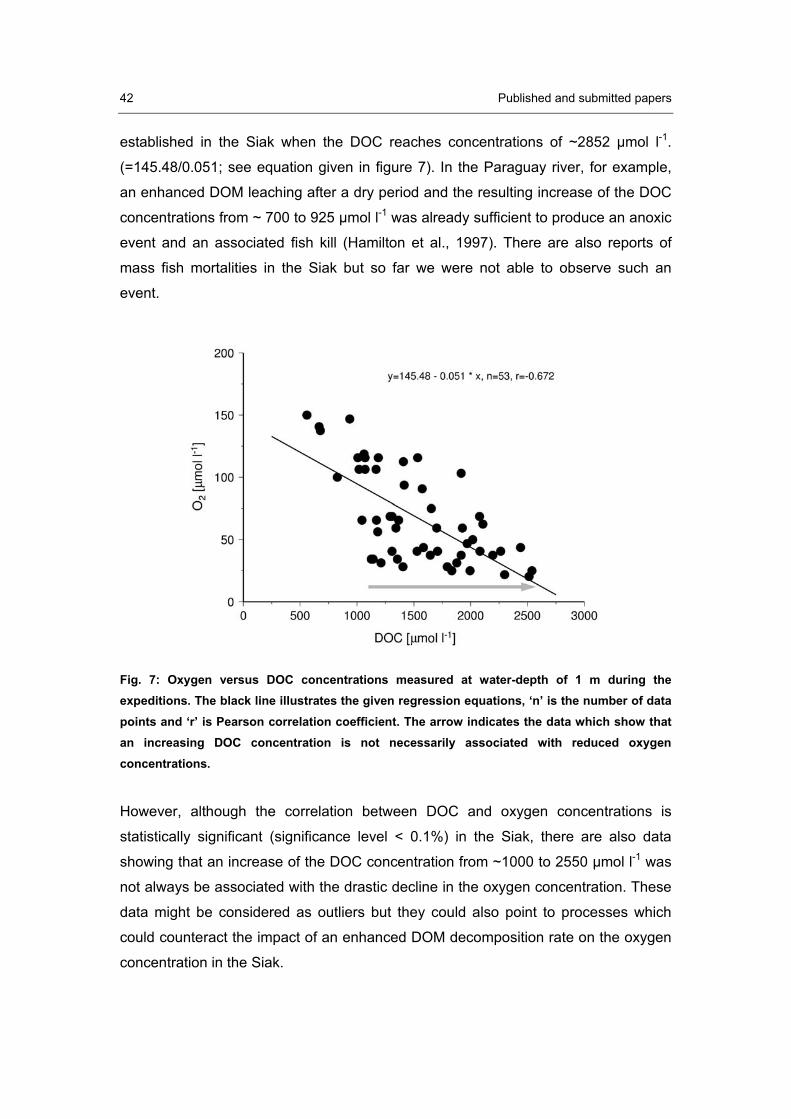
Fig. 7: Oxygen versus DOC concentrations measured at water-depth of 1 m during the expeditions. The black line illustrates the given regression equations, ‘n’ is the number of data points and ‘r’ is Pearson correlation coefficient. The arrow indicates the data which show that an increasing DOC concentration is not necessarily associated with reduced oxygen concentrations.
However, although the correlation between DOC and oxygen concentrations is
statistically significant (significance level < 0.1%) in the Siak, there are also data
showing that an increase of the DOC concentration from ~1000 to 2550 μmol l-1 was
not always be associated with the drastic decline in the oxygen concentration. These
data might be considered as outliers but they could also point to processes which
could counteract the impact of an enhanced DOM decomposition rate on the oxygen
concentration in the Siak.
Published and submitted papers 43
Oxygen inputs
Oxygen production during the photosynthesis of organic matter could in principle be
an oxygen source which might have enhanced the oxygen concentrations in the Siak
during the daytime. Since the lack of light caused by the brown water color strongly
reduces photosynthesis, it is assumed that oxygen inputs across the air-water
interface are the main source of oxygen in the Siak. This oxygen flux (FOxygen) is
driven by the oxygen partial pressure (pO2) difference between the river and the
atmosphere and can be calculated according to Fick’s law:
FOxygen=k * � (pO2-Atmospere – pO2-River) (4)
‘�’ is the temperature and salinity dependent solubility coefficient of oxygen (�=[O2]/
pO2) which was calculated according to Benson & Krause Jr. (1984). ‘k’ is the piston
velocity, which is mainly controlled by the turbulence in the aquatic boundary layer.
The turbulence in the aquatic boundary layer strongly depends on the bottom friction
and can be increased by wind speeds and precipitation rates (e.g., Raymond and
Cole, 2001; Kremer et al., 2003; Borges et al., 2004; Guerin et al., 2007). The bottom
friction, in turn, generally increase with decreasing water-depth and increasing
current velocity (Raymond and Cole, 2001). However, results derived from the
Amazon, by determining 222Rn accumulation in free-floating chambers and carrying
out oxygen mass balances, indicate mean piston velocities of up to 7 and 25 cm hr-1,
respectively (Devol et al., 1987).
Oxygen dynamic
In order to examine the interplay between oxygen consumption and oxygen input, we
developed a small box-diffusion model (eq. 5) within which the water column of the
river was divided into 100 cm thick layers (�z) and a time step of 13.5 s was
considered.
CS+zOA
ztO
OxygenOxygenV ����
�
��
��
��� 22
(5)
SOxygen is the oxygen source term in the surface layer. If in a discrete model the
surface layer has a thickness �z, the oxygen source term in this layer can be derived
44 Published and submitted papers
from the oxygen flux through the sea surface (F Oxygen, see eq. 4) by means of: S
Oxygen = F Oxygen / �z. COxygen (see eq. 3) is the oxygen consumption rate in the water
column and ‘AV’ is the diffusion coefficient for which a value of 370 cm2 s-1 was
selected. Determination of the diffusion velocity udiff by means of tAu Vdiff /2 �� ,
leads to the conclusion that due to the mean water depth of < 20 m (see Fig. 6)
diffusion affects the entire water column after approximately ~1.5 hrs. Accordingly it
is inferred that a variation of the chosen AV in a realistic range would also result in a
rapid mixing which agrees with the well-mixed water body seen in the salinity and
temperature profiles (Fig. 6). Eq. 5 is formulated forward in time and as central
differences in space. An explicit scheme was employed to solve this equation, which
made it necessary to use the above-mentioned small time step of 13.5 s. A test of
this scheme prior to our simulation proved that it fulfils all mass conservation
requirements.
Water-depth and piston velocity
In order to check the applicability of the model for the Siak, we firstly averaged the
DOC and oxygen concentrations measured upstream the estuary. The resulting
mean DOC concentration of 1500 μmol l-1 was used to calculate the oxygen
consumption (eq. 3) and after reaching the steady state, the simulated oxygen
concentration was compared to the mean measured oxygen concentrations of 59
μmol l-1. The modelled oxygen concentrations varied depending on the selected
piston velocity and the water-depth. As discussed previously the piston velocity
strongly influences the oxygen input across the air-water interface and the water-
depth affects the total oxygen consumption in the water column. The total oxygen
consumption within a given time is the product of the oxygen consumption rate (see
eq. 3) and the considered water volume. Since the time step of 13.5 s and the
considered surface area are constant in the model, the total oxygen consumption
increases with an increasing water-depth. One therefore has to increase the piston
velocities if one enhances the water-depth in order to produce an oxygen
concentration of 59 μmol l-1 in the modeled water column (Fig. 8). A piston velocity of
22.9 cm hr-1 would, for example, call for a water-depth of 8 m, in order to simulate a
mean oxygen concentration of 59 μmol l-1 (Fig. 9, see also Tab. 2 – experiment 1).
Published and submitted papers 45
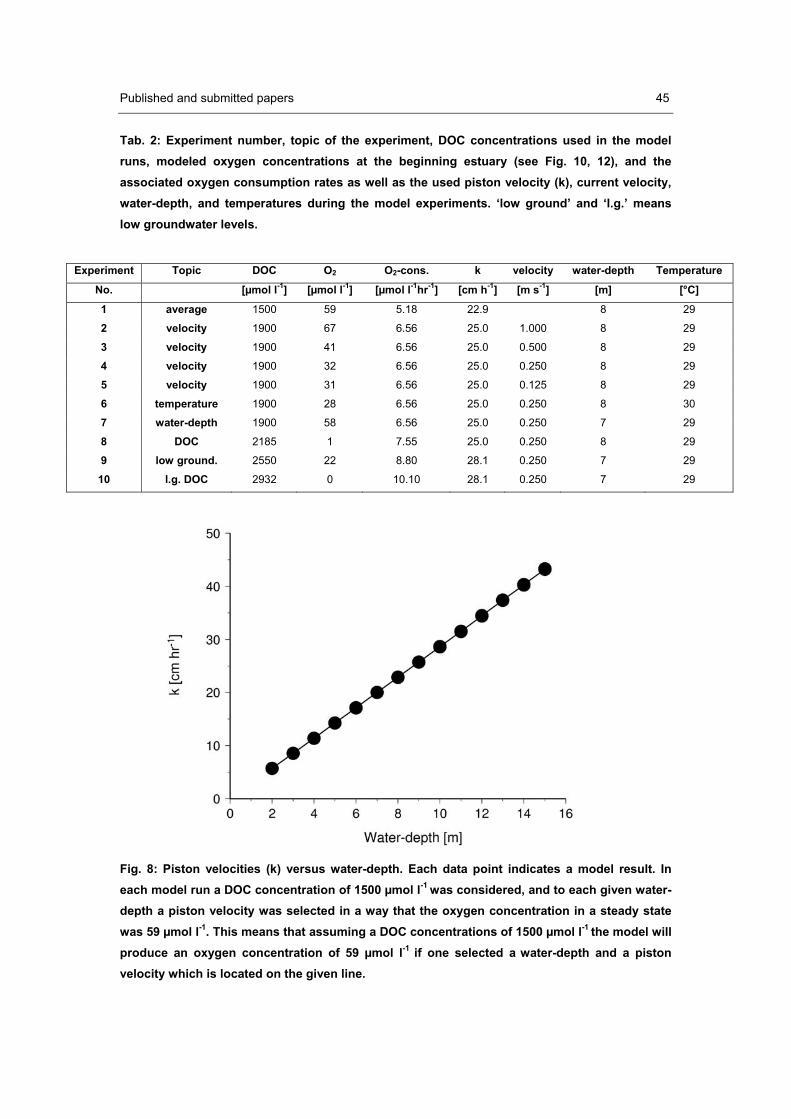
Tab. 2: Experiment number, topic of the experiment, DOC concentrations used in the model runs, modeled oxygen concentrations at the beginning estuary (see Fig. 10, 12), and the associated oxygen consumption rates as well as the used piston velocity (k), current velocity, water-depth, and temperatures during the model experiments. ‘low ground’ and ‘l.g.’ means low groundwater levels.
Experiment Topic DOC O2 O2-cons. k velocity water-depth Temperature
No. [μmol l-1] [μmol l-1] [μmol l-1hr-1] [cm h-1] [m s-1] [m] [°C]
1 average 1500 59 5.18 22.9 8 29
2 velocity 1900 67 6.56 25.0 1.000 8 29
3 velocity 1900 41 6.56 25.0 0.500 8 29
4 velocity 1900 32 6.56 25.0 0.250 8 29
5 velocity 1900 31 6.56 25.0 0.125 8 29
6 temperature 1900 28 6.56 25.0 0.250 8 30
7 water-depth 1900 58 6.56 25.0 0.250 7 29
8 DOC 2185 1 7.55 25.0 0.250 8 29
9 low ground. 2550 22 8.80 28.1 0.250 7 29
10 l.g. DOC 2932 0 10.10 28.1 0.250 7 29
Fig. 8: Piston velocities (k) versus water-depth. Each data point indicates a model result. In each model run a DOC concentration of 1500 μmol l-1 was considered, and to each given water-depth a piston velocity was selected in a way that the oxygen concentration in a steady state was 59 μmol l-1. This means that assuming a DOC concentrations of 1500 μmol l-1 the model will produce an oxygen concentration of 59 μmol l-1 if one selected a water-depth and a piston velocity which is located on the given line.
46 Published and submitted papers
Such a mean water-depth appears to be representative for the Siak considering that
the water-depth at our sampling sites ranged between ~ 8 and 20 m (see Fig. 6) and
the sites were located near the centre and not close to the river banks. Since a piston
velocity of 22.9 cm hr-1 is also close to the one derived from the oxygen mass
balance calculation in the Amazon (Devol et al., 1987), it can be concluded that the
our model is suitable to study the oxygen dynamics in the Siak river.
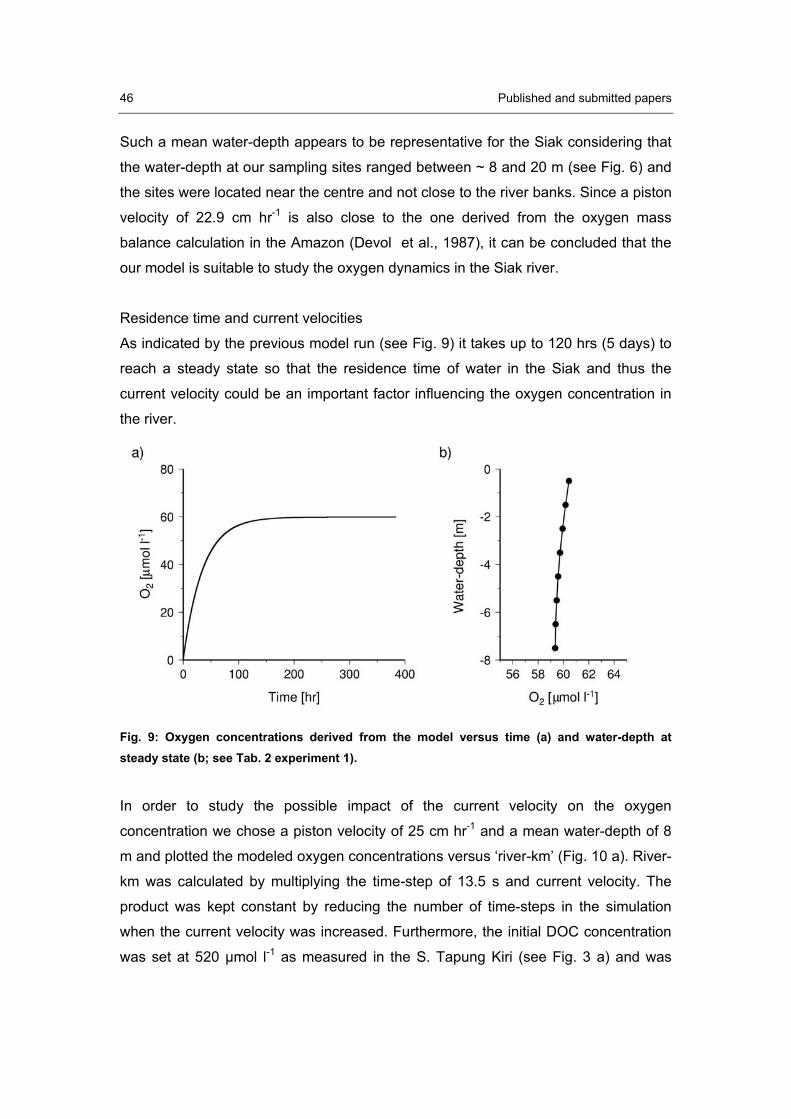
Residence time and current velocities
As indicated by the previous model run (see Fig. 9) it takes up to 120 hrs (5 days) to
reach a steady state so that the residence time of water in the Siak and thus the
current velocity could be an important factor influencing the oxygen concentration in
the river.
Fig. 9: Oxygen concentrations derived from the model versus time (a) and water-depth at steady state (b; see Tab. 2 experiment 1).
In order to study the possible impact of the current velocity on the oxygen
concentration we chose a piston velocity of 25 cm hr-1 and a mean water-depth of 8
m and plotted the modeled oxygen concentrations versus ‘river-km’ (Fig. 10 a). River-
km was calculated by multiplying the time-step of 13.5 s and current velocity. The
product was kept constant by reducing the number of time-steps in the simulation
when the current velocity was increased. Furthermore, the initial DOC concentration
was set at 520 μmol l-1 as measured in the S. Tapung Kiri (see Fig. 3 a) and was
Published and submitted papers 47
subsequently increased on a step by step basis at river-km 105 and 215 to 1300 and
1900 μmol l-1 in order to simulate DOM inputs from the S. Tapung Kanan and
Mandau. The selected river-km’s are actually ~30 – 50 km prior to real Kanan/Kiri
and Mandau junction at river km 155 and 245. The shift reflects the tidal influence at
the Mandau junction and DOM inputs of smaller peat draining creeks into to the S.
Tapung Kiri already prior to the Kanan/Kiri junctions. However, a selected mean
current velocity of 1 m s-1 results in oxygen concentrations which are higher than
those measured because of the short residence time (~2.4 days) and a resulting
lower DOM consumption in the river (Fig. 10 a, Tab. 2 – experiment 2). If one selects
mean current velocities (residence times) of 0.25 m s-1 (~9.8 days) and 0.125 m s-1
(~18 days), the resulting oxygen concentrations correspond reasonably well with the
measured oxygen concentrations in the Siak (Fig. 10 a, Tab. 2 - experiments 4 and
5). Direct determination of mean current velocities in tidal-influenced rivers is very
problematic but can be deduced from the mean water discharge and the mean river
cross section. A mean water discharge of 440 m3 s-1 (Tab. 1), a mean water-depth of
8 m as indicated by the model results and a river-width of 220 m would, for example,
suggest a mean current velocity of ~0.25 m s-1. Since the Siak already reveals a
width of 80 m at the Kanan/Kiri junction which increases to 250 m at the Mandau
junction and to > 350 m at the beginning of the estuary, a mean river-width of > 220
m and therefore also a mean current velocity of < 0.25 m s-1 would appear to be
acceptable.
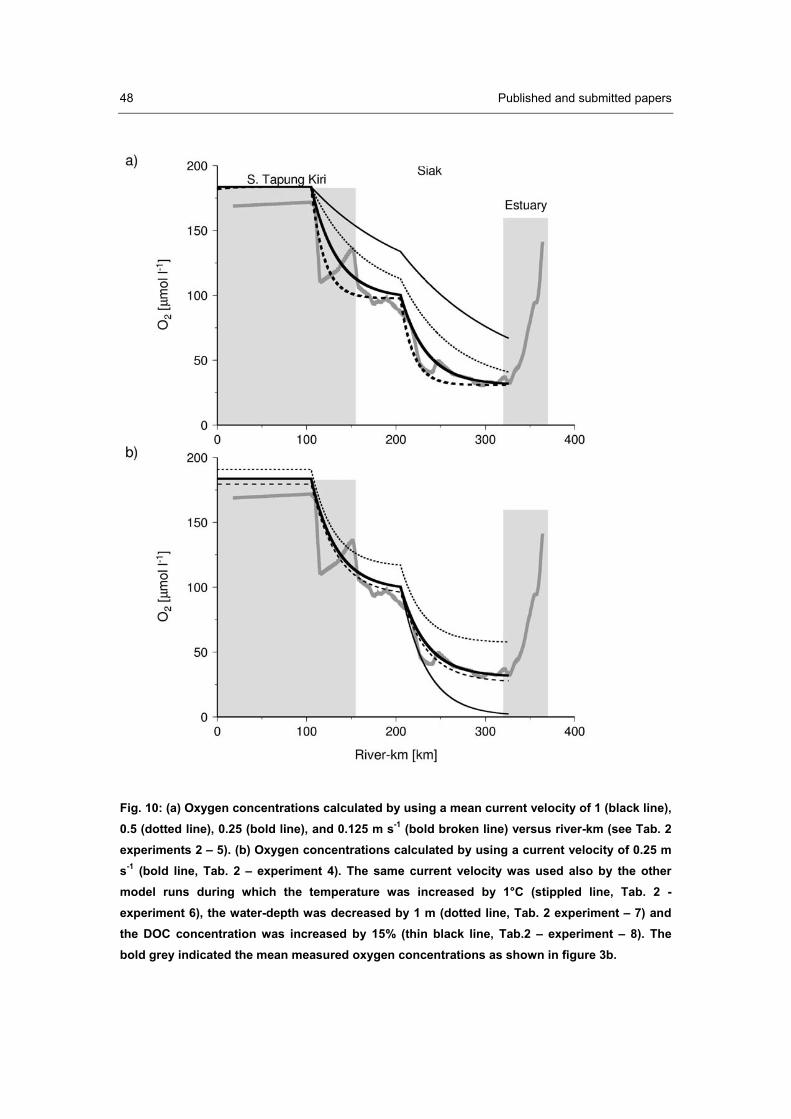
48 Published and submitted papers
Fig. 10: (a) Oxygen concentrations calculated by using a mean current velocity of 1 (black line), 0.5 (dotted line), 0.25 (bold line), and 0.125 m s-1 (bold broken line) versus river-km (see Tab. 2 experiments 2 – 5). (b) Oxygen concentrations calculated by using a current velocity of 0.25 m s-1 (bold line, Tab. 2 – experiment 4). The same current velocity was used also by the other model runs during which the temperature was increased by 1°C (stippled line, Tab. 2 - experiment 6), the water-depth was decreased by 1 m (dotted line, Tab. 2 experiment – 7) and the DOC concentration was increased by 15% (thin black line, Tab.2 – experiment – 8). The bold grey indicated the mean measured oxygen concentrations as shown in figure 3b.
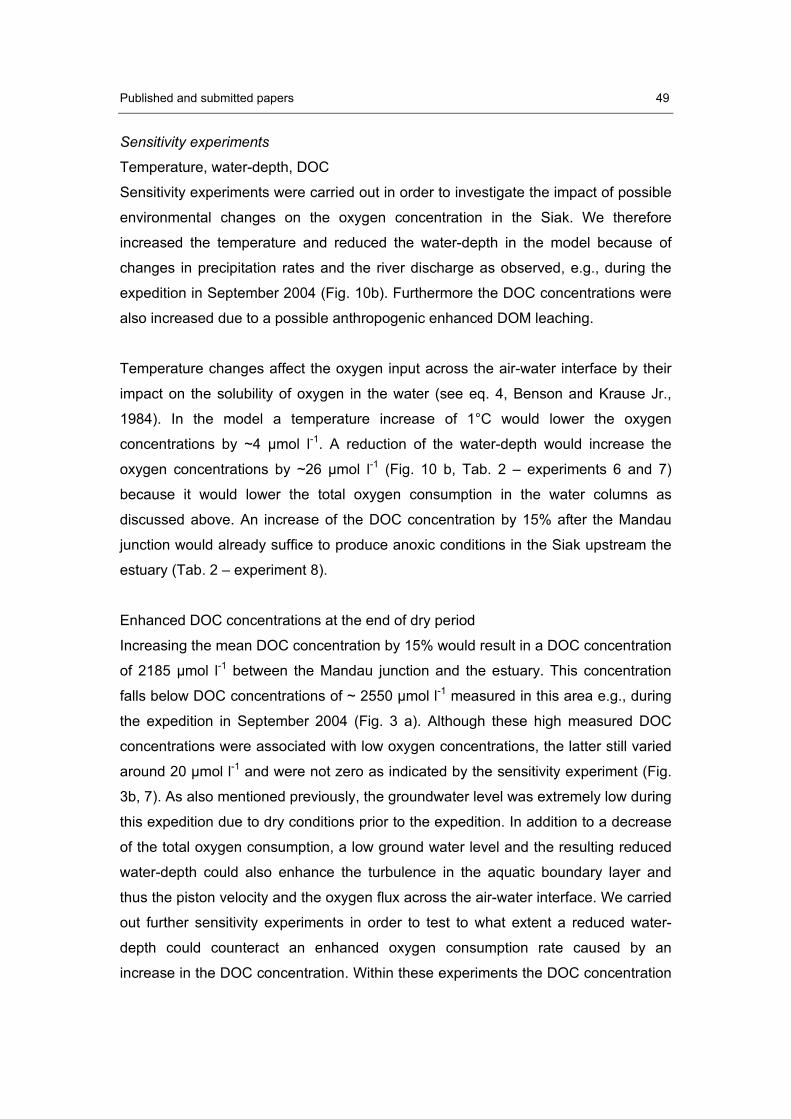
Published and submitted papers 49
Sensitivity experiments
Temperature, water-depth, DOC
Sensitivity experiments were carried out in order to investigate the impact of possible
environmental changes on the oxygen concentration in the Siak. We therefore
increased the temperature and reduced the water-depth in the model because of
changes in precipitation rates and the river discharge as observed, e.g., during the
expedition in September 2004 (Fig. 10b). Furthermore the DOC concentrations were
also increased due to a possible anthropogenic enhanced DOM leaching.
Temperature changes affect the oxygen input across the air-water interface by their
impact on the solubility of oxygen in the water (see eq. 4, Benson and Krause Jr.,
1984). In the model a temperature increase of 1°C would lower the oxygen
concentrations by ~4 μmol l-1. A reduction of the water-depth would increase the
oxygen concentrations by ~26 μmol l-1 (Fig. 10 b, Tab. 2 – experiments 6 and 7)
because it would lower the total oxygen consumption in the water columns as
discussed above. An increase of the DOC concentration by 15% after the Mandau
junction would already suffice to produce anoxic conditions in the Siak upstream the
estuary (Tab. 2 – experiment 8).
Enhanced DOC concentrations at the end of dry period
Increasing the mean DOC concentration by 15% would result in a DOC concentration
of 2185 μmol l-1 between the Mandau junction and the estuary. This concentration
falls below DOC concentrations of ~ 2550 μmol l-1 measured in this area e.g., during
the expedition in September 2004 (Fig. 3 a). Although these high measured DOC
concentrations were associated with low oxygen concentrations, the latter still varied
around 20 μmol l-1 and were not zero as indicated by the sensitivity experiment (Fig.
3b, 7). As also mentioned previously, the groundwater level was extremely low during
this expedition due to dry conditions prior to the expedition. In addition to a decrease
of the total oxygen consumption, a low ground water level and the resulting reduced
water-depth could also enhance the turbulence in the aquatic boundary layer and
thus the piston velocity and the oxygen flux across the air-water interface. We carried
out further sensitivity experiments in order to test to what extent a reduced water-
depth could counteract an enhanced oxygen consumption rate caused by an
increase in the DOC concentration. Within these experiments the DOC concentration
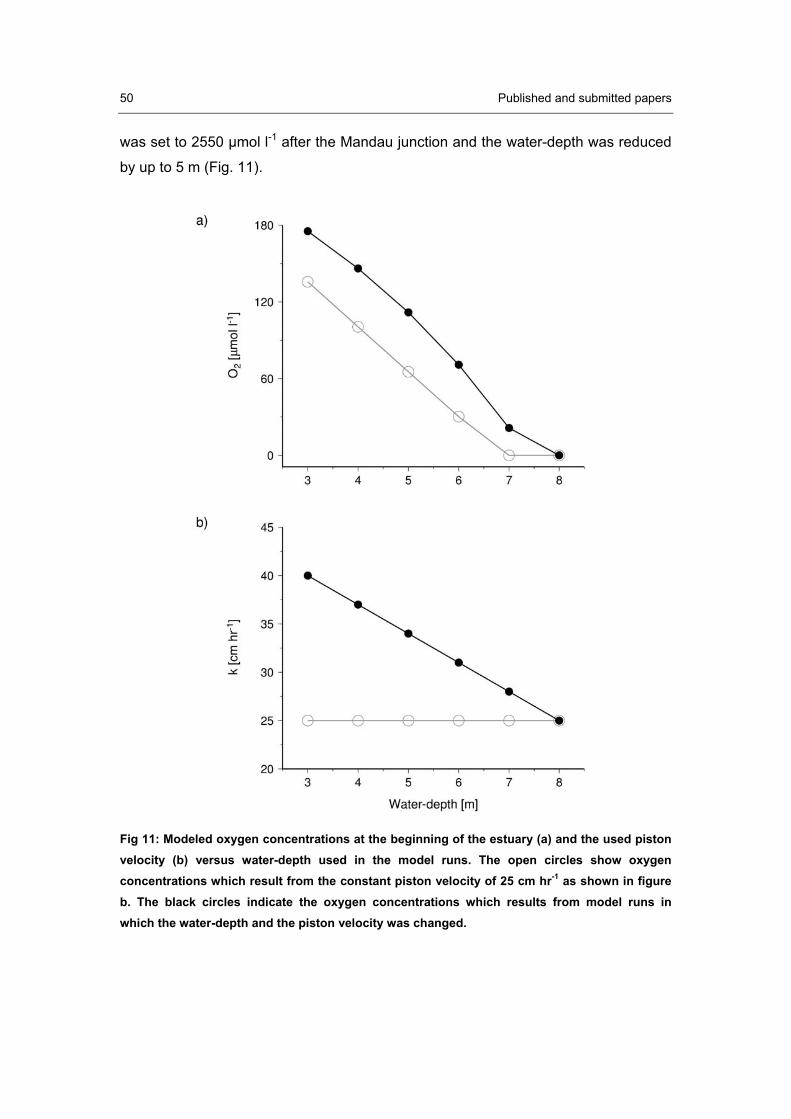
50 Published and submitted papers
was set to 2550 μmol l-1 after the Mandau junction and the water-depth was reduced
by up to 5 m (Fig. 11).
Fig 11: Modeled oxygen concentrations at the beginning of the estuary (a) and the used piston velocity (b) versus water-depth used in the model runs. The open circles show oxygen concentrations which result from the constant piston velocity of 25 cm hr-1 as shown in figure b. The black circles indicate the oxygen concentrations which results from model runs in which the water-depth and the piston velocity was changed.
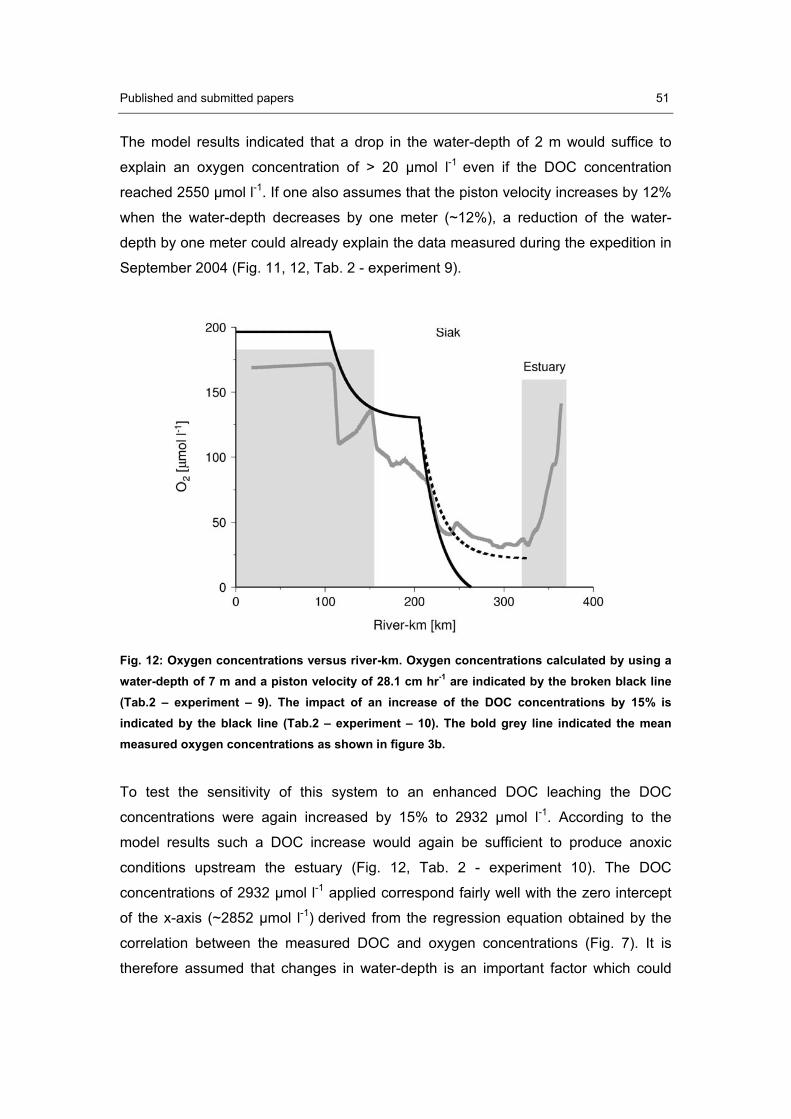
Published and submitted papers 51
The model results indicated that a drop in the water-depth of 2 m would suffice to
explain an oxygen concentration of > 20 μmol l-1 even if the DOC concentration
reached 2550 μmol l-1. If one also assumes that the piston velocity increases by 12%
when the water-depth decreases by one meter (~12%), a reduction of the water-
depth by one meter could already explain the data measured during the expedition in
September 2004 (Fig. 11, 12, Tab. 2 - experiment 9).
Fig. 12: Oxygen concentrations versus river-km. Oxygen concentrations calculated by using a water-depth of 7 m and a piston velocity of 28.1 cm hr-1 are indicated by the broken black line (Tab.2 – experiment – 9). The impact of an increase of the DOC concentrations by 15% is indicated by the black line (Tab.2 – experiment – 10). The bold grey line indicated the mean measured oxygen concentrations as shown in figure 3b.
To test the sensitivity of this system to an enhanced DOC leaching the DOC
concentrations were again increased by 15% to 2932 μmol l-1. According to the
model results such a DOC increase would again be sufficient to produce anoxic
conditions upstream the estuary (Fig. 12, Tab. 2 - experiment 10). The DOC
concentrations of 2932 μmol l-1 applied correspond fairly well with the zero intercept
of the x-axis (~2852 μmol l-1) derived from the regression equation obtained by the
correlation between the measured DOC and oxygen concentrations (Fig. 7). It is
therefore assumed that changes in water-depth is an important factor which could
52 Published and submitted papers
counteracts an enhanced DOC leaching and the resulting increased oxygen
consumption rates but its buffer capacity seems to be close to its limits in the Siak.
Conclusion Our results showed that the DOC concentrations increase along the Siak river
because DOM inputs exceed DOM decay. DOM decomposition and the resulting
oxygen consumption fueled by continuous DOM inputs appeared to be a main factor
influencing the oxygen concentration in the Siak. This result could be confirmed by a
box-diffusion model which showed that in addition to the DOC concentration the
water-depth is also an important factor influencing the oxygen concentrations. The
water-depth affects the oxygen input across the air water interface and the total
oxygen consumption in the water columns due to its impact on the turbulence in the
aquatic boundary layer and the water volume in the river. A reduced water-depth
could, for example, compensate for an enhanced oxygen consumption caused by an
increased DOM leaching from soils during the transition from dry to wet periods.
Model results in line with measured data suggest that this buffer mechanism is close
to its limit which emphasizes the sensitivity of the Siak against further peat soil
degradation.
Acknowledgments We would like to thank all scientists and students from the University of Pekanbaru
who helped us during our field work, the rector of the University of Riau, the captain
of the research vessel R/V Senangin and his crew for their support. For helpful
discussion we would like to thank V. Ittekkot, P. Damm our colleagues from the ZMT
and Rena Kerr. We are also grateful to the Federal German Ministry for Education,
Science, Research and Technology (BMBF, Bonn grant number 03F0392C - ZMT)
for financial support and to R. Schlitzer as well as to P. Wessels and W.H.F. Smith
for providing Ocean Data View (ODV) and the generic mapping tools (GMT).
Published and submitted papers 53
Abbreviations AV diffusion coefficient C carbon COxygen oxygen consumption rate C/O ratio ratio between organic carbon and oxygen cm centimeter DOC dissolved organic carbon DOM dissolved organic matter ENSO El Niño Southern Oscillation FOxygen oxygen flux rate across the air-water interface hr hour k piston velocity km2 square kilometer
l liter
m2 square meter O2 oxygen concentration O2sat oxygen saturation concentration [O2]River oxygen concentration in the river water pO2 oxygen partial pressure pO2-Atmospere partial pressure of oxygen in the atmosphere pO2-River partial pressure of oxygen in the river water t time Tg terra gram S Oxygen oxygen flux through the sea surface into the surface layer SOI Southern Oscillation Index S. Sungai (river) s second udiff diffusion velocity UV ultra violet yr year � solubility coefficient of oxygen �z thickness of the layers in the model μmol micro mol % percent °C degree Celsius

54 Published and submitted papers
Published and submitted papers 55
2.3. Relevance of peat draining rivers in central Sumatra for riverine input of
dissolved organic carbon into the ocean
Antje Bauma, Tim Rixena and Joko Samiajib
aCenter for Tropical Marine Ecology, Fahrenheitstr. 6, 28359 Bremen, Germany bUniversity of Riau, Jl. Simpang Panam Km 12.5, Pekanbaru, Riau, Indonesia
Estuarine, Coastal and Shelf Science 73 (2007) 563 – 570; Received 8 August 2006;
accepted 21 February 2007; Available online 16 April 2007
Abstract Sources and discharges of dissolved organic carbon (DOC) from the central
Sumatran river Siak were studied. DOC concentrations in the Siak ranged between
560 and 2,594 μmol l-1 and peak out after its confluence with the river Mandau. The
Mandau drains part of the central Sumatra peatlands and can be characterized as a
typical blackwater river due to its high DOC concentration, its dark brown-coloured,
acidic water (pH 4.4-4.7) and its low concentration of total suspended matter (12-41
mg l-1). The Mandau supplies about half of the DOC that enters the Siak estuary
where it mixes conservatively with ocean water. The DOC input from the Siak into the
ocean was estimated to be ~0.3 Tg C yr-1. Extrapolated to entire Indonesia the data
suggest a total Indonesian DOC export of ~21 Tg yr-1 representing ~10% of the
global riverine DOC input into the ocean.
Keywords: dissolved organic carbon (DOC); peat; Indonesia; Sumatra
Introduction The riverine transport of DOC plays an important role in the carbon cycle as it links
the terrestrial and the marine carbon cycles (Degens et al., 1991; Meybeck, 1993).
Decomposition experiments and studies in polar regions suggest that the majority of
the riverine DOC (63-73%) is decomposed in the ocean within years to decades,
explaining the relatively low contribution (~10%) of terrestrial dissolved organic
matter (DOM) to the marine DOM pool (Meyers-Schulte and Hedges, 1986; Hedges
56 Published and submitted papers
et al., 1997; Hansell et al., 2004). Such an efficient decomposition implies that
riverine DOC exports act as a source of CO2 to the atmosphere, because
remineralisation of riverine DOC would increase CO2 concentrations and hence the
air-sea gas exchange. Improved understanding and quantification of processes
controlling carbon losses from the terrestrial biosphere are of particular importance
as terrestrial biosphere-soil systems presently act as a sink of anthropogenic CO2
(Keeling et al., 1996).
Present estimates suggest a riverine DOC discharge into the ocean of 170-250 Tg C
yr-1 based on model calculations as well as inventory and extrapolation of data from
selected large global rivers (Ludwig et al., 1996; Hedges et al., 1997; Cauwet, 2002;
Harrison et al., 2005). According to model studies Indonesia contributes ~11% (4.26 *
1012 m3yr-1) to the global freshwater discharge into the ocean (Syvitski et al., 2005).
Despite the high freshwater discharge Indonesia has no major rivers, because it
consists mainly out of relatively small volcanic and coral islands. High precipitation
rates and large areas covered by peat soils (particularly on Sumatra and Borneo),
which are known to be an important riverine DOC source (Freeman et al., 2004),
suggest that Indonesian rivers are important with respect to their input of DOC into
the ocean. However, DOC discharges from Indonesian rivers have not been
investigated in field studies so far. Within the framework of the bilateral joint
Indonesian German project SPICE (Science for the Protection of Indonesian Coastal
Marine Ecosystems), DOC dynamics within the Siak and its tributaries in central
Sumatra were studied in order to quantify the DOC discharge into the ocean.
Study area The Siak is one of the main rivers draining the province of Riau in central Sumatra. It
originates at the confluence of the two headstreams Sungai Tapung Kanan and
Sungai Tapung Kiri, passes through adjacent lowlands and discharges after 370 km
into the Bengkalis Strait which is part of the Malacca Strait (Fig. 1a). The S. Tapung
Kiri has its source at the foot of the western Sumatra highlands whereas the S.
Tapung Kanan and the major tributary Mandau originate in the Central Sumatra
lowlands (Fig. 1a, b).
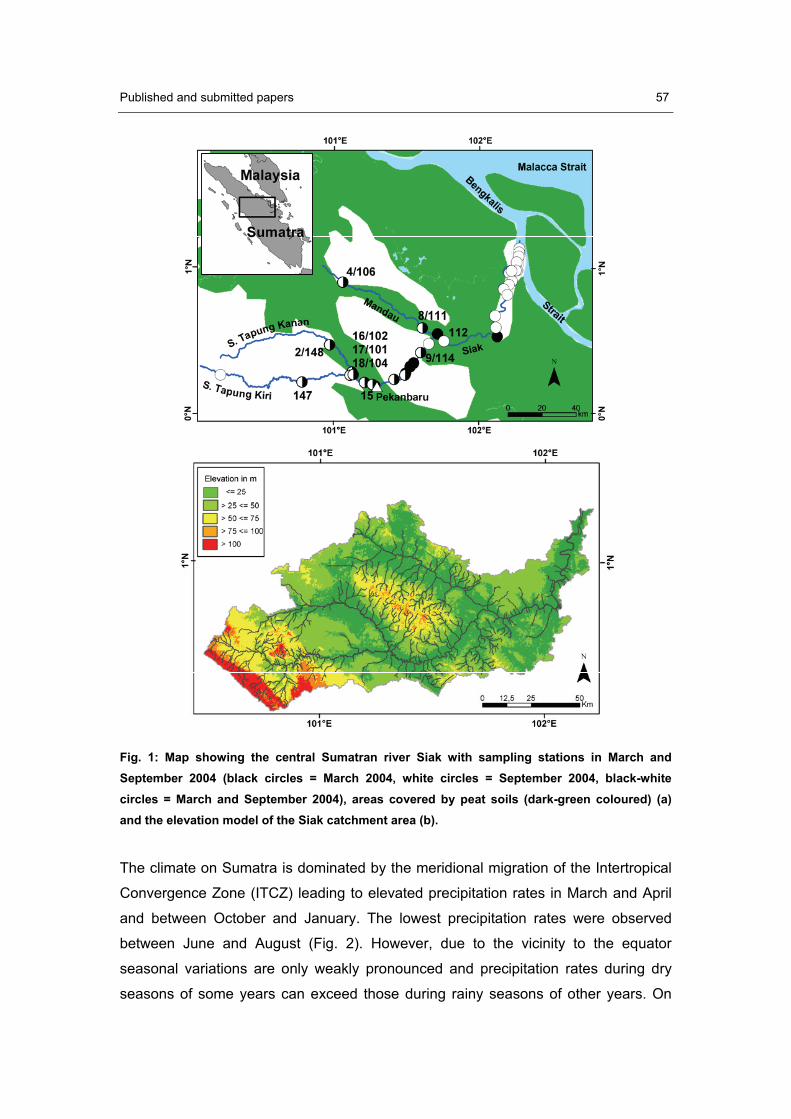
Published and submitted papers 57
Fig. 1: Map showing the central Sumatran river Siak with sampling stations in March and September 2004 (black circles = March 2004, white circles = September 2004, black-white circles = March and September 2004), areas covered by peat soils (dark-green coloured) (a) and the elevation model of the Siak catchment area (b).
The climate on Sumatra is dominated by the meridional migration of the Intertropical
Convergence Zone (ITCZ) leading to elevated precipitation rates in March and April
and between October and January. The lowest precipitation rates were observed
between June and August (Fig. 2). However, due to the vicinity to the equator
seasonal variations are only weakly pronounced and precipitation rates during dry
seasons of some years can exceed those during rainy seasons of other years. On
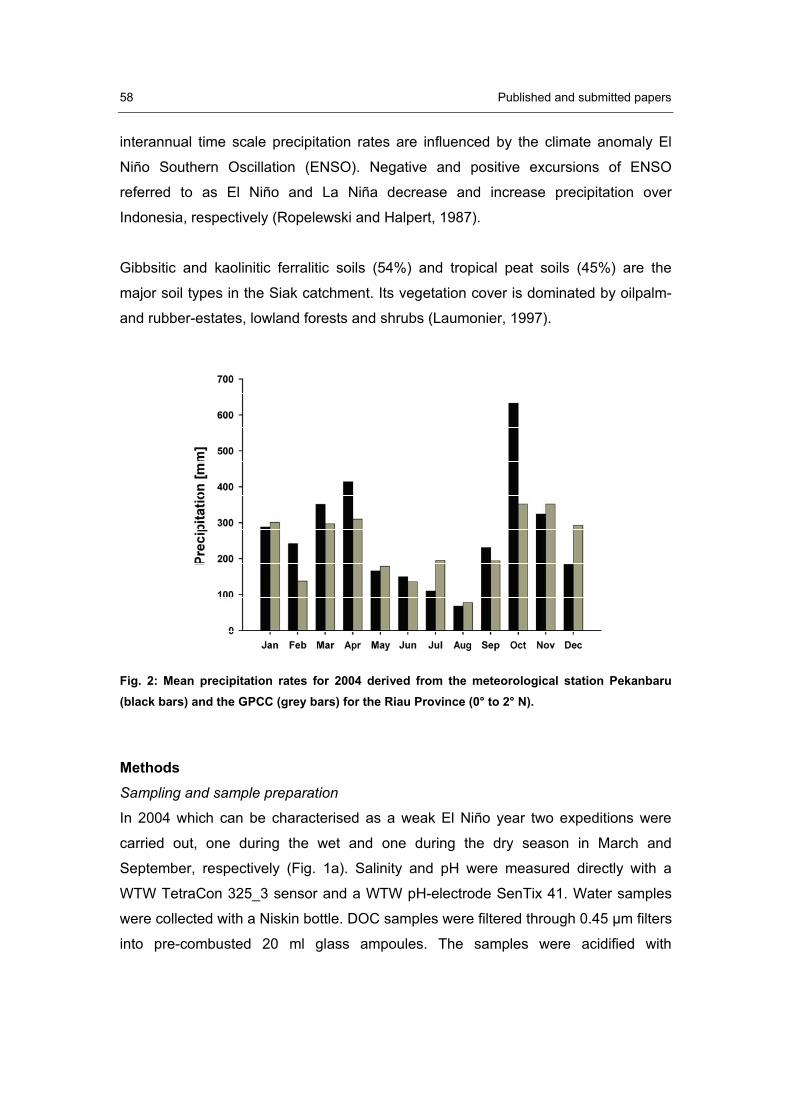
58 Published and submitted papers
interannual time scale precipitation rates are influenced by the climate anomaly El
Niño Southern Oscillation (ENSO). Negative and positive excursions of ENSO
referred to as El Niño and La Niña decrease and increase precipitation over
Indonesia, respectively (Ropelewski and Halpert, 1987).
Gibbsitic and kaolinitic ferralitic soils (54%) and tropical peat soils (45%) are the
major soil types in the Siak catchment. Its vegetation cover is dominated by oilpalm-
and rubber-estates, lowland forests and shrubs (Laumonier, 1997).
Fig. 2: Mean precipitation rates for 2004 derived from the meteorological station Pekanbaru (black bars) and the GPCC (grey bars) for the Riau Province (0° to 2° N).
Methods Sampling and sample preparation
In 2004 which can be characterised as a weak El Niño year two expeditions were
carried out, one during the wet and one during the dry season in March and
September, respectively (Fig. 1a). Salinity and pH were measured directly with a
WTW TetraCon 325_3 sensor and a WTW pH-electrode SenTix 41. Water samples
were collected with a Niskin bottle. DOC samples were filtered through 0.45 μm filters
into pre-combusted 20 ml glass ampoules. The samples were acidified with
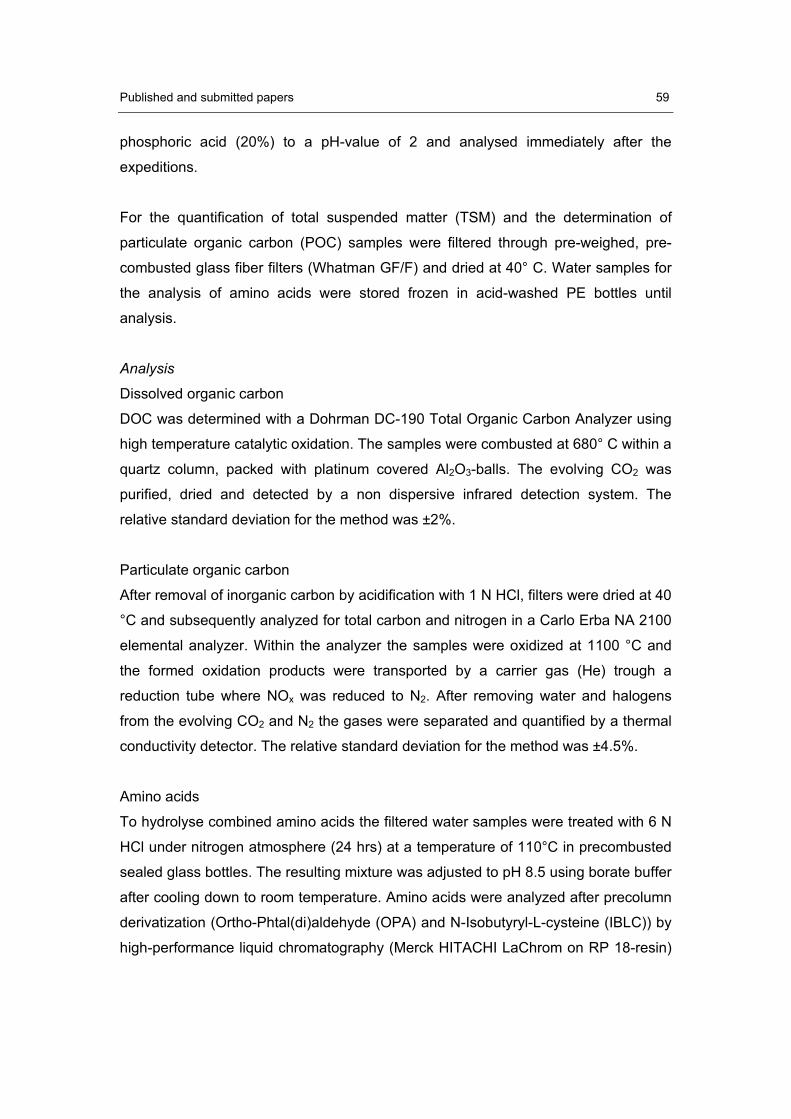
Published and submitted papers 59
phosphoric acid (20%) to a pH-value of 2 and analysed immediately after the
expeditions.
For the quantification of total suspended matter (TSM) and the determination of
particulate organic carbon (POC) samples were filtered through pre-weighed, pre-
combusted glass fiber filters (Whatman GF/F) and dried at 40° C. Water samples for
the analysis of amino acids were stored frozen in acid-washed PE bottles until
analysis.
Analysis
Dissolved organic carbon
DOC was determined with a Dohrman DC-190 Total Organic Carbon Analyzer using
high temperature catalytic oxidation. The samples were combusted at 680° C within a
quartz column, packed with platinum covered Al2O3-balls. The evolving CO2 was
purified, dried and detected by a non dispersive infrared detection system. The
relative standard deviation for the method was ±2%.
Particulate organic carbon
After removal of inorganic carbon by acidification with 1 N HCl, filters were dried at 40
°C and subsequently analyzed for total carbon and nitrogen in a Carlo Erba NA 2100
elemental analyzer. Within the analyzer the samples were oxidized at 1100 °C and
the formed oxidation products were transported by a carrier gas (He) trough a
reduction tube where NOx was reduced to N2. After removing water and halogens
from the evolving CO2 and N2 the gases were separated and quantified by a thermal
conductivity detector. The relative standard deviation for the method was ±4.5%.
Amino acids
To hydrolyse combined amino acids the filtered water samples were treated with 6 N
HCl under nitrogen atmosphere (24 hrs) at a temperature of 110°C in precombusted
sealed glass bottles. The resulting mixture was adjusted to pH 8.5 using borate buffer
after cooling down to room temperature. Amino acids were analyzed after precolumn
derivatization (Ortho-Phtal(di)aldehyde (OPA) and N-Isobutyryl-L-cysteine (IBLC)) by
high-performance liquid chromatography (Merck HITACHI LaChrom on RP 18-resin)
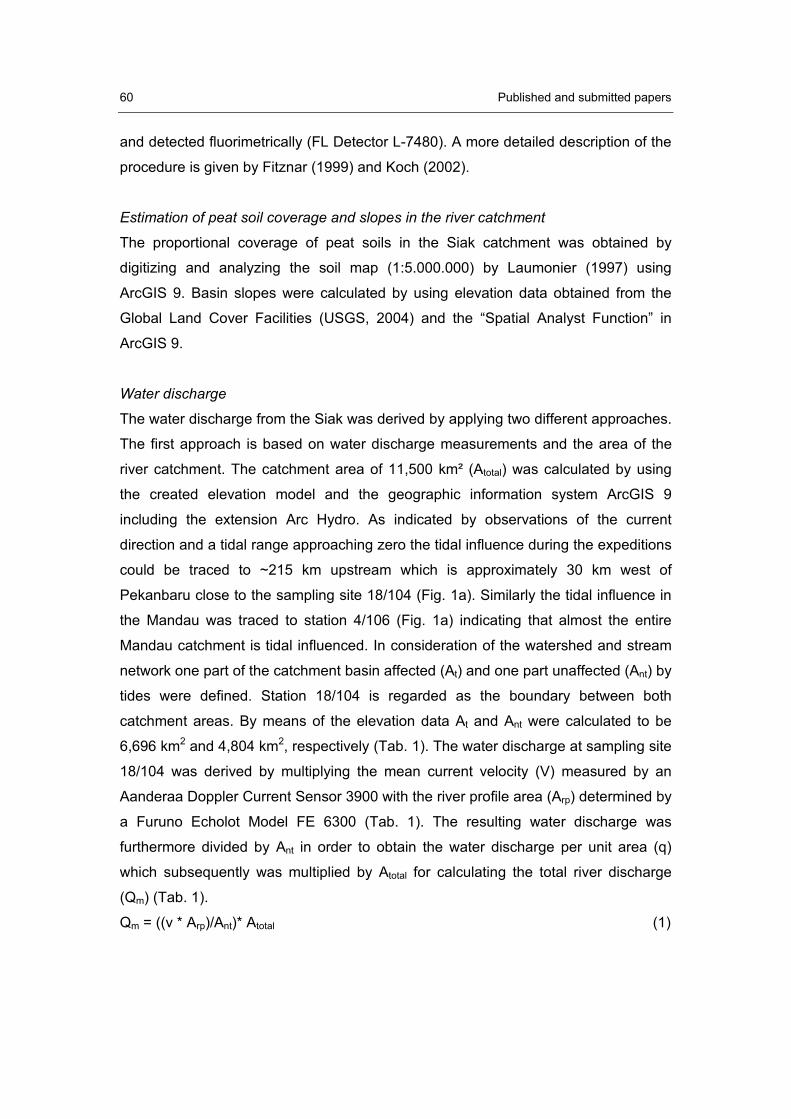
60 Published and submitted papers
and detected fluorimetrically (FL Detector L-7480). A more detailed description of the
procedure is given by Fitznar (1999) and Koch (2002).
Estimation of peat soil coverage and slopes in the river catchment
The proportional coverage of peat soils in the Siak catchment was obtained by
digitizing and analyzing the soil map (1:5.000.000) by Laumonier (1997) using
ArcGIS 9. Basin slopes were calculated by using elevation data obtained from the
Global Land Cover Facilities (USGS, 2004) and the “Spatial Analyst Function” in
ArcGIS 9.
Water discharge
The water discharge from the Siak was derived by applying two different approaches.
The first approach is based on water discharge measurements and the area of the
river catchment. The catchment area of 11,500 km² (Atotal) was calculated by using
the created elevation model and the geographic information system ArcGIS 9
including the extension Arc Hydro. As indicated by observations of the current
direction and a tidal range approaching zero the tidal influence during the expeditions
could be traced to ~215 km upstream which is approximately 30 km west of
Pekanbaru close to the sampling site 18/104 (Fig. 1a). Similarly the tidal influence in
the Mandau was traced to station 4/106 (Fig. 1a) indicating that almost the entire
Mandau catchment is tidal influenced. In consideration of the watershed and stream
network one part of the catchment basin affected (At) and one part unaffected (Ant) by
tides were defined. Station 18/104 is regarded as the boundary between both
catchment areas. By means of the elevation data At and Ant were calculated to be
6,696 km2 and 4,804 km2, respectively (Tab. 1). The water discharge at sampling site
18/104 was derived by multiplying the mean current velocity (V) measured by an
Aanderaa Doppler Current Sensor 3900 with the river profile area (Arp) determined by
a Furuno Echolot Model FE 6300 (Tab. 1). The resulting water discharge was
furthermore divided by Ant in order to obtain the water discharge per unit area (q)
which subsequently was multiplied by Atotal for calculating the total river discharge
(Qm) (Tab. 1).
Qm = ((v * Arp)/Ant)* Atotal (1)
Published and submitted papers 61
In a second approach the total water discharge (Qc) was calculated from the
catchment area (Atotal) and the runoff which is defined as the difference between
precipitation (P) and evapotranspiration (ET) according to the following equation:
Qc = (P – ET) (2)
Precipitation rates were obtained from the meteorological station at Pekanbaru and
from the 1x1° gridded global precipitation data set provided by the Global
Precipitation Climatology Centre (GPCC, 2005) covering the region between 1°S and
1°N and 100° and 102°E for the year 2004 (Tab. 1).
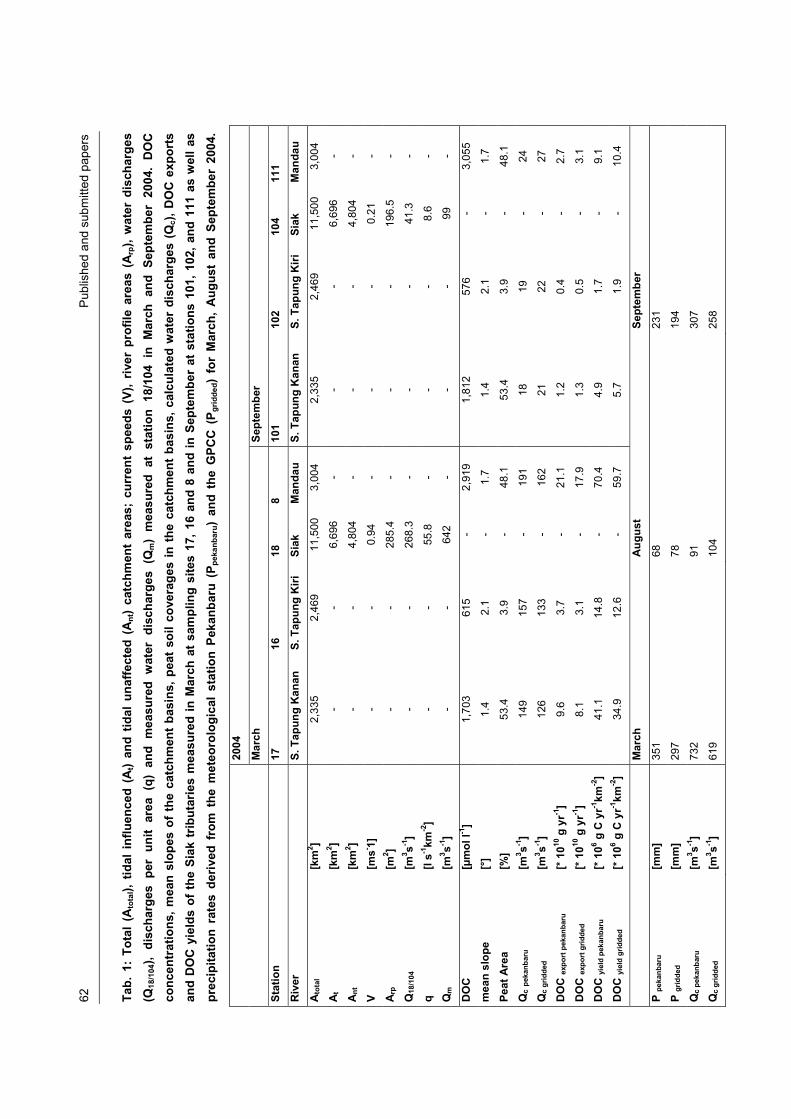
62
P
ublis
hed
and
subm
itted
pap
ers
Tab.
1:
Tota
l (A
tota
l), t
idal
inf
luen
ced
(At)
and
tidal
una
ffect
ed (
Ant
) ca
tchm
ent
area
s; c
urre
nt s
peed
s (V
), riv
er p
rofil
e ar
eas
(Arp
), w
ater
dis
char
ges
(Q18
/104
), di
scha
rges
per
uni
t ar
ea (
q) a
nd m
easu
red
wat
er d
isch
arge
s (Q
m)
mea
sure
d at
sta
tion
18/1
04 i
n M
arch
and
Sep
tem
ber
2004
. D
OC
co
ncen
trat
ions
, mea
n sl
opes
of
the
catc
hmen
t ba
sins
, pea
t so
il co
vera
ges
in t
he c
atch
men
t ba
sins
, cal
cula
ted
wat
er d
isch
arge
s (Q
c), D
OC
exp
orts
an
d D
OC
yie
lds
of t
he S
iak
trib
utar
ies
mea
sure
d in
Mar
ch a
t sa
mpl
ing
site
s 17
, 16
and
8 an
d in
Sep
tem
ber
at s
tatio
ns 1
01, 1
02, a
nd 1
11 a
s w
ell a
s pr
ecip
itatio
n ra
tes
deriv
ed f
rom
the
met
eoro
logi
cal
stat
ion
Peka
nbar
u (P
peka
nbar
u) a
nd t
he G
PCC
(P g
ridde
d) f
or M
arch
, A
ugus
t an
d Se
ptem
ber
2004
.
2004
Mar
ch
Sept
embe
r
Stat
ion
17
16
18
8
101
102
104
111
Riv
er
S.
Tap
ung
Kan
an
S. T
apun
g K
iri
Siak
M
anda
u S.
Tap
ung
Kan
an
S. T
apun
g K
iri
Siak
M
anda
u
Ato
tal
[km
2 ] 2,
335
2,46
9 11
,500
3,
004
2,33
5 2,
469
11,5
00
3,00
4
At
[km
2 ] -
- 6,
696
- -
- 6,
696
-
Ant
[k
m2 ]
- -
4,80
4 -
- -
4,80
4 -
V [m
s- 1]
- -
0.94
-
- -
0.21
-
Arp
[m
2 ] -
- 28
5.4
- -
- 19
6.5
-
Q18
/104
[m
3 s-1]
- -
268.
3 -
- -
41.3
-
q
[l s-1
km-2
] -
- 55
.8
- -
- 8.
6 -
Qm
[m
3 s-1]
- -
642
- -
- 99
-
DO
C
[μm
ol l-1
] 1,
703
615
- 2,
919
1,81
2 57
6 -
3,05
5
mea
n sl
ope
[°]
1.4
2.1
- 1.
7 1.
4 2.
1 -
1.7
Peat
Are
a [%
] 53
.4
3.9
- 48
.1
53.4
3.
9 -
48.1
Qc p
ekan
baru
[m
3 s-1]
149
157
- 19
1 18
19
-
24
Qc
grid
ded
[m3 s-1
] 12
6 13
3 -
162
21
22
- 27
DO
C ex
port
pek
anba
ru
[* 1
010 g
yr-1
] 9.
6 3.
7 -
21.1
1.
2 0.
4 -
2.7
DO
C ex
port
grid
ded
[* 1
010 g
yr-1
] 8.
1 3.
1 -
17.9
1.
3 0.
5 -
3.1
DO
C yi
eld
peka
nbar
u [*
106 g
C y
r-1km
-2]
41.1
14
.8
- 70
.4
4.9
1.7
- 9.
1
DO
C yi
eld
grid
ded
[* 1
06 g C
yr-1
km-2
] 34
.9
12.6
-
59.7
5.
7 1.
9 -
10.4
Mar
ch
Aug
ust
Sept
embe
r
P pe
kanb
aru
[mm
] 35
1 68
23
1
P gr
idde
d [m
m]
297
78
194
Qc
peka
nbar
u [m
3 s-1]
732
91
307
Qc
grid
ded
[m3 s-1
] 61
9 10
4 25
8
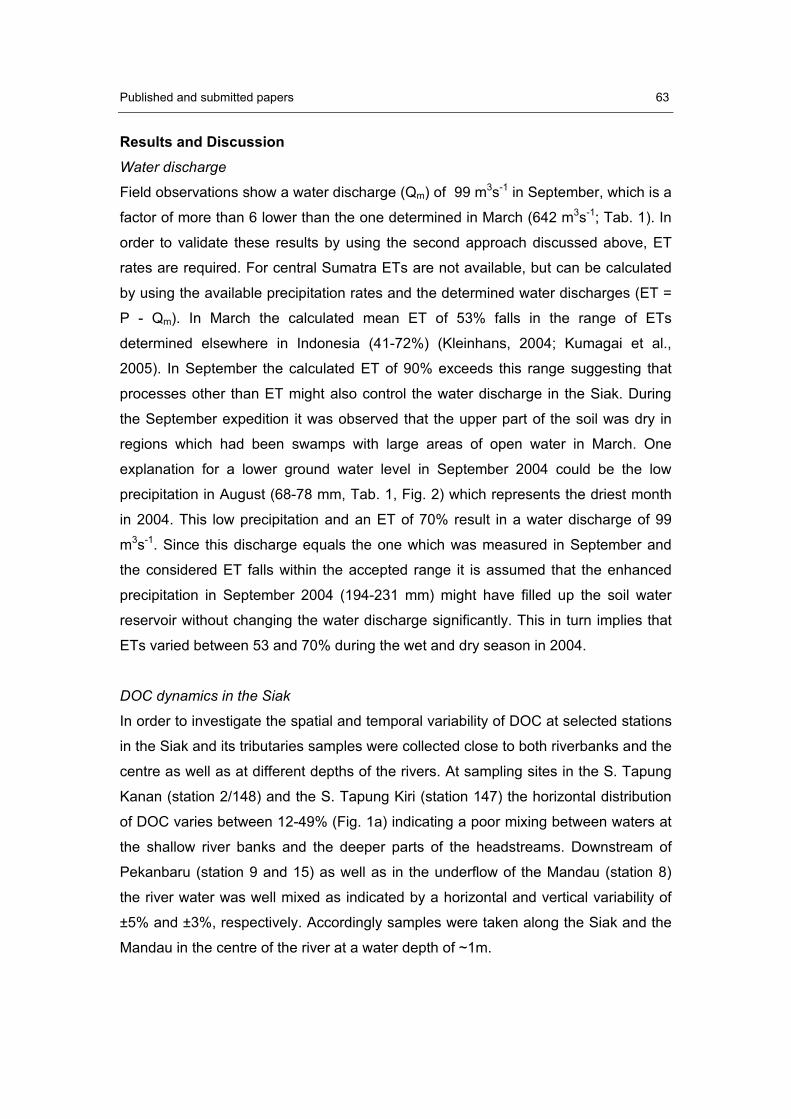
Published and submitted papers 63
Results and Discussion Water discharge
Field observations show a water discharge (Qm) of 99 m3s-1 in September, which is a
factor of more than 6 lower than the one determined in March (642 m3s-1; Tab. 1). In
order to validate these results by using the second approach discussed above, ET
rates are required. For central Sumatra ETs are not available, but can be calculated
by using the available precipitation rates and the determined water discharges (ET =
P - Qm). In March the calculated mean ET of 53% falls in the range of ETs
determined elsewhere in Indonesia (41-72%) (Kleinhans, 2004; Kumagai et al.,
2005). In September the calculated ET of 90% exceeds this range suggesting that
processes other than ET might also control the water discharge in the Siak. During
the September expedition it was observed that the upper part of the soil was dry in
regions which had been swamps with large areas of open water in March. One
explanation for a lower ground water level in September 2004 could be the low
precipitation in August (68-78 mm, Tab. 1, Fig. 2) which represents the driest month
in 2004. This low precipitation and an ET of 70% result in a water discharge of 99
m3s-1. Since this discharge equals the one which was measured in September and
the considered ET falls within the accepted range it is assumed that the enhanced
precipitation in September 2004 (194-231 mm) might have filled up the soil water
reservoir without changing the water discharge significantly. This in turn implies that
ETs varied between 53 and 70% during the wet and dry season in 2004.
DOC dynamics in the Siak
In order to investigate the spatial and temporal variability of DOC at selected stations
in the Siak and its tributaries samples were collected close to both riverbanks and the
centre as well as at different depths of the rivers. At sampling sites in the S. Tapung
Kanan (station 2/148) and the S. Tapung Kiri (station 147) the horizontal distribution
of DOC varies between 12-49% (Fig. 1a) indicating a poor mixing between waters at
the shallow river banks and the deeper parts of the headstreams. Downstream of
Pekanbaru (station 9 and 15) as well as in the underflow of the Mandau (station 8)
the river water was well mixed as indicated by a horizontal and vertical variability of
±5% and ±3%, respectively. Accordingly samples were taken along the Siak and the
Mandau in the centre of the river at a water depth of ~1m.
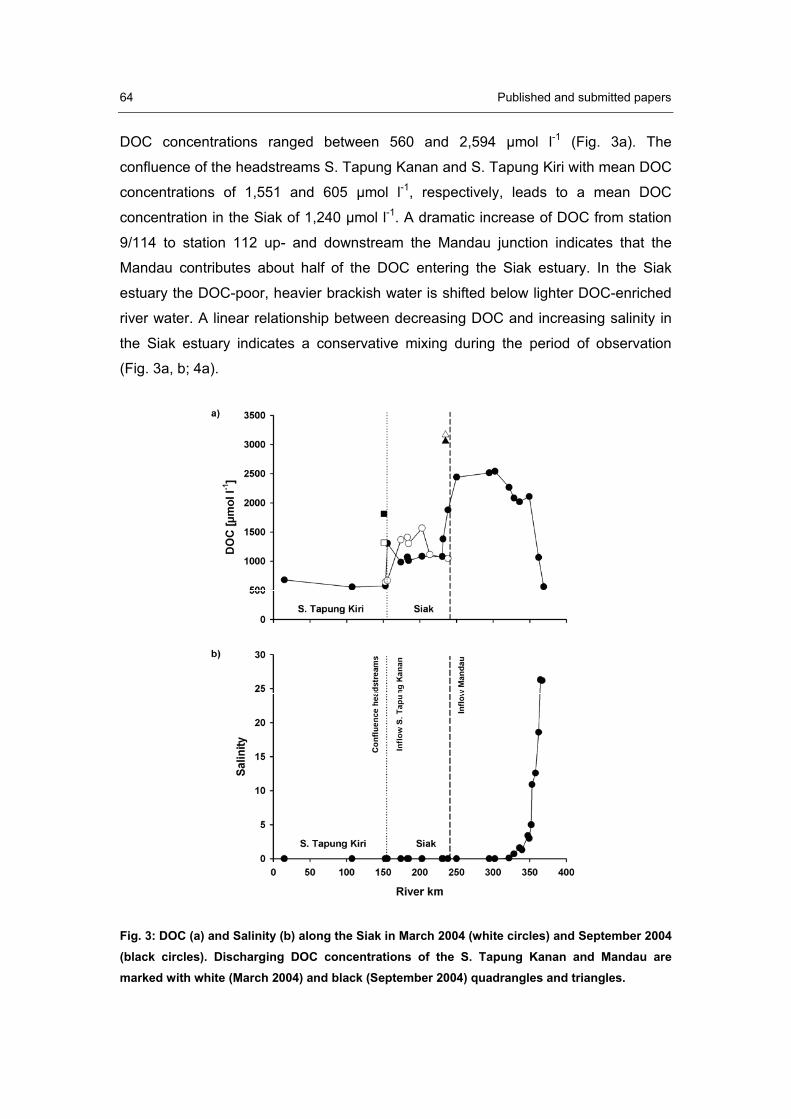
64 Published and submitted papers
DOC concentrations ranged between 560 and 2,594 μmol l-1 (Fig. 3a). The
confluence of the headstreams S. Tapung Kanan and S. Tapung Kiri with mean DOC
concentrations of 1,551 and 605 μmol l-1, respectively, leads to a mean DOC
concentration in the Siak of 1,240 μmol l-1. A dramatic increase of DOC from station
9/114 to station 112 up- and downstream the Mandau junction indicates that the
Mandau contributes about half of the DOC entering the Siak estuary. In the Siak
estuary the DOC-poor, heavier brackish water is shifted below lighter DOC-enriched
river water. A linear relationship between decreasing DOC and increasing salinity in
the Siak estuary indicates a conservative mixing during the period of observation
(Fig. 3a, b; 4a).
Fig. 3: DOC (a) and Salinity (b) along the Siak in March 2004 (white circles) and September 2004 (black circles). Discharging DOC concentrations of the S. Tapung Kanan and Mandau are marked with white (March 2004) and black (September 2004) quadrangles and triangles.
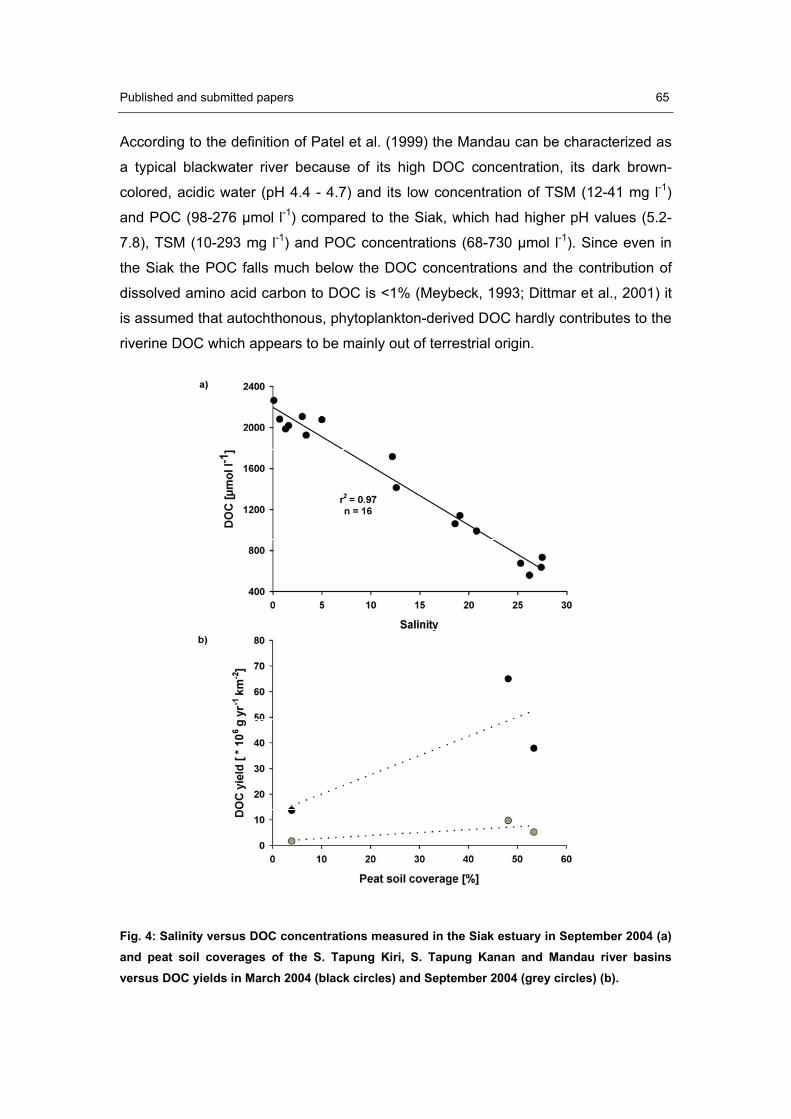
Published and submitted papers 65
According to the definition of Patel et al. (1999) the Mandau can be characterized as
a typical blackwater river because of its high DOC concentration, its dark brown-
colored, acidic water (pH 4.4 - 4.7) and its low concentration of TSM (12-41 mg l-1)
and POC (98-276 μmol l-1) compared to the Siak, which had higher pH values (5.2-
7.8), TSM (10-293 mg l-1) and POC concentrations (68-730 μmol l-1). Since even in
the Siak the POC falls much below the DOC concentrations and the contribution of
dissolved amino acid carbon to DOC is <1% (Meybeck, 1993; Dittmar et al., 2001) it
is assumed that autochthonous, phytoplankton-derived DOC hardly contributes to the
riverine DOC which appears to be mainly out of terrestrial origin.
Fig. 4: Salinity versus DOC concentrations measured in the Siak estuary in September 2004 (a) and peat soil coverages of the S. Tapung Kiri, S. Tapung Kanan and Mandau river basins versus DOC yields in March 2004 (black circles) and September 2004 (grey circles) (b).
66 Published and submitted papers
DOC yields obtained for the three catchment basins of the Siak (S. Tapung Kiri, S.
Tapung Kanan and Mandau) tend to increase with an increasing proportional
coverage of peat soils and decreasing mean slopes in the catchment basins (Tab. 1,
Fig. 4b). This trend could be explained by an enhanced residence time of water due
to a lower topographic relief in the catchment basin and enhanced soil carbon
content both favouring leaching of DOC from soils (Ludwig et al., 1996; Dillon and
Molot, 1997; Hope et al., 1997b). High precipitation rates and subsequently
increased water discharges seem to enhance leaching from soils additionally as
indicated by DOC yields which are higher in March than in September (Tab. 1, Fig.
4b).
DOC export of the Siak
In order to estimate the DOC export of the Siak into the coastal ocean the DOC end-
member concentration derived from the linear relation between salinity and DOC was
multiplied by the freshwater discharge. In September a riverine DOC end-member
concentration of 2,195 μmol l-1 and a freshwater discharge of 99 m3s-1 suggest a
DOC export of 0.0069 Tg month-1. Due to a lack of DOC and salinity data for the Siak
estuary in March 2004 a DOC end-member concentration could not directly be
determined. However, since DOC concentrations in the Siak and Mandau were <15%
lower in March than in September, it is assumed that the mean riverine DOC
concentration also falls 15% below those determined in September. Considering
such a reduced DOC concentration (~1,866 μmol l-1) and the freshwater discharges
of 642 m3s-1 a DOC export of 0.038 Tg month-1 in March is suggested. As March and
September represent the wet and dry season, respectively, a monthly mean DOC
export of 0.0224 Tg month-1 (=0.27 Tg yr-1) is assumed to be representative for the
year 2004.
In order to validate this estimate a second approach is applied which is based on the
available precipitation rates and the estimated ETs (53 – 70%). The resulting annual
mean discharges vary between 1 and 1.6 * 1010 m3yr-1 and a mean DOC
concentration 2030 ±15% suggest a mean DOC flux of 0.32 Tg C yr-1. Considering
the uncertainties involved in both approaches the two different results reveal an
acceptable agreement so that an annual mean DOC discharge from the Siak into the
Published and submitted papers 67
ocean of ~0.3 ± 0.03 Tg C yr-1 is assumed which places the Siak on position 17 on
the ranking list of DOC exports of major global rivers (Ludwig et al., 1996).
Estimated DOC export from peat draining Indonesian rivers
As observed from higher latitudes (Hope et al., 1997a; Aitkenhead et al., 1999) and
also seen in the Siak DOC yields strongly depend on the peat soil coverage within
the catchment basin and the water discharge (Fig. 4b). Approximately 10% of the
Indonesian landmass is covered by peat soils (Rieley et al., 1996a; FAO/UNESCO,
2003). Based on the observed relationship between peat soil coverage and DOC
yield of the Siak tributaries a peat soil coverage of 10% would imply DOC yields of
2.8 and 20 * 106 g yr-1 km-2 in August/September and March, respectively (Fig. 4b).
This difference is mainly caused by the water discharges which were low in
August/September and high in March. The associated precipitation rates varied
between 68-78 mm (August) and 297-351 mm (March), respectively (Tab. 1). The
annual mean precipitation rates over Indonesia (94° - 141° E, 11° S - 6° E) is 193
mm (GPCC, 2005). Such a precipitation rate suggests a DOC yield of 11 * 106 g yr-1
km-2 if linear interpolated between 2.8 and 20 * 106 g yr-1 km-2. Extrapolated over
entire Indonesia (~1.9*106 km2) this DOC yield suggests a DOC discharge of ~21 Tg
yr-1. This DOC export and the modelled Indonesian freshwater discharge of 4.26 *
1012 m3 yr-1 suggest furthermore a mean riverine DOC concentration of ~410 μmol l-1
which is at the lower range of estimated mean DOC concentrations of non-
Indonesian tropical rivers (408-667 μmol-1) (Meybeck, 1988; Ludwig et al., 1996).
Since Indonesia holds 48% of the tropical peat soils covering 10% of its land mass
and experiences one of the worlds highest precipitation rates it is assumed that this
estimate is an under- rather than an overestimate.
Conclusion The data obtained during the study suggest that leaching from peat soils is the main
source of DOC carried by the Siak and its tributaries. The DOC concentrations in the
Siak and its tributaries exceed those reported so far from other tropical rivers due to
effective leaching of DOC from the peat soils. The DOC yields increased with
enhanced precipitation indicating the sensitivity of peat soil leaching to changes in
the water discharge as also reported from higher latitudes (Tranvik and Jansson,
2002). In 2004 the annual mean DOC export from the Siak was estimated to be 0.3
68 Published and submitted papers
Tg C yr-1. This contributes ~1.4% to the Indonesian DOC discharge which was
estimated to be ~21 Tg C yr-1. This of course is a first estimate which needs to be
validated in future by including data from further Indonesian rivers but it implies that
the small Indonesian rivers contribute at least 10% to the global riverine DOC
discharge into the ocean.
Acknowledgments We would like to thank all scientists and students from the University of Pekanbaru
who helped us during our field work. Furthermore, we would like to thank the rector of
the University of Riau and the captain of the research vessel R/V Senangin and his
crew for their support. Particularly, we would like to thank Venugopalan Ittekkot and
Günther Uher for their useful comments on the manuscript, Timo Ebenthal for his
support by the application of the ArcGIS program tools and our colleagues from the
ZMT for helpful discussions. We are also grateful to the Federal German Ministry for
Education, Science, Research and Technology (BMBF, Bonn) for financial support
(Grant No. 03F0392C-ZMT).
Published and submitted papers 69
2.4. DOC discharges from the Indonesian blackwater river Siak and its estuary
into the Malacca Strait and their role as DOC source for the Indian Ocean
Antje Bauma, *, Tim Rixena, Herbert Siegelb, Thomas Pohlmannc, Joko Samiajid,
Christine Josed
aCenter for Tropical Marine Ecology, Fahrenheitstrasse 6, 28359 Bremen, Germany bBaltic Sea Research Institute Warnemünde, Seestrasse 15, 18119 Rostock, Germany cInstitute of Oceanography, Hamburg University, Bundesstrasse 53, 20146 Hamburg, Germany dUniversity of Riau, Jl. Simpang Panam Km 12.5, Pekanbaru, Riau, Indonesia
Marine Chemistry, submitted 11 June 2008
Abstract Three expeditions to the peat-draining river Siak in Central Sumatra (Indonesia) were
carried out between 2004 and 2006 to investigate sources and sinks of dissolved
organic carbon (DOC) in the river estuary and to quantify the DOC export into the
Malacca Strait. Incubation experiments upstream the estuary conducted in March
2006 showed that approximately 27% of the riverine DOC was degradable with a
half-life of 2 days whereas ~73% appear to be more refractory. Based on the
relationship between salinity and DOC two-point mixing analyzes were carried out to
quantify DOC inputs and losses in the estuary which catchment is largely covered by
peatsoils. The results indicate that especially during rainy periods, the Siak Estuary
acts as DOC source and nearly doubled the DOC discharge from the Siak River into
the Malacca Strait during the period of investigation. Satellite images reveal
pronounced plumes of the Siak and other peat-draining rivers in the Malacca Strait,
which strongly suggest that terrestrial DOC inputs increase the DOC concentration in
the Malacca Strait. Based on the difference between the DOC concentration
measured in the Malacca Strait and in its source water from the South China Sea, a
terrestrial DOC input from the Malacca Strait into the Indian Ocean of ~6.4 Tg yr-1
was estimated to which the Siak contributes ~8%. Thus the DOC export from the
Malacca Strait into the Indian Ocean is among the highest riverine DOC inputs into
the ocean reported world-wide.
70 Published and submitted papers
Keywords: blackwater river, tropical peat, estuary, DOC export, Sumatra (Indonesia),
Malacca Strait
Introduction Photosynthesis of organic matter in the euphotic zone of the ocean, its subsequent
dissolution and downward mixing into the deep ocean, referred to as DOC export, is
considered to be the main source of the marine DOC pool, which holds with ~700 Gt
almost as much carbon as the atmosphere (~815 Gt) (Kurz, 1993; Hansell and
Carlson, 2002; Tans, 2008). Estimates of DOC exports (~1200 Tg C yr-1) exceed
those of DOC inputs from marine sediments (260 Tg C yr-1) and rivers (170-250 Tg C
yr-1) by one order of magnitude (Ludwig et al., 1996; Hansell and Carlson, 1998;
Cauwet, 2002; Harrison et al., 2005; Lahajnar et al., 2005). However, the high age of
marine DOC (1,300-6,200 years) suggests an enrichment of aged DOC released
from sediments and/or terrestrial soils (Williams and Druffel, 1987). Biomarker
studies indicated that only 0.7-2.4% of the marine DOC pool is of terrestrial origin
(Opsahl and Benner, 1997). Other authors point to analytical problems associated
with the separation between marine and terrestrial organic matter and suggest that
terrestrial DOC inputs and especially DOC outwelling from mangroves (20 Tg C yr-1)
could play an important role in the marine DOC cycle (Dittmar et al., 2006). DOC
inputs from the numerous small Indonesian rivers into the ocean were also
suggested to be as large as DOC inputs from mangroves world-wide (Baum et al.,
2007). Leaching from peatsoils, which correspond to ~10% of the Indonesian
landmass, is assumed to play a significant role as source of DOC in Indonesian
rivers. Large parts of the Indonesian peatsoils are located in coastal areas which
emphasizes the role of river estuaries as DOC source and/or sink in Central Sumatra,
Indonesia.
In a recent study the DOC export of the Siak into the coastal ocean for the year 2004
was calculated whereas the role of the river estuary was not investigated in detail
(Baum et al., 2007). In this work we will utilize the relationship between DOC and
salinity to quantify DOC sources and sinks in the Siak Estuary in order to estimate
the DOC export of the Siak into the coastal ocean for the period 2004-2006.
Furthermore, remote sensing data and results derived from numerical models were
evaluated to trace and quantify the riverine DOC discharge into the Malacca Strait
and further into the Indian Ocean.
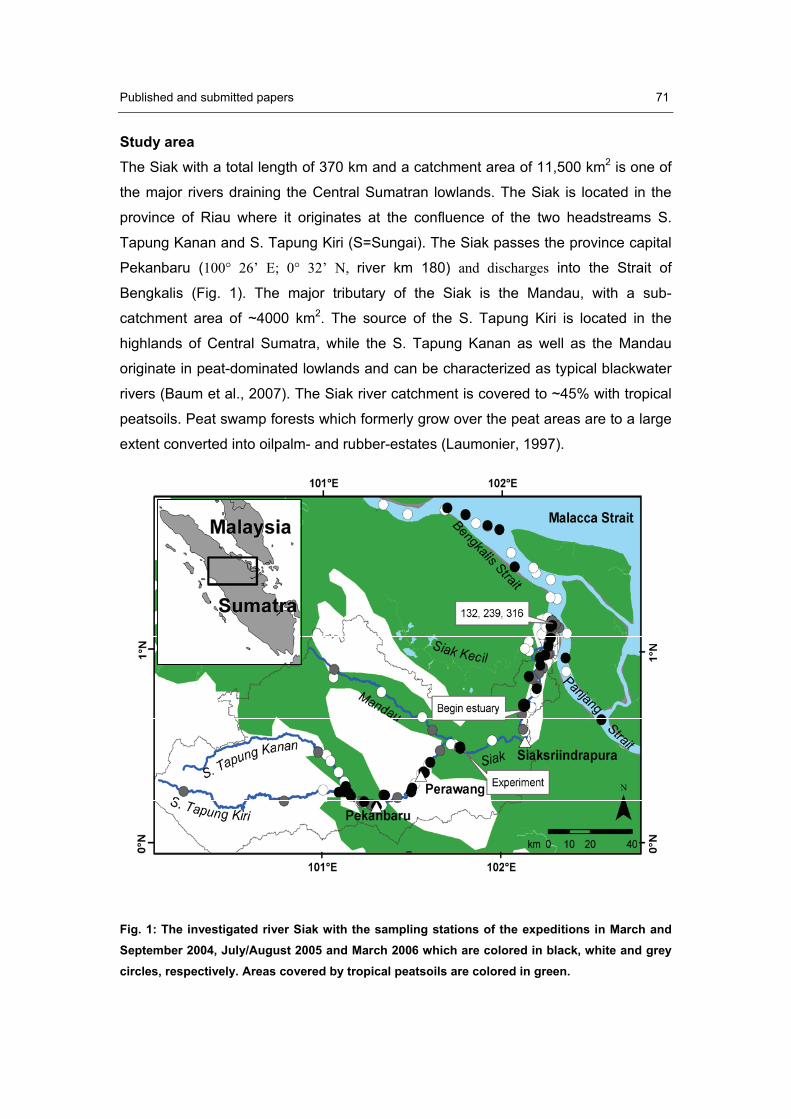
Published and submitted papers 71
Study area The Siak with a total length of 370 km and a catchment area of 11,500 km2 is one of
the major rivers draining the Central Sumatran lowlands. The Siak is located in the
province of Riau where it originates at the confluence of the two headstreams S.
Tapung Kanan and S. Tapung Kiri (S=Sungai). The Siak passes the province capital
Pekanbaru (100° 26’ E; 0° 32’ N, river km 180) and discharges into the Strait of
Bengkalis (Fig. 1). The major tributary of the Siak is the Mandau, with a sub-
catchment area of ~4000 km2. The source of the S. Tapung Kiri is located in the
highlands of Central Sumatra, while the S. Tapung Kanan as well as the Mandau
originate in peat-dominated lowlands and can be characterized as typical blackwater
rivers (Baum et al., 2007). The Siak river catchment is covered to ~45% with tropical
peatsoils. Peat swamp forests which formerly grow over the peat areas are to a large
extent converted into oilpalm- and rubber-estates (Laumonier, 1997).
Fig. 1: The investigated river Siak with the sampling stations of the expeditions in March and September 2004, July/August 2005 and March 2006 which are colored in black, white and grey circles, respectively. Areas covered by tropical peatsoils are colored in green.
72 Published and submitted papers
Due to the meridional migration of the Intertropical Convergence Zone (ITCZ) dry and
wet seasons are not clearly pronounced. During our expedition to the Siak the
monthly rainfall ranged between 101 and 398 mm resulting in mean annual
freshwater discharges ranging between 1.23 and 1.89 * 1010 m3s-1 (Tab. 1). The
estuary of the Siak, defined as the mixing area of fresh and ocean water, is indicated
by salinities > 0.1 and ranges from the river mouth (river km 0) until river km ~300.
Methods Samplings for DOC, salinity and colored dissolved organic matter (CDOM) were
carried out in September 2004, July/August 2005 and March 2006. In 2004 and 2005
the entire Siak system including the headstreams S. Tapung Kanan and S. Tapung
Kiri as well as the Mandau were investigated while in 2006 the study was focused on
the Siak mainstream and the lower reaches of both headstreams. The coastal ocean
was sampled in 2005 and 2006 (Fig. 1).
DOC
Water samples were collected with a Niskin bottle and filtered through 0.45μm single-
use syringe filters into pre-combusted glass-ampoules. After acidification with
phosphoric acid the samples were stored cool. DOC samples were analyzed by
means of high temperature catalytic oxidation using a Dohrman DC-190 Total
Organic Carbon Analyzer equipped with a platinum catalyst. Before injection into the
furnace, the acidified samples were decarbonated by purging with oxygen. The
evolving CO2 was purified, dried and detected by a non-dispersive infrared detection
system. Calibration was carried out using potassium phthalate dissolved in MilliQ
water.
C-DOM, Salinity
For the determination of the C-DOM absorption water samples were filtered through
Whatman GF/F filters and measured at 440 nm (ay(440)) using a spectral photometer
PC-Spec. Salinity was directly measured with a WTW TetraCon 325_3 sensor and a
Sea-Bird SBE19plus.
Published and submitted papers 73
DOC degradation experiments
DOC degradation experiments were conducted in March 2006. Water samples were
collected in the Siak mainstream after the confluence with the tributary Mandau (Fig.
1). Pre-combusted glass ampoules were filled with unfiltered Siak water and
incubated over a period of ~131 days under natural sunlight and constant
temperature (~32° C) in an artificial fish pond at the University of Riau (Pekanbaru).
Two samplings were done at the first day (4 and 8 hours after incubation) and one
sampling each at day 2 (after 29 hours), day 4 (after 76.5 hours) and day 9 (after 196
hours). After returning to Germany the remaining DOC ampoules were incubated
under UV light at constant temperatures (~32°C). The last sampling was conducted
after 131 days (3,148 hours). More detailed information can be found in Rixen et al.
(submitted).
Water discharge and DOC flux
Water discharges (Q) for the estimate of the DOC export into the ocean were
calculated based on the Siak catchment area and runoff, which is defined as the
difference between precipitation and evapotranspiration. Precipitation rates were
obtained from the 1 x 1° gridded global precipitation data set provided by the Global
Precipitation Climatology Centre (GPCC, 2005) (Baum et al., 2007).
Riverine DOC discharges were often quantified by multiplying freshwater discharges
with DOC concentrations. Selecting the right DOC concentration however is
problematic as the DOC concentrations often vary along the river and decrease in the
estuary due to mixing of DOC-rich river and DOC-poor ocean water. One approach
for deriving riverine DOC concentration is the correlation between salinity and DOC
(Alvarez-Salgado and Miller, 1998; Miller, 1999) whereby the DOC end-member
concentration is defined by the zero-intercept of the resulting regression equation
with the DOC axis. Although this is a reproducible method which has been also used
during our previous work (Baum et al., 2007) it ignores DOC inputs and
decomposition in river estuaries. Within this study, the linear relationship between
DOC and salinity is utilized to quantify DOC sources and sinks in the estuary and to
reassess the riverine DOC end-member concentration.
74 Published and submitted papers
Satellite data
The application of satellite remote sensing methods was focused on the visible
spectral range due to the strong variations in water color. The application in the Siak
river discharge area requires high spatial resolution. Therefore, MODIS data with a
resolution of 250m provided by the Rapid Response System of NASA were used. For
local studies Landsat ETM+ data with a spatial resolution of 30m were implemented.
HAMSOM model
Results derived from a baroclinic, three-dimensional circulation model HAMSOM will
be presented in this study. HAMSOM was adapted to a fine-scale model domain
covering only the Siak estuary and its vicinity with a resolution of approximately 1 km.
In the vertical, the resolution was 2 m with the exception of the surface layer. The
model was run for 5.5 years covering a simulation period from January 2001 to May
2006. The latest development of HAMSOM was discussed in detail by Pohlmann
(2006). The model was forced by open boundary conditions including 8 tidal
constituents provided by a larger-scale HAMSOM application of the entire Malacca
Strait and western Java Sea, 6-hourly atmospheric data, and climatological means of
temperature and salinity.
Results and Discussion DOC in the Siak River and estuary
The DOC concentrations in the Siak and its tributaries ranged between 348 and 4043
μmol L-1 (Tab. 1). These concentrations exceed not only those of major global rivers
but also concentrations measured in other blackwater rivers world-wide (Hope et al.,
1994; Ludwig et al., 1996; Spencer et al., 2007). Riverine DOC end-member
concentrations (DOCcorrelation) derived from the correlation between salinity and DOC
ranged between 1613 and 2247 μmol L-1 and therefore suggest that DOC discharges
into ocean range between ~0.31 and 0.51 Tg C (mean 0.38 ± 0.1 Tg C). The highest
DOC discharges were observed in periods of enhanced rainfall, probably as a
consequence of increased peatsoil leaching (Tab. 1).
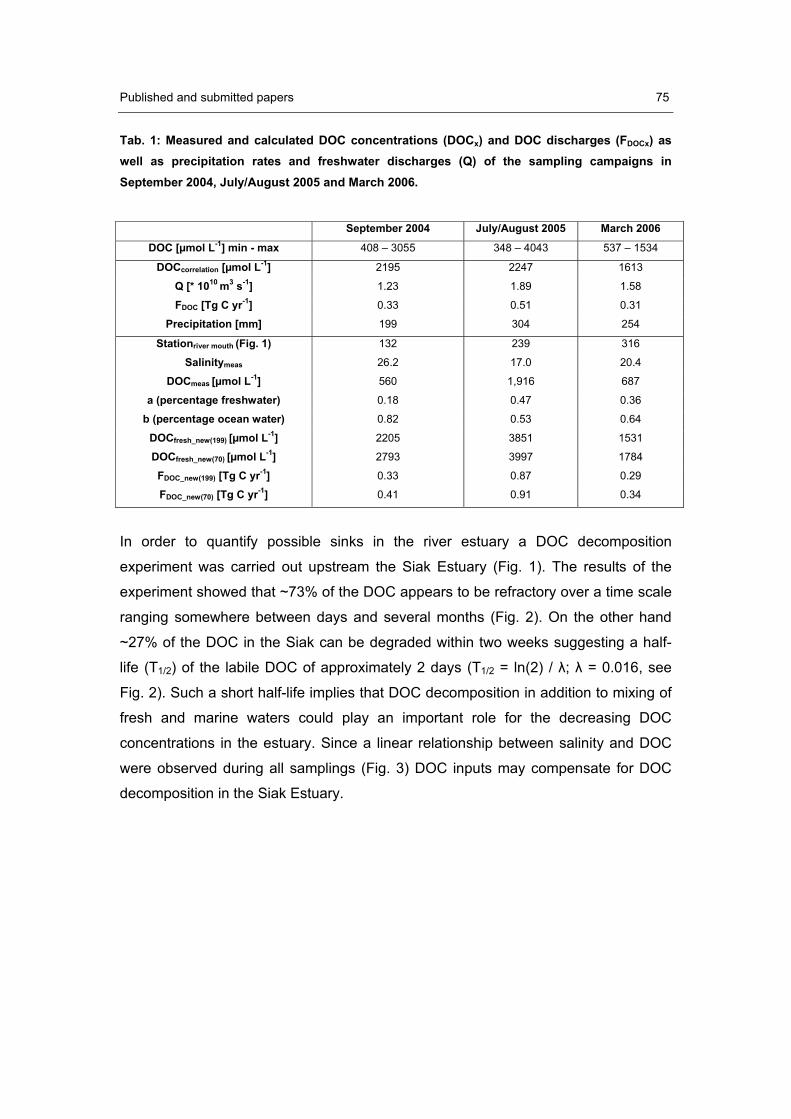
Published and submitted papers 75
Tab. 1: Measured and calculated DOC concentrations (DOCx) and DOC discharges (FDOCx) as well as precipitation rates and freshwater discharges (Q) of the sampling campaigns in September 2004, July/August 2005 and March 2006.
September 2004 July/August 2005 March 2006
DOC [μmol L-1] min - max 408 – 3055 348 – 4043 537 – 1534
DOCcorrelation [μmol L-1] 2195 2247 1613
Q [* 1010 m3 s-1] 1.23 1.89 1.58
FDOC [Tg C yr-1] 0.33 0.51 0.31
Precipitation [mm] 199 304 254
Stationriver mouth (Fig. 1) 132 239 316
Salinitymeas 26.2 17.0 20.4
DOCmeas [μmol L-1] 560 1,916 687
a (percentage freshwater) 0.18 0.47 0.36
b (percentage ocean water) 0.82 0.53 0.64
DOCfresh_new(199) [μmol L-1] 2205 3851 1531
DOCfresh_new(70) [μmol L-1] 2793 3997 1784
FDOC_new(199) [Tg C yr-1] 0.33 0.87 0.29
FDOC_new(70) [Tg C yr-1] 0.41 0.91 0.34
In order to quantify possible sinks in the river estuary a DOC decomposition
experiment was carried out upstream the Siak Estuary (Fig. 1). The results of the
experiment showed that ~73% of the DOC appears to be refractory over a time scale
ranging somewhere between days and several months (Fig. 2). On the other hand
~27% of the DOC in the Siak can be degraded within two weeks suggesting a half-
life (T1/2) of the labile DOC of approximately 2 days (T1/2 = ln(2) / �; � = 0.016, see
Fig. 2). Such a short half-life implies that DOC decomposition in addition to mixing of
fresh and marine waters could play an important role for the decreasing DOC
concentrations in the estuary. Since a linear relationship between salinity and DOC
were observed during all samplings (Fig. 3) DOC inputs may compensate for DOC
decomposition in the Siak Estuary.
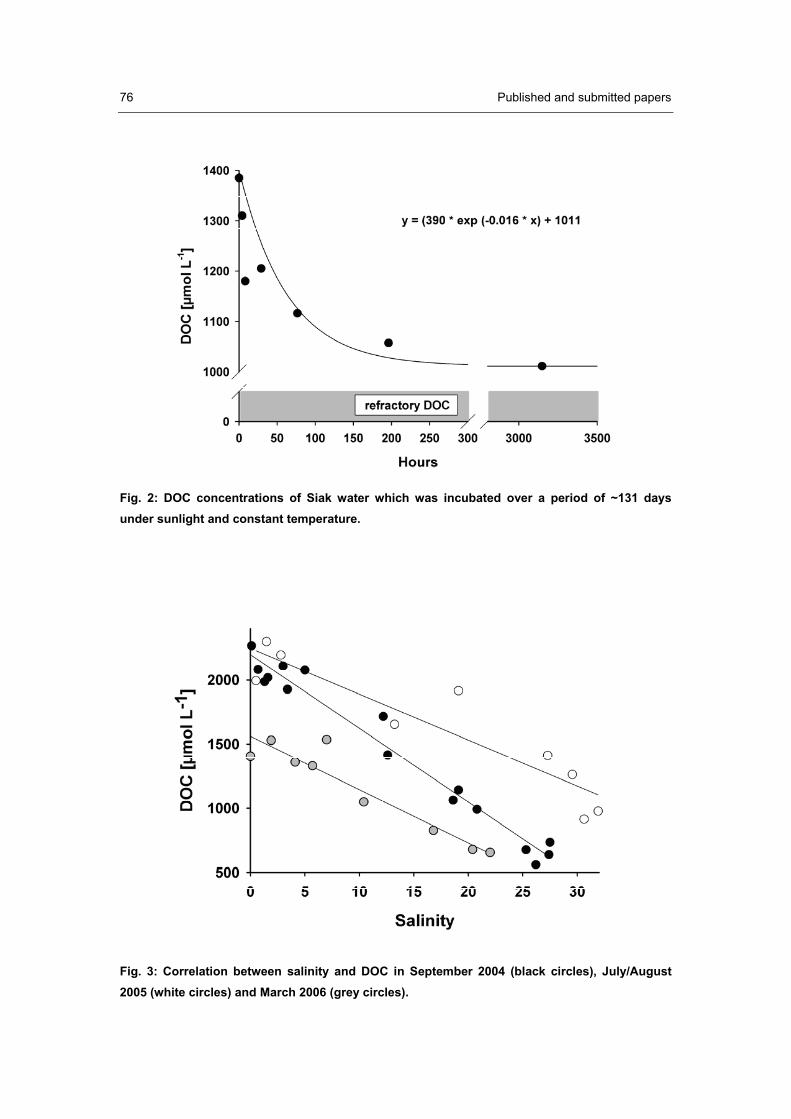
76 Published and submitted papers
Fig. 2: DOC concentrations of Siak water which was incubated over a period of ~131 days under sunlight and constant temperature.
Fig. 3: Correlation between salinity and DOC in September 2004 (black circles), July/August 2005 (white circles) and March 2006 (grey circles).
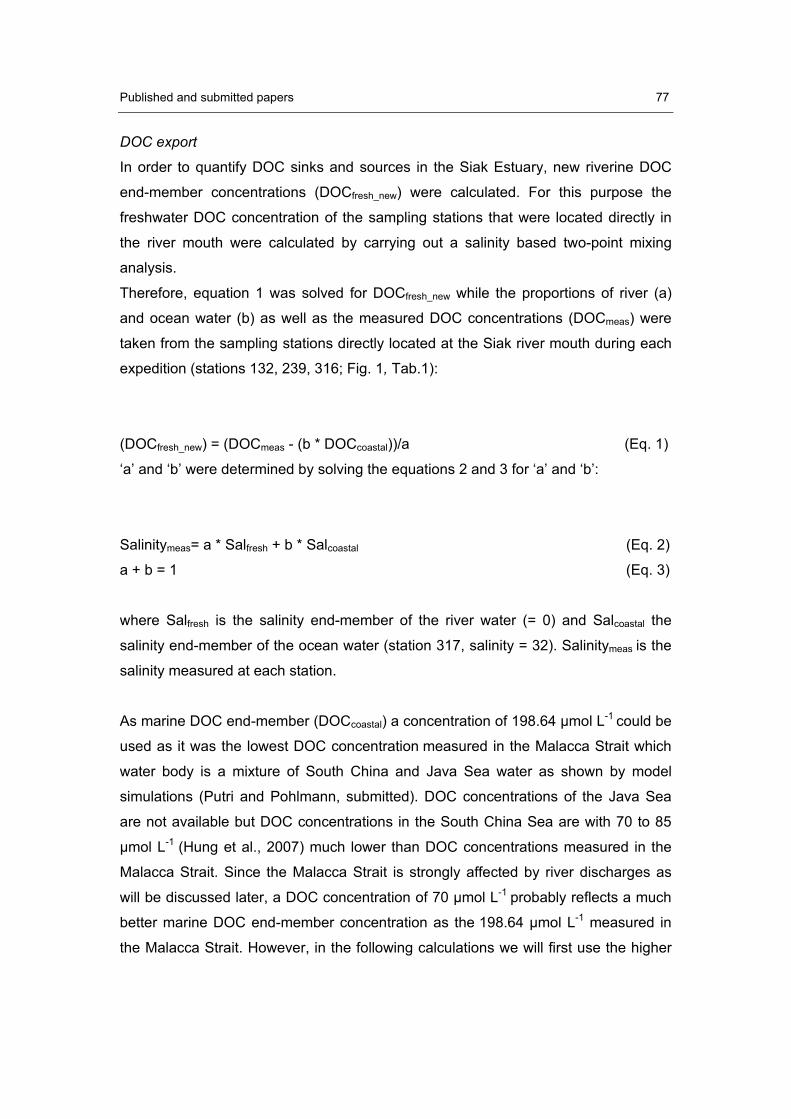
Published and submitted papers 77
DOC export
In order to quantify DOC sinks and sources in the Siak Estuary, new riverine DOC
end-member concentrations (DOCfresh_new) were calculated. For this purpose the
freshwater DOC concentration of the sampling stations that were located directly in
the river mouth were calculated by carrying out a salinity based two-point mixing
analysis.
Therefore, equation 1 was solved for DOCfresh_new while the proportions of river (a)
and ocean water (b) as well as the measured DOC concentrations (DOCmeas) were
taken from the sampling stations directly located at the Siak river mouth during each
expedition (stations 132, 239, 316; Fig. 1, Tab.1):
(DOCfresh_new) = (DOCmeas - (b * DOCcoastal))/a (Eq. 1)
‘a’ and ‘b’ were determined by solving the equations 2 and 3 for ‘a’ and ‘b’:
Salinitymeas= a * Salfresh + b * Salcoastal (Eq. 2)
a + b = 1 (Eq. 3)
where Salfresh is the salinity end-member of the river water (= 0) and Salcoastal the
salinity end-member of the ocean water (station 317, salinity = 32). Salinitymeas is the
salinity measured at each station.
As marine DOC end-member (DOCcoastal) a concentration of 198.64 μmol L-1 could be
used as it was the lowest DOC concentration measured in the Malacca Strait which
water body is a mixture of South China and Java Sea water as shown by model
simulations (Putri and Pohlmann, submitted). DOC concentrations of the Java Sea
are not available but DOC concentrations in the South China Sea are with 70 to 85
μmol L-1 (Hung et al., 2007) much lower than DOC concentrations measured in the
Malacca Strait. Since the Malacca Strait is strongly affected by river discharges as
will be discussed later, a DOC concentration of 70 μmol L-1 probably reflects a much
better marine DOC end-member concentration as the 198.64 μmol L-1 measured in
the Malacca Strait. However, in the following calculations we will first use the higher
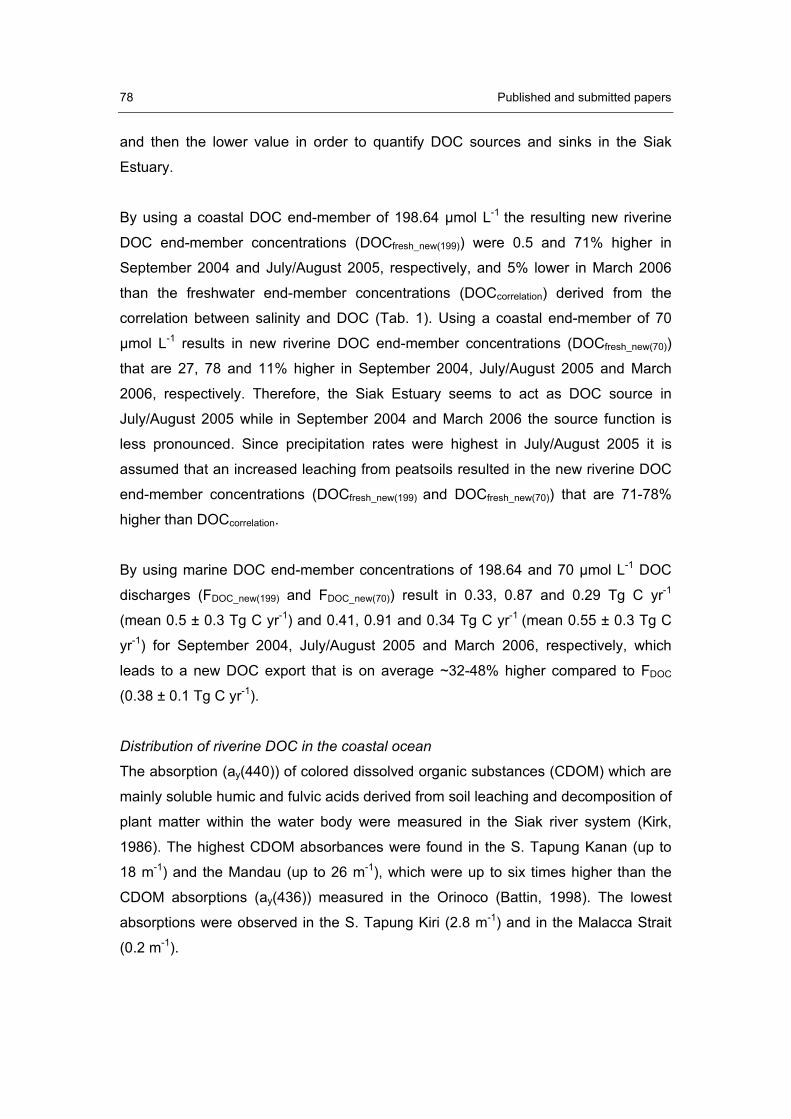
78 Published and submitted papers
and then the lower value in order to quantify DOC sources and sinks in the Siak
Estuary.
By using a coastal DOC end-member of 198.64 μmol L-1 the resulting new riverine
DOC end-member concentrations (DOCfresh_new(199)) were 0.5 and 71% higher in
September 2004 and July/August 2005, respectively, and 5% lower in March 2006
than the freshwater end-member concentrations (DOCcorrelation) derived from the
correlation between salinity and DOC (Tab. 1). Using a coastal end-member of 70
μmol L-1 results in new riverine DOC end-member concentrations (DOCfresh_new(70))
that are 27, 78 and 11% higher in September 2004, July/August 2005 and March
2006, respectively. Therefore, the Siak Estuary seems to act as DOC source in
July/August 2005 while in September 2004 and March 2006 the source function is
less pronounced. Since precipitation rates were highest in July/August 2005 it is
assumed that an increased leaching from peatsoils resulted in the new riverine DOC
end-member concentrations (DOCfresh_new(199) and DOCfresh_new(70)) that are 71-78%
higher than DOCcorrelation.
By using marine DOC end-member concentrations of 198.64 and 70 μmol L-1 DOC
discharges (FDOC_new(199) and FDOC_new(70)) result in 0.33, 0.87 and 0.29 Tg C yr-1
(mean 0.5 ± 0.3 Tg C yr-1) and 0.41, 0.91 and 0.34 Tg C yr-1 (mean 0.55 ± 0.3 Tg C
yr-1) for September 2004, July/August 2005 and March 2006, respectively, which
leads to a new DOC export that is on average ~32-48% higher compared to FDOC
(0.38 ± 0.1 Tg C yr-1).
Distribution of riverine DOC in the coastal ocean
The absorption (ay(440)) of colored dissolved organic substances (CDOM) which are
mainly soluble humic and fulvic acids derived from soil leaching and decomposition of
plant matter within the water body were measured in the Siak river system (Kirk,
1986). The highest CDOM absorbances were found in the S. Tapung Kanan (up to
18 m-1) and the Mandau (up to 26 m-1), which were up to six times higher than the
CDOM absorptions (ay(436)) measured in the Orinoco (Battin, 1998). The lowest
absorptions were observed in the S. Tapung Kiri (2.8 m-1) and in the Malacca Strait
(0.2 m-1).
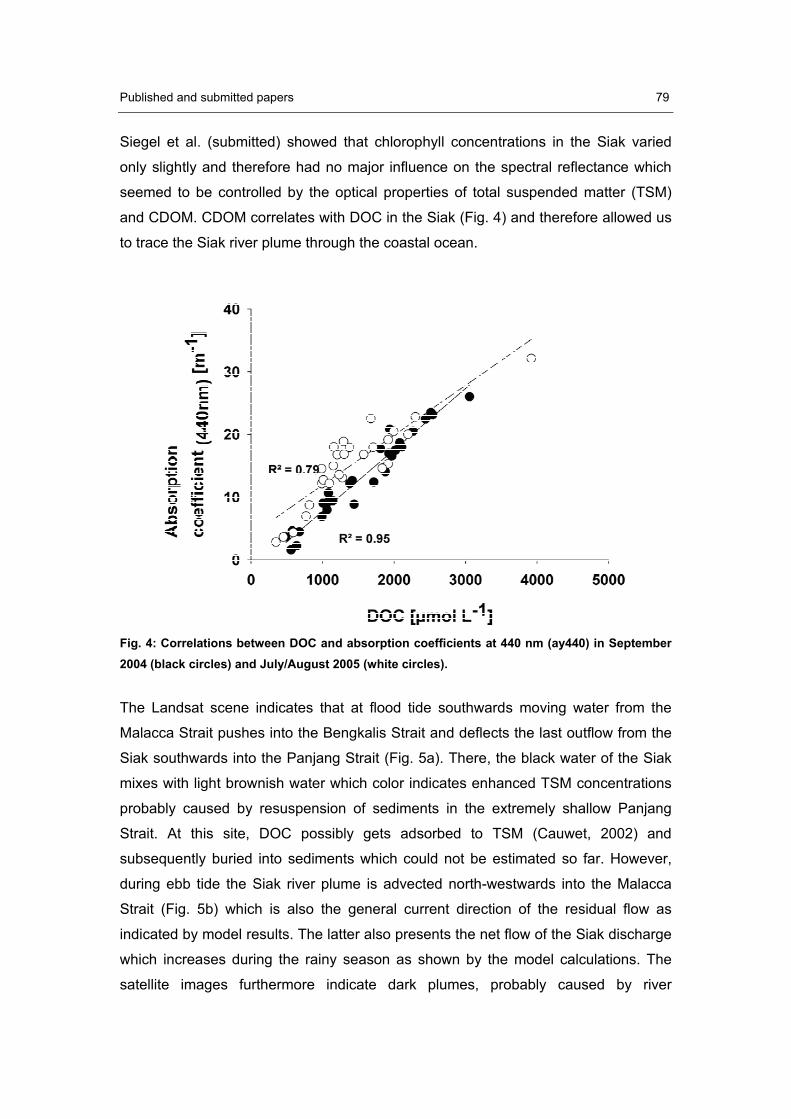
Published and submitted papers 79
Siegel et al. (submitted) showed that chlorophyll concentrations in the Siak varied
only slightly and therefore had no major influence on the spectral reflectance which
seemed to be controlled by the optical properties of total suspended matter (TSM)
and CDOM. CDOM correlates with DOC in the Siak (Fig. 4) and therefore allowed us
to trace the Siak river plume through the coastal ocean.
Fig. 4: Correlations between DOC and absorption coefficients at 440 nm (ay440) in September 2004 (black circles) and July/August 2005 (white circles).
The Landsat scene indicates that at flood tide southwards moving water from the
Malacca Strait pushes into the Bengkalis Strait and deflects the last outflow from the
Siak southwards into the Panjang Strait (Fig. 5a). There, the black water of the Siak
mixes with light brownish water which color indicates enhanced TSM concentrations
probably caused by resuspension of sediments in the extremely shallow Panjang
Strait. At this site, DOC possibly gets adsorbed to TSM (Cauwet, 2002) and
subsequently buried into sediments which could not be estimated so far. However,
during ebb tide the Siak river plume is advected north-westwards into the Malacca
Strait (Fig. 5b) which is also the general current direction of the residual flow as
indicated by model results. The latter also presents the net flow of the Siak discharge
which increases during the rainy season as shown by the model calculations. The
satellite images furthermore indicate dark plumes, probably caused by river
80 Published and submitted papers
discharges from other peat-draining rivers to the north (Rokan) and south (Kampar)
of the Siak (Fig. 5b).
Fig. 5: Landsat 7 ETM+ scene acquired on 14th July 2002 11:10 SGT showing the Siak river plum during arising tide (a) adapted from Siegel et al. 2008. MODIS scene on 3rd January 2002 acquired 11:10 SGT showing the Siak discharge during flow off before low tide (b).
These pronounced river discharges into the Malacca Strait strongly support our
former assumption that the DOC concentration is influenced by terrestrial DOC inputs
which might have increased the concentration from 70 to 198.64 μmol L-1. This
increase of ~130 μmol L-1 in combination with a mean throughflow through the
Malacca Strait of 0.13 * 106 m3 s-1 (Humphries and Webb, 2007) would imply a mean
riverine DOC discharge into the Indian Ocean of 6.4 Tg C yr-1. Considering a mean
DOC export from the Siak of ~0.5 Tg C yr-1 in turn suggests that the Siak could
contribute ~8% to the terrestrial DOC discharge into the Indian Ocean through the
Malacca Strait.
Conclusions The results of this study indicate that the Siak Estuary acted as a DOC source during
rainy periods. On average DOC inputs into the estuary between 2004 and 2006
increased the DOC discharge from the Siak into the Malacca Strait by ~32-48%.
a) b)
Published and submitted papers 81
Pronounced plumes of the Siak and other peat-draining rivers in the Malacca Strait,
which can be identified on satellite images, strongly suggest that further terrestrial
DOC inputs increase the DOC concentration in the Malacca Strait. The difference
between the DOC concentration measured in the Malacca Strait and in its source
water from the South China Sea of ~130 μmol L-1 implies a terrestrial DOC discharge
from the Malacca Strait into the Indian Ocean of ~6.4 Tg yr-1 to which the Siak
contributes ~8%. Thus, the Malacca Strait is after the rivers Amazon, Yangtze and
Zaire the fourth largest source of terrestrial DOC into the ocean world-wide which
strongly emphasizes the role of Indonesian peat-draining rivers as source for
terrestrial DOC inputs into the ocean.
Acknowledgements We are grateful to all students and scientists from the University of Riau (Pekanbaru,
Sumatra) for their help during the expeditions. For dedicated help during field and
laboratory work we would like to thank Csilla Kovacs. Furthermore, we would like to
thank Venugopalan Ittekkot for his useful comments on the manuscript and Esther
Borell for proofreading. We are also thankful for financial support through the Federal
German Ministry for Education, Science, Research and Technology (BMBF, Bonn)
(Grant No. 03F0392C-ZMT).

82 Published and submitted papers
83
3. General conclusions
It was shown that the low nutrient concentrations measured in the Siak relative to
other rivers not only in Indonesia but world-wide may be attributed to leaching of
nutrient-poor peatlands. However an anthropogenically mediated increase in nutrient
concentrations, particularly in areas near cities, villages and industrial estates is
evident. In addition to domestic and industrial wastewater discharges the washout of
nitrogen fertilizers contributed significantly to the measured DIN concentrations in the
Siak. The comparison of nutrient data of the Siak and another peat-draining river in
South Sumatra, which was sampled prior to the main cultivation of oil palms in the
1970s, indicates that nutrient concentrations have increased in the Siak during the
last few decades.
Leaching of peatsoils was identified to be the major source of DOC in the Siak,
featuring concentrations that are among the highest reported world-wide. Leaching of
soils is assumed to be enhanced as a consequence of deforestation and drainage
activities in order to establish oil palm estates. However, such anthropogenic impacts
could not be quantified so far.
The decomposition of DOC was indicated to be the main factor controlling the
oxygen concentrations in the Siak. An increase in riverine DOC concentrations of
~15%, a likely result of enhanced soil leaching, would lead to anoxic conditions in the
river.
The DOC discharge of the Siak River into the estuary was calculated to be 0.38 ± 0.1
Tg C yr-1. Since the river estuary acts as additional DOC source, the DOC discharge
of the Siak into the coastal ocean accounts for 0.5 ± 0.3 Tg C yr-1. The DOC export of
the Siak and other peat-draining rivers increased the DOC concentration in the
Malacca Strait by ~130 μmol L-1 which results in a DOC flux ~6.4 Tg C yr-1 into the
Indian Ocean. Thus, the Malacca Strait presents after the Amazon, Yangtze and
Zaire the fourth largest contributor of terrestrial-derived DOC into the ocean. Based
on the DOC export of the Siak the annual DOC flux of Indonesian rivers was
extrapolated to be ~21 Tg C. Thus the DOC discharge of Indonesian rivers is
equivalent to the Amazon, the main contributor of terrestrial DOC (~26 Tg C yr-1)

84 General conclusions
(Ludwig et al., 1996), which underscores the relative importance of Indonesia in
terms of DOC input into the ocean.
85
4. Future perspectives
Problems that should be addressed in future studies in order to prove the results of
this thesis are briefly outlined below:
Verification of Indonesian riverine DOC export
The calculated DOC exports of Indonesian rivers and the Malacca Strait present the
first estimates of the contribution of Indonesia to the global DOC discharge into the
ocean so far. To specify these estimates, further Indonesian rivers should be
investigated in order to obtain additional data on the DOC export. Moreover, detailed
studies on the DOC dynamics in the Malacca Strait are needed.
Mixing of discharging blackwater with coastal waters that are enriched in suspended
matter may lead to the adsorption of DOC onto particles. If this is the case, coastal
oceans would act as a DOC sink where terrestrial DOC gets buried into sediments
rather than exported into the ocean. Possible trapping of DOC by suspended matter,
a potentially important process for the DOC export into the ocean, should be
therefore investigated in future campaigns.
Quantification of anthropogenic enhanced leaching
In order to quantify the anthropogenic impact on peatsoil leaching, comparative
studies should be carried out. Therefore blackwater rivers located in both disturbed
(drained, deforested, burned) and unaffected catchments should be investigated.
Although, the logistical realisation of such undertakings may be difficult, as oil palm
plantations, logging activities and fire clearance are spread over large scales in
Indonesia.
Investigation of further environmental consequences
The occurrence and extent of anoxic events in the Siak as well as their possible link
to periodic mass mortality of fish, which was observed downstream the city of
Pekanbaru, should be investigated during further expeditions.
Moreover, increased soil leaching and the aerobic decomposition of soil-carbon as a
consequence of intensive drainage lead to a destabilisation of peat and subsequent
86 Future perspectives
coastal erosion which may finally result in the loss of land and therefore has to be
quantified in the future.
As observed in March 2004, riverine nutrient concentrations were increased due to
fertilizers washed out of the soil. Due to the low abundance of primary producers in
the Siak, it is likely that substantial amounts of nutrients were transported into the
coastal ocean rather than being absorbed inside the river system. Thus the extent to
which high nutrient input causes eutrophic and even hypoxic conditions in the coastal
ocean should be investigated during further studies.
Lastly, consideration should be given to investigations addressing the effects of
climate change on the hydrological conditions and therefore the seasonalities in the
river system.
87
5. References
Aitkenhead, J.A., Hope, D., Billett, M.F., 1999. The relationship between dissolved
organic carbon in stream water and soil organic carbon pools at different spatial
scales. Hydrological Processes 13, 1289-1302.
Alvarez-Salgado, X.A., Miller, A.E.J., 1998. Dissolved organic carbon in a large
macrotidal estuary (the Humber, U.K.): behaviour during estuarine mixing. Marine
Pollution Bulletin 37, 216-224.
Angelsen, A., 1995. Shifting cultivation and "deforestation": A study from Indonesia.
World Development 23, 1713-1729.
Battin, T.J., 1998. Dissolved organic matter and its optical properties in a blackwater
tributary of the upper Orinoco river, Venezuela. Organic Geochemistry 28, 561-569.
Baum, A., Rixen, T., Samiaji, J., 2007. Relevance of peat draining rivers in central
Sumatra for riverine input of dissolved organic carbon into the ocean. Estuarine
Coastal and Shelf Science 73, 563-570.
Benson, B.B., Krause Jr., D., 1984. The concentration and isotopic fractionation of
oxygen dissolved in freshwater and seawater in equilibrium with the atmosphere.
Limnology and Oceanography 29, 620-632.
Billen, G., Garnier, J., 2007. River basin nutrient delivery to the coastal sea:
Assessing its potential to sustain new production of non-siliceous algae. Marine
Chemistry 106, 148-160.
Borges, A.V., Delille, B., Schiettecatte, L.-S., Gazeau, F., Abril, G., Frankignoulle, M.,
2004. Gas transfer velocities of CO2 in three European estuaries (Randers Fjord,
Scheldt, and Thames). Limnology and Oceanography 49, 1630 - 1641.
88 References
Bouwman, A.F., Van Drecht, G., Knoop, J.M., Beusen, A.H.W., Meinardi, C.R., 2005.
Exploring changes in river nitrogen export to the world's oceans. Global
Biogeochemical Cycles 19.
Cameron, C., Esterle, J., S., Palmer, C.A., 1989. The geology, botany and chemistry
of selected peat-forming environments from temperate and tropical latitudes.
International Journal of Coal Geology 12, 105 - 156.
Carpenter, S.R., Caraco, N.F., Correll, D.L., Howarth, R.W., Sharpley, A.N., Smith,
V.H., 1998. Nonpoint pollution of surface waters with phosphorus and nitrogen.
Ecological Applications 8, 559-568.
Cauwet, G., 2002. DOM in the Coastal Zone. In: Hansell, D.A., Carlson, C.A. (Eds.),
Biogeochemistry of Marine Dissolved Organic Matter. Academic Press, San Diego,
pp. 579-609.
Degens, E.T., Kempe, S., Richey, J.E., 1991. Summary: Biogeochemistry of Major
World Rivers. In: Degens, E.T., Kempe, S., Richey, J.E. (Eds.), Biogeochemistry of
Major World Rivers. John Wiley & Sons, New York, pp. 323-347.
Devol , A.H., Quay, P.D., Richey, J.E., Martinelli, L.A., , 1987. The role of gas
exchange in the inorganic carbon, oxygen, and 222Rn budgets of the Amazon River.
Limnology and Oceanography 32, 235 - 248.
Diaz, R.J., 2001. Overview of hypoxia around the world. Journal of Environmental
Quality 30, 275 -281.
Dillon, P.J., Molot, L.A., 1997. Effect of landscape form on export of dissolved
organic carbon, iron, and phosphorus from forested stream catchments. Water
Resources Research 33, 2591-2600.
Dittmar, T., Fitznar, H.P., Kattner, G., 2001. Origin and biogeochemical cycling of
organic nitrogen in the eastern Arctic Ocean as evident from D- and L-amino acids.
Geochimica and Cosmochimica Acta 65, 4103-4114.
References 89
Dittmar, T., Hertkorn, N., Kattner, G., Lara, R., 2006. Mangroves, a major source of
dissolved organic carbon to the oceans. Global Biogeochemical Cycles 20,
doi:10.1029/2005GB002570.
Dumont, E., Harrison, J.A., Kroeze, C., Bakker, E.J., Seitzinger, S.P., 2005. Global
distribution and sources of dissolved inorganic nitrogen export to the coastal zone:
Results from a spatially explicit, global model. Global Biogeochemical Cycles [Global
Biogeochem. Cycles] 19, no.
DWD, 2006. monthly precipitation (monitoring) product (1.0° gridcells), Volume 2006:
Offenbach am Main, Global Precipitation Climatology Centre, Deutscher
Wetterdienst.
Ertel, J.R., Hedges, J.I., Devol, A.H., Richey, J.E., de Nazare Goes Ribeiro, M.,
1986. Dissolved humic substances of the Amazon River system. Limnology and
Oceanography 31, 739-754.
FAO/UNESCO, 2003. Digital soil map of the world and derived soil properties.
Fitznar, H.P., 1999. D-Amino acids as tracers for biogeochemical processes in the
river-shelf-ocean-system of the Arctic. Alfred-Wegener-Institut für Polar- und
Meeresforschung, Bremerhaven, 116 pp.
Freeman, C., Evans, C.D., Monteith, D.T., Reynolds, B., Fenner, N., 2001. Export of
organic carbon from peat soils. Nature 412, 785-785.
Freeman, C., Fenner, N., Ostle, N.J., Kang, H., Dowrick, D.J., Reynolds, B., Lock,
M.A., Sleep, D., Hughes, S., Hudson, J., 2004. Export of dissolved organic carbon
from peatlands under elevated carbon dioxide levels. Nature 430, 195-198.
GPCC, 2005. Global Precipitation Climatology Centre: Offenbach, Deutscher
Wetterdienst.
90 References
Grasshoff, K., 1999. Methods of Seawater Analysis Verlag Chemie, Weinheim, 600
pp.
Guerin, F., Abril, G., Serca, D., Delon, C., Richard, S., Delmas, R., Tremblay, A.,
Varfalvy, L., 2007. Gas transfer velocities of CO2 and CH4 in a tropical reservoir and
its river downstream. Journal of Marine Systems 66, 161-172.
Hamilton, S.K., Sippel, S.J., Calheiros, D.F., Melack, J.M., 1997. An anoxic event
and other biogeochemical effects of the Pantanal wetland on the Paraguay River.
Limnology and Oceanography 42, 257-272.
Hansell, D.A., 2002. DOC in the Global Ocean Carbon Cycle. In: Hansell, D.A.,
Carlson, C.A. (Eds.), Biogeochemistry of Marine Dissolved Organic Matter. Academic
Press, pp. 774.
Hansell, D.A., Carlson, C.A., 1998. Net community production of dissolved organic
carbon. Global Biogeochemical Cycles 12, 443-453.
Hansell, D.A., Carlson, C.A., 2002. Preface. In: Hansell, D.A., Carlson, C.A. (Eds.),
Biogeochemistry of Marine Dissolved Organic Matter. Academic Press, San Diego,
pp. 774.
Hansell, D.A., Kadko, D., Bates, N.R., 2004. Degradation of Terrigenous Dissolved
Organic Carbon in the Western Arctic Ocean. Science 304, 858-861.
Harrison, J., Caraco, N.F., Seitzinger, S.P., 2005. Global pattern and sources of
dissolved organic matter export to the coastal zone: Results from a spatially explicit,
global model. Global Biogeochemical Cycles 19.
Hedges, J.I., Cowie, G.L., Richey, J.E., Quay, P.D., 1994. Origins and processing of
organic matter in the Amazon River as indicated by carbohydrates and amino acids.
Limnology and Oceanography 39, 743-761.
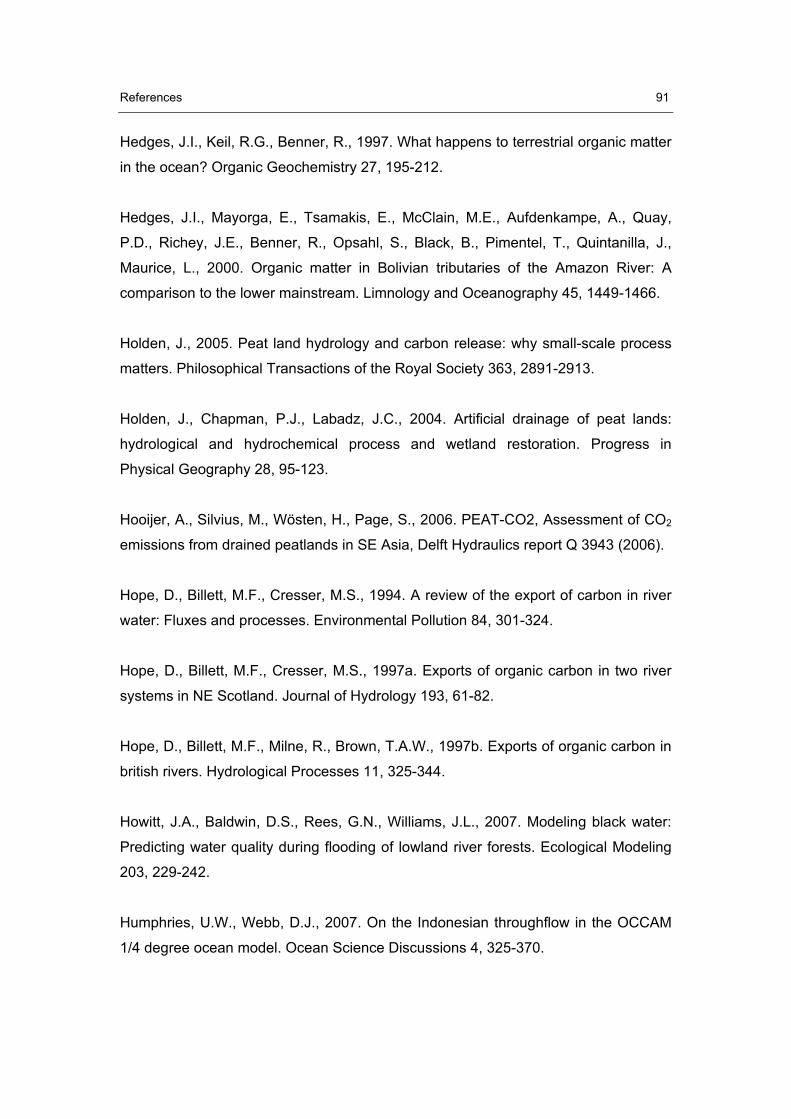
References 91
Hedges, J.I., Keil, R.G., Benner, R., 1997. What happens to terrestrial organic matter
in the ocean? Organic Geochemistry 27, 195-212.
Hedges, J.I., Mayorga, E., Tsamakis, E., McClain, M.E., Aufdenkampe, A., Quay,
P.D., Richey, J.E., Benner, R., Opsahl, S., Black, B., Pimentel, T., Quintanilla, J.,
Maurice, L., 2000. Organic matter in Bolivian tributaries of the Amazon River: A
comparison to the lower mainstream. Limnology and Oceanography 45, 1449-1466.
Holden, J., 2005. Peat land hydrology and carbon release: why small-scale process
matters. Philosophical Transactions of the Royal Society 363, 2891-2913.
Holden, J., Chapman, P.J., Labadz, J.C., 2004. Artificial drainage of peat lands:
hydrological and hydrochemical process and wetland restoration. Progress in
Physical Geography 28, 95-123.
Hooijer, A., Silvius, M., Wösten, H., Page, S., 2006. PEAT-CO2, Assessment of CO2
emissions from drained peatlands in SE Asia, Delft Hydraulics report Q 3943 (2006).
Hope, D., Billett, M.F., Cresser, M.S., 1994. A review of the export of carbon in river
water: Fluxes and processes. Environmental Pollution 84, 301-324.
Hope, D., Billett, M.F., Cresser, M.S., 1997a. Exports of organic carbon in two river
systems in NE Scotland. Journal of Hydrology 193, 61-82.
Hope, D., Billett, M.F., Milne, R., Brown, T.A.W., 1997b. Exports of organic carbon in
british rivers. Hydrological Processes 11, 325-344.
Howitt, J.A., Baldwin, D.S., Rees, G.N., Williams, J.L., 2007. Modeling black water:
Predicting water quality during flooding of lowland river forests. Ecological Modeling
203, 229-242.
Humphries, U.W., Webb, D.J., 2007. On the Indonesian throughflow in the OCCAM
1/4 degree ocean model. Ocean Science Discussions 4, 325-370.
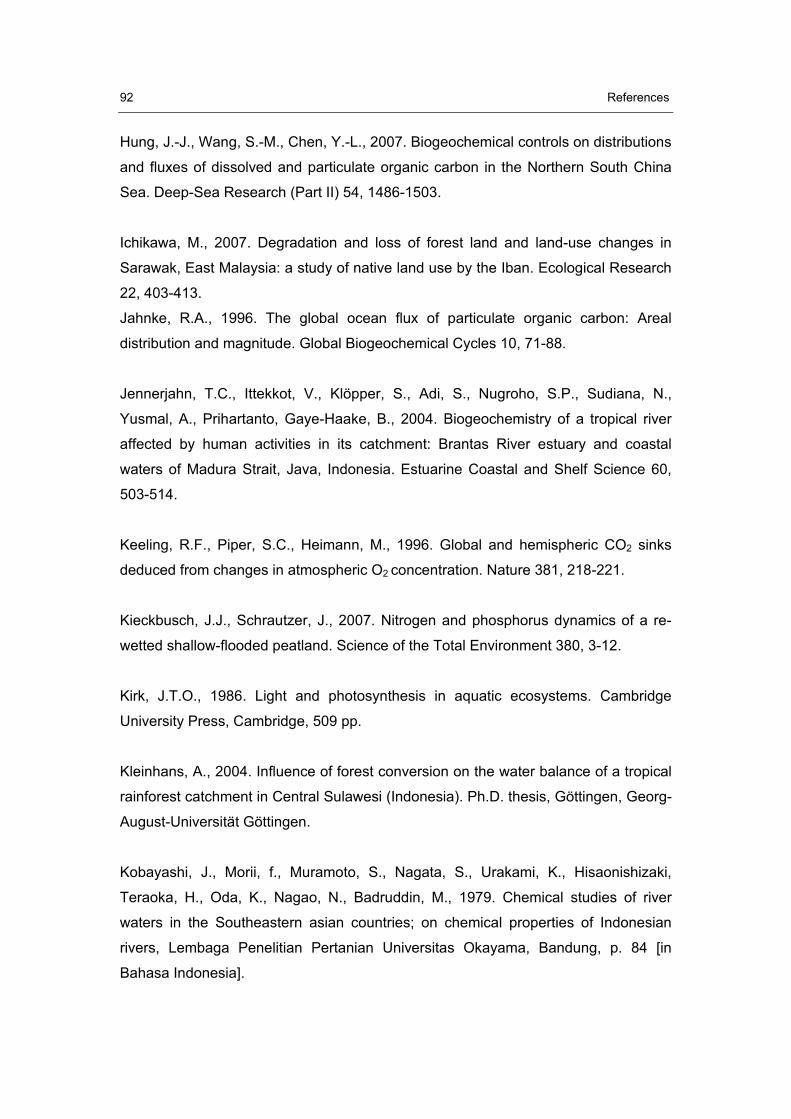
92 References
Hung, J.-J., Wang, S.-M., Chen, Y.-L., 2007. Biogeochemical controls on distributions
and fluxes of dissolved and particulate organic carbon in the Northern South China
Sea. Deep-Sea Research (Part II) 54, 1486-1503.
Ichikawa, M., 2007. Degradation and loss of forest land and land-use changes in
Sarawak, East Malaysia: a study of native land use by the Iban. Ecological Research
22, 403-413.
Jahnke, R.A., 1996. The global ocean flux of particulate organic carbon: Areal
distribution and magnitude. Global Biogeochemical Cycles 10, 71-88.
Jennerjahn, T.C., Ittekkot, V., Klöpper, S., Adi, S., Nugroho, S.P., Sudiana, N.,
Yusmal, A., Prihartanto, Gaye-Haake, B., 2004. Biogeochemistry of a tropical river
affected by human activities in its catchment: Brantas River estuary and coastal
waters of Madura Strait, Java, Indonesia. Estuarine Coastal and Shelf Science 60,
503-514.
Keeling, R.F., Piper, S.C., Heimann, M., 1996. Global and hemispheric CO2 sinks
deduced from changes in atmospheric O2 concentration. Nature 381, 218-221.
Kieckbusch, J.J., Schrautzer, J., 2007. Nitrogen and phosphorus dynamics of a re-
wetted shallow-flooded peatland. Science of the Total Environment 380, 3-12.
Kirk, J.T.O., 1986. Light and photosynthesis in aquatic ecosystems. Cambridge
University Press, Cambridge, 509 pp.
Kleinhans, A., 2004. Influence of forest conversion on the water balance of a tropical
rainforest catchment in Central Sulawesi (Indonesia). Ph.D. thesis, Göttingen, Georg-
August-Universität Göttingen.
Kobayashi, J., Morii, f., Muramoto, S., Nagata, S., Urakami, K., Hisaonishizaki,
Teraoka, H., Oda, K., Nagao, N., Badruddin, M., 1979. Chemical studies of river
waters in the Southeastern asian countries; on chemical properties of Indonesian
rivers, Lembaga Penelitian Pertanian Universitas Okayama, Bandung, p. 84 [in
Bahasa Indonesia].
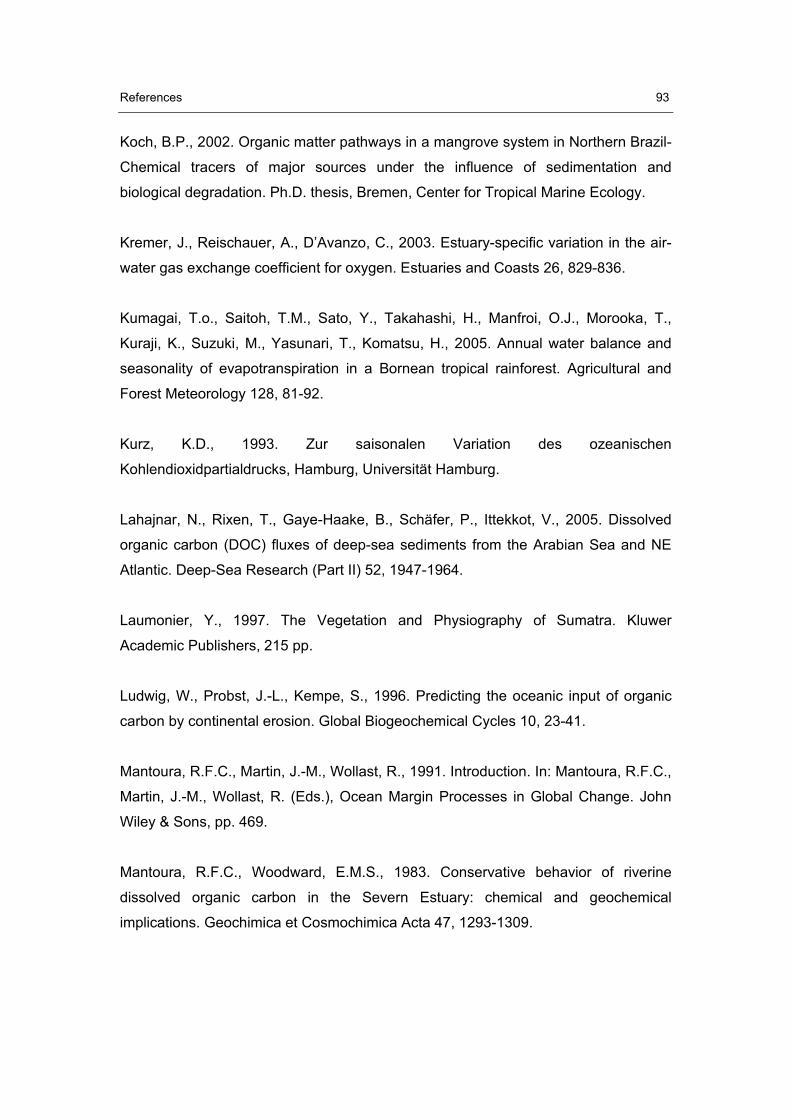
References 93
Koch, B.P., 2002. Organic matter pathways in a mangrove system in Northern Brazil-
Chemical tracers of major sources under the influence of sedimentation and
biological degradation. Ph.D. thesis, Bremen, Center for Tropical Marine Ecology.
Kremer, J., Reischauer, A., D’Avanzo, C., 2003. Estuary-specific variation in the air-
water gas exchange coefficient for oxygen. Estuaries and Coasts 26, 829-836.
Kumagai, T.o., Saitoh, T.M., Sato, Y., Takahashi, H., Manfroi, O.J., Morooka, T.,
Kuraji, K., Suzuki, M., Yasunari, T., Komatsu, H., 2005. Annual water balance and
seasonality of evapotranspiration in a Bornean tropical rainforest. Agricultural and
Forest Meteorology 128, 81-92.
Kurz, K.D., 1993. Zur saisonalen Variation des ozeanischen
Kohlendioxidpartialdrucks, Hamburg, Universität Hamburg.
Lahajnar, N., Rixen, T., Gaye-Haake, B., Schäfer, P., Ittekkot, V., 2005. Dissolved
organic carbon (DOC) fluxes of deep-sea sediments from the Arabian Sea and NE
Atlantic. Deep-Sea Research (Part II) 52, 1947-1964.
Laumonier, Y., 1997. The Vegetation and Physiography of Sumatra. Kluwer
Academic Publishers, 215 pp.
Ludwig, W., Probst, J.-L., Kempe, S., 1996. Predicting the oceanic input of organic
carbon by continental erosion. Global Biogeochemical Cycles 10, 23-41.
Mantoura, R.F.C., Martin, J.-M., Wollast, R., 1991. Introduction. In: Mantoura, R.F.C.,
Martin, J.-M., Wollast, R. (Eds.), Ocean Margin Processes in Global Change. John
Wiley & Sons, pp. 469.
Mantoura, R.F.C., Woodward, E.M.S., 1983. Conservative behavior of riverine
dissolved organic carbon in the Severn Estuary: chemical and geochemical
implications. Geochimica et Cosmochimica Acta 47, 1293-1309.
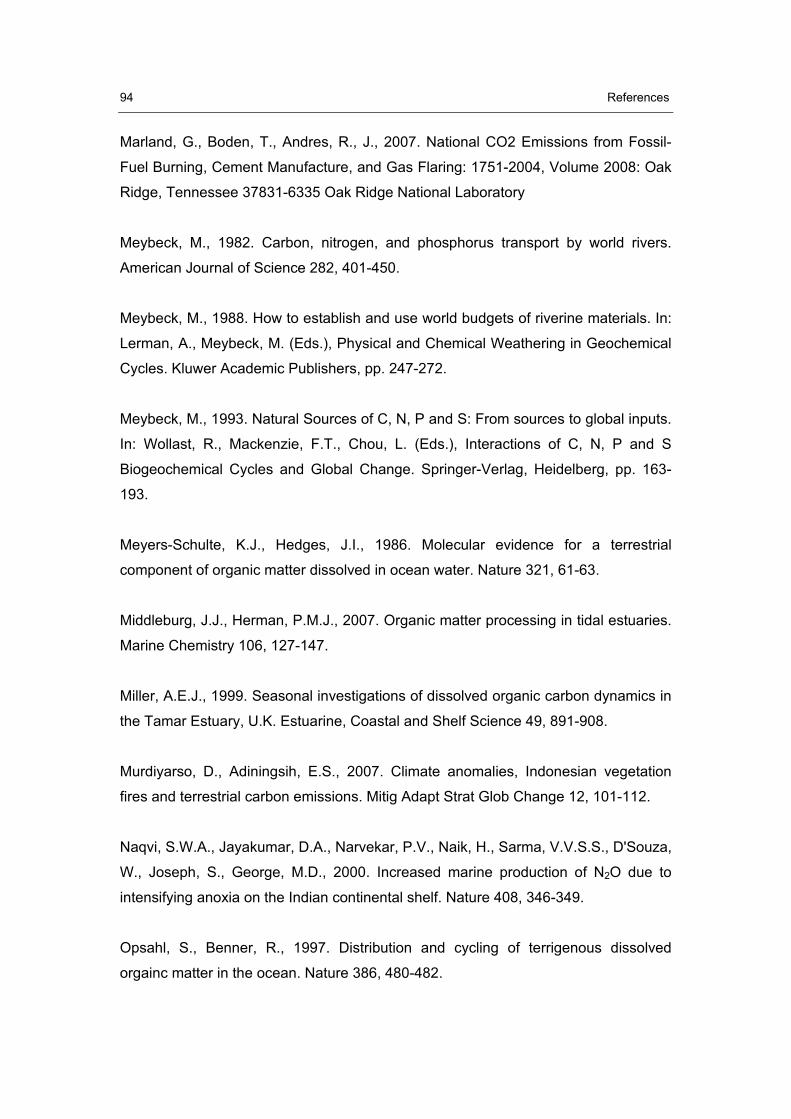
94 References
Marland, G., Boden, T., Andres, R., J., 2007. National CO2 Emissions from Fossil-
Fuel Burning, Cement Manufacture, and Gas Flaring: 1751-2004, Volume 2008: Oak
Ridge, Tennessee 37831-6335 Oak Ridge National Laboratory
Meybeck, M., 1982. Carbon, nitrogen, and phosphorus transport by world rivers.
American Journal of Science 282, 401-450.
Meybeck, M., 1988. How to establish and use world budgets of riverine materials. In:
Lerman, A., Meybeck, M. (Eds.), Physical and Chemical Weathering in Geochemical
Cycles. Kluwer Academic Publishers, pp. 247-272.
Meybeck, M., 1993. Natural Sources of C, N, P and S: From sources to global inputs.
In: Wollast, R., Mackenzie, F.T., Chou, L. (Eds.), Interactions of C, N, P and S
Biogeochemical Cycles and Global Change. Springer-Verlag, Heidelberg, pp. 163-
193.
Meyers-Schulte, K.J., Hedges, J.I., 1986. Molecular evidence for a terrestrial
component of organic matter dissolved in ocean water. Nature 321, 61-63.
Middleburg, J.J., Herman, P.M.J., 2007. Organic matter processing in tidal estuaries.
Marine Chemistry 106, 127-147.
Miller, A.E.J., 1999. Seasonal investigations of dissolved organic carbon dynamics in
the Tamar Estuary, U.K. Estuarine, Coastal and Shelf Science 49, 891-908.
Murdiyarso, D., Adiningsih, E.S., 2007. Climate anomalies, Indonesian vegetation
fires and terrestrial carbon emissions. Mitig Adapt Strat Glob Change 12, 101-112.
Naqvi, S.W.A., Jayakumar, D.A., Narvekar, P.V., Naik, H., Sarma, V.V.S.S., D'Souza,
W., Joseph, S., George, M.D., 2000. Increased marine production of N2O due to
intensifying anoxia on the Indian continental shelf. Nature 408, 346-349.
Opsahl, S., Benner, R., 1997. Distribution and cycling of terrigenous dissolved
orgainc matter in the ocean. Nature 386, 480-482.
References 95
Paerl, H.W., 2006. Assessing and managing nutrient-enhanced eutrophication in
estuarine and coastal waters: Interactive effects of human and climatic perturbations.
Ecological Engineering 26, 40-54.
Page, S.E., Rieley, J.O., 1998. Tropical Peatlands: A review of their natural resource
functions, with particular reference to southeast asia. International Peat Journal 8,
95-106.
Page, S.E., Rieley, J.O., Shotyk, O.W., Weiss, D., 1999. Interdependence of peat
and vegetation in a tropical peat swamp forest. Philosophical Transactions: Biological
Sciences 354, 1885-1897.
Page, S.E., Siegert, F., Rieley, J.O., Boehm, H.-D.V., Jaya, A., Limin, S., 2002. The
amount of carbon released from peat and forest fires in Indonesia during 1997.
Nature 420, 61-65.
Patel, N., Mounier, S., Guyot, J.L., Benamou, C., Benaim, J.Y., 1999. Fluxes of
dissolved and colloidal organic carbon, along the Purus and Amazonas rivers
(Brazil). The Science of the Total Environment 229, 53-64.
Pohlmann, T., 2006. A meso-scale model of the central and southern North Sea:
consequences of an improved resolution. . Continental Shelf Research 26, 2367 -
2385.
Post, W.M., Emanuel, W.R., Zinke, P.J., Stangenberger, A.G., 1982. Soil carbon
pools and world life zones. Nature 298, 156-159.
Putri, M.R., Pohlmann, T., submitted. Hydrodynamic and Transport Model of the Siak
Estuary. Asian Journal of Water, Environment and Pollution.
Rabalais, N., N., 1999. Changes in Mississippi river nutrient fluxes and
consequences for the northern Gulf of Mexico coastal ecosystem. LOIZ Newsletter
13, 1-3.
96 References
Rabouille, C., Mackenzie, F.T., Ver, L.M., 2001. Influence of the human perturbation
on carbon, nitrogen, and oxygen biogeochemical cycles in the global coastal ocean.
Geochimica and Cosmochimica Acta 65, 3615-3641.
Raymond, P., Cole, J., 2001. Gas exchange in rivers and estuaries: Choosing a gas
transfer velocity. Estuaries and Coasts 24, 312-317.
Reddy, K.R., D'Angelo, E.M., 1990. Biomass yield and nutrient removal by water
hyacinth (Eichhornia crassipes) as influenced by harvesting frequency. Biomass 21,
27-42.
Reddy, K.R., D'Angelo, E.M., 1994. Soil processes regulating water quality in
wetlands. In: Mitsch, W.J. ed., Global Wetlands: old world and new. Elsevier,
Amsterdam, pp. 967.
Richey, J.E., Hedges, J.I., Devol, A.H., Quay, P.D., Victoria, R.L., Martinelli, L.A.,
Forsberg, B.R., 1990. Biogeochemistry of carbon in the Amazon River. Limnology
and Oceanography 35, 352-371.
Richey, J.E., Victoria, R.L., Salati, E., Forsberg, B.R., 1991. The Biogeochemistry of
a Major River System: The Amazon Case Study. In: Degens, E.T., Kempe, S.,
Richey, J.E. (Eds.), Biogeochemistry of Major World Rivers. pp. 57-74.
Rieley, J.O., Ahmad-Shah, A.A., Brady, M.A., 1996a. The extent and nature of
tropical peat swamps. In: Maltby, E., Immirzi, C.P., Safford, R.J. (Eds.), Tropical
Lowland Peatlands of Southeast Asia. IUCN, Gland, pp. 17-53.
Rieley, J.O., Page, S.E., Setiadi, B., 1996b. Distribution of peatlands in Indonesia,
Global Peat Resources. International Peat Society, pp. 169-178.
Rieley, J.O., Setiadi, B., 1997. Role of tropical peatlands in global carbon balance:
preliminary findings from the high peats of Central Kalimantan, Indonesia. Alami 2,
52-56.
References 97
Rixen, T., Baum, A., Pohlmann, T., Balzer, W., Samiaji, J., Jose, C., submitted. The
Siak, a tropical blackwater river in Central Sumatra on the verge to anoxia.
Ropelewski, C.F., Halpert, M.S., 1987. Global and regional scale precipitation
patterns associated with El Nino/Southern Oscillation. Monthly Weather Review 115,
1606-1626.
Siegel, H., Stottmeister, I., Reißmann, J., Gerth, M., Samiaji, J., submitted. Siak River
System - East-Sumatra, Characterisation of sources, estuarine processes, and
discharge into the Malacca Strait. Journal of Marine Systems.
Sorensen, K.W., 1993. Indonesian peat swamp forests and their role as a carbon
sink. Chemosphere 27, 1065-1082.
Spencer, R.G.M., Ahad, J.M.E., Baker, A., Cowie, G.L., Ganeshram, R., Upstill-
Goddard, R.C., Uher, G., 2007. The estuarine mixing behaviour of peatland derived
dissolved organic carbon and its relationship to chromophoric dissolved organic
matter in two North Sea estuaries (U.K.). Estuarine Coastal and Shelf Science 74,
131-144.
Syvitski, J.P.M., Vörösmarty, C.J., Kettner, A.J., Green, P., 2005. Impact of Humans
on the Flux of Terrestrial Sediment to the Global Coastal Ocean. Science 308, 376-
380.
Tans, P., 2008. Trends in Atmospheric Carbon Dioxide - Mauna Loa,
NOAA/ESRL(www.esrl.noaa.gov/gmd/ccgg/trends/).
Tranvik, L.J., Jansson, M., 2002. Terrestrial export of organic carbon. Nature 415,
861-862.
Turner, R.E., Rabalais, N.N., 1994. Coastal eutrophication near the Mississippi river
delta. Nature 368, 619-621.
98 References
USGS, 2004. Global Land Cover Facility (GLCF) 30 Arc Second SRTM Elevation
Data: Maryland, University of Maryland.
Van Drecht, G., Bouwman, A.F., Knoop, J.M., Beusen, A.H.W., Meinardi, C.R., 2003.
Global modeling of the fate of nitrogen from point and nonpoint sources in soils,
groundwater, and surface water. Global Biogeochemical Cycles 17.
Vollenweider, R.A., 1992. Coastal marine eutrophication: principles and control.
Science of the Total Environment Supplement, 1-20.
Williams, P.M., Druffel, E.R.M., 1987. Radiocarbon in dissolved organic matter in the
central North Pacific Ocean. Nature 330, 246-248.
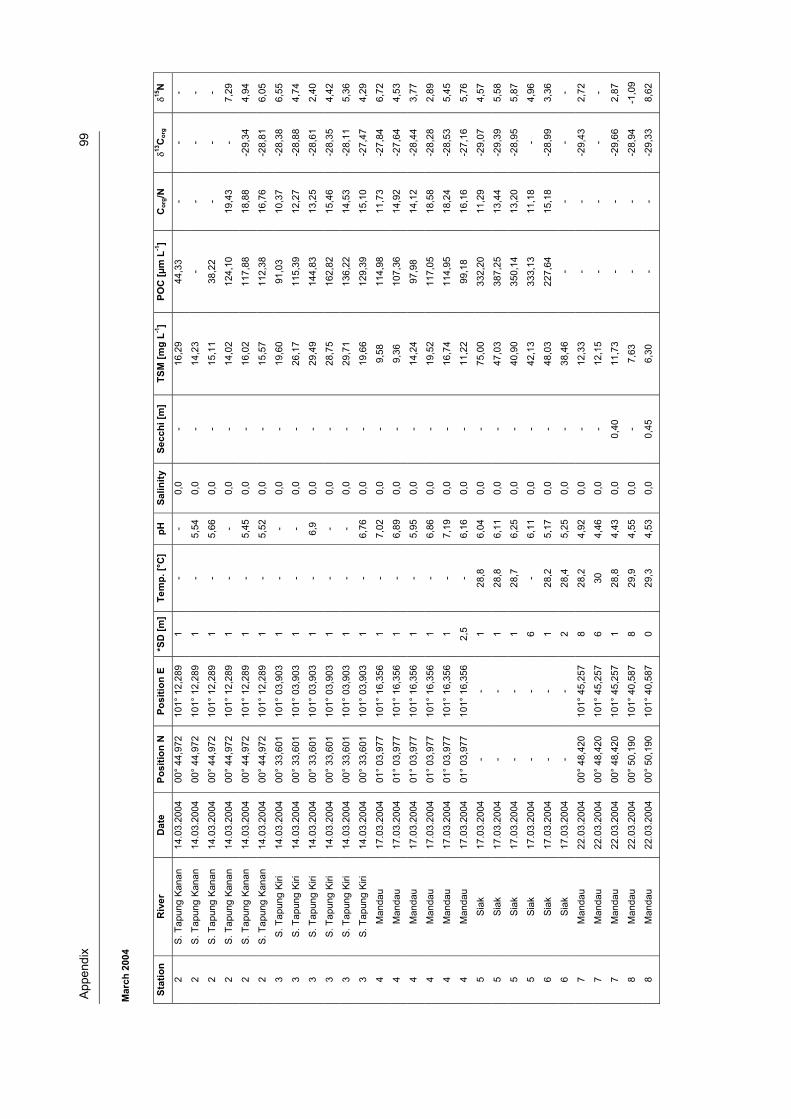
App
endi
x
99
Mar
ch 2
004
Stat
ion
Riv
er
Dat
e Po
sitio
n N
Po
sitio
n E
*SD
[m]
Tem
p. [°
C]
pH
Salin
ity
Secc
hi [m
] TS
M [m
g L-1
] PO
C [μ
m L
-1]
Cor
g/N
�13C
org
�15N
2 S.
Tap
ung
Kana
n 14
.03.
2004
00
° 44
,972
10
1° 1
2,28
9 1
- -
0,0
- 16
,29
44,3
3 -
- -
2 S.
Tap
ung
Kana
n 14
.03.
2004
00
° 44
,972
10
1° 1
2,28
9 1
- 5,
54
0,0
- 14
,23
- -
- -
2 S.
Tap
ung
Kana
n 14
.03.
2004
00
° 44
,972
10
1° 1
2,28
9 1
- 5,
66
0,0
- 15
,11
38,2
2 -
- -
2 S.
Tap
ung
Kana
n 14
.03.
2004
00
° 44
,972
10
1° 1
2,28
9 1
- -
0,0
- 14
,02
124,
10
19,4
3 -
7,29
2 S.
Tap
ung
Kana
n 14
.03.
2004
00
° 44
,972
10
1° 1
2,28
9 1
- 5,
45
0,0
- 16
,02
117,
88
18,8
8 -2
9,34
4,
94
2 S.
Tap
ung
Kana
n 14
.03.
2004
00
° 44
,972
10
1° 1
2,28
9 1
- 5,
52
0,0
- 15
,57
112,
38
16,7
6 -2
8,81
6,
05
3 S.
Tap
ung
Kiri
14.0
3.20
04
00°
33,6
01
101°
03,
903
1 -
- 0,
0 -
19,6
0 91
,03
10,3
7 -2
8,38
6,
55
3 S.
Tap
ung
Kiri
14.0
3.20
04
00°
33,6
01
101°
03,
903
1 -
- 0,
0 -
26,1
7 11
5,39
12
,27
-28,
88
4,74
3 S.
Tap
ung
Kiri
14.0
3.20
04
00°
33,6
01
101°
03,
903
1 -
6,9
0,0
- 29
,49
144,
83
13,2
5 -2
8,61
2,
40
3 S.
Tap
ung
Kiri
14.0
3.20
04
00°
33,6
01
101°
03,
903
1 -
- 0,
0 -
28,7
5 16
2,82
15
,46
-28,
35
4,42
3 S.
Tap
ung
Kiri
14.0
3.20
04
00°
33,6
01
101°
03,
903
1 -
- 0,
0 -
29,7
1 13
6,22
14
,53
-28,
11
5,36
3 S.
Tap
ung
Kiri
14.0
3.20
04
00°
33,6
01
101°
03,
903
1 -
6,76
0,
0 -
19,6
6 12
9,39
15
,10
-27,
47
4,29
4 M
anda
u 17
.03.
2004
01
° 03
,977
10
1° 1
6,35
6 1
- 7,
02
0,0
- 9,
58
114,
98
11,7
3 -2
7,84
6,
72
4 M
anda
u 17
.03.
2004
01
° 03
,977
10
1° 1
6,35
6 1
- 6,
89
0,0
- 9,
36
107,
36
14,9
2 -2
7,64
4,
53
4 M
anda
u 17
.03.
2004
01
° 03
,977
10
1° 1
6,35
6 1
- 5,
95
0,0
- 14
,24
97,9
8 14
,12
-28,
44
3,77
4 M
anda
u 17
.03.
2004
01
° 03
,977
10
1° 1
6,35
6 1
- 6,
86
0,0
- 19
,52
117,
05
18,5
8 -2
8,28
2,
89
4 M
anda
u 17
.03.
2004
01
° 03
,977
10
1° 1
6,35
6 1
- 7,
19
0,0
- 16
,74
114,
95
18,2
4 -2
8,53
5,
45
4 M
anda
u 17
.03.
2004
01
° 03
,977
10
1° 1
6,35
6 2,
5 -
6,16
0,
0 -
11,2
2 99
,18
16,1
6 -2
7,16
5,
76
5 Si
ak
17.0
3.20
04
- -
1 28
,8
6,04
0,
0 -
75,0
0 33
2,20
11
,29
-29,
07
4,57
5 Si
ak
17.0
3.20
04
- -
1 28
,8
6,11
0,
0 -
47,0
3 38
7,25
13
,44
-29,
39
5,58
5 Si
ak
17.0
3.20
04
- -
1 28
,7
6,25
0,
0 -
40,9
0 35
0,14
13
,20
-28,
95
5,87
5 Si
ak
17.0
3.20
04
- -
6 -
6,11
0,
0 -
42,1
3 33
3,13
11
,18
- 4,
96
6 Si
ak
17.0
3.20
04
- -
1 28
,2
5,17
0,
0 -
48,0
3 22
7,64
15
,18
-28,
99
3,36
6 Si
ak
17.0
3.20
04
- -
2 28
,4
5,25
0,
0 -
38,4
6 -
- -
-
7 M
anda
u 22
.03.
2004
00
° 48
,420
10
1° 4
5,25
7 8
28,2
4,
92
0,0
- 12
,33
- -
-29,
43
2,72
7 M
anda
u 22
.03.
2004
00
° 48
,420
10
1° 4
5,25
7 6
30
4,46
0,
0 -
12,1
5 -
- -
-
7 M
anda
u 22
.03.
2004
00
° 48
,420
10
1° 4
5,25
7 1
28,8
4,
43
0,0
0,40
11
,73
- -
-29,
66
2,87
8 M
anda
u 22
.03.
2004
00
° 50
,190
10
1° 4
0,58
7 8
29,9
4,
55
0,0
- 7,
63
- -
-28,
94
-1,0
9
8 M
anda
u 22
.03.
2004
00
° 50
,190
10
1° 4
0,58
7 0
29,3
4,
53
0,0
0,45
6,
30
- -
-29,
33
8,62
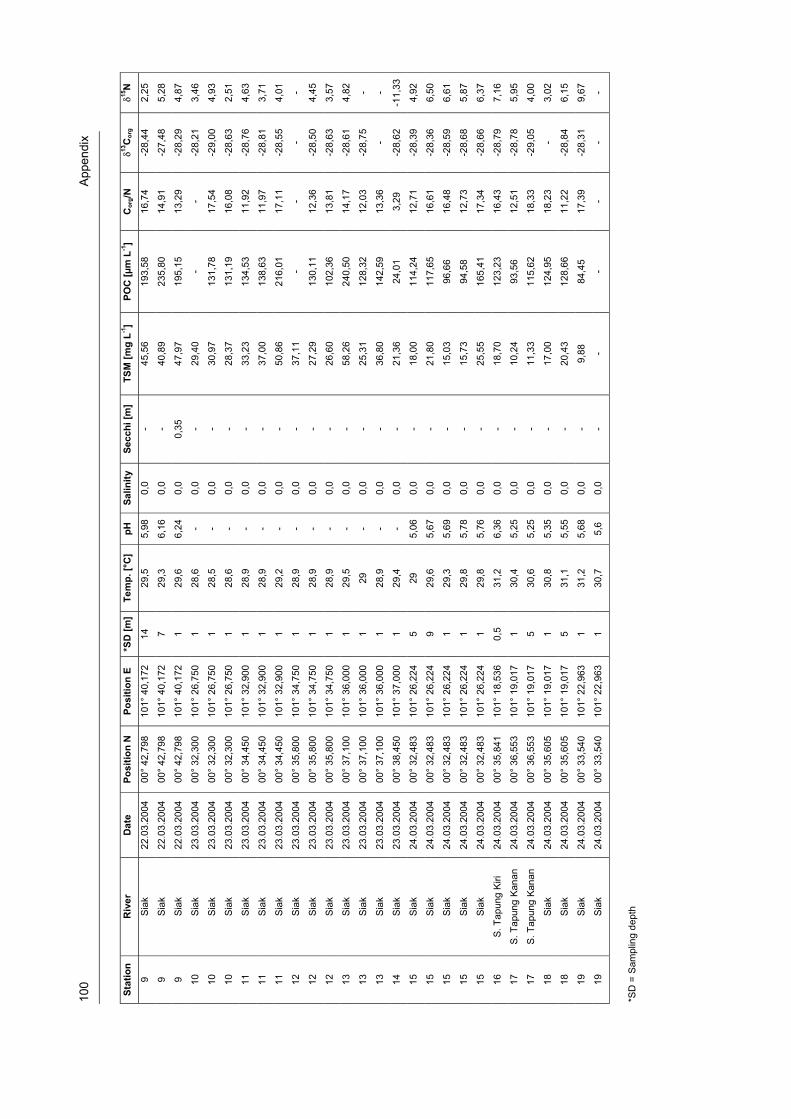
100
App
endi
x
Stat
ion
Riv
er
Dat
e Po
sitio
n N
Po
sitio
n E
*SD
[m]
Tem
p. [°
C]
pH
Salin
ity
Secc
hi [m
] TS
M [m
g L-1
] PO
C [μ
m L
-1]
Cor
g/N
�13C
org
�15N
9 Si
ak
22.0
3.20
04
00°
42,7
98
101°
40,
172
14
29,5
5,
98
0,0
- 45
,56
193,
58
16,7
4 -2
8,44
2,
25
9 Si
ak
22.0
3.20
04
00°
42,7
98
101°
40,
172
7 29
,3
6,16
0,
0 -
40,8
9 23
5,80
14
,91
-27,
48
5,28
9 Si
ak
22.0
3.20
04
00°
42,7
98
101°
40,
172
1 29
,6
6,24
0,
0 0,
35
47,9
7 19
5,15
13
,29
-28,
29
4,87
10
Siak
23
.03.
2004
00
° 32
,300
10
1° 2
6,75
0 1
28,6
-
0,0
- 29
,40
- -
-28,
21
3,46
10
Siak
23
.03.
2004
00
° 32
,300
10
1° 2
6,75
0 1
28,5
-
0,0
- 30
,97
131,
78
17,5
4 -2
9,00
4,
93
10
Siak
23
.03.
2004
00
° 32
,300
10
1° 2
6,75
0 1
28,6
-
0,0
- 28
,37
131,
19
16,0
8 -2
8,63
2,
51
11
Siak
23
.03.
2004
00
° 34
,450
10
1° 3
2,90
0 1
28,9
-
0,0
- 33
,23
134,
53
11,9
2 -2
8,76
4,
63
11
Siak
23
.03.
2004
00
° 34
,450
10
1° 3
2,90
0 1
28,9
-
0,0
- 37
,00
138,
63
11,9
7 -2
8,81
3,
71
11
Siak
23
.03.
2004
00
° 34
,450
10
1° 3
2,90
0 1
29,2
-
0,0
- 50
,86
216,
01
17,1
1 -2
8,55
4,
01
12
Siak
23
.03.
2004
00
° 35
,800
10
1° 3
4,75
0 1
28,9
-
0,0
- 37
,11
- -
- -
12
Siak
23
.03.
2004
00
° 35
,800
10
1° 3
4,75
0 1
28,9
-
0,0
- 27
,29
130,
11
12,3
6 -2
8,50
4,
45
12
Siak
23
.03.
2004
00
° 35
,800
10
1° 3
4,75
0 1
28,9
-
0,0
- 26
,60
102,
36
13,8
1 -2
8,63
3,
57
13
Siak
23
.03.
2004
00
° 37
,100
10
1° 3
6,00
0 1
29,5
-
0,0
- 58
,26
240,
50
14,1
7 -2
8,61
4,
82
13
Siak
23
.03.
2004
00
° 37
,100
10
1° 3
6,00
0 1
29
- 0,
0 -
25,3
1 12
8,32
12
,03
-28,
75
-
13
Siak
23
.03.
2004
00
° 37
,100
10
1° 3
6,00
0 1
28,9
-
0,0
- 36
,80
142,
59
13,3
6 -
-
14
Siak
23
.03.
2004
00
° 38
,450
10
1° 3
7,00
0 1
29,4
-
0,0
- 21
,36
24,0
1 3,
29
-28,
62
-11,
33
15
Siak
24
.03.
2004
00
° 32
,483
10
1° 2
6,22
4 5
29
5,06
0,
0 -
18,0
0 11
4,24
12
,71
-28,
39
4,92
15
Siak
24
.03.
2004
00
° 32
,483
10
1° 2
6,22
4 9
29,6
5,
67
0,0
- 21
,80
117,
65
16,6
1 -2
8,36
6,
50
15
Siak
24
.03.
2004
00
° 32
,483
10
1° 2
6,22
4 1
29,3
5,
69
0,0
- 15
,03
96,6
6 16
,48
-28,
59
6,61
15
Siak
24
.03.
2004
00
° 32
,483
10
1° 2
6,22
4 1
29,8
5,
78
0,0
- 15
,73
94,5
8 12
,73
-28,
68
5,87
15
Siak
24
.03.
2004
00
° 32
,483
10
1° 2
6,22
4 1
29,8
5,
76
0,0
- 25
,55
165,
41
17,3
4 -2
8,66
6,
37
16
S. T
apun
g Ki
ri 24
.03.
2004
00
° 35
,841
10
1° 1
8,53
6 0,
5 31
,2
6,36
0,
0 -
18,7
0 12
3,23
16
,43
-28,
79
7,16
17
S. T
apun
g Ka
nan
24.0
3.20
04
00°
36,5
53
101°
19,
017
1 30
,4
5,25
0,
0 -
10,2
4 93
,56
12,5
1 -2
8,78
5,
95
17
S. T
apun
g Ka
nan
24.0
3.20
04
00°
36,5
53
101°
19,
017
5 30
,6
5,25
0,
0 -
11,3
3 11
5,62
18
,33
-29,
05
4,00
18
Siak
24
.03.
2004
00
° 35
,605
10
1° 1
9,01
7 1
30,8
5,
35
0,0
- 17
,00
124,
95
18,2
3 -
3,02
18
Siak
24
.03.
2004
00
° 35
,605
10
1° 1
9,01
7 5
31,1
5,
55
0,0
- 20
,43
128,
66
11,2
2 -2
8,84
6,
15
19
Siak
24
.03.
2004
00
° 33
,540
10
1° 2
2,96
3 1
31,2
5,
68
0,0
- 9,
88
84,4
5 17
,39
-28,
31
9,67
19
Siak
24
.03.
2004
00
° 33
,540
10
1° 2
2,96
3 1
30,7
5,
6 0,
0 -
- -
- -
-
*SD
= S
ampl
ing
dept
h
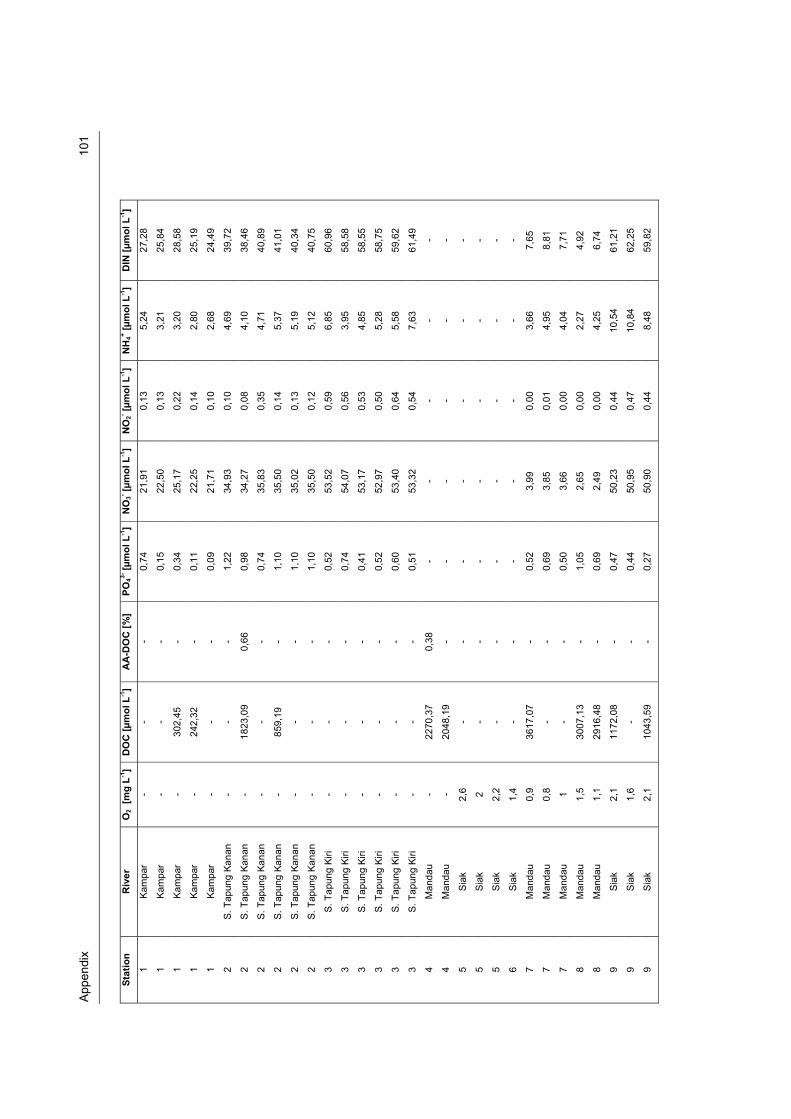
App
endi
x
1
01
Stat
ion
Riv
er
O2
[mg
L-1]
DO
C [μ
mol
L-1]
AA
-DO
C [%
] PO
43- [μ
mol
L-1
] N
O3- [μ
mol
L-1
] N
O2- [μ
mol
L-1
] N
H4+ [μ
mol
L-1]
DIN
[μm
ol L
-1]
1 Ka
mpa
r -
- -
0,74
21
,91
0,13
5,
24
27,2
8
1 Ka
mpa
r -
- -
0,15
22
,50
0,13
3,
21
25,8
4
1 Ka
mpa
r -
302,
45
- 0,
34
25,1
7 0,
22
3,20
28
,58
1 Ka
mpa
r -
242,
32
- 0,
11
22,2
5 0,
14
2,80
25
,19
1 Ka
mpa
r -
- -
0,09
21
,71
0,10
2,
68
24,4
9
2 S.
Tap
ung
Kana
n -
- -
1,22
34
,93
0,10
4,
69
39,7
2
2 S.
Tap
ung
Kana
n -
1823
,09
0,66
0,
98
34,2
7 0,
08
4,10
38
,46
2 S.
Tap
ung
Kana
n -
- -
0,74
35
,83
0,35
4,
71
40,8
9
2 S.
Tap
ung
Kana
n -
859,
19
- 1,
10
35,5
0 0,
14
5,37
41
,01
2 S.
Tap
ung
Kana
n -
- -
1,10
35
,02
0,13
5,
19
40,3
4
2 S.
Tap
ung
Kana
n -
- -
1,10
35
,50
0,12
5,
12
40,7
5
3 S.
Tap
ung
Kiri
- -
- 0,
52
53,5
2 0,
59
6,85
60
,96
3 S.
Tap
ung
Kiri
- -
- 0,
74
54,0
7 0,
56
3,95
58
,58
3 S.
Tap
ung
Kiri
- -
- 0,
41
53,1
7 0,
53
4,85
58
,55
3 S.
Tap
ung
Kiri
- -
- 0,
52
52,9
7 0,
50
5,28
58
,75
3 S.
Tap
ung
Kiri
- -
- 0,
60
53,4
0 0,
64
5,58
59
,62
3 S.
Tap
ung
Kiri
- -
- 0,
51
53,3
2 0,
54
7,63
61
,49
4 M
anda
u -
2270
,37
0,38
-
- -
- -
4 M
anda
u -
2048
,19
- -
- -
- -
5 Si
ak
2,6
- -
- -
- -
-
5 Si
ak
2 -
- -
- -
- -
5 Si
ak
2,2
- -
- -
- -
-
6 Si
ak
1,4
- -
- -
- -
-
7 M
anda
u 0,
9 36
17,0
7 -
0,52
3,
99
0,00
3,
66
7,65
7 M
anda
u 0,
8 -
- 0,
69
3,85
0,
01
4,95
8,
81
7 M
anda
u 1
- -
0,50
3,
66
0,00
4,
04
7,71
8 M
anda
u 1,
5 30
07,1
3 -
1,05
2,
65
0,00
2,
27
4,92
8 M
anda
u 1,
1 29
16,4
8 -
0,69
2,
49
0,00
4,
25
6,74
9 Si
ak
2,1
1172
,08
- 0,
47
50,2
3 0,
44
10,5
4 61
,21
9 Si
ak
1,6
- -
0,44
50
,95
0,47
10
,84
62,2
5
9 Si
ak
2,1
1043
,59
- 0,
27
50,9
0 0,
44
8,48
59
,82
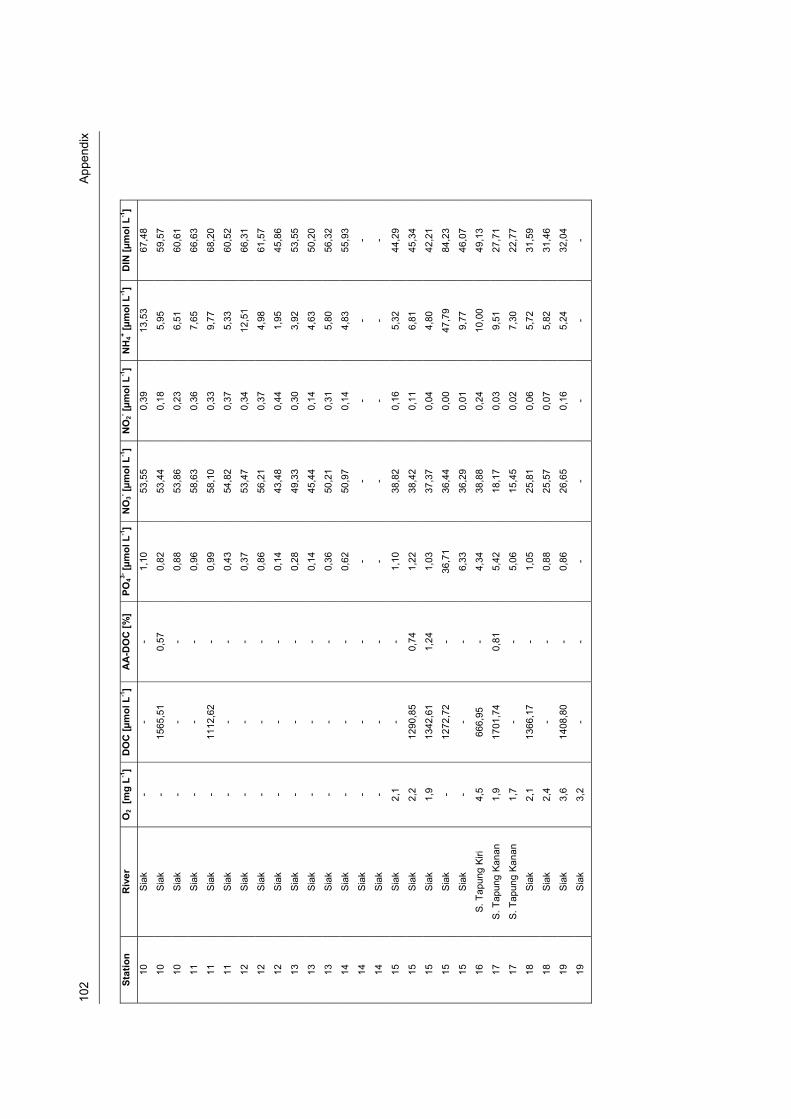
102
A
ppen
dix
Stat
ion
Riv
er
O2
[mg
L-1]
DO
C [μ
mol
L-1]
AA
-DO
C [%
] PO
43- [μ
mol
L-1
] N
O3- [μ
mol
L-1
] N
O2- [μ
mol
L-1
] N
H4+ [μ
mol
L-1]
DIN
[μm
ol L
-1]
10
Siak
-
- -
1,10
53
,55
0,39
13
,53
67,4
8
10
Siak
-
1565
,51
0,57
0,
82
53,4
4 0,
18
5,95
59
,57
10
Siak
-
- -
0,88
53
,86
0,23
6,
51
60,6
1
11
Siak
-
- -
0,96
58
,63
0,36
7,
65
66,6
3
11
Siak
-
1112
,62
- 0,
99
58,1
0 0,
33
9,77
68
,20
11
Siak
-
- -
0,43
54
,82
0,37
5,
33
60,5
2
12
Siak
-
- -
0,37
53
,47
0,34
12
,51
66,3
1
12
Siak
-
- -
0,86
56
,21
0,37
4,
98
61,5
7
12
Siak
-
- -
0,14
43
,48
0,44
1,
95
45,8
6
13
Siak
-
- -
0,28
49
,33
0,30
3,
92
53,5
5
13
Siak
-
- -
0,14
45
,44
0,14
4,
63
50,2
0
13
Siak
-
- -
0,36
50
,21
0,31
5,
80
56,3
2
14
Siak
-
- -
0,62
50
,97
0,14
4,
83
55,9
3
14
Siak
-
- -
- -
- -
-
14
Siak
-
- -
- -
- -
-
15
Siak
2,
1 -
- 1,
10
38,8
2 0,
16
5,32
44
,29
15
Siak
2,
2 12
90,8
5 0,
74
1,22
38
,42
0,11
6,
81
45,3
4
15
Siak
1,
9 13
42,6
1 1,
24
1,03
37
,37
0,04
4,
80
42,2
1
15
Siak
-
1272
,72
- 36
,71
36,4
4 0,
00
47,7
9 84
,23
15
Siak
-
- -
6,33
36
,29
0,01
9,
77
46,0
7
16
S. T
apun
g Ki
ri 4,
5 66
6,95
-
4,34
38
,88
0,24
10
,00
49,1
3
17
S. T
apun
g Ka
nan
1,9
1701
,74
0,81
5,
42
18,1
7 0,
03
9,51
27
,71
17
S. T
apun
g Ka
nan
1,7
- -
5,06
15
,45
0,02
7,
30
22,7
7
18
Siak
2,
1 13
66,1
7 -
1,05
25
,81
0,06
5,
72
31,5
9
18
Siak
2,
4 -
- 0,
88
25,5
7 0,
07
5,82
31
,46
19
Siak
3,
6 14
08,8
0 -
0,86
26
,65
0,16
5,
24
32,0
4
19
Siak
3,
2 -
- -
- -
- -
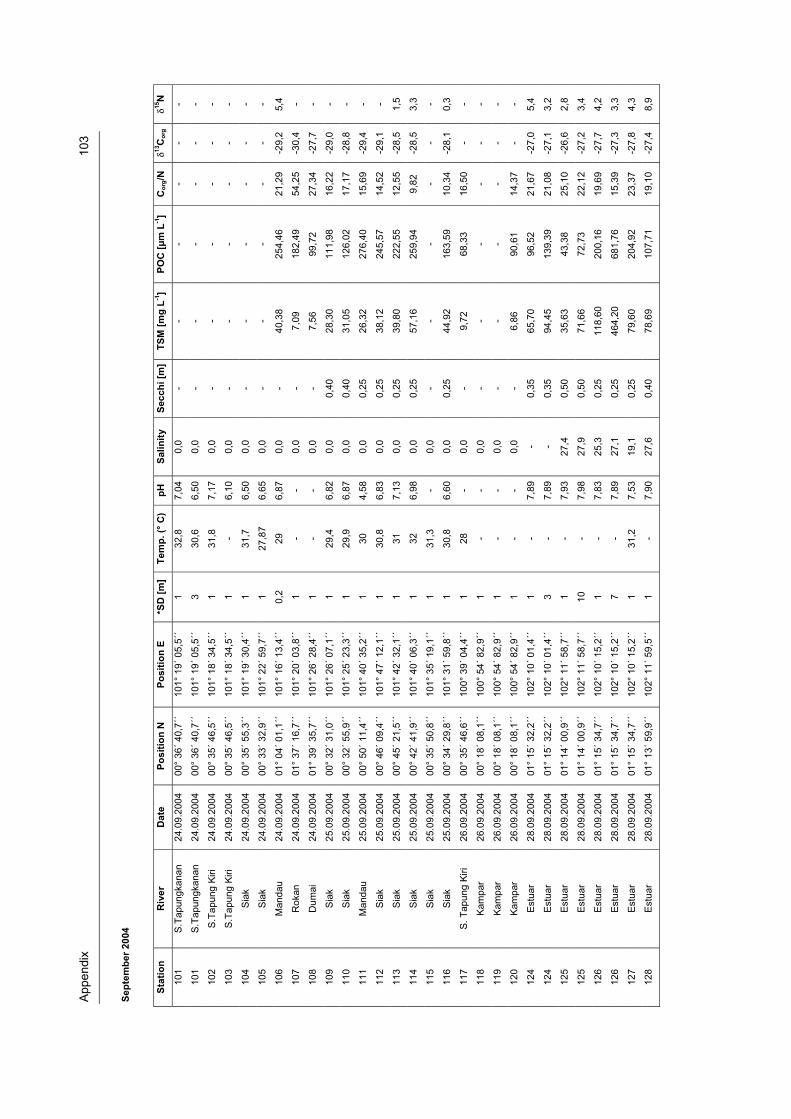
App
endi
x
1
03
Sept
embe
r 200
4
Stat
ion
Riv
er
Dat
e Po
sitio
n N
Po
sitio
n E
*SD
[m]
Tem
p. (°
C)
pH
Salin
ity
Secc
hi [m
]TS
M [m
g L-1
] PO
C [μ
m L
-1]
Cor
g/N
�13C
org
�15N
101
S.Ta
pung
kana
n 24
.09.
2004
00
° 36
´ 40,
7´´
101°
19´
05,
5´´
1 32
,8
7,04
0,0
- -
- -
- -
101
S.Ta
pung
kana
n 24
.09.
2004
00
° 36
´ 40,
7´´
101°
19´
05,
5´´
3 30
,6
6,50
0,0
- -
- -
- -
102
S.Ta
pung
Kiri
24
.09.
2004
00
° 35
´ 46,
5´´
101°
18´
34,
5´´
1 31
,8
7,17
0,0
- -
- -
- -
103
S.Ta
pung
Kiri
24
.09.
2004
00
° 35
´ 46,
5´´
101°
18´
34,
5´´
1 -
6,10
0,0
- -
- -
- -
104
Siak
24
.09.
2004
00
° 35
´ 55,
3´´
101°
19´
30,
4´´
1 31
,7
6,50
0,0
- -
- -
- -
105
Siak
24
.09.
2004
00
° 33
´ 32,
9´´
101°
22´
59,
7´´
1 27
,87
6,65
0,0
- -
- -
- -
106
Man
dau
24.0
9.20
04
01°
04´ 0
1,1´
´ 10
1° 1
6´ 1
3,4´
´ 0,
2 29
6,
870,
0 -
40,3
8 25
4,46
21
,29
-29,
2 5,
4
107
Rok
an
24.0
9.20
04
01°
37´ 1
6,7´
´ 10
1° 2
0´ 0
3,8´
´ 1
- -
0,0
- 7,
09
182,
49
54,2
5 -3
0,4
-
108
Dum
ai
24.0
9.20
04
01°
39´ 3
5,7´
´ 10
1° 2
6´ 2
8,4´
´ 1
- -
0,0
- 7,
56
99,7
2 27
,34
-27,
7 -
109
Siak
25
.09.
2004
00
° 32
´ 31,
0´´
101°
26´
07,
1´´
1 29
,4
6,82
0,0
0,40
28
,30
111,
98
16,2
2 -2
9,0
-
110
Siak
25
.09.
2004
00
° 32
´ 55,
9´´
101°
25´
23,
3´´
1 29
,9
6,87
0,0
0,40
31
,05
126,
02
17,1
7 -2
8,8
-
111
Man
dau
25.0
9.20
04
00°
50´ 1
1,4´
´ 10
1° 4
0´ 3
5,2´
´ 1
30
4,58
0,0
0,25
26
,32
276,
40
15,6
9 -2
9,4
-
112
Siak
25
.09.
2004
00
° 46
´ 09,
4´´
101°
47´
12,
1´´
1 30
,8
6,83
0,0
0,25
38
,12
245,
57
14,5
2 -2
9,1
-
113
Siak
25
.09.
2004
00
° 45
´ 21,
5´´
101°
42´
32,
1´´
1 31
7,
130,
0 0,
25
39,8
0 22
2,55
12
,55
-28,
5 1,
5
114
Siak
25
.09.
2004
00
° 42
´ 41,
9´´
101°
40´
06,
3´´
1 32
6,
980,
0 0,
25
57,1
6 25
9,94
9,
82
-28,
5 3,
3
115
Siak
25
.09.
2004
00
° 35
´ 50,
8´´
101°
35´
19,
1´´
1 31
,3
- 0,
0 -
- -
- -
-
116
Siak
25
.09.
2004
00
° 34
´ 29,
8´´
101°
31´
59,
8´´
1 30
,8
6,60
0,0
0,25
44
,92
163,
59
10,3
4 -2
8,1
0,3
117
S. T
apun
g Ki
ri 26
.09.
2004
00
° 35
´ 46,
6´´
100°
39´
04,
4´´
1 28
-
0,0
- 9,
72
68,3
3 16
,50
- -
118
Kam
par
26.0
9.20
04
00°
18´ 0
8,1´
´ 10
0° 5
4´ 8
2,9´
´ 1
- -
0,0
- -
- -
- -
119
Kam
par
26.0
9.20
04
00°
18´ 0
8,1´
´ 10
0° 5
4´ 8
2,9´
´ 1
- -
0,0
- -
- -
- -
120
Kam
par
26.0
9.20
04
00°
18´ 0
8,1´
´ 10
0° 5
4´ 8
2,9´
´ 1
- -
0,0
- 6,
86
90,6
1 14
,37
- -
124
Estu
ar
28.0
9.20
04
01°
15´ 3
2,2´
´ 10
2° 1
0´ 0
1,4´
´ 1
- 7,
89-
0,35
65
,70
96,5
2 21
,67
-27,
0 5,
4
124
Estu
ar
28.0
9.20
04
01°
15´ 3
2,2´
´ 10
2° 1
0´ 0
1,4´
´ 3
- 7,
89-
0,35
94
,45
139,
39
21,0
8 -2
7,1
3,2
125
Estu
ar
28.0
9.20
04
01°
14´ 0
0,9´
´ 10
2° 1
1´ 5
8,7´
´ 1
- 7,
9327
,4
0,50
35
,63
43,3
8 25
,10
-26,
6 2,
8
125
Estu
ar
28.0
9.20
04
01°
14´ 0
0,9´
´ 10
2° 1
1´ 5
8,7´
´ 10
-
7,98
27,9
0,
50
71,6
6 72
,73
22,1
2 -2
7,2
3,4
126
Estu
ar
28.0
9.20
04
01°
15´ 3
4,7´
´ 10
2° 1
0´ 1
5,2´
´ 1
- 7,
8325
,3
0,25
11
8,60
20
0,16
19
,69
-27,
7 4,
2
126
Estu
ar
28.0
9.20
04
01°
15´ 3
4,7´
´ 10
2° 1
0´ 1
5,2´
´ 7
- 7,
8927
,1
0,25
46
4,20
68
1,76
15
,39
-27,
3 3,
3
127
Estu
ar
28.0
9.20
04
01°
15´ 3
4,7´
´ 10
2° 1
0´ 1
5,2´
´ 1
31,2
7,
5319
,1
0,25
79
,60
204,
92
23,3
7 -2
7,8
4,3
128
Estu
ar
28.0
9.20
04
01°
13´ 5
9,9´
´ 10
2° 1
1´ 5
9,5´
´ 1
- 7,
9027
,6
0,40
78
,69
107,
71
19,1
0 -2
7,4
8,9
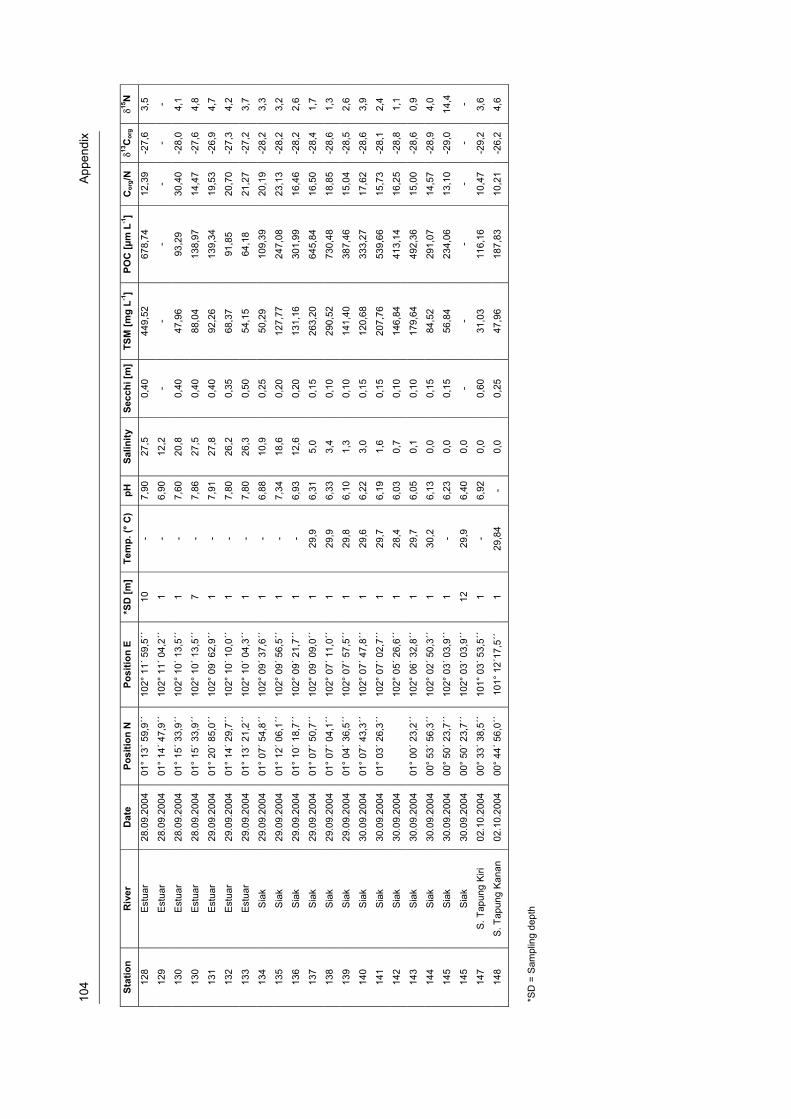
104
A
ppen
dix
Stat
ion
Riv
er
Dat
e Po
sitio
n N
Po
sitio
n E
*SD
[m]
Tem
p. (°
C)
pH
Salin
ity
Secc
hi [m
]TS
M [m
g L-1
] PO
C [μ
m L
-1]
Cor
g/N
�13C
org
�15N
128
Estu
ar
28.0
9.20
04
01°
13´ 5
9,9´
´ 10
2° 1
1´ 5
9,5´
´ 10
-
7,90
27,5
0,
40
449,
52
678,
74
12,3
9 -2
7,6
3,5
129
Estu
ar
28.0
9.20
04
01°
14´ 4
7,9´
´ 10
2° 1
1´ 0
4,2´
´ 1
- 6,
9012
,2
- -
- -
- -
130
Estu
ar
28.0
9.20
04
01°
15´ 3
3,9´
´ 10
2° 1
0´ 1
3,5´
´ 1
- 7,
6020
,8
0,40
47
,96
93,2
9 30
,40
-28,
0 4,
1
130
Estu
ar
28.0
9.20
04
01°
15´ 3
3,9´
´ 10
2° 1
0´ 1
3,5´
´ 7
- 7,
8627
,5
0,40
88
,04
138,
97
14,4
7 -2
7,6
4,8
131
Estu
ar
29.0
9.20
04
01°
20´ 8
5,0´
´ 10
2° 0
9´ 6
2,9´
´ 1
- 7,
9127
,8
0,40
92
,26
139,
34
19,5
3 -2
6,9
4,7
132
Estu
ar
29.0
9.20
04
01°
14´ 2
9,7´
´ 10
2° 1
0´ 1
0,0´
´ 1
- 7,
8026
,2
0,35
68
,37
91,8
5 20
,70
-27,
3 4,
2
133
Estu
ar
29.0
9.20
04
01°
13´ 2
1,2´
´ 10
2° 1
0´ 0
4,3´
´ 1
- 7,
8026
,3
0,50
54
,15
64,1
8 21
,27
-27,
2 3,
7
134
Siak
29
.09.
2004
01
° 07
´ 54,
8´´
102°
09´
37,
6´´
1 -
6,88
10,9
0,
25
50,2
9 10
9,39
20
,19
-28,
2 3,
3
135
Siak
29
.09.
2004
01
° 12
´ 06,
1´´
102°
09´
56,
5´´
1 -
7,34
18,6
0,
20
127,
77
247,
08
23,1
3 -2
8,2
3,2
136
Siak
29
.09.
2004
01
° 10
´ 18,
7´´
102°
09´
21,
7´´
1 -
6,93
12,6
0,
20
131,
16
301,
99
16,4
6 -2
8,2
2,6
137
Siak
29
.09.
2004
01
° 07
´ 50,
7´´
102°
09´
09,
0´´
1 29
,9
6,31
5,0
0,15
26
3,20
64
5,84
16
,50
-28,
4 1,
7
138
Siak
29
.09.
2004
01
° 07
´ 04,
1´´
102°
07´
11,
0´´
1 29
,9
6,33
3,4
0,10
29
0,52
73
0,48
18
,85
-28,
6 1,
3
139
Siak
29
.09.
2004
01
° 04
´ 36,
5´´
102°
07´
57,
5´´
1 29
,8
6,10
1,3
0,10
14
1,40
38
7,46
15
,04
-28,
5 2,
6
140
Siak
30
.09.
2004
01
° 07
´ 43,
3´´
102°
07´
47,
8´´
1 29
,6
6,22
3,0
0,15
12
0,68
33
3,27
17
,62
-28,
6 3,
9
141
Siak
30
.09.
2004
01
° 03
´ 26,
3´´
102°
07´
02,
7´´
1 29
,7
6,19
1,6
0,15
20
7,76
53
9,66
15
,73
-28,
1 2,
4
142
Siak
30
.09.
2004
102°
05´
26,
6´´
1 28
,4
6,03
0,7
0,10
14
6,84
41
3,14
16
,25
-28,
8 1,
1
143
Siak
30
.09.
2004
01
° 00
´ 23,
2´´
102°
06´
32,
8´´
1 29
,7
6,05
0,1
0,10
17
9,64
49
2,36
15
,00
-28,
6 0,
9
144
Siak
30
.09.
2004
00
° 53
´ 56,
3´´
102°
02´
50,
3´´
1 30
,2
6,13
0,0
0,15
84
,52
291,
07
14,5
7 -2
8,9
4,0
145
Siak
30
.09.
2004
00
° 50
´ 23,
7´´
102°
03´
03,
9´´
1 -
6,23
0,0
0,15
56
,84
234,
06
13,1
0 -2
9,0
14,4
145
Siak
30
.09.
2004
00
° 50
´ 23,
7´´
102°
03´
03,
9´´
12
29,9
6,
400,
0 -
- -
- -
-
147
S. T
apun
g Ki
ri 02
.10.
2004
00
° 33
´ 38,
5´´
101°
03´
53,
5´´
1 -
6,92
0,0
0,60
31
,03
116,
16
10,4
7 -2
9,2
3,6
148
S. T
apun
g Ka
nan
02.1
0.20
04
00°
44´ 5
6,0´
´ 10
1° 1
2´17
,5´´
1
29,8
4 -
0,0
0,25
47
,96
187,
83
10,2
1 -2
6,2
4,6
*SD
= S
ampl
ing
dept
h
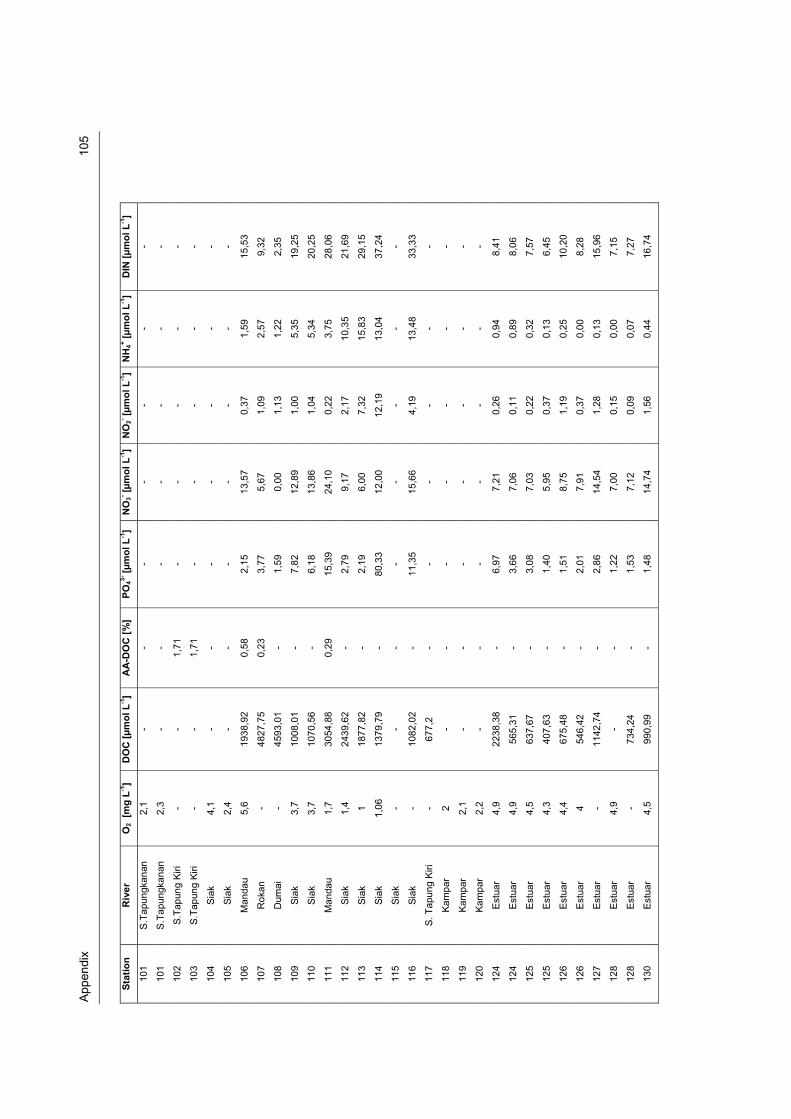
App
endi
x
1
05
Stat
ion
Riv
er
O2
[mg
L-1]
DO
C [μ
mol
L-1]
AA
-DO
C [%
] PO
43- [μ
mol
L-1
] N
O3- [μ
mol
L-1]
NO
2- [μm
ol L
-1]
NH
4+ [μm
ol L
-1]
DIN
[μm
ol L
-1]
101
S.Ta
pung
kana
n 2,
1 -
- -
- -
- -
101
S.Ta
pung
kana
n 2,
3 -
- -
- -
- -
102
S.Ta
pung
Kiri
-
- 1,
71
- -
- -
-
103
S.Ta
pung
Kiri
-
- 1,
71
- -
- -
-
104
Siak
4,
1 -
- -
- -
- -
105
Siak
2,
4 -
- -
- -
- -
106
Man
dau
5,6
1938
,92
0,58
2,
15
13,5
7 0,
37
1,59
15
,53
107
Rok
an
- 48
27,7
5 0,
23
3,77
5,
67
1,09
2,
57
9,32
108
Dum
ai
- 45
93,0
1 -
1,59
0,
00
1,13
1,
22
2,35
109
Siak
3,
7 10
08,0
1 -
7,82
12
,89
1,00
5,
35
19,2
5
110
Siak
3,
7 10
70,5
6 -
6,18
13
,86
1,04
5,
34
20,2
5
111
Man
dau
1,7
3054
,88
0,29
15
,39
24,1
0 0,
22
3,75
28
,06
112
Siak
1,
4 24
39,6
2 -
2,79
9,
17
2,17
10
,35
21,6
9
113
Siak
1
1877
,82
- 2,
19
6,00
7,
32
15,8
3 29
,15
114
Siak
1,
06
1379
,79
- 80
,33
12,0
0 12
,19
13,0
4 37
,24
115
Siak
-
- -
- -
- -
-
116
Siak
-
1082
,02
- 11
,35
15,6
6 4,
19
13,4
8 33
,33
117
S. T
apun
g Ki
ri -
677,
2 -
- -
- -
-
118
Kam
par
2 -
- -
- -
- -
119
Kam
par
2,1
- -
- -
- -
-
120
Kam
par
2,2
- -
- -
- -
-
124
Estu
ar
4,9
2238
,38
- 6,
97
7,21
0,
26
0,94
8,
41
124
Estu
ar
4,9
565,
31
- 3,
66
7,06
0,
11
0,89
8,
06
125
Estu
ar
4,5
637,
67
- 3,
08
7,03
0,
22
0,32
7,
57
125
Estu
ar
4,3
407,
63
- 1,
40
5,95
0,
37
0,13
6,
45
126
Estu
ar
4,4
675,
48
- 1,
51
8,75
1,
19
0,25
10
,20
126
Estu
ar
4 54
6,42
-
2,01
7,
91
0,37
0,
00
8,28
127
Estu
ar
- 11
42,7
4 -
2,86
14
,54
1,28
0,
13
15,9
6
128
Estu
ar
4,9
- -
1,22
7,
00
0,15
0,
00
7,15
128
Estu
ar
- 73
4,24
-
1,53
7,
12
0,09
0,
07
7,27
130
Estu
ar
4,5
990,
99
- 1,
48
14,7
4 1,
56
0,44
16
,74
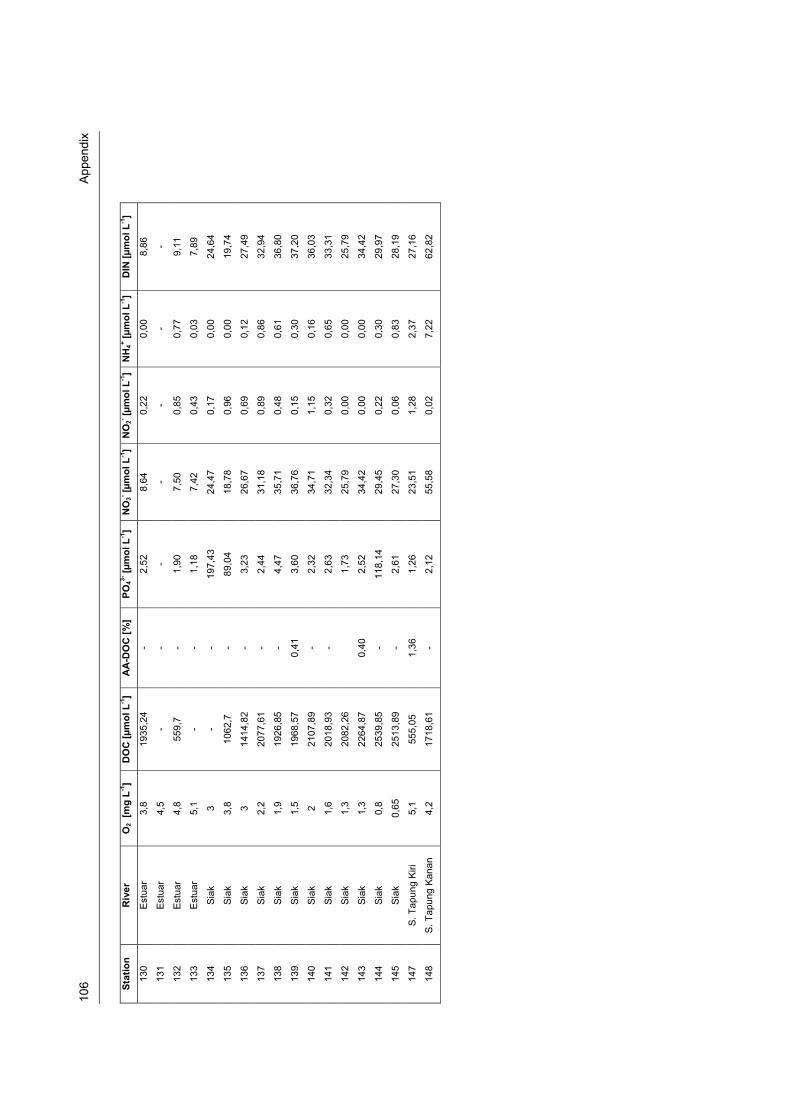
106
A
ppen
dix
Stat
ion
Riv
er
O2
[mg
L-1]
DO
C [μ
mol
L-1]
AA
-DO
C [%
] PO
43- [μ
mol
L-1
] N
O3- [μ
mol
L-1]
NO
2- [μm
ol L
-1]
NH
4+ [μm
ol L
-1]
DIN
[μm
ol L
-1]
130
Estu
ar
3,8
1935
,24
- 2,
52
8,64
0,
22
0,00
8,
86
131
Estu
ar
4,5
- -
- -
- -
-
132
Estu
ar
4,8
559,
7 -
1,90
7,
50
0,85
0,
77
9,11
133
Estu
ar
5,1
- -
1,18
7,
42
0,43
0,
03
7,89
134
Siak
3
- -
197,
43
24,4
7 0,
17
0,00
24
,64
135
Siak
3,
8 10
62,7
-
89,0
4 18
,78
0,96
0,
00
19,7
4
136
Siak
3
1414
,82
- 3,
23
26,6
7 0,
69
0,12
27
,49
137
Siak
2,
2 20
77,6
1 -
2,44
31
,18
0,89
0,
86
32,9
4
138
Siak
1,
9 19
26,8
5 -
4,47
35
,71
0,48
0,
61
36,8
0
139
Siak
1,
5 19
68,5
7 0,
41
3,60
36
,76
0,15
0,
30
37,2
0
140
Siak
2
2107
,89
- 2,
32
34,7
1 1,
15
0,16
36
,03
141
Siak
1,
6 20
18,9
3 -
2,63
32
,34
0,32
0,
65
33,3
1
142
Siak
1,
3 20
82,2
6
1,73
25
,79
0,00
0,
00
25,7
9
143
Siak
1,
3 22
64,8
7 0,
40
2,52
34
,42
0,00
0,
00
34,4
2
144
Siak
0,
8 25
39,8
5 -
118,
14
29,4
5 0,
22
0,30
29
,97
145
Siak
0,
65
2513
,89
- 2,
61
27,3
0 0,
06
0,83
28
,19
147
S. T
apun
g Ki
ri 5,
1 55
5,05
1,
36
1,26
23
,51
1,28
2,
37
27,1
6
148
S. T
apun
g Ka
nan
4,2
1718
,61
- 2,
12
55,5
8 0,
02
7,22
62
,82
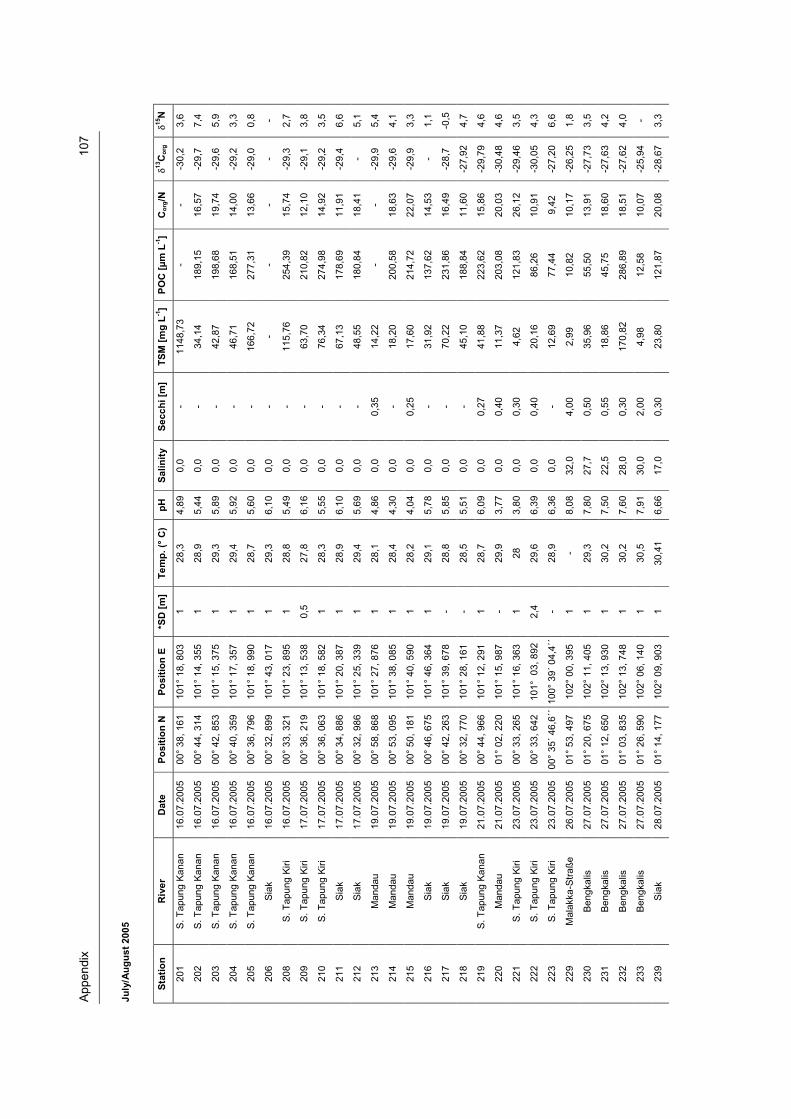
App
endi
x
1
07
July
/Aug
ust 2
005
Stat
ion
Riv
er
Dat
e Po
sitio
n N
Po
sitio
n E
*SD
[m]
Tem
p. (°
C)
pH
Salin
ity
Secc
hi [m
] TS
M [m
g L-1
] PO
C [μ
m L
-1]
Cor
g/N
�13C
org
�15N
201
S. T
apun
g Ka
nan
16.0
7.20
05
00°
38, 1
61
101°
18,
803
1
28,3
4,
890,
0 -
1148
,73
- -
-30,
2 3,
6
202
S. T
apun
g Ka
nan
16.0
7.20
05
00°
44, 3
14
101°
14,
355
1
28,9
5,
440,
0 -
34,1
4 18
9,15
16
,57
-29,
7 7,
4
203
S. T
apun
g Ka
nan
16.0
7.20
05
00°
42, 8
53
101°
15,
375
1
29,3
5,
890,
0 -
42,8
7 19
8,68
19
,74
-29,
6 5,
9
204
S. T
apun
g Ka
nan
16.0
7.20
05
00°
40, 3
59
101°
17,
357
1
29,4
5,
920,
0 -
46,7
1 16
8,51
14
,00
-29,
2 3,
3
205
S. T
apun
g Ka
nan
16.0
7.20
05
00°
36, 7
96
101°
18,
990
1
28,7
5,
600,
0 -
166,
72
277,
31
13,6
6 -2
9,0
0,8
206
Siak
16
.07.
2005
00
° 32
, 899
10
1° 4
3, 0
17
1 29
,3
6,10
0,0
- -
- -
- -
208
S. T
apun
g Ki
ri 16
.07.
2005
00
° 33
, 321
10
1° 2
3, 8
95
1 28
,8
5,49
0,0
- 11
5,76
25
4,39
15
,74
-29,
3 2,
7
209
S. T
apun
g Ki
ri 17
.07.
2005
00
° 36
, 219
10
1° 1
3, 5
38
0,5
27,8
6,
160,
0 -
63,7
0 21
0,82
12
,10
-29,
1 3,
8
210
S. T
apun
g Ki
ri 17
.07.
2005
00
° 36
, 063
10
1° 1
8, 5
82
1 28
,3
5,55
0,0
- 76
,34
274,
98
14,9
2 -2
9,2
3,5
211
Siak
17
.07.
2005
00
° 34
, 886
10
1° 2
0, 3
87
1 28
,9
6,10
0,0
- 67
,13
178,
69
11,9
1 -2
9,4
6,6
212
Siak
17
.07.
2005
00
° 32
, 986
10
1° 2
5, 3
39
1 29
,4
5,69
0,0
- 48
,55
180,
84
18,4
1 -
5,1
213
Man
dau
19.0
7.20
05
00°
58, 8
68
101°
27,
876
1
28,1
4,
860,
0 0,
35
14,2
2 -
- -2
9,9
5,4
214
Man
dau
19.0
7.20
05
00°
53, 0
95
101°
38,
085
1
28,4
4,
300,
0 -
18,2
0 20
0,58
18
,63
-29,
6 4,
1
215
Man
dau
19.0
7.20
05
00°
50, 1
81
101°
40,
590
1
28,2
4,
040,
0 0,
25
17,6
0 21
4,72
22
,07
-29,
9 3,
3
216
Siak
19
.07.
2005
00
° 46
, 675
10
1° 4
6, 3
64
1 29
,1
5,78
0,0
- 31
,92
137,
62
14,5
3 -
1,1
217
Siak
19
.07.
2005
00
° 42
, 263
10
1° 3
9, 6
78
- 28
,8
5,85
0,0
- 70
,22
231,
86
16,4
9 -2
8,7
-0,5
218
Siak
19
.07.
2005
00
° 32
, 770
10
1° 2
8, 1
61
- 28
,5
5,51
0,0
- 45
,10
188,
84
11,6
0 -2
7,92
4,
7
219
S. T
apun
g Ka
nan
21.0
7.20
05
00°
44, 9
66
101°
12,
291
1
28,7
6,
090,
0 0,
27
41,8
8 22
3,62
15
,86
-29,
79
4,6
220
Man
dau
21.0
7.20
05
01°
02, 2
20
101°
15,
987
-
29,9
3,
770,
0 0,
40
11,3
7 20
3,08
20
,03
-30,
48
4,6
221
S. T
apun
g Ki
ri 23
.07.
2005
00
° 33
, 265
10
1° 1
6, 3
63
1 28
3,
800,
0 0,
30
4,62
12
1,83
26
,12
-29,
46
3,5
222
S. T
apun
g Ki
ri 23
.07.
2005
00
° 33
, 642
10
1° 0
3, 8
92
2,4
29,6
6,
390,
0 0,
40
20,1
6 86
,26
10,9
1 -3
0,05
4,
3
223
S. T
apun
g Ki
ri 23
.07.
2005
00
° 35
´ 46,
6´´
100°
39´
04,
4´´
- 28
,9
6,36
0,0
- 12
,69
77,4
4 9,
42
-27,
20
6,6
229
Mal
akka
-Stra
ße
26.0
7.20
05
01°
53, 4
97
102°
00,
395
1
- 8,
0832
,0
4,00
2,
99
10,8
2 10
,17
-26,
25
1,8
230
Beng
kalis
27
.07.
2005
01
° 20
, 675
10
2° 1
1, 4
05
1 29
,3
7,80
27,7
0,
50
35,9
6 55
,50
13,9
1 -2
7,73
3,
5
231
Beng
kalis
27
.07.
2005
01
° 12
, 650
10
2° 1
3, 9
30
1 30
,2
7,50
22,5
0,
55
18,8
6 45
,75
18,6
0 -2
7,63
4,
2
232
Beng
kalis
27
.07.
2005
01
° 03
, 835
10
2° 1
3, 7
48
1 30
,2
7,60
28,0
0,
30
170,
82
286,
89
18,5
1 -2
7,62
4,
0
233
Beng
kalis
27
.07.
2005
01
° 26
, 590
10
2° 0
6, 1
40
1 30
,5
7,91
30,0
2,
00
4,98
12
,58
10,0
7 -2
5,94
-
239
Siak
28
.07.
2005
01
° 14
, 177
10
2° 0
9, 9
03
1 30
,41
6,66
17,0
0,
30
23,8
0 12
1,87
20
,08
-28,
67
3,3
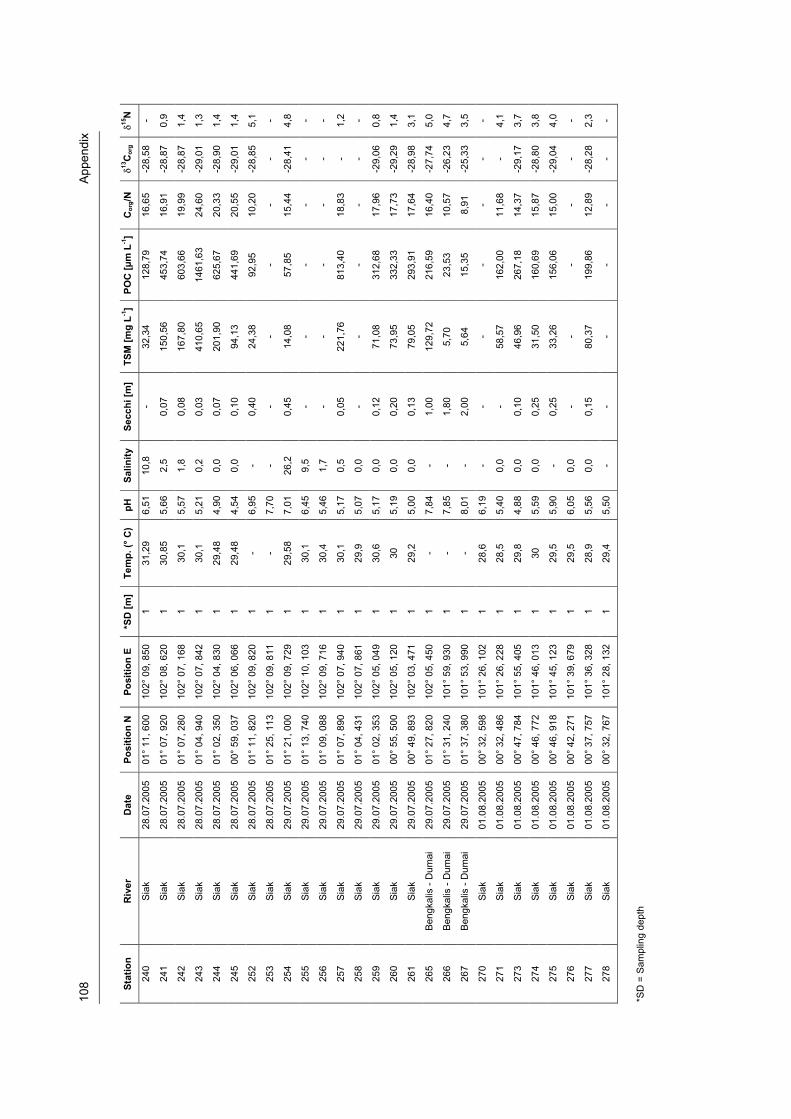
108
A
ppen
dix
Stat
ion
Riv
er
Dat
e Po
sitio
n N
Po
sitio
n E
*SD
[m]
Tem
p. (°
C)
pH
Salin
ity
Secc
hi [m
] TS
M [m
g L-1
] PO
C [μ
m L
-1]
Cor
g/N
�13C
org
�15N
240
Siak
28
.07.
2005
01
° 11
, 600
10
2° 0
9, 8
50
1 31
,29
6,51
10,8
-
32,3
4 12
8,79
16
,65
-28,
58
-
241
Siak
28
.07.
2005
01
° 07
, 920
10
2° 0
8, 6
20
1 30
,85
5,66
2,5
0,07
15
0,56
45
3,74
16
,91
-28,
87
0,9
242
Siak
28
.07.
2005
01
° 07
, 280
10
2° 0
7, 1
68
1 30
,1
5,57
1,8
0,08
16
7,80
60
3,66
19
,99
-28,
87
1,4
243
Siak
28
.07.
2005
01
° 04
, 940
10
2° 0
7, 8
42
1 30
,1
5,21
0,2
0,03
41
0,65
14
61,6
3 24
,60
-29,
01
1,3
244
Siak
28
.07.
2005
01
° 02
, 350
10
2° 0
4, 8
30
1 29
,48
4,90
0,0
0,07
20
1,90
62
5,67
20
,33
-28,
90
1,4
245
Siak
28
.07.
2005
00
° 59
, 037
10
2° 0
6, 0
66
1 29
,48
4,54
0,0
0,10
94
,13
441,
69
20,5
5 -2
9,01
1,
4
252
Siak
28
.07.
2005
01
° 11
, 820
10
2° 0
9, 8
20
1 -
6,95
- 0,
40
24,3
8 92
,95
10,2
0 -2
8,85
5,
1
253
Siak
28
.07.
2005
01
° 25
, 113
10
2° 0
9, 8
11
1 -
7,70
- -
- -
- -
-
254
Siak
29
.07.
2005
01
° 21
, 000
10
2° 0
9, 7
29
1 29
,58
7,01
26,2
0,
45
14,0
8 57
,85
15,4
4 -2
8,41
4,
8
255
Siak
29
.07.
2005
01
° 13
, 740
10
2° 1
0, 1
03
1 30
,1
6,45
9,5
- -
- -
- -
256
Siak
29
.07.
2005
01
° 09
, 088
10
2° 0
9, 7
16
1 30
,4
5,46
1,7
- -
- -
- -
257
Siak
29
.07.
2005
01
° 07
, 890
10
2° 0
7, 9
40
1 30
,1
5,17
0,5
0,05
22
1,76
81
3,40
18
,83
- 1,
2
258
Siak
29
.07.
2005
01
° 04
, 431
10
2° 0
7, 8
61
1 29
,9
5,07
0,0
- -
- -
- -
259
Siak
29
.07.
2005
01
° 02
, 353
10
2° 0
5, 0
49
1 30
,6
5,17
0,0
0,12
71
,08
312,
68
17,9
6 -2
9,06
0,
8
260
Siak
29
.07.
2005
00
° 55
, 500
10
2° 0
5, 1
20
1 30
5,
190,
0 0,
20
73,9
5 33
2,33
17
,73
-29,
29
1,4
261
Siak
29
.07.
2005
00
° 49
, 893
10
2° 0
3, 4
71
1 29
,2
5,00
0,0
0,13
79
,05
293,
91
17,6
4 -2
8,98
3,
1
265
Beng
kalis
- D
umai
29
.07.
2005
01
° 27
, 820
10
2° 0
5, 4
50
1 -
7,84
- 1,
00
129,
72
216,
59
16,4
0 -2
7,74
5,
0
266
Beng
kalis
- D
umai
29
.07.
2005
01
° 31
, 240
10
1° 5
9, 9
30
1 -
7,85
- 1,
80
5,70
23
,53
10,5
7 -2
6,23
4,
7
267
Beng
kalis
- D
umai
29
.07.
2005
01
° 37
, 380
10
1° 5
3, 9
90
1 -
8,01
- 2,
00
5,64
15
,35
8,91
-2
5,33
3,
5
270
Siak
01
.08.
2005
00
° 32
, 598
10
1° 2
6, 1
02
1 28
,6
6,19
- -
- -
- -
-
271
Siak
01
.08.
2005
00
° 32
, 486
10
1° 2
6, 2
28
1 28
,5
5,40
0,0
- 58
,57
162,
00
11,6
8 -
4,1
273
Siak
01
.08.
2005
00
° 47
, 784
10
1° 5
5, 4
05
1 29
,8
4,88
0,0
0,10
46
,96
267,
18
14,3
7 -2
9,17
3,
7
274
Siak
01
.08.
2005
00
° 46
, 772
10
1° 4
6, 0
13
1 30
5,
590,
0 0,
25
31,5
0 16
0,69
15
,87
-28,
80
3,8
275
Siak
01
.08.
2005
00
° 46
, 918
10
1° 4
5, 1
23
1 29
,5
5,90
- 0,
25
33,2
6 15
6,06
15
,00
-29,
04
4,0
276
Siak
01
.08.
2005
00
° 42
, 271
10
1° 3
9, 6
79
1 29
,5
6,05
0,0
- -
- -
- -
277
Siak
01
.08.
2005
00
° 37
, 757
10
1° 3
6, 3
28
1 28
,9
5,56
0,0
0,15
80
,37
199,
86
12,8
9 -2
8,28
2,
3
278
Siak
01
.08.
2005
00
° 32
, 767
10
1° 2
8, 1
32
1 29
,4
5,50
- -
- -
- -
-
*SD
= S
ampl
ing
dept
h
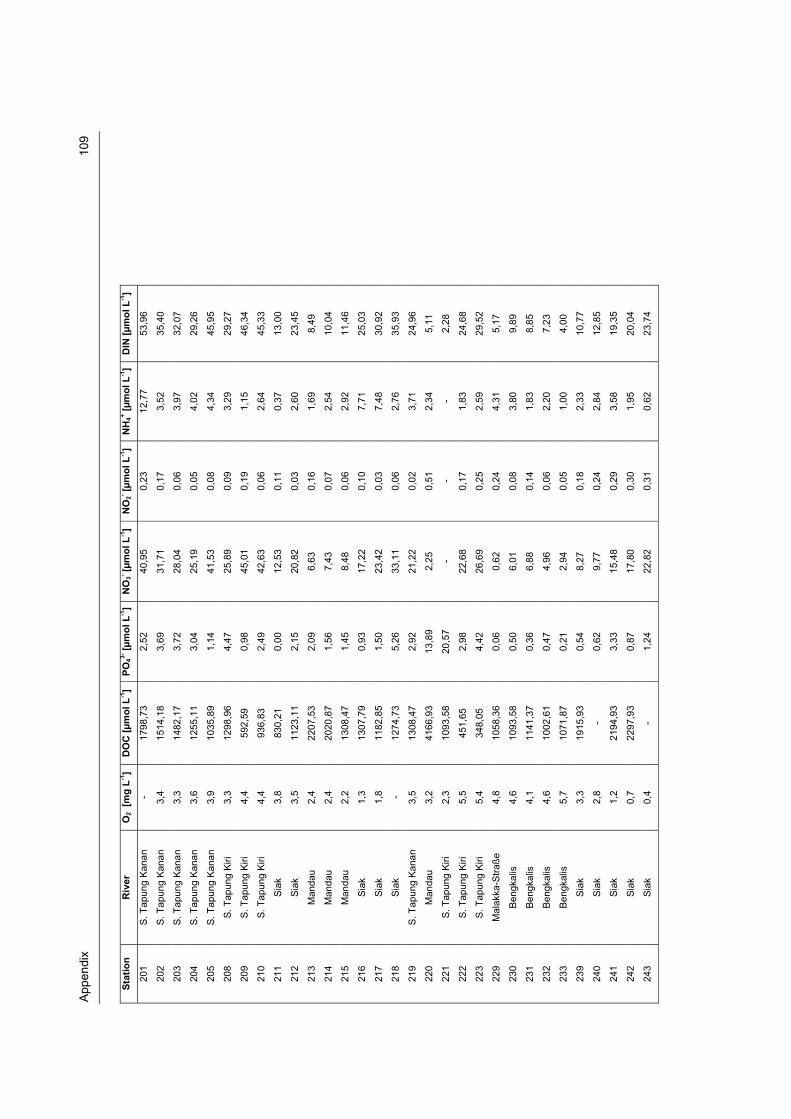
App
endi
x
1
09
Stat
ion
Riv
er
O2
[mg
L-1]
DO
C [μ
mol
L-1]
PO43-
[μm
ol L
-1]
NO
3- [μm
ol L
-1]
NO
2- [μm
ol L
-1]
NH
4+ [μm
ol L
-1]
DIN
[μm
ol L
-1]
201
S. T
apun
g Ka
nan
- 17
98,7
3 2,
52
40,9
5 0,
23
12,7
7 53
,96
202
S. T
apun
g Ka
nan
3,4
1514
,18
3,69
31
,71
0,17
3,
52
35,4
0
203
S. T
apun
g Ka
nan
3,3
1482
,17
3,72
28
,04
0,06
3,
97
32,0
7
204
S. T
apun
g Ka
nan
3,6
1255
,11
3,04
25
,19
0,05
4,
02
29,2
6
205
S. T
apun
g Ka
nan
3,9
1035
,89
1,14
41
,53
0,08
4,
34
45,9
5
208
S. T
apun
g Ki
ri 3,
3 12
98,9
6 4,
47
25,8
9 0,
09
3,29
29
,27
209
S. T
apun
g Ki
ri 4,
4 59
2,59
0,
98
45,0
1 0,
19
1,15
46
,34
210
S. T
apun
g Ki
ri 4,
4 93
6,83
2,
49
42,6
3 0,
06
2,64
45
,33
211
Siak
3,
8 83
0,21
0,
00
12,5
3 0,
11
0,37
13
,00
212
Siak
3,
5 11
23,1
1 2,
15
20,8
2 0,
03
2,60
23
,45
213
Man
dau
2,4
2207
,53
2,09
6,
63
0,16
1,
69
8,49
214
Man
dau
2,4
2020
,87
1,56
7,
43
0,07
2,
54
10,0
4
215
Man
dau
2,2
1308
,47
1,45
8,
48
0,06
2,
92
11,4
6
216
Siak
1,
3 13
07,7
9 0,
93
17,2
2 0,
10
7,71
25
,03
217
Siak
1,
8 11
82,8
5 1,
50
23,4
2 0,
03
7,48
30
,92
218
Siak
-
1274
,73
5,26
33
,11
0,06
2,
76
35,9
3
219
S. T
apun
g Ka
nan
3,5
1308
,47
2,92
21
,22
0,02
3,
71
24,9
6
220
Man
dau
3,2
4166
,93
13,8
9 2,
25
0,51
2,
34
5,11
221
S. T
apun
g Ki
ri 2,
3 10
93,5
8 20
,57
- -
- 2,
28
222
S. T
apun
g Ki
ri 5,
5 45
1,65
2,
98
22,6
8 0,
17
1,83
24
,68
223
S. T
apun
g Ki
ri 5,
4 34
8,05
4,
42
26,6
9 0,
25
2,59
29
,52
229
Mal
akka
-Stra
ße
4,8
1058
,36
0,06
0,
62
0,24
4,
31
5,17
230
Beng
kalis
4,
6 10
93,5
8 0,
50
6,01
0,
08
3,80
9,
89
231
Beng
kalis
4,
1 11
41,3
7 0,
36
6,88
0,
14
1,83
8,
85
232
Beng
kalis
4,
6 10
02,6
1 0,
47
4,96
0,
06
2,20
7,
23
233
Beng
kalis
5,
7 10
71,8
7 0,
21
2,94
0,
05
1,00
4,
00
239
Siak
3,
3 19
15,9
3 0,
54
8,27
0,
18
2,33
10
,77
240
Siak
2,
8 -
0,62
9,
77
0,24
2,
84
12,8
5
241
Siak
1,
2 21
94,9
3 3,
33
15,4
8 0,
29
3,58
19
,35
242
Siak
0,
7 22
97,9
3 0,
87
17,8
0 0,
30
1,95
20
,04
243
Siak
0,
4 -
1,24
22
,82
0,31
0,
62
23,7
4
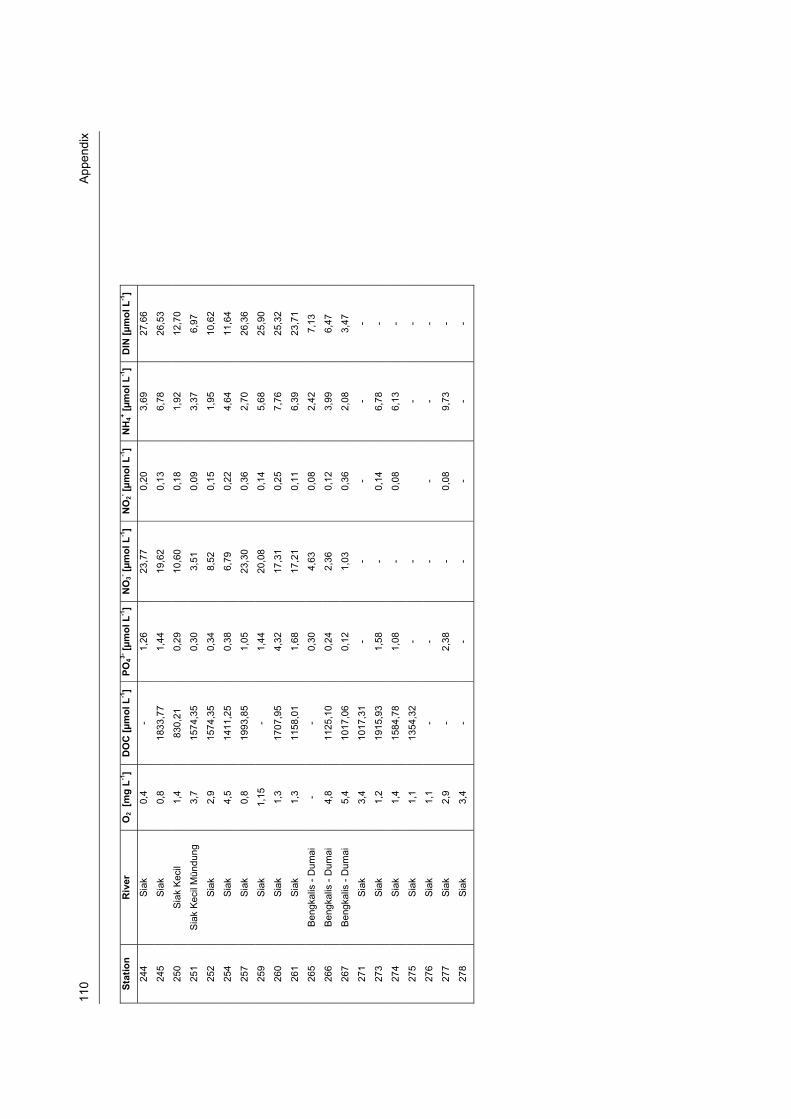
110
A
ppen
dix
Stat
ion
Riv
er
O2
[mg
L-1]
DO
C [μ
mol
L-1]
PO43-
[μm
ol L
-1]
NO
3- [μm
ol L
-1]
NO
2- [μm
ol L
-1]
NH
4+ [μm
ol L
-1]
DIN
[μm
ol L
-1]
244
Siak
0,
4 -
1,26
23
,77
0,20
3,
69
27,6
6
245
Siak
0,
8 18
33,7
7 1,
44
19,6
2 0,
13
6,78
26
,53
250
Siak
Kec
il 1,
4 83
0,21
0,
29
10,6
0 0,
18
1,92
12
,70
251
Siak
Kec
il M
ündu
ng
3,7
1574
,35
0,30
3,
51
0,09
3,
37
6,97
252
Siak
2,
9 15
74,3
5 0,
34
8,52
0,
15
1,95
10
,62
254
Siak
4,
5 14
11,2
5 0,
38
6,79
0,
22
4,64
11
,64
257
Siak
0,
8 19
93,8
5 1,
05
23,3
0 0,
36
2,70
26
,36
259
Siak
1,
15
- 1,
44
20,0
8 0,
14
5,68
25
,90
260
Siak
1,
3 17
07,9
5 4,
32
17,3
1 0,
25
7,76
25
,32
261
Siak
1,
3 11
58,0
1 1,
68
17,2
1 0,
11
6,39
23
,71
265
Beng
kalis
- D
umai
-
- 0,
30
4,63
0,
08
2,42
7,
13
266
Beng
kalis
- D
umai
4,
8 11
25,1
0 0,
24
2,36
0,
12
3,99
6,
47
267
Beng
kalis
- D
umai
5,
4 10
17,0
6 0,
12
1,03
0,
36
2,08
3,
47
271
Siak
3,
4 10
17,3
1 -
- -
- -
273
Siak
1,
2 19
15,9
3 1,
58
- 0,
14
6,78
-
274
Siak
1,
4 15
84,7
8 1,
08
- 0,
08
6,13
-
275
Siak
1,
1 13
54,3
2 -
-
- -
276
Siak
1,
1 -
- -
- -
-
277
Siak
2,
9 -
2,38
-
0,08
9,
73
-
278
Siak
3,
4 -
- -
- -
-
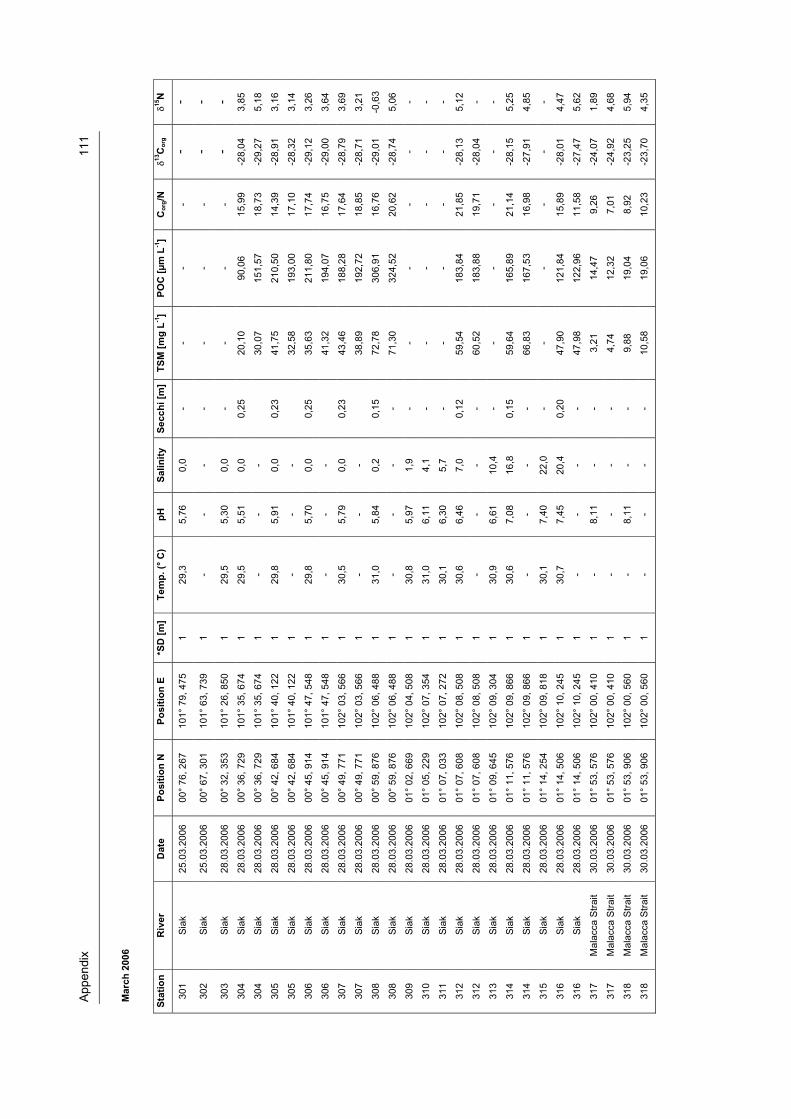
App
endi
x
1
11
Mar
ch 2
006
Stat
ion
Riv
er
Dat
e Po
sitio
n N
Po
sitio
n E
*SD
[m]
Tem
p. (°
C)
pH
Salin
ity
Secc
hi [m
]TS
M [m
g L-1
] PO
C [μ
m L
-1]
Cor
g/N
�13C
org
�15N
301
Siak
25
.03.
2006
00
° 76
, 267
10
1° 7
9, 4
75
1 29
,3
5,76
0,
0 -
- -
- -
-
302
Siak
25
.03.
2006
00
° 67
, 301
10
1° 6
3, 7
39
1 -
- -
- -
- -
- -
303
Siak
28
.03.
2006
00
° 32
, 353
10
1° 2
6, 8
50
1 29
,5
5,30
0,
0 -
- -
- -
- 30
4 Si
ak
28.0
3.20
06
00°
36, 7
29
101°
35,
674
1
29,5
5,
51
0,0
0,25
20
,10
90,0
6 15
,99
-28,
04
3,85
304
Siak
28
.03.
2006
00
° 36
, 729
10
1° 3
5, 6
74
1 -
- -
30
,07
151,
57
18,7
3 -2
9,27
5,
18
305
Siak
28
.03.
2006
00
° 42
, 684
10
1° 4
0, 1
22
1 29
,8
5,91
0,
0 0,
23
41,7
5 21
0,50
14
,39
-28,
91
3,16
305
Siak
28
.03.
2006
00
° 42
, 684
10
1° 4
0, 1
22
1 -
- -
32
,58
193,
00
17,1
0 -2
8,32
3,
14
306
Siak
28
.03.
2006
00
° 45
, 914
10
1° 4
7, 5
48
1 29
,8
5,70
0,
0 0,
25
35,6
3 21
1,80
17
,74
-29,
12
3,26
306
Siak
28
.03.
2006
00
° 45
, 914
10
1° 4
7, 5
48
1 -
- -
41
,32
194,
07
16,7
5 -2
9,00
3,
64
307
Siak
28
.03.
2006
00
° 49
, 771
10
2° 0
3, 5
66
1 30
,5
5,79
0,
0 0,
23
43,4
6 18
8,28
17
,64
-28,
79
3,69
307
Siak
28
.03.
2006
00
° 49
, 771
10
2° 0
3, 5
66
1 -
- -
38
,89
192,
72
18,8
5 -2
8,71
3,
21
308
Siak
28
.03.
2006
00
° 59
, 876
10
2° 0
6, 4
88
1 31
,0
5,84
0,
2 0,
15
72,7
8 30
6,91
16
,76
-29,
01
-0,6
3
308
Siak
28
.03.
2006
00
° 59
, 876
10
2° 0
6, 4
88
1 -
- -
- 71
,30
324,
52
20,6
2 -2
8,74
5,
06
309
Siak
28
.03.
2006
01
° 02
, 669
10
2° 0
4, 5
08
1 30
,8
5,97
1,
9 -
- -
- -
-
310
Siak
28
.03.
2006
01
° 05
, 229
10
2° 0
7, 3
54
1 31
,0
6,11
4,
1 -
- -
- -
-
311
Siak
28
.03.
2006
01
° 07
, 033
10
2° 0
7, 2
72
1 30
,1
6,30
5,
7 -
- -
- -
-
312
Siak
28
.03.
2006
01
° 07
, 608
10
2° 0
8, 5
08
1 30
,6
6,46
7,
0 0,
12
59,5
4 18
3,84
21
,85
-28,
13
5,12
312
Siak
28
.03.
2006
01
° 07
, 608
10
2° 0
8, 5
08
1 -
- -
- 60
,52
183,
88
19,7
1 -2
8,04
-
313
Siak
28
.03.
2006
01
° 09
, 645
10
2° 0
9, 3
04
1 30
,9
6,61
10
,4
- -
- -
- -
314
Siak
28
.03.
2006
01
° 11
, 576
10
2° 0
9, 8
66
1 30
,6
7,08
16
,8
0,15
59
,64
165,
89
21,1
4 -2
8,15
5,
25
314
Siak
28
.03.
2006
01
° 11
, 576
10
2° 0
9, 8
66
1 -
- -
- 66
,83
167,
53
16,9
8 -2
7,91
4,
85
315
Siak
28
.03.
2006
01
° 14
, 254
10
2° 0
9, 8
18
1 30
,1
7,40
22
,0
- -
- -
- -
316
Siak
28
.03.
2006
01
° 14
, 506
10
2° 1
0, 2
45
1 30
,7
7,45
20
,4
0,20
47
,90
121,
84
15,8
9 -2
8,01
4,
47
316
Siak
28
.03.
2006
01
° 14
, 506
10
2° 1
0, 2
45
1 -
- -
- 47
,98
122,
96
11,5
8 -2
7,47
5,
62
317
Mal
acca
Stra
it 30
.03.
2006
01
° 53
, 576
10
2° 0
0, 4
10
1 -
8,11
-
- 3,
21
14,4
7 9,
26
-24,
07
1,89
317
Mal
acca
Stra
it 30
.03.
2006
01
° 53
, 576
10
2° 0
0, 4
10
1 -
- -
- 4,
74
12,3
2 7,
01
-24,
92
4,68
318
Mal
acca
Stra
it 30
.03.
2006
01
° 53
, 906
10
2° 0
0, 5
60
1 -
8,11
-
- 9,
88
19,0
4 8,
92
-23,
25
5,94
318
Mal
acca
Stra
it 30
.03.
2006
01
° 53
, 906
10
2° 0
0, 5
60
1 -
- -
- 10
,58
19,0
6 10
,23
-23,
70
4,35
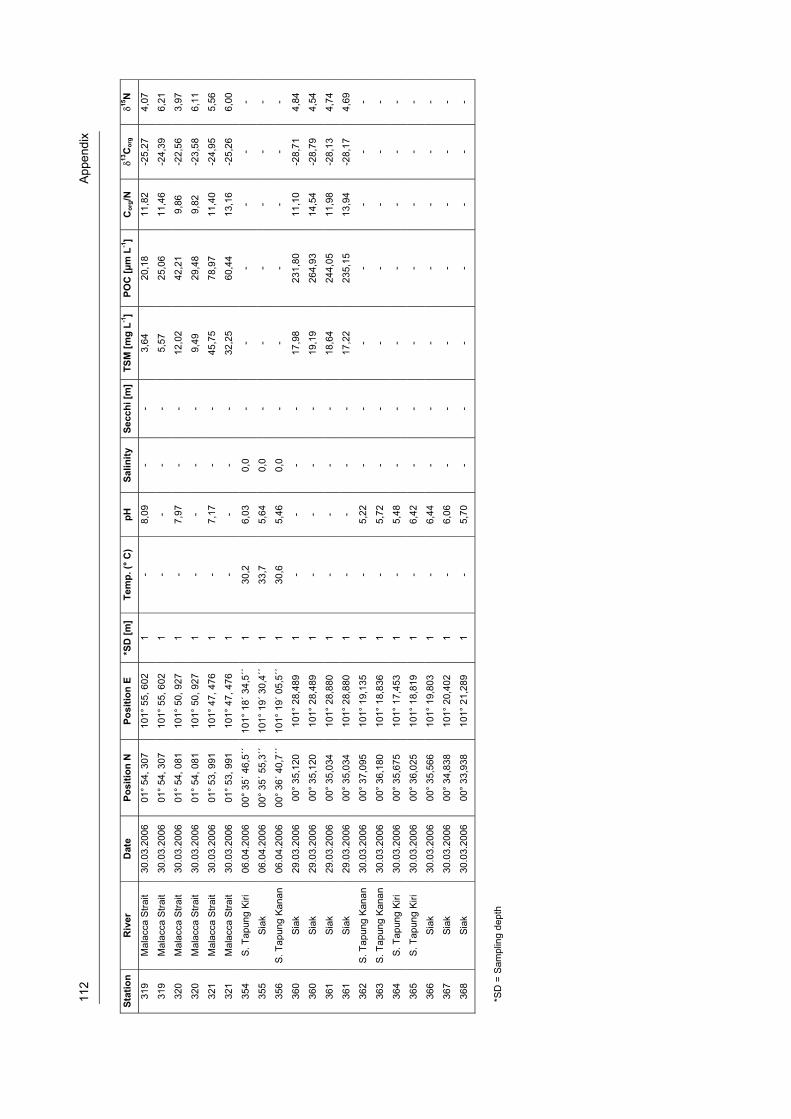
112
A
ppen
dix
Stat
ion
Riv
er
Dat
e Po
sitio
n N
Po
sitio
n E
*SD
[m]
Tem
p. (°
C)
pH
Salin
ity
Secc
hi [m
]TS
M [m
g L-1
] PO
C [μ
m L
-1]
Cor
g/N
�13C
org
�15N
319
Mal
acca
Stra
it 30
.03.
2006
01
° 54
, 307
10
1° 5
5, 6
02
1 -
8,09
-
- 3,
64
20,1
8 11
,82
-25,
27
4,07
319
Mal
acca
Stra
it 30
.03.
2006
01
° 54
, 307
10
1° 5
5, 6
02
1 -
- -
- 5,
57
25,0
6 11
,46
-24,
39
6,21
320
Mal
acca
Stra
it 30
.03.
2006
01
° 54
, 081
10
1° 5
0, 9
27
1 -
7,97
-
- 12
,02
42,2
1 9,
86
-22,
56
3,97
320
Mal
acca
Stra
it 30
.03.
2006
01
° 54
, 081
10
1° 5
0, 9
27
1 -
- -
- 9,
49
29,4
8 9,
82
-23,
58
6,11
321
Mal
acca
Stra
it 30
.03.
2006
01
° 53
, 991
10
1° 4
7, 4
76
1 -
7,17
-
- 45
,75
78,9
7 11
,40
-24,
95
5,56
321
Mal
acca
Stra
it 30
.03.
2006
01
° 53
, 991
10
1° 4
7, 4
76
1 -
- -
- 32
,25
60,4
4 13
,16
-25,
26
6,00
354
S. T
apun
g Ki
ri 06
.04.
2006
00
° 35
´ 46,
5´´
101°
18´
34,
5´´
1 30
,2
6,03
0,
0 -
- -
- -
-
355
Siak
06
.04.
2006
00
° 35
´ 55,
3´´
101°
19´
30,
4´´
1 33
,7
5,64
0,
0 -
- -
- -
-
356
S. T
apun
g Ka
nan
06.0
4.20
06
00°
36´ 4
0,7´
´ 10
1° 1
9´ 0
5,5´
´ 1
30,6
5,
46
0,0
- -
- -
- -
360
Siak
29
.03.
2006
00
° 35
,120
10
1° 2
8,48
9 1
- -
- -
17,9
8 23
1,80
11
,10
-28,
71
4,84
360
Siak
29
.03.
2006
00
° 35
,120
10
1° 2
8,48
9 1
- -
- -
19,1
9 26
4,93
14
,54
-28,
79
4,54
361
Siak
29
.03.
2006
00
° 35
,034
10
1° 2
8,88
0 1
- -
- -
18,6
4 24
4,05
11
,98
-28,
13
4,74
361
Siak
29
.03.
2006
00
° 35
,034
10
1° 2
8,88
0 1
- -
- -
17,2
2 23
5,15
13
,94
-28,
17
4,69
362
S. T
apun
g Ka
nan
30.0
3.20
06
00°
37,0
95
101°
19,
135
1 -
5,22
-
- -
- -
- -
363
S. T
apun
g Ka
nan
30.0
3.20
06
00°
36,1
80
101°
18,
836
1 -
5,72
-
- -
- -
- -
364
S. T
apun
g Ki
ri 30
.03.
2006
00
° 35
,675
10
1° 1
7,45
3 1
- 5,
48
- -
- -
- -
-
365
S. T
apun
g Ki
ri 30
.03.
2006
00
° 36
,025
10
1° 1
8,81
9 1
- 6,
42
- -
- -
- -
-
366
Siak
30
.03.
2006
00
° 35
,566
10
1° 1
9,80
3 1
- 6,
44
- -
- -
- -
-
367
Siak
30
.03.
2006
00
° 34
,838
10
1° 2
0,40
2 1
- 6,
06
- -
- -
- -
-
368
Siak
30
.03.
2006
00
° 33
,938
10
1° 2
1,28
9 1
- 5,
70
- -
- -
- -
-
*SD
= S
ampl
ing
dept
h
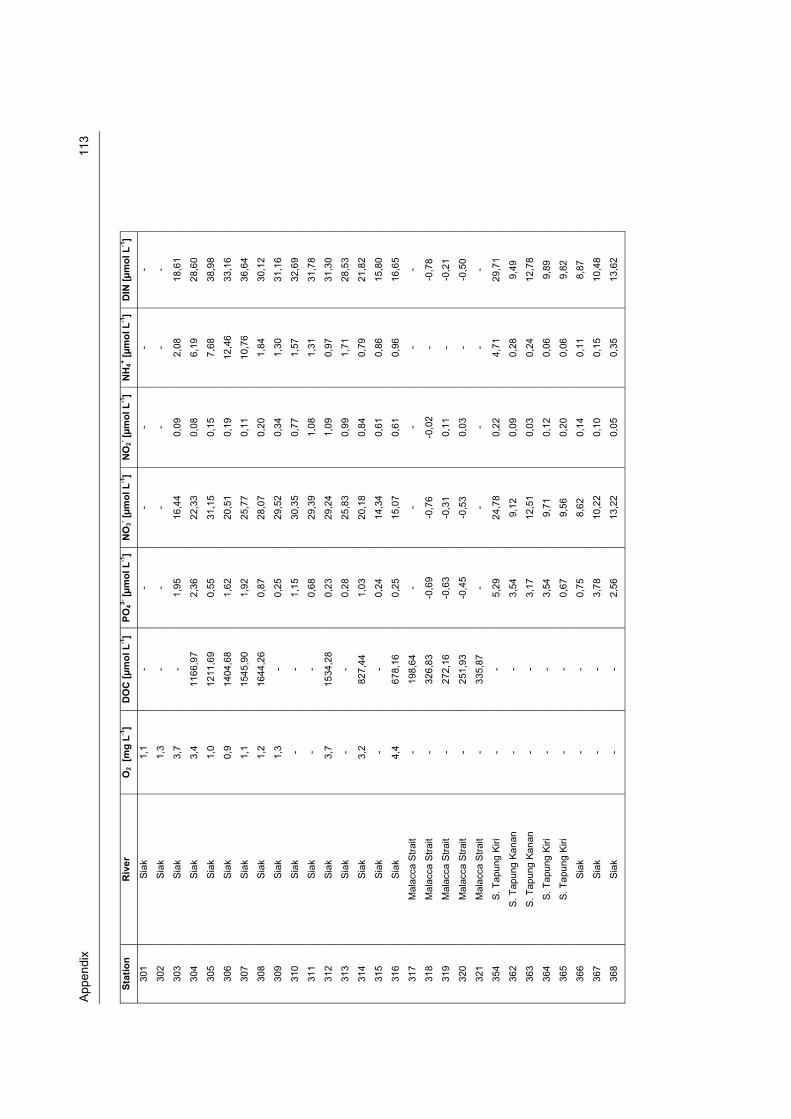
App
endi
x
1
13
Stat
ion
Riv
er
O2
[mg
L-1]
DO
C [μ
mol
L-1
] PO
43- [μ
mol
L-1
] N
O3- [μ
mol
L-1]
NO
2- [μm
ol L
-1]
NH
4+ [μm
ol L
-1]
DIN
[μm
ol L
-1]
301
Siak
1,
1 -
- -
- -
-
302
Siak
1,
3 -
- -
- -
-
303
Siak
3,
7 -
1,95
16
,44
0,09
2,
08
18,6
1
304
Siak
3,
4 11
66,9
7 2,
36
22,3
3 0,
08
6,19
28
,60
305
Siak
1,
0 12
11,6
9 0,
55
31,1
5 0,
15
7,68
38
,98
306
Siak
0,
9 14
04,6
8 1,
62
20,5
1 0,
19
12,4
6 33
,16
307
Siak
1,
1 15
45,9
0 1,
92
25,7
7 0,
11
10,7
6 36
,64
308
Siak
1,
2 16
44,2
6 0,
87
28,0
7 0,
20
1,84
30
,12
309
Siak
1,
3 -
0,25
29
,52
0,34
1,
30
31,1
6
310
Siak
-
- 1,
15
30,3
5 0,
77
1,57
32
,69
311
Siak
-
- 0,
68
29,3
9 1,
08
1,31
31
,78
312
Siak
3,
7 15
34,2
8 0,
23
29,2
4 1,
09
0,97
31
,30
313
Siak
-
- 0,
28
25,8
3 0,
99
1,71
28
,53
314
Siak
3,
2 82
7,44
1,
03
20,1
8 0,
84
0,79
21
,82
315
Siak
-
- 0,
24
14,3
4 0,
61
0,86
15
,80
316
Siak
4,
4 67
8,16
0,
25
15,0
7 0,
61
0,96
16
,65
317
Mal
acca
Stra
it -
198,
64
- -
- -
-
318
Mal
acca
Stra
it -
326,
83
-0,6
9 -0
,76
-0,0
2 -
-0,7
8
319
Mal
acca
Stra
it -
272,
16
-0,6
3 -0
,31
0,11
-
-0,2
1
320
Mal
acca
Stra
it -
251,
93
-0,4
5 -0
,53
0,03
-
-0,5
0
321
Mal
acca
Stra
it -
335,
87
- -
- -
-
354
S. T
apun
g Ki
ri -
- 5,
29
24,7
8 0,
22
4,71
29
,71
362
S. T
apun
g Ka
nan
- -
3,54
9,
12
0,09
0,
28
9,49
363
S. T
apun
g Ka
nan
- -
3,17
12
,51
0,03
0,
24
12,7
8
364
S. T
apun
g Ki
ri -
- 3,
54
9,71
0,
12
0,06
9,
89
365
S. T
apun
g Ki
ri -
- 0,
67
9,56
0,
20
0,06
9,
82
366
Siak
-
- 0,
75
8,62
0,
14
0,11
8,
87
367
Siak
-
- 3,
78
10,2
2 0,
10
0,15
10
,48
368
Siak
-
- 2,
56
13,2
2 0,
05
0,35
13
,62


Acknowledgements
I would like to thank Dr. Tim Rixen for all his support as well as his endurance with
which he has introduced me to scientific writing! He has contributed considerably to
the fun I had doing this PhD.
I am grateful to Prof. Dr. Wolfgang Balzer who kindly accepted the second
supervision.
I am very thankful to Prof. Dr. Venugopalan Ittekkot for his support and motivating
discussions during the time of my PhD thesis.
Many thanks to Dr. Daniela Unger who gave me valuable advice and support at all
times and who has kindly agreed to be member of my thesis committee.
I am very grateful to Matthias Birkicht, Doro Dasbach, Dieter Peterke and Ole
Morisse for the numerous analyses, valuable advices and support during the
laboratory work. Without them this work would not have been possible.
Thanks are given to Dr. Joko Samiaji, Dr. Christine Jose and all the colleagues and
students of the University Riau (Pekanbaru) for their support and help during my time
in Indonesia.
I am grateful to Csilla Kovacs for her dedicated help at the ZMT and in Indonesia. I
very much enjoyed spending so much time with her and captain Hany.
Sincere thanks to all colleagues at the ZMT for giving me scientific support and
helping me manage all the administrative and financial challenges. I kindly thank
Esther Borell for proofreading the papers and for being around these last few years. I
very much enjoyed the cooperation, help and friendship of so many Phd students
(and those who already made it) who joined me during my time at ZMT. Thank you
very much! In this context special thanks go to Anne Baumgart, Claudia Propp, Dr.
Inga Nordhaus, Dr. Kerstin Kober and Dr. Bettina Schmitt.

I kindly thank my parents for believing in me and always supporting my decisions.
Finally, I thank Timo Ebenthal who always supported and encouraged me all these
years.
Liste der veröffentlichten und eingereichten Artikel
Die vorliegende Arbeit besteht aus mehreren eigenen Artikeln die in referierten
Fachzeitschriften eingereicht und veröffentlicht wurden. Der Eigenanteil in Bezug auf
Idee- und Konzeptentwicklung, Datenerhebung und Auswertung sowie das
Verfassen der einzelnen Artikel ist im Folgenden beschrieben:
Artikel 1 Titel: Sources of dissolved inorganic nutrients in the peat-draining river Siak, Central
Sumatra, Indonesia
Autoren: Antje Baum, Tim Rixen, Gerd Liebezeit, Ralf Wöstmann, Christine Jose,
Joko Samiaji
Fachzeitschrift: Biogeochemistry, eingereicht am 3. Juni 2008
Idee und Konzept dieses Artikels wurden von Antje Baum entwickelt. Probennahme
der Flusswasser- und Bodenproben sowie deren Analyse wurde von Antje Baum
durchgeführt. Die Daten wurden von Antje Baum ausgewertet und mit den Co-
Autoren diskutiert. Der Artikel wurde von Antje Baum verfasst. Eine Durchsicht des
Artikels erfolgte durch die Co-Autoren, deren Anmerkungen und Verbesserungen bei
der Überarbeitung des Artikels berücksichtigt wurden.
Artikel 2 Titel: The Siak, a tropical black water river in central Sumatra on the verge of anoxia Autoren: Tim Rixen, Antje Baum, Thomas Pohlmann, Wolfgang Balzer, Joko
Samiaji, Christine Jose
Fachzeitschrift: Biogeochemistry, eingereicht am 10. Juni 2008
Idee und Konzept dieses Artikels wurde von Tim Rixen entwickelt. Der Eigenanteil an
diesem Artikel lag hauptsächlich in der Datenerhebung, Analyse und Auswertung
sowie der Durchführung des Abbauexperiments.
Artikel 3 Titel: Relevance of peat draining rivers in central Sumatra for riverine input of
dissolved organic carbon into the ocean Autoren: Antje Baum, Tim Rixen, Joko Samiaji
Fachzeitschrift: Estuarine, Coastal and Shelf Science 73 (2007) 563-570;
eingereicht am 8. August 2006; akzeptiert am 21. Februar 2007
Idee und Konzept dieses Artikels wurden von Antje Baum entwickelt. Die
Probennahme wurde größtenteils von Antje Baum und Tim Rixen und Analyse der
Proben von Antje Baum durchgeführt. Die Auswertung der Daten erfolgte durch Antje
Baum mit Unterstützung von Tim Rixen. Der Artikel wurde von Antje Baum verfasst.
Eine Durchsicht des Artikels erfolgte durch die Co-Autoren, deren Anmerkungen und
Verbesserungen bei der Überarbeitung des Artikels berücksichtigt wurden.
Artikel 4 Titel: DOC discharges from the Indonesian blackwater river Siak and its estuary into
the Malacca Strait and their role as DOC source for the Indian Ocean
Autoren: Antje Baum, Tim Rixen, Herbert Siegel, Thomas Pohlmann, Joko Samiaji,
Christine Jose
Fachzeitschrift: Marine Chemistry, eingereicht am 11. Juni 2008
Idee und Konzept dieses Artikels wurden von Antje Baum entwickelt. Entnahmen der
DOC-Proben, deren Analysen und Auswertung wurden von Antje Baum
durchgeführt. Die Daten wurden von Antje Baum ausgewertet, die die Ergebnisse
zusammen mit Beiträgen der Co-Autoren (Fernerkundung, Modellierung; Kapitel
„Distribution of riverine DOC in the coastal ocean“) in diesem Artikel dargestellt und
diskutiert hat. Eine Durchsicht des Artikels erfolgte durch alle beteiligten Autoren,
deren Anmerkungen und Verbesserungen bei der Überarbeitung des Artikels
berücksichtigt wurden.
Erklärung
Gemäß §6 der Promotionsordnung der Universität Bremen für die mathematischen,
natur- und ingenieurwissenschaftlichen Fachbereiche vom 14. März 2007 versichere
ich, dass:
- die Arbeit ohne unerlaubte fremde Hilfe angefertigt wurde
- keine anderen als die angegebenen Quellen und Hilfsmittel benutzt wurden
- die den benutzten Werken wörtlich oder inhaltlich entnommenen Stellen als solche
kenntlich gemacht wurden
Bremen, 2. September 2008
(Antje Baum)