
Triveni Engineering & Industries Ltd. sugar manufacturers in India and the market leader in its...
33
Triveni Engineering & Industries Ltd. CORPORATE PRESENTATION Q3/9M FY13
Transcript of Triveni Engineering & Industries Ltd. sugar manufacturers in India and the market leader in its...

Triveni Engineering & Industries Ltd. CORPORATE PRESENTATION Q3/9M FY13

Triveni Group Organisation Structure
2
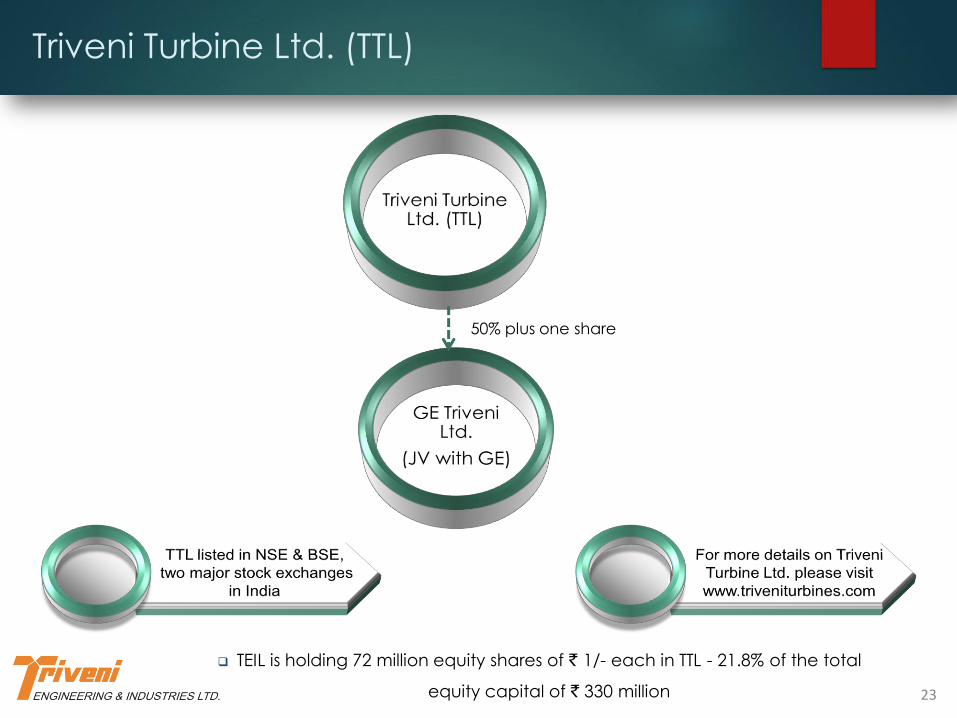
TEIL holds 21.8% of the equity in TTL
50% plus one share

Triveni Group Fact Sheet
3
Two Independent Listed Companies –
Triveni Engineering & Industries Ltd.
and Triveni Turbine Ltd.
Listed in both National Stock Exchange &
Bombay Stock Exchange – Market Cap of ~
INR 20 billion (August 22, 2013)
Promoter driven, professionally managed
companies with eminent and independent
Board of Directors
Triveni Engineering is one amongst the largest
integrated sugar manufacturers in India and
the market leader in its engineering businesses
comprising high speed gears, gearboxes, and
water treatment solutions.
Triveni Turbine Ltd. is the market leader in the
steam turbines upto 30 MW size.
Pan India Presence
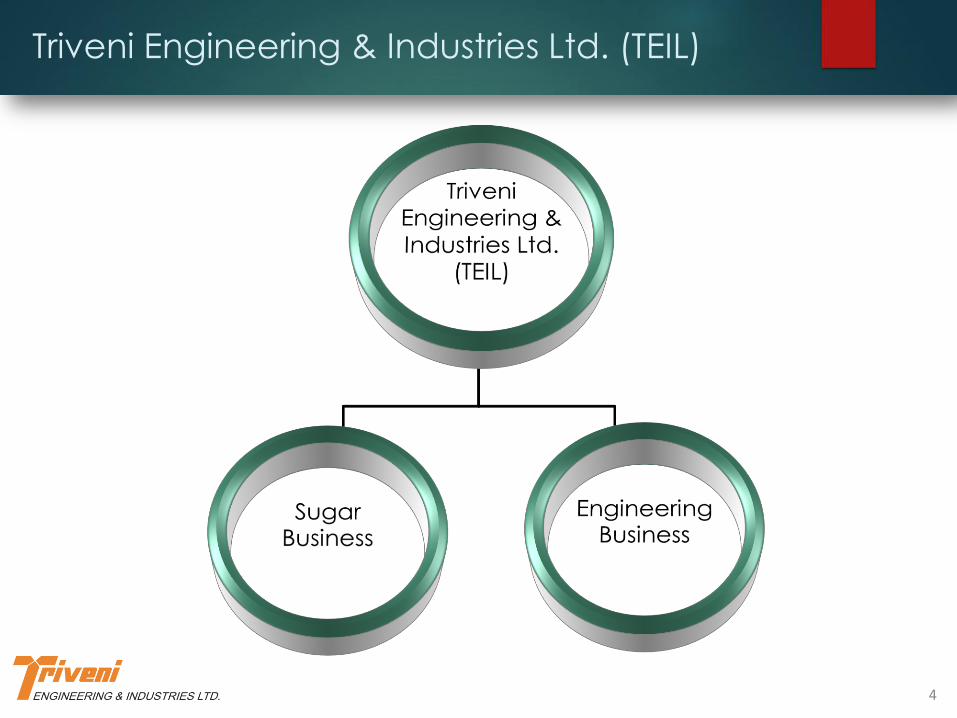
Triveni Engineering & Industries Ltd. (TEIL)
4
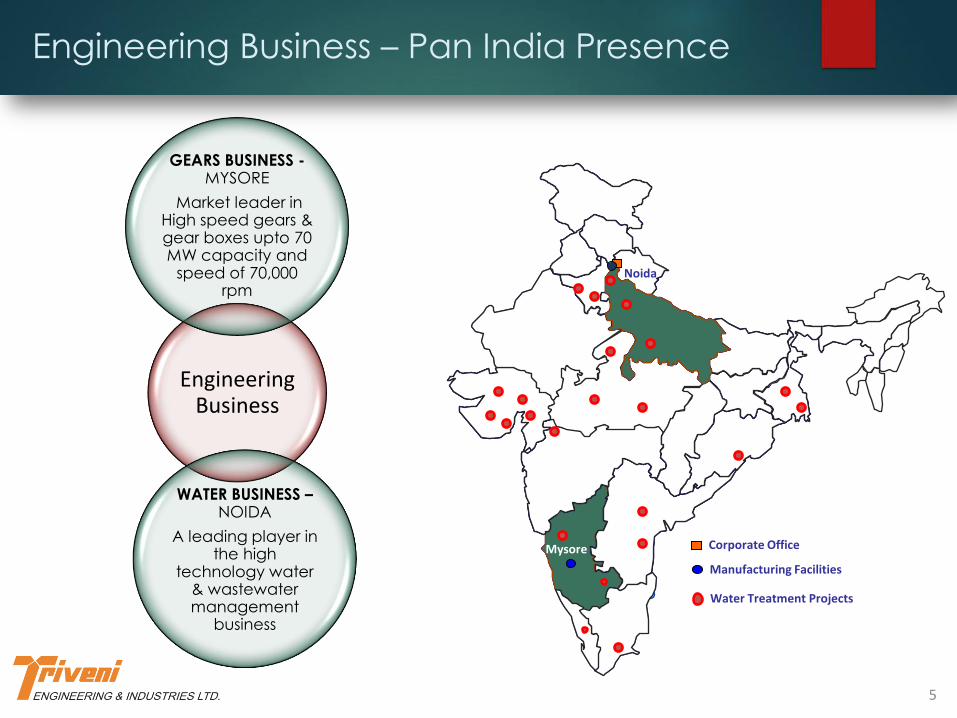
Engineering Business – Pan India Presence
5
Mysore Corporate Office
Manufacturing Facilities
Noida
Water Treatment Projects
Engineering Business
GEARS BUSINESS - MYSORE
Market leader in High speed gears & gear boxes upto 70 MW capacity and
speed of 70,000 rpm
WATER BUSINESS – NOIDA
A leading player in the high
technology water & wastewater management
business

Engineering Business – Revenue Growth
6
0
500
1000
1500
2000
2500
3000
3500
FY07* FY08 FY09 FY10 FY11 FY12
1006
1437
1730
2625
3068
2736
192 325 392
565 651
423
` in
mil
lion
s
Revenue PBIT
CAGR 07*-12
SALES – 22%
PBIT – 17%
FY07* - 12 months period from Oct 06 – Sep 07

Gears Business Group – Business Perspective
7
Triveni is in the business of design, manufacture and marketing of customised
gears and gearboxes (both high speed and niche low speed gears) having a
state-of-the-art design and manufacturing facility at Mysore conforming to
international standards.
About 70% market share in complete high speed gear market across
applications up to 70 MW capacity and speeds of 70,000 rpm.
Own developed technology for high speed gear boxes upto 7.5 MW and for
hydel gearbox range upto 6 MW.
Range above 7.5 MW-62 MW is manufactured using technology licensed from
Lufkin, USA.
High Speed Gears product range includes all Steam Turbine gear boxes, gear
boxes for compressors and load gear boxes for gas turbines apart from gear
boxes for mechanical drives like Pumps, Fans and Blowers driven by Electric
Motor, Steam Turbine or Diesel Engine. Geographies extended to cover major
markets in South East Asia such as Malaysia, Indonesia, Singapore, Thailand with
the possibility of enhancing territories in the future.
Niche engineered-to-order high technology low speed gear applications with
Lufkin for four industrial segments viz., Rubber & Plastics, Metals and Steel, Marine
and Coal pulverizer application in the thermal power plants.
Gears Business Group – Financial Performance
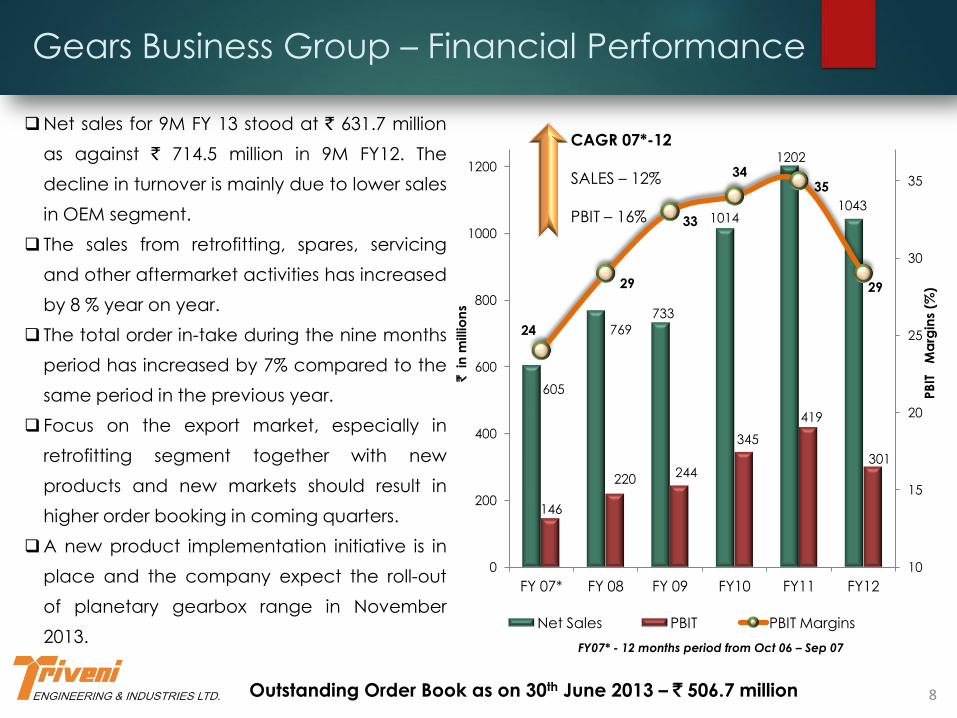
8 Outstanding Order Book as on 30th June 2013 – ` 506.7 million
FY07* - 12 months period from Oct 06 – Sep 07
605
769
733
1014
1202
1043
146
220 244
345
419
301
24
29
33
34 35
29
10
15
20
25
30
35
0
200
400
600
800
1000
1200
FY 07* FY 08 FY 09 FY10 FY11 FY12
PB
IT
Ma
rgin
s (%
)
` in
millio
ns
Net Sales PBIT PBIT Margins
CAGR 07*-12
SALES – 12%
PBIT – 16%
Net sales for 9M FY 13 stood at ` 631.7 million
as against ` 714.5 million in 9M FY12. The
decline in turnover is mainly due to lower sales
in OEM segment.
The sales from retrofitting, spares, servicing
and other aftermarket activities has increased
by 8 % year on year.
The total order in-take during the nine months
period has increased by 7% compared to the
same period in the previous year.
Focus on the export market, especially in
retrofitting segment together with new
products and new markets should result in
higher order booking in coming quarters.
A new product implementation initiative is in
place and the company expect the roll-out
of planetary gearbox range in November
2013.

Water Industry – Potential To Grow
Rising Water Demand to double by 2025 from 2000 levels - Growth potential in coming years in both
major segments – Municipal and Industrial.
Multi-lateral funding actively promoting privatisation and commercialisation of water.
Jawaharlal Nehru National Urban Renewal Mission (JNNURM) – annual estimated water related
schemes of `13-15 billion.
Substantial new power generation capacities to be added; Largest user of water & waste water
treatment - Annual estimated market size of ` 10-13 billion for water business.
Major expansion and capacity additions envisaged in steel, coal etc. – estimated annual market of
` 7-12 billion.
High cost & scarcity of water driving manufacturing industry to have In-house water management
and water recycling programs.
Stricter regulations for environmental compliance in terms of effluent and pollution control.
9

Water Business – Business Perspective
Technology association with world’s leading technology
providers for various products, process & solutions such as Ultra
filtration (UF), Reverse Osmosis (RO), Moving Bed Bio Reactor
(MBBR) etc.
One of the widest ranges of products & technologies offered in
the Indian Market. Indigenous Product lines include clarifiers,
aerators, filters, membrane solutions, de-watering equipment
and high purity water systems.
Over 2000 numbers of process equipments for water & waste
water treatment applications, supplied and commissioned till
date.
With the visibility of a fast growing market, Water Business
expected to grow consistently in future.
During FY12, the company has made a long term strategic
investment by acquiring 25.04% equity stake in Aqwise-Wise
Water Technologies Limited, a company registered in Israel,
engaged in providing water treatment solutions using proprietary
technology. The investment is synergistic to the water / waste
water business of the company.
10

Water Business – Financial Performance
400
668
997
1610
1866
1692
46 105
148 219 232
123
12
16
15 14
12
7
5
7
9
11
13
15
17
0
100
200
300
400
500
600
700
800
900
1000
1100
1200
1300
1400
1500
1600
1700
1800
1900
FY 07 (*) FY 08 FY 09 FY 10 FY 11 FY 12
PB
IT M
arg
ins
(%)
` i
n m
illi
on
s
Net Sales PBIT PBIT Margins
FY07* - 12 months period from Oct 06 – Sep 07
Outstanding order Book as on 30th June 2013 - ` 4.24 billion (including O&M)
There has been slow down in the order-intake
from industrial segment and also no major
municipal projects were finalised during Q3 FY13,
which resulted in significantly lower order-inflow
during the current 9M vis a vis previous year.
However, we have seen some significant order
finalisation in July 2013, and on account of
which, the order inflow for Q4 should be healthy,
but only from certain sectors.
Unless the overall situation is improved, the order
execution and booking may remain lumpy in the
coming quarters.
Even though substantial capital expenditure is
planned in the thermal power, metal &
hydrocarbon segments, by major players, the
finalisation of the same is getting delayed on
account of the overall economic scenario.
CAGR 07*-12
SALES – 33%
PBIT – 22%
11

Sugar Business
12
Sugar Business
SUGAR BUSINESS
One of the largest sugar producers in
India with seven sugar manufacturing
facilities
DISTILLERY BUSINESS
One of the largest single stream
molasses based distillery in the
country located at Muzaffarnagar
CO-GENERATION BUSINESS
Two state of the art co-generation
facilities at two of its major sugar units viz.
Khatauli and Deoband

Sugar Industry Overview
India:
Contrary to initial estimates of much lower sugar production for the 2012-13 season, India's estimated
sugar production for the current season is at 25.2 million tonnes, which is only a marginal decline from the
previous year's sugar production.
According to recent industry data on early estimates, the country’s sugar production may fall by ~7% to
23.5 MT in 2013-14 sugar year. It is estimated that sugar production for Maharashtra could decline by
around 23% to 6.1 million tonnes in the SY 2013-14 from 7.9 million tonnes in the current year while
Karnataka’s output might fall to 2.7 million tonnes in the next year from 3.1 million tonnes in the current
year.
Sugar output of Uttar Pradesh is expected to increase to 8.2 million tonnes in SY 2013-14 from 7.7 million
tonnes during SY 2012-13. As per the recent Government data, in UP, sugarcane has been planted in
20.50 lakh hectares, which is 1.65% more than corresponding last year, though there was a delay in
planting due to the delayed wheat harvest.
Global:
it is estimated that the global production will be a record 10 million tonnes more than consumption in
2012-2013, further impacting the global sugar prices.
According to recent industry reports, preliminary projections for 2013/14 indicate to a fourth year of
global sugar surplus, estimated to be around 3.7 million tonnes of sugar.
13

Sugar Industry Overview
India:
It has been gathered that the Government of Karnataka has already enacted an Act in May 2013
deciding to form a sugar board and prescribing that the sugarcane price will be based on the
revenue sharing model in line with the reforms recommendations of Dr. Rangarajan Committee. We
expect other states to follow on a similar manner.
The Central government announced a 24% rise in Fair & Remunerative Price (FRP) of sugarcane for
the 2013-14 at ` 210 per quintal. The FRP is linked to a basic recovery rate of 9.5%, subject to a
premium of ` 2.21 for every 0.1 percentage point increase in recovery above 9.5%. This may further
impact the financial performance of the sugar mills especially U.P. based mills where normally the
SAP announced by the state government has always been higher than the FRP.
The sugar prices have declined by 12-15% over the past 7-9 months, ever since SAP was set. Sugar
imports of 6,50,000 tonnes coupled with surplus output led to a decline in prices.
At the current exchange rate, further imports are not expected and in fact, these may even
stimulate export of sugar.
It is also possible that the declining sugar prices may be the result of accelerated selling by sugar
mills consequent to decontrol to maintain liquidity, in which case, there could be a potential for the
prices to improve in future. Central Government announced a hike in import duty to 15% from 10%
in July 2013. It is expected that this will boost sugar sales and has halted imports.
14

Sugar Industry Overview
(Figures in million tonnes)
Closing stock taken as a percent of consumption is one of the indicators of sugar price movement.
2006-07 2007-08 2008-09 2009-10 2010-11 2011-12 2012-13
(E)
Opening Stock as on 1st Oct. 4.3 11.0 10.4 4.4 5.0 5.5 6.5
Production during the Season 28.3 26.3 14.5 18.9 24.4 26.3 25.0
Imports - - 2.5 4.0 0 0 0.7
Total Availability 32.6 37.3 27.4 27.3 29.4 31.8 32.2
Off-take
I) Internal Consumption 19.9 21.9 23.0 21.3 20.8 22.0 23.0
ii)Exports 1.7 5.0 0.02 0.2 2.6 3.4 0.1
Total off-take 21.6 26.9 23.0 21.5 23.4 25.4 23.1
Closing Stock as on 30th Sept. 11.0 10.4 4.4 5.8 6.0 6.5 9.1
Stock as % of Off-take 55.3% 47.7% 19.1% 27.2% 28.9% 29.5% 40.0%
Source: ISMA
15

Sugar Business
Major facilities located in cane rich areas
of Western Uttar Pradesh with more than
80% cane intensity – fertile and irrigated
land
Sugar cane catchment area for all sugar
units under canal irrigation – both in
Western & Central Uttar Pradesh - Lower
dependency on monsoon
Closer to country’s major sugar
consuming markets - better realizations &
lower transportation cost. Long term
relationship with ~ 250,000 farmers
Extensive sugar cane development
programme – to develop new areas
under cane cultivation in our new
locations; improving yields of cane across
the units.
Deoband
Khatauli
Ramkola
Chandanpur
Sabitgarh
Milak
Narayanpur
Rani Nangal
Uttar Pradesh
16

Sugar Business
FY07* - 12 months period from Oct 06 – Sep 07
Triveni crushed 5.63 million tonnes cane at an average recovery of 9.28% in FY13 which is higher by
0.19% in comparison to the previous season.
Chandanpur & Milak Narayanpur units have started incidental co-generation during the season which
resulted in a revenue from incidental co-generation at ` 43.7 million for the year.
The refinery at Sabitgarh sugar unit was commissioned and operated during the season. The company
has taken steps to set refinery plant at Khatauli Sugar plant which will be operational from 2013-14
season.
Net sales during 9M FY13 stood at ` 12207.3 million as against ` 11045.4 million during the corresponding
period of last year.
The cost of production of sugar produced in 2012-13 being higher than the estimated realisable value,
sugar inventories have been written down by ` 540.8 million. The higher cost of production was a direct
consequence of unrealistically high cane price.
FY 07 (*) FY 08 FY 09 FY 10 FY 11 FY 12
Net Sales (` in millions) 7605 8863 12529 14055 13434 14821
PBIT (` in millions) (900) 359 2023 (573) 74 29
PBIT Margins (%) NM 4 16 NM 0.6 0.2
Sugar Manufactured (000 t) 591 580 336 506 420 465
17

Sugar Business - Co-generation Business
18
Three plants in two sugar units viz. Khatauli &
Deoband.
The operating days of co-generation units during
Q3 FY13 were higher compared to the same period
last year. Consequently, the power generation
during nine months has been higher by approx. 8%
when compared to corresponding period of last
year. The operating efficiency of the plants
continued to be excellent.
Currently, CERs are being held by the Company in
respect of Khatauli and Deoband for the period up
to February 2012. As the prices of carbon credits
continue to remain sluggish, the same will be sold
at an appropriate time and accordingly, revenue
will be recognised. It is expected that the
impediments relating to issuance of RECs in U.P.
may get resolved during Q4.
1339
1174
948
1467
1171
1293
449 476
201
270
366
499
34
41
21 18
31
39
0
5
10
15
20
25
30
35
40
45
0
100
200
300
400
500
600
700
800
900
1000
1100
1200
1300
1400
1500
FY07 (*) FY 08 FY 09 FY 10 FY 11 FY 12
PB
IT M
argi
ns
(%)
` i
n m
illio
ns
Net Sales PBIT PBIT Margins
FY07* - 12 months period from Oct 06 – Sep 07

Sugar Business - Distillery Business
19
Distillery turnover increased by 16% during nine
months period under review as compared to the
same period last year due to higher sales volume
by 8% and higher average realisation prices of
around 8%.
Distillery production during the nine months is
higher due to a longer operational period of an
additional 26 days over the corresponding
period. On account of higher realisation, the
profit for both the quarter and nine months has
been significantly higher.
As compared to previous year, the share of ENA
in the product mix this year was much higher.
In the E-tender of ethanol, company had applied
for supply of ethanol to Oil Marketing Companies
(OMCs). Ethanol supplies started only in May 2013
and based on skeletal schedule received from
OMCs, supplies have commenced.
FY07* - 12 months period from Oct 06 – Sep 07
182
737
539
889
762
1264
23
177
92 81 90
272
13
24
17
9
12
22
0
5
10
15
20
25
0
100
200
300
400
500
600
700
800
900
1000
1100
1200
1300
FY07 (*) FY 08 FY 09 FY 10 FY 11 FY 12
PB
IT M
argi
ns
(%)
` i
n m
illio
ns
Net Sales PBIT PBIT Margins

Sugar Business – Operational Performance
Q3 FY 13 Q3 FY 12 9M FY13 9M FY 12
Power Generated – (million units) 40.10 16.87 231.30 214.87
Power exported – (million units) 25.90 12.61 150.61 142.74
Q3 FY 13 Q3 FY 12 9M FY 13 9M FY 12
Production (KL) 13,592 13,329 40,128 36,242
Sales (KL) 12,507 10,036 32,335 29,888
Avg. realisation (`/ ltr) 32.17 28.84 33.23 30.84
Distillery Business
Co-generation Business

9M FY13 Financial Performance
15411
13823
Net Sales (` In Million) (Overall)
9M FY 13 9M FY 12
9M FY 13 9M FY 12
14698 13262
1858 2054
Revenue Composition (` In Million)
Sugar Engineering
Sugar Co-generation Distillery
12207
1395 1096
11045
1271 946
Net Turnover – Sugar Business (` In Million)
9M FY13 9M FY12
Gears Water
632
1226
715
1340
Net Turnover – Engineering Business
(` In Million)
9M FY13 9M FY12

22
9M FY 13 9M FY 12 Sep FY 12
507 635 486
4240 4950 4850
Order Book in Millions GBG WBG
Total – 5336 Total - 4747 Total - 5585
9M FY13 Financial Performance
23
Triveni Turbine Ltd. (TTL)
50% plus one share
TEIL is holding 72 million equity shares of ` 1/- each in TTL - 21.8% of the total
equity capital of ` 330 million

TTL – Pan India Presence
24
Manufacturing Facility
Marketing and Service Centres
NOIDA
Allahabad
Kolkata
Ahmedabad
Mumbai
Kolhapur
Bengaluru
Vijaywada
Raipur
Hyderabad
Latur Nagpur
Pune
Key Differentiator

25
TTL – Business Perspective
Cater to wide range of customers across segments like sugar, paper, co-gen, textiles, pharma,
steel, IPP.
Consistently upgrading the product range and efficiency.
The current range of product up to 30MW.
Manufacturing since 1968; over 2,500 turbines manufactured and sold since inception.
Highly efficient turbines with indigenously developed tapered twisted blades.
Fully integrated operations with strong Engineering & Design team.
Facility equipped with state of the art equipments and machine tools best in the industry.
Strong in-house R&D team and tie-ups with leading international design and R&D establishments.
In-house learning centre – to create pool of technical team for design, engineering and servicing.
Consistently maintained dominant market share. Commands market leadership for range up to 30
MW.

Efficient Products
Product
Product
Straight Condensing Type
Controlled Extraction
Condensing Type
Un-Controlled Extraction
Condensing Type
Injection Condensing Type
Straight Back Pressure Type
Power Generation
Capacity
Up to 30 MW Up to 30 MW
Steam Inlet Temperature Up to 535°C Up to 535°C
Steam Inlet Pressure Up to 110 Bar (a) Up to 110 Bar
(a)
Product
Product
Triveni Turbines

Unparallel Service
13 service centres
180 service professionals
Over 900 turbines
Serviced annually
24X7 customer care
support
Aftermarket Services are integrated under Customer Care Cell
(CCC) which provides solutions for all after-sales requirements
from erection and commissioning (E&C) to maintenance and
spare parts to efficiency improvement.
Full speed vacuum balancing tunnel for
balancing turbines, compressors/alternators
– can undertake balancing for turbo
machines up to 200 MW depending on
specifications.
Overhauling & troubleshooting.
Refurbishment & Residual Life Assessment of
all makes of turbines, compressors etc.
Customization & upgradation of old turbines
for both industrial and utility segments in
India and Asia Pacific market.
Currently offering refurbishment solutions for
higher MW turbines for all makes.

Diverse Applications & Industry Segments
Co-generation
Captive Power Plant
Combined Heat & Power
CCP / Waste Heat
Recovery
Incineration
Biomass
Sugar
Palm Oil
Distillery
Pulp & Paper
Food Processing
Textiles
Steel & Metal
Carbon Black
Cement
Chemicals & Fertilisers
Oil & Gas and
Petrochemical
District Heating & Cooling
Municipal Solid waste
29
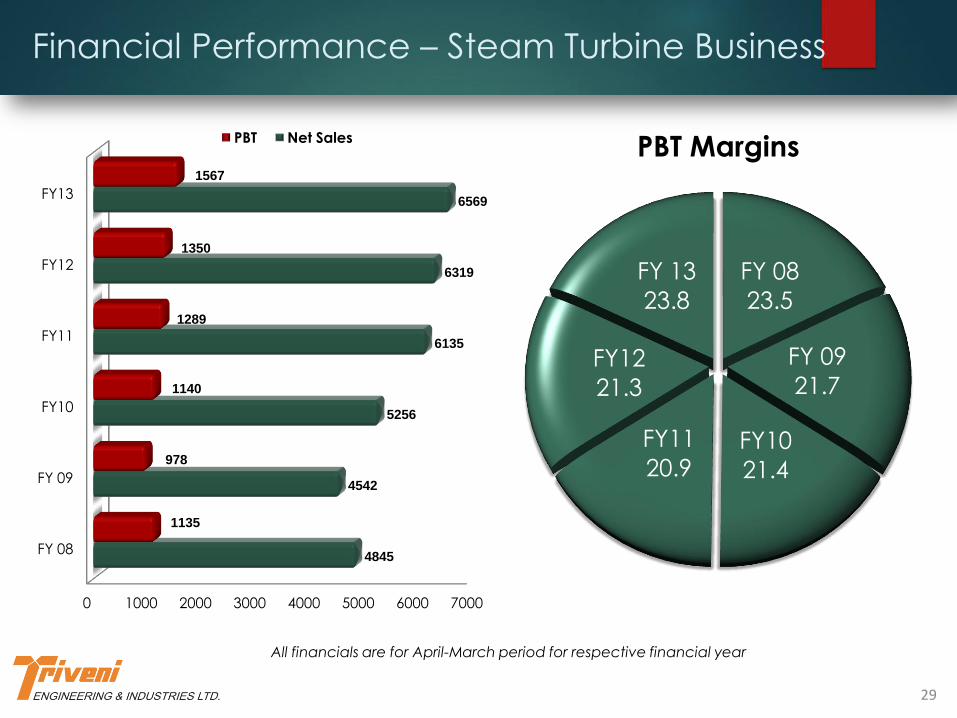
Financial Performance – Steam Turbine Business
All financials are for April-March period for respective financial year
0 1000 2000 3000 4000 5000 6000 7000
FY 08
FY 09
FY10
FY11
FY12
FY13
4845
4542
5256
6135
6319
6569
1135
978
1140
1289
1350
1567
PBT Net Sales
FY 08
23.5
FY 09
21.7
FY10
21.4
FY11
20.9
FY12
21.3
FY 13
23.8
PBT Margins
30
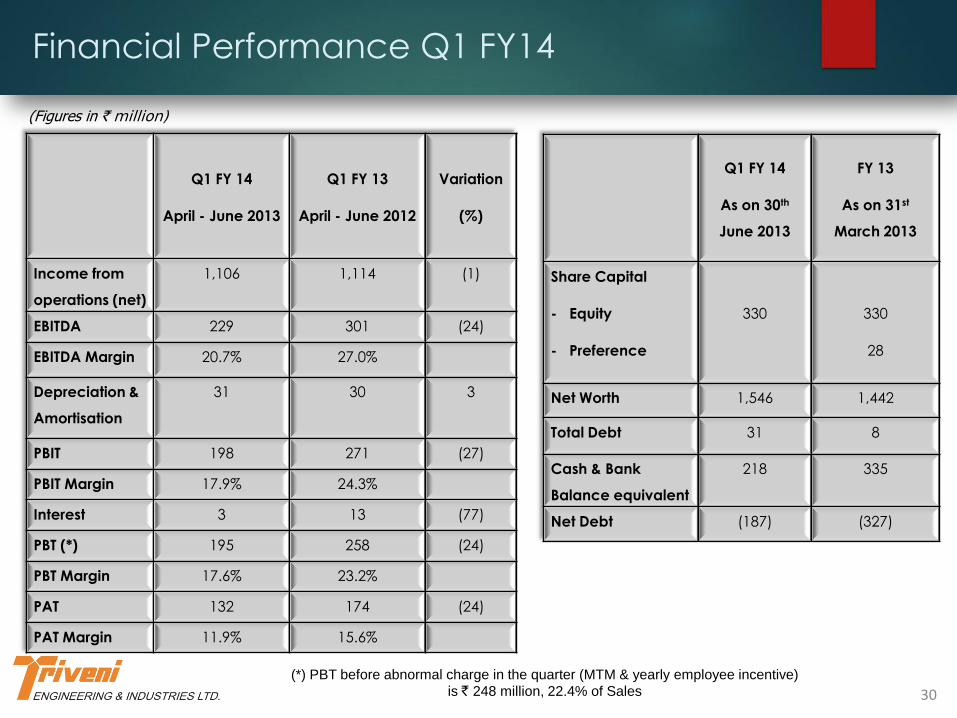
Financial Performance Q1 FY14
(Figures in ` million)
Q1 FY 14
April - June 2013
Q1 FY 13
April - June 2012
Variation
(%)
Income from
operations (net)
1,106 1,114 (1)
EBITDA 229 301 (24)
EBITDA Margin 20.7% 27.0%
Depreciation &
Amortisation
31 30 3
PBIT 198 271 (27)
PBIT Margin 17.9% 24.3%
Interest 3 13 (77)
PBT (*) 195 258 (24)
PBT Margin 17.6% 23.2%
PAT 132 174 (24)
PAT Margin 11.9% 15.6%
Q1 FY 14
As on 30th
June 2013
FY 13
As on 31st
March 2013
Share Capital
- Equity
- Preference
330
330
28
Net Worth 1,546 1,442
Total Debt 31 8
Cash & Bank
Balance equivalent
218 335
Net Debt (187) (327)
(*) PBT before abnormal charge in the quarter (MTM & yearly employee incentive)
is ` 248 million, 22.4% of Sales

31
Financial Performance Q1 FY14
The overall turnover for the quarter is the
same as last year, uneven sales for the
quarter is a characteristic of the business, of
which the order booking to delivery cycle is
a major component.
The mix of product and aftermarket for Q1
FY 14 has been 78:22, with the share of
aftermarket increasing by 10% over the
corresponding quarter of the previous year.
The mix of domestic and export sales for the
quarter has been 65:35.
Current quarter profitability impacted by `
53 million on account of MTM loss on foreign
exchange of ` 24 million & yearly incentive
payment to employees of ` 29 million
(Previous year paid in Q2).
The enquiry book from the international
market is growing as the company is
expanding our market reach into new
geographies.
Order-intake during the quarter has been
lower, mainly due to delays in the
finalisation of export orders.
The Company has adopted a focused
approach towards the export market
and is deploying more resources to
intensify efforts in the potential markets.
The outstanding order book for the
company as on 30th June 2013 is ` 4.8
billion which includes about ` 340 million
from the aftermarket segment.

32
Joint Venture with General Electric (GE)
Triveni Turbine Ltd. formed a 50:50 Joint Venture
with GE on 15th April 2010. GE Triveni Ltd. (GETL)
headquartered in Bengaluru, a subsidiary of TTL,
will design, supply, sell and service advanced
technology steam turbines in India in the range
above 30-100MW for power generation
applications in India and globally.
GETL to get technology and on-going R&D
support from GE and TTL and will use TTL’s
Bengaluru facility for turbine manufacturing.
The operations of the joint venture with GE are in
line with our expectation. All key managerial
personnel are on board and the technology
transfer is progressing as per schedule.
The marketing teams of both GE and Triveni are
working closely on the opportunities in their
respective markets.
The JV is currently responding to the enquiries
both in the domestic market and to a diverse
international market ranging from Canada to
Indonesia.
GETL dispatched its first turbine of 35 MW
which is under commissioning.
GETL received a breakthrough order for two
turbines of 40 MW each through one of the
largest power sector Engineering,
Procurement and Construction (EPC)
Company, for a new 80 MW distributed power
plant that will generate power for a leading
GoI Enterprise engaged in mining & metal
industry at its new 3 million tonne per annum
integrated steel plant in Central India.
During Q1 FY13, GETL received one more
order for a 45 MW Turbo generator from a
leading cement manufacturing company in
India.

33
CN Narayanan
Triveni Engineering & Industries Ltd.
Tel. +91 120 430 8000 Fax : +91 120 431 1010
Gavin Desa/ Rishab Barar
Citigate Dewe Rogerson
Tel: +91 22 66451238
[email protected] / [email protected]
-----------------------------------------------------------------------------------------------------------------
DISCLAIMER: Some of the statements in this presentation that are not historical facts are forward looking statements. These forward-looking statements include our financial and growth projections as well as statements concerning our plans, strategies, intentions and beliefs concerning our business and the markets in which we operate. These statements are based on information currently available to us, and we assume no obligation to update these statements as circumstances change. There are risks and uncertainties that could cause actual events to differ materially from these forward-looking statements. These risks include, but are not limited to, the level of market demand for our services, the highly-competitive market for the types of services that we offer, market conditions that could cause our customers to reduce their spending for our services, our ability to create, acquire and build new businesses and to grow our existing businesses, our ability to attract and retain qualified personnel, currency fluctuations and market conditions in India and elsewhere around the world, and other risks not specifically mentioned herein but those that are common to industry. Further, this presentation may make references to reports and publications available in the public domain. Triveni Engineering & Industries Ltd. makes no representation as to their accuracy or that the company subscribes to those views / findings.
Contact


![Hydel Power Potential of Pakistan[1]embassyofpakistanusa.org/.../05/Hydel-Power-Potential-of-Pakistan1.pdf · Hydel Power Potential of Pakistan And Hydel Power Policy 1995 In Pakistan,](https://static.fdocuments.net/doc/165x107/5e89981e09d0bf793f5533d6/hydel-power-potential-of-pakistan1-hydel-power-potential-of-pakistan-and-hydel.jpg)