TrimSize: 7in x10in Pruitt flast.tex V3 -05/05/2016 3:52...
30
Transcript of TrimSize: 7in x10in Pruitt flast.tex V3 -05/05/2016 3:52...

Trim Size: 7in x 10in Pruitt flast.tex V3 - 05/05/2016 3:52 P.M. Page xii

Trim Size: 7in x 10in Pruitt ffirs.tex V2 - 05/05/2016 12:29 A.M. Page i
THE ULTIMATEALGORITHMIC
TRADING SYSTEMTOOLBOX

Trim Size: 7in x 10in Pruitt ffirs.tex V2 - 05/05/2016 12:29 A.M. Page ii
The Wiley Trading series features books by traders who have survived the market’s
ever changing temperament and have prospered—some by reinventing systems,
others by getting back to basics. Whether a novice trader, professional, or
somewhere in between, these books will provide the advice and strategies needed
to prosper today and well into the future. For more on this series, visit our website
at www.WileyTrading.com.
Founded in 1807, John Wiley & Sons is the oldest independent publishing
company in the United States. With offices in North America, Europe, Australia, and
Asia, Wiley is globally committed to developing and marketing print and electronic
products and services for our customers’ professional and personal knowledge and
understanding.

Trim Size: 7in x 10in Pruitt ffirs.tex V2 - 05/05/2016 12:29 A.M. Page iii
THE ULTIMATEALGORITHMIC
TRADING SYSTEMTOOLBOX
+ WebsiteUsing Today’s Technology to Help
You Become a Better Trader
George Pruitt

Trim Size: 7in x 10in Pruitt ffirs.tex V2 - 05/05/2016 12:29 A.M. Page iv
Copyright C 2016 by George Pruitt. All rights reserved.
Published by John Wiley & Sons, Inc., Hoboken, New Jersey.
Published simultaneously in Canada.
No part of this publication may be reproduced, stored in a retrieval system, or transmitted in any form or byany means, electronic, mechanical, photocopying, recording, scanning, or otherwise, except as permittedunder Section 107 or 108 of the 1976 United States Copyright Act, without either the prior written permissionof the Publisher, or authorization through payment of the appropriate per-copy fee to the Copyright ClearanceCenter, Inc., 222 Rosewood Drive, Danvers, MA 01923, (978) 750-8400, fax (978) 646-8600, or on the Webat www.copyright.com. Requests to the Publisher for permission should be addressed to the PermissionsDepartment, John Wiley & Sons, Inc., 111 River Street, Hoboken, NJ 07030, (201) 748-6011, fax (201)748-6008, or online at http://www.wiley.com/go/permissions.
Limit of Liability/Disclaimer of Warranty: While the publisher and author have used their best efforts inpreparing this book, they make no representations or warranties with respect to the accuracy or completenessof the contents of this book and specifically disclaim any implied warranties of merchantability or fitness for aparticular purpose. No warranty may be created or extended by sales representatives or written sales materials.The advice and strategies contained herein may not be suitable for your situation. You should consult with aprofessional where appropriate. Neither the publisher nor author shall be liable for any loss of profit or anyother commercial damages, including but not limited to special, incidental, consequential, or other damages.
For general information on our other products and services or for technical support, please contact ourCustomer Care Department within the United States at (800) 762-2974, outside the United States at (317)572-3993 or fax (317) 572-4002.
Wiley publishes in a variety of print and electronic formats and by print-on-demand. Some material includedwith standard print versions of this book may not be included in e-books or in print-on-demand. If this bookrefers to media such as a CD or DVD that is not included in the version you purchased, you may download thismaterial at http://booksupport.wiley.com. For more information about Wiley products, visitwww.wiley.com.
Library of Congress Cataloging-in-Publication Data:
Names: Pruitt, George, 1967- author.Title: The ultimate algorithmic trading system toolbox + website : using today’s
technology to help you become a better trader/George Pruitt.Description: Hoboken : Wiley, 2016. | Series: Wiley trading | Includes index.Identifiers: LCCN 2016010889 (print) | LCCN 2016011196 (ebook) | ISBN 9781119096573 (hardback) |
ISBN 9781119262961 (pdf) | ISBN 9781119262978 (epub)Subjects: LCSH: Electronic trading of securities. | Investment analysis. | Futures. | BISAC:
BUSINESS & ECONOMICS/Finance.Classification: LCC HG4515.95 .P788 2016 (print) | LCC HG4515.95 (ebook) |
DDC 332.640285/4678—dc23LC record available at http://lccn.loc.gov/2016010889
Cover Design: WileyCover Images: C agsandrew/Shutterstock
Printed in the United States of America.
10 9 8 7 6 5 4 3 2 1
Trim Size: 7in x 10in Pruitt ftoc.tex V3 - 05/05/2016 3:52 P.M. Page v
v
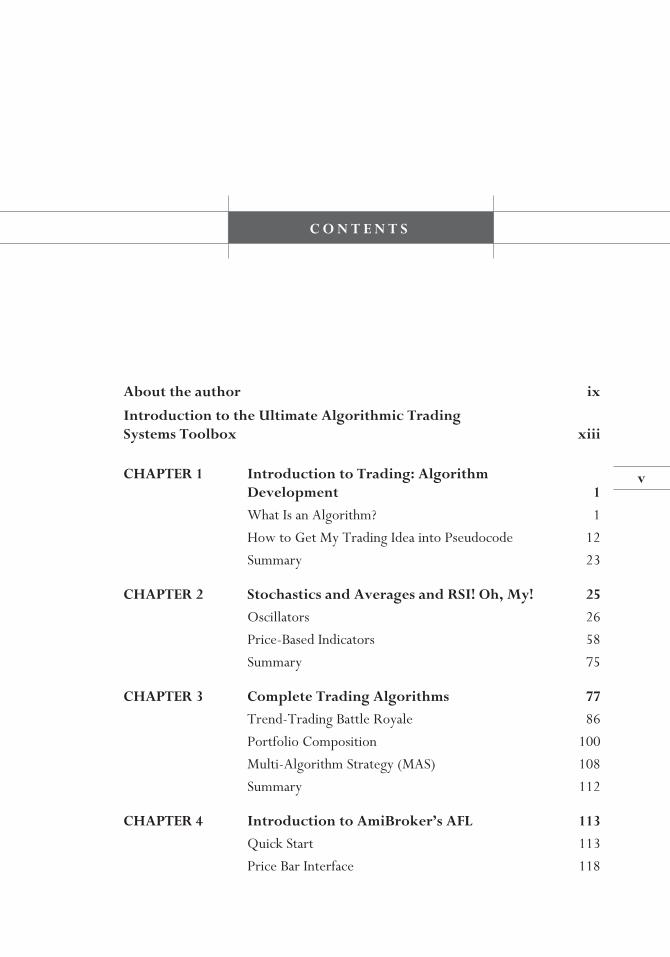
C O N T E N T S
About the author ix
Introduction to the Ultimate Algorithmic TradingSystems Toolbox xiii
CHAPTER 1 Introduction to Trading: AlgorithmDevelopment 1
What Is an Algorithm? 1
How to Get My Trading Idea into Pseudocode 12
Summary 23
CHAPTER 2 Stochastics and Averages and RSI! Oh, My! 25
Oscillators 26
Price-Based Indicators 58
Summary 75
CHAPTER 3 Complete Trading Algorithms 77
Trend-Trading Battle Royale 86
Portfolio Composition 100
Multi-Algorithm Strategy (MAS) 108
Summary 112
CHAPTER 4 Introduction to AmiBroker’s AFL 113
Quick Start 113
Price Bar Interface 118

Trim Size: 7in x 10in Pruitt ftoc.tex V3 - 05/05/2016 3:52 P.M. Page vi
CO
NT
ENT
S
vi
AFL Array Programming 120
Syntax 129
AFL Wizard 133
AmiBroker Loop Programming 139
Summary 140
CHAPTER 5 Using Microsoft Excel to Backtest YourAlgorithm 145
VBA Functions and Subroutines 147
Data 148
Software Structure 149
Programming Environment 154
Summary 163
CHAPTER 6 Using Python to Backtest Your Algorithm 167
Why Python? 167
Python Installation 169
PSB Installation 169
PSB Structure 171
Getting Down to Business 193
Summary 202
CHAPTER 7 An Introduction to EasyLanguage 203
TradeStation IDE 204
Syntax 209
Samples of EasyLanguage 221
Summary 224
CHAPTER 8 Genetic Optimization, Walk Forward, andMonte Carlo Start Trade Analysis 227
Utilizing TradeStation and AmiBroker 227
Computers, Evolution, and Problem Solving 230
Population 231
Initial Population Setup Using VBA Excel 232
Testing Fitness of Chromosomes Using VBA Excel 232
Selection 233

Trim Size: 7in x 10in Pruitt ftoc.tex V3 - 05/05/2016 3:52 P.M. Page vii
CO
NT
ENT
S
vii
Reproduction 238
Mutation 240
Using Genetic Algorithms in Trading SystemDevelopment 243
Preventing Over-Curve-Fitting 247
Walk-Forward Optimizer: Is It Worth the ExtraWork and Time? 249
Monte Carlo Analysis 258
Start Trade Drawdown 264
Summary 269
CHAPTER 9 An Introduction to Portfolio Maestro,Money Management, and Portfolio Analysis 271
Fixed Fractional 272
Portfolio Maestro 272
Summary 290
APPENDIX A AmiBroker 293
Keywords 293
Flow Control Structures 294
Functions 295
Utilizing Exploration for Debugging 295
Position Sizing in Futures Mode 298
APPENDIX B Excel System Backtester 301
Data Arrays 301
Keywords 302
Functions and Subroutines 302
APPENDIX C Python System Backtester 309
Data Arrays or Lists 309
Keywords and Identifiers 310
Classes 310
Indicator Classes and Functions 315
Python-Specific Keywords 320

Trim Size: 7in x 10in Pruitt ftoc.tex V3 - 05/05/2016 3:52 P.M. Page viii
CO
NT
ENT
S
viii
APPENDIX D TradeStation and EasyLanguage 323
Importing ELD file from Book Website 323
Keywords and Functions 324
Sample Algorithm Codes 325
APPENDIX E 335
About the Companion Website 337
Index 339

Trim Size: 7in x 10in Pruitt flast.tex V3 - 05/05/2016 3:52 P.M. Page ix
ix
A B O U T T H E A U T H O R
It was March of 1989 as I drove my beat-up Dodge up Hillside Rd. in Hendersonville,NC. In an attempt to pay for my last semesters of college I was answering a
classified ad that was looking to hire a computer programmer. As I drove up the thindrive I passed several houses and then through a gate attached to two large stonepillars. I stopped the car and looked down at the ad again to make sure I was atthe right place. I proceeded down the country lane and the view opened up into alarge meadow. At the end of the lane was a circular drive and large farm house. AsI circled and went back down the road I thought to myself I must have the wrongaddress or directions. So I followed the small road back down the main highwayand then to a small convenient store. Once there I asked myself again what type ofbusiness was this Futures Truth and if I should call and get directions or just simplyforget about it. Curiosity and the need for money were too much so I used thestore’s pay phone and called the number once again.
‘‘Hello—Futures Truth, may I help you?’’ a lady’s voice answered.‘‘Yes, this is George Pruitt and I made an appointment for an interview but I
can’t seem to find your office.’’‘‘Do you drive a red Dodge?’’ she asked.‘‘Yes I do. How did you know?’’‘‘We saw you drive right by the office. When you come through the two stone
pillars turn immediately to the left. Don’t go all the way down the drive—that’s theowner’s house.’’

Trim Size: 7in x 10in Pruitt flast.tex V3 - 05/05/2016 3:52 P.M. Page x
ABO
UT
TH
EA
UT
HO
R
x
So I follow the directions and find myself in front of a small house. I knock onthe door and John Fisher opens and invites me in. We go through the normal Qand A for a job interview and he finally asks if I knew FORTRAN. My first collegeprogramming class was FORTRAN so I confidently answered, ‘‘Sure!’’
He then asked me if I knew anything about the Futures market. I vaguelyremembered the term from one of my economics classes and of course from theEddie Murphy movie and answer him with the question, ‘‘You mean like TradingPlaces with Eddie Murphy?’’
John Fisher said ‘‘Sort of like that—yes.’’He went on to explain how Futures Truth tried to determine market direction
in the most widely traded futures contracts by using trading systems. The tradingsystems were programmed in FORTRAN and they needed help with the program-ming. In addition to trading they also published a newsletter in which they trackedpublicly offered trading systems.
I asked, ‘‘Do people really buy these programs?’’John Fisher said yes and by that time an older gentlemen walked into the office and
stated that he had spent thousands of dollars on these programs and was ultimatelyripped off. John Hill stated this was the main reason he started Futures Truth. Hewanted to bring truth to the trading system industry. Both Johns told me that mosttraders couldn’t afford to validate the trading systems because of the cost of thecomputer equipment, data, and software. John Fisher pointed to the computer hewas working on and asked, ‘‘How much do you think this Macintosh II cost?’’
I answered him, ‘‘I am not that familiar with Macs but I know they aren’t cheap.’’My mouth fell open when he said ‘‘$4,000 and we have three of them.’’
Remember this was way back in 1989 when computers were not cheap.I was thinking to myself that they got ripped off because they could have got
a much cheaper and better computer with the IBM PS/2. And what was up withusing FORTRAN? Did they not know ‘‘C’’ was the new programming languageof the 1990s? John Fisher chose the Apple Macintosh because of its easy-to-usegraphical user interface (GUI) and FORTRAN because many traders and hobbyistprogrammers had knowledge of this language.
John Fisher also said that he and John Hill had developed what they consideredthe best testing platform, ‘‘Excalibur.’’ This platform could load decades of dailyand intraday data and test any trading idea that could be defined in an algorithmicform. He also said the only thing that was missing was a charting application andthat was where they also needed help.
I explained that I would be wrapping up my degree after summer and both Johnsagreed that I could work part time in the evening until I graduated and then wecould go from there.

Trim Size: 7in x 10in Pruitt flast.tex V3 - 05/05/2016 3:52 P.M. Page xi
ABO
UT
TH
EA
UT
HO
R
xi
Well that was 27 years ago and I did work part time until I graduated with adegree in computer science from the University of North Carolina at Asheville. The‘‘Excalibur Chart’’ project turned into my senior project, which blew my professorsaway. Over the years I have worked with many trading firms in the developmentof trading algorithms and testing platforms. I have seen it all and have had the greatpleasure to be educated by some of the greatest minds in the industry, includingJohn Fisher, John Hill Sr. and John Hill Jr. Even with this experience and educationthe ultimate trading system still eludes me. As John Hill has stated many times, ‘‘Aspeculator who dies rich, dies before his time!’’ This may be true, but I have seentraders make millions, lose millions, and make millions again. The one thing theyalways do when they fail is get right back up, dust themselves off, and start searchingfor the next great trading algorithm.

Trim Size: 7in x 10in Pruitt flast.tex V3 - 05/05/2016 3:52 P.M. Page xii

Trim Size: 7in x 10in Pruitt flast.tex V3 - 05/05/2016 3:52 P.M. Page xiii
xiii
I N T R O D U C T I O N T O T H E U L T I M A T EA L G O R I T H M I C T R A D I N G
S Y S T E M S T O O L B O X
If you want to learn more about high-frequency trading utilizing special orderplacement/replacement algorithms such as Predatory trading, Pinging, Point of
Presence, or Liquidity Rebates, then this book is not for you. However, if youwant to learn about trading algorithms that help make a trading decision, trade size,money management, and the software used to create these algorithms, then you’rein the right place.
This book is designed to teach trading algorithm development, testing, andoptimization. Another goal is to expose the reader to multiple testing platformsand programming languages. Don’t worry if you don’t have a background inprogramming; this book will provide enough instruction to get you started indeveloping your own trading systems. Source code and instructions will be providedfor TradeStation’s EasyLanguage, AmiBroker’s AFL, and my own Python andExcel testing engines. I chose these platforms because they give a nice overview ofdifferent scripting languages and trading platforms. Users of different testing/tradingplatforms may criticize my decision to use just these platforms, but the EasyLanguagesource code that will be provided can be easily ported into Multi-Charts, andAmiBroker’s unique and powerful platform provides a complete trading solution.My Python and Excel software, including all source code, are included on theassociated website as well as the EasyLanguage and AFL source code for the otherplatforms. I didn’t include the use of Python’s scientific libraries, NumPy or SciPy,because I wanted to keep things as simple as possible. Also I used the bare-bonesIDLE (Python’s own simple Integrated Development Environment) to cut downon the learning curve—I wanted to get to the bare essentials of Python withoutmuddying the water with a sophisticated IDE. Many successful Quants utilize R
Trim Size: 7in x 10in Pruitt flast.tex V3 - 05/05/2016 3:52 P.M. Page xiv
INT
RO
DU
CT
ION
TO
TH
EU
LTIM
AT
EA
LGO
RIT
HM
ICT
RA
DIN
G
xiv
(a GNU project for statistical computing), but again to keep things simple I stuck withthe easy-to-learn Python. The majority, if not all algorithms were tested utilizingcommodity and futures data only. All the testing platforms in the book can be used totest stocks and ETFs, and all the included trading algorithms can be applied to theseassets as well. Stock and ETF data is very simple to acquire. Getting commodityand futures data in an easily usable format is a little more difficult. Deep historiesfor commodity and futures can be acquired for as little as $100 from Pinnacle Data.I have used CSI data since the late 1980s and it is the data I used for a good portion ofthe testing carried out in the book. I would definitely take a look at Pinnacle and CSIdata, especially if you wanted your database updated daily. If you are not familiarwith Quandl, then you might want to take the time to do so. Quandl is a searchengine for numerical data. I was pleasantly surprised to find a free continuous futuresdatabase (Wiki Continuous Futures) on Quandl. Keep in mind this data is free andis no way as good as premium data such as CSI and Pinnalce—it is missing multipledays and data points and the continuous data is simply created by concatenating datafrom individual contracts. The gaps between contracts are included, which cannotbe utilized on any testing platform. In real life, a futures position is ‘‘rolled-over’’from one contract to another by liquidating the front-month position and initiatingthe same position in the next contract. This ‘‘rollover’’ trade eliminates the gap.I have written a Python application that takes the Wiki Futures data and creates aback-adjusted continuous contract that can be imported into the Python and ExcelSystem Back Tester software. Since I needed the data to do testing, I have alsoincluded a 10-plus-year ASCII back-adjusted futures database for 30-plus marketson the companion website. Directions on how to use the software and downloadfutures data from Quandl are included along with the software.
The one thing I really wanted to include in this book was the ‘‘Holy Grail’’ ofalgorithmic trading systems. I have analyzed many algorithms that claimed to be theGrail, but after rigorous testing they failed to break even. So go ahead and checkthis off your list. Even though the ‘‘Holy Grail’’ will remain hidden you will find thefollowing:■ Twenty-seven years of experience working with non-programmers in the devel-
opment of their own trading algorithms
■ The tools or building blocks that are used most often in the development cycle
■ The core trading models that make up the majority of publicly offered tradingsystems
■ The most important and simplest programming techniques to transform anon-quant into a not-so-non-quant

Trim Size: 7in x 10in Pruitt flast.tex V3 - 05/05/2016 3:52 P.M. Page xv
INT
RO
DU
CT
ION
TO
TH
EU
LTIM
AT
EA
LGO
RIT
HM
ICT
RA
DIN
G
xv
■ Simple examples and explanations of complex trading ideas such as Walk Forwardand Genetic Optimization and Monte Carlo simulation
■ A complete toolbox to help algorithm development from idea to a finishedtradable solution
The majority of successful trading algorithms utilize quantitative analysis (QA).QA is simply the application of mathematical formulae to a financial time series. Thisbook will solely focus on this type of analysis in the design of trading algorithms.Fundamental analysis, which is used in many trading plans, will be used, too, butit will be reduced and simplified into a pure and easily digestible data format.Fundamental data is huge and diverse and in many cases market movement reactsto it in an unpredictable manner. A good example that I have dealt with for manyyears is the monthly unemployment report. At the time of the writing of this bookunemployment has been on a downward trend, which is usually a bullish indicatorfor the stock market. However, with interest rates at the time being close to 0%the market could react opposite due to the fear of the Federal Reserve doing awaywith quantitative easing and raising rates. This type of fundamental analysis requiresmany different inputs and trying to reduce it down to something testable is nearlyimpossible.
Quantitative analysis focuses on just the data included in a chart. Price action andprice translations are easily definable and therefore can be tested. The ability to testand evaluate a trading algorithm is a tremendous tool as it shows how a model canaccurately map a market’s behavior. If you can interpret a market’s behavior, youcan take advantage of its inefficiencies. If an algorithm has been capable of exploitinga market’s inefficiencies on a historic basis, then there is a possibility it willdo so in the future. This hope of future performance is the only leg an algorithmictrader has to stand upon. We all know historic performance is not necessarily anindicator of future results, but what else do we have? An algorithmic trader whoquickly defines and tests his system and immediately takes a leap of faith becausethe historic performance looks great is doomed. Doesn’t this contradict what I justsaid about historical performance being a system trader’s only gauge of quality?A good trading algorithm not only demonstrates profitability but also robustness.Robustness is an expression of how well a trading system performs on diversemarkets and diverse market conditions. An algorithm can be improved to a pointwhere the trader can feel somewhat confident putting on those first few trades aswell as continuing to put trades on after a losing streak. Improving an algorithmis not simply tweaking it until the historic results look utterly fantastic (aka curvefitting); it is taking the time to learn and work with tools that are designed to

Trim Size: 7in x 10in Pruitt flast.tex V3 - 05/05/2016 3:52 P.M. Page xvi
INT
RO
DU
CT
ION
TO
TH
EU
LTIM
AT
EA
LGO
RIT
HM
ICT
RA
DIN
G
xvi
make a trading algorithm fail. That’s the ultimate objective—making your tradingalgorithm fail before any money is put on the line. Remember the absence of failureis success and if your algorithm survives the brutal gauntlet of in depth analysis, thenyou know you might, just might have a winner.
This book starts out simple in Chapter 1 with the definition and examples ofalgorithms. The chapter is a little longwinded but I know that the inability to put atrading idea onto paper and then into pseudocode and finally actual computer codeis the biggest stumbling block for traders who want to test their own trading ideas.All trading algorithms that are reducible to a set of instructions can be properlyprogrammed using one of two different modeling methods or paradigms. These twoparadigms, Finite State Machine and Flow Chart, are fully discussed and utilized totranslate written descriptions first into diagrams and then into actual pseudocode.The diagrammatic approach as well as the simple pseudocode language used toformulate trading algorithms is introduced in this chapter. It doesn’t matter howsophisticated your testing software is if you can’t define a testable algorithm and thischapter shows you how to do so.
Chapter 2 may be a refresher for those who are familiar with the basic buildingblocks of trading algorithms, indicators; however, the chapter not only explains thelogic behind the indicators but shows how they can be incorporated into completeentry and exit techniques. Diagrams and pseudocode are carried on through thischapter to aid in the understanding of each indicator, its purpose, and its place ina trading algorithm. In addition, the first look at indicator-based trading algorithmperformance is presented as well.
Chapter 3 introduces complete trading algorithms and their associated historicalperformance. Most, if not all, testing was performed on historical commodity/futures data. This data gave rise to the concept of systematic trading more than50 years ago. Now this doesn’t mean the ideas aren’t transferable to the stockmarket. In most cases they are. However, I stuck with commodity data because thatis where my expertise lies. The complete pseudocode and actual computer code ofthese algorithms are revealed as well. The key metrics for determining algorithmrobustness are explained and utilized in the evaluation of the algorithms’ results.
Chapter 4 starts the section that highlights different testing/trading softwareplatforms that can either be purchased or leased. AmiBroker is introduced in thischapter and the most important components of a trading platform are highlighted:integrated development environment and its associated scripting/programminglanguage, individual market and portfolio testing, and algorithm performancemetrics. These components are then highlighted again in Chapter 5 with VBA forExcel, Chapter 6 with Python, and finally Chapter 7 with TradeStation.
Chapter 8 delves into the concepts of Genetic and Walk Forward Optimization,Walk Forward Analysis, and Monte Carlo simulation. A genetic optimizer is builtusing VBA and used to help explain the ideas of synthesizing computers with

Trim Size: 7in x 10in Pruitt flast.tex V3 - 05/05/2016 3:52 P.M. Page xvii
INT
RO
DU
CT
ION
TO
TH
EU
LTIM
AT
EA
LGO
RIT
HM
ICT
RA
DIN
G
xvii
biology. The core concepts of Genetic Algorithms, fitness, selection, reproduction,and mutation are fully explained and illustrated utilizing Excel. Artificial intelligenceis here to stay in the study of trading algorithms and this chapter tries to pull back theveil of mystery and show how these tools should be used, and in some cases, mustbe used to develop that elusive robustness. Along these lines, Machine Learning hasbecome a very highly discussed and somewhat controversial topic in today’s trading.Also ‘‘Big Data’’ analysis has found its way to the front as well. These topics arehighly advanced and I felt beyond the scope of this book. I can state I have workedwith the algorithms that were derived with machine-only input and they have stoodthe test of time.
A trading algorithm must work over a diverse portfolio of markets before it canbe sufficiently considered useful and robust. Chapter 9 utilizes the portfolio-leveltesting capabilities of TradeStation and AmiBroker to demonstrate different moneyand portfolio management techniques. The Fixed Fractional approach, by far themost popular, will be highlighted.
The complete source code for the Python System Back Tester is included onthe website. Python is the new language of many a quant and the source showshow the language can be used to develop a simple, yet powerful, back tester.Important language concepts and syntax are used to open ASCII files, and importthe data into a LIST data structure, create classes and modules, and loop throughthe entire database while applying a trading algorithm. All the parts of building atesting platform are revealed in the source code, including Monte Carlo and StartTrade Drawdown simulation.
Most traders have Microsoft Excel on their computers and the complete sourcefor a more simplified version of the Python back tester using VBA is included on thewebsite as well.
This book is a toolbox and a guide and touches upon many different facets ofalgorithmic trading. As with any toolbox it will take time and effort to apply thetools found within to replicate the trader’s ideas in a form that not only can be testedand evaluated but fully implemented.

Trim Size: 7in x 10in Pruitt flast.tex V3 - 05/05/2016 3:52 P.M. Page xviii

1
C H A P T E R 1
Introductionto TradingAlgorithm Development
■ What Is an Algorithm?
An Algorithm is an effective procedure, a way of getting something done in afinite number of discrete steps.
David Berlinski
Berlinski’s definition is exactly right on the money. The word algorithm soundsmysterious as well as intellectual but it’s really a fancy name for a recipe. It explainsprecisely the stuff and steps necessary to accomplish a task. Even though you canperceive an algorithm to be a simple recipe, it must, like all things dealing withcomputers, follow specific criteria:
1. Input: There are zero or more quantities that are externally supplied.
2. Output: At least one quantity is produced.
3. Definiteness: Each instruction must be clear and unambiguous.
4. Finiteness: If we trace out the instructions of an algorithm, then for all cases thealgorithm will terminate after a finite number of steps.

INT
RO
DU
CT
ION
TO
TR
AD
ING
2
5. Effectiveness: Every instruction must be sufficiently basic that it can in principlebe carried out by a person using only pencil and paper. It is not enough that eachoperation be definite as in (3), but it must also be feasible. [Fundamentals of DataStructures: Ellis Horowitz and Sartaj Sahni 1976; Computer Science Press]
These criteria are very precise because they can be universally applied to anytype of problem. Don’t be turned off thinking this is going to be another computerscience text, because even though the criteria of an algorithm seem to be veryformal, an algorithm really is straightforward and quite eloquent. It is basically aguide that one must follow to convert a problem into something a computer cansolve. Anybody can design an algorithm following these criteria with pencil andpaper. The only prerequisite is that you must think like a Vulcan from Star Trek.In other words, think in logical terms by breaking ideas down into rudimentarybuilding blocks. This is the first step—translation of idea into an algorithm. It takespractice to do this, and this is in part why programming can be difficult.
Another thing that makes programming difficult is understanding a computerlanguage’s syntax. Most people who have been exposed to a programming orscripting language at one time or another in their lives have probably exclaimedsomething like, ‘‘I forgot one stupid semicolon and the entire program crashed!Isn’t the computer smart enough to know that? Arrgh! I will never be a computerprogrammer!’’ The question that is proffered in this temper tantrum is the questionof the computer’s intelligence. Computers are not smart—they only do what wetell them. It doesn’t matter if you spend $500 or $5,000 on the hardware. Theydo things very quickly and accurately, but their intelligence is a reflection of theirprogrammer’s ability to translate idea into algorithmic form and then into propersyntax.
Algorithmic (algo) traders don’t necessarily need to be programmers, but theymust understand what a computer needs to know to carry out a trading signal,position sizing, and money management. If you can create an algorithm, then youare more than 50 percent there. I say more than 50 percent because most traderswill utilize trading software and its associated programming or scripting language.Learning the syntax of a scripting language or a small subset of a programming dialectis much easier than learning an entire programming language like C# or C++. Analgo trader only needs to be concerned with the necessary tools to carry out a tradingsystem. The developers of EasyLanguage, AmiBroker, or TradersStudio’s mainobjective was to provide only the necessary tools to put a trading idea into action.They accomplished this by creating a vast library of trading functions, easy access tothese functions, and a simplified programming syntax. Now if you want to developyour own testing platform and want to use a full-blown programming language todo so, then you will need to know the language inside-out. If you are interested indoing this, Chapters 5 and 6 will give you a head start. In these chapters, I showhow I developed testing platforms in Python and Microsoft VBA from scratch.

INT
RO
DU
CT
ION
TO
TR
AD
ING
3
However, at this introductory stage, let’s take a look at a very simple tradingalgorithm and the possible exchange between a computer and trader. Pretend atrader wants to develop and test a simple moving-average crossover system andwants to use software specifically designed for system testing. Let’s call this firsttrader AlgoTrader1, and since he has used this particular testing platform he knowsit understands a trading vernacular and provides access to the common indicatorfunctions and data. Box 1.1 shows a possible exchange between trader and computer.
Box 1.1 Algo Testing Software
AlgoTrader1 – AlgoTester ON
Computer – AlgoTester ready
AlgoTrader1 – load crude oil futures data
Computer – data loaded
AlgoTrader1 – buy whenever close is above moving average
Computer – "moving average" function requires three inputs
AlgoTrader1 - help with moving average function
Computer - function calculates simple, weighted, exponential average
Computer - function syntax moving average (type, price, length)
AlgoTrader1 - buy whenever close is above moving average
(simple,close,21)
Computer – command completed
AlgoTrader1 –short whenever close is below moving average
(simple,close,21)
Computer – command completed
AlgoTrader1 – save algorithm as MovAvgCross
Computer – command completed
AlgoTrader1 – run MovAvgCross algorithm
Computer – run completed and results are:
$12,040 profit, $8,500 draw down, $1,200 avg. win
AlgoTrader1 – load euro currency data
Computer – command completed
AlgoTrader2 – run MovAvgCross algorithm
Computer – run completed and results are:
-$32,090 profit, $40,000 draw down, $400 avg. win
AlgoTrader1 – edit MovAvgCross algorithm
Computer – command completed
AlgoTrader2 – edit moving average function
Computer - command completed
AlgoTrader2 – change length input to 30
Computer – command completed
AlgoTrader2 – run MovAvgCross algorithm
Computer – run completed and blah blah blah

INT
RO
DU
CT
ION
TO
TR
AD
ING
4
As you can see, the computer had to be somewhat spoon-fed the instructions.The software recognized many keywords such as: load, buy, short, run, edit,change, and save. It also recognized the moving average function and was able toprovide information on how to properly use it. The trading algorithm is now storedin the computer’s library and will be accessible in the future.
This simple exchange between computer and AlgoTrader1 doesn’t reveal all thecomputations or processes going on behind the scene. Loading and understandingthe data, applying the algorithm properly, keeping track of the trades, and, finally,calculating all of the performance metrics did not involve any interaction with thetrader. All this programming was done ahead of time and was hidden from the traderand this allows an algo trader to be creative without being bogged down in all theminutiae of a testing platform.
Even though the computer can do all these things seamlessly it still needed to betold exactly what to do. This scenario is similar to a parent instructing a child onhow to do his first long-division problem. A child attempting long division probablyknows how to add, subtract, multiply, and divide. However, even with these‘‘built-in’’ tools, a child needs a list of exact instructions to complete a problem.An extended vocabulary or a large library of built-in functions saves a lot of time,but it doesn’t necessarily make the computer any smarter. This is an example ofknowledge versus intelligence—all the knowledge in the world will not necessarilyhelp solve a complex problem. To make a long story short, think like a computeror child when developing and describing a trading algorithm. Box 1.2 shows analgorithmic representation of the long-division process to illustrate how even asimple process can seem complicated when it is broken down into steps.
Box 1.2 Procedure for Long Division
Suppose you are dividing two large numbers in the problem n ÷ m. In thisexample, the dividend is n and the divisor is m.
If the divisor is not a whole number, simplify the problem by moving the decimalof the divisor until it is to the right of the last digit. Then, move the decimalof the dividend the same number of places. If you run out of digits in thedividend, add zeroes as placeholders.
When doing long division, the numbers above and below the tableau should bevertically aligned.
Now you are ready to divide. Look at the first digit of the dividend. If the divisorcan go into that number at least once, write the total number of times it fits
INT
RO
DU
CT
ION
TO
TR
AD
ING
5
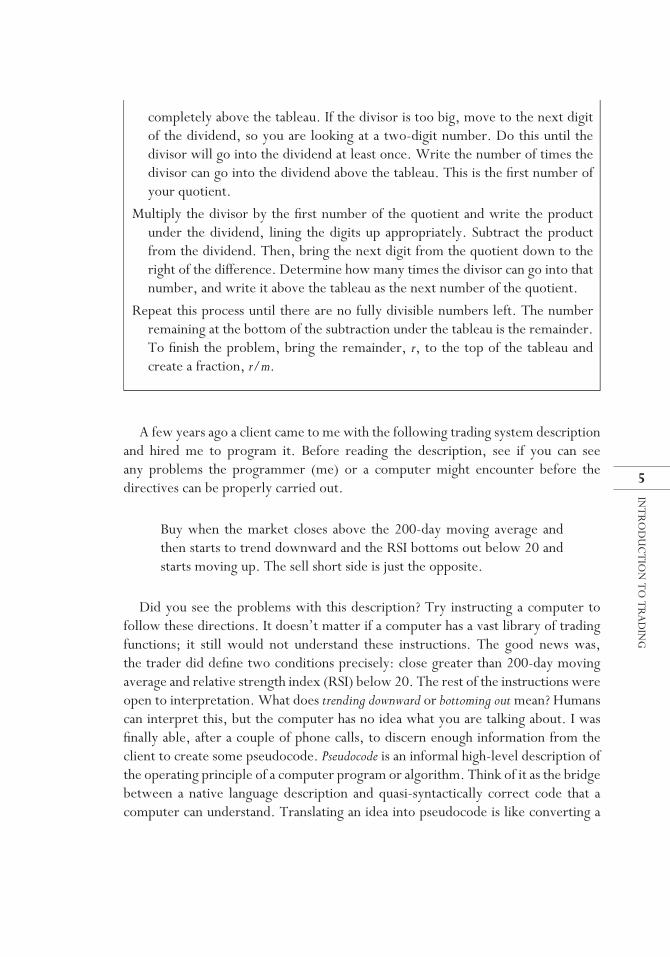
completely above the tableau. If the divisor is too big, move to the next digitof the dividend, so you are looking at a two-digit number. Do this until thedivisor will go into the dividend at least once. Write the number of times thedivisor can go into the dividend above the tableau. This is the first number ofyour quotient.
Multiply the divisor by the first number of the quotient and write the productunder the dividend, lining the digits up appropriately. Subtract the productfrom the dividend. Then, bring the next digit from the quotient down to theright of the difference. Determine how many times the divisor can go into thatnumber, and write it above the tableau as the next number of the quotient.
Repeat this process until there are no fully divisible numbers left. The numberremaining at the bottom of the subtraction under the tableau is the remainder.To finish the problem, bring the remainder, r, to the top of the tableau andcreate a fraction, r/m.
A few years ago a client came to me with the following trading system descriptionand hired me to program it. Before reading the description, see if you can seeany problems the programmer (me) or a computer might encounter before thedirectives can be properly carried out.
Buy when the market closes above the 200-day moving average andthen starts to trend downward and the RSI bottoms out below 20 andstarts moving up. The sell short side is just the opposite.
Did you see the problems with this description? Try instructing a computer tofollow these directions. It doesn’t matter if a computer has a vast library of tradingfunctions; it still would not understand these instructions. The good news was,the trader did define two conditions precisely: close greater than 200-day movingaverage and relative strength index (RSI) below 20. The rest of the instructions wereopen to interpretation. What does trending downward or bottoming out mean? Humanscan interpret this, but the computer has no idea what you are talking about. I wasfinally able, after a couple of phone calls, to discern enough information from theclient to create some pseudocode. Pseudocode is an informal high-level description ofthe operating principle of a computer program or algorithm. Think of it as the bridgebetween a native language description and quasi-syntactically correct code that acomputer can understand. Translating an idea into pseudocode is like converting a

INT
RO
DU
CT
ION
TO
TR
AD
ING
6
nebulous idea into something with structure. Here is the pseudocode of the client’sinitial trading idea:
Algorithm Pseudocode
if close > 200 day moving average and
close < close[1] and close [1] < close [2] and
close[2] < close[3] and yesterday’s 14 day RSI < 20 and
yesterday’s 14 day RSI < today’s 14 day RSI then BUY
If this looks like Latin (and you don’t know Latin), don’t worry about it. The [1]in the code just represents the number of bars back. So close [2] represents the closeprice prior to yesterday. If you are not familiar with RSI, you will be after Chapter 2.By the time you are through with this book you will be able to translate this intoEnglish, Python, EasyLanguage, AmiBroker, or Excel VBA. Here it is in English.
If today’s close is greater than the 200-day moving average of closingprices and today’s close is less than yesterday’s close and yesterday’sclose is less than the prior day’s close and the prior day’s close is lessthan the day before that and the 14-day RSI of yesterday is less than 20and the 14-day RSI of yesterday is less than the 14-day RSI of today,then buy at the market.
Notice how the words downward and bottoming out were removed and replacedwith exact descriptions:
downward: today’s close is less than yesterday’s close and yesterday’s close isless than the prior day’s close and the prior day’s close is less than the daybefore. The market has closed down for three straight days.
bottoming out: the 14-day RSI of yesterday is less than 20 and the 14-day RSIof yesterday is less than the 14-day RSI of today. The RSI value ticked below20 and then ticked up.
Also notice how the new description of the trading system is much longer than theoriginal. This is a normal occurrence of the evolution of idea into an exact tradingalgorithm.
And now here it is in the Python programming language:
Actual Python Code
if myClose[D0] < sAverage(myClose,200,D0,1) and
myClose[D0] < myClose[D1] and myClose[D2] < myClose[D3] and
myClose[D1] < myClose[D2] and rsiVal[D1] < 20 and rsiVal[D1]
< rsiVal[D0]:
buyEntryName = 'rsiBuy'
entryPrice = myOpen

INT
RO
DU
CT
ION
TO
TR
AD
ING
7
Don’t get bogged down trying to understand exactly what is going on; just noticethe similarity between pseudo and actual code. Now this is something the computercan sink its teeth into. Unfortunately, reducing a trading idea down to pseudocodeis as difficult as programming it into a testing platform. The transformation from atrader to an algo trader is very difficult and in some cases cannot be accomplished.I have worked with many clients who simply could not reduce what they saw on achart into concise step-by-step instructions. In other cases the reduction of a tradingidea removes enough of the trader’s nuances that it turned something that seemedplausible into something that wasn’t.
It goes without saying that if you don’t have an algorithm, then all the softwarein the world will not make you a systematic trader. Either you have to design yourown or you have to purchase somebody else’s. Buying another person’s technologyis not a bad way to go, but unless the algorithm is fully disclosed you will not learnanything. However, you will be systematic trader. I have spent 27 years evaluatingtrading systems and have come across good and bad and really bad technology.I can say without a doubt that one single type of algorithm does not stand headand shoulders above all the others. I can also say without a doubt there isn’t acorrelation between the price of a trading system and its future profitability. Thedescription in Box 1.3 is very similar to a system that sold for over $10,000 inthe 1990s.
Box 1.3 Trading Algorithm Similar to One That Sold for $10Kin the 1990s Description
Entry Logic:
If the 13-day moving average of closes > the 65-day moving average of closesand the 13-day moving average is rising and the 65-day moving average is risingthen buy the next day’s open
If the 13-day moving average of closes < the 65-day moving average of closesand the 13-day moving average is falling and the 65-day moving average is fallingthen sell the next day’s open
Exit Logic:
If in a long position thenset initial stop at the lowest low of the past 13 days
If in a short position thenset initial stop at the highest high of the past 13 days
Once profit exceeds or matches $700 pull stops to break even
INT
RO
DU
CT
ION
TO
TR
AD
ING
8
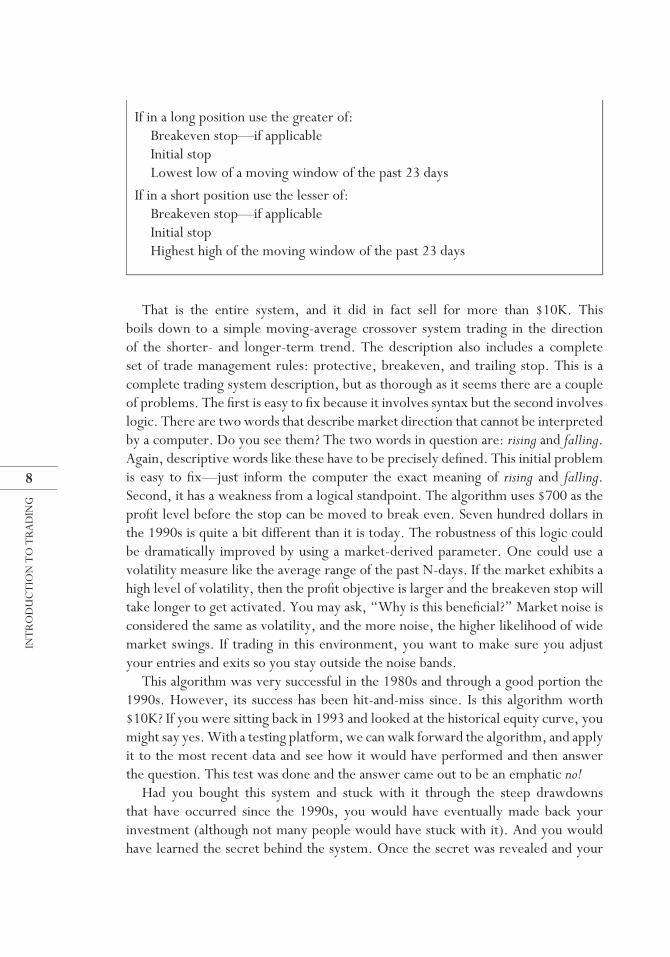
If in a long position use the greater of:Breakeven stop—if applicableInitial stopLowest low of a moving window of the past 23 days
If in a short position use the lesser of:Breakeven stop—if applicableInitial stopHighest high of the moving window of the past 23 days
That is the entire system, and it did in fact sell for more than $10K. Thisboils down to a simple moving-average crossover system trading in the directionof the shorter- and longer-term trend. The description also includes a completeset of trade management rules: protective, breakeven, and trailing stop. This is acomplete trading system description, but as thorough as it seems there are a coupleof problems. The first is easy to fix because it involves syntax but the second involveslogic. There are two words that describe market direction that cannot be interpretedby a computer. Do you see them? The two words in question are: rising and falling.Again, descriptive words like these have to be precisely defined. This initial problemis easy to fix—just inform the computer the exact meaning of rising and falling.Second, it has a weakness from a logical standpoint. The algorithm uses $700 as theprofit level before the stop can be moved to break even. Seven hundred dollars inthe 1990s is quite a bit different than it is today. The robustness of this logic couldbe dramatically improved by using a market-derived parameter. One could use avolatility measure like the average range of the past N-days. If the market exhibits ahigh level of volatility, then the profit objective is larger and the breakeven stop willtake longer to get activated. You may ask, ‘‘Why is this beneficial?’’ Market noise isconsidered the same as volatility, and the more noise, the higher likelihood of widemarket swings. If trading in this environment, you want to make sure you adjustyour entries and exits so you stay outside the noise bands.
This algorithm was very successful in the 1980s and through a good portion the1990s. However, its success has been hit-and-miss since. Is this algorithm worth$10K? If you were sitting back in 1993 and looked at the historical equity curve, youmight say yes. With a testing platform, we can walk forward the algorithm, and applyit to the most recent data and see how it would have performed and then answerthe question. This test was done and the answer came out to be an emphatic no!
Had you bought this system and stuck with it through the steep drawdownsthat have occurred since the 1990s, you would have eventually made back yourinvestment (although not many people would have stuck with it). And you wouldhave learned the secret behind the system. Once the secret was revealed and your

INT
RO
DU
CT
ION
TO
TR
AD
ING
9
checking account was down the $10K, you might have been a little disappointedknowing that basic tenets of the system had been around for many years and freelydisseminated in books and trade journals of that era. The system may not be all thatgreat, but the structure of the algorithm is very clean and accomplishes the tasksnecessary for a complete trading system.
The most time-consuming aspect when developing a complete trading idea iscoming up with the trade entry. This seems somewhat like backward thinkingbecause it’s the exit that determines the success of the entry. Nonetheless, the lion’sshare of focus has always been on the entry. This system provides a very succincttrade entry algorithm. If you want to develop your own trading algorithm, thenyou must also provide the computer with logic just as precise and easy to interpret.Getting from the nebula of a trading idea to this point is not easy, but it is absolutelynecessary. On past projects, I have provided the template shown in Box 1.4 toclients to help them write their own entry rules in a more easily understood form.You can download this form and a similar exit template at this book’s companionwebsite:www.wiley.com/go/ultimatealgotoolbox.
Box 1.4 Simple Template for Entry Rules
Long / Short Entries
Calculations and/or Indicators Involved (specify lookback period). Don’t useambiguously descriptive words like rising, falling, flattening, topping or bottom-ing out.
_________________________________________________________________________________________________________________________________________________________Buy Condition—What must happen for a long signal to be issued? List steps
in chronological order. And remember, don’t use ambiguously descriptive wordslike rising, falling, flattening, topping, or bottoming out.
_________________________________________________________________________________________________________________________________________________________Sell Condition—What must happen for a short signal to be issued? List steps
in chronological order._________________________________________________________________________________________________________________________________________________________Here is one of the templates filled out by a one-time client:
Calculations and/or Indicators Involved (specify lookback period)Bollinger Band with a 50-day lookback

INT
RO
DU
CT
ION
TO
TR
AD
ING
10
Buy Condition—What must happen for a long signal to be issued? List steps inchronological order.
1. Close of yesterday is above 50-day upper Bollinger Band
2. Today’s close < yesterday’s close
3. Buy next morning’s open
Sell Condition—What must happen for a short signal to be issued? List steps inchronological order.
1. Close of yesterday is below 50-day lower Bollinger Band
2. Today’s close > yesterday’s close
3. Sell next morning’s open
The simple Bollinger Band system shown in Box 1.4 is seeking to buy afterthe upper Bollinger Band penetration is followed by a down close. The conditionsmust occur within one daily bar of each other. In other words, things must happenconsecutively: the close of yesterday is > upper Bollinger Band and close of today <yesterday’s close. The sell side of things uses just the opposite logic. The templatefor exiting a trade is very similar to that of entering. Box 1.5 contains a simpletemplate for exit rules and shows what the client from Box 1.4 had completed forhis strategy.
Box 1.5 Simple Template for Exit Rules
Exits
Calculations and/or Indicators Involved (specify lookback period). Don’t useambiguously descriptive words like rising, falling, flattening, topping, or bottom-ing out.
_________________________________________________________________________________________________________________________________________________________Long Liquidation Condition—What must happen to get out of a long position?
List steps in chronological order._________________________________________________________________________________________________________________________________________________________