Triennial Central Bank Survey Foreign exchange and derivatives market activity in April 2010
27
Triennial Central Bank Survey Foreign exchange and derivatives market activity in April 2010 Preliminary results Monetary and Economic Department September 2010
-
Upload
finance-magnates -
Category
Business
-
view
188 -
download
2
Transcript of Triennial Central Bank Survey Foreign exchange and derivatives market activity in April 2010
TriennialCentral Bank Survey
Foreign exchange and derivatives market activity in April 2010
Preliminary results
Monetary and Economic Department
September 2010

Queries concerning this report should be addressed to the authors listed below:
Sections I + II: Karsten von Kleist tel +41 61 280 8408 e-mail: [email protected]
Sections III + IV: Carlos Mallo tel +41 61 280 8256 e-mail: [email protected]
Section III: Serge Grouchko tel +41 61 280 8445 e-mail: [email protected]
Section IV: Philippe Mesny tel +41 61 280 8425 e-mail: [email protected]
Copies of publications are available from:
Bank for International Settlements Communications CH-4002 Basel, Switzerland
E-mail: [email protected]
Fax: +41 61 280 9100 and +41 61 280 8100
This publication is available on the BIS website (www.bis.org).
© Bank for International Settlements 2010. All rights reserved. Brief excerpts may be reproduced or translated provided the source is stated.
ISSN 1814-7348 (print) ISBN 92-9131-840-X (print)
ISSN 1814-7356 (online) ISBN 92-9197-840-X (online)

Triennial Central Bank Survey 2010
Contents
Summary of the April 2010 Triennial Central Bank Survey ......................................................1 I. Background on the Triennial Central Bank Survey..........................................................2 II. Results of the triennial survey .........................................................................................3
1. Global foreign exchange market turnover ..............................................................3 A. Turnover by instrument, counterparty and maturity ......................................3 B. Currency distribution and turnover by currency pair .....................................4 C. Geographical distribution of turnover ............................................................5
2. Global interest rate OTC derivatives market turnover............................................5 A. Turnover by instrument and currency ...........................................................5 B. Geographical distribution of turnover ............................................................6
III. Statistical tables ..............................................................................................................7 IV. Statistical notes .............................................................................................................16
1. Coverage..............................................................................................................16 2. Turnover data.......................................................................................................16 3. Instruments ..........................................................................................................17 4. Counterparties......................................................................................................18 5. Currency and other market risk breakdowns .......................................................19 6. Maturities..............................................................................................................19 7. Elimination of double-counting .............................................................................19 8. Intertemporal comparisons...................................................................................20 9. Data at constant exchange rates .........................................................................21
Notations used in this release
trillion thousand billion billion thousand million … not available . not applicable $ US dollar unless specified otherwise
Differences in totals are due to rounding.

Triennial Central Bank Survey 2010 1
Summary of the April 2010 Triennial Central Bank Survey1
1. Turnover on the global foreign exchange market
Global foreign exchange market turnover was 20% higher in April 2010 than in April 2007, with average daily turnover of $4.0 trillion compared to $3.3 trillion. The increase was driven by the 48% growth in turnover of spot transactions, which represent 37% of foreign exchange market turnover. Spot turnover rose to $1.5 trillion in April 2010 from $1.0 trillion in April 2007.
The increase in turnover of other foreign exchange instruments was more modest at 7%, with average daily turnover of $2.5 trillion in April 2010. Turnover in outright forwards and currency swaps grew strongly. Turnover in foreign exchange swaps was flat relative to the previous survey, while trading in currency options decreased.
As regards counterparties, the higher global foreign exchange market turnover is associated with the increased trading activity of “other financial institutions” – a category that includes non-reporting banks, hedge funds, pension funds, mutual funds, insurance companies and central banks, among others. Turnover by this category grew by 42%, increasing to $1.9 trillion in April 2010 from $1.3 trillion in April 2007. For the first time, activity of reporting dealers with other financial institutions surpassed inter-dealer transactions (ie transactions between reporting dealers).
Foreign exchange market activity became more global, with cross-border transactions representing 65% of trading activity in April 2010, while local transactions account for 35%.
The percentage share of the US dollar has continued its slow decline witnessed since the April 2001 survey, while the euro and the Japanese yen gained relative to April 2007. Among the 10 most actively traded currencies, the Australian and Canadian dollars both increased market share, while the pound sterling lost ground and the Swiss franc declined marginally. The market share of emerging market currencies increased, with the biggest gains for the Turkish lira and the Korean won.
The relative ranking of foreign exchange trading centres has changed slightly from the previous survey. Banks located in the United Kingdom accounted for 36.7%, against 34.6% in 2007, of all foreign exchange market turnover, followed by the United States (18%), Japan (6%), Singapore (5%), Switzerland (5%), Hong Kong SAR (5%) and Australia (4%).
2. Turnover in OTC interest rate derivatives
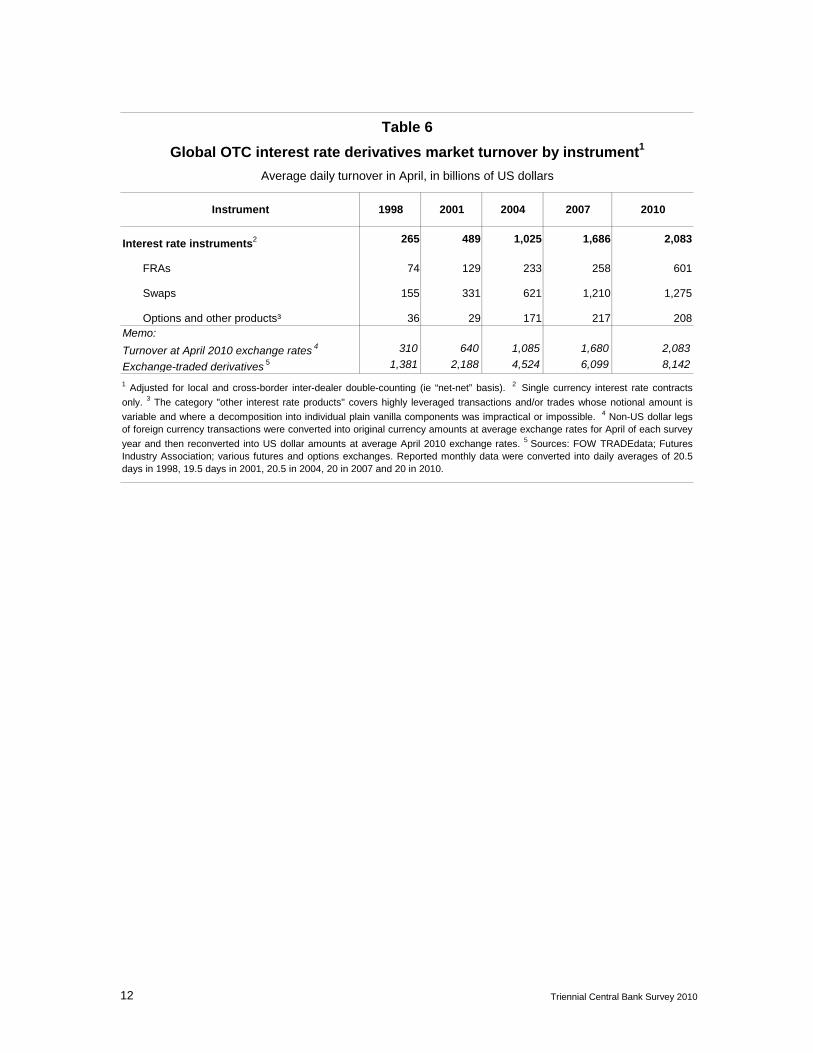
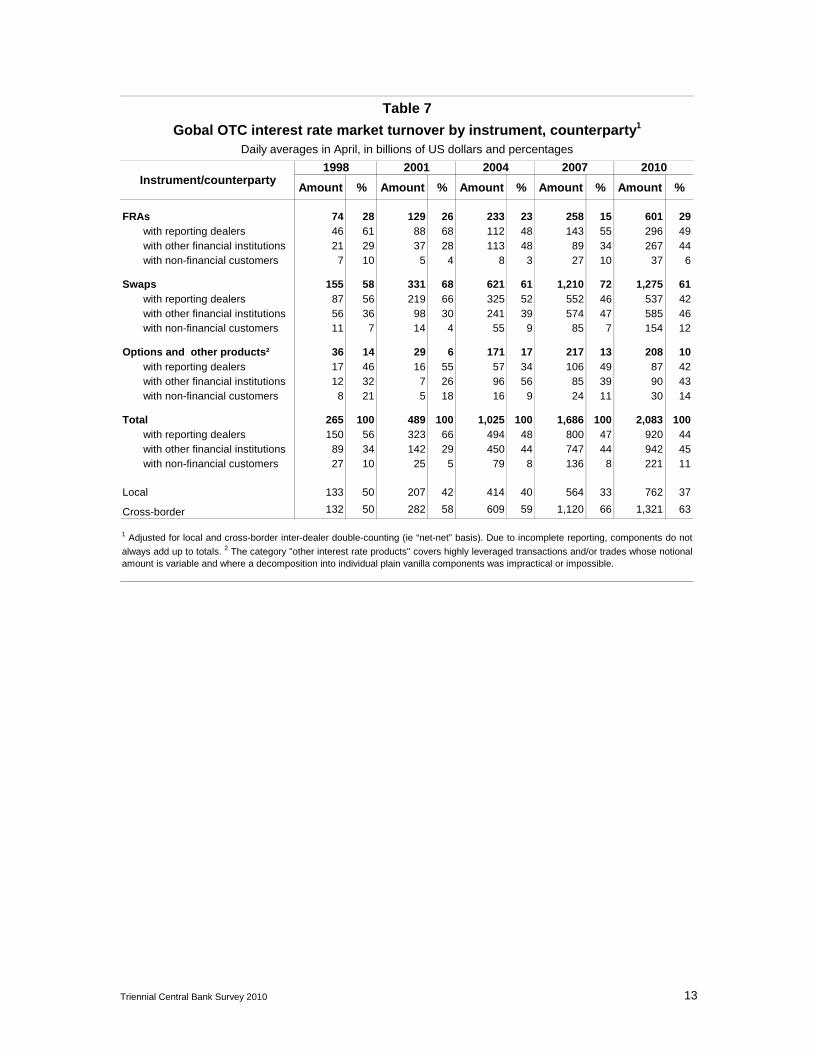
Activity in OTC interest rate derivatives grew by 24%, with average daily turnover of $2.1 trillion in April 2010. Almost all of the increase relative to the last survey was due to the growth of forward rate agreements (FRAs), which increased by 132% to reach $601 billion.
1 Preliminary results. The final results will be published in a detailed report in November 2010.
2 Triennial Central Bank Survey 2010
I. Background on the Triennial Central Bank Survey
In April this year, 53 central banks and monetary authorities participated in the eighth Triennial Central Bank Survey of Foreign Exchange and Derivatives Market Activity (“the triennial survey”). The objective of the survey is to provide the most comprehensive and internationally consistent information on the size and structure of global foreign exchange markets, allowing policymakers and market participants to better monitor patterns of activity in the global financial system.2 Coordinated by the BIS, participating institutions collect data from 1,3093 banks and other dealers (so-called reporting dealers) on turnover in foreign exchange instruments and OTC interest rate derivatives. For the survey, each participating institution is requested to collect data from the reporting dealers in its jurisdiction and calculate aggregate national data.4 These data are then provided to the BIS, which compiles and publishes the global aggregates. The triennial survey has been conducted every three years since April 1989, and has been modified since April 1995 to include OTC interest rate derivatives.
With this release, the BIS is publishing the preliminary global aggregates at the same time as most participating central banks and monetary authorities release their national survey results.5 The BIS plans to publish a more detailed report for foreign exchange markets in November and a special feature article in the December 2010 BIS Quarterly Review. The November report will also include global results from a companion survey, which measures the dollar amounts outstanding of open contracts in OTC derivatives markets at end-June 2010.
Previous triennial surveys have used the expression “traditional foreign exchange markets” to refer to spot transactions, outright forwards and foreign exchange swaps. This expression excludes currency swaps and currency options, which are under OTC instruments. Beginning with the 2010 survey, the expression “global foreign exchange markets” will include all five foreign exchange instruments. The analysis will henceforth distinguish between spot transactions and other related foreign exchange instruments (outright forwards, foreign exchange swaps, currency swaps, currency options and other foreign exchange products). Turnover on global foreign exchange markets and in interest rate derivatives is analysed in Tables 1 to 5 and in Tables 6 to 9, respectively.
2 The triennial survey complements more frequent regional surveys conducted in the following financial
centres by local Foreign Exchange Committees: Australia, Canada, Hong Kong SAR, London, New York, Singapore and Tokyo.
3 1,260 in 2007. 4 For detailed information about the methodology and the coverage of the survey, see the statistical notes
in Section IV. 5 National results are adjusted for double-counting between reporting dealers located in the same country
(ie “net-gross” basis). Global results are adjusted for both local and cross-border inter-dealer double-counting (“net-net” basis).
Triennial Central Bank Survey 2010 3
II. Results of the triennial survey
1. Global foreign exchange market turnover
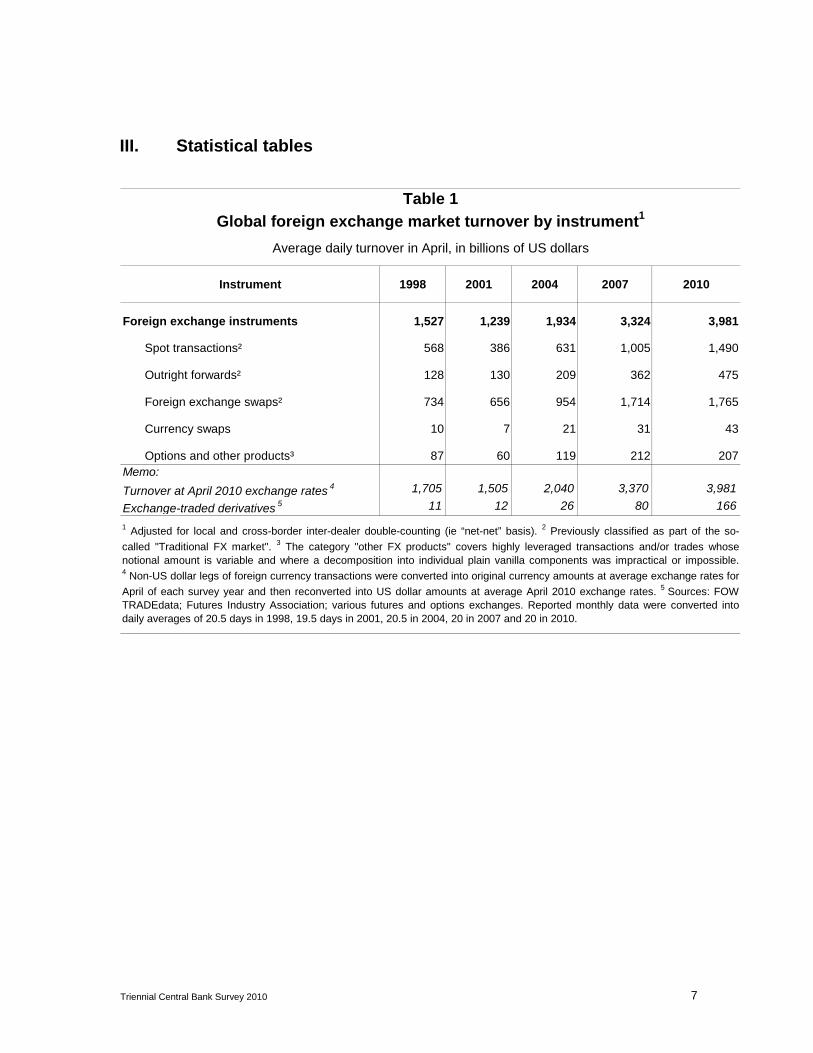
The 2010 triennial survey shows another significant increase in global foreign exchange market activity since the last survey in 2007, following the unprecedented rise in activity between 2004 and 2007. Global foreign exchange market turnover was 20% higher in April 2010 than in April 2007 (Table 1). This increase brought average daily turnover to $4.0 trillion (from $3.3 trillion) at current exchange rates. Because euro/dollar exchange rates were very similar in April 2007 and 2010, growth calculated at constant exchange rates was similar at 18%. The 2010 increase in average daily turnover was lower than the 72% growth observed between 2004 and 2007, which – apart from valuation effects – had been driven by factors such as low levels of financial market volatility and of risk aversion, and expansion in the activity of hedge funds.6
The higher global foreign exchange market turnover in 2010 is largely due to the increased trading activity of “other financial institutions” – a category that includes non-reporting banks, hedge funds, pension funds, mutual funds, insurance companies and central banks, among others. Turnover by this category grew by 42%, increasing to $1.9 trillion in April 2010 from $1.3 trillion in April 2007. For the first time, activity with other financial institutions surpassed transactions between reporting dealers.
A. Turnover by instrument, counterparty and maturity
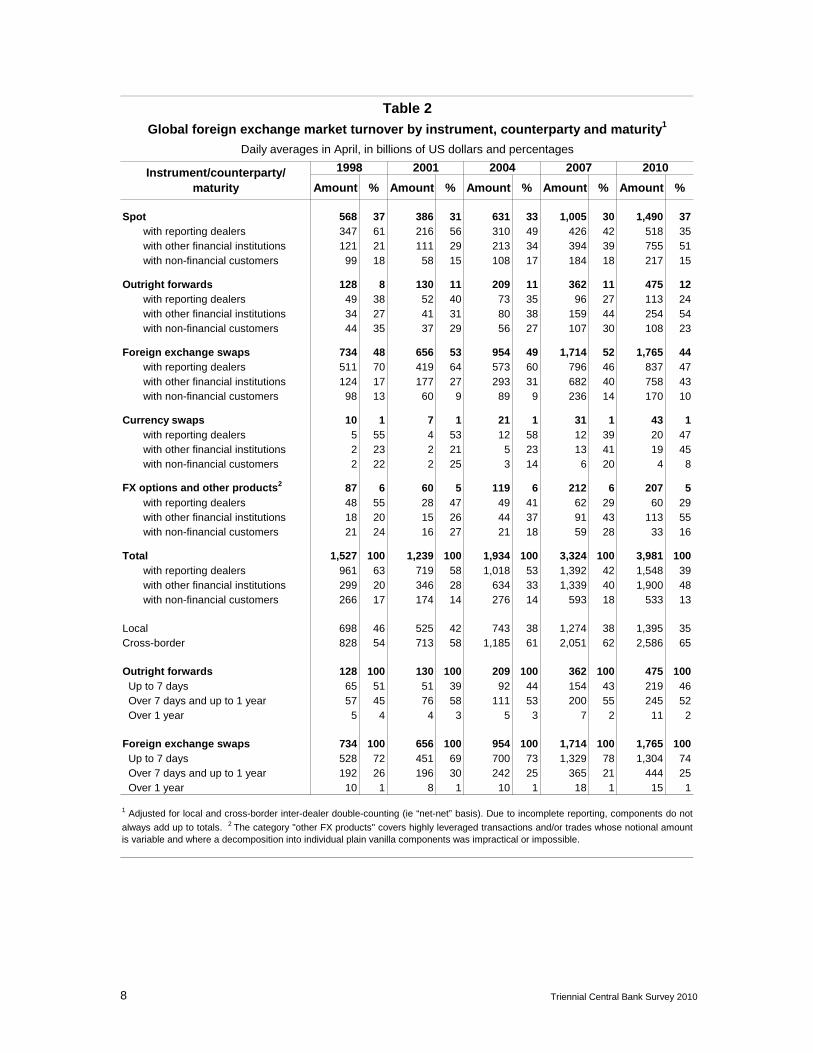
Foreign exchange spot turnover rose to $1.5 trillion in April 2010 from $1.0 trillion, an increase of 48% at current exchange rates (Table 1). The increase in spot market turnover accounts for three-quarters of the overall increase in global foreign exchange market activity relative to the previous survey. The higher turnover in spot transactions is largely due to more active trading with other financial institutions, followed by inter-dealer trading (Table 2). Trading with other financial institutions now accounts for over half (51%) of spot turnover, compared to 39% in 2007 (Table 2).
Trading activity in other related foreign exchange instruments continued to expand, but at a more moderate pace than in the three years to April 2007. Average daily turnover in these instruments grew by 7% to $2.5 trillion in April 2010 (Table 1). Turnover in outright forwards grew by 31% to $475 billion. Trading in currency swaps also grew strongly by 39%, albeit from a much lower level, to $43 billion. Foreign exchange swaps, which remain the mostly activity traded foreign exchange instrument, were relatively unchanged compared to the prior survey at $1.8 trillion. The distribution of trading across counterparties and maturities was largely unchanged. Foreign exchange swaps are used widely by banks to raise liquidity across money markets denominated in different currencies.7 Finally the use of currency options declined by 2% between surveys with average daily turnover of $207 billion in April 2010.
6 For more details on the results of the 2007 Triennial Survey, see G Galati and A Heath, “What drives the
growth in FX activity? Interpreting the 2007 triennial survey”, BIS Quarterly Review, December 2007. 7 Disruptions to the foreign exchange swap market during the 2007–09 financial crisis attracted
considerable attention; see N Baba and F Packer, “From turmoil to crisis: dislocations in the FX swap market before and after the failure of Lehman Brothers”, BIS Working Papers, no 285, July 2009.
4 Triennial Central Bank Survey 2010
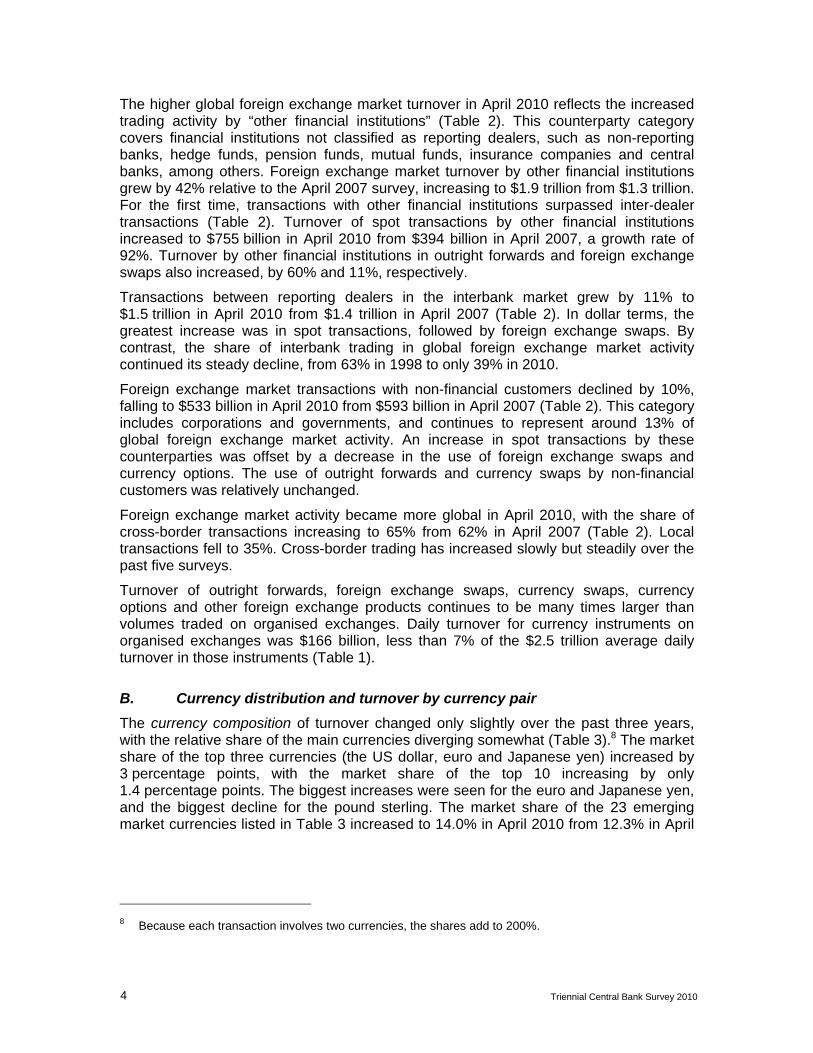
The higher global foreign exchange market turnover in April 2010 reflects the increased trading activity by “other financial institutions” (Table 2). This counterparty category covers financial institutions not classified as reporting dealers, such as non-reporting banks, hedge funds, pension funds, mutual funds, insurance companies and central banks, among others. Foreign exchange market turnover by other financial institutions grew by 42% relative to the April 2007 survey, increasing to $1.9 trillion from $1.3 trillion. For the first time, transactions with other financial institutions surpassed inter-dealer transactions (Table 2). Turnover of spot transactions by other financial institutions increased to $755 billion in April 2010 from $394 billion in April 2007, a growth rate of 92%. Turnover by other financial institutions in outright forwards and foreign exchange swaps also increased, by 60% and 11%, respectively.
Transactions between reporting dealers in the interbank market grew by 11% to $1.5 trillion in April 2010 from $1.4 trillion in April 2007 (Table 2). In dollar terms, the greatest increase was in spot transactions, followed by foreign exchange swaps. By contrast, the share of interbank trading in global foreign exchange market activity continued its steady decline, from 63% in 1998 to only 39% in 2010.
Foreign exchange market transactions with non-financial customers declined by 10%, falling to $533 billion in April 2010 from $593 billion in April 2007 (Table 2). This category includes corporations and governments, and continues to represent around 13% of global foreign exchange market activity. An increase in spot transactions by these counterparties was offset by a decrease in the use of foreign exchange swaps and currency options. The use of outright forwards and currency swaps by non-financial customers was relatively unchanged.
Foreign exchange market activity became more global in April 2010, with the share of cross-border transactions increasing to 65% from 62% in April 2007 (Table 2). Local transactions fell to 35%. Cross-border trading has increased slowly but steadily over the past five surveys.
Turnover of outright forwards, foreign exchange swaps, currency swaps, currency options and other foreign exchange products continues to be many times larger than volumes traded on organised exchanges. Daily turnover for currency instruments on organised exchanges was $166 billion, less than 7% of the $2.5 trillion average daily turnover in those instruments (Table 1).
B. Currency distribution and turnover by currency pair
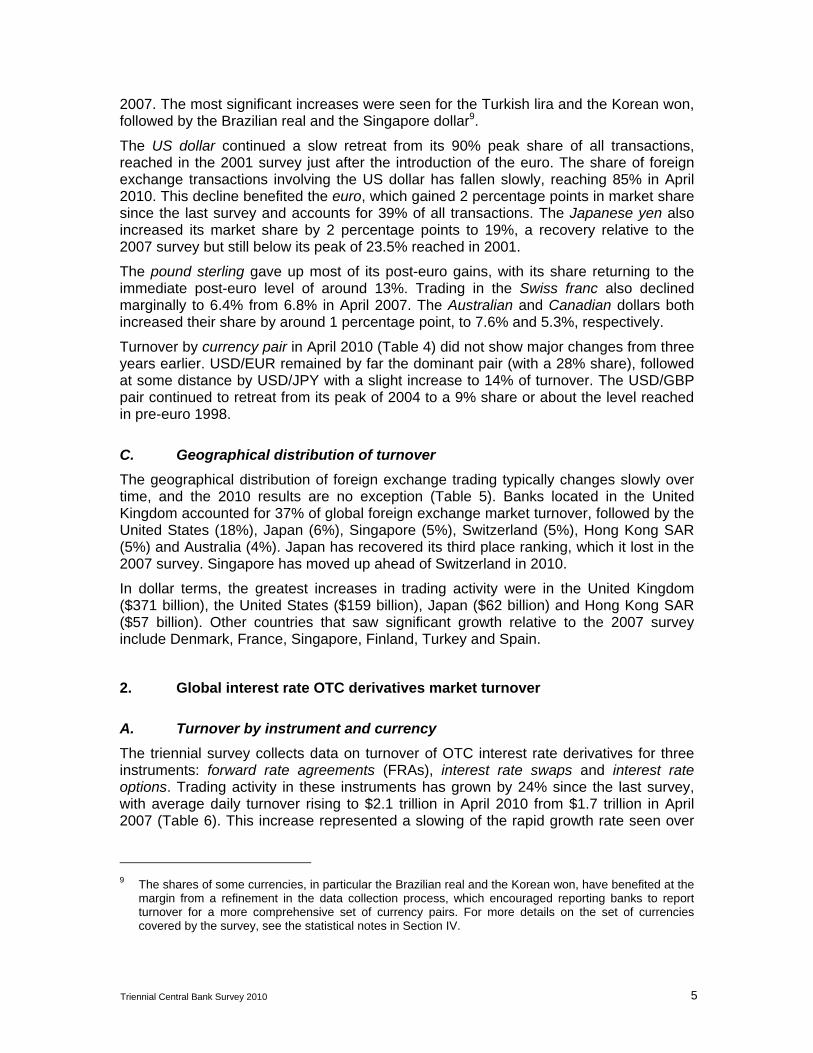
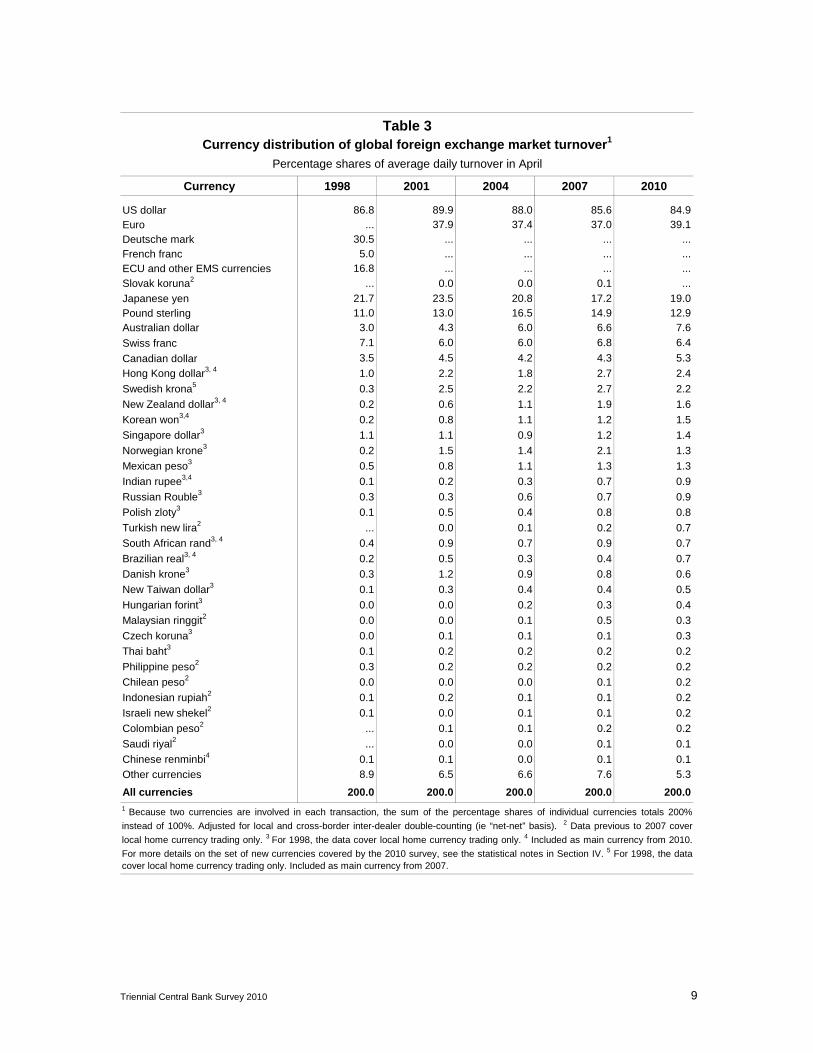
The currency composition of turnover changed only slightly over the past three years, with the relative share of the main currencies diverging somewhat (Table 3).8 The market share of the top three currencies (the US dollar, euro and Japanese yen) increased by 3 percentage points, with the market share of the top 10 increasing by only 1.4 percentage points. The biggest increases were seen for the euro and Japanese yen, and the biggest decline for the pound sterling. The market share of the 23 emerging market currencies listed in Table 3 increased to 14.0% in April 2010 from 12.3% in April
8 Because each transaction involves two currencies, the shares add to 200%.
Triennial Central Bank Survey 2010 5
2007. The most significant increases were seen for the Turkish lira and the Korean won, followed by the Brazilian real and the Singapore dollar9.
The US dollar continued a slow retreat from its 90% peak share of all transactions, reached in the 2001 survey just after the introduction of the euro. The share of foreign exchange transactions involving the US dollar has fallen slowly, reaching 85% in April 2010. This decline benefited the euro, which gained 2 percentage points in market share since the last survey and accounts for 39% of all transactions. The Japanese yen also increased its market share by 2 percentage points to 19%, a recovery relative to the 2007 survey but still below its peak of 23.5% reached in 2001.
The pound sterling gave up most of its post-euro gains, with its share returning to the immediate post-euro level of around 13%. Trading in the Swiss franc also declined marginally to 6.4% from 6.8% in April 2007. The Australian and Canadian dollars both increased their share by around 1 percentage point, to 7.6% and 5.3%, respectively.
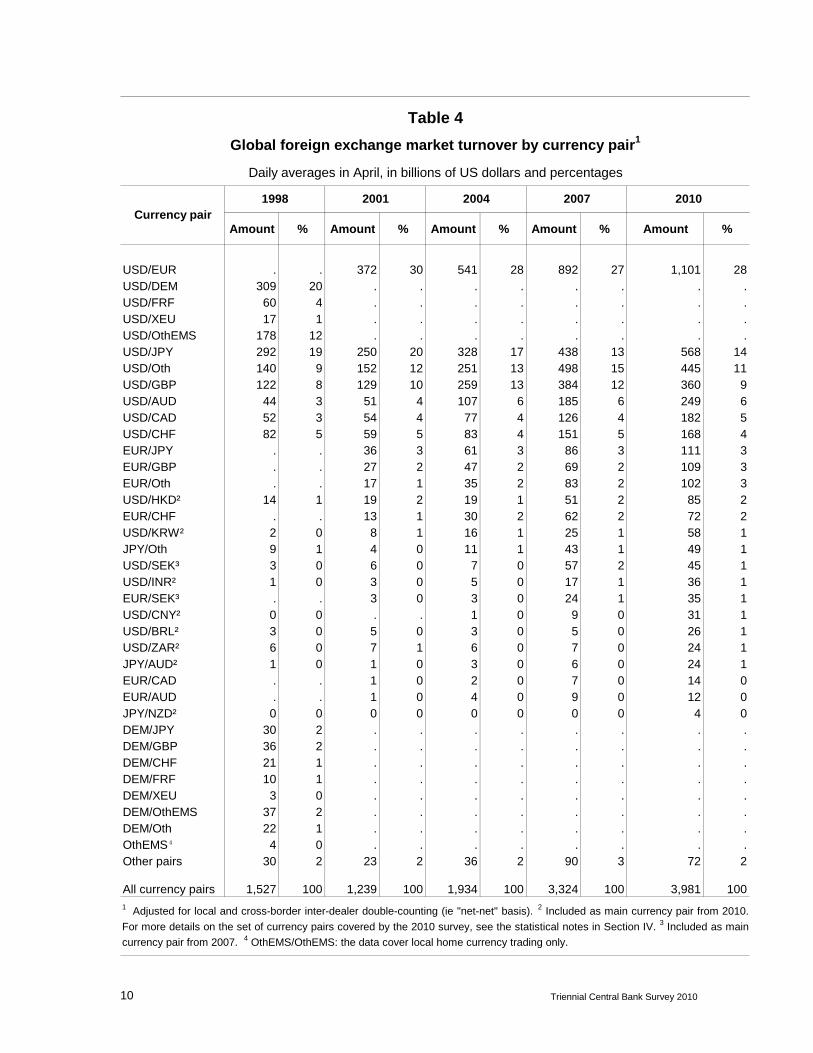
Turnover by currency pair in April 2010 (Table 4) did not show major changes from three years earlier. USD/EUR remained by far the dominant pair (with a 28% share), followed at some distance by USD/JPY with a slight increase to 14% of turnover. The USD/GBP pair continued to retreat from its peak of 2004 to a 9% share or about the level reached in pre-euro 1998.
C. Geographical distribution of turnover
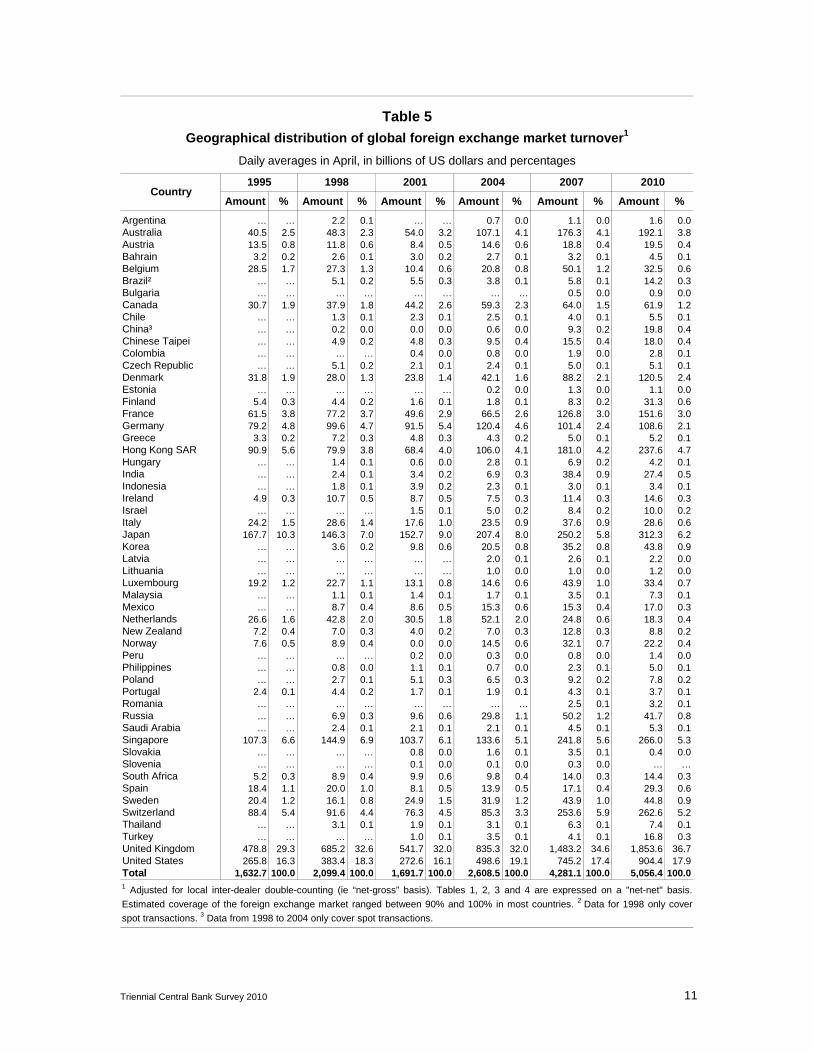
The geographical distribution of foreign exchange trading typically changes slowly over time, and the 2010 results are no exception (Table 5). Banks located in the United Kingdom accounted for 37% of global foreign exchange market turnover, followed by the United States (18%), Japan (6%), Singapore (5%), Switzerland (5%), Hong Kong SAR (5%) and Australia (4%). Japan has recovered its third place ranking, which it lost in the 2007 survey. Singapore has moved up ahead of Switzerland in 2010.
In dollar terms, the greatest increases in trading activity were in the United Kingdom ($371 billion), the United States ($159 billion), Japan ($62 billion) and Hong Kong SAR ($57 billion). Other countries that saw significant growth relative to the 2007 survey include Denmark, France, Singapore, Finland, Turkey and Spain.
2. Global interest rate OTC derivatives market turnover
A. Turnover by instrument and currency
The triennial survey collects data on turnover of OTC interest rate derivatives for three instruments: forward rate agreements (FRAs), interest rate swaps and interest rate options. Trading activity in these instruments has grown by 24% since the last survey, with average daily turnover rising to $2.1 trillion in April 2010 from $1.7 trillion in April 2007 (Table 6). This increase represented a slowing of the rapid growth rate seen over
9 The shares of some currencies, in particular the Brazilian real and the Korean won, have benefited at the
margin from a refinement in the data collection process, which encouraged reporting banks to report turnover for a more comprehensive set of currency pairs. For more details on the set of currencies covered by the survey, see the statistical notes in Section IV.
6 Triennial Central Bank Survey 2010
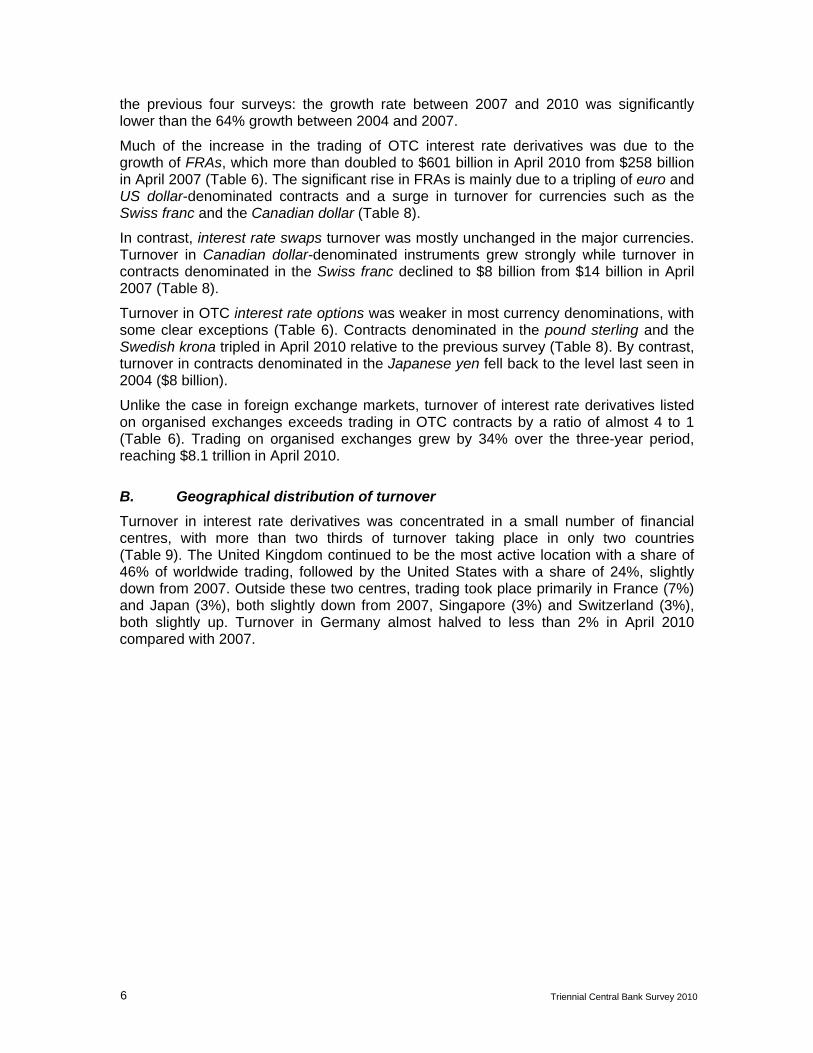
the previous four surveys: the growth rate between 2007 and 2010 was significantly lower than the 64% growth between 2004 and 2007.
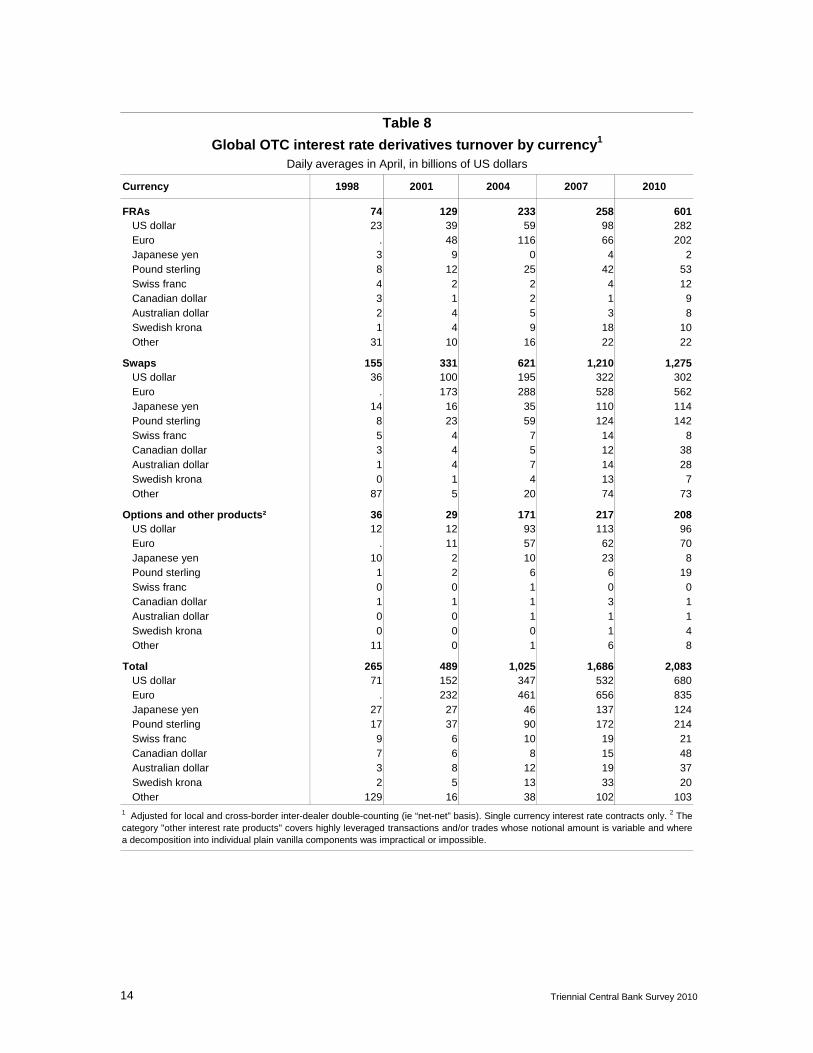
Much of the increase in the trading of OTC interest rate derivatives was due to the growth of FRAs, which more than doubled to $601 billion in April 2010 from $258 billion in April 2007 (Table 6). The significant rise in FRAs is mainly due to a tripling of euro and US dollar-denominated contracts and a surge in turnover for currencies such as the Swiss franc and the Canadian dollar (Table 8).
In contrast, interest rate swaps turnover was mostly unchanged in the major currencies. Turnover in Canadian dollar-denominated instruments grew strongly while turnover in contracts denominated in the Swiss franc declined to $8 billion from $14 billion in April 2007 (Table 8).
Turnover in OTC interest rate options was weaker in most currency denominations, with some clear exceptions (Table 6). Contracts denominated in the pound sterling and the Swedish krona tripled in April 2010 relative to the previous survey (Table 8). By contrast, turnover in contracts denominated in the Japanese yen fell back to the level last seen in 2004 ($8 billion).
Unlike the case in foreign exchange markets, turnover of interest rate derivatives listed on organised exchanges exceeds trading in OTC contracts by a ratio of almost 4 to 1 (Table 6). Trading on organised exchanges grew by 34% over the three-year period, reaching $8.1 trillion in April 2010.
B. Geographical distribution of turnover
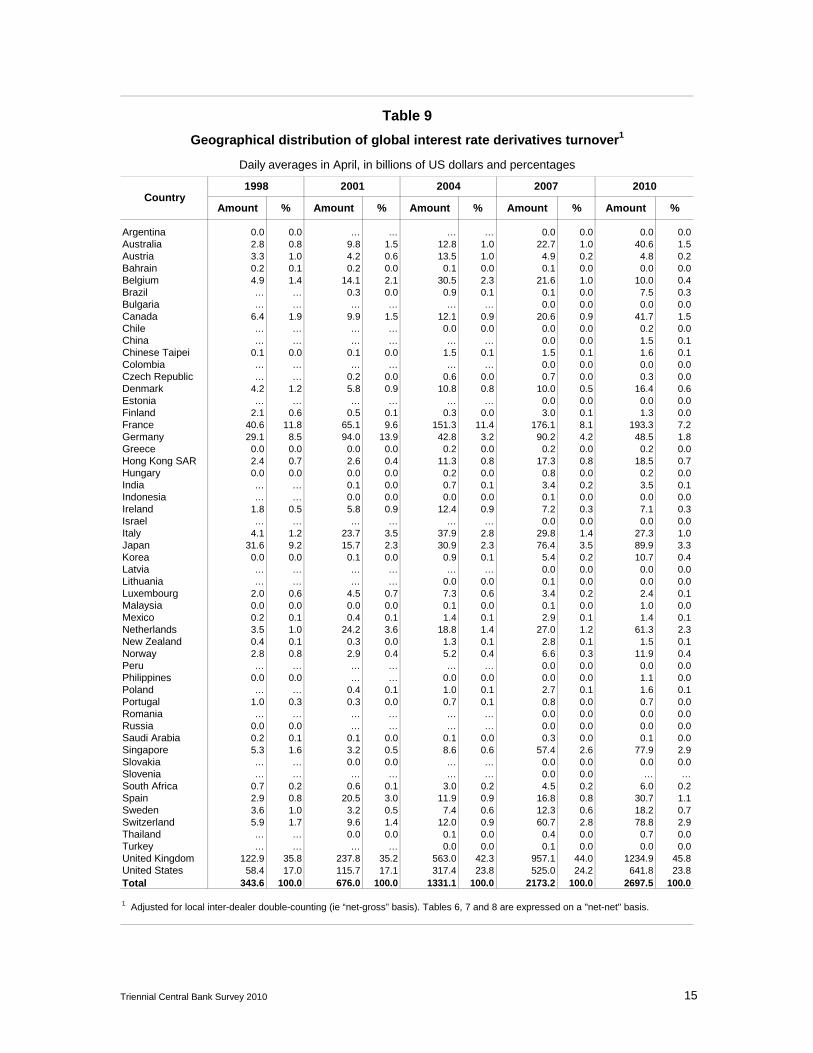
Turnover in interest rate derivatives was concentrated in a small number of financial centres, with more than two thirds of turnover taking place in only two countries (Table 9). The United Kingdom continued to be the most active location with a share of 46% of worldwide trading, followed by the United States with a share of 24%, slightly down from 2007. Outside these two centres, trading took place primarily in France (7%) and Japan (3%), both slightly down from 2007, Singapore (3%) and Switzerland (3%), both slightly up. Turnover in Germany almost halved to less than 2% in April 2010 compared with 2007.
Triennial Central Bank Survey 2010 7
III. Statistical tables
Instrument 1998 2001 2004 2007 2010
Foreign exchange instruments 1,527 1,239 1,934 3,324 3,981
Spot transactions² 568 386 631 1,005 1,490
Outright forwards² 128 130 209 362 475
Foreign exchange swaps² 734 656 954 1,714 1,765
Currency swaps 10 7 21 31 43
Options and other products³ 87 60 119 212 207Memo:
Turnover at April 2010 exchange rates 4 1,705 1,505 2,040 3,370 3,981
Exchange-traded derivatives 5 11 12 26 80 166
Table 1
Global foreign exchange market turnover by instrument1
Average daily turnover in April, in billions of US dollars
1 Adjusted for local and cross-border inter-dealer double-counting (ie “net-net” basis). 2 Previously classified as part of the so-
called "Traditional FX market". 3 The category "other FX products" covers highly leveraged transactions and/or trades whosenotional amount is variable and where a decomposition into individual plain vanilla components was impractical or impossible.4 Non-US dollar legs of foreign currency transactions were converted into original currency amounts at average exchange rates for
April of each survey year and then reconverted into US dollar amounts at average April 2010 exchange rates. 5 Sources: FOWTRADEdata; Futures Industry Association; various futures and options exchanges. Reported monthly data were converted intodaily averages of 20.5 days in 1998, 19.5 days in 2001, 20.5 in 2004, 20 in 2007 and 20 in 2010.
8 Triennial Central Bank Survey 2010
Amount % Amount % Amount % Amount % Amount %
Spot 568 37 386 31 631 33 1,005 30 1,490 37 with reporting dealers 347 61 216 56 310 49 426 42 518 35 with other financial institutions 121 21 111 29 213 34 394 39 755 51 with non-financial customers 99 18 58 15 108 17 184 18 217 15
Outright forwards 128 8 130 11 209 11 362 11 475 12 with reporting dealers 49 38 52 40 73 35 96 27 113 24 with other financial institutions 34 27 41 31 80 38 159 44 254 54 with non-financial customers 44 35 37 29 56 27 107 30 108 23
Foreign exchange swaps 734 48 656 53 954 49 1,714 52 1,765 44 with reporting dealers 511 70 419 64 573 60 796 46 837 47 with other financial institutions 124 17 177 27 293 31 682 40 758 43 with non-financial customers 98 13 60 9 89 9 236 14 170 10
Currency swaps 10 1 7 1 21 1 31 1 43 1 with reporting dealers 5 55 4 53 12 58 12 39 20 47 with other financial institutions 2 23 2 21 5 23 13 41 19 45 with non-financial customers 2 22 2 25 3 14 6 20 4 8
FX options and other products2 87 6 60 5 119 6 212 6 207 5 with reporting dealers 48 55 28 47 49 41 62 29 60 29 with other financial institutions 18 20 15 26 44 37 91 43 113 55 with non-financial customers 21 24 16 27 21 18 59 28 33 16
Total 1,527 100 1,239 100 1,934 100 3,324 100 3,981 100 with reporting dealers 961 63 719 58 1,018 53 1,392 42 1,548 39 with other financial institutions 299 20 346 28 634 33 1,339 40 1,900 48 with non-financial customers 266 17 174 14 276 14 593 18 533 13
Local 698 46 525 42 743 38 1,274 38 1,395 35Cross-border 828 54 713 58 1,185 61 2,051 62 2,586 65
Outright forwards 128 100 130 100 209 100 362 100 475 100 Up to 7 days 65 51 51 39 92 44 154 43 219 46 Over 7 days and up to 1 year 57 45 76 58 111 53 200 55 245 52 Over 1 year 5 4 4 3 5 3 7 2 11 2
Foreign exchange swaps 734 100 656 100 954 100 1,714 100 1,765 100 Up to 7 days 528 72 451 69 700 73 1,329 78 1,304 74 Over 7 days and up to 1 year 192 26 196 30 242 25 365 21 444 25 Over 1 year 10 1 8 1 10 1 18 1 15 1
Table 2
Global foreign exchange market turnover by instrument, counterparty and maturity1
Daily averages in April, in billions of US dollars and percentages
1 Adjusted for local and cross-border inter-dealer double-counting (ie “net-net” basis). Due to incomplete reporting, components do not
always add up to totals. 2 The category "other FX products" covers highly leveraged transactions and/or trades whose notional amountis variable and where a decomposition into individual plain vanilla components was impractical or impossible.
1998 2001 2004 2007Instrument/counterparty/maturity
2010
Triennial Central Bank Survey 2010 9
Currency 1998 2001 2004 2007 2010
US dollar 86.8 89.9 88.0 85.6 84.9Euro ... 37.9 37.4 37.0 39.1Deutsche mark 30.5 ... ... ... ...French franc 5.0 ... ... ... ...ECU and other EMS currencies 16.8 ... ... ... ...
Slovak koruna2 ... 0.0 0.0 0.1 ...
Japanese yen 21.7 23.5 20.8 17.2 19.0Pound sterling 11.0 13.0 16.5 14.9 12.9Australian dollar 3.0 4.3 6.0 6.6 7.6
Swiss franc 7.1 6.0 6.0 6.8 6.4
Canadian dollar 3.5 4.5 4.2 4.3 5.3
Hong Kong dollar3, 4 1.0 2.2 1.8 2.7 2.4
Swedish krona5 0.3 2.5 2.2 2.7 2.2
New Zealand dollar3, 4 0.2 0.6 1.1 1.9 1.6
Korean won3,4 0.2 0.8 1.1 1.2 1.5
Singapore dollar3 1.1 1.1 0.9 1.2 1.4
Norwegian krone3 0.2 1.5 1.4 2.1 1.3
Mexican peso3 0.5 0.8 1.1 1.3 1.3
Indian rupee3,4 0.1 0.2 0.3 0.7 0.9
Russian Rouble3 0.3 0.3 0.6 0.7 0.9
Polish zloty3 0.1 0.5 0.4 0.8 0.8
Turkish new lira2 ... 0.0 0.1 0.2 0.7
South African rand3, 4 0.4 0.9 0.7 0.9 0.7
Brazilian real3, 4 0.2 0.5 0.3 0.4 0.7
Danish krone3 0.3 1.2 0.9 0.8 0.6
New Taiwan dollar3 0.1 0.3 0.4 0.4 0.5
Hungarian forint3 0.0 0.0 0.2 0.3 0.4
Malaysian ringgit2 0.0 0.0 0.1 0.5 0.3
Czech koruna3 0.0 0.1 0.1 0.1 0.3
Thai baht3 0.1 0.2 0.2 0.2 0.2
Philippine peso2 0.3 0.2 0.2 0.2 0.2
Chilean peso2 0.0 0.0 0.0 0.1 0.2
Indonesian rupiah2 0.1 0.2 0.1 0.1 0.2
Israeli new shekel2 0.1 0.0 0.1 0.1 0.2
Colombian peso2 ... 0.1 0.1 0.2 0.2
Saudi riyal2 ... 0.0 0.0 0.1 0.1
Chinese renminbi4 0.1 0.1 0.0 0.1 0.1
Other currencies 8.9 6.5 6.6 7.6 5.3
All currencies 200.0 200.0 200.0 200.0 200.0
1 Because two currencies are involved in each transaction, the sum of the percentage shares of individual currencies totals 200%
instead of 100%. Adjusted for local and cross-border inter-dealer double-counting (ie “net-net” basis). 2 Data previous to 2007 cover
local home currency trading only. 3 For 1998, the data cover local home currency trading only. 4 Included as main currency from 2010.
For more details on the set of new currencies covered by the 2010 survey, see the statistical notes in Section IV. 5 For 1998, the datacover local home currency trading only. Included as main currency from 2007.
Table 3Currency distribution of global foreign exchange market turnover1
Percentage shares of average daily turnover in April
10 Triennial Central Bank Survey 2010
Amount % Amount % Amount % Amount % Amount %
USD/EUR . . 372 30 541 28 892 27 1,101 28USD/DEM 309 20 . . . . . . . .USD/FRF 60 4 . . . . . . . .USD/XEU 17 1 . . . . . . . .USD/OthEMS 178 12 . . . . . . . .USD/JPY 292 19 250 20 328 17 438 13 568 14USD/Oth 140 9 152 12 251 13 498 15 445 11USD/GBP 122 8 129 10 259 13 384 12 360 9USD/AUD 44 3 51 4 107 6 185 6 249 6USD/CAD 52 3 54 4 77 4 126 4 182 5USD/CHF 82 5 59 5 83 4 151 5 168 4EUR/JPY . . 36 3 61 3 86 3 111 3EUR/GBP . . 27 2 47 2 69 2 109 3EUR/Oth . . 17 1 35 2 83 2 102 3USD/HKD² 14 1 19 2 19 1 51 2 85 2EUR/CHF . . 13 1 30 2 62 2 72 2USD/KRW² 2 0 8 1 16 1 25 1 58 1JPY/Oth 9 1 4 0 11 1 43 1 49 1USD/SEK³ 3 0 6 0 7 0 57 2 45 1USD/INR² 1 0 3 0 5 0 17 1 36 1EUR/SEK³ . . 3 0 3 0 24 1 35 1USD/CNY² 0 0 . . 1 0 9 0 31 1USD/BRL² 3 0 5 0 3 0 5 0 26 1USD/ZAR² 6 0 7 1 6 0 7 0 24 1JPY/AUD² 1 0 1 0 3 0 6 0 24 1EUR/CAD . . 1 0 2 0 7 0 14 0EUR/AUD . . 1 0 4 0 9 0 12 0JPY/NZD² 0 0 0 0 0 0 0 0 4 0DEM/JPY 30 2 . . . . . . . .DEM/GBP 36 2 . . . . . . . .DEM/CHF 21 1 . . . . . . . .DEM/FRF 10 1 . . . . . . . .DEM/XEU 3 0 . . . . . . . .DEM/OthEMS 37 2 . . . . . . . .DEM/Oth 22 1 . . . . . . . .OthEMS⁴ 4 0 . . . . . . . .Other pairs 30 2 23 2 36 2 90 3 72 2
All currency pairs 1,527 100 1,239 100 1,934 100 3,324 100 3,981 1001 Adjusted for local and cross-border inter-dealer double-counting (ie "net-net" basis). 2 Included as main currency pair from 2010.
For more details on the set of currency pairs covered by the 2010 survey, see the statistical notes in Section IV. 3 Included as main
currency pair from 2007. 4 OthEMS/OthEMS: the data cover local home currency trading only.
Table 4
Global foreign exchange market turnover by currency pair1
Daily averages in April, in billions of US dollars and percentages
20102004 2007Currency pair
1998 2001
Triennial Central Bank Survey 2010 11
Amount % Amount % Amount % Amount % Amount % Amount %
Argentina … … 2.2 0.1 … … 0.7 0.0 1.1 0.0 1.6 0.0Australia 40.5 2.5 48.3 2.3 54.0 3.2 107.1 4.1 176.3 4.1 192.1 3.8Austria 13.5 0.8 11.8 0.6 8.4 0.5 14.6 0.6 18.8 0.4 19.5 0.4Bahrain 3.2 0.2 2.6 0.1 3.0 0.2 2.7 0.1 3.2 0.1 4.5 0.1Belgium 28.5 1.7 27.3 1.3 10.4 0.6 20.8 0.8 50.1 1.2 32.5 0.6Brazil² … … 5.1 0.2 5.5 0.3 3.8 0.1 5.8 0.1 14.2 0.3Bulgaria … … … … … … … … 0.5 0.0 0.9 0.0Canada 30.7 1.9 37.9 1.8 44.2 2.6 59.3 2.3 64.0 1.5 61.9 1.2Chile … … 1.3 0.1 2.3 0.1 2.5 0.1 4.0 0.1 5.5 0.1China³ … … 0.2 0.0 0.0 0.0 0.6 0.0 9.3 0.2 19.8 0.4Chinese Taipei … … 4.9 0.2 4.8 0.3 9.5 0.4 15.5 0.4 18.0 0.4Colombia … … … … 0.4 0.0 0.8 0.0 1.9 0.0 2.8 0.1Czech Republic … … 5.1 0.2 2.1 0.1 2.4 0.1 5.0 0.1 5.1 0.1Denmark 31.8 1.9 28.0 1.3 23.8 1.4 42.1 1.6 88.2 2.1 120.5 2.4Estonia … … … … … … 0.2 0.0 1.3 0.0 1.1 0.0Finland 5.4 0.3 4.4 0.2 1.6 0.1 1.8 0.1 8.3 0.2 31.3 0.6France 61.5 3.8 77.2 3.7 49.6 2.9 66.5 2.6 126.8 3.0 151.6 3.0Germany 79.2 4.8 99.6 4.7 91.5 5.4 120.4 4.6 101.4 2.4 108.6 2.1Greece 3.3 0.2 7.2 0.3 4.8 0.3 4.3 0.2 5.0 0.1 5.2 0.1Hong Kong SAR 90.9 5.6 79.9 3.8 68.4 4.0 106.0 4.1 181.0 4.2 237.6 4.7Hungary … … 1.4 0.1 0.6 0.0 2.8 0.1 6.9 0.2 4.2 0.1India … … 2.4 0.1 3.4 0.2 6.9 0.3 38.4 0.9 27.4 0.5Indonesia … … 1.8 0.1 3.9 0.2 2.3 0.1 3.0 0.1 3.4 0.1Ireland 4.9 0.3 10.7 0.5 8.7 0.5 7.5 0.3 11.4 0.3 14.6 0.3Israel … … … … 1.5 0.1 5.0 0.2 8.4 0.2 10.0 0.2Italy 24.2 1.5 28.6 1.4 17.6 1.0 23.5 0.9 37.6 0.9 28.6 0.6Japan 167.7 10.3 146.3 7.0 152.7 9.0 207.4 8.0 250.2 5.8 312.3 6.2Korea … … 3.6 0.2 9.8 0.6 20.5 0.8 35.2 0.8 43.8 0.9Latvia … … … … … … 2.0 0.1 2.6 0.1 2.2 0.0Lithuania … … … … … … 1.0 0.0 1.0 0.0 1.2 0.0Luxembourg 19.2 1.2 22.7 1.1 13.1 0.8 14.6 0.6 43.9 1.0 33.4 0.7Malaysia … … 1.1 0.1 1.4 0.1 1.7 0.1 3.5 0.1 7.3 0.1Mexico … … 8.7 0.4 8.6 0.5 15.3 0.6 15.3 0.4 17.0 0.3Netherlands 26.6 1.6 42.8 2.0 30.5 1.8 52.1 2.0 24.8 0.6 18.3 0.4New Zealand 7.2 0.4 7.0 0.3 4.0 0.2 7.0 0.3 12.8 0.3 8.8 0.2Norway 7.6 0.5 8.9 0.4 0.0 0.0 14.5 0.6 32.1 0.7 22.2 0.4Peru … … … … 0.2 0.0 0.3 0.0 0.8 0.0 1.4 0.0Philippines … … 0.8 0.0 1.1 0.1 0.7 0.0 2.3 0.1 5.0 0.1Poland … … 2.7 0.1 5.1 0.3 6.5 0.3 9.2 0.2 7.8 0.2Portugal 2.4 0.1 4.4 0.2 1.7 0.1 1.9 0.1 4.3 0.1 3.7 0.1Romania … … … … … … … … 2.5 0.1 3.2 0.1Russia … … 6.9 0.3 9.6 0.6 29.8 1.1 50.2 1.2 41.7 0.8Saudi Arabia … … 2.4 0.1 2.1 0.1 2.1 0.1 4.5 0.1 5.3 0.1Singapore 107.3 6.6 144.9 6.9 103.7 6.1 133.6 5.1 241.8 5.6 266.0 5.3Slovakia … … … … 0.8 0.0 1.6 0.1 3.5 0.1 0.4 0.0Slovenia … … … … 0.1 0.0 0.1 0.0 0.3 0.0 … …South Africa 5.2 0.3 8.9 0.4 9.9 0.6 9.8 0.4 14.0 0.3 14.4 0.3Spain 18.4 1.1 20.0 1.0 8.1 0.5 13.9 0.5 17.1 0.4 29.3 0.6Sweden 20.4 1.2 16.1 0.8 24.9 1.5 31.9 1.2 43.9 1.0 44.8 0.9Switzerland 88.4 5.4 91.6 4.4 76.3 4.5 85.3 3.3 253.6 5.9 262.6 5.2Thailand … … 3.1 0.1 1.9 0.1 3.1 0.1 6.3 0.1 7.4 0.1Turkey … … … … 1.0 0.1 3.5 0.1 4.1 0.1 16.8 0.3United Kingdom 478.8 29.3 685.2 32.6 541.7 32.0 835.3 32.0 1,483.2 34.6 1,853.6 36.7United States 265.8 16.3 383.4 18.3 272.6 16.1 498.6 19.1 745.2 17.4 904.4 17.9Total 1,632.7 100.0 2,099.4 100.0 1,691.7 100.0 2,608.5 100.0 4,281.1 100.0 5,056.4 100.0
2004 20071995
1 Adjusted for local inter-dealer double-counting (ie “net-gross” basis). Tables 1, 2, 3 and 4 are expressed on a "net-net" basis.
Estimated coverage of the foreign exchange market ranged between 90% and 100% in most countries. 2 Data for 1998 only cover
spot transactions. 3 Data from 1998 to 2004 only cover spot transactions.
Table 5
Geographical distribution of global foreign exchange market turnover1
Daily averages in April, in billions of US dollars and percentages
2010Country
1998 2001
12 Triennial Central Bank Survey 2010
Instrument 1998 2001 2004 2007 2010
Interest rate instruments2 265 489 1,025 1,686 2,083
FRAs 74 129 233 258 601
Swaps 155 331 621 1,210 1,275
Options and other products³ 36 29 171 217 208Memo:
Turnover at April 2010 exchange rates 4 310 640 1,085 1,680 2,083
Exchange-traded derivatives 5 1,381 2,188 4,524 6,099 8,142
Table 6
Global OTC interest rate derivatives market turnover by instrument1
Average daily turnover in April, in billions of US dollars
1 Adjusted for local and cross-border inter-dealer double-counting (ie “net-net” basis). 2 Single currency interest rate contracts
only. 3 The category "other interest rate products" covers highly leveraged transactions and/or trades whose notional amount is
variable and where a decomposition into individual plain vanilla components was impractical or impossible. 4 Non-US dollar legsof foreign currency transactions were converted into original currency amounts at average exchange rates for April of each survey
year and then reconverted into US dollar amounts at average April 2010 exchange rates. 5 Sources: FOW TRADEdata; FuturesIndustry Association; various futures and options exchanges. Reported monthly data were converted into daily averages of 20.5days in 1998, 19.5 days in 2001, 20.5 in 2004, 20 in 2007 and 20 in 2010.
Triennial Central Bank Survey 2010 13
Amount % Amount % Amount % Amount % Amount %
FRAs 74 28 129 26 233 23 258 15 601 29 with reporting dealers 46 61 88 68 112 48 143 55 296 49 with other financial institutions 21 29 37 28 113 48 89 34 267 44 with non-financial customers 7 10 5 4 8 3 27 10 37 6
Swaps 155 58 331 68 621 61 1,210 72 1,275 61 with reporting dealers 87 56 219 66 325 52 552 46 537 42 with other financial institutions 56 36 98 30 241 39 574 47 585 46 with non-financial customers 11 7 14 4 55 9 85 7 154 12
Options and other products² 36 14 29 6 171 17 217 13 208 10 with reporting dealers 17 46 16 55 57 34 106 49 87 42 with other financial institutions 12 32 7 26 96 56 85 39 90 43 with non-financial customers 8 21 5 18 16 9 24 11 30 14
Total 265 100 489 100 1,025 100 1,686 100 2,083 100 with reporting dealers 150 56 323 66 494 48 800 47 920 44 with other financial institutions 89 34 142 29 450 44 747 44 942 45 with non-financial customers 27 10 25 5 79 8 136 8 221 11
Local 133 50 207 42 414 40 564 33 762 37
Cross-border 132 50 282 58 609 59 1,120 66 1,321 63
Table 7
Gobal OTC interest rate market turnover by instrument, counterparty1
Daily averages in April, in billions of US dollars and percentages
1 Adjusted for local and cross-border inter-dealer double-counting (ie “net-net” basis). Due to incomplete reporting, components do not
always add up to totals. 2 The category "other interest rate products" covers highly leveraged transactions and/or trades whose notionalamount is variable and where a decomposition into individual plain vanilla components was impractical or impossible.
1998 2001 2004 2007Instrument/counterparty
2010
14 Triennial Central Bank Survey 2010
Currency 1998 2001 2004 2007 2010
FRAs 74 129 233 258 601US dollar 23 39 59 98 282Euro . 48 116 66 202Japanese yen 3 9 0 4 2Pound sterling 8 12 25 42 53Swiss franc 4 2 2 4 12Canadian dollar 3 1 2 1 9Australian dollar 2 4 5 3 8Swedish krona 1 4 9 18 10Other 31 10 16 22 22
Swaps 155 331 621 1,210 1,275US dollar 36 100 195 322 302Euro . 173 288 528 562Japanese yen 14 16 35 110 114Pound sterling 8 23 59 124 142Swiss franc 5 4 7 14 8Canadian dollar 3 4 5 12 38Australian dollar 1 4 7 14 28Swedish krona 0 1 4 13 7Other 87 5 20 74 73
Options and other products² 36 29 171 217 208US dollar 12 12 93 113 96Euro . 11 57 62 70Japanese yen 10 2 10 23 8Pound sterling 1 2 6 6 19Swiss franc 0 0 1 0 0Canadian dollar 1 1 1 3 1Australian dollar 0 0 1 1 1Swedish krona 0 0 0 1 4Other 11 0 1 6 8
Total 265 489 1,025 1,686 2,083US dollar 71 152 347 532 680Euro . 232 461 656 835Japanese yen 27 27 46 137 124Pound sterling 17 37 90 172 214Swiss franc 9 6 10 19 21Canadian dollar 7 6 8 15 48Australian dollar 3 8 12 19 37Swedish krona 2 5 13 33 20Other 129 16 38 102 103
Global OTC interest rate derivatives turnover by currency1
Daily averages in April, in billions of US dollars
Table 8
1 Adjusted for local and cross-border inter-dealer double-counting (ie “net-net” basis). Single currency interest rate contracts only. 2 Thecategory "other interest rate products" covers highly leveraged transactions and/or trades whose notional amount is variable and wherea decomposition into individual plain vanilla components was impractical or impossible.
Triennial Central Bank Survey 2010 15
Amount % Amount % Amount % Amount % Amount %
Argentina 0.0 0.0 … … … … 0.0 0.0 0.0 0.0Australia 2.8 0.8 9.8 1.5 12.8 1.0 22.7 1.0 40.6 1.5Austria 3.3 1.0 4.2 0.6 13.5 1.0 4.9 0.2 4.8 0.2Bahrain 0.2 0.1 0.2 0.0 0.1 0.0 0.1 0.0 0.0 0.0Belgium 4.9 1.4 14.1 2.1 30.5 2.3 21.6 1.0 10.0 0.4Brazil … … 0.3 0.0 0.9 0.1 0.1 0.0 7.5 0.3Bulgaria … … … … … … 0.0 0.0 0.0 0.0Canada 6.4 1.9 9.9 1.5 12.1 0.9 20.6 0.9 41.7 1.5Chile … … … … 0.0 0.0 0.0 0.0 0.2 0.0China … … … … … … 0.0 0.0 1.5 0.1Chinese Taipei 0.1 0.0 0.1 0.0 1.5 0.1 1.5 0.1 1.6 0.1Colombia … … … … … … 0.0 0.0 0.0 0.0Czech Republic … … 0.2 0.0 0.6 0.0 0.7 0.0 0.3 0.0Denmark 4.2 1.2 5.8 0.9 10.8 0.8 10.0 0.5 16.4 0.6Estonia … … … … … … 0.0 0.0 0.0 0.0Finland 2.1 0.6 0.5 0.1 0.3 0.0 3.0 0.1 1.3 0.0France 40.6 11.8 65.1 9.6 151.3 11.4 176.1 8.1 193.3 7.2Germany 29.1 8.5 94.0 13.9 42.8 3.2 90.2 4.2 48.5 1.8Greece 0.0 0.0 0.0 0.0 0.2 0.0 0.2 0.0 0.2 0.0Hong Kong SAR 2.4 0.7 2.6 0.4 11.3 0.8 17.3 0.8 18.5 0.7Hungary 0.0 0.0 0.0 0.0 0.2 0.0 0.8 0.0 0.2 0.0India … … 0.1 0.0 0.7 0.1 3.4 0.2 3.5 0.1Indonesia … … 0.0 0.0 0.0 0.0 0.1 0.0 0.0 0.0Ireland 1.8 0.5 5.8 0.9 12.4 0.9 7.2 0.3 7.1 0.3Israel … … … … … … 0.0 0.0 0.0 0.0Italy 4.1 1.2 23.7 3.5 37.9 2.8 29.8 1.4 27.3 1.0Japan 31.6 9.2 15.7 2.3 30.9 2.3 76.4 3.5 89.9 3.3Korea 0.0 0.0 0.1 0.0 0.9 0.1 5.4 0.2 10.7 0.4Latvia … … … … … … 0.0 0.0 0.0 0.0Lithuania … … … … 0.0 0.0 0.1 0.0 0.0 0.0Luxembourg 2.0 0.6 4.5 0.7 7.3 0.6 3.4 0.2 2.4 0.1Malaysia 0.0 0.0 0.0 0.0 0.1 0.0 0.1 0.0 1.0 0.0Mexico 0.2 0.1 0.4 0.1 1.4 0.1 2.9 0.1 1.4 0.1Netherlands 3.5 1.0 24.2 3.6 18.8 1.4 27.0 1.2 61.3 2.3New Zealand 0.4 0.1 0.3 0.0 1.3 0.1 2.8 0.1 1.5 0.1Norway 2.8 0.8 2.9 0.4 5.2 0.4 6.6 0.3 11.9 0.4Peru … … … … … … 0.0 0.0 0.0 0.0Philippines 0.0 0.0 … … 0.0 0.0 0.0 0.0 1.1 0.0Poland … … 0.4 0.1 1.0 0.1 2.7 0.1 1.6 0.1Portugal 1.0 0.3 0.3 0.0 0.7 0.1 0.8 0.0 0.7 0.0Romania … … … … … … 0.0 0.0 0.0 0.0Russia 0.0 0.0 … … … … 0.0 0.0 0.0 0.0Saudi Arabia 0.2 0.1 0.1 0.0 0.1 0.0 0.3 0.0 0.1 0.0Singapore 5.3 1.6 3.2 0.5 8.6 0.6 57.4 2.6 77.9 2.9Slovakia … … 0.0 0.0 … … 0.0 0.0 0.0 0.0Slovenia … … … … … … 0.0 0.0 … …South Africa 0.7 0.2 0.6 0.1 3.0 0.2 4.5 0.2 6.0 0.2Spain 2.9 0.8 20.5 3.0 11.9 0.9 16.8 0.8 30.7 1.1Sweden 3.6 1.0 3.2 0.5 7.4 0.6 12.3 0.6 18.2 0.7Switzerland 5.9 1.7 9.6 1.4 12.0 0.9 60.7 2.8 78.8 2.9Thailand … … 0.0 0.0 0.1 0.0 0.4 0.0 0.7 0.0Turkey … … … … 0.0 0.0 0.1 0.0 0.0 0.0United Kingdom 122.9 35.8 237.8 35.2 563.0 42.3 957.1 44.0 1234.9 45.8United States 58.4 17.0 115.7 17.1 317.4 23.8 525.0 24.2 641.8 23.8Total 343.6 100.0 676.0 100.0 1331.1 100.0 2173.2 100.0 2697.5 100.0
Table 9
Geographical distribution of global interest rate derivatives turnover1
Daily averages in April, in billions of US dollars and percentages
1 Adjusted for local inter-dealer double-counting (ie “net-gross” basis). Tables 6, 7 and 8 are expressed on a "net-net" basis.
Country1998 2001 2004 2007 2010
16 Triennial Central Bank Survey 2010
IV. Statistical notes
The objective of the Triennial Central Bank Survey of Foreign Exchange and Derivatives Market Activity is to obtain the most comprehensive and internationally consistent information on the size and structure of foreign exchange and over-the-counter (OTC) interest rate derivative markets. The purpose of the statistics is to increase market transparency and thereby help central banks, other authorities and market participants to better monitor patterns of activity in the global financial system. The latest triennial survey covered turnover in April 2010, as reported by 1,309 market participants in 53 countries and financial centres10 on a gross and unconsolidated basis. The format of the 2010 survey included the following main refinements and clarifications of reporting procedures as compared with the previous survey:
The list of currency pairs has been expanded in order to capture transactions involving currencies typically used in carry trade strategies, namely AUD/JPY, NZD/JPY, USD/ZAR and USD/HKD. In addition, trades in the Brazilian real, Chinese renminbi, Indian rupee and Korean won against USD were also collected.
A more detailed counterparty breakdown for each instrument has been collected for identification of execution method in order to include a distinction between “with reporting dealers, local” and “with reporting dealers, cross-border”.
Despite these changes, the data presented here can be considered as being largely comparable with those of the previous triennial survey in 2007, notwithstanding the different structure of the results (see Section I). Weighted average coverage of foreign exchange markets in reporting countries increased from 96% in 2007 to 97% in 2010.
1. Coverage
The triennial survey collects data on the following foreign exchange instruments: spot transactions, outright forwards, foreign exchange swaps, currency options and currency swaps.
The survey also collects data on the following interest rate derivatives: forward rate agreements (FRAs), interest rate swaps and interest rate options.
2. Turnover data
Turnover data provide a measure of market activity, as well as an indication of market liquidity. Turnover was defined as the absolute gross value of all new deals entered into during the month of April 2010, and was measured in terms of the nominal or notional amount of the contracts.
10 Slovenia did not participate in 2010.
Triennial Central Bank Survey 2010 17
No distinction was made between sales and purchases (ie a purchase of $5 million against sterling and a sale of $7 million against sterling would amount to a gross turnover of $12 million). Direct cross-currency transactions are counted as single transactions; however, cross-currency transactions passing through a vehicle currency are recorded as two separate deals against the vehicle currency. The gross amount of each transaction was recorded once, and netting arrangements and offsets are ignored. For turnover of transactions with variable nominal or notional principal amounts, the nominal or notional principal amount on the transaction date was reported.
The basis for reporting was in principle the location of the sales desk of any trade, even if deals entered into in different locations are booked in a central location. Thus, transactions concluded by offices located abroad are not reported by the country of location of the head office, but by that of the office abroad (insofar as the latter was a reporting institution in one of the other 52 reporting countries). Where no sales desk was involved in a deal, the trading desk was used to determine the location of deals.
In all cases, transactions are reported to the BIS in US dollar equivalents, with non-dollar amounts generally converted into US dollars using the exchange rate prevailing on the date of the trade.
As in the previous triennial foreign exchange market surveys, turnover data are collected over a one-month period, the month of April, in order to reduce the likelihood that very short-term variations in activity might contaminate the data. The data collected for the survey reflected all transactions entered into during the calendar month of April 2010, regardless of whether delivery or settlement was made during that month.
In order to allow a comparison across countries, daily averages of turnover are computed by dividing aggregate monthly turnover for the country in question by the number of days in April on which the foreign exchange and derivatives markets in that country were open. The number of trading days ranged from 18 to 22 in April 2010, with the exception of Saudi Arabia (30 days) and Bahrain (24 days).
3. Instruments
The definitions used for foreign exchange market instruments are the following:
Spot transaction: single outright transaction involving the exchange of two currencies at a rate agreed on the date of the contract for value or delivery (cash settlement) within two business days.
Outright forward: transaction involving the exchange of two currencies at a rate agreed on the date of the contract for value or delivery (cash settlement) at some time in the future (more than two business days later). This category also includes forward rate agreement (FRA) transactions, non-deliverable forwards and other forward contracts for differences.
Foreign exchange swap: transaction which involves the actual exchange of two currencies (principal amount only) on a specific date at a rate agreed at the time of the conclusion of the contract (the short leg), and a reverse exchange of the same two currencies at a date further in the future at a rate (generally different from the rate applied to the short leg) agreed at the time of the contract (the long leg).
Currency swap: contract which commits two counterparties to exchange streams of interest payments in different currencies for an agreed period of time and usually to
18 Triennial Central Bank Survey 2010
exchange principal amounts in different currencies at a pre-agreed exchange rate at maturity.
Currency option: option contract that gives the right to buy or sell a currency with another currency at a specified exchange rate during a specified period. This category also includes exotic currency options such as average rate options and barrier options.
The definitions used for OTC single-currency interest rate derivatives are the following:
Forward rate agreement (FRA): interest rate forward contract in which the rate to be paid or received on a specific obligation for a set period of time, beginning at some time in the future, is determined at contract initiation.
Interest rate swap: agreement to exchange periodic payments related to interest rates on a single currency; can be fixed for floating, or floating for floating based on different indices. This group includes those swaps whose notional principal is amortised according to a fixed schedule independent of interest rates.
Interest rate option: option contract that gives the right to pay or receive a specific interest rate on a predetermined principal for a set period of time.
4. Counterparties
Following the methodology of the previous triennial central bank surveys, reporting institutions were requested to provide for each instrument a breakdown of contracts by counterparty as follows: reporting dealers, other financial institutions and non-financial customers, with separate information on local and cross-border transactions. The distinction between local and cross-border had to be determined according to the location of the counterparty and not its nationality.
“Reporting dealers” are defined as those financial institutions that actively participate in local and global foreign exchange and derivatives markets. These are mainly large commercial and investment banks and securities houses that (1) participate in the inter-dealer market and/or (2) have active business with large customers, such as large corporate firms, governments and other non-reporting financial institutions; in other words, reporting dealers are institutions that are actively buying and selling currency and OTC derivatives both for their own account and/or to meet customer demand. In practice, reporting dealers are often those institutions that actively or regularly deal through electronic platforms, such as EBS or Reuters dealing facilities. The category of reporting dealers also includes the branches and subsidiaries of institutions operating in multiple locations that have sales desks, but not necessarily trading desks, which conduct active business with large customers.
“Other financial institutions” are defined as those financial institutions that are not classified as reporting dealers. Thus, they mainly cover all other financial institutions, such as smaller commercial banks, investment banks and securities houses, and in addition mutual funds, pension funds, hedge funds, currency funds, money market funds, building societies, leasing companies, insurance companies, financial subsidiaries of corporate firms and central banks.
“Non-financial customers” are defined as any counterparty other than those described above, ie mainly non-financial end users, such as corporations and governments.
Triennial Central Bank Survey 2010 19
5. Currency and other market risk breakdowns
In order to obtain consistent data on turnover in principal currency segments of the foreign exchange market, reporting institutions are asked to report turnover data on foreign exchange contracts and to identify the main currency pairs. Thus, data should be provided separately for trading in the domestic currency, the US dollar and the euro against each other and against the individual currencies listed below.
JPY: Japanese yen
GBP: pound sterling
CHF: Swiss franc
CAD: Canadian dollar
AUD: Australian dollar
SEK: Swedish krona
Other currencies
Due to the importance of carry trade activities, data were also collected for transactions involving certain combination of currencies that – not being explicitly listed in the main currency pairs above – are typically present in carry trade strategies, namely: USD/ZAR, USD/HKD, AUD/JPY and NZD/JPY. In addition, data on trades in the Brazilian real, Chinese renminbi, Indian rupee and Korean won against USD were also collected.
Moreover, given the increasing interest in the identification of turnover in all reporting countries’ currencies, reporting dealers were requested to provide supplementary information on total turnover for the following currencies:
Argentine peso, Australian dollar, Bahraini dinar, Brazilian real, Bulgarian lev, Canadian dollar, Swiss franc, Chilean peso, Chinese renminbi, Colombian peso, Czech koruna, Danish krone, Estonian kroon, pound sterling, Hong Kong dollar, Hungarian forint, Indonesian rupiah, Israeli new shekel, Indian rupee, Japanese yen, Korean won, Latvian lats, Lithuanian litas, Malaysian ringgit, Mexican peso, Norwegian krone, New Zealand dollar, Peruvian new sol, Philippine peso, Polish zloty, Romanian leu, Russian rouble, Saudi riyal, Singapore dollar, Swedish krona, New Taiwan dollar, Thai baht, Turkish lira and South African rand.
6. Maturities
Transactions in outright forwards and foreign exchange swaps are to be broken down between the following maturity bands: seven days or less; over seven days and up to one year; over one year.
7. Elimination of double-counting
Double-counting arises because transactions between two reporting entities are recorded by each of them, ie twice. In order to derive meaningful measures of overall market size, it is therefore necessary to halve the data on transactions between reporting dealers. To permit this, reporters are asked to distinguish deals contracted with other reporters (dealers). The following methods of adjustment are applied: data on local deals with other reporters are firstly divided by two, and this figure is subtracted from total gross data to arrive at so-called “net-gross” figures, ie business net of local inter-
20 Triennial Central Bank Survey 2010
dealer double-counting. In a second step, data on cross-border deals with other reporters are also divided by two, and this figure is subtracted from total “net-gross” data to obtain so-called “net-net” figures, ie business net of local and cross-border inter-dealer double-counting.
8. Intertemporal comparisons
Intertemporal comparisons are complicated by changes in coverage and definition, and by the movement of exchange rates over the three-year periods separating the surveys in the participating countries.
Changes in coverage might have been of two kinds. First, within national markets the coverage of dealers active in national markets might have changed. An increase in the number of reporting institutions, for example, does not necessarily denote greater coverage. If institutions which were not active before, and were therefore not covered in earlier reports, began to deal on a substantial scale, it is legitimate to compare the total turnover of the larger number of reporting institutions with the total turnover of the smaller number reporting their transactions in the previous period. The same applies, of course, in the case of a decrease in the number of reporting institutions due to a reduction or the transfer to another country of their activity, and to their relative importance in the market.
The second type of change in coverage relates to the inclusion of a larger number of countries and of new features since the inception of the survey in 1986. For instance, in 1995 the coverage of market activity was significantly expanded to include most financial derivatives. In 1998 the number of reporting countries increased from 28 to 43 and the coverage of derivatives market activity was further expanded to include separate data on credit-linked derivatives. In 2001, 2004 and 2007 the number of reporting countries increased further to 48, 52 and 54, respectively, while in 2010 the number of participating countries dropped to 53. For all these periods the coverage of market segments remained the same as in 1998.
While the additional information provided by new reporting countries is valuable, not all of it relates to transactions that were not captured before. The bulk of these countries’ cross-border transactions with dealers can be presumed to have been included in the reports of their counterparties in earlier years. In new reporting countries, the business not captured before therefore relates to local inter-dealer transactions and those with non-reporting financial institutions and customers.
Another complication involves changes in definitions. Most changes in definitions reflect improvements in compilation procedures. In particular, greater effort has been made following the 1992 survey to classify counterparties accurately and a finer counterparty breakdown has been used. As a result, it is now possible to arrive at more accurate estimates of double-counting and to compile net figures on turnover for all items.
However, intertemporal comparisons have to be interpreted carefully. The current procedure introduces biases to the extent that the share of inter-dealer business has changed over time. In 2004, an effort was made to clarify the concept of reporting dealers, in order to better distinguish between inter-dealer and customer transactions. In addition, the reporting basis for the location of trades was further clarified as being, in principle, that of the sales desk of any reporting institution. See Section 4 of these statistical notes for more details.
Triennial Central Bank Survey 2010 21
The extension of the currency breakdown in 2010, to ensure a finer identification of the turnover in all participating countries’ currencies, is another factor to be considered when analysing movements in a particular currency.
9. Data at constant exchange rates
Another question often raised with intertemporal comparisons is the impact on aggregate turnover of movements in exchange rates vis-à-vis the US dollar from one reporting date to the next. For instance, turnover in the Japanese yen/pound sterling sector might have remained unchanged from one reporting period to the next in terms of these currencies. But if the dollar rises against both currencies, total turnover in the segment reported in dollar terms will be lower, thus signalling a decline where none has in fact taken place. Even in currency pairs involving the dollar, exchange rate movements will impact on turnover. For example, if a trade for a fixed amount of yen against US dollars is transacted, the trade will enter the aggregates with a smaller or larger US dollar amount, depending on how the yen moves against the dollar from one reporting date to the next. To provide some guidance on the impact of actual exchange rate movements on total reported aggregates, pre-2010 totals have been provided additionally recalculated at constant exchange rates, replacing historical exchange rates by average April 2010 exchange rates. All transactions in a given currency, say the yen, are converted into original currency terms at the historical exchange rate and then recalculated using the average April 2010 dollar/yen exchange rate, as appropriate. In the case of foreign exchange transactions, the dollar side of transactions remains unchanged, since the exchange rate for dollar amounts is constant (and equal to one) over time. The sums of all recalculated transactions are divided by two. This takes account of the joint contribution of two currencies to each foreign exchange transaction.