Triangulating Your Data For A Rich Picture Of Safety · Triangulating Your Data For A Rich Picture...
29
Triangulating Your Data For A Rich Picture Of Safety Welcome, the call will begin at 14:00
Transcript of Triangulating Your Data For A Rich Picture Of Safety · Triangulating Your Data For A Rich Picture...

Triangulating Your Data For A Rich Picture Of Safety
Welcome, the call will begin at 14:00
Agenda
• Welcome and introductions
• What do we mean by triangulation?
• Understanding different sources of safety data
• Tips for data triangulation
• Bringing it all together

What do we mean by triangulation?
What do we mean by triangulation?
• Different data sources for one specific measure / issue • Different types of display of data for one measure
• Different measures related to one broader topic
• Different cuts of the data: by setting, specialty etc

Understanding different sources of safety data


What can we learn from each data source?


Tips for data triangulation
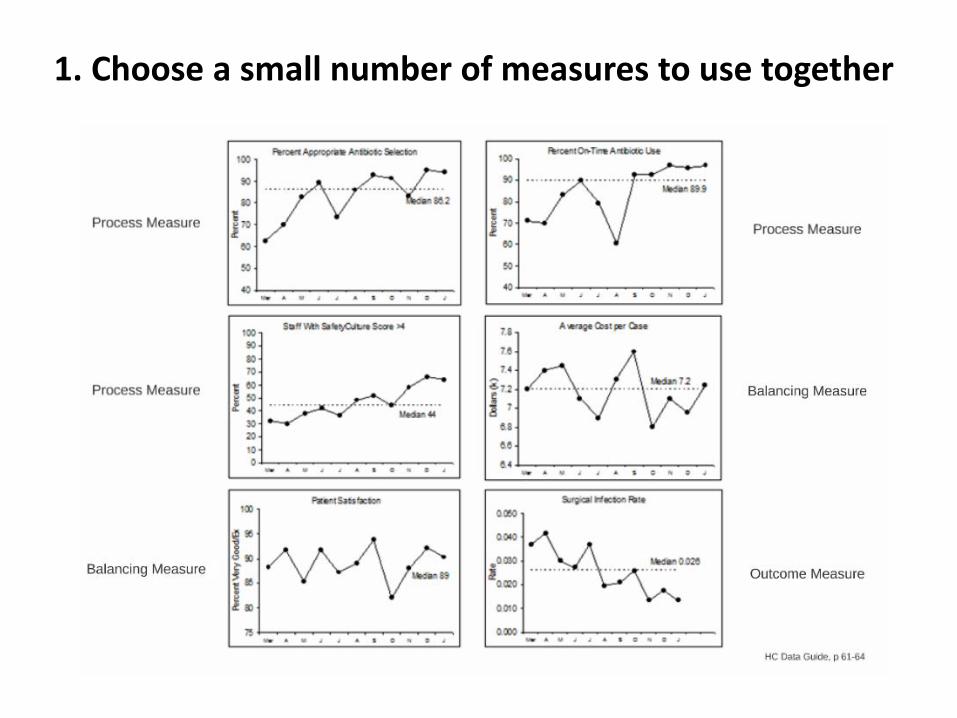
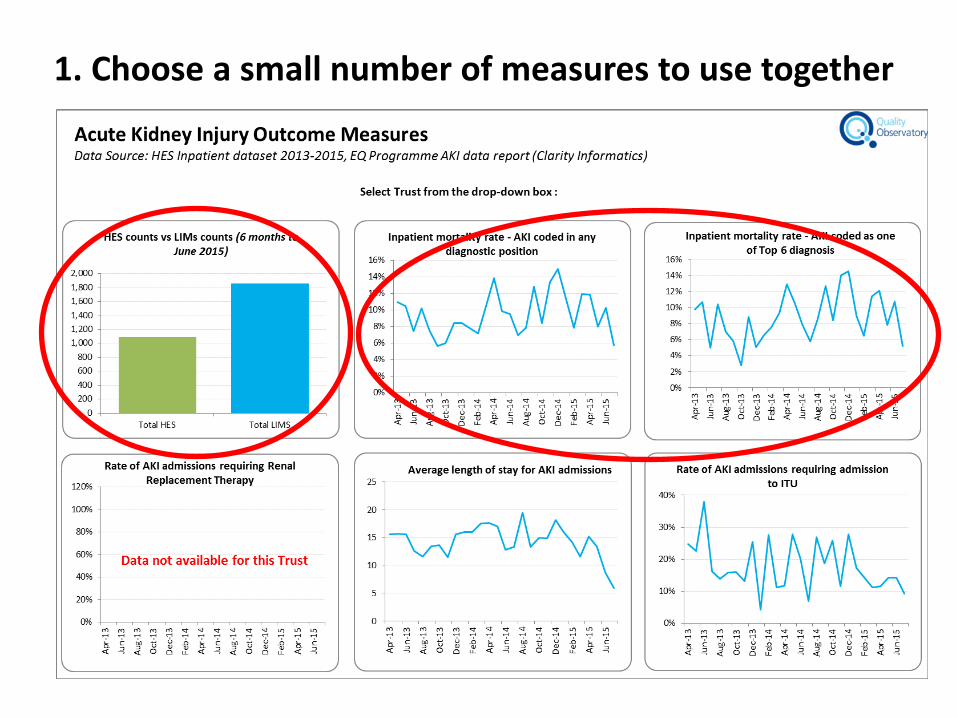
1. Choose a small number of measures to use together

1. Choose a small number of measures to use together Sutton CCG: Urgent and Emergency Care DashboardTest Court Nursing Home
Address 16 Somewhere Square CQC rating:Postcode SM1 4LDType Nursing Safe Effective Caring Responsible Well ledDementia NoFunding PrivateBeds 20Occupancy rate 80.0%
Good
Select care/nursing home:
0
10
20
30
40
50
60
Apr-15 May-15 Jun-15 Jul-15 Aug-15 Sep-15
Num
ber o
f inc
iden
ts
Test Court Nursing Home: LAS incidents for ALL as chief complaint
Select chief complaint
LAS incidents to care/nursing home locations
A&E attendances from care/nursing home locations
0
10
20
30
40
50
60
Apr-15 May-15 Jun-15 Jul-15 Aug-15 Sep-15
Num
ber o
f att
endn
ces
Test Court Nursing Home: A&E attends for ALL as A&E diagnosis category
Select A&Ediagnosis category
Select primary diagnosis Emergency admissions from care/nursing home locations
9
9.5
10
10.5
11
11.5
12
12.5
Apr-15 May-15 Jun-15 Jul-15 Aug-15 Sep-15
Test Court Nursing Home: Emergency admissions ALL as primary diagnosis
0123456789
10
May-15 Jun-15 Jul-15 Aug-15 Sep-15
Test Court Nursing Home: Emergency av. length of stay ALL as primary diagnosis
0
10
0
12
0
12
0
15
0
0
13
0
0
0
0
0
02468
10121416
65-49 70-74 75-79 80-84 85-89 90-94 95-99 100+
Male Female
Test Court Nursing Home: Age & gender split (all diags)
50
120 0 00
102030405060
Usua
l pla
ce o
fre
siden
ce
Curre
ntin
patie
nt
LA re
siden
tial
acco
mm
odat
ion
Non-
NHS
(oth
er th
an LA
)ru
n Ca
re H
ome
Patie
nt d
ied
Test Court Nursing Home: Discharge destination split (all diags)
15 12
010
0
25
005
1015202530
Mon
day
Tues
day
Wed
nesd
ay
Thur
sday
Frid
ay
Satu
rday
Sund
ay
Test Court Nursing Home: Week day of admission (all diags)
1. Choose a small number of measures to use together

1. Choose a small number of measures to use together
Remember: Ensure your measures are linked to your aim; be guided by what you need, not by what you can get Have a mix of process, outcome and balancing measures; a family of measures Wherever possible, look at measures on the same page Think about patient centred measures and measures from different settings

2. Understand your different data sources

2. Understand your different data sources

2. Understand your different data sources
Remember: Different data collections were designed for different purposes and should be viewed in an appropriate context No data is ‘bad’ data, everything can provide useful knowledge Multidisciplinary discussions of multiple datasets provides the best insight
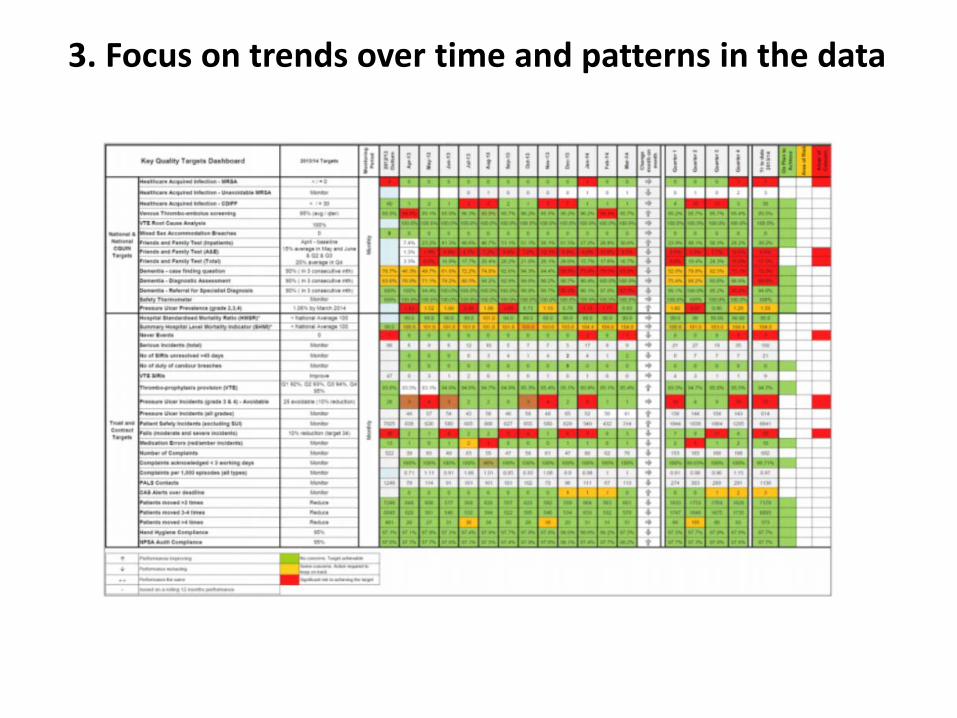
3. Focus on trends over time and patterns in the data

3. Focus on trends over time and patterns in the data
HES data (administrative) Safety Thermometer (improvement)
NRLS data (incident reporting)

Acute Trust A Community Trust B
Acute Trust A Community Trust B 3. Focus on trends over time and patterns in the data
3. Focus on trends over time and patterns in the data
Remember: Worry less about absolute numbers and look at how trends are similar or differ Think back to your understanding of data sources to help you understand differences or similarities when using them together Look at the data from different ‘angles’ by using different plots or different cuts We’re not doing research; don’t worry about ‘controlling’ the data

4. Use qualitative information as well as numbers
4. Use qualitative information as well as numbers
Remember: Data is most effective if you can tell a story with it
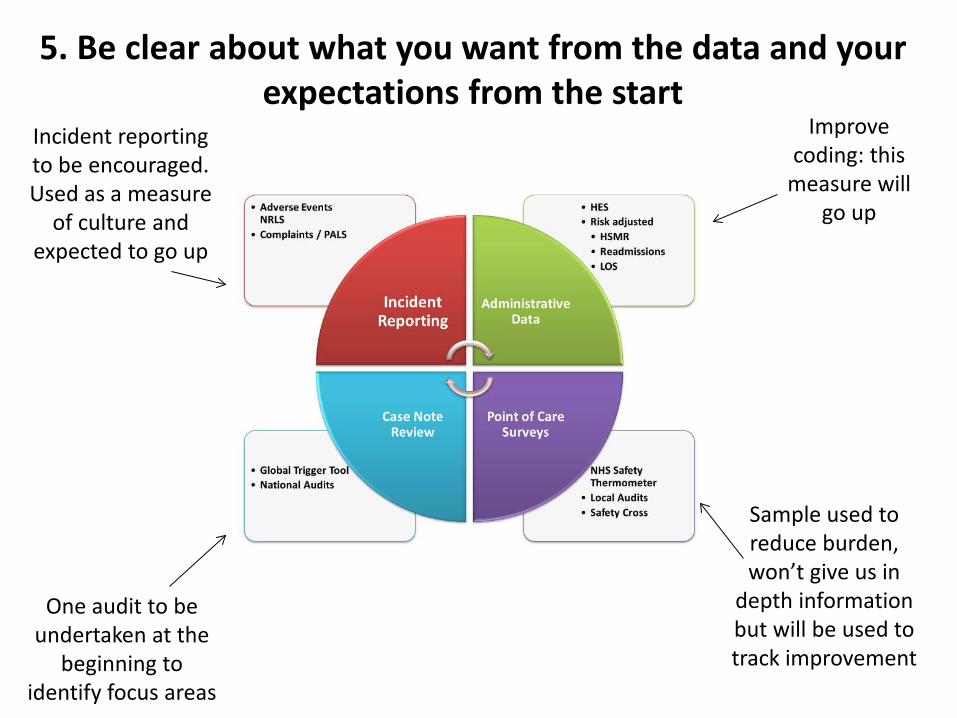
5. Be clear about what you want from the data and your expectations from the start
Improve coding: this
measure will go up
Sample used to reduce burden, won’t give us in
depth information but will be used to track improvement
One audit to be undertaken at the
beginning to identify focus areas
Incident reporting to be encouraged. Used as a measure
of culture and expected to go up
5. Be clear about what you want from the data and your expectations from the start
Remember: You know your system and processes best; work with your analysts to get a view of what you expect to happen, for example, at different times of the year, or in relation to specific improvement work Each time you review refreshed data ask the question “is this what we expected to happen” Think back to tip 1; by linking your measures to your goals you will be much more able to articulate your expectations

Bringing it all together


Thank You
Upcoming Calls
Developing a Measurement Strategy - 25th November 2015 - 2:00pm
Making Safety Visible: improving the measurement and monitoring of safety - 8th December 2015 - 11:00am
Making the most of your NHS Safety Thermometer data - 1st February 2016 - 11:00am
Measurement for boards: past, present and future - 22nd February 2016 - 11:00am