Triangulating Judicial Responsiveness: Automated Content ...
Triangulating the ApdexMetric with Barry-3
CMG International ConferenceSan Diego, CaliforniaDecember 5, 2007
Dr. Neil J. GuntherPerformance DynamicsCastro Valley, [email protected]
Mario Francois JauvinMFJ AssociatesOttawa, [email protected]
Session 45A

Motivation
Better Performance ThroughBetter Visualization

Slide 3
How High is Mt. Everest?
Highest mountain in the world How do we know that? It’s a single number (like AT)
Estimates have varied It’s rising a few mm each year But moves northward several cm GPS is less accurate for heights
Surveyors solved this problem along time ago

Slide 4
All Done with Triangles
Surveying procedure Triangulation Start with short distances Form triangular mesh
Great Trigonometric Surveyof India How big is my colony? Started by the British c.1790 George Everest joined in 1822 First estimate of Everest c.1850
was 8849m Officially: 8848.82m
Computer graphics Similar idea Triangular mesh for defining
irregular shapes

Slide 5
Some Facts About Triangles
B C
A
In following, consider only equilateral ∆ (each interior angle = 60°) For ∆ sides of length 2, height h = √ 3
For ∆ sides of length 1, height h = √ 3/2 For ∆ sides of length 2/√ 3, height h = 1
Bisector of each side also bisects opposite interior angle (30°)
Slide 6
The Centroid
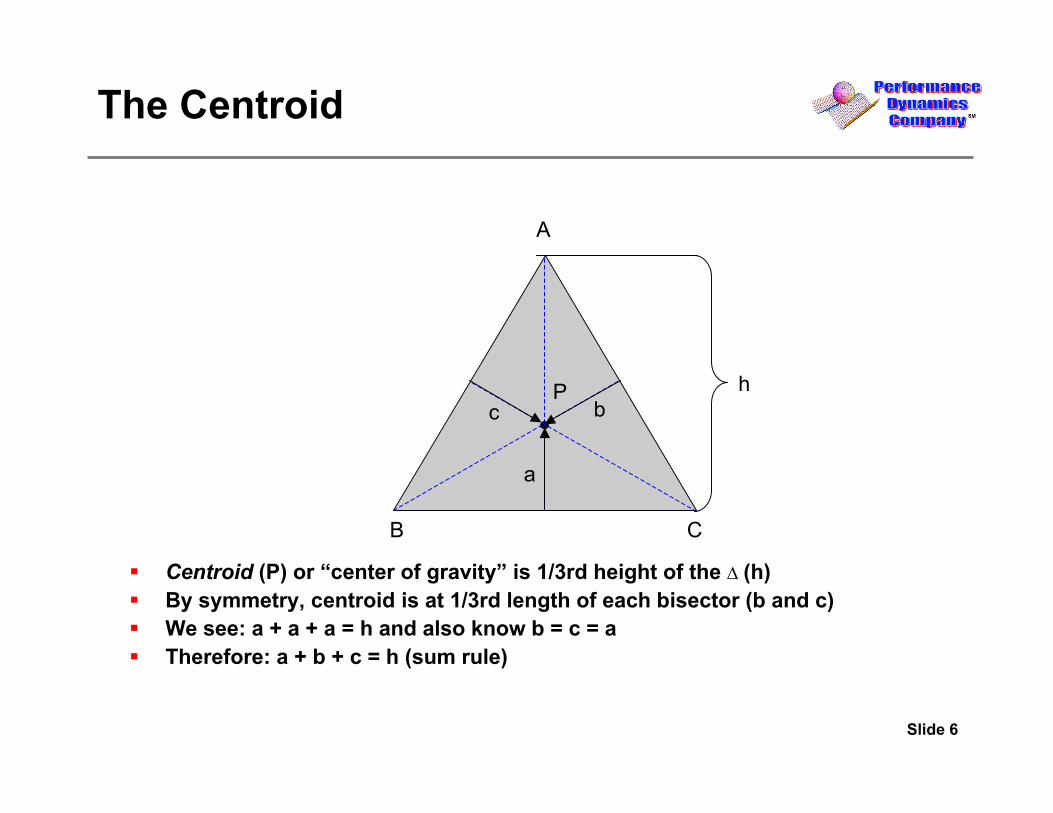
Centroid (P) or “center of gravity” is 1/3rd height of the ∆ (h) By symmetry, centroid is at 1/3rd length of each bisector (b and c) We see: a + a + a = h and also know b = c = a Therefore: a + b + c = h (sum rule)
B C
A
h
a
bcP
Slide 7
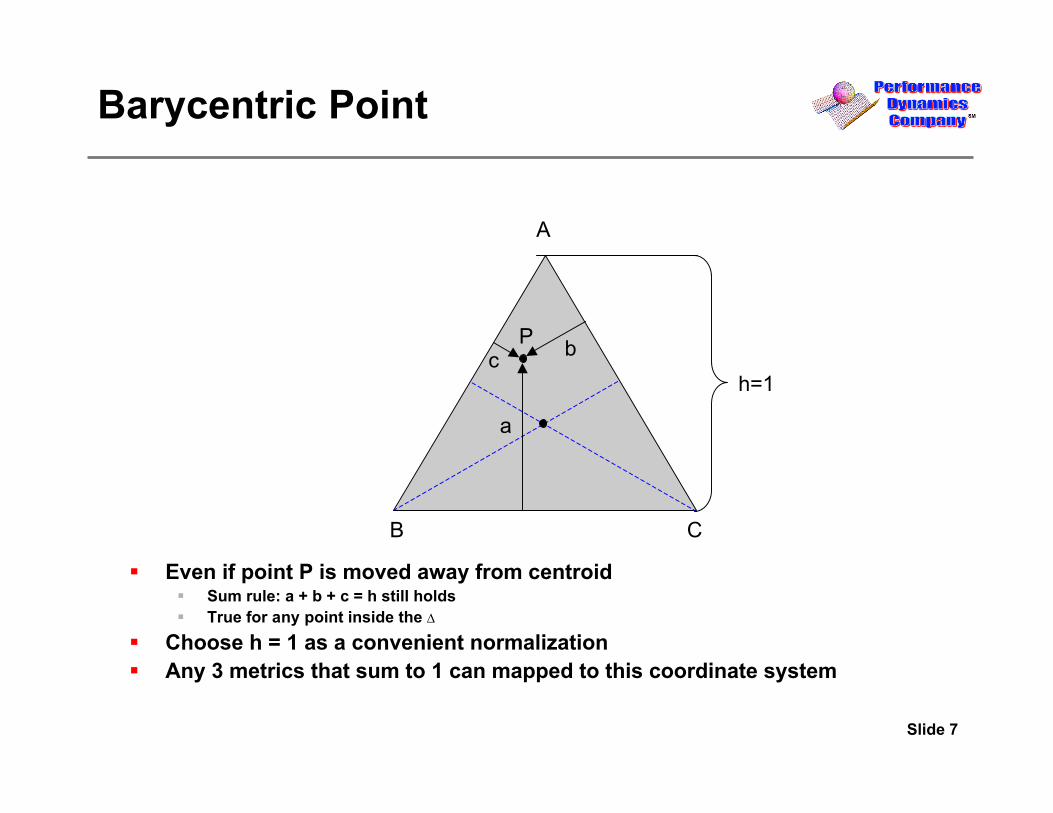
Even if point P is moved away from centroid Sum rule: a + b + c = h still holds True for any point inside the ∆
Choose h = 1 as a convenient normalization Any 3 metrics that sum to 1 can mapped to this coordinate system
Barycentric Point
B C
A
h=1
a
bcP

Slide 8
Apdex Categories
Categorical data Sampled RTT counts Categorized by threshold time T
– Satisfied (0 < Sat < T)– Tolerating (T < Tol < 4T)– Frustrated (Frus > 4T)
Ratio of counts If total counts in any period is Cnt, then Sat + Tol + Frus = Cnt
– Equivalently: (Sat/Cnt) + (Tol/Cnt) + (Frus/Cnt) = 1 Think of each term as a percentage of Cnt
– Satisfied% + Tolerating% + Frustrated% = 100% More simply: s + t + c = 1
– Where: s = Satisfied%, t = Tolerating%, f = Frustrated% Barycentric coordinates
s + t + c = 1 means each triple {s, t, c} is a barycentric point– Only need a pair of {s,t,c} because of sum rule

Slide 9
Apdex Index
Apdex categories define Index AT = s + t/2
Application responsiveness AT based on RTT counts e.g., Gomez User-perceived performance (not
system performance) Single number AT reported
Aimed at Executive Mgrs. Normalized range: 0 < AT < 1 Colored zones for AT values
Some Limitations How to compare 5 geographic AT
values for the same appln? (Table?) How to compare 5 geographic AT
values for 5 apps? (messy) Most enterprises need to compare
100’s of apps? (give up?) Also want to know how multiple AT
values change in time

Solution
Mapping Apdex to Barry-3

Slide 11
Any 3 metrics that sum to 1 can mapped to Barry-3 system Apdex categories: s + t + f = 1 (height) Arrows {s,t,f} range from each side (min=0) to opp. interior angle (max=1)
Limitation Don’t know the numerical value of AT
Locating AT in Barry-3
t f
s
s
tfAT
Min
imal
Fru
stra
tion
(f =
0)
Maximal Satisfaction
Maxim
al Frustration (f > 0)
Minimal Satisfaction

Slide 12
Adding Numerical Apdex Zones
AT zones are diagonal bands NOTE: Zone edges are parallel to Barry t-axis
Zone boundaries are lines of constant AT (isoclines) Zones are actually independent of Barry-3 coordinates
Minimal Satisfaction
A=0.50
A=0.75
A=0.50
A=0.75
Maximal Satisfaction
A=1.00 A=1.00
A=0.00t f
s
Min
imal
Fru
stra
tion
(f =
0)
Maxim
al Frustration (f > 0)
Slide 13
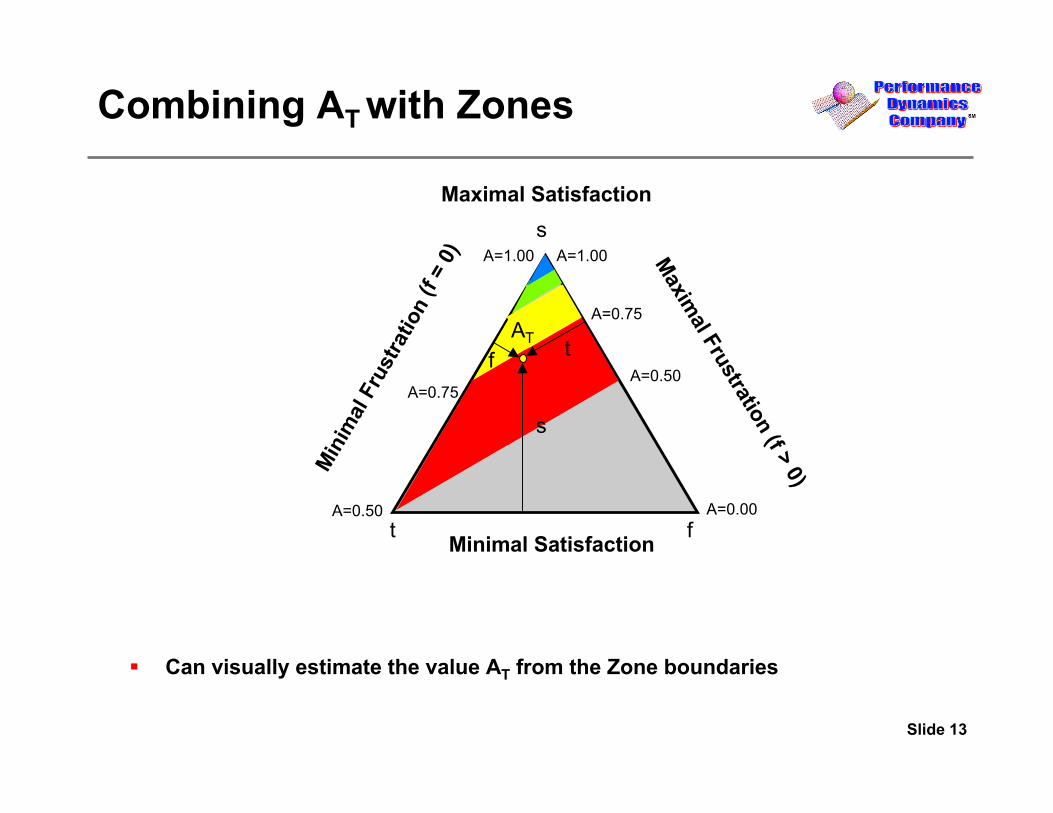
Combining AT with Zones
Minimal Satisfaction
A=0.50
A=0.75
A=0.50
A=0.75
Maximal Satisfaction
A=1.00 A=1.00
A=0.00t f
s
Min
imal
Fru
stra
tion
(f =
0)
Maxim
al Frustration (f > 0)
s
tfAT
Can visually estimate the value AT from the Zone boundaries

Slide 14
Example AT Data in Barry-3
Shown are 5 geographic measurements of the same application Some points may cover each other Most clustered near s = 1 apex in this sample One straggler is near the centroid
Data supplied by Peter Sevcik
Min
imal
Fru
stra
tion
(f =
0)
A=0.50
A=0.75
A=0.50
A=0.75
Maximal Satisfaction
Maxim
al Frustration (f > 0)A=1.00 A=1.00
Minimal SatisfactionA=0.00
t f
s
Slide 15
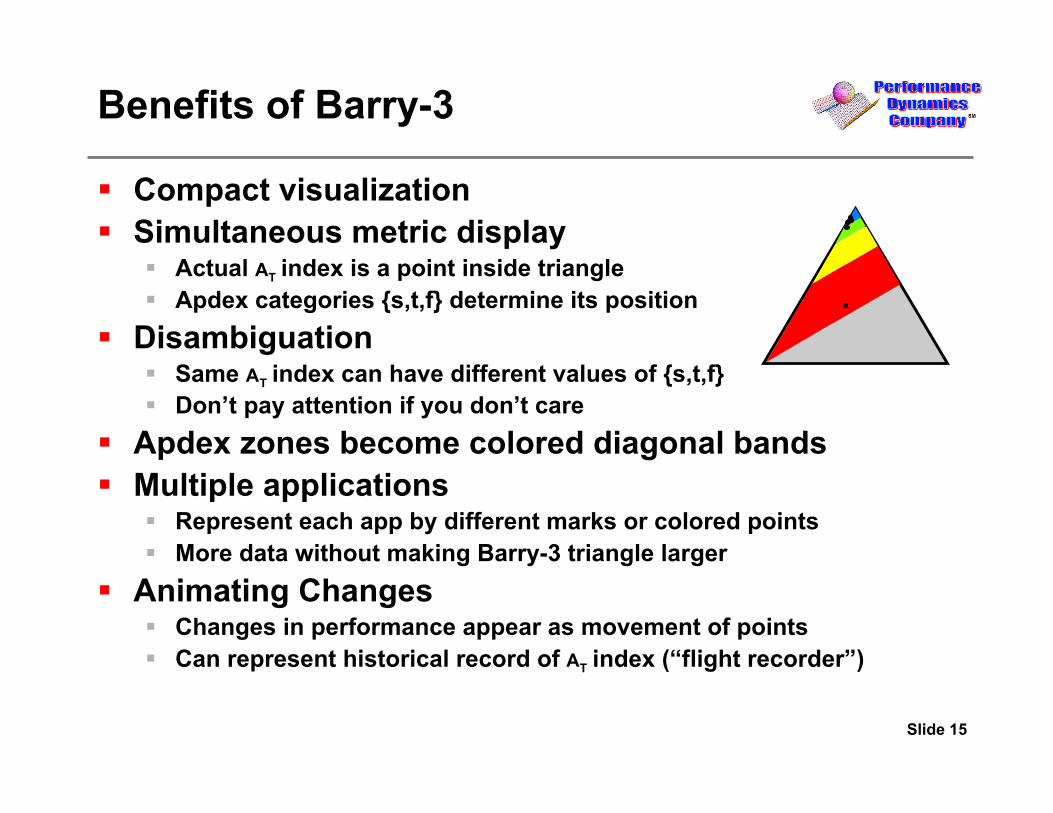
Benefits of Barry-3
Compact visualization Simultaneous metric display
Actual AT index is a point inside triangle Apdex categories {s,t,f} determine its position
Disambiguation Same AT index can have different values of {s,t,f} Don’t pay attention if you don’t care
Apdex zones become colored diagonal bands Multiple applications
Represent each app by different marks or colored points More data without making Barry-3 triangle larger
Animating Changes Changes in performance appear as movement of points Can represent historical record of AT index (“flight recorder”)

Sir Barry
Questions?
Thank YouSir BarrySir Barry
conquersconquersMt. EverestMt. Everest
in 1953in 1953