TRIAL ON VT TREATMENT -...
25
T TR RI IA AL L O ON N V VT T T TR RE EA AT TM ME EN NT T q I IC CD D i in n s se ec co on nd da ar ry y p pr re ev ve en nt ti io on n q I IC CD D i in n p pr ri im ma ar ry y p pr re ev ve en nt ti io on n
Transcript of TRIAL ON VT TREATMENT -...

TTRRIIAALL OONN VVTT TTRREEAATTMMEENNTT
q IICCDD iinn sseeccoonnddaarryy pprreevveennttiioonn
q IICCDD iinn pprriimmaarryy pprreevveennttiioonn

Primary prevention § MADIT (1) § CABG-Patch (2) § CAT (1) § MUSTT (3) § AMIOVIRT (1) § MADIT II (1) § SCD-HeFT (4) § DINAMIT (5) § DEFINITE (5) § IRIS
Inserire bibliografia

MADIT § MADIT: 1990 – 1995
" RCT* multicenter with ICD vs. antiarrhythmic drugs " 32 centers/196 pts, follow-up 27 months " Inclusion criteria : MI ≥ 3 weeks before enrolment, EF ≤ 35 % " Other risk factors: NSVT and inducible VT inducibile " Results:
Mortality: 16% in ICD group vs. 39% in standard therapy group . Aboslute risk reduction 23%
*Studio clinico randomizzato Moss AJ et al. NEJM 1996;335:1933-40
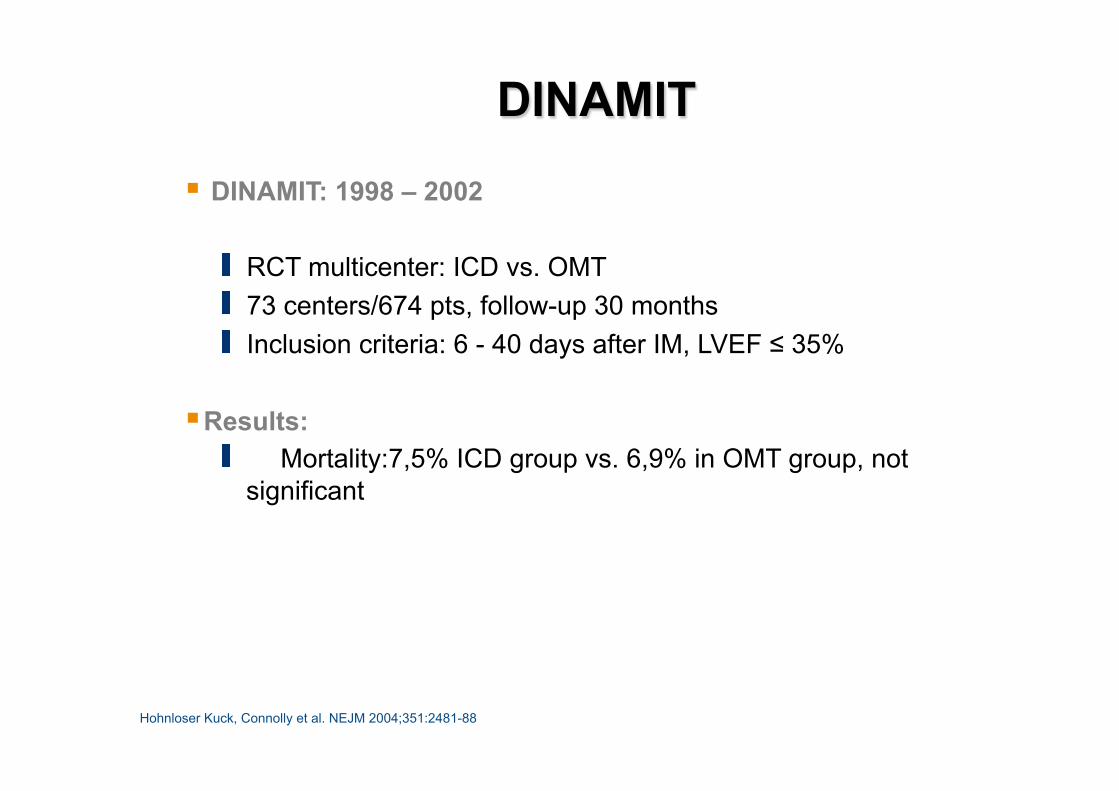
§ DINAMIT: 1998 – 2002
" RCT multicenter: ICD vs. OMT " 73 centers/674 pts, follow-up 30 months " Inclusion criteria: 6 - 40 days after IM, LVEF ≤ 35%
§ Results: " Mortality:7,5% ICD group vs. 6,9% in OMT group, not
significant
DINAMIT
Hohnloser Kuck, Connolly et al. NEJM 2004;351:2481-88

MADIT II
§ MADIT II: 1997 – 2001
" RCT multicenter ICD vs. OMT " 76 centers/1.232 pts, follow-up 20 months " Inclusion criteria: previous MI, EF ≤ 30%
§ Results: § 14,2% ICD vs. 19,8 OMT. § Absolute risk reduction 5,6%. p=0,007
Moss JA et al. NEJM 2002;346:887-83

MADIT II Study design
§ Randomization: ICD vs. without ICD (ratio 3:2) § Sequential design
• OPT • ICD
• OPT
+
(n = 490)
(n = 742)
Randomization

NEJM 2002;346: fig. 2, pag. 880
Tempo (anni)
Prob
abili
tà d
i sop
ravv
iven
za
Curve di Kaplan-Meier che indicano la probabilità di sopravvivenza nel gruppo trattato con ICD + OPT e in quello trattato con OPT soltanto.
MADIT II Survival

Mortality reduction in MADIT II is the consequence of SCD reduction
MADIT II: SCD
SCD OPT: 10,0% ICD: 3,8%
Anni
Prob
abili
tà c
umul
ativ
a di
mor
te c
ardi
aca
impr
ovvi
sa
N. a rischio
ICD
OPT
CONV
MMAADDIITT IIIISSCCDD MMoorrttaalliittyy

§ Prematurely suspended " median Follow-up 20 months
§ Mortality reduction 31% § Hazard ratio = 0,69, p = 0,016 " Absolute reduction = 5,6 %
§ Determined FDA indication
MADIT II Results

Hazard ratio
(EF ≤ 0,35, NSVT, EP+)
(Aborted SCD)
(EF ≤ 0,40, NSVT, EP+)
(Previous MI & EF ≤ 0,30)
ICD better
MMAADDIITT IIIINNeell ccoonntteessttoo ccoonn ggllii ssttuuddii ssuullll’’IICCDD

The sudden Cardiac death in Heart Failure Trial (SCD-HeFT 1997-2001) A trial designed to evaluate the effect of amiodarone or implantable Cardioverter-Defibrillator for congestive Heart Failure The New England Journal of Medecine (January 20, 2005)
Bardy GH et al. NEJM 2002;346:877-83
SCD-HeFT

§ 2.500 pts § Ischemic or non ischemic cardiomyopathy § Primary Endpoint : total Mortality in 2,5 years of FU § Secondary Endpoint :
§ Arrhythmic Mortality vs. non arrythmic § All cause mortality and HF hospitalization § Quality of life….
SCD-HeFT Disegno dello studio

§ HF NYHA II/III § EF ≤ 35% § CHF ≥ 3 mesi § Age ≥ 18 year § No cardiac arrest or sustained VT documented
SSCCDD--HHeeFFTTEElleeggiibbiilliittyy

Am J Cardiol 1999;83: fig. 1, pag. 94D
1
2 • OMT • ICD +
• OMT • Placebo
• OMT • Amiodarone +
2
§ Multicenter (148) § Randomization 2.521 pts in 3 groups
+ Placebo
Randomization
SCD-HeFT Study design SCD-HeFT
ICD

Bardy GH, Lee KL, Mark DB, et al. Amiodarone or an implantable cardioverter-defibrillator for congestive heart failure. N Engl. J Med. 2005; 352:225-237. © 2005 Massachusetts Medical Society. All rights reserved.
§ 23% total mortality reduction in ICD (p=0,007)
Mortalità secondo l’analisi intention-to-treat Hazard ratio (IC 97,5%)
1,06 (0,86-1,30) 0,77 (0,62-0,96)
P 0,53 0,007
182 decessi; percentuale a 5 anni
0,289)
Amiodarone (240 decessi; % a
5 anni, 0,340)
FU months
Terapia con ICD
SSCCDD--HHeeFFTTEEnnddppooiinntt pprriimmaarriioo:: MMoorrttaalliittàà ppeerr qquuaalluunnqquuee ccaauussaa

05
101520253035404550
SCD-HeFT 5-Year Mortality Rate Ischemic vs. Non-Ischemic
41.7% 43.2%
21.4% 25.8% 27.9%
35.9%
Ischemic Non- Ischemic
Ischemic Non- Ischemic
Ischemic Non- Ischemic
Amiodarone Placebo ICD
Mor
talit
y R
ate
Bardy GH. N Engl J Med. 2005;352:225-237.

No. at Risk Amiodarone 601 563 536 378 222 76 Placebo 594 563 522 367 218 72 ICD 566 550 531 371 236 80
SCD-HeFT Mortality Rate NYHA Class II Patients
Months of Follow-Up
Mor
talit
y R
ate
48 36 24 12 0
Amiodarone Placebo ICD 0.4
0.3
0.2
0.1
0.0 60
Hazard Ratio (97.5% Cl) P-Value Amiodarone vs. Placebo 0.85 (0.65 - 1.11) 0.17 ICD vs. Placebo 0.54 (0.40 - 0.74) < 0.001
Bardy GH. N Engl J Med. 2005;352:225-237.
0.5
0.6

No. at Risk Amiodarone 244 209 179 106 58 21 Placebo 253 234 202 138 86 17 ICD 263 228 202 130 68 23
SCD-HeFT Mortality Rate NYHA Class III Patients
Months of Follow-Up
Mor
talit
y R
ate
48 36 24 12 0
Amiodarone Placebo ICD
60
Hazard Ratio (97.5% Cl) P-Value Amiodarone vs. Placebo 1.44 (1.05 - 1.97) 0.010 ICD vs. Placebo 1.16 (0.84 - 1.61) 0.30
Bardy GH. N Engl J Med. 2005;352:225-237.
0.4
0.3
0.2
0.1
0.0
0.5
0.6

0
10
20
30
40
50
60
SCD-HeFT 5-Year Mortality Rate NYHA Class II vs. III
26.4% 32%
48.4% 52.8%
45.6%
20%
NYHA II NYHA III NYHA II NYHA III NYHA II NYHA III
Amiodarone Placebo ICD
Mor
talit
y R
ate
Bardy GH. N Engl J Med. 2005;352:225-237.

SCD-HeFT Mode of Death Cause of Death Amiodarone
N = 845 Placebo N = 847
ICD N = 829
Cardiac 19% 20% 15%
Tachyarrhythmia 9% 11% 4%
Bradyarrhythmia < 1% < 1% < 1%
Heart Failure 8% 8% 9%
Nonarrhythmic 1% < 1% 1%
Packer DL. Heart Rhythm 2005. May;2 (1suppl):AB20-2.

SCD-HeFT Tachyarrhythmia Deaths
Cause of Death Amiodarone N = 845
Placebo N = 847
ICD N = 829
Tachyarrhythmia 9% 11% 4%
ICD therapy reduced tachyarrhythmia deaths by 60%
Packer DL. Heart Rhythm 2005. May;2 (1suppl):AB20-2.

SCD-HeFT Conclusions • ICD therapy provided the largest mortality
reduction in NYHA Class II patients • Surviving patients had improvements in
their heart failure condition over time. Good drug management likely contributed to this improvement.
• Compared to other CV therapies, ICDs are a cost-effective therapy

Mortality reduction: Summary
PPrriimmaarryy pprreevveennttiioonn ttrriiaall

Primary prevention trials Conclusions
§ Primary prevention trials identified pts at risk § 2 landmark studies MADIT II and SCD-HeFT
contributed to define pts at risk:
§ post MI pts § HF pts With reduced LVEF

§ Summarizing, prophylactic ICD reduces SCD in high risk pts in OMT:
§ Previous aborted SCD (VT o VF) § Previous MI with LVEF ≤ 30% § HF pts (NYHAII/III) with LVEF ≤ 35%
Trials Conclusions