Control of Hep G2-cell triacylglycerol and apolipoprotein B synthesis ...

1
Triacylglycerol Profile as a Chemical Fingerprint of Mushroom Species:
Evaluation by Principal Component and Linear Discriminant Analyses
João C.M. Barreiraa,b, Isabel C.F.R. Ferreirab,*, M. Beatriz P.P. Oliveiraa
aREQUIMTE, Departamento de Ciências Químicas, Faculdade de Farmácia da Universidade
do Porto, Rua Jorge Viterbo Ferreira, 228, 4050-313 Porto, Portugal.
bCIMO/Escola Superior Agrária, Instituto Politécnico de Bragança, Apartado 1172, 5301-
855 Bragança, Portugal.
*Corresponding author
Telephone: +351 273303277
Fax: +351 273325405
E-mail: [email protected]

2
Abstract
Mushrooms are becoming relevant foods due to their nutritional, gastronomic and
pharmacological properties, namely antioxidant, antitumor and antimicrobial properties.
However, despite several mushroom species have been chemically characterized, the
evaluation of triacylglycerol (TAG) profile remained nearly discarded. Since TAG was
formerly used to assess the authentication of highly valued commercial oils, and the
distribution of fatty acids on the glycerol molecule is genetically controlled, the potential of
TAG profile to act as taxonomical marker was evaluated in 30 wild mushroom species.
Principal component analysis and linear discriminant analysis were used to verify the
taxonomical rank (order, family, genus or species) more related with the detected TAG
profile. The results pointed out that the ability of TAG profile to discriminate mushroom
samples increased for the lower taxonomical ranks, reaching a maximal performance for
species discrimination. Since there is high resemblance among mushroom species belonging
to the same genus and considering that conservation techniques applied to mushrooms often
change their physical properties, this might be considered as a valuable outcome with
important practical applications.
Keywords: Wild mushrooms; triacylglycerols; PCA; LDA.
3
INTRODUCTION
The Northeast of Portugal, with its climatic conditions and flora diversity, is one of the
European regions with higher wild edible mushrooms diversity, some of them with great
gastronomic relevance. Studies conducted on mushrooms proved their antioxidant (1),
antitumor (2) and antimicrobial properties, as well as their interesting contents in
nutraceuticals (3). Furthermore, mushrooms are becoming important in our diet for their
nutritional and organoleptic characteristics (4). Our research group has been interested in the
bioactive properties and chemical profile of wild and commercial mushrooms; regarding
chemical characterization, special attention has been dedicated to the determination of
proteins, fat, ash, carbohydrates, individual sugars, fatty acids, phenolic compounds,
carotenoids, ascorbic acid and tocopherols (5-11). Other authors also analyzed ergosterol,
vitamin D2, nucleosides and nucleobases in mushrooms (12-15).
The determination of selected lipid species is of considerable interest because it allows
conclusions on metabolic processes (16). Furthermore, the lipidic fraction of a natural product
has a characteristic pattern of triacylglycerols (TAG), comprising highly specific information
due to the genetic control of the stereospecific distribution of fatty acids (FA) on the glycerol
molecule, which is typical for each species (17). Analysis of TAG in oils and fats has gained
increasing attention in the last decades. In food research, it is used to study crystallization
phenomena, to detect adulteration of specialty fats and oils, and for recognition of oils origin
(18). Nevertheless, the studies dealing with TAG in mushrooms are rather scarce and based
on highly specific features, for instance the neurolysin inhibitory ability of agaricoglycerides
(a class of aromatic triacylglycerols) produced by some Basidiomycetes (19). The evaporative
light-scattering detector (ELSD) is a mass-sensitive detector that responds to any analyte less
volatile than the mobile phase, which is a suitable solution for TAG analysis. It has a low
background signal, a non-specific response (unlike a flame ionization detector), is compatible

4
with gradient elution (unlike a refraction index (RI) detector) and with a broad range of
solvents, besides having a signal independent of the degree of saturation and chain length
(unlike an ultraviolet detector). From a theoretical point of view, the response of the ELSD is
sigmoidal upon increasing analyte concentrations (18). Partition number, equivalent carbon
number, theoretical carbon number, and matrix models are proposed methods to identify TAG
peaks from HPLC-ELSD analysis. These methods are relatively well fit when reversed-phase
(RP)-HPLC is used as analytical tool (20).
Due to the high commercial value of mushrooms, finding an analytical parameter that might
act as a chemical fingerprint is a mandatory subject. Herein, thirty different species of
mushrooms are characterized regarding their TAG profile, in order to define this parameter as
a taxonomical marker. The results were scrutinized trough an analysis of variance, a principal
component analysis as pattern recognition unsupervised classification method, and a stepwise
based linear discrimination analysis as a supervised classification technique.
MATERIALS AND METHODS
Standards and reagents
Triacylglycerols 1,2,3-tripalmitoylglycerol (PPP), 1,2,3-tristearoylglycerol (SSS), 1,2,3-
trilinolenoylglycerol (LnLnLn), and 1,2,3-tripalmitoleoylglycerol (PoPoPo), of purity >98%,
and 1,2,3-trioleoyglycerol (OOO), 1,2,3-trilinoleoyglycerol (LLL), 1,2-dilinoleoyl-3-
palmitoyl-rac-glycerol (PLL), 1,2-dilinoleoyl-3-oleoyl-rac-glycerol (OLL), 1,2 -dipalmitoyl-
3-oleoyl-rac-glycerol (PPO), 1,2-dioleoyl-3-stearoyl-rac-glycerol (OOS), 1-palmitoyl-2-
oleoyl-3-linoleoylglycerol (POL), and 1,2-dioleoyl-3-palmitoyl-rac-glycerol (POO), of ≈99%
purity, were purchased from Sigma (St. Louis, MO, USA). Petroleum ether was of analytical
grade and obtained from Fisher Scientific (Leicestershire, UK). Acetonitrile and acetone were

5
of HPLC grade and obtained from Merck (Darmstadt, Germany). The code letters used for the
fatty acids are: Po, palmitoleic; L, linoleic; Ln, linolenic; M, myristic; O, oleic; P, palmitic; S,
stearic.
Samples
Samples of thirty different wild edible mushrooms (Table 1; their composition in fatty acids
was previously reported in the cited references) were collected in Bragança (Northeast
Portugal) between 2005 and 2010. Taxonomical identification of sporocarps was made and
representative voucher specimens were deposited at the herbarium of Escola Superior Agrária
of Instituto Politécnico de Bragança. All the samples were lyophilised (Ly-8-FM-ULE,
Snijders, Holland), reduced to a fine dried powder (20 mesh) and mixed to obtain a
homogenate sample.
Triacylglycerols analysis
The sample (~3 g) was submitted to an extraction with petroleum ether (40-60 ºC) performed
in Soxhlet apparatus for 1.5 h. The chromatographic analyses were carried out according to
the procedure previously described (21), with a Jasco (Tokyo, Japan) HPLC system, equipped
with a PU-1580 quaternary pump and a Jasco AS-950 automatic sampler with a 10 µL loop.
The chromatographic separation of the compounds was achieved with a Kromasil 100 C18 (5
µm; 250 × 4.6 mm) column (Teknokroma, Barcelona, Spain) operating at room temperature
(≈20 °C). The mobile phase was a mixture of acetone and acetonitrile (70:30), in an isocratic
mode, at an elution rate of 1 mL/min. Detection was performed with an evaporative light-
scattering detector (ELSD) (model 75-Sedere, Alfortville, France) with the following settings:
evaporator temperature 40 ºC, air pressure 3.5 bar and photomultiplier sensitivity 6. Taking
into account the selectivities (R, relative retention times to LLL), peaks were identified

6
according to the logarithms of R in relation to homogeneous TAG standards. Quantification
of the peaks was made by internal normalization of chromatographic peak area, and the
results were expressed in relative percentage, assuming that the detector response was the
same for all the compounds. Data were analyzed using the Borwin-PDA Controller Software
(JMBS, France).
Statistical analysis
Two samples of each mushroom species were used. For each mushroom sample, two
extractions were performed, and each extract was injected twice in the HPLC system. Data
were expressed as means±standard deviations. All the statistical tests were performed at a 5%
significance level using the SPSS software, version 18.0 (SPSS Inc).
Analysis of variance
The fulfillment of the one-way ANOVA requirements, specifically the normal distribution of
the residuals and the homogeneity of variance, was tested by means of the Kolmogorov-
Smirnov with Lilliefors correction and the Levene’s tests, respectively. In the cases where
statistical significance differences were identified, the dependent variables were compared
using Tukey’s honestly significant difference (HSD) or Tamhane’s T2 multiple comparison
tests, when homoscedasticity was verified or not, respectively.
Principal component analysis (PCA)
PCA was applied as pattern recognition unsupervised classification method. PCA transforms
the original, measured variables into new uncorrelated variables called principal components.
The first principal component covers as much of the variation in the data as possible. The
second principal component is orthogonal to the first and covers as much of the remaining

7
variation as possible, and so on (18). The number of dimensions to keep for data analysis was
evaluated by the respective eigenvalues (which should be greater than one), by the
Cronbach’s alpha parameter (that must be positive) and also by the total percentage of
variance (that should be as higher as possible) explained by the number of components
selected.
Stepwise linear discriminant analysis (LDA)
LDA was used to classify the mushroom species according to their TAG profiles. A stepwise
technique, using the Wilks’ λ method with the usual probabilities of F (3.84 to enter and 2.71
to remove), was applied for variable selection. This procedure uses a combination of forward
selection and backward elimination procedures, where before selecting a new variable to be
included, it is verified whether all variables previously selected remain significant (19, 20).
Discriminant analysis defines a combination of varieties in a way that the first function
furnishes the most general discrimination between groups, the second provides the second
most, and so on (25). To verify which canonical discriminant functions were significant, the
Wilks’ λ test was applied. To avoid overoptimistic data modulation, a leaving-one-out cross-
validation procedure was carried out to assess the model performance. Moreover, the
sensibility and specificity of the discriminant model were computed from the number of
individuals correctly predicted as belonging to an assigned group (24). Sensibility was
calculated by dividing the number of samples of a specific group correctly classified by the
total number of samples belonging to that specific group. Specificity was calculated by
dividing the number of samples of a specific group classified as belonging to that group by
the total number of samples of any group classified as belonging to that specific group.

8
RESULTS AND DISCUSSION
In the absence of similar publications reporting TAG profile of wild edible mushrooms, Table
1 presents the FA with higher representativeness among the TAG of the studied species.
Table 2 shows the mean values obtained for TAG profiles of each mushroom species.
Besides the evaluated compounds, OLLn was also found in Laccaria amethystina. The values
are presented in relative percentage, because in the particular case of TAG, the existence of
high purity standards with a mixed FA composition is limited. However, even if reference
material was commercially available, the diversity of TAG molecules in each oil would make
virtually impossible to construct a calibration curve for each TAG. Accordingly, the relative
peak areas might be readily converted into relative TAG concentration, assuming linearity and
uniformity of the detector signal, regardless of the TAG molecules and absolute concentration
(18). Denoting S = saturated, M = monoenoic, D = dienoic and T = trienoic acids, the
following order of chromatographic separation is generally obtained: SSS>SSM>SMM>
SSD>MMM>SMD>MMD>SDD>SST>MDD>SMT>MMT>DDD>SDT>MDT>DDT>STT>
MTT>DTT>TTT (26). TAG found in this work (presented in Table 2 according with their
elution time) followed the expected order: PPO (SSM)>POO (SMM)>OOO (MMM)>POL
(SMD)>OOL (MMD)>PLL (SDD)>OLL (MDD)>LLL (DDD)>LLLn (DDT)>LLnLn (DTT).
Furthermore, and despite this conclusion cannot be drawn so directly, the obtained profiles are
generally in agreement with the FA percentages (Table 1) quantified by several researchers in
these mushroom species.
Analysis of variance (ANOVA). Regarding the main purpose of this work, i.e. assessing
TAG profile as mushroom taxonomical markers, the Levene test showed that the assumption
of equality among variances could only be assumed for OLL and OOL. Even so, to facilitate
the analysis, and since the statistical differences (p < 0.05) were always significant (as
detected by the one-way ANOVA test), the differences among mushroom species were

9
classificated by means of the Tamhanes’ T2 test. The multiple comparisons allowed the
conclusion that TAG profiles of the evaluated species were quite dissimilar. For instance, the
maximal values for each TAG were exclusive for a single mushroom, except in the case of
PPO (LLnLn, Fistulina hepatica: 22±1; LLLn, Lycoperdon umbrinum: 27±1; LLL,
Leucoagaricus leucothites: 57±1; OLL, Leucopaxillus giganteus: 36±1; PLL, Chlorophyllum
rhacodes: 35±1; OOL, Sarcodon imbricatus: 42±1; POL, Clavariadelphus pistillaris:
28.9±0.4; OOO, Lycoperdon molle: 60±1; POO, Amanita caesarea: 33±1; PPO, Macrolepiota
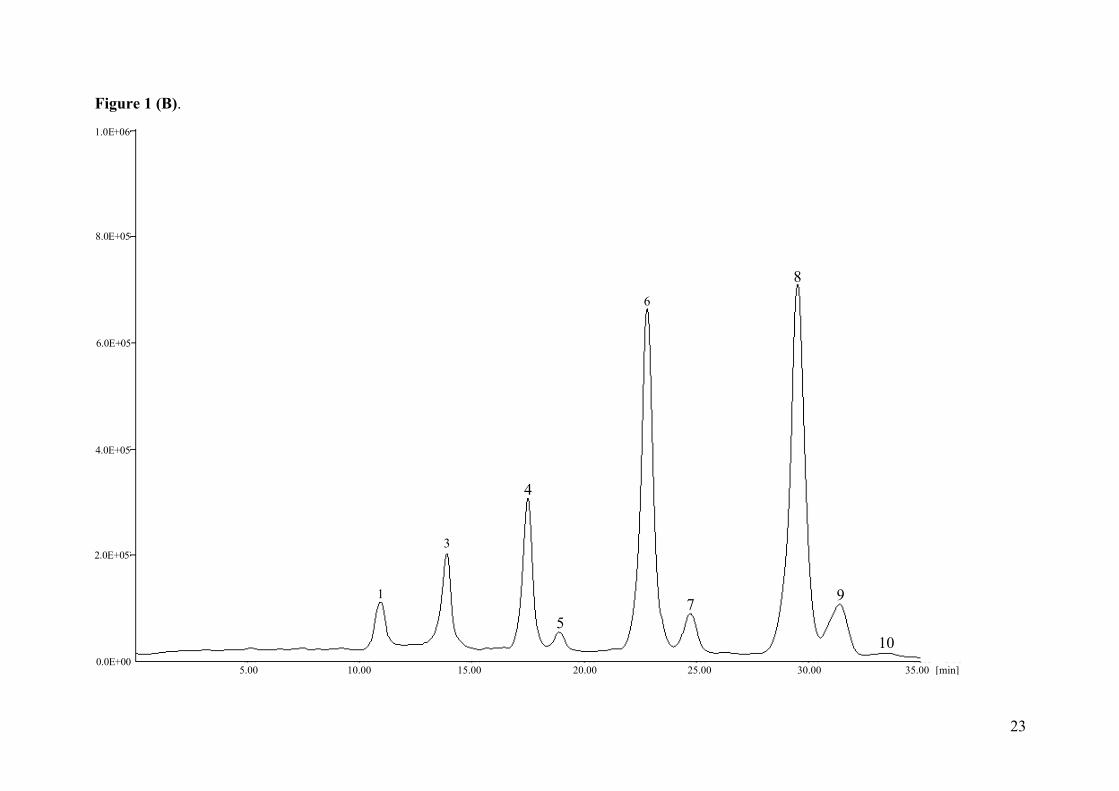
procera: 19±1 and Boletus edulis: 18±1). As an example, the HPLC-ELSD TAG profiles of
Lycoperdon molle (A) and Ramaria aurea (B) can be observed in Figure 1. The significant
differences found among the mean values for each TAG are signalized by different letters in
each column, and as it can be seen, most of the values could be differentiated from each other.
These differences were a good preliminary indicator of the ability of TAG profile to act as
taxonomical marker. This assumption was checked through a Principal Component Analysis
(PCA), as an unsupervised classification technique, and a Linear Discriminant Analysis
(LDA), as a supervised classification technique.
Principal Component Analysis (PCA). PCA was applied using different labeling variables:
order, family or genus. In each case, the first two dimensions were considered. The reliability
of these dimensions was assured by the value of the Cronbach’s alpha parameter (first
dimension: 0.769; second dimension: 0.558) and the related eigenvalue (first dimension:
3.251; second dimension: 2.008). The selected dimensions account for most of the variance of
all quantified variables (32.5% and 20.1%, respectively). Third and fourth dimensions were
also reliable (Cronbach’s alpha- third dimension: 0.286; fourth dimension: 0.090; eigenvalue-
third dimension: 1.347; fourth dimension: 1.088) and would include 77% of the variance
instead of 53%, but the correspondent output would not allow a meaningful interpretation.
The effects of the variables more correlated with each considered dimension (LLL, PLL,

10
OOO, OOL and POO, for the first; OLL, POL, LLLn and OOO for the second) allowed
higher separation when genus was used as a labeling variable. Regarding the relation between
the objects and variables (Figure 2), it is clear that Lycoperdon, Clavariadelphus and
Chlorophylum are characterized for having high LLLn, POL and PLL percentages,
respectively (dashed ellipses), but the remaining genera are somehow difficult to characterize.
Although the lower dimensional solutions often conceal differences among variables, PCA
results were satisfactory, and there was no need to increase the number of dimensions. In fact,
the results plotted in Figure 2 show that, in general, the TAG profiles recorded for different
mushroom genera evaluated in this study contain valuable information that may be used as an
effective tool for their diferentiation. Actually, the spatial distribution of the object points was
improved with the lowering of taxonomical rank, indicating that TAG profile is most related
with the lowest ranks. This is in accordance with the the genetic control of the stereospecific
distribution of fatty acids (FA) on the glycerol molecule, which is typical for each species
(17).
Linear Discriminant Analysis (LDA). To confirm this hypothesis a LDA was also
performed, attempting to separate the assayed mushroom species based on their taxonomical
ranks. The significant independent variables (TAG) were selected using the stepwise
procedure of the LDA, according to the Wilks’ λ test. Only those that showed a statistical
significant classification performance (p < 0.05) were kept for analysis. The analysis was
applied considering order, family, genus or species as grouping variables. As it would be
expected after the performed PCA, the classification performance decreased from lower to
higher taxonomical ranks (Table 3). In fact, when mushrooms were grouped by species,
100.0% of the samples were correctly classified for the originally grouped cases, as well as
for the cross-validated grouped cases, but due to practical reasons, the presented output
(Figure 3) is the one obtained using genus as grouping variable. The three plotted functions

11
integrated 89.2% of the observed variance (first: 59.1%; second: 15.8%; third: 14.3%). As it
can be observed, besides the clusters are well individualized, the model joined (dot and
dashed ellipses) genera belonging to the same family (Armillaria, Calocybe, Lepista,
Leucopaxillus and Tricholoma belonging to Tricholomataceae; Agaricus, Chlorophylum and
Leucoagaricus belonging to Agaricaceae; Bovista and Lycoperdon belonging to
Lycoperdaceae).
In summary, the set of analyzed mushrooms presented very particular intrinsic differences in
their TAG profile. Hence, chemical assessment linked to stereospecific analysis of TAG can
be very useful in checking mushroom species. In fact, the usefulness of stereospecific analysis
of TAG as a potential species discriminator was already indicated in vegetable oils (32).
Herein, the results obtained for TAG analysis showed the ability to assemble the tested
mushroom species within single groups, indicating a high degree of specificity possibly
derived from the genetic control of the stereospecific distribution of FA on the glycerol
molecule (17). Therefore, TAG profile seems to be related with the most specific taxonomical
rank, proving that it might be used as a practical tool to identify a particular mushroom
species. Since the conservation techniques applied to mushrooms often change their physical
properties, TAG profile might be a feature for the species identification.
ACKNOWLEDGEMENT
The authors are grateful to the Foundation for Science and Technology (FCT, Portugal) and
COMPETE/QREN/EU for financial support to this work (research project PTDC/AGR-
ALI/110062/2009), to CIMO (strategic project PEst-OE/AGR/UI0690/2011) and to
REQUIMTE (PEst-C/EQB/LA0006/2011). J.C.M. Barreira thanks to FCT, POPH-QREN and
FSE for his grant (SFRH/BPD/72802/2010).

12
LITERATURE CITED
(1) Ferreira, I. C. F. R.; Barros, L.; Abreu, R. M. V. Antioxidants in wild mushrooms. Curr.
Med. Chem. 2009, 16, 1543-1560.
(2) Ferreira, I. C. F. R.; Vaz, J. A.; Vasconcelos, M. H.; Martins, A. Compounds from wild
mushrooms with antitumor potential. Anti-cancer Agent Me. 2010, 10, 424-436.
(3) Barros, L.; Cruz, T.; Baptista, P.; Estevinho, L.; Ferreira, I. C. F. R. Wild and
commercial mushrooms as source of nutrients and nutraceuticals. Food Chem. Toxicol.
2008a, 46, 2742-2747.
(4) Barros, L.; Baptista, P.; Correia, D. M.; Casal, S.; Oliveira, M. B. P. P.; Ferreira, I. C. F.
R. Fatty acid and sugar compositions, and nutritional value of five wild edible
mushrooms from Northeast Portugal. Food Chem. 2007, 105, 140-145.
(5) Barros, L.; Venturini, B. A.; Baptista, P.; Estevinho, L. M.; Ferreira, I. C. F. R.
Chemical composition and biological properties of Portuguese wild mushrooms: A
comprehensive study. J. Agr. Food Chem. 2008b, 56, 3856-3862.
(6) Grangeia, C.; Heleno, S. A.; Barros, L.; Martins, A.; Ferreira, I. C. F. R. Effects of
trophism on nutritional and nutraceutical potential of wild edible mushrooms. Food Res.
Int. 2011, 44, 1029-1035.
(7) Heleno, S. A.; Barros, L.; Sousa, M. J.; Martins, A.; Ferreira, I. C. F. R. Study and
characterization of selected nutrients in wild mushrooms from Portugal by gas
chromatography and high performance liquid chromatography. Microchem. J. 2009, 93,
195-199.
13
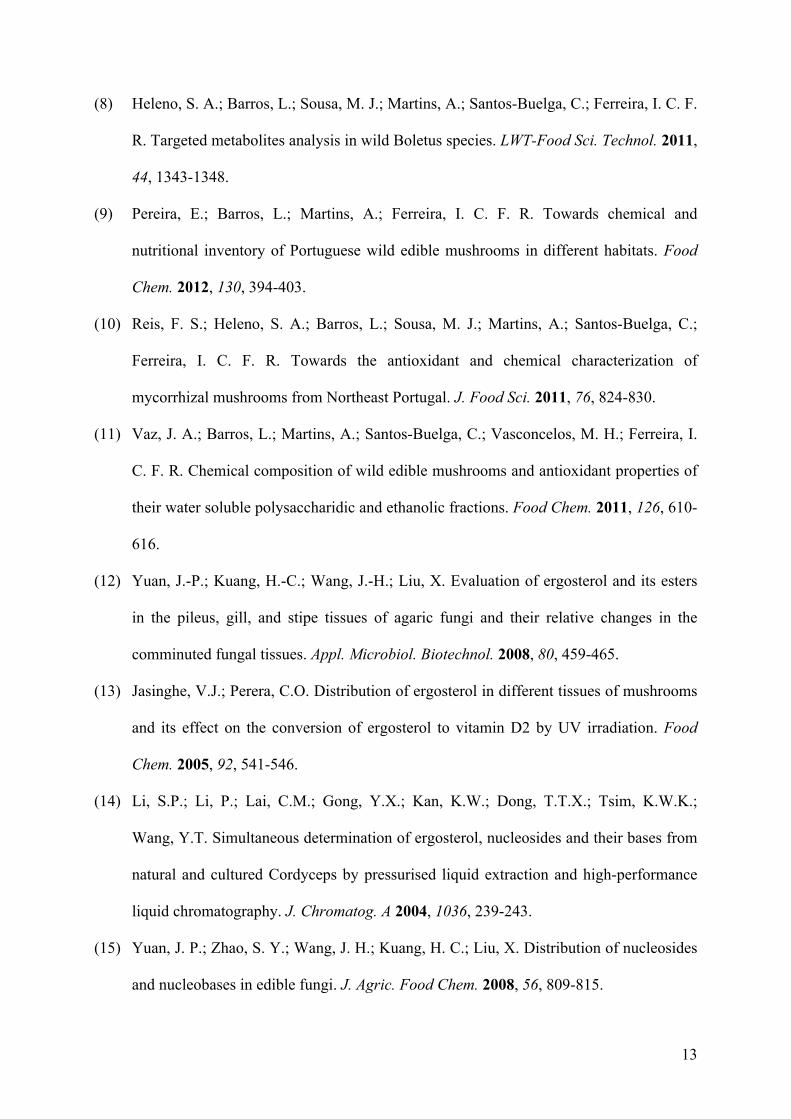
(8) Heleno, S. A.; Barros, L.; Sousa, M. J.; Martins, A.; Santos-Buelga, C.; Ferreira, I. C. F.
R. Targeted metabolites analysis in wild Boletus species. LWT-Food Sci. Technol. 2011,
44, 1343-1348.
(9) Pereira, E.; Barros, L.; Martins, A.; Ferreira, I. C. F. R. Towards chemical and
nutritional inventory of Portuguese wild edible mushrooms in different habitats. Food
Chem. 2012, 130, 394-403.
(10) Reis, F. S.; Heleno, S. A.; Barros, L.; Sousa, M. J.; Martins, A.; Santos-Buelga, C.;
Ferreira, I. C. F. R. Towards the antioxidant and chemical characterization of
mycorrhizal mushrooms from Northeast Portugal. J. Food Sci. 2011, 76, 824-830.
(11) Vaz, J. A.; Barros, L.; Martins, A.; Santos-Buelga, C.; Vasconcelos, M. H.; Ferreira, I.
C. F. R. Chemical composition of wild edible mushrooms and antioxidant properties of
their water soluble polysaccharidic and ethanolic fractions. Food Chem. 2011, 126, 610-
616.
(12) Yuan, J.-P.; Kuang, H.-C.; Wang, J.-H.; Liu, X. Evaluation of ergosterol and its esters
in the pileus, gill, and stipe tissues of agaric fungi and their relative changes in the
comminuted fungal tissues. Appl. Microbiol. Biotechnol. 2008, 80, 459-465.
(13) Jasinghe, V.J.; Perera, C.O. Distribution of ergosterol in different tissues of mushrooms
and its effect on the conversion of ergosterol to vitamin D2 by UV irradiation. Food
Chem. 2005, 92, 541-546.
(14) Li, S.P.; Li, P.; Lai, C.M.; Gong, Y.X.; Kan, K.W.; Dong, T.T.X.; Tsim, K.W.K.;
Wang, Y.T. Simultaneous determination of ergosterol, nucleosides and their bases from
natural and cultured Cordyceps by pressurised liquid extraction and high-performance
liquid chromatography. J. Chromatog. A 2004, 1036, 239-243.
(15) Yuan, J. P.; Zhao, S. Y.; Wang, J. H.; Kuang, H. C.; Liu, X. Distribution of nucleosides
and nucleobases in edible fungi. J. Agric. Food Chem. 2008, 56, 809-815.

14
(16) Fuchs, B.; Schiller, J. Lysophospholipids: their generation, physiological role and
detection. Are they important disease markers? Mini-Rev. Med. Chem. 2009, 9, 368-
378.
(17) Buchgraber, M.; Ulberth, F.; Emons, H.; Anklam, E. Triacylglycerol profiling by using
chromatographic techniques. Eur. J. Lipid Sci. Tech. 2004, 106, 621-648.
(18) Rombaut, R.; De Clercq, N.; Foubert, I.; Dewettinck, K. Triacylglycerol Analysis of
Fats and Oils by Evaporative Light Scattering Detection. J. Am. Oil Chem. Soc. 2009,
86, 19-25.
(19) Stadler, M.; Hellwig, V.; Mayer-Bartschmid, A.; Denzer, D.; Wiese, B.; Burkhardt, N.
Novel analgesic triglycerides from cultures of Agaricus macrosporus and other
Basidiomycetes as selective inhibitors of neurolysin. J. Antibiot. 2005, 58 (12), 775-
786.
(20) Cunha, S. C.; Oliveira, M. B. P. P. Discrimination of vegetable oils by triacylglycerols
evaluation of profile using HPLC/ELSD. Food Chem. 2006, 95, 518-524.
(21) Barreira, J. C. M.; Casal, S.; Ferreira, I. C. F. R.; Oliveira, M. B. P. P.; Pereira, J. A.
Nutritional, fatty acid and triacylglycerol profiles of Castanea sativa Mill. cultivars: a
compositional and chemometric approach. J. Agr. Food Chem. 2009, 57, 2836-2842.
(22) Patras, A.; Brunton, N. P.; Downey, G.; Rawson, A.; Warriner, K.; Gernigon, G.
Application of principal component and hierarchical cluster analysis to classify fruits
and vegetables commonly consumed in Ireland based on in vitro antioxidant activity. J.
Food Compos. Anal. 2011, 24, 250-256.
(23) Hill, T.; Lewicki, P. Statistics: methods and applications. A comprehensive reference
for science, industry, and data mining, StatSoft, 2006.
(24) López, A.; García, P.; Garrido, A. Multivariate characterization of table olives
according to their mineral nutrient composition. Food Chem. 2008, 106, 369-378.

15
(25) Benitez, E.; Nogales, R.; Campos, M.; Ruano, F. Biochemical variability of olive-
orchard soils under different management systems. Appl. Soil Ecol. 2006, 32, 221-231.
(26) Fuchs, B.; Rosmarie, Süβ R.; Teuber, K., Eibisch, M.; Schiller J. Lipid analysis by thin-
layer chromatography - a review of the current state. J. Chromatogr. A 2011, 1218,
2754-2774.
(27) Pedneault, K.; Angers, P.; Gosselin, A.; Weddell, R. J. Fatty acid composition of lipids
from mushrooms belonging to the family Boletaceae. Mycol. Res. 2006, 110, 1179-
1183.
(28) Kavishree, S.; Hemavathy, J.; Lokesh, B. R.; Shashirekha, M. N.; Rajarathnam, S. Fat
and fatty acids of Indian edible mushrooms. Food Chem. 2008, 106, 597-602.
(29) Liu, Y.-T.; Sun, J.; Luo, Z.-Y.; Rao, S.-Q.; Su, Y.-J.; Xu, R.-R.; Yang, Y.-J. Chemical
composition of five wild edible mushrooms collected from Southwest China and their
antihyperglycemic and antioxidant activity. Food Chem. Toxicol. 2012, in press.
(30) Senatore, F.; Dini, A.; Marino, A. Chemical constituents of some Basidiomycetes. J.
Sci. Food Agr. 1988, 45, 337-345.
(31) Díez, V.A.; Alvarez, A. Compositional and nutritional studies on two wild edible
mushrooms from northwest Spain. Food Chem. 2001, 75, 417-422.
(32) Butinar, B.; Bučar-Miklavčič, M.; Valenčič, V.; Raspor, P. Stereospecific analysis of
triacylglycerols as a useful means to evaluate genuineness of pumpkin seed oils: lesson
from virgin olive oil Analyses. J. Agric. Food Chem. 2010, 58, 5227-5234.

16
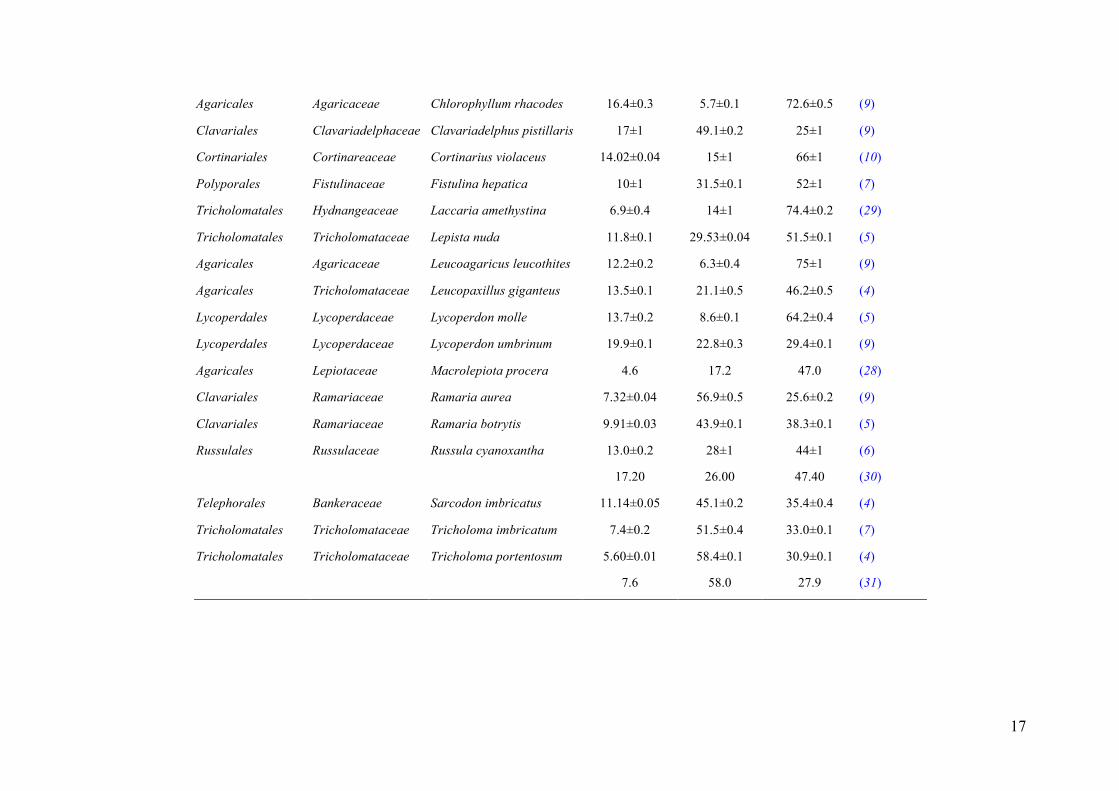
Table 1. Fatty acids composition (%) in some selected studies using the species herein studied. The results are presented, except when non-avaliable, as mean±SD.
Order Family Species Palmitic acid Oleic acid Linoleic acid References
Agaricales Agaricaceae Agaricus silvaticus 11.7±0.1 6.67±0.01 74.78±0.01 (3)
Agaricales Agaricaceae Agaricus silvicola 10.0±0.2 3.5±0.2 76.5±0.2 (3)
Agaricales Amanitaceae Amanita caesarea 12.4±0.4 54±1 26±2 (10)
Tricholomatales Tricholomataceae Armillaria mellea 11.0±0.1 47.7±0.4 27.7±0.3 (11)
Boletales Boletaceae Boletus edulis 10.0±0.3 40±2 44±2 (3)
9.6±0.2 42.1±0.2 41.3±0.1 (8)
9.8 36.1 42.2 (27)
21.6 31.1 33.8 (28)
Boletales Boletaceae Boletus erythropus 21±1 15±1 49±1 (6)
11.20 18.00 63.00 (27)
Boletales Boletaceae Boletus fragrans 14.9±0.1 20±1 57±1 (6)
Boletales Boletaceae Boletus impolitus 16.8±0.4 14±1 61±1 (9)
Boletales Boletaceae Boletus reticulatus 11.0±0.1 47.2±0.1 32.83±0.01 (8)
Lycoperdales Lycoperdaceae Bovista aestivalis 21±2 12.6±0.1 42±4 (9)
Lycoperdales Lycoperdaceae Bovista nigrescens 17.4±0.1 21.0±0.2 38.3±0.2 (9)
Tricholomatales Tricholomataceae Calocybe gambosa 15±1 18±1 58±1 (3)
13.6±0.5 33±1 43.9±0.3 (11)
Cantharellales Cantharellaceae Cantharellus cibarius 7.2±0.1 8.13±0.01 50.0±0.1 (5)
13.1±0.1 10.8±0.3 53.6±0.1 (3)
18.30 35.40 17.30 (28)
17
Agaricales Agaricaceae Chlorophyllum rhacodes 16.4±0.3 5.7±0.1 72.6±0.5 (9)
Clavariales Clavariadelphaceae Clavariadelphus pistillaris 17±1 49.1±0.2 25±1 (9)
Cortinariales Cortinareaceae Cortinarius violaceus 14.02±0.04 15±1 66±1 (10)
Polyporales Fistulinaceae Fistulina hepatica 10±1 31.5±0.1 52±1 (7)
Tricholomatales Hydnangeaceae Laccaria amethystina 6.9±0.4 14±1 74.4±0.2 (29)
Tricholomatales Tricholomataceae Lepista nuda 11.8±0.1 29.53±0.04 51.5±0.1 (5)
Agaricales Agaricaceae Leucoagaricus leucothites 12.2±0.2 6.3±0.4 75±1 (9)
Agaricales Tricholomataceae Leucopaxillus giganteus 13.5±0.1 21.1±0.5 46.2±0.5 (4)
Lycoperdales Lycoperdaceae Lycoperdon molle 13.7±0.2 8.6±0.1 64.2±0.4 (5)
Lycoperdales Lycoperdaceae Lycoperdon umbrinum 19.9±0.1 22.8±0.3 29.4±0.1 (9)
Agaricales Lepiotaceae Macrolepiota procera 4.6 17.2 47.0 (28)
Clavariales Ramariaceae Ramaria aurea 7.32±0.04 56.9±0.5 25.6±0.2 (9)
Clavariales Ramariaceae Ramaria botrytis 9.91±0.03 43.9±0.1 38.3±0.1 (5)
Russulales Russulaceae Russula cyanoxantha 13.0±0.2 28±1 44±1 (6)
17.20 26.00 47.40 (30)
Telephorales Bankeraceae Sarcodon imbricatus 11.14±0.05 45.1±0.2 35.4±0.4 (4)
Tricholomatales Tricholomataceae Tricholoma imbricatum 7.4±0.2 51.5±0.4 33.0±0.1 (7)
Tricholomatales Tricholomataceae Tricholoma portentosum 5.60±0.01 58.4±0.1 30.9±0.1 (4)
7.6 58.0 27.9 (31)

18
Table 2. Triacylglycerol composition (%).The results are presented as mean±SD.a LLnLn LLLn LLL OLL PLL OOL POL OOO POO PPO
Species
Agaricus silvaticus 9.4±0.3 e nd 29±1 f 12±1 ij 17±1 d 12±1 no 4.3±0.2 lmn 11.7±0.4 k nd 4.2±0.2 de
Agaricus silvicola 1.2±0.1 jkl 0.4±0.1 gh 47±1 b 8±1 no 26±1 b 9±1 p 0.5±0.1 qr 2.8±0.3 no 1.7±0.3 i 3.2±0.3 efg
Amanita caesarea nd nd 3.2±0.1 qr 5.0±0.2 q 1.6±0.1 mno 23±1 gh 5.5±0.5 kl 24±1 f 33±1 a 4.3±0.2 de
Armillaria mellea 0.18±0.02 no 0.19±0.02 ghi 3.5±0.2 q 12±1 hi 2.4±0.3 jklmn 25±1 g 9±1 ef 30±1 e 16±1 d 1.3±0.1 ijkl
Boletus edulis nd nd 9.2±0.3 lm 11.0±0.3 ijk 3.1±0.1 jkl 21±1 ijk 22±1 b 15.2±0.5 ij nd 18±1 a
Boletus erythropus nd nd 19.2±0.2 j 9.4±0.3 lm 7.3±0.3 h 32±2 d 9.5±0.2 ef 5.8±0.3 m 9±1 f 7±1 c
Boletus fragrans 1.2±0.3 jkl 2.0±0.2 e 34±1 d 11±1 jkl 8.8±0.4 g 16±1 m 8±1 fgh 4.9±0.3 m 6.8±0.5 g 8±1 c
Boletus impolitus 1.7±0.2 ij 0.41±0.04 gh 24±1 h 5.5±0.4 pq 5.9±0.5 i 15.8±0.5 m 7.0±0.3 ij 24.8±0.4 f 13.6±0.3 e 1.2±0.1 jkl
Boletus reticulatus 1.3±0.2 jkl 1.6±0.1 e 6.9±0.5 no 8.8±0.4 mn 0.13±0.01 p 39.4±0.5 b 2.5±0.3 op 36±1 c nd 4.0±0.3 de
Bovista aestivalis 10.8±0.4 d 4.4±0.2 b 13.6±0.3 k 18±1 def 2.3±0.2 jklmn 19.3±0.5 kl 4.2±0.3 mn 20±1 h nd 8±1 c
Bovista nigrescens 12.0±0.4 c 3.6±0.3 c 19±1 j 16.6±0.4 fg 2.0±0.3 klmn 18.2±0.5 l 5.2±0.2 kl 15.9±0.5 i nd 7.7±0.3 c
Calocybe gambosa nd nd 32±1 e 17±1 efg 6.0±0.4 i 19±1 l 4.8±0.3 klm 13.7±0.4 j 6.2±0.4 g 2.2±0.3 ghij
Cantharellus cibarius 0.8±0.1 klmn 0.28±0.05 ghi 8±1 mno 6.8±0.5 op 3.4±0.3 j 20±1 jkl 5.1±0.4 klm 40±1 b 13.4±0.5 e 2.6±0.4 fgh
Chlorophyllum rhacodes 1.39±0.02 jk 0.06±0.01 hi 31±1 ef 19±1 d 35±1 a 11±1 op 1.4±0.1 pq 0.25±0.02 q 0.23±0.03 jk 0.36±0.02 l
Clavariadelphus pistillaris 1.6±0.2 j nd 5.0±0.2 pq 18.3±0.4 de 7.8±0.3 gh 34±1 cd 28.9±0.4 a 2.0±0.2 op 1.6±0.3 ij 1.1±0.2 jkl
Cortinarius violaceus 0.6±0.2 mn 1.1±0.2 f 25.0±0.4 gh 22±1 c 21±1 c 10±1 op 11±1 d 5.1±0.4 m nd 4.7±0.2 d
Fistulina hepatica 22±1 a nd 43±1 c 13±1 hi 2.2±0.2 klmn 6.7±0.3 q 6.0±0.4 jk 4.2±0.2 mn nd 3.5±0.2 def
Laccaria amethystina 7.2±0.2 f nd 26±1 g 10.3±0.3 jklm 3.1±0.2 jk 15.8±0.4 m 8.4±0.5 fg 14.2±0.5 j 9.9±0.4 f 0.5±0.1 l
Lepista nuda 4.7±0.2 g 1.0±0.1 f 22.2±0.5 i 27±1 b 5.0±0.3 i 22±1 hi 10±1 de 5.1±0.2 m nd 2.5±0.2 fghi
Leucoagaricus leucothites nd nd 57±1 a 10±1 klm 14.6±0.5 e 11±1 op 3.5±0.3 no 1.7±0.2 opq nd 2.2±0.1 ghij

19
Leucopaxillus giganteus 0.4±0.1 no nd 30±1 ef 36±1 a 11±1 f 14±1 mn 7.1±0.1 hij 0.42±0.04 pq 0.21±0.03 jk nd
Lycoperdon molle 2.3±0.2 hi 0.39±0.02 ghi 30±1 f 3.1±0.3 r 1.6±0.2 mno 1.2±0.1 r nd 60±1 a 1.1±0.2 ijk 0.8±0.2 kl
Lycoperdon umbrinum 13.8±0.5 b 27±1 a 34±1 d 4.9±0.5 q 5.1±0.4 i 3.2±0.2 r 1.2±0.2 qr 9.3±0.3 l nd 1.9±0.3 hijk
Macrolepiota procera 0.9±0.1 klm nd 1.6±0.3 r 8.7±0.4 mn 2.6±0.2 jklm 22±1 hi 8±1 ghi 9±1 l 28±1 b 19±1 a
Ramaria aurea 1.7±0.1 j nd 6.0±0.2 op 11.1±0.4 ijkl 1.3±0.1 nop 29±1 e 3.9±0.1 mn 39.7±0.3 b 6.9±0.5 g 0.4±0.1 l
Ramaria botrytis 1.2±0.2 jkl 0.5±0.1 g 7.9±0.1 mn 13±1 h 1.8±0.2 lmn 25±1 fg 4.6±0.2 lmn 33±1 d 10±1 f 3.0±0.4 efgh
Russula cyanoxantha 4.3±0.3 g 1.6±0.1 e 13±1 k 10.1±0.4 jklm 5.0±0.5 i 22±1 hij 8.9±0.5 fg 22±1 g nd 14±1 b
Sarcodon imbricatus 2.4±0.2 h 2.7±0.2 d 1.5±0.2 r 7.8±0.4 no 1.8±0.3 lmn 42±1 a 13±1 c 4.2±0.4 mn 24.5±0.5 c nd
Tricholoma imbricatum 0.4±0.1 mno nd 9.8±0.2 l 15.8±0.5 g 1.4±0.1 mno 27±1 f 7.8±0.4 ghi 29±1 e 9±1 f 0.4±0.1 l
Tricholoma portentosum 0.19±0.05 no 1.7±0.2 e 4.0±0.4 q 11±1 ij 0.4±0.1 op 36±1 c 3.6±0.5 no 37±1 c 4.3±0.2 h 2.3±0.4 ghij
Homocedasticity1 P-value 0.004 <0.001 0.004 0.428 0.001 0.176 0.048 0.022 <0.001 <0.001
One-way ANOVA2 P-value <0.001 <0.001 <0.001 <0.001 <0.001 <0.001 <0.001 <0.001 <0.001 <0.001 1Homoscedasticity among cultivars was tested by means of the Levene test 2P<0.05 meaning that the mean value of the evaluated parameter of at least one cultivar differs from the others (in this case multiple comparison tests were performed). aMeans within a column with different letters differ significantly (p < 0.05). The results were evaluated either using the multiple comparison Tukey’s HSD or Tamhane’s T2 tests, depending on the fulfilment or not of the homoscedasticity requirement.

20
Table 3. LDA parameters considering different grouping variables.
Grouping variable Number of functions
(Wilks’ Λ test)
Correctly classified groups Variables not in
the analysis Original grouped cases Cross-validated grouped cases
Order p < 0.001 75.8 64.2 OLL
Family p < 0.001 95.8 93.3 LLL
Genus p < 0.001 99.2 99.2 OOO
Species p < 0.001 100.0 100.0 POL

21
Figure 1. Individual chromatogram of TAG profile in (A) Lycoperdon molle and (B)
Ramaria aurea. 1- LLnLn; 2-LLLn; 3- LLL; 4- OLL; 5- PLL; 6- OOL; 7- POL; 8- OOO; 9-
POO; 10- PPO.
Figure 2. Biplot of objects and component loadings using genus as labeling variable. Aga-
Agaricus; Ama- Amanita; Arm- Armillaria; Bol- Boletus; Bov- Bovista; Cal- Calocybe; Can-
Camtharellus; Chl- Chlorophyllum; Cla- Clavariadelphus; Cor- Cortinarius; Fis- Fistulina;
Lac- Laccaria; Lep- Lepista; Leur- Leucoagaricus; Leux- Leucopaxillus; Lyc- Lycoperdon;
Mac- Macrolepiota; Ram- Ramaria; Rus- Russula; Sar- Sarcodon; Tric- Tricholoma.
Figure 2. Canonical analysis of mushroom genera based on triacylglycerols profiles.

22
Figure 1 (A).
1.0E + 06
8.0 E + 0 5
6 .0 E + 0 5
4 .0 E + 0 5
2 .0 E + 0 5
0 .0 E + 0 0
1.0E + 06
8.0 E + 0 5
6 .0 E + 0 5
4 .0 E + 0 5
2 .0 E + 0 5
0 .0 E + 0 0 5.00 10.00 15.00 20.00 25.00 30.00 35.00 [min]
1 2
3
4 5 6
8
9 10
23
Figure 1 (B).
1.0E + 06
8.0 E + 0 5
6 .0 E + 0 5
4 .0 E + 0 5
2 .0 E + 0 5
0 .0 E + 0 0 5.00 10.00 15.00 20.00 25.00 30.00 35.00 [min]
1
3
4
5
6
7
8
10
9

24
Figure 2.

25
Figure 3.

26
TOC Graphic ______________________________________________________________________
Triacylglycerol Profile as a Chemical Fingerprint of Mushroom Species: Evaluation by
Principal Component and Linear Discriminant Analyses
João C.M. Barreira, Isabel C.F.R. Ferreira, M. Beatriz P.P. Oliveira
___________________________________________________________________________