![MASTER MORTGAGE LOAN PURCHASE AND INTERIM SERVICING AGREEMENT · 2017. 9. 27. · EXHIBIT 10.2 [TPW: NYLEGAL:122559.3] 16159-00120 02/28/2003 4:07 PM MASTER MORTGAGE LOAN PURCHASE](https://static.fdocuments.net/doc/165x107/61429efab7accd31ec0ed179/master-mortgage-loan-purchase-and-interim-servicing-agreement-2017-9-27-exhibit.jpg)
TREZ CAPITAL MORTGAGE INVESTMENT … CAPITAL MORTGAGE INVESTMENT CORPORATION Interim Management...
10
TREZ CAPITAL MORTGAGE INVESTMENT CORPORATION Interim Management Report of Fund Performance For the six months ended June 30, 2013 This Interim Management Report of Fund Performance contains financial highlights, but does not contain the complete interim financial statements of Trez Capital Mortgage Investment Corporation (the “Company” or “Trez”). You may receive a copy of the interim or annual financial statements at your request, and at no cost, by any of the following: Internet: SEDAR at www.sedar.com; or Phone: Call 1-877-689-0821 Mail: Writing to us at: Trez Capital Mortgage Investment Corporation 1550-1185 West Georgia Street Vancouver, BC V6E 4E6 Shareholders may also contact us using the above methods to request a copy of the Company’s proxy voting policies and procedures, proxy voting disclosure record, or quarterly portfolio disclosure. Topics covered in this Report Management Discussion of Fund Performance Investment Objectives and Strategies Industry and Sector Overview Risks Results of Operations Recent Developments Related Party Transactions Financial Highlights Past Performance Management Fees Summary of Investment Portfolio Summary of Mortgage Holdings Summary of Composition of the Portfolio
Transcript of TREZ CAPITAL MORTGAGE INVESTMENT … CAPITAL MORTGAGE INVESTMENT CORPORATION Interim Management...
TREZ CAPITAL MORTGAGE INVESTMENT CORPORATION
Interim Management Report of Fund Performance
For the six months ended June 30, 2013
This Interim Management Report of Fund Performance contains financial highlights, but does not contain the complete interim financial statements of Trez Capital Mortgage Investment Corporation (the “Company” or “Trez”). You may receive a copy of the interim or annual financial statements at your request, and at no cost, by any of the following:
Internet: SEDAR at www.sedar.com; or
Phone: Call 1-877-689-0821
Mail: Writing to us at: Trez Capital Mortgage Investment Corporation 1550-1185 West Georgia Street Vancouver, BC
V6E 4E6 Shareholders may also contact us using the above methods to request a copy of the Company’s proxy voting policies and procedures, proxy voting disclosure record, or quarterly portfolio disclosure.
Topics covered in this Report
Management Discussion of Fund Performance
Investment Objectives and Strategies
Industry and Sector Overview
Risks
Results of Operations
Recent Developments
Related Party Transactions
Financial Highlights
Past Performance
Management Fees
Summary of Investment Portfolio
Summary of Mortgage Holdings
Summary of Composition of the Portfolio

A Note on Forward Looking Statements
This report may contain forward-looking statements about the Company, including its strategy, expected performance and condition. Forward-looking statements include statements that are predictive in nature, that depend upon or refer to future events or conditions, or that include words such as “expects”, “anticipates”, “intends”, “plans”, “believes”, “estimates” or negative versions thereof and similar expressions. In addition, any statement that may be made concerning future performance, strategies or prospects, and possible future Company action, is also a forward-looking statement. Forward-looking statements are based on current expectations and projections about future events and are inherently subject to, among other things, risks, uncertainties and assumptions about the Company and economic factors.
Forward-looking statements are not guarantees of future performance, and actual events and results could differ materially from those expressed or implied in any forward-looking statements made by the Company. Any number of important factors could contribute to these digressions, including, but not limited to, general economic, political and market factors in North America and internationally, interest and foreign exchange rates, global equity and capital markets, business competition, technological change, changes in government regulations, unexpected judicial or regulatory proceedings, and catastrophic events.
We stress that the above-mentioned list of important factors is not exhaustive. We encourage you to consider these and other factors carefully before making any investment decisions and we urge you to avoid placing undue reliance on forward-looking statements. Further, you should be aware of the fact that the Company has no specific intention of updating any forward-looking statements whether as a result of new information, future events or otherwise.
MANAGEMENT DISCUSSION OF FUND PERFORMANCE
Investment Objectives and Strategies
Trez Capital Mortgage Investment Corporation’s investment objectives are to acquire and maintain a diversified portfolio of mortgages on real property in Canada that preserves capital and generates attractive returns in order to permit the Company to pay monthly distributions to its Class A Shareholders.
The Company seeks to accomplish its investment objectives through prudent investments in mortgages to qualified real estate investors and developers, focusing primarily on short-term bridge financing needs not currently serviced by traditional real estate lenders. Mortgages are secured primarily by income producing Real Property where the principal and interest can be serviced from cash flow generated by the underlying Real Property. Trez Capital Limited Partnership (“the Manager”) believes that its key lending practices and advantages in this market include its: (i) flexible structuring capability, (ii) speed of approval and funding, and (iii) certainty of execution, all of which lead to repeat business opportunities.
In general, the mortgages generate income through a rate of interest, which is typically payable periodically throughout the terms of the mortgages, as well as Commitment Fees which generally are paid at the time of initial funding. All mortgages are secured by Real Property consisting primarily of residential (generally not including single family residential), office, retail, industrial or other commercial property anywhere in Canada. Mortgages may be either first ranking, a junior position in a first ranking mortgage, or a second ranking mortgage, and individual mortgages may be secured by more than one property owned by the same mortgagor.
Due to the short-term nature of the mortgages, the Manager expects the Company’s portfolio to turnover approximately every 18 months.
The Manager believes that the declining number of mortgage financing options available to owners of real estate will allow the Company to earn above-average returns for a given risk profile and to be selective in its investments.
Industry and Sector Overview
Canadian Mortgage Lending Industry
The Manager believes that the fundamentals for real estate investment and development remain favourable in Canada as real estate capitalization rates remain high relative to government bond yields and Canadian real estate operating fundamentals remain sound which continues to attract sustained investor demand. The demand has remained stable as real estate investment trusts (REITs) and pension funds continue to raise capital to acquire new assets. Furthermore, an abundance of domestic and foreign investment capital continues to be deployed in Canadian direct real estate equity investments, contributing to continued strong demand. Canadian real estate prices are expected to remain stable due to a balance between supply and demand, and due to disciplined investors remaining focused on strong fundamentals and risk management rather than on speculation. Current valuations and fundamentals continue to provide an attractive market for mortgage lending in high quality real estate assets across Canada.
Industry and Sector Overview
Following a very strong first half to the year, in terms of absorption, the office market settled into a holding pattern for the remainder of the year. There is a major construction cycle underway with a total of almost 10 million square feet of downtown office space under construction in Canada (CBRE, January 21) and expectations are that many downtown tenants will look to move to new Class A office space when it becomes available. This pipeline, largely coming online in the next

four years, starting in 2014, should temper downtown rental rates in the medium term. In the meantime continued expansion of engineering and energy firms is encouraging ongoing leasing activity in Western Canada. The retail leasing market remains stable, supported by steadily rising sales growth in most Canadian markets coupled with an aggressive expansion North by several major U.S. retailers. The industrial market performed strongly again in the final quarter with demand clearly exceeding supply in Western markets and pushing the vacancy rate down to 3.7%, 1% lower than the national average (Avison Young, January 17, 2013). The residential market experienced further cooling across most sub markets as a result of stricter mortgage lending rules.
5-year and 10-year Government of Canada benchmark bond yields ended the year within 20 basis points of where they started. There are still no signals from the Bank of Canada that the prime rate will increase in the short term due to low inflation and spare capacity within the economy. Any change to this outlook will likely be triggered by a sustained improvement of the US economy and progress on European debt issues in 2013.
The Canadian economy saw growth in 2012, but when viewed in historic terms was sluggish, with the persistent strength of the Canadian dollar and the economic struggles of Canada’s main trading partners dampening export demand. However, despite the slowdown in growth, particularly in the second half of 2012, the Bank of Canada expects economic growth to pick up through 2013 (Bank of Canada, January 2013). Improving sentiment regarding the US economy should lead to an improving export market through 2013 which should provide a boost to the manufacturing based markets in Eastern Canada while continued job creation will help buoy consumer confidence, particularly in Western Canada. Rising household debt has been much highlighted in recent months as a key risk to the Canadian economy; however, the pace at which the household debt to income ratio has grown slowed during the third quarter of 2012 (Statistics Canada, December 2012). Canada’s GDP growth for 2012 was 1.9% (Bank of Canada estimate, January, 2013). CPI fell from 1.2% in September 2012 to 0.8% in December, and total CPI inflation is expected to remain around 1% in the near term, rising gradually to the 2% target in the second half of 2014 (Bank of Canada, January 2013).
Overall, the Manager believes that the above trends continue to create opportunities for alternative lenders to charge premium interest rates for high quality mortgage loans. The Company invests in mortgages secured by various types of Real Property, with such asset classes including multi-family residential, commercial and land servicing provided that such mortgages comply with the investment policies of the Company. Such mortgages are often of a short term nature, and may be subordinated to other debt. Loans made in connection with developed property may have longer terms. As well, the Company may invest in such mortgages, either alone or in participation with other parties. The investment activity of the Company is transactional in nature and is dependent on a high level of experience in assessing eligibility and suitability of mortgage investment opportunities.
Risks
The risks associated with investing in the Company remain as disclosed in its annual information form dated March 31, 2013. Any changes to the Company over the period have not affected the overall risk of the Company.
Results of Operations
The Company was incorporated on April 18, 2012. The Company completed its initial public offering of 10,000,000 shares at a price of $10.00 per share on June 4, 2012 and received an overallotment of 1,500,000 shares at a price of $10.00 per share on June 12, 2012. The Company also completed a second public offering on September 7, 2012 raising an additional $115 Million through the issuance of 11,500,000 shares at a price of $10.00 per share.
Since December 31, 2012, the company has been implementing its strategy of investing in high quality mortgages with the Company invested in a total of forty nine mortgages totalling $218,950,695 at June 30, 2013 (December 31, 2013, thirty two mortgages totalling $204,091,260).
At June 30, 2013, 23,001,475 Class A common shares and 100 Voting common shares were outstanding (December 31, 2012, 23,000,000 Class A common shares and 100 Voting common shares).
The income from operations for the period ended June 30, 2103 was $7,626,029 (June 30, 2012 was $24,240). During the period the Company earned $10,444,738 (June 30, 2012 - $170,385) in interest and fee revenues from investing its unallocated cash reserves and investing in mortgages.
During the period, the Company incurred management fees of $1,585,581 (June 30, 2012 - $116,167) and accrued performance fees of $392,073 (June 30, 2012 – Nil) to the Manager in accordance with the Management Agreement dated May 25, 2012. The Company also incurred trailer fees to registed dealers holding shares of the Company which totaled $541,336 (June 30, 2012 - Nil) and other administrative charges of $127,462 (June 30, 2012 - Nil) which included bank charges to establish a line of credit. In addition the Company incurred custodian fees of $17,366 (June 30, 2012 - $11,200) and transfer agent fees of $25,417 as a result of its agreements with Computershare Trust Company of Canada as well as professional fees of $106,405 ($9,480) paid to its auditors and legal counsel for ongoing services and $23,069 (June 2012 - $5,204) to its independent review committee.
Recent Developments
For the six months ended June 30, 2013, the Company funded net new mortgage investments in the amount of $14,859,435 (June 30, 2012 - $32,426,000).
In order to continue the growth of the Company, manage its risk and sustain returns to shareholders, the Manager intends to continue to enter into and maintain investment positions which are diversified across both geographic and real estate segments.
Related party transactions: Manager The Company is managed by Trez capital Fund Management LP (the “Manager”), a related party by virtue of common management. Pursuant to the Management Agreement, the Manager is entitled to a fee of 1.35% per annum of the gross assets of the Company (the “Management Fee”), plus applicable taxes, calculated daily and paid monthly in arrears. During the period, the Manager earned management fees of $1,585,581. The Manager is responsible for the management and administration of the Company’s mortgage investment portfolio. In any calendar year where the Company has a net return in excess of the
Hurdle Rate (Hurdle Rate is defined as the average two‐year Government of Canada Bond Yield for the 12 month period then ended plus 450 basis points), the Manager is entitled to receive from
the Company a performance fee equal to 20% of the Net Return over the Hurdle Rate (the “Performance Fee”). The Manager will calculate the final Performance Fee in respect of a completed calendar year based on the audited financial statements for that year. The Performance Fee in respect of a calendar year will be payable to the Manager within 15 days of the issuance of the Company’s audited financial statements for that year. The performance fee accrued for the current period totals $392,073. In the event of redemption of shares by the Company, any dividends declared by the Company during the calendar year in which the redemptions have taken place will be annualized and evaluated with respect to the Hurdle Rate. Fees payable to the Manager shall be, in any calendar year where the Company has a Net Return in excess of the Hurdle Rate, 20% of such excess. Other Related Party Transactions As at June 30, 2013 the Company has co-invested in 30 mortgage investments with parties related by virtue of common management. The total amount of the mortgages was $310,818,197, of which the Company’s share was $127,505,622 (December 31, 2012, 14 mortgage investments worth a total of $260,083,379, of which the Company’s share was $123,553,205).
The above related party transactions are in the normal course of operations and are measured at the exchange amount, which is the amount of consideration established and agreed to by the related parties. Title to mortgages is held by Computershare Trust Company of Canada, the Custodian, on behalf of the beneficial owners of the mortgages. In addition, certain duties are performed by the Manager.
In cases where mortgages are held on a participation basis:
The Company’s rights are as outlined in the Company Agreement and in a Mortgage Participation and Servicing Agreement with the Manager. The Custodian will hold the Company’s interest in the mortgage and underlying security.
Pursuant to these agreements, the Manager agrees to administer and service the mortgage loan on behalf of the Company and other investees. The Manager acts as the Company’s loan originator, underwriter, servicer, and syndicator.
The Manager performs certain duties including registering the mortgage, arranging for title searches, and holding all title papers and other security documentation related to the mortgage loan.
The Manager agrees to deliver cash payments received for interest and principal to the Company.
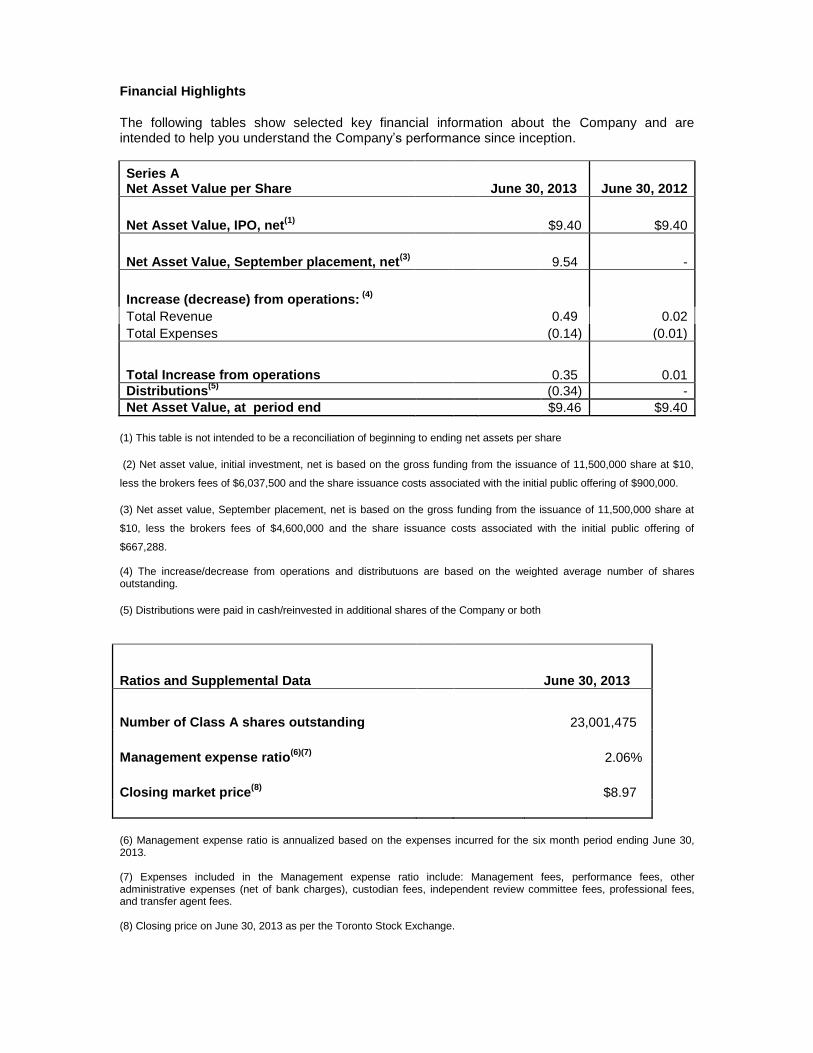
Financial Highlights
The following tables show selected key financial information about the Company and are intended to help you understand the Company’s performance since inception.
Series A Net Asset Value per Share June 30, 2013
June 30, 2012
Net Asset Value, IPO, net(1)
$9.40 $9.40
Net Asset Value, September placement, net(3)
9.54 -
Increase (decrease) from operations: (4)
Total Revenue 0.49 0.02
Total Expenses (0.14) (0.01)
Total Increase from operations 0.35 0.01
Distributions(5)
(0.34) -
Net Asset Value, at period end $9.46 $9.40
(1) This table is not intended to be a reconciliation of beginning to ending net assets per share
(2) Net asset value, initial investment, net is based on the gross funding from the issuance of 11,500,000 share at $10,
less the brokers fees of $6,037,500 and the share issuance costs associated with the initial public offering of $900,000.
(3) Net asset value, September placement, net is based on the gross funding from the issuance of 11,500,000 share at
$10, less the brokers fees of $4,600,000 and the share issuance costs associated with the initial public offering of
$667,288. (4) The increase/decrease from operations and distributuons are based on the weighted average number of shares outstanding.
(5) Distributions were paid in cash/reinvested in additional shares of the Company or both
Ratios and Supplemental Data June 30, 2013
Number of Class A shares outstanding 23,001,475
Management expense ratio(6)(7)
2.06%
Closing market price(8)
$8.97
(6) Management expense ratio is annualized based on the expenses incurred for the six month period ending June 30, 2013. (7) Expenses included in the Management expense ratio include: Management fees, performance fees, other administrative expenses (net of bank charges), custodian fees, independent review committee fees, professional fees, and transfer agent fees. (8) Closing price on June 30, 2013 as per the Toronto Stock Exchange.
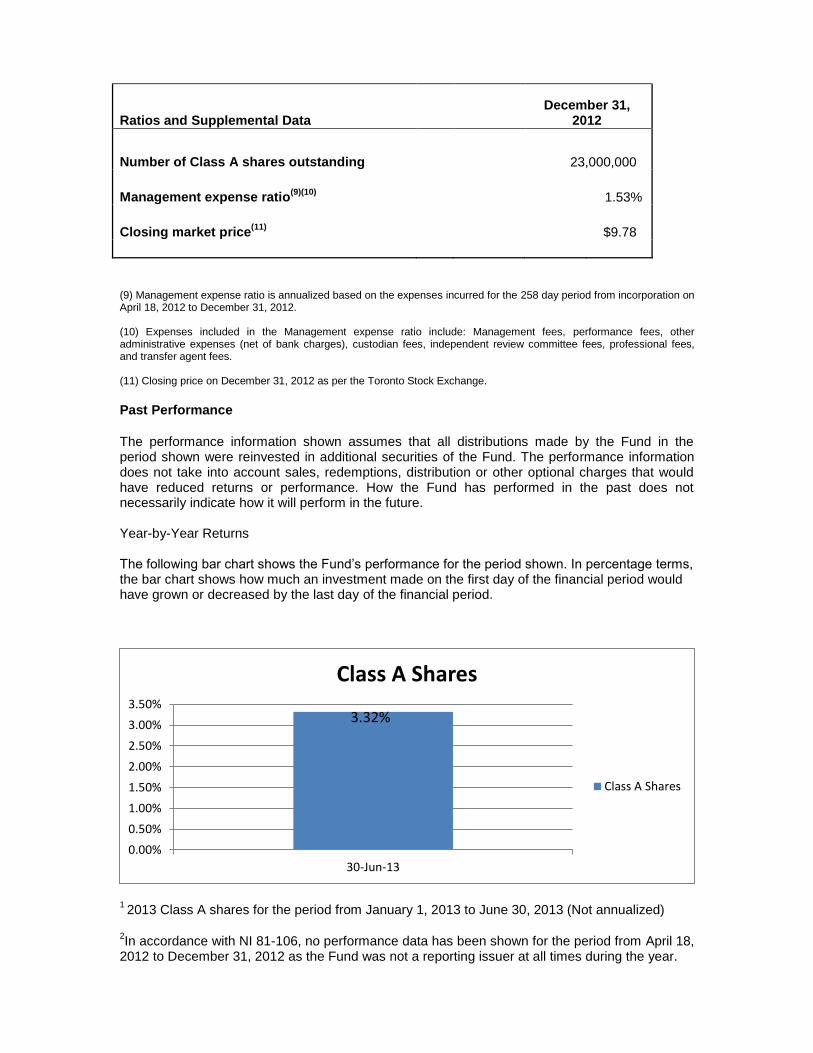
Ratios and Supplemental Data December 31,
2012
Number of Class A shares outstanding 23,000,000
Management expense ratio(9)(10)
1.53%
Closing market price(11)
$9.78
(9) Management expense ratio is annualized based on the expenses incurred for the 258 day period from incorporation on April 18, 2012 to December 31, 2012. (10) Expenses included in the Management expense ratio include: Management fees, performance fees, other administrative expenses (net of bank charges), custodian fees, independent review committee fees, professional fees, and transfer agent fees. (11) Closing price on December 31, 2012 as per the Toronto Stock Exchange.
Past Performance
The performance information shown assumes that all distributions made by the Fund in the period shown were reinvested in additional securities of the Fund. The performance information does not take into account sales, redemptions, distribution or other optional charges that would have reduced returns or performance. How the Fund has performed in the past does not necessarily indicate how it will perform in the future. Year-by-Year Returns The following bar chart shows the Fund’s performance for the period shown. In percentage terms, the bar chart shows how much an investment made on the first day of the financial period would have grown or decreased by the last day of the financial period.
1 2013 Class A shares for the period from January 1, 2013 to June 30, 2013 (Not annualized)
2In accordance with NI 81-106, no performance data has been shown for the period from April 18,
2012 to December 31, 2012 as the Fund was not a reporting issuer at all times during the year.
3.32%
0.00%
0.50%
1.00%
1.50%
2.00%
2.50%
3.00%
3.50%
30-Jun-13
Class A Shares
Class A Shares
Management Fees and Trailer Fees
A summary of management fees paid to the Manager for the period, including a breakdown of services received by the Company is included in “Related Party Transactions”. In addition, Class A shares of the Company pay each registered dealer a trailer fee equal to 0.50% per annum of the net asset value per Class A share of the Company (the “Trailer Fee”). The Trailer Fee is calculated and paid at the end of each calendar quarter and commenced in September 2012. For the six month period ended June 30, 2013 the total trailer fee incurred is $541,336 (June 30, 2012 – Nil) and the total unpaid accrued trailer fee is $272,067. (December 31, 2012 the total unpaid accrued trailer fee was $276,959) In addition to the management fees disclosed above, the Company will pay for all expenses incurred by it in connection with the operation and management, including but not limited to any additional fees payable to the Manager for performance of extraordinary services on behalf of the Company for services outside the scope of the Management Agreement. During the period ended December 31, 2012 no additional fees were accrued or paid to the Manager. Summary of Investment Portfolio
At June 30, 2013, the Company had a Net Asset Value of $217,628,370 made up of investments in fourty nine mortgages with a total fair market value of $218,950,695, net bank indebtedness of of $(762,951) and net other assets and liabilities of $(559,374) (December 31, 2012, the Company had a Net Asset Value of $218,033,930 made up of investments in thirty two mortgages with a total fair market value of $204,091,260, net cash of $14,553,380 and net other assets and liabilities of $(610,710)). The Manager continues to invest in a diversified portfolio in accordance with the Company’s investment policy. The current mortgage portfolio includes:
The largest mortgage the Company has invested in totals $21,800,000, 10% of the Company’s assets.
The weighted average Loan-to-Value ratio of the Company’s current mortgage portfolio is 65.1%, with the highest Loan-to-Value mortgage being 84.9%.
Twenty one mortgages, totalling $88,875,781 representing 40.5% of the mortgage portfolio are located in Ontario; fourteen mortgages, totalling $83,110,011 representing 38.0% of the mortgage portfolio are located in Alberta; one mortgage totalling $21,800,000 representing 10% of the portfolio is located in New Brunswick; five mortgages totalling $15,276,912 representing 7.0% of the portfolio are located in Nova Scotia, one mortgage in the amount of $6,000,000 representing 2.7% of the portfolio is located in Quebec; five mortgages totaling $3,519,391 representing 1.6% of the portfolio are located in British Columbia, and two mortgages totalling $368,600 representing 0.2% of the mortgage portfolio are located in Saskatchewan..
Among real estate classifications, $108,735,538, representing 49.7% of the mortgage portfolio is invested in residential projects, $85,067,925 representing 38.8% of the mortgage portfolio is invested in office projects, $20,709,730, representing 9.5% of the portfolio is invested in industrial projects, and $4,437,502 representing 2.0% of the portfolio is invested in retail projects. Overall, the Company’s assets are over 51% invested in residential mortgages and unallocated cash.
Thirty three of the mortgages totalling $156,543,204, representing 71.5% of the mortgage portfolio are first mortgages; nine mortgages totalling $46,566,906, representing 21.3% of the mortgage portfolio, are invested in second mortgages and $15,840,586, representing 7.2% of the mortgage portfolio, are invested in blanket mortgages which include, first mortgages, second mortgages and third mortgages.
Thirty seven of the mortgages totalling $153,666,591, representing 70.2% of the mortgage portfolio are invested in income producing real property and twelve mortgages totaling $65,284,104, representing 29.8% of the mortgage portfolio are invested in non-income producing real property.
The weighted average effective yield (interest and commitment fees) of the mortgage portfolio as at June 30, 2013 was 9.94% (December 31, 2012 was 9.28%)
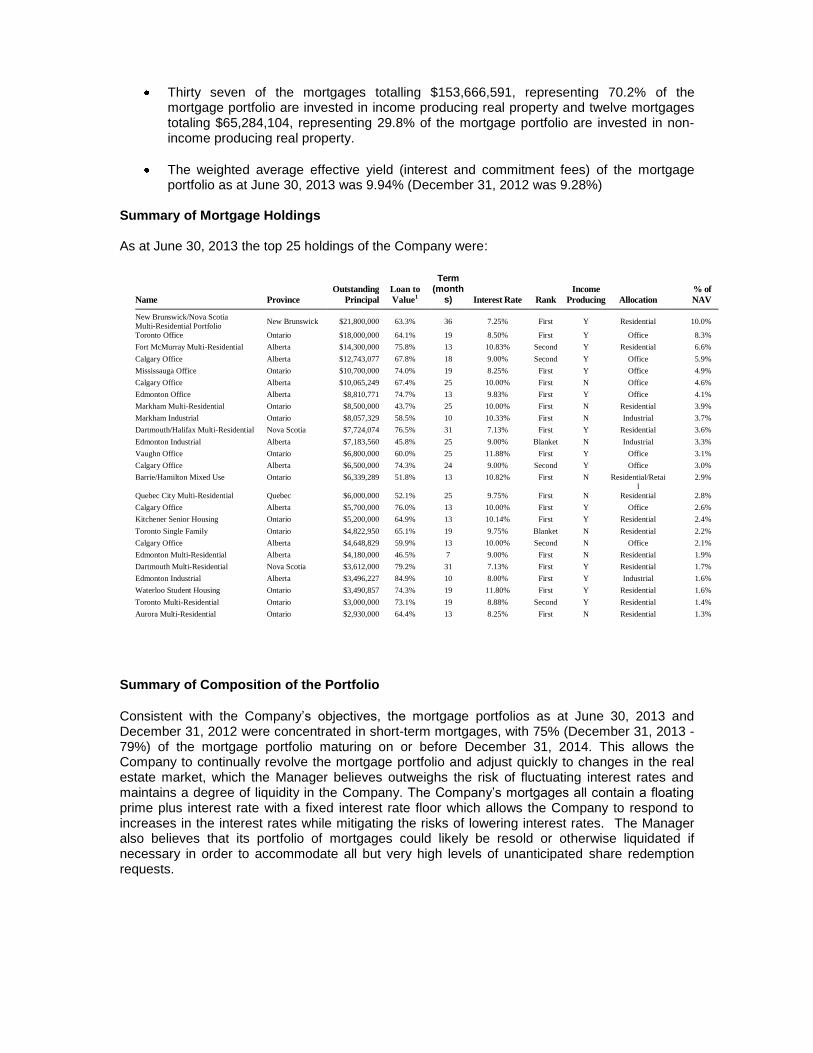
Summary of Mortgage Holdings As at June 30, 2013 the top 25 holdings of the Company were:
Name Province
Outstanding
Principal
Loan to
Value1
Term (month
s) Interest Rate Rank
Income
Producing Allocation
% of
NAV
New Brunswick/Nova Scotia
Multi-Residential Portfolio New Brunswick $21,800,000 63.3% 36 7.25% First Y Residential 10.0%
Toronto Office Ontario $18,000,000 64.1% 19 8.50% First Y Office 8.3%
Fort McMurray Multi-Residential Alberta $14,300,000 75.8% 13 10.83% Second Y Residential 6.6%
Calgary Office Alberta $12,743,077 67.8% 18 9.00% Second Y Office 5.9%
Mississauga Office Ontario $10,700,000 74.0% 19 8.25% First Y Office 4.9%
Calgary Office Alberta $10,065,249 67.4% 25 10.00% First N Office 4.6%
Edmonton Office Alberta $8,810,771 74.7% 13 9.83% First Y Office 4.1%
Markham Multi-Residential Ontario $8,500,000 43.7% 25 10.00% First N Residential 3.9%
Markham Industrial Ontario $8,057,329 58.5% 10 10.33% First N Industrial 3.7%
Dartmouth/Halifax Multi-Residential Nova Scotia $7,724,074 76.5% 31 7.13% First Y Residential 3.6%
Edmonton Industrial Alberta $7,183,560 45.8% 25 9.00% Blanket N Industrial 3.3%
Vaughn Office Ontario $6,800,000 60.0% 25 11.88% First Y Office 3.1%
Calgary Office Alberta $6,500,000 74.3% 24 9.00% Second Y Office 3.0%
Barrie/Hamilton Mixed Use Ontario $6,339,289 51.8% 13 10.82% First N Residential/Retai
l
2.9%
Quebec City Multi-Residential Quebec $6,000,000 52.1% 25 9.75% First N Residential 2.8%
Calgary Office Alberta $5,700,000 76.0% 13 10.00% First Y Office 2.6%
Kitchener Senior Housing Ontario $5,200,000 64.9% 13 10.14% First Y Residential 2.4%
Toronto Single Family Ontario $4,822,950 65.1% 19 9.75% Blanket N Residential 2.2%
Calgary Office Alberta $4,648,829 59.9% 13 10.00% Second N Office 2.1%
Edmonton Multi-Residential Alberta $4,180,000 46.5% 7 9.00% First N Residential 1.9%
Dartmouth Multi-Residential Nova Scotia $3,612,000 79.2% 31 7.13% First Y Residential 1.7%
Edmonton Industrial Alberta $3,496,227 84.9% 10 8.00% First Y Industrial 1.6%
Waterloo Student Housing Ontario $3,490,857 74.3% 19 11.80% First Y Residential 1.6%
Toronto Multi-Residential Ontario $3,000,000 73.1% 19 8.88% Second Y Residential 1.4%
Aurora Multi-Residential Ontario $2,930,000 64.4% 13 8.25% First N Residential 1.3%
Summary of Composition of the Portfolio
Consistent with the Company’s objectives, the mortgage portfolios as at June 30, 2013 and December 31, 2012 were concentrated in short-term mortgages, with 75% (December 31, 2013 -79%) of the mortgage portfolio maturing on or before December 31, 2014. This allows the Company to continually revolve the mortgage portfolio and adjust quickly to changes in the real estate market, which the Manager believes outweighs the risk of fluctuating interest rates and maintains a degree of liquidity in the Company. The Company’s mortgages all contain a floating prime plus interest rate with a fixed interest rate floor which allows the Company to respond to increases in the interest rates while mitigating the risks of lowering interest rates. The Manager also believes that its portfolio of mortgages could likely be resold or otherwise liquidated if necessary in order to accommodate all but very high levels of unanticipated share redemption requests.