Trends Packet Covers - Oregon State...
124
LOCAL LABOR TRENDS PACKET JULY 2010
Transcript of Trends Packet Covers - Oregon State...

LOCAL LABOR TRENDS PACKET JULY 2010

The Mission of the Oregon Employment Department
Support Business Promote Employment
“The Oregon Employment Department is an equal opportunity program. Auxiliary aids and services are
available upon request to individuals with disabilities.”
Please send address changes to: [email protected],
or call (503) 947-1204

July 2010
The seasonally adjusted unemployment rate for the U.S. decreased to 9.7 percent in May from its April revised rate of 9.9 percent. The statewide rate in May remained unchanged at 10.6 percent. Local News In May, Linn County’s seasonally adjusted unemployment rate increased while Benton County’s rate decreased. Benton County’s rate dropped to 7.0 percent in May from its revised rate of 7.4 percent in April. Linn County’s rate increased from a revised rate of 12.9 percent in April to 13.2 percent in May. Benton County’s May unemployment rate of 7.0 percent was lower than its rate of 8.2 percent in May 2009. Linn County’s May rate of 13.2 percent was lower than its rate of 14.6 percent in May 2009. Linn and Benton counties combined together had a seasonally adjusted unemployment rate of 10.3 percent in May, down from its revised rate of 10.6 percent in April. The two counties
Economic Indicators
Unemployment Rates
Seasonally United States Raw Adjusted May 2010 9.3% 9.7% Apr. 2010 9.5% 9.9% Oregon May 2010 10.4% 10.6% Apr. 2010 10.7% 10.6% Benton May 2010 6.7% 7.0% Apr. 2010 7.4% 7.4% Linn May 2010 12.7% 13.2% Apr. 2010 13.2% 12.9%
Nonfarm Payroll Employment (Preliminary Estimates)
Annual Benton Employment change Total Employment 36,870 -1,070 Manufacturing 3,070 -450 Trade, Trans., & Utl. 4,090 -160 Private Ed. & Health 5,520 60 Government 13,070 -120 Linn Total Employment 37,820 -1,460 Manufacturing 6,370 -470 Trade, Trans., & Utl. 8,170 -400 Private Ed. & Health 4,750 100 Government 7,910 -180
Consumer Price Index (CPI) United States 218.2 Yearly % Change (May 2010) 2.0% Portland/Salem OR-WA MSA 215.6 Annual Average 2009 +0.1%
http://www.bls.gov/cpi -500 -400 -300 -200 -100 0 100 200
Manufacturing
Trade, Trans., and Utilities
Financial Activities
Prof. and Business Services
Private Educ. and Health Services
Leisure and Hospitality
Other Private
Government
Change in Nonfarm Payroll Employment
Benton County: Employment Change, May 2010
past month
past year

2 Oregon Employment Department Workforce Analysis Benton-Linn Trends July 2010
combined unemployment rate of 10.3 percent was slightly lower than the statewide rate of 10.6 percent in May. Benton County’s unemployment rate was the lowest unemployment rate among Oregon’s 36 counties. Linn County’s ranking was significantly worse, ranking 27th among the counties. In Linn County, nonfarm employment decreased over the past 12 months by 1,460 jobs. Benton County’s employment has declined 1,070 jobs since May 2009. Labor Force Summary In May, there were an estimated 2,886 Benton County residents unemployed in a civilian labor force of 42,848. The number of residents unemployed decreased 546 since May 2009. Benton County had 39,962 employed residents including payroll employees, the self-employed, farm workers, and a number of residents commuting outside of the county for work. In May, there were an estimated 6,928 Linn County residents unemployed in a civilian labor force of 54,457. There were 47,529 Linn County residents employed in May including payroll employees, self-employed, farm workers, and residents commuting outside the county for work. Overall, there were 995 fewer unemployed residents compared with May 2009. Nonfarm Payroll Employment In Benton County, May total nonfarm employment was 36,870. Private-sector employment increased 120 over the month and the public sector added 140. Benton County’s
-500 -400 -300 -200 -100 0 100 200
Manufacturing
Construction
Trade, Trans., and Utilities
Financial Activities
Prof. and Business Services
Private Educ. and Health Services
Leisure and Hospitality
Other Private
Government
Change in Nonfarm Payroll Employment
Linn County: Employment Change, May 2010
past month
past year
Nonfarm payroll employment statistics are by place of work and estimate how many jobs have been added or lost in an area. They measure an area’s economic health and are based on a survey of employers. Nonfarm payroll employment shows how many people were employed in a given area, on average, during the month.
Benton/Linn Labor Trends is published by the Workforce and Economic Research Division of the Oregon Employment Department. Benton/Linn Labor Trends also can be found on the Publications page at www.QualityInfo.org. Material contained in this publication is in the public domain and may be reproduced without permission. Please credit Benton/Linn Labor Trends, Oregon Employment Department.
Laurie Warner, Director Graham Slater, Administrator for Workforce and Economic Research Patrick O’Connor, Regional Economist Will Summers, Workforce Analyst Albany (541) 967-2177 Sue Hankins, Field Office Manager Albany (541) 967-2171 Corvallis (541) 757-4261 Lebanon (541) 451-1934
Please direct address changes to: Oregon Employment Department Workforce and Economic Research 875 Union St NE Salem OR 97311 Phone (503) 947-1204 TDD (503) 947-1391 e-mail [email protected] The Oregon Employment Department is an equal opportunity employer. Auxiliary aids and services are available upon request to individuals with disabilities.

Oregon Employment Department Workforce Analysis 3 Benton-Linn Trends July 2010
employment growth in May was very typical; total nonfarm employment increased 260 jobs when an increase of 260 jobs is what we typically expect in May. Benton County’s seasonally adjusted employment was unchanged in May. From April 2008 to May 2010, Benton County lost nearly 2,600 jobs, or 6.7 percent. Over the past 12 months, Benton County shed 1,070 jobs, declining 2.8 percent. Nearly all private-sector industries in Benton County lost jobs over the past 12 months. Educational and health services is the one exception; the industry added 60 jobs over the past 12 months. Manufacturing recorded the largest employment decline over the past year, shedding 20 jobs in May and losing 450 jobs since May 2009. In the past 24 months Benton County’s manufacturing sector shed 1,390 jobs, a 31 percent decrease in employment. In the public sector, federal government shed 50 jobs over the past 12 months while local government trimmed 100 jobs. State government employment increased 30 since May 2009. Linn County's total nonfarm payroll employment decreased 40 in May, dropping to 37,820. May’s employment drop was less than is typical. The county’s employment typically drops about 90 jobs in May; Linn County’s seasonally adjusted employment in May increased 50 jobs. Linn County’s employment shrunk 1,460, or 3.7 percent, since May 2009. From February 2008 to May 2010, Linn County lost nearly 5,500 jobs, or 12.6 percent. The only two private-sector industries adding jobs over the past 12 months in Linn County were education and health services (+100 jobs) and mining and logging (+20). Linn County’s hardest-hit sectors continue to be manufacturing and construction. Manufacturing employment is down 470, or 6.9 percent, since May 2009. Linn County’s construction sector shed 140 jobs in the past 12 months, declining 7.6 percent. In the past 24 months, Linn County’s construction employment dropped 810, or 32 percent. Outlook Job loss has slowed in recent months in both counties. Unemployment rates had dropped slightly in recent months, but May showed an uptick in Linn County’s unemployment rate. Both counties are likely to have high unemployment rates that persist through 2010. The national recession led to significant job loss in key industries such as manufacturing; construction; and trade, transportation, and utilities. Manufacturing job loss slowed in recent months. Benton County’s manufacturing continued to shed jobs but Linn County’s manufacturing showed job growth in May. These preliminary estimates will be revised as new data from businesses becomes available. News From Around the Region Material gathered from published, nonconfidential sources. The Riverfront Restaurant will open in Corvallis this summer. It will offer Vietnamese specialties, steak, pasta dishes, and a sushi bar. FixMyGadget, a Nintendo DS repair business, opened in Corvallis.

4 Oregon Employment Department Workforce Analysis Benton-Linn Trends July 2010
Barefoot Gardens Inc., a full-service landscaping company that focuses on sustainable landscape practices, opened in Corvallis. Purple Dragonfly, a thrift store, opened in Lebanon. Pro-Image, a sports apparel and merchandise store, will open at the Heritage Mall in Albany. Hillbilly Barbecue Grill opened in Lebanon. Oregon Employment Oregon’s seasonally adjusted unemployment rate was 10.6 percent in May, the same as in March and April. The rate has been essentially unchanged for the most recent seven months. Oregon’s unemployment rate was 11.6 percent in May 2009, which tied June 2009 as Oregon’s highest unemployment rate since the early 1980s. The U.S. seasonally adjusted unemployment rate dropped to 9.7 percent in May from 9.9 percent in April.
In May, 202,944 Oregonians were unemployed. In May 2009, 223,474 Oregonians were unemployed. In seasonally adjusted terms, both Oregon’s civilian labor force and its number of citizens employed increased modestly in May. This marked the fifth consecutive month of increases in both these figures. Oregon’s seasonally adjusted nonfarm payroll employment was flat in May, following a gain of 5,500 (as revised) in April. Government added 6,800 jobs in May at a time of year when a gain of 3,700 is expected due to seasonality. The addition of 4,451 intermittent Census workers boosted both federal government and total government for May, adding to the 1,952 already working for the Census in April. In the private sector, several major industries posted job declines, while only two major industries produced substantial seasonally adjusted job gains: construction and manufacturing. Construction posted its third consecutive seasonally adjusted job gain. It added 1,700 jobs at a time of year when a gain of 1,200 is the normal seasonal movement. Construction employment stood at 64,200 jobs in May, still well below its May 2009 tally of 73,100.
Manufacturing continued to slowly recover from its recent trough. Seasonally adjusted employment rose 700 in May and is now up 1,400 from its February trough. Over the last several months,
0%
2%
4%
6%
8%
10%
12%
14%
16%
Jan-99 Jan-00 Jan-01 Jan-02 Jan-03 Jan-04 Jan-05 Jan-06 Jan-07 Jan-08 Jan-09 Jan-10
Seasonally Adjusted Unemployment Rates
US
Oregon
Linn County
Benton County

Oregon Employment Department Workforce Analysis 5 Benton-Linn Trends July 2010
durable goods employment continued to hover above 110,000, while nondurable goods steadied slightly below 50,000. Trade, transportation, and utilities normally gains 1,700 jobs due to seasonal factors in May, so this May’s flat employment trend was 1,700 below normal seasonal expectations. Retail trade contributed most of the dismal performance as it added only 300 jobs during the normally rapidly growing spring month of May.
Financial activities gave back its April gains, dropping 800 jobs in May. The industry fell below 93,000 for only the second month in more than 12 years. Professional and business services added only 100 jobs in May when a gain of 800 is the normal seasonal movement. The industry is now close to its December employment level after showing modest gains during the first part of the year.
Educational and health services dropped 1,900 jobs in May, when it normally would drop by only 1,300 for the month. Despite the one-month decline there have been solid long-term gains. Over the past 12 months, health care and social assistance added 1,300 jobs. National Employment The number of unemployed persons was 15.0 million in May. The unemployment rate edged down to 9.7 percent, the same rate as in the first three months of 2010. Nonfarm payroll employment increased by 431,000 in May, reflecting the addition of 411,000 temporary workers for Census 2010. Total private employment showed little change over the month (+41,000), following increases in March and April. In May, manufacturing, temporary help services, and mining added jobs, while employment in construction declined. Manufacturing employment increased by 29,000 over the month. Factory employment rose by 126,000 over the past five months. Within manufacturing, both fabricated metals and machinery added jobs in May. Temporary help services added 31,000 jobs over the month; employment in the industry rose by 362,000 since September 2009. Employment in mining continued to increase in May, with a gain of 10,000. Support activities for mining accounted for 8,000 of the over-the-month increase. Since October 2009, mining employment expanded by 50,000. Health care employment was little changed in May (+8,000). Over the prior 12 months, health care employment increased by an average of 20,000 per month. In May, employment in construction declined by 35,000, largely offsetting industry gains in the prior two months. May's job loss was spread throughout the sector.

6 Oregon Employment Department Workforce Analysis Benton-Linn Trends July 2010
Employment in other private-sector industries, including wholesale trade, retail trade, transportation and warehousing, information, financial activities, and leisure and hospitality showed little or no change in May. Government employment rose by 390,000 in May. The federal government hired 411,000 temporary workers for Census 2010, bringing total temporary census staffing during the payroll survey reference period to 564,000. Employment in state government excluding education decreased by 13,000. The largest city in the region is Corvallis in Benton County, with a 2009 population of 55,125. Coming in a distant second in Benton County is Philomath, with a population of 4,640. Albany, in Linn and Benton counties, is the region’s second-largest city, with a population of 49,165. Albany has grown by nearly 20 percent since 2000. Other large cities in Linn County include Lebanon (15,580) and Sweet Home (9,050). On the coast, Newport is the largest city in Lincoln County, with a population of 10,600. Not far behind is Lincoln City, with a population of 7,930.

Oregon Employment Department Workforce Analysis 7 Benton-Linn Trends July 2010
LINN COUNTY LABOR FORCE SUMMARY (by place of residence)
May Apr. May Apr. May2010 2010 2009 2010 2009
C ivilian Labor Force 54,457 55,033 55,997 -576 -1,540 Unemployment 6,928 7,264 7,923 -336 -995 Percent of Labor Force 12.7% 13.2% 14.1% X X XX Total Employment 47,529 47,769 48,074 -240 -545Seasonally Adjusted Unemployment Rate 13.2% 12.9% 14.6% X X XX
LINN COUNTY NONFARM PAYROLL EMPLOYMENT(by place of work)
May Apr. May Apr. May2010 2010 2009 2010 2009
TOTAL NONFAR M PAYROLL EMPLOYMENT 37,820 37,860 39,280 -40 -1,460
SEASONALLY ADJU STED NON FARM PAYROLL EMPLOYMENT 37,930 37,880 39,390 50 -1,460
TOTAL PRIVATE 29,910 29,860 31,190 50 -1,280 Mining and Logging 370 360 350 10 20 Construction 1,700 1,650 1,840 50 -140 Manufacturing Total 6,370 6,310 6,840 60 -470 Durable Goods 4,560 4,490 4,710 70 -150 W ood Product Manufacturing 1,450 1,420 1,450 30 0 Primary Metal Manufacturing 1,630 1,620 1,800 10 -170 N ondurable Goods 1,810 1,820 2,130 -10 -320 Trade, Transportation, and Utilities 8,170 8,230 8,570 -60 -400 W holesale Trade 1,340 1,400 1,420 -60 -80 R etail Trade 4,210 4,210 4,420 0 -210 Transportation, W arehousing, and Utilities 2,620 2,620 2,730 0 -110 Information 400 400 420 0 -20 Financial Activities 1,330 1,310 1,380 20 -50 Professional and Busines s Services 2,660 2,650 2,770 10 -110 Adminis trative and Support Services 1,540 1,500 1,530 40 10 Educational and Health Services 4,750 4,770 4,650 -20 100 Health Care and Social Assistance 4,350 4,360 4,220 -10 130 Health Care 3,640 3,650 3,530 -10 110 Leis ure and Hospitality 2,840 2,880 3,010 -40 -170 Accomodation and Food Services 2,640 2,580 2,720 60 -80 Other Services 1,320 1,300 1,360 20 -40 Government 7,910 8,000 8,090 -90 -180 Federal Government 340 340 410 0 -70 S tate Government 1,220 1,220 1,170 0 50 Local Government 6,350 6,440 6,510 -90 -160 Loc al Government Educational Services 4,200 4,290 4,360 -90 -160 Loc al Government Excluding Education 2,150 2,150 2,150 0 0
LABOR-MA NAGEMENT DISPUTE S 0 0 0 0 0
Nonfarm Payroll Employment: Data are by place of work and cover full- and pa rt- time employees who worked or received pay for the pay per iod that inc ludes the 12th of the mon th. The data exclude the self-employed, volunteers, unpaid family workers, and domestics. "Natural Resou rces" includes only Logging (NAICS 1133).
Current Labor Force and Industry Employm ent
-Change from-
-Change from-
The most recent month is preliminary, the pr ior month is revised. Prepared in cooperation with the U.S. Department of Labor, Bureau of Labor Statistics.
Labor Force Status: Civilian labor force includes employed and unemployed individuals 16 years and o lder by p lace of res idence . Emp loyed includes nonfarm payroll employmen t, self-employed, unpa id family workers, domestics, agriculture , and labor disputants. Unemployment rate is calculated by div id ing unemployed by c ivilian labor force.

8 Oregon Employment Department Workforce Analysis Benton-Linn Trends July 2010
(by place of residence)
May Apr. May Apr. May2010 2010 2009 2010 2009
Civilian Labor Force 42,848 43,250 43,848 -402 -1,000 Unemployment 2,886 3,216 3,432 -330 -546 Percent of Labor Force 6.7% 7.4% 7.8% XX XX Total Employment 39,962 40,034 40,416 -72 -454Seasonally Adjusted Unemployment Rate 7.0% 7.4% 8.2% XX XX
CORVALLIS MSA (Benton County) NONFARM PAYROLL EMPLOYMENT(by place of work)
May Apr. May Apr. May2010 2010 2009 2010 2009
TOTAL NONFARM PAYROLL EMPLOYMENT 36,870 36,610 37,940 260 -1,070SEASONALLY ADJUSTED NONFARM PAYROLL EMPLOYMENT 36,200 36,200 37,250 0 -1,050
TOTAL PRIVATE 23,800 23,680 24,750 120 -950 Mining, logging, and Construction 1,060 1,020 1,100 40 -40 Manufacturing Total 3,070 3,090 3,520 -20 -450 Durable Goods 2,750 2,780 3,150 -30 -400 Trade, Transportation, and Utilities 4,090 4,090 4,250 0 -160 Information 880 870 920 10 -40 Financial Activities 1,300 1,300 1,360 0 -60 Professional and Business Services 3,390 3,380 3,560 10 -170 Educational and Health Services 5,520 5,490 5,460 30 60 Health Care and Social Assistance 5,100 5,080 5,070 20 30 Leisure and Hospitality 3,330 3,280 3,430 50 -100 Other Services 1,160 1,160 1,150 0 10 Government 13,070 12,930 13,190 140 -120 Federal Government 580 580 630 0 -50 State Government 9,480 9,380 9,450 100 30 State Government Educational Services 9,100 9,010 9,070 90 30 Local Government 3,010 2,970 3,110 40 -100 Local Government Educational Services 1,680 1,650 1,730 30 -50
LABOR-MANAGEMENT DISPUTES 0 0 0 0 0
Nonfarm Payroll Employment: Data are by place of work and cover full- and part-time employees who worked or received pay for the pay period that includes the 12th of the month. The data exclude the self-employed, volunteers, unpaid family workers, and domestics. "Natural Resources" includes only logging (NAICS 1133).
Labor Force Status: Civilian labor force includes employed and unemployed individuals 16 years and older by place of residence. Employed includes nonfarm payroll employment, self-employed, unpaid family workers, domestics, agriculture, and labor disputants. Unemployment rate is calculated by dividing unemployed by civilian labor force.
Current Labor Force and Industry Employment
The most recent month is preliminary, the prior month is revised. Prepared in cooperation with the U.S. Department of Labor, Bureau of Labor Statistics.
-Change from-
-Change from-
CORVALLIS (Benton County) MSA LABOR FORCE SUMMARY

July 2010 The Latest Employment Data The state’s seasonally adjusted unemployment rate was 10.6 percent in May, unchanged from April (10.6%). The nation’s rate was 9.7 percent in May. The total number of people employed in Oregon – estimated from a survey of households – was almost unchanged in April, increasing by only 784 from April to May but the number of people unemployed decreased by about 7,000. Total employment was about 1,700 higher this May than last year and the number of unemployed people dropped by about 20,000 over the year. Nonfarm payroll employment in Oregon – estimated from a survey of businesses – increased by about 12,000 in May but remained about 20,000 lower than one year before. Lincoln County The seasonally adjusted unemployment rate was 10.8 percent in May, essentially unchanged from April (10.6%). Lincoln County’s rate was 11.2 percent last May. The estimated number of people unemployed fell by 101 to 2,329. Estimated total employment went up by 288 to 20,918. This was 171 more than the previous May. Seasonally adjusted nonfarm payroll employment rose by 130 jobs in May. A gain of 270 jobs is normal for the month but nonfarm employment in the county climbed by 400 in May to 17,660. The private sector added 250 jobs and governments gained 150. Leisure and hospitality gained 220 and retail added 30.
Economic Indicators Unemployment Rates
Seasonally Adjusted Lincoln May 10.8% April 10.6% Oregon May 10.6% April 10.6% United States May 9.7% April 9.9% Average Pay Per Job – 2008 Lincoln County $29,656 Oregon $40,740
Consumer Price Index (CPI)
Monthly Annual Change Change
United States +0.1% +2.0%
Portland MSA 0.5 %
(July-Dec. 2009)
Consumer Confidence
Monthly Index Change
May 63.3 +5.6
Federal Reserve Data Monthly Rate Change
Prime Rate June 19 3.25% 0
OR GDP Index May. +0.20%

2 Oregon Employment Department Workforce Analysis Central Coast Trends July 2010
Local government education added 30 jobs as did state government. The federal government added 90 jobs, primarily for the 2010 Census. Estimated total nonfarm employment in Lincoln County was 160 below the level one year ago. The private sector shed 80 jobs and governments cut 80. Around the County The Gentle Dragon Massage and Healing Hideaway is a new alternative health practice in Yachats. South Lincoln County News, June 9, 2010 Donya Marie’s Beyond Chocolate is a new manufacturing, wholesale, retail, and restaurant business in Newport that makes a wide variety of ordinary food items that are combined with dark chocolate. The firm’s two owners mix chocolate into salsa, bread, salad dressing and drink mixes. Dr. Vinod Vinjamuri opened a new internal medicine practice in Newport. News Times, June 2, 2010 KORC Radio in Newport is back on the air after shutting down last December. A new owner purchased the station and plans to increase its power. Samaritan Mental Health of Newport will close its facility. The clinic had only one practitioner left. News-Times, May 26, 2010 A new Veteran’s Administration health clinic opened in Newport. The clinic is co-located with the Newport Community Health Center. The News Guard, May 26, 2010 Gracie Technics is a new Brazilian jiu-jitsu school in Newport. News-Times, June 16, 2010
0
2
4
6
8
10
12
14
May-05 May-06 May-07 May-08 May-09 May-10
Pe
rce
nt
Seasonally Adjusted Unemployment Rates
Oregon Lincoln County, OR
-1,400
-1,200
-1,000
-800
-600
-400
-200
0
200
400
May-08 Aug-08 Nov-08 Feb-09 May-09 Aug-09 Nov-09 Feb-10 May-10
Lincoln County: Year-to-Year Employment Change May 2008 to May 2010
Central Coast Labor Trends is published by the Workforce and Economic Research Division of the Oregon Employment Department. Central Coast Labor Trends also can be found on the Publications page at www.QualityInfo.org. Material contained in this publication is in the public domain and October be reproduced without permission. Please credit Central Coast Labor Trends, Oregon Employment Department.
Laurie Warner, Director Graham Slater, Administrator for Workforce and Economic Research Erik Knoder, Regional Economist Will Summers, Workforce Analyst Albany (541) 967-2171 x244 Judy Fontanini, Field Office Manager Newport (541) 265-8891 Lincoln City (541) 994-6992
Please direct address changes to: Oregon Employment Department Workforce and Economic Research 875 Union St NE Salem OR 97311 Phone (503) 947-1204 TDD (503) 947-1391 e-mail [email protected] The Oregon Employment Department is an equal opportunity employer. Auxiliary aids and services are available upon request to individuals with disabilities.
Oregon Employment Department Workforce Analysis 3 Central Coast Trends July 2010
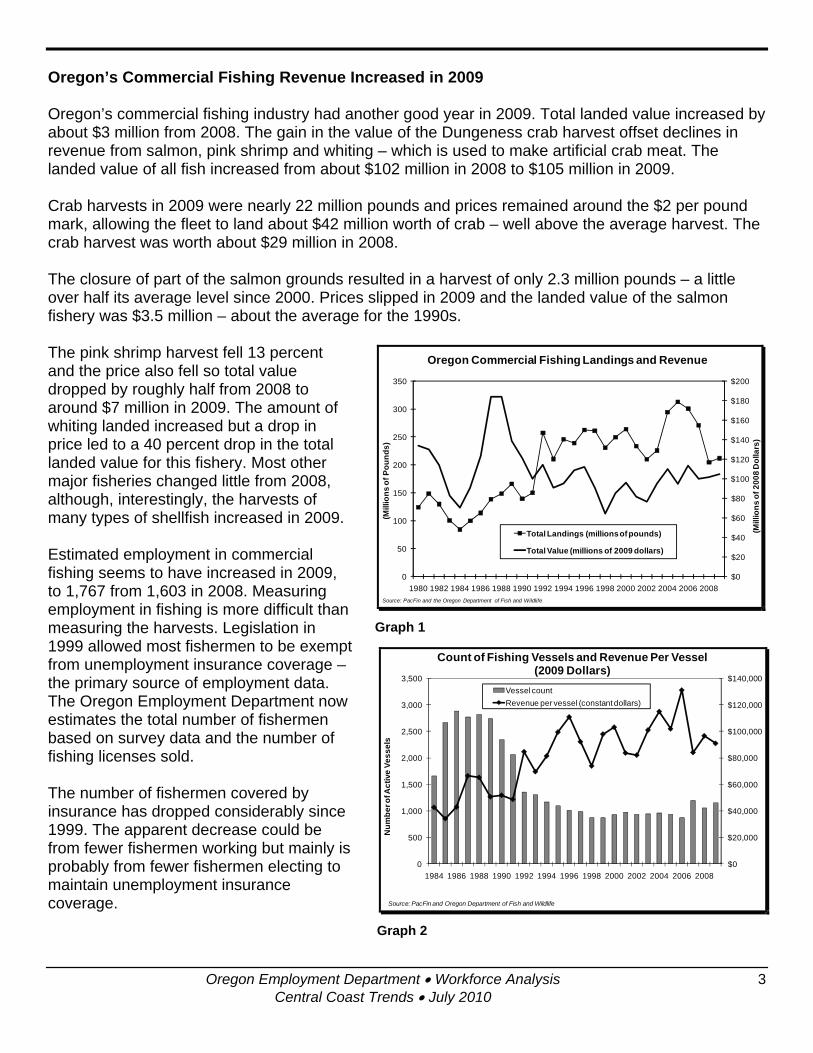
Oregon’s Commercial Fishing Revenue Increased in 2009 Oregon’s commercial fishing industry had another good year in 2009. Total landed value increased by about $3 million from 2008. The gain in the value of the Dungeness crab harvest offset declines in revenue from salmon, pink shrimp and whiting – which is used to make artificial crab meat. The landed value of all fish increased from about $102 million in 2008 to $105 million in 2009. Crab harvests in 2009 were nearly 22 million pounds and prices remained around the $2 per pound mark, allowing the fleet to land about $42 million worth of crab – well above the average harvest. The crab harvest was worth about $29 million in 2008. The closure of part of the salmon grounds resulted in a harvest of only 2.3 million pounds – a little over half its average level since 2000. Prices slipped in 2009 and the landed value of the salmon fishery was $3.5 million – about the average for the 1990s. The pink shrimp harvest fell 13 percent and the price also fell so total value dropped by roughly half from 2008 to around $7 million in 2009. The amount of whiting landed increased but a drop in price led to a 40 percent drop in the total landed value for this fishery. Most other major fisheries changed little from 2008, although, interestingly, the harvests of many types of shellfish increased in 2009. Estimated employment in commercial fishing seems to have increased in 2009, to 1,767 from 1,603 in 2008. Measuring employment in fishing is more difficult than measuring the harvests. Legislation in 1999 allowed most fishermen to be exempt from unemployment insurance coverage – the primary source of employment data. The Oregon Employment Department now estimates the total number of fishermen based on survey data and the number of fishing licenses sold. The number of fishermen covered by insurance has dropped considerably since 1999. The apparent decrease could be from fewer fishermen working but mainly is probably from fewer fishermen electing to maintain unemployment insurance coverage.
$0
$20
$40
$60
$80
$100
$120
$140
$160
$180
$200
0
50
100
150
200
250
300
350
1980 1982 1984 1986 1988 1990 1992 1994 1996 1998 2000 2002 2004 2006 2008
(Mill
ion
s o
f 2
00
8 D
olla
rs)
(Mill
ion
s o
f P
ou
nd
s)
Oregon Commercial Fishing Landings and Revenue
Total Landings (millions of pounds)
Total Value (millions of 2009 dollars)
Source: PacFin and the Oregon Department of Fish and Wildlife Graph 1
$0
$20,000
$40,000
$60,000
$80,000
$100,000
$120,000
$140,000
0
500
1,000
1,500
2,000
2,500
3,000
3,500
1984 1986 1988 1990 1992 1994 1996 1998 2000 2002 2004 2006 2008
Nu
mb
er o
f Ac
tive
Ve
ss
els
Count of Fishing Vessels and Revenue Per Vessel (2009 Dollars)
Vessel count
Revenue per vessel (constant dollars)
Source: PacFin and Oregon Department of Fish and Wildlife Graph 2

4 Oregon Employment Department Workforce Analysis Central Coast Trends July 2010
Although the number of fishing vessels has declined from historic highs, fishing is generating more revenue per boat and is probably becoming a higher-paying occupation. In addition to direct employment, commercial fishing provides the resource for processors. There were 26 seafood processors in Oregon in 2009, one fewer than the previous year. Their average annual employment was 1,007. Some ports, such as Florence and Reedsport, have fish buyers who now transport the harvest to be processed elsewhere. National Employment The number of unemployed persons was 15.0 million in May. The unemployment rate edged down to 9.7 percent, the same rate as in the first three months of 2010. Nonfarm payroll employment increased by 431,000 in May, reflecting the addition of 411,000 temporary workers for Census 2010. Total private employment showed little change over the month (+41,000), following increases in March and April. In May, manufacturing, temporary help services, and mining added jobs, while employment in construction declined. Manufacturing employment increased by 29,000 over the month. Factory employment rose by 126,000 over the past five months. Within manufacturing, both fabricated metals and machinery added jobs in May. Temporary help services added 31,000 jobs in May; the industry added 362,000 since September 2009. Employment in mining continued to increase in May, with a gain of 10,000. Support activities for mining accounted for 8,000 of the over-the-month increase. Since October 2009, mining employment expanded by 50,000. Health care employment was little changed in May (+8,000). Over the prior 12 months, health care employment increased by an average of 20,000 per month. In May, employment in construction declined by 35,000, largely offsetting industry gains in the prior two months. May's job loss was spread throughout the sector. Employment in other private-sector industries, including wholesale trade, retail trade, transportation and warehousing, information, financial activities, and leisure and hospitality showed little or no change in May. Government employment rose by 390,000 in May. The federal government hired 411,000 temporary workers for Census 2010, bringing total temporary census staffing during the payroll survey reference period to 564,000. Employment in state government excluding education decreased by 13,000.
Interest rates provide clues about the future of the economy. Lower interest rates generally decrease the cost of doing business and tend to promote growth in output, employment, and prices. The Fed’s target rate for its funds is still 0.25 percent – essentially as low as it can go. The prime rate held steady from May to June at 3.25 percent. Conventional 30-year mortgage rates fell slightly to around 4.75 percent in June. Rates on 10-year Treasury notes also dropped in June. The rate for three-month Treasury bills remained near zero. The consumer price index rose slightly in May. The 12-month change in the index was a positive 2.0 percent. The Conference Board’s leading index for the national economy increased 0.4 percent in May – after no change in April. The consumer confidence index climbed to 63.3 in June from 57.7 in May. This is its third consecutive month of increase. Consumers thought present-day business conditions improved.

Oregon Employment Department Workforce Analysis 5 Central Coast Trends July 2010
Oregon Employment Oregon’s seasonally adjusted unemployment rate was 10.6 percent in May, the same as in March and April. The rate has been essentially unchanged for the most recent seven months. Oregon’s unemployment rate was 11.6 percent in May 2009, which tied June 2009 as Oregon’s highest unemployment rate since the early 1980s. The U.S. seasonally adjusted unemployment rate dropped to 9.7 percent in May from 9.9 percent in April.
In May, 202,944 Oregonians were unemployed. In May 2009, 223,474 Oregonians were unemployed. In seasonally adjusted terms, both Oregon’s civilian labor force and its number of citizens employed increased modestly in May. This marked the fifth consecutive month of increases in both these figures. Oregon’s seasonally adjusted nonfarm payroll employment was flat in May, following a gain of 5,500 (as revised) in April. Government added 6,800 jobs in May at a time of year when a gain of 3,700 is expected due to seasonality. The addition of 4,451 intermittent Census workers boosted both federal government and total government for May, adding to the 1,952 already working for the Census in April. In the private sector, several major industries posted job declines, while only two major industries produced substantial seasonally adjusted job gains: construction and manufacturing. Construction posted its third consecutive seasonally adjusted job gain. It added 1,700 jobs at a time of year when a gain of 1,200 is the normal seasonal movement. Construction employment stood at 64,200 jobs in May, still well below its May 2009 tally of 73,100.
Manufacturing continued to slowly recover from its recent trough. Seasonally adjusted employment rose 700 in May and is now up 1,400 from its February trough. Over the last several months, durable goods employment continued to hover above 110,000, while nondurable goods steadied slightly below 50,000. Trade, transportation, and utilities normally gains 1,700 jobs due to seasonal factors in May, so this May’s flat employment trend was 1,700 below normal seasonal expectations. Retail trade contributed most of the dismal performance as it added only 300 jobs during the normally rapidly growing spring month of May.
Financial activities gave back its April gains, dropping 800 jobs in May. The industry fell below 93,000 for only the second month in more than 12 years. Professional and business services added only 100 jobs in May when a gain of 800 is the normal seasonal movement. The industry is now close to its December employment level after showing modest gains during the first part of the year.
Educational and health services dropped 1,900 jobs in May, when it normally would drop by only 1,300 for the month. Despite the one-month decline there have been solid long-term gains. Over the past 12 months, health care and social assistance added 1,300 jobs.

6 Oregon Employment Department Workforce Analysis Central Coast Trends July 2010
(by place of residence)
Change From Change From May April May April May
2010 2010 2009 2010 2009Civilian labor force 23,247 23,060 23,118 187 129 Unemployed 2,329 2,430 2,371 -101 -42 Unemployment rate 10.0% 10.5% 10.3% -0.5 -0.3 Unemployment rate, seasonally adjusted 10.8% 10.6% 11.2% 0.2 -0.4 Total Employment 20,918 20,630 20,747 288 171
LINCOLN COUNTY NONFARM PAYROLL EMPLOYMENT(by place of work)
May April May April May
TOTAL NONFARM PAYROLL EMPLOYMENT 2010 2010 2009 2010 2009
Total nonfarm 17,660 17,260 17,820 400 -160Total nonfarm, seasonally adjusted 17,570 17,440 17,730 130 -160
TOTAL PRIVATE 13,470 13,220 13,550 250 -80 Mining and Logging 150 160 130 -10 20 Construction 640 680 800 -40 -160 Manufacturing 1,040 1,030 1,060 10 -20 Durable Goods 200 200 210 0 -10 Nondurable Goods 840 830 850 10 -10 Food Manufacturing 300 290 280 10 20 Trade, Transportation, and Utilities 3,150 3,100 3,210 50 -60 Retail Trade 2,710 2,680 2,720 30 -10 Food and Beverage Stores 660 650 700 10 -40 Transportation, Warehousing, and Utilities 260 250 320 10 -60 Information 170 170 180 0 -10 Financial Activities 840 830 840 10 0 Professional and Business Services 900 890 840 10 60 Educational and Health Services 1,860 1,870 1,850 -10 10 Leisure and Hospitality 4,100 3,880 4,040 220 60 Accommodation and Food Services 3,830 3,630 3,830 200 0 Accommodation 1,750 1,630 1,680 120 70 Food Services and Drinking Places 2,080 2,000 2,150 80 -70 Other Services 620 610 600 10 20 GOVERNMENT 4,190 4,040 4,270 150 -80 Federal Government 380 290 310 90 70 State Government 780 750 810 30 -30 Local Government 3,030 3,000 3,150 30 -120 Indian tribal 1,000 1,010 1,030 -10 -30 Local Education 790 760 880 30 -90 Local Government, excluding Education and Tribal 1,240 1,230 1,240 10 0LABOR-MANAGEMENT DISPUTES 0 0 0 0 0
LINCOLN COUNTY CURRENT LABOR FORCE AND INDUSTRY EMPLOYMENT
-Change from-
Labor Force Status: Civilian labor force includes employed and unemployed individuals 16 years and older by place of residence. Employed includes nonfarm payroll employment, self-employed, unpaid family workers, domestics, agriculture, and labor disputants. Unemployment rate is calculated by dividing unemployed by civilian labor force.Nonfarm Payroll Employment: Data are by place of work and cover full- and part-time employees who worked or received pay for the pay period that includes the 12th of the month. The data exclude the self-employed, volunteers, unpaid family workers, and domestics.
The most recent month is preliminary, the prior month is revised. Prepared by the Oregon Employment Department in cooperation with the U.S. Department of Labor, Bureau of Labor Statistics.

Oregon Employment Department Workforce Analysis 7 Central Coast Trends July 2010
May 2010 April 2010 May 2009
United States 9.7 9.9 9.4
State of Oregon 10.6 10.6 11.6
Metropolitan Statistical Areas:Bend (Deschutes County) 14.7 14.0 16.1Corvallis (Benton County) 7.0 7.4 8.2Eugene-Springfield (Lane County) 10.7 10.9 12.8Medford (Jackson County) 12.3 12.3 13.2Portland-Vancouver-Hillsboro (2) 10.3 10.4 10.9Salem (Marion and Polk counties) 10.8 10.4 11.3
Counties (1):Baker 10.1 9.6 11.5Benton 7.0 7.4 8.2Clackamas 10.1 10.0 10.6Clatsop (3) 9.5 9.4 9.5Columbia 12.0 12.5 14.0Coos (3) 12.9 12.4 14.1Crook (3) 17.0 16.5 19.2Curry (3) 13.3 12.9 14.6Deschutes 14.7 14.0 16.1Douglas (3) 14.0 13.9 16.5Gilliam 7.4 7.0 8.1Grant 12.7 12.8 13.3Harney 15.7 15.0 16.9Hood River (3) 7.9 8.2 8.7Jackson 12.3 12.3 13.2Jefferson 14.2 13.9 15.5Josephine (3) 14.5 14.0 15.4Klamath (3) 13.3 12.9 14.7Lake 13.5 12.5 12.2Lane 10.7 10.9 12.8Lincoln 10.8 10.6 11.2Linn (3) 13.2 12.9 14.6Malheur (3) 11.0 9.6 10.6Marion 11.1 10.9 11.7Morrow (3) 9.4 9.5 13.0Multnomah 9.8 9.8 10.7Polk 9.1 8.9 9.7Sherman 9.2 9.2 8.5Tillamook 9.1 9.6 10.1Umatilla (3) 10.0 9.9 10.5Union (3) 9.8 10.3 12.2Wallowa 11.7 11.4 12.3Wasco (3) 8.9 9.3 10.2Washington 9.0 8.8 9.9Wheeler 9.9 9.9 9.4Yamhill 11.0 10.7 12.2
(3) This county is in a micropolitan statistical area. Malheur County is part of the Ontario micropolitan statistical area, which also includes Payette County, Idaho. Morrow and Umatilla counties combine to form the Pendleton-Hermiston micropolitan statistical area.
Oregon Seasonally Adjusted Unemployment Rates by Area (1)
(1) Seasonally adjusted rates for areas other than the United States and Oregon are not official Bureau of Labor Statistics series.
(2) Portland-Vancouver-Hillsboro MSA includes Clackamas, Columbia, Multnomah, Washington, and Yamhill counties in Oregon and Clark and Skamania counties in Washington.


July 2010
Central and South Central Oregon May 2010 Employment
The seasonally adjusted unemployment rates increased in all five counties in Central and South Central Oregon in May. The state rate remained unchanged at 10.6 percent for the month. Region 10 Crook County The county’s seasonally adjusted unemployment rate was 17.0 percent in May, up 0.5 percentage point from April’s revised rate of 16.5 percent. One year ago, the rate was 19.2 percent. The county added 110 jobs in May, which is typical for this time of year. Only two private-sector industries added jobs in May: leisure and hospitality (+20) and education and health services (+10).
Federal government added 50 jobs and local government added 40 jobs. The county recorded 180 fewer jobs this May than in May 2009. The industry with the largest year-over-year loss was wood product manufacturing (-15.2%), followed by construction (-13.0%) and wholesale trade (-12.1%). Four private-sector industries have experienced employment growth over the year: education and health services (10.9%); transportation, warehousing, and utilities (5.3%); retail trade (2.1%); and leisure and hospitality (1.8%).
Economic Indicators
Unemployment Rates
Seas. Adj. Raw United States May 2010 9.7% 9.3% April 2010 9.9% 9.5%
Oregon May 2010 10.6% 10.4% April 2010 10.6% 10.7%
Crook May 2010 17.0% 15.9% April 2010 16.5% 17.1%
Deschutes (Bend MSA) May 2010 14.7% 13.7% April 2010 14.0% 14.2%
Jefferson May 2010 14.2% 13.0% April 2010 13.9% 14.4%
Klamath May 2010 13.3% 12.2% April 2010 12.9% 13.2%
Lake May 2010 13.5% 12.6% April 2010 12.5% 13.4% Consumer Price Index (CPI) 1982-1984 = 100 All Urban Consumers
United States May 2010 218.2 April 2010 218.0 May 2009 213.9 Year % change 2.0%
Portland-Salem, OR-WA MSA July – Dec. 2009 212.0 % Change 0.7%
http://www.bls.gov/cpi
Online version available Are you interested in receiving an e-mail notice when Central Oregon Local Labor Trends is available to view or download? If so, visit http://listsmart.osl.state.or.us/mailman/listinfo/local-trends-co and follow the sign-up instructions.

2 Oregon Employment Department Workforce Analysis Central Oregon Labor Trends July 2010
Deschutes County (Bend MSA) The county’s seasonally adjusted unemployment rate climbed 0.7 percentage point over the month to reach 14.7 percent in May. In May 2009, the rate was 16.1 percent. The county added 250 jobs in May. The county typically adds approximately 1,100 jobs this time of year. Four private-sector industries added jobs in May: professional and business services (+140); accommodation and food services (+140); mining, logging, and construction (+60); and other services (+10). Retail trade lost 150 jobs in May. Government added 180 jobs in May. Since May 2009, the county lost approximately 1,730 jobs (-2.8%). The largest percentage losses in the private sector occurred in durable goods manufacturing (-15.6%); logging, mining, and construction (-13.7%); and transportation, warehousing, and utilities (-8.6%). Three private-sector industries showed employment growth over the year: leisure and hospitality (3.8%); other services (2.4%); and financial activities (0.2%). Government showed a year-over-year employment loss of 2.6 percent. Jefferson County The county’s seasonally adjusted unemployment rate was 14.2 percent in May, up 0.3 percentage point from April’s revised rate of 13.9 percent. One year ago, the rate was 15.5 percent. Jefferson County added 160 jobs in May. Three private-sector industries added jobs last month: leisure and hospitality (+40); wood product manufacturing (+20); and other services (+10). Government added 80 jobs in May.
0%
5%
10%
15%
20%
25%
May-04 Nov-04 May-05 Nov-05 May-06 Nov-06 May-07 Nov-07 May-08 Nov-08 May-09 Nov-09 May-10
Oregon and Central Oregon Unemployment Rates May 2004 - May 2010 (seasonally adjusted)
OregonCrookDeschutesJefferson
Central Oregon Labor Trends is published by the Workforce and Economic Research Division of the Oregon Employment Department. Central Oregon Labor Trends also can be found on the Publications page at www.QualityInfo.org. Material contained in this publication is in the public domain and may be reproduced without permission. Please credit Central Oregon Labor Trends, Oregon Employment Department.
Laurie Warner, Director Graham Slater, Administrator for Workforce and Economic Research Carolyn Eagan, Regional Economist Jan Swander, Workforce Analyst Bend (541) 388-6076 Randal Norris, Field Office Manager Klamath Falls (541) 883-5630 Laurel Werhane, Field Office Manager Bend (541) 388-6070 Redmond (541) 548-8196 Madras (541) 475-2382 Prineville (541) 447-8076
Please direct address changes to: Oregon Employment Department Workforce and Economic Research 875 Union St NE Salem OR 97311 Phone (503) 947-1204 TDD (503) 947-1391 e-mail [email protected] The Oregon Employment Department is an equal opportunity employer. Auxiliary aids and services are available upon request to individuals with disabilities.

Oregon Employment Department Workforce Analysis 3 Central Oregon Labor Trends July 2010
The county recorded year-over-year job growth in May (0.5%); it was the third month in a row that the county gained jobs over the year. The largest gain was in wood product manufacturing (12.0%). Industries with year-over-year losses were professional and business services (-12.5%); education and health services (-10.3%); and financial activities (-5.9%). Government employment was down over the year by 1.1 percent. Region 11 Klamath County The county’s seasonally adjusted unemployment rate was 13.3 percent in May, up 0.4 percentage point from April’s rate of 12.9 percent. One year ago in May the rate was 14.7 percent. The county added 510 jobs in May, which is typical for this time of year. Eight private-sector industries added jobs in May: leisure and hospitality (+170); construction (+50); manufacturing (+30); transportation, warehousing, and utilities (+30); retail trade (+30); other services (+10); and professional and business services (+10). Three private-sector industries reported job losses in May: wholesale trade (-20); information (-20); and financial activities (-10). Klamath County’s total employment was down over the year again in May, with 410 fewer jobs compared to May 2009. The industry with the largest over-the-year decline was leisure and hospitality (-10.5%), followed by nondurable goods manufacturing (-8.0%). Government also lost employment in the last year (-1.2%). Lake County The county’s seasonally adjusted unemployment rate was 13.5 percent in May, up 1.0 percentage point from April’s revised rate of 12.5 percent. In May 2009, the rate was 12.2 percent. Overall the county added 70 jobs last month. Of those 70 jobs, 50 were added in the public sector. Lake County saw an over-the-year increase in employment (1.4%). This was the third month in a row with a year-over-year increase in employment. The private-sector growth was 1.9 percent and the public-sector growth was 0.9 percent. Oregon Employment Oregon’s seasonally adjusted unemployment rate was 10.6 percent in May, the same as in March and April. The rate has been essentially unchanged for the most recent seven months. Oregon’s
0%
2%
4%
6%
8%
10%
12%
14%
16%
May-04 Nov-04 May-05 Nov-05 May-06 Nov-06 May-07 Nov-07 May-08 Nov-08 May-09 Nov-09 May-10
Oregon and South Central Oregon Unemployment Rates May 2004 - May 2010 (seasonally adjusted)
Oregon
Klamath
Lake

4 Oregon Employment Department Workforce Analysis Central Oregon Labor Trends July 2010
unemployment rate was 11.6 percent in May 2009, which tied June 2009 as Oregon’s highest unemployment rate since the early 1980s. The U.S. seasonally adjusted unemployment rate dropped to 9.7 percent in May from 9.9 percent in April.
In May, 202,944 Oregonians were unemployed. In May 2009, 223,474 Oregonians were unemployed. In seasonally adjusted terms, both Oregon’s civilian labor force and its number of citizens employed increased modestly in May. This marked the fifth consecutive month of increases in both these figures. Oregon’s seasonally adjusted nonfarm payroll employment was flat in May, following a gain of 5,500 (as revised) in April. Government added 6,800 jobs in May at a time of year when a gain of 3,700 is expected due to seasonality. The addition of 4,451 intermittent Census workers boosted both federal government and total government for May, adding to the 1,952 already working for the Census in April. In the private sector, several major industries posted job declines, while only two major industries produced substantial seasonally adjusted job gains: construction and manufacturing. Construction posted its third consecutive seasonally adjusted job gain. It added 1,700 jobs at a time of year when a gain of 1,200 is the normal seasonal movement. Construction employment stood at 64,200 jobs in May, still well below its May 2009 tally of 73,100.
Manufacturing continued to slowly recover from its recent trough. Seasonally adjusted employment rose 700 in May and is now up 1,400 from its February trough. Over the last several months, durable goods employment continued to hover above 110,000, while nondurable goods steadied slightly below 50,000. Trade, transportation, and utilities normally gains 1,700 jobs due to seasonal factors in May, so this May’s flat employment trend was 1,700 below normal seasonal expectations. Retail trade contributed most of the dismal performance as it added only 300 jobs during the normally rapidly growing spring month of May.
Financial activities gave back its April gains, dropping 800 jobs in May. The industry fell below 93,000 for only the second month in more than 12 years. National Employment The number of unemployed persons was 15.0 million in May. The unemployment rate edged down to 9.7 percent, the same rate as in the first three months of 2010. Nonfarm payroll employment increased by 431,000 in May, reflecting the addition of 411,000 temporary workers for Census 2010. Total private employment showed little change over the month
0%
2%
3%
5%
7%
9%
10%
12%
May-04 Nov-04 May-05 Nov-05 May-06 Nov-06 May-07 Nov-07 May-08 Nov-08 May-09 Nov-09 May-10
Oregon and U.S. Unemployment Rates May 2004 - May 2010 (seasonally adjusted)
U.S.
Oregon

Oregon Employment Department Workforce Analysis 5 Central Oregon Labor Trends July 2010
(+41,000), following increases in March and April. In May, manufacturing, temporary help services, and mining added jobs, while employment in construction declined. Manufacturing employment increased by 29,000 over the month. Factory employment rose by 126,000 over the past five months. Within manufacturing, both fabricated metals and machinery added jobs in May. Temporary help services added 31,000 jobs over the month; employment in the industry rose by 362,000 since September 2009. Employment in mining continued to increase in May, with a gain of 10,000. Support activities for mining accounted for 8,000 of the over-the-month increase. Since October 2009, mining employment expanded by 50,000. Health care employment was little changed in May (+8,000). Over the prior 12 months, health care employment increased by an average of 20,000 per month. In May, employment in construction declined by 35,000, largely offsetting industry gains in the prior two months. May's job loss was spread throughout the sector. Employment in other private-sector industries, including wholesale trade, retail trade, transportation and warehousing, information, financial activities, and leisure and hospitality showed little or no change in May. Government employment rose by 390,000 in May. The federal government hired 411,000 temporary workers for Census 2010, bringing total temporary census staffing during the payroll survey reference period to 564,000. Employment in state government excluding education decreased by 13,000. Jefferson County: Central Oregon’s Shining Star Between April 2009 and April 2010, nine of Oregon’s 36 counties showed year-over-year job growth. All were rural counties. During the same period, all of the metro areas in the state lost at least 1.0 percent of their jobs, with one metro area (Corvallis) having a 3.7 percent job loss over the year. Jefferson County was one of the nine counties to show job growth. Although the county had very small year-over-year job growth in April, adding just 20 jobs (0.4%), it was the second month in a row that the county showed annual job gains. In March, the county added 80 jobs. This begs the question: What is going on in Jefferson County? Between March 2009 and March 2010, Jefferson County added 80 jobs; 70 were in the private sector. More than 70 percent (50 jobs) were in wood product manufacturing. The other 30 were split between retail trade and transportation, warehousing, and utilities. Between April 2009 and April 2010, the county added 20 jobs. The private sector added 110 jobs, while the public sector lost 90 jobs. In the private sector, manufacturing added 90 jobs, 80 of which were in wood product manufacturing.

6 Oregon Employment Department Workforce Analysis Central Oregon Labor Trends July 2010
According to the Madras-Jefferson County Chamber of Commerce director, 33 new businesses opened in the last 18 months. More than 60 percent of those businesses have employees in addition to the business owners. The new businesses represent a variety of industries from accommodation and food services to financial activities. What is perhaps more exciting is the recent increase in activity at Jefferson County wood product manufacturers. According to both state and regional economic development organizations, orders are up at the local plants and there are more trucks bringing raw material in. One reason is the earthquake that occurred in Chile, another is the increased demand for locally produced goods across the county and region. At its pre-recession height in Jefferson County, manufacturing employed 1,730 people, 1,140 of whom worked in wood product manufacturing. In April 2010, the county had 820 jobs in manufacturing, with 540 jobs in wood product manufacturing. The pre-recession job level may never be seen again in Jefferson County, as local manufacturers have taken advantage of the recent downtime to bring new machinery into the plants. The machinery increases productivity but also decreases the need for labor. But the recent employment gains across all industries are a bright spot for a region that was hit very hard by the recent recession. Happenings in Central and South Central Oregon The following information is from published nonconfidential sources.
Crook County
Hearing Specialists of America opened in Prineville. Central Oregonian, 5-19-10
Urban G!rl, a fashion accessory store, opened in Prineville. Central Oregonian, 6-9-10
Deschutes County (Bend MSA)
Wonderland Toy Shoppe opened in Bend’s Old Mill District. Cascade Business News, 5-19-10
Deschutes County laid off five people due to a closure of a portion of its juvenile facility. Bend Bulletin, 5-8-10
Spotted Mule Saddlery and Western Wear in Bend will close. Bend Bulletin, 6-5-10
Back Door Studios, a tattoo parlor, opened in Redmond. Redmond Spokesman, 6-2-10
0
200
400
600
800
1,000
1,200
1,400
Jan-00 Jan-01 Jan-02 Jan-03 Jan-04 Jan-05 Jan-06 Jan-07 Jan-08 Jan-09 Jan-10
Wood Product Manufacturing Employment in Jefferson County January 2000 - April 2010
Graph 1

Oregon Employment Department Workforce Analysis 7 Central Oregon Labor Trends July 2010
The Lodge Restaurant opened at Black Butte Ranch. The Nugget, 5-18-10
BendBroadband is planning to develop a data center in Bend. It will be completed in three phases over an eight-year period and will provide at least five new full-time jobs. Bend Bulletin, 6-5-10
Mele Ohana Café, a Hawaiian-style café, will open in Redmond. Redmond Spokesman, 6-16-10
Epic Air in Bend has reopened. It employs 16 people and plans to add more workers later this year. Bend Bulletin, 6-10-10
Baked, an afternoon and evening bakery, opened in Bend. Bend Bulletin, 6-11-10
Camp RV Trailer Rentals Inc. opened in Sisters. The Nugget, 6-8-10
Jefferson County None Reported Klamath County
Klamath County will lay off 30 employees due to budget shortfalls. Herald and News, 5-20-10
Construction will begin in September on Sanford Health Foundation, a pediatric clinic in Klamath Falls. It will employ 30 to 40 people, including four pediatricians. Herald and News, 6-11-10
Lake County
Sunshine Center, a day care in Lakeview closed. Lake County Examiner, 6-2-10

8 Oregon Employment Department Workforce Analysis Central Oregon Labor Trends July 2010
Change From Change FromMay Apr. May Apr. May
2010 2010 2009 2010 2009Labor Force Status (Household Data)Civilian labor force 9,149 9,260 9,495 -111 -346 Unemployed 1,451 1,581 1,694 -130 -243 Unemployment rate 15.9% 17.1% 17.8% XX XX Unemployment rate, seasonally adjusted 17.0% 16.5% 19.2% XX XX Employed 7698 7679 7801 19 -103
Nonfarm Payroll Employment (Establishment Data)Total nonfarm payroll employment 5,590 5,480 5,770 110 -180 Total private 4,270 4,250 4,400 20 -130 Mining and logging 60 60 60 0 0 Construction 200 200 230 0 -30 Manufacturing 680 680 800 0 -120 Wood product manufacturing 560 560 660 0 -100 Trade, transportation, and utilities 1,400 1,400 1,440 0 -40 Wholesale trade 510 510 580 0 -70 Retail trade 490 490 480 0 10 Transportation, warehousing, and utilities 400 400 380 0 20 Information 30 30 30 0 0 Financial activities 240 240 240 0 0 Professional and business services 230 230 240 0 -10 Educational and health services 710 700 640 10 70 Leisure and hospitality 560 540 550 20 10 Other services 160 170 170 -10 -10 Government 1,320 1,230 1,370 90 -50 Federal government 350 300 340 50 10 State government 200 200 200 0 0 Local government 770 730 830 40 -60Labor-management disputes 0 0 0 0 0
Change From Change FromMay Apr. May Apr. May
2010 2010 2009 2010 2009Labor Force Status (Household Data)Civilian labor force 79,317 79,962 81,422 -645 -2,105 Unemployed 10,885 11,319 12,107 -434 -1,222 Unemployment rate 13.7% 14.2% 14.9% XX XX Unemployment rate, seasonally adjusted 14.7% 14.0% 16.1% XX XX Employed 68,432 68,643 69,315 -211 -883
Nonfarm Payroll Employment (Establishment Data)Total nonfarm payroll employment 60,230 59,980 61,960 250 -1,730 Total private 51,150 51,080 52,640 70 -1,490 Mining, logging, and construction 3,460 3,400 4,010 60 -550 Manufacturing 3,510 3,510 3,960 0 -450 Durable goods 2,710 2,710 3,210 0 -500 Trade, transportation, and utilities 11,520 11,670 11,870 -150 -350 Wholesale trade 1,540 1,540 1,580 0 -40 Retail trade 8,920 9,070 9,130 -150 -210 Transportation, warehousing, and utilities 1,060 1,060 1,160 0 -100 Information 1,380 1,380 1,400 0 -20 Financial activities 4,520 4,520 4,510 0 10 Professional and business services 6,470 6,330 6,860 140 -390 Educational and health services 8,970 8,970 9,100 0 -130 Leisure and hospitality 9,180 9,170 8,840 10 340 Accommodation and food services 6,900 6,760 7,130 140 -230 Other services 2,140 2,130 2,090 10 50 Government 9,080 8,900 9,320 180 -240 Federal government 990 960 960 30 30 State government 1,200 1,190 1,210 10 -10 Local government 6,890 6,750 7,150 140 -260 Local education 4,040 3,980 4,310 60 -270Labor-management disputes 0 0 0 0 0
The most recent month is preliminary, the prior month is revised. Prepared in cooperation with the U.S. Department of Labor, Bureau of Labor Statistics.
Labor Force Status: Civilian labor force includes employed and unemployed individuals 16 years and older by place of residence. Employed includes nonfarm payroll employment, self-employed, unpaid family workers, domestics, agriculture, and labor disputants. Unemployment rate is calculated by dividing unemployed by civilian labor force.
Crook County Current Labor Force and Industry Employment
Deschutes County (Bend MSA) Current Labor Force and Industry Employment
Nonfarm Payroll Employment: Data are by place of work and cover full- and part-time employees who worked or received pay for the pay period that includes the 12th of the month. The data exclude the self-employed, volunteers, unpaid family workers, and domestics. "Natural resources" includes only Logging (NAICS 1133).

Oregon Employment Department Workforce Analysis 9 Central Oregon Labor Trends July 2010
Change From Change FromMay Apr. May Apr. May
2010 2010 2009 2010 2009Labor Force Status (Household Data)Civilian labor force 9,476 9,240 9,483 236 -7 Unemployed 1,230 1,330 1,340 -100 -110 Unemployment rate 13.0% 14.4% 14.1% XX XX Unemployment rate, seasonally adjusted 14.2% 13.9% 15.5% XX XX Employed 8,246 7,910 8,143 336 103
Nonfarm Payroll Employment (Establishment Data)Total nonfarm payroll employment 5,710 5,550 5,680 160 30 Total private 3,040 2,960 2,980 80 60 Mining and logging 20 20 20 0 0 Construction 100 100 100 0 0 Manufacturing 850 820 780 30 70 Wood product manufacturing 560 540 500 20 60 Trade, transportation, and utilities 830 830 810 0 20 Wholesale trade 220 220 220 0 0 Retail trade 490 490 480 0 10 Transportation, warehousing, and utilities 120 120 110 0 10 Information 20 20 20 0 0 Financial activities 160 160 170 0 -10 Professional and business services 140 140 160 0 -20 Educational and health services 260 260 290 0 -30 Leisure and hospitality 480 440 450 40 30 Other services 180 170 180 10 0 Government 2,670 2,590 2,700 80 -30 Federal government 180 140 170 40 10 State government 340 340 350 0 -10 Local government 2,150 2,110 2,180 40 -30 Indian tribal 920 920 910 0 10Labor-management disputes 0 0 0 0 0
The most recent month is preliminary, the prior month is revised. Prepared in cooperation with the U.S. Department of Labor, Bureau of Labor Statistics.
Jefferson County Current Labor Force and Industry Employment
Labor Force Status: Civilian labor force includes employed and unemployed individuals 16 years and older by place of residence. Employed includes nonfarm payroll employment, self-employed, unpaid family workers, domestics, agriculture, and labor disputants. Unemployment rate is calculated by dividing unemployed by civilian labor force.
Nonfarm Payroll Employment: Data are by place of work and cover full- and part-time employees who worked or received pay for the pay period that includes the 12th of the month. The data exclude the self-employed, volunteers, unpaid family workers, and domestics. "Natural resources" includes only Logging (NAICS 1133).

10 Oregon Employment Department Workforce Analysis Central Oregon Labor Trends July 2010
Change From Change FromMay Apr. May Apr. May
2010 2010 2009 2010 2009Labor Force Status (Household Data)Civilian labor force 31,071 30,834 31,544 237 -473 Unemployed 3,781 4,061 4,226 -280 -445 Unemployment rate 12.2% 13.2% 13.4% XX XX Unemployment rate, seasonally adjusted 13.3% 12.9% 14.7% XX XX Employed 27,290 26,773 27,318 517 -28
Nonfarm Payroll Employment (Establishment Data)Total nonfarm payroll employment 22,110 21,600 22,520 510 -410 Total private 16,310 16,010 16,650 300 -340 Mining and logging 130 110 110 20 20 Construction 810 760 860 50 -50 Manufacturing 1,760 1,730 1,720 30 40 Durable goods 1,530 1,500 1,470 30 60 Wood product manufacturing 1,000 970 940 30 60 Nondurable goods 230 230 250 0 -20 Trade, transportation, and utilities 4,370 4,330 4,460 40 -90 Wholesale trade 820 840 870 -20 -50 Retail trade 2,860 2,830 2,900 30 -40 Food and beverage stores 580 580 560 0 20 General merchandise stores 820 820 860 0 -40 Transportation, warehousing, and utilities 690 660 690 30 0 Information 180 200 190 -20 -10 Financial activities 900 910 930 -10 -30 Professional and business services 2,020 2,010 2,000 10 20 Educational and health services 3,130 3,130 3,080 0 50 Leisure and hospitality 2,310 2,140 2,580 170 -270 Other services 700 690 720 10 -20 Government 5,800 5,590 5,870 210 -70 Federal government 1,030 910 980 120 50 State government 1,630 1,590 1,550 40 80 Local government 3,140 3,090 3,340 50 -200 Local education 1,640 1,620 1,750 20 -110Labor-management disputes 0 0 0 0 0
Change From Change FromMay Apr. May Apr. May
2010 2010 2009 2010 2009Labor Force Status (Household Data)Civilian labor force 3,750 3,725 3,575 25 175 Unemployed 472 499 406 -27 66 Unemployment rate 12.6% 13.4% 11.4% XX XX Unemployment rate, seasonally adjusted 13.5% 12.5% 12.2% XX XX Employed 3,278 3,226 3,169 52 109
Nonfarm Payroll Employment (Establishment Data)Total nonfarm payroll employment 2,140 2,070 2,110 70 30 Total private 1,070 1,050 1,050 20 20 Mining and logging 20 20 30 0 -10 Construction 50 40 50 10 0 Manufacturing 250 250 220 0 30 Trade, transportation, and utilities 320 320 300 0 20 Retail trade 250 240 230 10 20 Information 20 20 20 0 0 Financial activities 60 60 60 0 0 Professional and business services 60 60 60 0 0 Educational and health services 80 80 100 0 -20 Leisure and hospitality 170 160 170 10 0 Other services 40 40 40 0 0 Government 1,070 1,020 1,060 50 10 Federal government 280 250 280 30 0 State government 190 190 190 0 0 Local government 600 580 590 20 10Labor-management disputes 0 0 0 0 0
The most recent month is preliminary, the prior month is revised. Prepared in cooperation with the U.S. Department of Labor, Bureau of Labor Statistics.
Nonfarm Payroll Employment: Data are by place of work and cover full- and part-time employees who worked or received pay for the pay period that includes the 12th of the month. The data exclude the self-employed, volunteers, unpaid family workers, and domestics. "Natural resources" includes only Logging (NAICS 1133).
Labor Force Status: Civilian labor force includes employed and unemployed individuals 16 years and older by place of residence. Employed includes nonfarm payroll employment, self-employed, unpaid family workers, domestics, agriculture, and labor disputants. Unemployment rate is calculated by dividing unemployed by civilian labor force.
Klamath County Current Labor Force and Industry Employment
Lake County Current Labor Force and Industry Employment

July 2010
Latest Local Area Employment Data
Douglas County’s unemployment rate was essentially unchanged at 14.0 percent in May compared to a revised 13.9 percent in April. The rate this May was 2.5 percentage points lower than the 16.5 percent recorded in May 2009. The unadjusted rate was 13.5 percent in May 2010. Douglas County has the sixth highest seasonally adjusted county unemployment rate in the state. The number of unemployed, at 6,307, dropped 405 from April and was 1,118 lower than during May 2009. Nonfarm Payroll Employment In May, total nonfarm payroll employment increased 400, when an increase of 370 was expected on a seasonal basis. Total nonfarm employment was 30 higher than in May of last year, a gain of 0.1 percent. Manufacturing increased by 50 in May. In durable goods manufacturing, wood products added 40, while other durable goods held steady. Nondurable goods manufacturing added 10.
Economic Indicators Unemployment Rates
Seasonally Douglas Raw Adjusted April 2010 14.3% 13.9% May 2010 13.5% 14.0% Oregon April 2010 10.7% 10.6% May 2010 10.4% 10.6% United States April 2010 9.5% 9.9% May 2010 9.3% 9.7%
Nonfarm Payroll Employment
May 2010 Douglas Total 34,890 Wood Product Mfg. 2,940 Other Mfg. 1,300 Construction 1,160 Trade 4,740 Information 290 Financial Activities 1,360 Additional Services 11,710 Government 8,980
Consumer Price Index (CPI)
1982-1984 = 100 All Urban Consumers
United States May 2010 218.178 Year change 2.0%
Portland-Salem MSA July – Dec. 2009 217.191 Year Change 0.5% Jan. – June 2010 available 8/13/10
http://www.bls.gov/cpi
0
2
4
6
8
10
12
14
16
18
May-05 May-06 May-07 May-08 May-09 May-10
Pe
rce
nt
Seasonally Adjusted Unemployment Rates
Oregon Douglas County

2 Oregon Employment Department Workforce Analysis Douglas County Trends July 2010
In May, the private nonmanufacturing sectors had were seasonal gains in mining and logging (+20), construction (+50), and leisure and hospitality (+80). Elsewhere, there were gains in retail trade (+10); transportation, warehousing, and utilities (+10); financial activities (+10); professional and business services (+100); and private education and health services (+20). Government added 50 jobs in May. Federal government gained 150, helped by the addition of Census workers. State government increased by 10. Local government dropped 110 due to a loss of 140 in local education that was countered by a gain of 30 in other local government. Around the County Cascade Community Credit Union opened in Sutherlin. -The News-Review (Roseburg, OR) 06/06/10 Toketee Falls Elementary School in Idleyld Park, Douglas County’s last one room school house, has closed due to expected state budget cuts. -The News-Review (Roseburg, OR) 06/06/10 Douglas County Commissioners have awarded $1.7 million in federal Title III money for forest related projects. The largest grant went to The Douglas County’s sheriff office for equipment, salaries and administrative costs for search and rescue projects. The second largest sum went to the Douglas Forest Protective Association and its county youth work program, which reduces hazardous fuels on federal forest lands. -The News-Review (Roseburg, OR) 06/07/10 The new Roseburg Costco store is scheduled to open August 12. As of June 9, 3,000 applications had been received for the 100 jobs that will be filled locally. Another 50 to 60 positions will be filled via transfers or promotions from within the Costco system. -The News-Review (Roseburg, OR) 06/10/10
(3,500)
(3,000)
(2,500)
(2,000)
(1,500)
(1,000)
(500)
0
500
1,000
May-05 Nov-05 May-06 Nov-06 May-07 Nov-07 May-08 Nov-08 May-09 Nov-09 May-10
Douglas County: Employment Change from Previous YearMay 2005 to May 2010
Douglas County Labor Trends is published by the Workforce and Economic Research Division of the Oregon Employment Department. Douglas County Labor Trends also can be found on the Publications page at www.QualityInfo.org. Material contained in this publication is in the public domain and may be reproduced without permission. Please credit Douglas County Labor Trends, Oregon Employment Department.
Laurie Warner, Director Graham Slater, Administrator for Workforce and Economic Research Brian Rooney, Regional Economist Rob Abbott, Workforce Analyst Roseburg (541) 440-3344 x222 Debbie Fitchett, Field Office Manager Roseburg (541) 440-3344
Please direct address changes to: Oregon Employment Department Workforce and Economic Research 875 Union St NE Salem OR 97311 Phone (503) 947-1204 TDD (503) 947-1391 e-mail [email protected] The Oregon Employment Department is an equal opportunity employer. Auxiliary aids and services are available upon request to individuals with disabilities.

Oregon Employment Department Workforce Analysis 3 Douglas County Trends July 2010
Douglas County’s elected surveyor has announced he will resign rather than lay off one of his employees in a new round of county budget cuts. -The News-Review (Roseburg, OR) 06/11/10 Elite Taxi and Limousine service opened in Roseburg. It employs seven and plans to expand to up to 12 workers. -The News-Review (Roseburg, OR) 06/11/10 McFarland Cascade has purchased the former Wilbur Pole Plant, which has been closed since December. It plans to restart the plant and employ 15. -The News-Review (Roseburg, OR) 06/17/10 Southern Oregon Goodwill has opened a new store in Roseburg. It employs three. -The News-Review (Roseburg, OR) 06/20/10 Umpqua Community Development Corp. held a ground breaking ceremony for Neu Place, a 15-unit housing complex for disabled adults in Roseburg. Local contractor RE Noah & Co. will do the construction, which is expected to begin July 1 and take about eight months. -The News-Review (Roseburg, OR) 06/20/10 Yesterday’s Treasures has opened in Winston. It sells antiques, secondhand and restored furniture, and other chic and retro items. -The News-Review (Roseburg, OR) 06/27/10 Healthy Homes Steamcleaning has opened in Roseburg. It offers carpet cleaning and stripping and waxing of hardwood floors. -The News-Review (Roseburg, OR) 06/27/10 Oregon Employment Oregon’s seasonally adjusted unemployment rate was 10.6 percent in May, the same as in March and April. The rate has been essentially unchanged for the most recent seven months. Oregon’s unemployment rate was 11.6 percent in May 2009, which tied June 2009 as Oregon’s highest unemployment rate since the early 1980s. The U.S. seasonally adjusted unemployment rate dropped to 9.7 percent in May from 9.9 percent in April.
In May, 202,944 Oregonians were unemployed. In May 2009, 223,474 Oregonians were unemployed. In seasonally adjusted terms, both
3
4
5
6
7
8
9
10
11
12
13
Jan-99 Jan-00 Jan-01 Jan-02 Jan-03 Jan-04 Jan-05 Jan-06 Jan-07 Jan-08 Jan-09 Jan-10
Seasonally Adjusted Unemployment Rates, 1999 to Present
U.S. Oregon

4 Oregon Employment Department Workforce Analysis Douglas County Trends July 2010
Oregon’s civilian labor force and its number of citizens employed increased modestly in May. This marked the fifth consecutive month of increases in both these figures. Oregon’s seasonally adjusted nonfarm payroll employment was flat in May, following a gain of 5,500 (as revised) in April. Government added 6,800 jobs in May at a time of year when a gain of 3,700 is expected due to seasonality. The addition of 4,451 intermittent Census workers boosted both federal government and total government for May, adding to the 1,952 already working for the Census in April. In the private sector, several major industries posted job declines, while only two major industries produced substantial seasonally adjusted job gains: construction and manufacturing. Construction posted its third consecutive seasonally adjusted job gain. It added 1,700 jobs at a time of year when a gain of 1,200 is the normal seasonal movement. Construction employment stood at 64,200 jobs in May, still well below its May 2009 tally of 73,100.
Manufacturing continued to slowly recover from its recent trough. Seasonally adjusted employment rose 700 in May and is now up 1,400 from its February trough. Over the last several months, durable goods employment continued to hover above 110,000, while nondurable goods steadied slightly below 50,000. Trade, transportation, and utilities normally gains 1,700 jobs due to seasonal factors in May, so this May’s flat employment trend was 1,700 below normal seasonal expectations. Retail trade contributed most of the dismal performance as it added only 300 jobs during the normally rapidly growing spring month of May.
Financial activities gave back its April gains, dropping 800 jobs in May. The industry fell below 93,000 for only the second month in more than 12 years. Professional and business services added only 100 jobs in May when a gain of 800 is the normal seasonal movement. The industry is now close to its December employment level after showing modest gains during the first part of the year.
Educational and health services dropped 1,900 jobs in May, when it normally would drop by only 1,300 for the month. Despite the one-month decline there have been solid long-term gains. Over the past 12 months, health care and social assistance added 1,300 jobs. National Employment The number of unemployed persons was 15.0 million in May. The unemployment rate edged down to 9.7 percent, the same rate as in the first three months of 2010. Nonfarm payroll employment increased by 431,000 in May, reflecting the addition of 411,000 temporary workers for Census 2010. Total private employment showed little change over the month (+41,000), following increases in March and April. In May, manufacturing, temporary help services, and mining added jobs, while employment in construction declined.

Oregon Employment Department Workforce Analysis 5 Douglas County Trends July 2010
Manufacturing employment increased by 29,000 over the month. Factory employment rose by 126,000 over the past five months. Within manufacturing, both fabricated metals and machinery added jobs in May. Temporary help services added 31,000 jobs over the month; employment in the industry rose by 362,000 since September 2009. Employment in mining continued to increase in May, with a gain of 10,000. Support activities for mining accounted for 8,000 of the over-the-month increase. Since October 2009, mining employment expanded by 50,000. Health care employment was little changed in May (+8,000). Over the prior 12 months, health care employment increased by an average of 20,000 per month. In May, employment in construction declined by 35,000, largely offsetting industry gains in the prior two months. May's job loss was spread throughout the sector. Employment in other private-sector industries, including wholesale trade, retail trade, transportation and warehousing, information, financial activities, and leisure and hospitality showed little or no change in May. Government employment rose by 390,000 in May. The federal government hired 411,000 temporary workers for Census 2010, bringing total temporary census staffing during the payroll survey reference period to 564,000. Employment in state government excluding education decreased by 13,000.

6 Oregon Employment Department Workforce Analysis Douglas County Trends July 2010
May Apr. May Apr. May2010 2010 2009 2010 2009
Civilian Labor Force 46,565 46,788 47,000 -223 -435 Unemployment 6,307 6,712 7,425 -405 -1,118 Unemployment rate 13.5% 14.3% 15.8% -0.8 -2.3 Unemployment rate, seasonally adjusted 14.0% 13.9% 16.5% 0.1 -2.5 Total Employment 40,258 40,076 39,575 182 683
DOUGLAS COUNTY NONFARM PAYROLL EMPLOYMENT(by place of work)
May Apr. May Apr. May2010 2010 2009 2010 2009
TOTAL NONFARM PAYROLL EMPLOYMENT 34,890 34,490 34,860 400 30
TOTAL PRIVATE 25,910 25,560 25,940 350 -30
Mining and Logging 810 790 750 20 60
Construction 1,160 1,110 1,250 50 -90
Manufacturing 4,240 4,190 4,170 50 70
Durable Goods 3,920 3,880 3,850 40 70
Wood Product Manufacturing 2,940 2,900 2,760 40 180
Nondurable Goods 320 310 320 10 0
Trade, Transportation, and Utilities 6,340 6,320 6,410 20 -70
Wholesale Trade 570 570 590 0 -20
Retail Trade 4,170 4,160 4,240 10 -70
Food and Beverage Stores 1,070 1,060 1,050 10 20
General Merchandise Stores 950 970 1,000 -20 -50
Transportation, Warehousing, and Utilities 1,600 1,590 1,580 10 20
Information 290 290 310 0 -20
Financial Activities 1,360 1,350 1,410 10 -50
Professional and Business Services 2,650 2,550 2,580 100 70
Educational and Health Services 4,670 4,650 4,620 20 50
Leisure and Hospitality 3,230 3,150 3,320 80 -90
Food Services and Drinking Places 2,490 2,460 2,600 30 -110
Other Services 1,160 1,160 1,120 0 40
Government 8,980 8,930 8,920 50 60
Federal Government 1,760 1,610 1,620 150 140
State Government 1,220 1,210 1,190 10 30
Local Government 6,000 6,110 6,110 -110 -110
Local Government Tribal 1,110 1,110 1,060 0 50
Local Education 3,060 3,200 3,180 -140 -120
Local Government, excluding Education 1,830 1,800 1,870 30 -40
LABOR-MANAGEMENT DISPUTES 0 0 0 0 0
The most recent month is preliminary, the prior month is revised. Prepared in cooperation with the U.S. Department of Labor, Bureau of Labor Statistics.
DOUGLAS COUNTY LABOR FORCE SUMMARY* (by place of residence)
-Change from-
Nonfarm Payroll Employment: Data are by place of work and cover full- and part-time employees who worked or received pay for the pay period that includes the 12th of the month. The data exclude the self-employed, volunteers, unpaid family workers, and domestics.
Labor Force Status: Civilian labor force includes employed and unemployed individuals 16 years and older by place of residence. Employed includes nonfarm payroll employment, self-employed, unpaid family workers, domestics, agriculture, and labor disputants. Unemployment rate is calculated by dividing unemployed by civilian labor force.
-Change from-

July 2010 Question: What are some of the highest-paying jobs in Eastern Oregon? Answer: Managers and pharmacists are at or near the top of the pay scale in both Northeast Oregon and Southeast Oregon. Question: How do we know this? Answer: We learn about occupational wages by reviewing the Oregon Employment Department’s latest publication, 2010 Oregon Wage Information. That’s right; our annual summary of occupational wage data in Oregon and the 15 workforce regions within Oregon is now available with estimates for 2010. We gather occupational wage information from employers across the state on an ongoing basis. Once per year, we summarize and publish that wage information for all occupations meeting certain minimum statistical criteria. Using the 2010 Oregon Wage Information book, one can find average annual wages for more than 650 job categories in Oregon’s labor market. In the 2010 edition, we were able to publish wage data for 141 occupations in Northeast Oregon’s Baker, Union, and Wallowa counties and 124 occupations in Southeast Oregon’s Grant, Harney, and Malheur counties. Table 1 and Table 2 on the next page offer a peek at the highest-paying occupations in Northeast Oregon and Southeast Oregon. Keep in mind that there may be other jobs or self-employed individuals with salaries even greater than those shown on these tables; we publish statistics only for those occupations with reliable survey results. The complete 2010 Oregon Wage Information book is available from your local Oregon Employment Department office or from our labor market information website, www.QualityInfo.org.
Economic Indicators
Unemployment Rates
May 2010
Baker County 8.8% seasonally adjusted 10.1% Grant County 12.6% seasonally adjusted 12.7% Harney County 14.3% seasonally adjusted 15.7% Malheur County 11.1% seasonally adjusted 11.0% Union County 9.3% seasonally adjusted 9.8% Wallowa County 11.8% seasonally adjusted 11.7% Oregon 10.4% seasonally adjusted 10.6% United States 9.3% seasonally adjusted 9.7%
Population – July 1, 2009
Baker County 16,450 Grant County 7,525 Harney County 7,715 Malheur County 31,720 Union County 25,470 Wallowa County 7,100 Oregon 3,823,465
Average Pay Per Job – 2009
Baker County $29,259 Grant County $30,174 Harney County $30,248 Malheur County $28,956 Union County $30,202 Wallowa County $27,604 Oregon $40,740 United States not yet available

2 Oregon Employment Department Workforce Analysis Eastern Oregon Labor Trends July 2010
Here are the “Top 40” highest-paying occupations in Eastern Oregon:
The annual average wage generally equals the hourly wage multiplied by 2,080, the yearly equivalent of a 40-hour work week. Please note, however, that many occupations often do not provide full-time, year-round work.
Table 1
Pharmacists $112,501Medical and Health Services Managers $86,760General and Operations Managers $83,905Computer and Information Systems Managers $83,685Supervisors and Managers of Police and Detectives $80,977Industrial Production Managers $79,641Physical Therapists $79,472Financial Managers $73,237Civil Engineers $72,062Supervisors and Managers of Mechanics, Installers, and Repairers $71,981Elementary and Secondary School Administrators $71,307Construction Managers $68,137Electrical and Electronic Engineering Technicians $66,511Lawyers $65,630Public Relations Specialists $65,563Supervisors and Managers of Production and Operating Workers $65,049Registered Nurses $64,451Soil and Plant Scientists $63,851Occupational Health and Safety Specialists $62,437Zoologists and Wildlife Biologists $62,370Compliance Officers, Except Agriculture, Construction, Health and Safety, and Transportation $62,275Environmental Scientists and Specialists, Including Health $61,719Geoscientists, Except Hydrologists and Geographers $60,800Social and Community Service Managers $60,301Radiologic, CAT, and MRI Technologists and Technicians $60,277Conservation Scientists $60,175Transportation, Storage, and Distribution Managers $59,861Computer Specialists, All Other $59,097Foresters $58,968Administrative Services Managers $58,428Network and Computer Systems Administrators $57,724Urban and Regional Planners $57,437Electricians $56,292Police and Sheriff's Patrol Officers $56,036Wholesale and Manufacturing Sales Representatives, Except Technical and Scientific Products $55,763Supervisors and Managers of Construction Trades and Extraction Workers $55,238Purchasing Agents, Except Wholesale, Retail, and Farm Products $54,754Engineering Technicians, All Other $54,316Computer Programmers $53,764Postmasters and Mail Superintendents $53,245
Region 13 (Baker, Union, and Wallowa counties)Occupational Title
2010 Annual Mean Wage
Table 2
General and Operations Managers $99,788Pharmacists $98,920Financial Managers $79,317Judges and Magistrates $75,523Industrial Production Managers $73,086Medical and Health Services Managers $72,110Supervisors and Managers of Police and Detectives $70,533Managers, All Other $69,045Registered Nurses $66,870Anthropologists and Archeologists $66,328Civil Engineers $65,077Elementary and Secondary School Administrators $64,393Public Relations Specialists $60,155Soil and Plant Scientists $59,185Foresters $58,788Business Operations Specialists, All Other $58,244Supervisors and Managers of Mechanics, Installers, and Repairers $57,581Administrative Services Managers $57,180Radiologic, CAT, and MRI Technologists and Technicians $57,158Accountants and Auditors $55,895Zoologists and Wildlife Biologists $55,556Human Resources, Training, and Labor Relations Specialists, All Other $54,005Postal Service Clerks $53,812Biological Scientists, All Other $51,614Purchasing Agents, Except Wholesale, Retail, and Farm Products $50,748Urban and Regional Planners $50,385Engineering Technicians, All Other $50,367Food Scientists and Technologists $50,315Wholesale and Manufacturing Sales Representatives, Technical and Scientific Products $49,601Loan Officers $49,496Postal Service Mail Carriers $48,911Supervisors and Managers of Transportation Helpers, Laborers, and Material Movers, Hand $48,415Medical and Public Health Social Workers $48,053Management Analysts $47,988Social and Community Service Managers $47,267Postmasters and Mail Superintendents $46,843Supervisors and Managers of Production and Operating Workers $46,349Supervisors and Managers of Transportation and Material-Moving Machine and Vehicle Operators $46,011Substance Abuse and Behavioral Disorder Counselors $45,378Educational, Vocational, and School Counselors $45,239
Region 14 (Grant, Harney, and Malheur counties)Occupational Title
2010 Annual Mean Wage
Eastern Oregon Labor Trends is published by the Workforce and Economic Research Division of the Oregon Employment Department. Eastern Oregon Labor Trends also can be found on the Publications page at www.QualityInfo.org. Material contained in this publication is in the public domain and may be reproduced without permission. Please credit Eastern Oregon Labor Trends, Oregon Employment Department.
Laurie Warner, Director Graham Slater, Administrator for Workforce and Economic Research Jason Yohannan, Regional Economist Annette Shelton-Tiderman, Workforce Analyst La Grande (541) 519-0315 Debbie Gargalis, Field Office Manager Baker City (541) 523-6331 Enterprise (541) 426-4972 La Grande (541) 963-7111 Nancy Alvarado, Field Office Manager Burns (541) 573-5251 Canyon City (541) 575-0744 Ontario (541) 889-5394
Please direct address changes to: Oregon Employment Department Workforce and Economic Research 875 Union St NE Salem OR 97311 Phone (503) 947-1204 TDD (503) 947-1391 e-mail [email protected] The Oregon Employment Department is an equal opportunity employer. Auxiliary aids and services are available upon request to individuals with disabilities.

Oregon Employment Department Workforce Analysis 3 Eastern Oregon Labor Trends July 2010
BAKER COUNTY
Baker County had an estimated May 2010 jobless rate of 8.8 percent, down moderately from April’s 10.0 percent. May’s labor force estimates show 6,958 employed and 672 unemployed local residents. Baker County’s May unemployment rate of 8.8 percent was lower than the corresponding state and national averages. It was also the first month with an unemployment rate under 10 percent since last November. May’s labor force statistics followed the same theme that Baker County has experienced most of this year. Namely, job market conditions remain weak but the trend still shows some improvement since last year. As of the mid-month reference period used to develop May’s employment statistics, the U.S. Census Bureau employed 47 people in Baker County for America’s once-every-10-years head count. Those 47 folks were the main reason federal government employment in May 2010 was 50 jobs higher than its month-ago and year-ago levels. Even without the census workers, Baker County would have added jobs from April to May. In the private sector, the leisure and hospitality industry provided the biggest employment boost, up an estimated 30 jobs over the month.
May Apr. May Apr. May 2010 2010 2009 2010 2009
Labor Force Status (Household Data)Civilian labor force 7,630 7,584 7,648 46 -18 Unemployed 672 755 763 -83 -91 Unemployment rate 8.8 10.0 10.0 -1.2 -1.2 Unemployment rate (seasonally adjusted) 10.1 9.6 11.5 0.5 -1.4 Employed 6,958 6,829 6,885 129 73
Nonfarm Payroll Employment (Establishment Data)Total nonfarm payroll employment 5,310 5,180 5,350 130 -40 Total private 3,940 3,870 3,980 70 -40 Mining and logging 20 10 20 10 0 Construction 200 190 200 10 0 Manufacturing 530 530 570 0 -40 Trade, transportation, and utilities 1,010 990 1,000 20 10 Wholesale trade 80 80 70 0 10 Retail trade 700 680 690 20 10 Transportation, warehousing, and utilities 230 230 240 0 -10 Information 80 70 80 10 0 Financial activities 210 210 220 0 -10 Professional and business services 260 270 270 -10 -10 Educational and health services 770 770 760 0 10 Leisure and hospitality 600 570 600 30 0 Other services 260 260 260 0 0 Government 1,370 1,310 1,370 60 0 Federal government 290 240 240 50 50 State government 300 290 290 10 10 Local government 780 780 840 0 -60Labor-management disputes 0 0 0 0 0
The most recent month is preliminary; the prior month is revised.
BAKER COUNTY CURRENT LABOR FORCE AND INDUSTRY EMPLOYMENT
Change From
Labor Force Status: Civilian labor force includes employed and unemployed individuals 16 years and older by place of residence. Employed includes nonfarm payroll employment, self-employed, unpaid family workers, domestics, agriculture, and labor disputants. Unemployment rate is calculated by dividing unemployed by civilian labor force. Prepared in cooperation with the U.S. Department of Labor, Bureau of Labor Statistics.
Nonfarm Payroll Employment: Data are by place of work and cover full- and part-time employees who worked or received pay for the pay period that includes the 12th of the month. The data exclude the self-employed, volunteers, unpaid family workers, and domestics.
4,800
5,100
5,400
5,700
6,000
M J J A S O N D J F M A M J J A S O N D J F M A M
May 2008 - May 2010
Baker County Nonfarm Payroll EmploymentLatest 25 Months

4 Oregon Employment Department Workforce Analysis Eastern Oregon Labor Trends July 2010
GRANT COUNTY Grant County had an estimated May 2010 jobless rate of 12.6 percent, down moderately from April’s 14.9 percent. May’s labor force estimates show 3,011 employed and 434 unemployed local residents. Grant County’s 2010 unemployment rates have risen from “much below” year-ago levels in January, February, and March to only “slightly below” year-ago levels in the two most recent monthly reports for April and May. While the margin of improvement has narrowed, at least we’re still talking about jobless rates improving instead of yet another setback in labor market conditions. In terms of nonfarm payroll employment, Grant County’s numbers were up 100 from April to May, with about half the gain coming from the federal government. The Census Bureau did have 18 temporary workers on duty in Grant County in May, but most of the 50-person increase in Grant County’s federal workforce in May was due to regular hiring of seasonal workers by other federal agencies. In the private sector, the construction industry added 20 jobs to lead the way. No local industry dropped jobs over the month, but several industries still showed job losses over the year.
May Apr. May Apr. May 2010 2010 2009 2010 2009
Labor Force Status (Household Data)Civilian labor force 3,445 3,387 3,469 58 -24 Unemployed 434 505 459 -71 -25 Unemployment rate 12.6 14.9 13.2 -2.3 -0.6 Unemployment rate (seasonally adjusted) 12.7 12.8 13.3 -0.1 -0.6 Employed 3,011 2,882 3,010 129 1
Nonfarm Payroll Employment (Establishment Data)Total nonfarm payroll employment 2,290 2,190 2,340 100 -50 Total private 1,200 1,160 1,260 40 -60 Mining and logging 20 20 20 0 0 Construction 120 100 130 20 -10 Manufacturing 110 110 160 0 -50 Trade, transportation, and utilities 340 330 350 10 -10 Wholesale trade 40 40 40 0 0 Retail trade 250 240 260 10 -10 Transportation, warehousing, and utilities 50 50 50 0 0 Information 40 40 40 0 0 Financial activities 100 100 90 0 10 Professional and business services 80 80 90 0 -10 Educational and health services 150 150 150 0 0 Leisure and hospitality 180 170 170 10 10 Other services 60 60 60 0 0 Government 1,090 1,030 1,080 60 10 Federal government 290 240 270 50 20 State government 130 130 130 0 0 Local government 670 660 680 10 -10Labor-management disputes 0 0 0 0 0
The most recent month is preliminary; the prior month is revised.
GRANT COUNTY CURRENT LABOR FORCE AND INDUSTRY EMPLOYMENT
Change From
Labor Force Status: Civilian labor force includes employed and unemployed individuals 16 years and older by place of residence. Employed includes nonfarm payroll employment, self-employed, unpaid family workers, domestics, agriculture, and labor disputants. Unemployment rate is calculated by dividing unemployed by civilian labor force. Prepared in cooperation with the U.S. Department of Labor, Bureau of Labor Statistics.
Nonfarm Payroll Employment: Data are by place of work and cover full- and part-time employees who worked or received pay for the pay period that includes the 12th of the month. The data exclude the self-employed, volunteers, unpaid family workers, and domestics.
2,000
2,200
2,400
2,600
2,800
M J J A S O N D J F M A M J J A S O N D J F M A M
May 2008 - May 2010
Grant County Nonfarm Payroll EmploymentLatest 25 Months

Oregon Employment Department Workforce Analysis 5 Eastern Oregon Labor Trends July 2010
HARNEY COUNTY Harney County had an estimated May 2010 jobless rate of 14.3 percent, down moderately from April’s revised 15.9 percent. May’s labor force estimates show 2,956 employed and 495 unemployed local residents. Once again, Harney County’s latest unemployment rate estimate was second highest in Oregon, behind Crook County’s 15.9 percent. The federal government employed an estimated 270 workers in Harney County in May, 30 more than in April. That 270 figure included 19 temporary employees hired to help with the 2010 Census. Outside of the federal government, no other nonfarm industry in Harney County showed any employment change up or down over the month. Last year’s monthly nonfarm employment totals peaked in June, at 2,420 jobs. The local economy needs to add another 180 jobs if it is to match that number this year.
May Apr. May Apr. May 2010 2010 2009 2010 2009
Labor Force Status (Household Data)Civilian labor force 3,451 3,501 3,541 -50 -90 Unemployed 495 556 546 -61 -51 Unemployment rate 14.3 15.9 15.4 -1.6 -1.1 Unemployment rate (seasonally adjusted) 15.7 15.0 16.9 0.7 -1.2 Employed 2,956 2,945 2,995 11 -39
Nonfarm Payroll Employment (Establishment Data)Total nonfarm payroll employment 2,240 2,210 2,330 30 -90 Total private 1,100 1,100 1,160 0 -60 Mining, logging, and construction 70 70 80 0 -10 Manufacturing 10 10 10 0 0 Trade, transportation, and utilities 390 390 390 0 0 Wholesale trade 50 50 50 0 0 Retail trade 290 290 290 0 0 Transportation, warehousing, and utilities 50 50 50 0 0 Information 20 20 20 0 0 Financial activities 70 70 80 0 -10 Professional and business services 90 90 100 0 -10 Educational and health services 180 180 170 0 10 Leisure and hospitality 220 220 250 0 -30 Other services 50 50 60 0 -10 Government 1,140 1,110 1,170 30 -30 Federal government 270 240 270 30 0 State government 160 160 160 0 0 Local government 710 710 740 0 -30Labor-management disputes 0 0 0 0 0
The most recent month is preliminary; the prior month is revised.
HARNEY COUNTY CURRENT LABOR FORCE AND INDUSTRY EMPLOYMENT
Change From
Labor Force Status: Civilian labor force includes employed and unemployed individuals 16 years and older by place of residence. Employed includes nonfarm payroll employment, self-employed, unpaid family workers, domestics, agriculture, and labor disputants. Unemployment rate is calculated by dividing unemployed by civilian labor force. Prepared in cooperation with the U.S. Department of Labor, Bureau of Labor Statistics.
Nonfarm Payroll Employment: Data are by place of work and cover full- and part-time employees who worked or received pay for the pay period that includes the 12th of the month. The data exclude the self-employed, volunteers, unpaid family workers, and domestics.
2,000
2,200
2,400
2,600
2,800
M J J A S O N D J F M A M J J A S O N D J F M A M
May 2008 - May 2010
Harney County Nonfarm Payroll EmploymentLatest 25 Months

6 Oregon Employment Department Workforce Analysis Eastern Oregon Labor Trends July 2010
MALHEUR COUNTY Malheur County had an estimated May 2010 jobless rate of 11.1 percent, up slightly from April’s revised 10.6 percent. May’s labor force estimates show 11,778 employed and 1,474 unemployed local residents. This month’s labor market statistics were a bit of a setback, as Malheur County was one of only two counties in Oregon where the unemployment rate rose from April to May. The other was Hood River County. In both cases, the jobless rate increased by one-half of a percentage point. However, in Hood River County’s case, it’s normal for the local unemployment rate to move up in May. In Malheur County’s case, it’s not. May’s employment situation report wasn’t entirely negative. Although unemployment grew, so did employment. In fact, each of the past two monthly reports revealed over-the-year increases in total nonfarm payroll employment. We haven’t been able to say that since April 2008. The largest employment increase in May came from the federal government, which added 50 people over April. The federal job count in May included 48 temporary census workers, but those jobs will fade away later this year.
May Apr. May Apr. May 2010 2010 2009 2010 2009
Labor Force Status (Household Data)Civilian labor force 13,252 13,135 12,811 117 441 Unemployed 1,474 1,396 1,367 78 107 Unemployment rate 11.1 10.6 10.7 0.5 0.4 Unemployment rate (seasonally adjusted) 11.0 9.6 10.6 1.4 0.4 Employed 11,778 11,739 11,444 39 334
Nonfarm Payroll Employment (Establishment Data)Total nonfarm payroll employment 11,780 11,670 11,610 110 170 Total private 7,930 7,910 7,860 20 70 Mining, logging, and construction 280 250 320 30 -40 Manufacturing 1,000 980 970 20 30 Trade, transportation, and utilities 2,740 2,780 2,720 -40 20 Wholesale trade 500 580 490 -80 10 Retail trade 1,920 1,880 1,900 40 20 Transportation, warehousing, and utilities 320 320 330 0 -10 Information 80 90 100 -10 -20 Financial activities 360 360 360 0 0 Professional and business services 480 490 430 -10 50 Educational and health services 1,610 1,610 1,530 0 80 Leisure and hospitality 1,080 1,060 1,120 20 -40 Other services 300 290 310 10 -10 Government 3,850 3,760 3,750 90 100 Federal government 280 230 250 50 30 State government 1,280 1,280 1,250 0 30 Local government 2,290 2,250 2,250 40 40Labor-management disputes 0 0 0 0 0
The most recent month is preliminary; the prior month is revised.
MALHEUR COUNTY CURRENT LABOR FORCE AND INDUSTRY EMPLOYMENT
Change From
Labor Force Status: Civilian labor force includes employed and unemployed individuals 16 years and older by place of residence. Employed includes nonfarm payroll employment, self-employed, unpaid family workers, domestics, agriculture, and labor disputants. Unemployment rate is calculated by dividing unemployed by civilian labor force. Prepared in cooperation with the U.S. Department of Labor, Bureau of Labor Statistics.
Nonfarm Payroll Employment: Data are by place of work and cover full- and part-time employees who worked or received pay for the pay period that includes the 12th of the month. The data exclude the self-employed, volunteers, unpaid family workers, and domestics.
11,000
11,500
12,000
12,500
13,000
M J J A S O N D J F M A M J J A S O N D J F M A M
May 2008 - May 2010
Malheur County Nonfarm Payroll EmploymentLatest 25 Months

Oregon Employment Department Workforce Analysis 7 Eastern Oregon Labor Trends July 2010
UNION COUNTY Union County had an estimated May 2010 jobless rate of 9.3 percent, down moderately from April’s revised 10.6 percent. May’s labor force estimates show 11,421 employed and 1,174 unemployed local residents. For digit counters, Union County’s employment and unemployment statistics crossed some notable thresholds in May. The county’s unemployment rate dropped from double digits – where it had been for the previous five months – back to single digits (that is, under 10%). Going the other direction, the county’s nonfarm employment added a digit in May. Total nonfarm payroll employment in Union County moved back above 10,000 in May after having been only four digits long for the previous five months. By industry, the largest employment increase in Union County over the month was from federal government, up by 60 positions. The Census Bureau had 38 temporary workers on the job in this report. Other levels of government also added workers in May, while private-sector trends were a mix of gains and losses that balanced each other out.
May Apr. May Apr. May 2010 2010 2009 2010 2009
Labor Force Status (Household Data)Civilian labor force 12,595 12,688 12,528 -93 67 Unemployed 1,174 1,347 1,431 -173 -257 Unemployment rate 9.3 10.6 11.4 -1.3 -2.1 Unemployment rate (seasonally adjusted) 9.8 10.3 12.2 -0.5 -2.4 Employed 11,421 11,341 11,097 80 324
Nonfarm Payroll Employment (Establishment Data)Total nonfarm payroll employment 10,030 9,920 9,870 110 160 Total private 7,270 7,270 7,180 0 90 Mining and logging 60 40 50 20 10 Construction 490 450 450 40 40 Manufacturing 1,020 1,030 950 -10 70 Trade, transportation, and utilities 2,000 1,980 2,070 20 -70 Wholesale trade 240 240 250 0 -10 Retail trade 1,330 1,320 1,390 10 -60 Transportation, warehousing, and utilities 430 420 430 10 0 Information 120 120 130 0 -10 Financial activities 350 350 330 0 20 Professional and business services 440 420 460 20 -20 Educational and health services 1,610 1,610 1,560 0 50 Leisure and hospitality 880 970 890 -90 -10 Other services 300 300 290 0 10 Government 2,760 2,650 2,690 110 70 Federal government 270 210 260 60 10 State government 1,290 1,260 1,240 30 50 Local government 1,200 1,180 1,190 20 10Labor-management disputes 0 0 0 0 0
The most recent month is preliminary; the prior month is revised.
UNION COUNTY CURRENT LABOR FORCE AND INDUSTRY EMPLOYMENT
Change From
Labor Force Status: Civilian labor force includes employed and unemployed individuals 16 years and older by place of residence. Employed includes nonfarm payroll employment, self-employed, unpaid family workers, domestics, agriculture, and labor disputants. Unemployment rate is calculated by dividing unemployed by civilian labor force. Prepared in cooperation with the U.S. Department of Labor, Bureau of Labor Statistics.
Nonfarm Payroll Employment: Data are by place of work and cover full- and part-time employees who worked or received pay for the pay period that includes the 12th of the month. The data exclude the self-employed, volunteers, unpaid family workers, and domestics.
9,000
9,500
10,000
10,500
11,000
M J J A S O N D J F M A M J J A S O N D J F M A M
May 2008 - May 2010
Union County Nonfarm Payroll EmploymentLatest 25 Months

8 Oregon Employment Department Workforce Analysis Eastern Oregon Labor Trends July 2010
WALLOWA COUNTY Wallowa County had an estimated May 2010 jobless rate of 11.8 percent, down moderately from April’s revised 14.0 percent. May’s labor force estimates show 3,270 employed and 439 unemployed local residents. Wallowa County’s marginally lower unemployment rate this May (11.8%) versus last May (12.4%) was the result of having about the same number of people employed but slightly fewer people looking for work. Total nonfarm payroll employment advanced by 130 over the month, about normal for May in Wallowa County. Industries with the largest over-the-month job gains included leisure and hospitality (+40) and federal government (+30). May’s federal job count included 18 temporary census workers. Elsewhere in the nonfarm economy, manufacturing employment in Wallowa County was stuck at 100 for the fourth consecutive month. It’s the lowest job count for this Wallowa County industry since comparable records began in 2001.
May Apr. May Apr. May 2010 2010 2009 2010 2009
Labor Force Status (Household Data)Civilian labor force 3,709 3,639 3,729 70 -20 Unemployed 439 511 464 -72 -25 Unemployment rate 11.8 14.0 12.4 -2.2 -0.6 Unemployment rate (seasonally adjusted) 11.7 11.4 12.3 0.3 -0.6 Employed 3,270 3,128 3,265 142 5
Nonfarm Payroll Employment (Establishment Data)Total nonfarm payroll employment 2,300 2,170 2,360 130 -60 Total private 1,520 1,440 1,560 80 -40 Mining and logging 20 20 30 0 -10 Construction 140 130 140 10 0 Manufacturing 100 100 120 0 -20 Trade, transportation, and utilities 400 380 410 20 -10 Wholesale and retail trade 310 300 330 10 -20 Transportation, warehousing, and utilities 90 80 80 10 10 Information 30 30 20 0 10 Financial activities 170 170 160 0 10 Professional and business services 100 90 100 10 0 Educational and health services 230 230 240 0 -10 Leisure and hospitality 240 200 250 40 -10 Other services 90 90 90 0 0 Government 780 730 800 50 -20 Federal government 130 100 120 30 10 State government 120 120 130 0 -10 Local government 530 510 550 20 -20Labor-management disputes 0 0 0 0 0
The most recent month is preliminary; the prior month is revised.
WALLOWA COUNTY CURRENT LABOR FORCE AND INDUSTRY EMPLOYMENT
Change From
Labor Force Status: Civilian labor force includes employed and unemployed individuals 16 years and older by place of residence. Employed includes nonfarm payroll employment, self-employed, unpaid family workers, domestics, agriculture, and labor disputants. Unemployment rate is calculated by dividing unemployed by civilian labor force. Prepared in cooperation with the U.S. Department of Labor, Bureau of Labor Statistics.
Nonfarm Payroll Employment: Data are by place of work and cover full- and part-time employees who worked or received pay for the pay period that includes the 12th of the month. The data exclude the self-employed, volunteers, unpaid family workers, and domestics.
2,000
2,200
2,400
2,600
2,800
M J J A S O N D J F M A M J J A S O N D J F M A M
May 2008 - May 2010
Wallowa County Nonfarm Payroll EmploymentLatest 25 Months

Oregon Employment Department Workforce Analysis 9 Eastern Oregon Labor Trends July 2010
MOTOR VEHICLE AND PARTS DEALERS AMONG RETAIL SALES LEADERS Oregon retailers accumulated more than $50 billion in sales in 2007, and Eastern Oregon retailers accounted for more than $1 billion of that total. That’s according to new data from the U.S. Census Bureau’s economic census program. The Census Bureau recently released final results from its 2007 Economic Census of the retail trade industry in Oregon and Oregon’s counties. Oregon’s motor vehicle and parts dealers rang up higher sales than any other category of retailers in 2007, amassing $11.3 billion at the 1,740 business establishments with payroll in that industry. Locally, Union County followed suit. Motor vehicle and parts dealers in Union County had sales totaling more than $82 million in 2007, just about one quarter of total retail sales in the county and more than any other type of retailer (Table 1).
In Baker County, food and beverage stores led all categories of retailers. Food and beverage retailers sold $40.6 million worth of goods. That was more than 26 percent of all retail sales in the county. In Wallowa County, the retail sales leader in 2007 was building material and garden equipment and supplies dealers. Sales at lumber yards, hardware stores, and the like totaled $20.9 million and
Table 1
IndustryBaker
CountyGrant
CountyHarney County
Malheur County
Union County
Wallowa County
Motor vehicle and parts dealers $29,844,000 $9,687,000 $14,277,000 $117,691,000 $82,286,000 $19,668,000Furniture and home furnishings stores $2,701,000 NA NA $8,219,000 $6,162,000 $1,587,000Electronics and appliance stores NA NA NA NA $2,069,000 NABuilding material and garden equipment and supplies dealers $16,090,000 $6,978,000 $10,776,000 $56,304,000 $39,358,000 $20,940,000Food and beverage stores $40,628,000 $16,236,000 NA $53,631,000 $50,596,000 $20,891,000Health and personal care stores NA NA NA NA $7,945,000 NAGasoline stations $36,857,000 NA $24,165,000 $71,729,000 $36,329,000 $10,976,000Clothing and clothing accessories stores $1,739,000 NA NA NA $8,881,000 $1,022,000Sporting goods, hobby, book, and music stores $634,000 NA NA $5,889,000 NA NAGeneral merchandise stores NA NA NA NA $73,864,000 NAMiscellaneous store retailers NA NA NA NA NA $4,289,000Nonstore retailers $424,000 NA NA NA $18,503,000 NAAll other retailers not separately identified above $26,539,000 $39,622,000 $38,358,000 $171,181,000 $7,767,000 $3,357,000TOTAL RETAIL SALES $155,456,000 $72,523,000 $87,576,000 $484,644,000 $333,760,000 $82,730,000
"NA" = Data are not available. Figures are suppressed to protect confidentiality of individual business information.
Source: U.S. Census Bureau
2007 Census of Retail TradeTotal Retail Sales by Store Type (includes only establishments of firms with payroll)

10 Oregon Employment Department Workforce Analysis Eastern Oregon Labor Trends July 2010
accounted for 25.3 percent of total retail sales in Wallowa County in 2007 but only 8.8 percent of statewide retail sales. Interestingly, building material and garden equipment and supplies dealers captured a relatively greater share of total retail sales in all six Eastern Oregon counties, when measured against the statewide retail sales distribution. Of course, these figures refer to sales in 2007, which was just before the Great Recession swamped building activity in many parts of the state. We don’t have enough information to say with certainty what category of retailing led the way in Grant, Harney, and Malheur counties. In these three counties, retail sales figures had to be suppressed in many categories, so the residual “all other” figure exceeded the sales totals for all categories that were published. Data for specific industries must be suppressed when publication of the statistics would risk disclosing potentially identifying information associated with only one or two firms. Among the categories that could be published in the Southeast Oregon counties, food and beverage stores ($16.2 million) led Grant County’s retail sales; gasoline stations ($24.2 million) had the strongest numbers in Harney County; and motor vehicle and parts dealers ($117.7 million) registered the most sales in Malheur County. Four of Six Eastern Oregon Counties Outgrew the State From 2002 – when the prior economic census was done – to 2007, total retail sales in Oregon grew by about $12.5 billion, a gain of 33 percent. Retail sales slipped in Morrow County from 2002 to 2007 but advanced in all 35 other counties, including Oregon’s six easternmost counties. In fact, four of these six counties enjoyed an even greater pace of retail sales growth than the statewide average (Graph 1). Retail sales in Harney County in 2007 were $34.3 million more than in 2002, a gain of 64 percent. That percentage ranked fourth highest in the state. Total retail sales at the seven gasoline stations in Harney County more than doubled from 2002 to 2007. Much of that increase no doubt had to do with how much more it cost to buy a gallon of gas or diesel in 2007 than in 2002. But part of the increase also might be a credit to the county’s seven establishments in the gasoline station industry capturing a greater share of regional sales activity for the local economy. As possible evidence of this, note that gasoline stations statewide saw an 85 percent sales increase over five years, while Harney County’s gasoline stations saw a 169 percent sales increase. In Malheur, Grant, and Baker counties, retail sales gains since the previous economic census exceeded the state average, too.
12.0%
26.1%
35.2%
41.5%
45.2%
64.3%
32.9%
0% 10% 20% 30% 40% 50% 60% 70% 80%
Wallowa County
Union County
Baker County
Grant County
Malheur County
Harney County
OREGON
2002-2007 increase in retail sales
Change in Total Retail Sales2007 Economic Census vs. 2002 Economic Census
Source: U.S. Census Bureau Graph 1

Oregon Employment Department Workforce Analysis 11 Eastern Oregon Labor Trends July 2010
Although Union and Wallowa counties also experienced mounting retail sales from 2002 to 2007, the growth rates in those two counties trailed Oregon’s statewide sales growth rate. Wallowa County’s 12 percent retail sales rise ranked 35th among Oregon’s 36 counties. That was ahead of only Morrow County, where, as noted above, retail sales actually declined between 2002 and 2007. Malheur County Remains a Retail Hub The U.S. Census Bureau conducts an economic census every five years. In the past, we’ve used results from earlier censuses of retail trade to demonstrate that Malheur County functions as a retail hub for a larger geography. Given these new results from the 2007 Census of Retail Trade, is such an assertion about Malheur County still true? Well, if you read the subheading for this section, you already know that the answer is yes. Retail sales in Malheur County are greater than one would expect for a county of that size. The Census Bureau calculated that Malheur County’s 2007 retail sales amounted to $484,644,000. The agency also pegged Malheur County’s 2007 population at 30,993. That works out to per capita retail sales of $15,637 in Malheur County in 2007. (That’s $484,644,000 divided by 30,993.) Per capita retail sales in Oregon in 2007 were only $13,494 (Graph 2). Thus, total retail sales in Malheur County were 16 percent greater than the statewide trend would have predicted. Such a figure is even more impressive when one considers that Malheur County residents have the lowest per capita personal income, and one of the highest poverty rates, in the state. We’re not talking about an especially wealthy community here that can lavish retailers with lots of discretionary income. Then again, residents of several Idaho towns near the Oregon-Idaho border don’t have to travel very far to shop in Ontario, and the absence of a state sales tax in Oregon certainly offers an added incentive to cross the border for merchandise purchases. So that boosts Malheur County’s standing in Graph 2. Other counties in Eastern Oregon look like they have retail dollars leaving their communities, since per capita retail sales in Baker, Grant, Harney, Union, and Wallowa counties show numbers beneath the statewide average. Graph 2 doesn’t definitively prove there’s retail leakage in these other Eastern Oregon counties; it only suggests it. But leakage probably plays at least some part in Graph 2’s relationships for Eastern Oregon’s five other counties.
$9,710
$10,560
$12,127
$12,936
$13,318
$15,637
$13,494
$0 $2,000 $4,000 $6,000 $8,000 $10,000 $12,000 $14,000 $16,000 $18,000
Baker County
Grant County
Wallowa County
Harney County
Union County
Malheur County
OREGON
2007 retail sales divided by 2007 population
Total Retail Sales Per Capita2007 Economic Census
Source: U.S. Census Bureau Graph 2


July 2010
Latest Local Area Employment Data Lane County’s seasonally adjusted unemployment rate dropped to 10.7 percent in May compared to a revised 10.9 percent in April. The rate this May is down 2.1 percentage points from the 12.8 percent recorded in May 2009. The unadjusted rate was 10.3 percent for May 2010. The number of unemployed dropped by 986 from April, and was 3,666 lower than May of last year. Nonfarm Payroll Employment In May, total nonfarm payroll employment rose 1,500 when an increase of 720 was expected on a seasonal basis. Total nonfarm employment was down by 1,000 from May of last year for a loss of 0.7 percent. Manufacturing increased by 100 in May due to an increase of 100 in nondurable goods. In the private nonmanufacturing sectors in May, there were seasonal gains in construction (+100) and leisure and
Economic Indicators
Unemployment Rates
Seasonally Lane Raw Adjusted April 2010 10.9% 10.9% May 2010 10.3% 10.7% Oregon April 2010 10.7% 10.6% May 2010 10.4% 10.6% United States April 2010 9.5% 9.9%
May 2010 9.3% 9.7%
Nonfarm Payroll Employment May 2010
Lane Total 142,700 Wood Prod. Mfg. 3,200 Other Mfg. 9,100 Construction 5,200 Trade 23,200 Information 3,400 Financial Activities 7,400 Additional Services 55,200 Government 32,300
Consumer Price Index (CPI) 1982-1984 = 100
All Urban Consumers United States May 2010 218.178 Year change 2.0%
Portland-Salem MSA July – Dec. 2009 217.191 Year Change 0.5% Jan. - June 2010 available 8/13/10
http://www.bls.gov/cpi
0
2
4
6
8
10
12
14
May-05 May-06 May-07 May-08 May-09 May-10
Pe
rce
nt
Seasonally Adjusted Unemployment Rates
Oregon Lane County

2 Oregon Employment Department Workforce Analysis Lane County Trends July 2010
hospitality (+200). Elsewhere, there were gains in retail trade (+100), professional and business services (+200), private education and health services (+100), and other services (+100). Government added 600 jobs in May. Federal government increased 200 due to a seasonal increase combined with the addition of temporary Census workers. State education added 200. Local government increased by 200 from an increase of 100 each in local education and other local government. Around the County Grape Solar, a Chinese solar panel distributor, plans to set up an assembly plant in west Eugene. It may employ up to 150 people doing assembly work and 40 to 50 support staff. -Register-Guard (Eugene, OR) 06/05/10 Osteria Sfizio, an Italian restaurant, has opened at Oakway Center in Eugene. -Register-Guard (Eugene, OR) 06/18/10 Abercrombie and Fitch is leaving Eugene’s Valley River Center, but will be replaced by Victoria’s Secret. Wig N’ It, which offers wigs, hairpieces, extensions and hair jewelry, will open at the mall in early July. -Register-Guard (Eugene, OR) 06/24/10 Oregon Employment Oregon’s seasonally adjusted unemployment rate was 10.6 percent in May, the same as in March and April. The rate has been essentially unchanged for the most recent seven months. Oregon’s unemployment rate was 11.6 percent in May 2009, which tied June 2009 as Oregon’s highest unemployment rate since the early 1980s. The U.S. seasonally adjusted unemployment rate dropped to 9.7 percent in May from 9.9 percent in April.
(15,000)
(10,000)
(5,000)
0
5,000
10,000
May-05 Nov-05 May-06 Nov-06 May-07 Nov-07 May-08 Nov-08 May-09 Nov-09 May-10
Lane County: Employment Change from Previous YearMay 2005 to May 2010
Lane County Labor Trends is published by the Workforce and Economic Research Division of the Oregon Employment Department. Lane County Labor Trends also can be found on the Publications page at www.QualityInfo.org. Material contained in this publication is in the public domain and may be reproduced without permission. Please credit Lane County Labor Trends, Oregon Employment Department.
Laurie Warner, Director Graham Slater, Administrator for Workforce and Economic Research Brian Rooney, Regional Economist Mike Meyers, Workforce Analyst (541) 686-7670 Jim Pfarrer, Field Office Manager Eugene (541) 686-7601 Florence (541) 997-1913 Springfield (541) 726-3525
Please direct address changes to: Oregon Employment Department Workforce and Economic Research 875 Union St NE Salem OR 97311 Phone (503) 947-1204 TDD (503) 947-1391 e-mail [email protected] The Oregon Employment Department is an equal opportunity employer. Auxiliary aids and services are available upon request to individuals with disabilities.
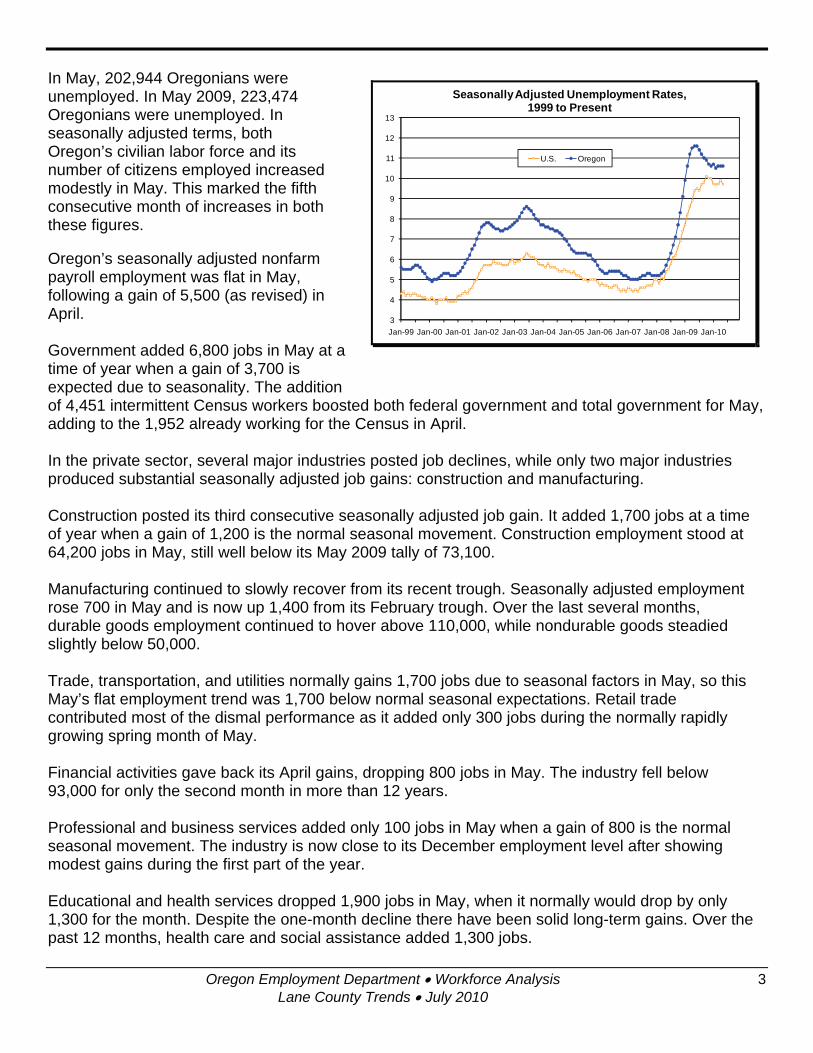
Oregon Employment Department Workforce Analysis 3 Lane County Trends July 2010
In May, 202,944 Oregonians were unemployed. In May 2009, 223,474 Oregonians were unemployed. In seasonally adjusted terms, both Oregon’s civilian labor force and its number of citizens employed increased modestly in May. This marked the fifth consecutive month of increases in both these figures. Oregon’s seasonally adjusted nonfarm payroll employment was flat in May, following a gain of 5,500 (as revised) in April. Government added 6,800 jobs in May at a time of year when a gain of 3,700 is expected due to seasonality. The addition of 4,451 intermittent Census workers boosted both federal government and total government for May, adding to the 1,952 already working for the Census in April. In the private sector, several major industries posted job declines, while only two major industries produced substantial seasonally adjusted job gains: construction and manufacturing. Construction posted its third consecutive seasonally adjusted job gain. It added 1,700 jobs at a time of year when a gain of 1,200 is the normal seasonal movement. Construction employment stood at 64,200 jobs in May, still well below its May 2009 tally of 73,100.
Manufacturing continued to slowly recover from its recent trough. Seasonally adjusted employment rose 700 in May and is now up 1,400 from its February trough. Over the last several months, durable goods employment continued to hover above 110,000, while nondurable goods steadied slightly below 50,000. Trade, transportation, and utilities normally gains 1,700 jobs due to seasonal factors in May, so this May’s flat employment trend was 1,700 below normal seasonal expectations. Retail trade contributed most of the dismal performance as it added only 300 jobs during the normally rapidly growing spring month of May.
Financial activities gave back its April gains, dropping 800 jobs in May. The industry fell below 93,000 for only the second month in more than 12 years. Professional and business services added only 100 jobs in May when a gain of 800 is the normal seasonal movement. The industry is now close to its December employment level after showing modest gains during the first part of the year.
Educational and health services dropped 1,900 jobs in May, when it normally would drop by only 1,300 for the month. Despite the one-month decline there have been solid long-term gains. Over the past 12 months, health care and social assistance added 1,300 jobs.
3
4
5
6
7
8
9
10
11
12
13
Jan-99 Jan-00 Jan-01 Jan-02 Jan-03 Jan-04 Jan-05 Jan-06 Jan-07 Jan-08 Jan-09 Jan-10
Seasonally Adjusted Unemployment Rates, 1999 to Present
U.S. Oregon

4 Oregon Employment Department Workforce Analysis Lane County Trends July 2010
National Employment The number of unemployed persons was 15.0 million in May. The unemployment rate edged down to 9.7 percent, the same rate as in the first three months of 2010. Nonfarm payroll employment increased by 431,000 in May, reflecting the addition of 411,000 temporary workers for Census 2010. Total private employment showed little change over the month (+41,000), following increases in March and April. In May, manufacturing, temporary help services, and mining added jobs, while employment in construction declined. Manufacturing employment increased by 29,000 over the month. Factory employment rose by 126,000 over the past five months. Within manufacturing, both fabricated metals and machinery added jobs in May. Temporary help services added 31,000 jobs over the month; employment in the industry rose by 362,000 since September 2009. Employment in mining continued to increase in May, with a gain of 10,000. Support activities for mining accounted for 8,000 of the over-the-month increase. Since October 2009, mining employment expanded by 50,000. Health care employment was little changed in May (+8,000). Over the prior 12 months, health care employment increased by an average of 20,000 per month. In May, employment in construction declined by 35,000, largely offsetting industry gains in the prior two months. May's job loss was spread throughout the sector. Employment in other private-sector industries, including wholesale trade, retail trade, transportation and warehousing, information, financial activities, and leisure and hospitality showed little or no change in May. Government employment rose by 390,000 in May. The federal government hired 411,000 temporary workers for Census 2010, bringing total temporary census staffing during the payroll survey reference period to 564,000. Employment in state government excluding education decreased by 13,000.

Oregon Employment Department Workforce Analysis 5 Lane County Trends July 2010
Workforce and Economic Research2010 BenchmarkJuly 2, 2010
(by place of residence)
-Change from-May Apr. May Apr. May
2010 2010 2009 2010 2009
Civilian Labor Force 182,352 182,892 184,574 -540 -2,222 Unemployment 18,870 19,856 22,536 -986 -3,666 Unemployment rate 10.3% 10.9% 12.2% -0.6 -1.9 Unemployment rate, seasonally adjusted 10.7% 10.9% 12.8% -0.1 -2.0 Total Employment 163,482 163,036 162,038 446 1,444
EUGENE MSA (Lane County) NONFARM PAYROLL EMPLOYMENT(by place of work)
-Change from-May Apr. May Apr. May
2010 2010 2009 2010 2009
TOTAL NONFARM PAYROLL EMPLOYMENT 142,700 141,200 143,700 1,500 -1,000
TOTAL PRIVATE 110,400 109,500 111,600 900 -1,200 Mining and Logging 700 700 700 0 0 Construction 5,300 5,200 5,500 100 -200 Manufacturing 12,300 12,200 12,500 100 -200 Durable Goods 8,600 8,600 8,700 0 -100 Wood Product Manufacturing 3,200 3,200 3,300 0 -100 Transportation Equipment Manufacturing 800 800 600 0 200 Nondurable goods 3,700 3,600 3,800 100 -100 Trade, Transportation, and Utilities 26,100 26,000 26,500 100 -400 Wholesale trade 5,400 5,400 5,600 0 -200 Retail trade 17,800 17,700 18,000 100 -200 General Merchandise and Clothing Stores 4,800 4,800 4,900 0 -100 Food and Beverage Stores 3,900 3,900 3,900 0 0 Transportation, Warehousing, and Utilities 2,900 2,900 2,900 0 0 Information 3,400 3,400 3,500 0 -100 Financial Activities 7,400 7,400 7,600 0 -200 Professional and Business Services 14,200 14,000 13,900 200 300 Administrative and Support Services 6,300 6,200 6,300 100 0 Educational and Health Services 22,000 21,900 22,100 100 -100 Health Care 17,500 17,500 17,300 0 200 Leisure and Hospitality 14,100 13,900 14,300 200 -200 Accommodation and Food Services 12,200 12,000 12,200 200 0 Food Services and Drinking Places 10,700 10,500 10,800 200 -100 Other Services 4,900 4,800 5,000 100 -100 Government 32,300 31,700 32,100 600 200 Federal Government 2,200 2,000 1,800 200 400 State Government 13,100 12,900 12,900 200 200 State Education 9,800 9,600 9,600 200 200 Local Government 17,000 16,800 17,400 200 -400 Local Education 9,700 9,600 9,900 100 -200
LABOR-MANAGEMENT DISPUTES 0 0 0 0 0
The most recent month is preliminary, the prior month is revised. Prepared in cooperation with the U.S. Department of Labor, Bureau of Labor Statistics.
EUGENE MSA (Lane County) LABOR FORCE SUMMARY*
Labor Force Status: Civilian labor force includes employed and unemployed individuals 16 years and older by place of residence. Employed includes nonfarm payroll employment, self-employed, unpaid family workers, domestics, agriculture, and labor disputants. Unemployment rate is calculated by dividing unemployed by civilian labor force.
Nonfarm Payroll Employment: Data are by place of work and cover full- and part-time employees who worked or received pay for the pay period that includes the 12th of the month. The data exclude the self-employed, volunteers, unpaid family workers, and domestics.

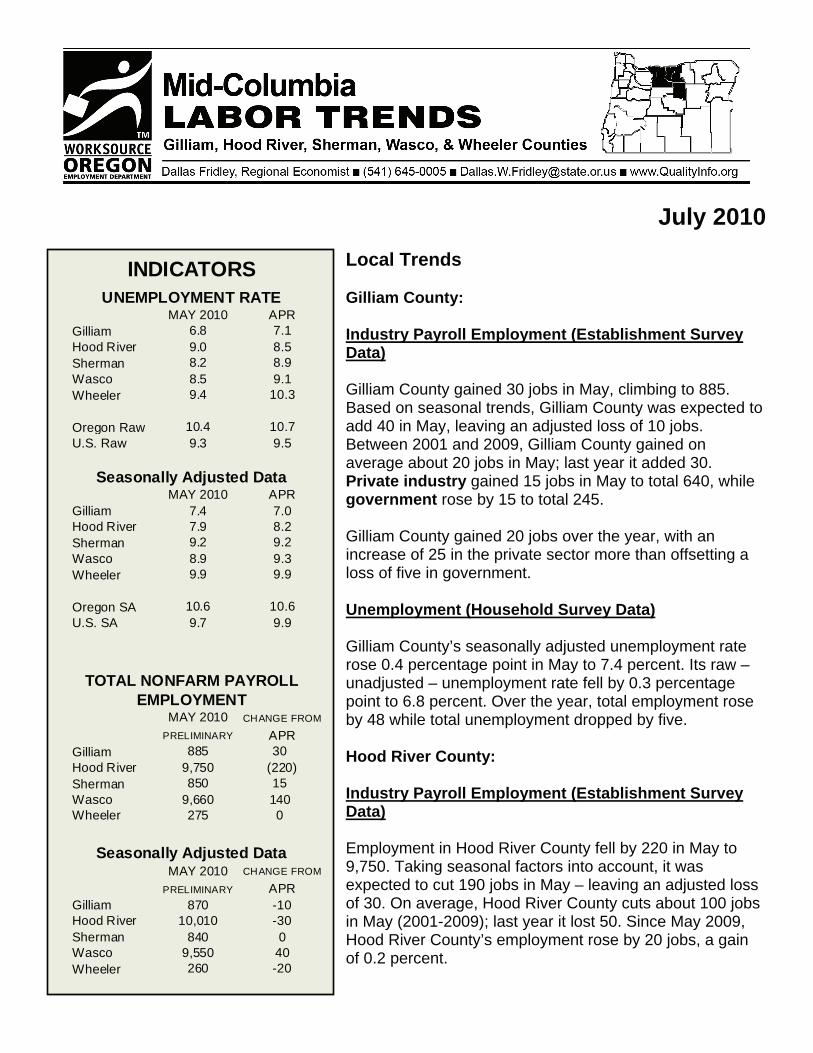
MAY 2010 APRGilliam 6.8 7.1Hood River 9.0 8.5Sherman 8.2 8.9Wasco 8.5 9.1Wheeler 9.4 10.3
Oregon Raw 10.4 10.7U.S. Raw 9.3 9.5
MAY 2010 APRGilliam 7.4 7.0Hood River 7.9 8.2Sherman 9.2 9.2Wasco 8.9 9.3Wheeler 9.9 9.9
Oregon SA 10.6 10.6U.S. SA 9.7 9.9
MAY 2010 CHANGE FROM
PRELIMINARY APRGilliam 885 30Hood River 9,750 (220)Sherman 850 15Wasco 9,660 140Wheeler 275 0
MAY 2010 CHANGE FROM
PRELIMINARY APRGilliam 870 -10Hood River 10,010 -30Sherman 840 0Wasco 9,550 40Wheeler 260 -20
INDICATORSUNEMPLOYMENT RATE
Seasonally Adjusted Data
TOTAL NONFARM PAYROLL EMPLOYMENT
Seasonally Adjusted Data
July 2010
Local Trends Gilliam County: Industry Payroll Employment (Establishment Survey Data) Gilliam County gained 30 jobs in May, climbing to 885. Based on seasonal trends, Gilliam County was expected to add 40 in May, leaving an adjusted loss of 10 jobs. Between 2001 and 2009, Gilliam County gained on average about 20 jobs in May; last year it added 30. Private industry gained 15 jobs in May to total 640, while government rose by 15 to total 245. Gilliam County gained 20 jobs over the year, with an increase of 25 in the private sector more than offsetting a loss of five in government. Unemployment (Household Survey Data) Gilliam County’s seasonally adjusted unemployment rate rose 0.4 percentage point in May to 7.4 percent. Its raw – unadjusted – unemployment rate fell by 0.3 percentage point to 6.8 percent. Over the year, total employment rose by 48 while total unemployment dropped by five. Hood River County: Industry Payroll Employment (Establishment Survey Data) Employment in Hood River County fell by 220 in May to 9,750. Taking seasonal factors into account, it was expected to cut 190 jobs in May – leaving an adjusted loss of 30. On average, Hood River County cuts about 100 jobs in May (2001-2009); last year it lost 50. Since May 2009, Hood River County’s employment rose by 20 jobs, a gain of 0.2 percent.

2 Oregon Employment Department Workforce Analysis Mid-Columbia Trends July 2010
Private industry payrolls fell by 260 jobs in May to total 8,250 while government rose by 40 to 1,500. Over the year, private industry cut 10 jobs and government gained 30. Arts, entertainment, and recreation cut 280 jobs in May. Despite that loss, the industry was 130 jobs ahead of its year-ago total. Generally the industry cuts more jobs in May, last year it lost 410; good news for May – but not for June when the remaining seasonal jobs will be shed. Food services and drinking places rose again in May, adding 70 jobs to total 930 – 10 jobs shy of last year’s total. Wholesale trade pulled back in May, cutting 70 jobs to total 460, slightly below its year-ago level. The next seasonal hiring push for wholesale trade should come in late summer and early fall. Mining, logging, and construction (+10); professional and business services (+10); educational and health services (+10); and accommodation (+10) all added jobs in May. Manufacturing (-10) and other services (-10) ended up in May’s loss column. Compared with last year, professional and business services lost 120 jobs while mining, logging, and construction shed 40. Manufacturing held steady over the year, while accommodation rose by 60, educational and health services gained 20, and other services chipped in 10. A loss of 30 in retail trade and a drop of 10 in information also soured the year-ago outlook. Government gained 40 in May to total 1,500 jobs, with nearly all of the month’s gain – 30 jobs – attributed to federal government (think Census). Other local government chipped in 10 to total 470, but still fell 20 jobs shy of its year-ago level. Federal government gained 40 over the year and state government gained 10. Unemployment (Household Survey Data) Hood River County’s seasonally adjusted unemployment rate fell by 0.3 percentage point in May to 7.9 percent. Its raw – unadjusted – unemployment rate rose by 0.5 percentage point to 9.0 percent. Total unemployment held steady in May at 1,148 but improved over the year, falling by 101.
Mid-Columbia Labor Trends is published by the Workforce and Economic Research Division of the Oregon Employment Department. Mid-Columbia Labor Trends can also be found on the Publications page at www.QualityInfo.org. Material contained in this publication is in the public domain and may be reproduced without permission. Please credit Mid-Columbia Labor Trends, Oregon Employment Department. The Oregon Employment Department is an equal opportunity employer. Auxiliary aids and services are available upon request to individuals with disabilities.
Laurie Warner, Director Graham Slater, Administrator for Workforce and Economic Research Dallas Fridley, Regional Economist Hood River (541) 645-0005 Tony Wendel, Workforce Analyst Hermiston (541) 564-5685 Ron Freeman, Field Office Manager The Dalles (541) 296-5435
Please direct address changes to: Oregon Employment Department Workforce and Economic Research 875 Union St NE Salem OR 97311 Phone (503) 947-1204 TDD (503) 947-1391 e-mail [email protected]
Portland-Salem, OR-WA Jul - Dec 2009 217.191 Yearly Change +2.7% Annual Average 2009 215.389 Yearly Change +1.1%
United States MAY 2010 218.178 Yearly Change +2.0% Annual Average 2009 214.537 Yearly Change -0.4%
Next release: 7/16/2010 http://www.bls.gov/cpi
Consumer Price Index (CPI)All Items, 1982-84=100
Urban Consumers

Oregon Employment Department Workforce Analysis 3 Mid-Columbia Trends July 2010
Sherman County: Industry Payroll Employment (Establishment Survey Data) Employment in Sherman County rose by 15 jobs in May to total 850 – meeting seasonal expectations. From 2001 to 2009, Sherman County gained on average about 15 jobs in May; last year it rose by 15. Over the 12-month period ending in May, Sherman County gained 25 jobs. In May, private industry rose by 10 jobs to total 540, while federal government managed a small gain of five to total 310. Federal government actually rose by 10 jobs over the year (think Census) but local government cut five. Private industry remained positive over the year, gaining 20 jobs. Unemployment (Household Survey Data) Sherman County’s seasonally adjusted unemployment rate held steady in May at 9.2 percent. The raw – unadjusted – unemployment rate fell 0.7 percentage point to 8.2 percent. Unemployment in Sherman County fell by eight in May – while total employment rose by six. Wasco County: Industry Payroll Employment (Establishment Survey Data) Wasco County employment rose by 140 jobs in May and its nonfarm total climbed to 9,660. Seasonal expectations pointed to a gain of 100 jobs – leaving an adjusted increase of 40. On average Wasco County adds around 110 jobs in May (2001-2009); last year it lost 30. Wasco County grew by 250 jobs or 2.7 percent over the year ending in May. Private industry rose by 70 jobs in May to total 7,160. Private job gains in May were concentrated in accommodation and food services, where employment rose by 60 to total 1,070 – 30 jobs ahead of its total last year. Small gains of 10 jobs apiece aided mining and logging, retail trade, and educational and health services, while a loss of 30 in professional and business services evened things out. Private industry gained 240 jobs since last May – led by an increase of 150 in manufacturing. Educational and health services also gained jobs over the year, adding 60 jobs to total 1,790. Professional and business services added 30 since last year, while retail trade gained 10. Construction (-10), and information (-10) ended up in the over-the-year loss column. Government added 70 jobs in May with an increase of 30 in Indian tribal leading the way. May job gains also aided federal government (+20), local education (+10), and other local (+10). Over-the-year gains of 10 jobs apiece in federal government, Indian tribal, and local education offset a loss of 20 in state government. Unemployment (Household Survey Data) Wasco County’s seasonally adjusted unemployment rate fell 0.4 percentage point in May to 8.9 percent. The county’s raw – unadjusted – unemployment rate fell 0.6 percentage point to 8.5 percent.

4 Oregon Employment Department Workforce Analysis Mid-Columbia Trends July 2010
Unemployment improved again in May, falling by 90 to total 1,130, a drop of 122 compared with last year. Wheeler County: Industry Payroll Employment (Establishment Survey Data) Employment in Wheeler County held steady in May to total 275 jobs. On a seasonally adjusted basis, Wheeler County should have gained 20 jobs – while over the past nine years it’s averaged a gain of about 15 jobs in May. Leisure and hospitality gained five jobs in May to total 25 although it fell five shy of its total last May. Government ended up five jobs in the hole in May with a gain of five in federal government erased by a loss of 10 in local government. Unemployment (Household Survey Data) Wheeler County’s seasonally adjusted unemployment rate held steady in May at 9.9 percent. The county’s raw – unadjusted – unemployment rate fell 0.9 percentage point to 9.4 percent. The number of unemployed fell by seven in May to total 64, an increase of five over last year’s total. 2009 Payroll Growth in the Mid-Columbia Region The Mid-Columbia Region was basically at a standstill in 2009, with total payroll climbing 0.1 percent to $753 million. Total employment was little changed in 2009, falling by just two – to total 24,905. The Mid-Columbia’s performance in 2009 was anything but impressive – but Oregon lost about $3.9 billion (-5.6%) in total payroll and nearly 106,000 jobs (-6.2%) in 2009. Despite the massive payroll and job loss, Oregon’s average wage actually climbed in 2009 to $40,740, an increase of $253 (0.6%). The Mid-Columbia also managed a small pay gain, climbing about $26 or 0.1 percent to average $30,253. Looking back, 2008 was a milestone for the state – with average pay climbing above $40,000, while the Mid-Columbia crossed the $30,000 mark. Oregon’s average pay passed the $30,000 mark back in 1999 – nine years earlier – and the $20,000 mark 10 years before that, back in 1989. In the Mid-Columbia, average pay climbed above $20,000 back in 1996, and passed $10,000 in 1978.
8.6
6.0
7.0
8.0
9.0
10.0
11.0
500
600
700
800
900
1,000
1,100
1,200
01 04 07 10 13 16 19 22 25 28 31 34 37 40 43 46 49 52
Un
em
plo
ymen
t Ra
te
UI C
laim
s
Week Number
Mid-Columbia Regular Weekly UI ClaimsWith Raw Monthly Unemployment Rate
2009 2010
09 UR 2010 UR
UI Claims
$0
$10,000
$20,000
$30,000
$40,000
$50,000
1976 1979 1982 1985 1988 1991 1994 1997 2000 2003 2006 2009
Real-Inflation Adjusted and Average Pay - Mid-ColumbiaPortland-Salem, OR-WA CPI-U
Average Pay
Real ($2009) Pay
Graph 1

Oregon Employment Department Workforce Analysis 5 Mid-Columbia Trends July 2010
Average 2009 wages rose slightly in the Mid-Columbia Region – but when adjusted for inflation, as shown in Graph 1, the outlook turns slightly negative. CPI-adjusted real pay spent 18 years below $30,000 (1990-2007). We didn’t know it then – but back in 1978 when average pay topped $10,000, real inflation-adjusted pay was close to $33,000. 2009 County Results The Mid-Columbia’s recent success reflects the continuing development of wind farms in Gilliam and Sherman counties. For Gilliam County, payroll climbed by $14.1 million since 2005 – and increase of about 66 percent in just four years. Consequently, average pay in Gilliam County grew from $27,782 in 2005 to $39,011 in 2009, good enough to rank as Oregon’s 6th highest. Construction payrolls are driving Gilliam County’s good fortune, growing from a base of about three-dozen jobs and $1.4-million payroll in 2005 to over 200 jobs and $11.9-million payroll in 2009. Wages grew substantially – climbing from $38,335 in 2005 to $58,749 in 2009, high enough to rank 2nd statewide. Sherman County’s experience has been similar – with an increase of $18.6 million in payroll, nearly doubling its 2005 total to reach $47.2 million. Average pay in Sherman County rose by nearly 57 percent in four years to $47,246 – ahead of Oregon by $6,506 and good enough to rank second, behind Washington County. Growth in construction pay exceeds expectations, rising from non-disclosed in 2005 (due to confidentiality) to average $119,860 in 2009! Wow! Is that a record for Oregon? Yes it is. Hood River County lost payroll and jobs in 2009, although that outcome was expected given its payroll growth in 2008. Payrolls fell by $8.7 million (-2.5%) to total $341.8 million in 2009, while total employment slipped to 12,175 – a loss of 100. The average wage in Hood River County fell to $28,078 – a loss of about $480 or 1.7 percent. Manufacturing turned in a phenomenal year in 2008 – but it didn’t carry over into 2009. Further complicating the performance of manufacturing was a code change that moved 132 jobs out of manufacturing and into professional and business services. No matter how you slice it, manufacturing payrolls fell by more than $18 million in 2009 and average wages returned to normalcy, at $36,438 – a drop of $9,319 compared with 2008. Wasco County also outperformed the state in 2009, gaining $5.4 million in total payroll along with 54 jobs. Average wages were also on the rise in 2009, climbing to $30,871, an increase of $351 or 1.2 percent over 2008. Natural resources and mining (think cherries) turned in a good year, with near record employment during July and the highest payroll on record, at $28.7 million, an increase of $8.5 million over 2008. Education and health services also provided Wasco County with a big boost in 2009, adding 54 jobs and $2.8 million in new payroll. With payroll at $66.7 million in 2009, education and health services grew to 20 percent of Wasco County’s total. Government employment and payroll
-$20,000,000
-$10,000,000
$0
$10,000,000
$20,000,000
$30,000,000
$40,000,000
$50,000,000
$60,000,000
$70,000,000
$80,000,000
$90,000,000
Gilliam Hood River Sherman Wasco Wheeler
Mid-Columbia Payroll Growth - 2006 to 2009
2009 2008
2007 2006
Graph 2

6 Oregon Employment Department Workforce Analysis Mid-Columbia Trends July 2010
rose slightly in 2009 to total 2,308 jobs and $93.5 million, respectively. With over 21 percent of Wasco County’s jobs and 28 percent of its total payroll, government remains an important industry in the overall mix. Wages in Wheeler County rose by $236 or 1.0 percent to average $24,466 in 2009. Despite the wage gain, Wheeler County still ranked 36th in Oregon – that’s less than half (-52.4%) the average wage paid by the top paying locale: Washington County. Total payroll fell by 1.2 percent to total $6.7 million in 2009 with employment slipped to 275, a loss of six jobs. Oregon’s Employment Oregon’s seasonally adjusted unemployment rate was 10.6 percent in May, the same as in March and April. The rate has been essentially unchanged for the most recent seven months. Oregon’s unemployment rate was 11.6 percent in May 2009, which tied June 2009 as Oregon’s highest unemployment rate since the early 1980s. The U.S. seasonally adjusted unemployment rate dropped to 9.7 percent in May from 9.9 percent in April.
In May, 202,944 Oregonians were unemployed. In May 2009, 223,474 Oregonians were unemployed. In seasonally adjusted terms, both Oregon’s civilian labor force and its number of citizens employed increased modestly in May. This marked the fifth consecutive month of increases in both these figures. Oregon’s seasonally adjusted nonfarm payroll employment was flat in May, following a gain of 5,500 (as revised) in April. Government added 6,800 jobs in May at a time of year when a gain of 3,700 is expected due to seasonality. The addition of 4,451 intermittent Census workers boosted both federal government and total government for May, adding to the 1,952 already working for the Census in April. In the private sector, several major industries posted job declines, while only two major industries produced substantial seasonally adjusted job gains: construction and manufacturing. Construction posted its third consecutive seasonally adjusted job gain. It added 1,700 jobs at a time of year when a gain of 1,200 is the normal seasonal movement. Construction employment stood at 64,200 jobs in May, still well below its May 2009 tally of 73,100.
Manufacturing continued to slowly recover from its recent trough. Seasonally adjusted employment rose 700 in May and is now up 1,400 from its February trough. Over the last several months,
4.0
6.0
8.0
10.0
12.0
14.0
Jan-05 Jul-05 Jan-06 Jul-06 Jan-07 Jul-07 Jan-08 Jul-08 Jan-09 Jul-09 Jan-10
Pe
rce
nt o
f La
bo
r Fo
rce
Month and Year
Oregon and U.S. Seasonally Adjusted Unemployment Rates, January 2005 - Current
U.S. Oregon

Oregon Employment Department Workforce Analysis 7 Mid-Columbia Trends July 2010
durable goods employment continued to hover above 110,000, while nondurable goods steadied slightly below 50,000. Trade, transportation, and utilities normally gains 1,700 jobs due to seasonal factors in May, so this May’s flat employment trend was 1,700 below normal seasonal expectations. Retail trade contributed most of the dismal performance as it added only 300 jobs during the normally rapidly growing spring month of May.
Financial activities gave back its April gains, dropping 800 jobs in May. The industry fell below 93,000 for only the second month in more than 12 years. Professional and business services added only 100 jobs in May when a gain of 800 is the normal seasonal movement. The industry is now close to its December employment level after showing modest gains during the first part of the year.
Educational and health services dropped 1,900 jobs in May, when it normally would drop by only 1,300 for the month. Despite the one-month decline there have been solid long-term gains. Over the past 12 months, health care and social assistance added 1,300 jobs. National Employment The number of unemployed persons was 15.0 million in May. The unemployment rate edged down to 9.7 percent, the same rate as in the first three months of 2010. Nonfarm payroll employment increased by 431,000 in May, reflecting the addition of 411,000 temporary workers for Census 2010. Total private employment showed little change over the month (+41,000), following increases in March and April. In May, manufacturing, temporary help services, and mining added jobs, while employment in construction declined. Manufacturing employment increased by 29,000 over the month. Factory employment rose by 126,000 over the past five months. Within manufacturing, both fabricated metals and machinery added jobs in May. Temporary help services added 31,000 jobs over the month; employment in the industry rose by 362,000 since September 2009. Employment in mining continued to increase in May, with a gain of 10,000. October 2009, mining employment expanded by 50,000. Health care employment was little changed in May (+8,000). Over the prior 12 months, health care employment increased by an average of 20,000 per month. In May, employment in construction declined by 35,000, largely offsetting industry gains in the prior two months. May's job loss was spread throughout the sector. Government employment rose by 390,000 in May. The federal government hired 411,000 temporary workers for Census 2010, bringing total temporary census staffing during the payroll survey reference period to 564,000. Employment in state government excluding education decreased by 13,000.

8 Oregon Employment Department Workforce Analysis Mid-Columbia Trends July 2010
CHANGE FROM
Labor Force Status May-10 Apr-10 May-09 Apr-10 May-09Civilian Labor Force 1,220 1,204 1,177 16 43 Unemployment 83 86 88 (3) (5) Unemployment Rate 6.8 7.1 7.5 XXX XXX
Unemployment Rate, seasonally adjusted 7.4 7.0 8.1 XXX XXX
Total Employment 1,137 1,118 1,089 19 48
Nonfarm Payroll EmploymentTotal nonfarm 885 855 865 30 20 Total private 640 625 615 15 25 Trade, transportation, and utilities 150 150 150 0 0 Professional and business services 145 145 145 0 0 Educational and health services 75 75 65 0 10 Leisure and hospitality 50 45 50 5 0 Government 245 230 250 15 (5) Federal government 15 10 15 5 0 State government 35 35 35 0 0 Local government 195 185 200 10 (5)
CHANGE FROM
Labor Force Status May-10 Apr-10 May-09 Apr-10 May-09Civilian Labor Force 1,114 1,116 1,065 (2) 49 Unemployment 91 99 80 (8) 11 Unemployment Rate 8.2 8.9 7.5 XXX XXX
Unemployment Rate, seasonally adjusted 9.2 9.2 8.5 XXX XXX
Total Employment 1,023 1,017 985 6 38
Nonfarm Payroll EmploymentTotal nonfarm 850 835 825 15 25 Total private 540 530 520 10 20 Trade, transportation, and utilities 225 220 220 5 5 Retail trade 85 85 85 0 0 Leisure and hospitality 140 135 140 5 0 Government 310 305 305 5 5 Federal government 105 100 95 5 10 State government 40 40 40 0 0 Local government 165 165 170 0 (5)
The most recent month is preliminary, the prior month is revised. Civilian labor force includes employed and unemployed individuals 16 years and older by place of residence. Data are adjusted for multiple job-holding and commuting. Includes nonfarm payroll employment, self-employed, unpaid family workers, domestics, agriculture,and labor disputants. Unemployment rate derived by dividing unemployment by civilian labor force.Nonfarm payroll employment data cover full- and part-time employees who worked during or received pay for the pay period that includes the 12th of the month. The data exclude the self-employed, volunteers,unpaid family workers, and domestics. Persons on sick leave, vacations, or holidays, and being paid for that period by their employer, are considered employed. Prepared in cooperation with the U.S. Dept. of Labor
Gilliam County Labor Force and Industry Employment
Sherman County Labor Force and Industry Employment

Oregon Employment Department Workforce Analysis 9 Mid-Columbia Trends July 2010
CHANGE FROM
Labor Force Status May-10 Apr-10 May-09 Apr-10 May-09Civilian Labor Force 12,762 13,509 12,660 (747) 102 Unemployment 1,148 1,148 1,249 0 (101) Unemployment Rate 9.0 8.5 9.9 XXX XXX
Unemployment Rate, seasonally adjusted 7.9 8.2 8.7 XXX XXX
Total Employment 11,614 12,361 11,411 (747) 203
Nonfarm Payroll EmploymentTotal nonfarm 9,750 9,970 9,730 (220) 20 Total private 8,250 8,510 8,260 (260) (10) Mining, logging, and construction 370 360 410 10 (40) Manufacturing 1,210 1,220 1,210 (10) 0 Trade, transportation, and utilities 1,810 1,880 1,860 (70) (50) Wholesale trade 460 530 480 (70) (20) Retail trade 1,210 1,210 1,240 0 (30) Transportation, warehousing, and utilities 140 140 140 0 0 Information 130 130 140 0 (10) Financial activities 310 310 310 0 0 Professional and business services 730 720 850 10 (120) Educational and health services 1,830 1,820 1,810 10 20 Leisure and hospitality 1,600 1,800 1,420 (200) 180 Arts, entertainment, and recreation 340 620 210 (280) 130 Accommodation and food services 1,260 1,180 1,210 80 50 Accommodation 330 320 270 10 60 Food services and drinking places 930 860 940 70 (10) Other services 260 270 250 (10) 10 Government 1,500 1,460 1,470 40 30 Federal government 150 120 110 30 40 State government 140 140 130 0 10 Local government 1,210 1,200 1,230 10 (20) Local government education 740 740 740 0 0 Local government other 470 460 490 10 (20)
The most recent month is preliminary, the prior month is revised. Civilian labor force includes employed and unemployed individuals 16 years and older by place of residence. Data are adjusted for multiple job-holding and commuting. Includes nonfarm payroll employment, self-employed, unpaid family workers, domestics, agriculture,and labor disputants. Unemployment rate derived by dividing unemployment by civilian labor force.Nonfarm payroll employment data cover full- and part-time employees who worked during or received pay for the pay period that includes the 12th of the month. The data exclude the self-employed, volunteers,unpaid family workers, and domestics. Persons on sick leave, vacations, or holidays, and being paid for that period by their employer, are considered employed. Prepared in cooperation with the U.S. Dept. of Labor
Hood River County Labor Force and Industry Employment

10 Oregon Employment Department Workforce Analysis Mid-Columbia Trends July 2010
CHANGE FROM
Labor Force Status May-10 Apr-10 May-09 Apr-10 May-09Civilian Labor Force 13,360 13,469 12,920 (109) 440 Unemployment 1,130 1,220 1,252 (90) (122) Unemployment Rate 8.5 9.1 9.7 XXX XXX
Unemployment Rate, seasonally adjusted 8.9 9.3 10.2 XXX XXX
Total Employment 12,230 12,249 11,668 (19) 562
Nonfarm Payroll EmploymentTotal nonfarm 9,660 9,520 9,410 140 250 Total private 7,160 7,090 6,920 70 240 Mining and logging 50 40 50 10 0 Construction 320 320 330 0 (10) Manufacturing 620 620 470 0 150 Trade, transportation, and utilities 1,900 1,890 1,890 10 10 Wholesale trade 160 160 160 0 0 Retail trade 1,540 1,530 1,530 10 10 Transportation, warehousing, and utilities 200 200 200 0 0 Information 100 100 110 0 (10) Financial activities 350 350 350 0 0 Professional and business services 530 560 500 (30) 30 Educational and health services 1,790 1,780 1,730 10 60 Ambulatory health care services 360 360 350 0 10 Nursing and residential care facilities 540 520 510 20 30 Leisure and hospitality 1,180 1,110 1,170 70 10 Accommodation and food services 1,070 1,010 1,040 60 30 Other services 320 320 320 0 0 Government 2,500 2,430 2,490 70 10 Federal government 340 320 330 20 10 State government 320 320 340 0 (20) Local government 1,840 1,790 1,820 50 20 Indian tribal 370 340 360 30 10 Local education 820 810 810 10 10 Local government other 650 640 650 10 0
The most recent month is preliminary, the prior month is revised. Civilian labor force includes employed and unemployed individuals 16 years and older by place of residence. Data are adjusted for multiple job-holding and commuting. Includes nonfarm payroll employment, self-employed, unpaid family workers, domestics, agriculture,and labor disputants. Unemployment rate derived by dividing unemployment by civilian labor force.Nonfarm payroll employment data cover full- and part-time employees who worked during or received pay for the pay period that includes the 12th of the month. The data exclude the self-employed, volunteers,unpaid family workers, and domestics. Persons on sick leave, vacations, or holidays, and being paid for that period by their employer, are considered employed. Prepared in cooperation with the U.S. Dept. of Labor
Wasco County Labor Force and Industry Employment

Oregon Employment Department Workforce Analysis 11 Mid-Columbia Trends July 2010
CHANGE FROM
Labor Force Status May-10 Apr-10 May-09 Apr-10 May-09Civilian Labor Force 682 691 661 (9) 21 Unemployment 64 71 59 (7) 5 Unemployment Rate 9.4 10.3 8.9 XXX XXX
Unemployment Rate, seasonally adjusted 9.9 9.9 9.4 XXX XXX
Total Employment 618 620 602 (2) 16
Nonfarm Payroll EmploymentTotal nonfarm 275 275 280 0 (5) Total private 125 120 130 5 (5) Trade, transportation, and utilities 35 35 35 0 0 Leisure and hospitality 25 20 30 5 (5) Government 150 155 150 (5) 0 Federal government 10 5 10 5 0 State government 10 10 10 0 0 Local government 130 140 130 (10) 0
The most recent month is preliminary, the prior month is revised. Civilian labor force includes employed and unemployed individuals 16 years and older by place of residence. Data are adjusted for multiple job-holding and commuting. Includes nonfarm payroll employment, self-employed, unpaid family workers, domestics, agriculture,and labor disputants. Unemployment rate derived by dividing unemployment by civilian labor force.Nonfarm payroll employment data cover full- and part-time employees who worked during or received pay for the pay period that includes the 12th of the month. The data exclude the self-employed, volunteers,unpaid family workers, and domestics. Persons on sick leave, vacations, or holidays, and being paid for that period by their employer, are considered employed. Prepared in cooperation with the U.S. Dept. of Labor
Wheeler County Labor Force and Industry Employment


July 2010 Local Trends Morrow County: Industry Payroll Employment (Establishment Survey Data) Morrow County added 10 jobs in May to total 3,350. Seasonal expectations called for a gain of 20 jobs, leaving a seasonally adjusted loss of 10. On average, Morrow County adds about 10 jobs in May (2001-2009); last year it shed 300. Nonfarm employment gained 190 jobs over the year, with the private sector adding 170 and government climbing by 20. Private industry cut 20 jobs in May to total 2,400 jobs. A loss of 30 in manufacturing was more than enough to offset a gain of 10 in leisure and hospitality. Over the year, manufacturing revealed a gain of 180 jobs – but in reality the 2009 total reflected a brief (one-month) layoff which will even out in June. Elsewhere, small gains of 10 jobs apiece lifted construction, financial activities, professional and business services, and educational and health services. Private industry losses in transportation, warehousing, and utilities (-20); leisure and hospitality (-20); and wholesale trade (-10) cut into the year-ago comparison. An increase of 20 in local government and 10 in federal government lifted the public sector by 30 in May to total 950 jobs. An over-the-year gain of 20 for government was evenly split between federal government and local government. Unemployment (Household Survey Data) Morrow County’s seasonally adjusted unemployment rate fell by 0.1 percentage point in May to 9.4 percent. The county’s raw – unadjusted – unemployment rate moved downward by 0.7 percentage point to 8.3 percent. The number of unemployed improved in May, falling by 44 to total 466 – a drop of 196 compared with last year.
MAY 2010 APRMorrow 8.3 9.0Umatilla 9.2 10.0
Oregon Raw 10.4 10.7U.S. Raw 9.3 9.5
MAY 2010 APRMorrow 9.4 9.5Umatilla 10.0 9.9
Oregon SA 10.6 10.6U.S. SA 9.7 9.9
MAY 2010 CHANGE FROM
PRELIMINARY APRMorrow 3,350 10Umatilla 27,450 190
MAY 2010 CHANGE FROM
PRELIMINARY APRMorrow 3,340 -10Umatilla 27,460 190
Portland-Salem, OR-WA217.191
+2.7%215.389
+1.1%
United States218.178
+2.0%214.537
-0.4% Next release: 7/16/2010 http://www.bls.gov/cpi
Annual Average 2009Yearly Change
Jul - Dec 2009Yearly Change
Annual Average 2009Yearly Change
MAY 2010Yearly Change
Consumer Price Index (CPI)All Items, 1982-84=100
Urban Consumers
UNEMPLOYMENT RATE
Seasonally Adjusted Data
TOTAL NONFARM PAYROLL
Seasonally Adjusted Data
INDICATORS

2 Oregon Employment Department Workforce Analysis Morrow/Umatilla Trends July 2010
Umatilla County: Industry Payroll Employment (Establishment Survey Data) Employment in Umatilla County rose by 190 jobs in May to total 27,450, meeting seasonal expectations. On average, employment rises by about 200 jobs in May (2001-2009); last year it rose by 70. Umatilla County lost 250 jobs over the year, a drop of 0.9 percent. Private industry gained 210 jobs in May to total 19,560. Manufacturing gained 40 jobs in May, with durable goods manufacturing adding 30 and food manufacturing increasing by 10. Wholesale trade added 40 jobs in May, and accommodation and food services also gained 40 jobs. Professional and business services added back 30 jobs in May, but the industry remains 80 jobs below its year-ago total with 2,340 jobs. Other private industry gains in May included transportation, warehousing, and utilities (+20); mining, logging, and construction (+10); retail trade (+10); and educational and health services (+10). Private industry added 60 jobs since last May, with a gain of 180 in durable goods manufacturing leading the way. Food manufacturing was 60 jobs shy of its year-ago total, leaving manufacturing with a gain of 120. Retail trade held steady over the year although general merchandise stores cut 90 jobs which food and beverage stores offset by gaining 100. Educational and health services rose by 70 over the year to total 2,890, while transportation, warehousing, and utilities gained 40. Losses in mining, logging, and construction (-40); financial activities (-40); and leisure and hospitality (-10) dampened the private sector’s year-ago comparison. The public sector cut 20 jobs in May to total 7,890 despite a gain of 70 in federal government (think Census). A loss of 110 in local education did all the damage, also offsetting a gain of 10 in Indian tribal and 10 in other local. Government cut 310 jobs since last May, including a loss of 190 in local education, a drop of 130 in state government and a reduction of 90 in other local. Indian tribal maintained its positive outlook, gaining 40 over the year, while federal government added 60.
9.1
7.0
8.0
9.0
10.0
11.0
12.0
13.0
800
1,000
1,200
1,400
1,600
1,800
2,000
2,200
01 04 07 10 13 16 19 22 25 28 31 34 37 40 43 46 49 52
Un
em
plo
ymen
t Ra
te
UI C
laim
s
Week Number
Columbia Basin Regular Weekly UI ClaimsWith Raw Monthly Unemployment Rate
2009 2010
09 UR 2010 UR
UI Claims
Morrow Umatilla Labor Trends is published by the Workforce and Economic Research Division of the Oregon Employment Department. Morrow Umatilla Labor Trends can also be found on the Publications page at www.QualityInfo.org. Material contained in this publication is in the public domain and may be reproduced without permission. Please credit Morrow Umatilla Labor Trends, Oregon Employment Department. The Oregon Employment Department is an equal opportunity employer. Auxiliary aids and services are available upon request to individuals with disabilities.
Laurie Warner, Director Graham Slater, Administrator for Workforce and Economic Research Dallas Fridley, Regional Economist Hood River, (541) 645-0005 Tony Wendel, Workforce Analyst Hermiston (541) 564-5685 Kathy Mendoza, Field Office Manager Hermiston (541) 567-3381 Pendleton (541) 276-9050 Milton-Freewater (541) 938-3371
Please direct address changes to: Oregon Employment Department Workforce and Economic Research 875 Union St NE Salem OR 97311 Phone (503) 947-1204 TDD (503) 947-1391 e-mail [email protected]

Oregon Employment Department Workforce Analysis 3 Morrow/Umatilla Trends July 2010
Unemployment (Household Survey Data) Umatilla County’s seasonally adjusted unemployment rate rose by 0.1 percentage point in May to 10.0 percent. The county’s raw – unadjusted – unemployment rate fell by 0.8 percentage point to 9.2 percent. The number of unemployed improved in May, falling by 322 to total 3,609 – about 126 fewer than last year’s total. 2009 Payroll Growth in the Columbia Basin Payrolls in the Columbia Basin Region rose to $1.1 billion in 2009, an increase of $19.6 million or 1.8 percent compared with 2008. Total employment fell 2.4 percent to total 33,189, a loss of over 800 jobs. Compared with Oregon’s loss of about $3.9 billion (-5.6%) in total payroll and nearly 106,000 jobs (-6.2%), the Columbia Basin Region outperformed most of the state. Despite the massive payroll and job loss, Oregon’s average wage actually climbed in 2009 to $40,740, an increase of $253 (0.6%). The Columbia Basin managed a pay gain of its own, climbing nearly $1,400 or 1.8 percent to average $34,214. Looking back, 2008 was a milestone for the state – with average pay climbing above $40,000. Oregon’s average pay passed the $30,000-mark back in 1999 – nine years earlier – and the $20,000-mark ten years before that, back in 1989. In the Columbia Basin Region, average pay climbed above $30,000 just two years ago, in 2006; it passed $20,000 in 1994. Morrow County total payroll grew to $158.6 million in 2009 – an increase of $8.4 million or 5.6 percent compared with 2008. Morrow County’s payroll dipped slightly in 2008 (-$1.7 million) but during the prior seven years, payroll grew an average of $9.5 million or 11.3 percent annually. Construction was the reason for the payroll loss in 2008 since there were no major projects – like bio-fuels – with specialized heavy construction work. Payrolls in construction plunged from $15.2 million in 2007 to just $1.5 million in 2008; the industry also lost payroll in 2009. Manufacturing continued to expand in 2009, growing its payroll by over $3 million to total $44.4 million. With 1,090 jobs in 2009 (+42), manufacturing represented more than one-fourth of Morrow County jobs. Wholesale trade boosted payrolls by $2.2 million and the industry’s job total rose to 271 (+16.8%). Natural resources (think agriculture) and mining gained $1.7 million in payroll to total nearly $40 million. Natural resources and mining boasted 1,099 jobs in 2009, an increase of 75 over 2008 and just edging out manufacturing as the county’s largest industry. Umatilla County’s payroll climbed to $976.9 million in 2008, an increase of $11.2 million or 1.2 percent. Looking at employment, however, 2009 was certainly in the red, falling by 908 jobs or 3.0 percent to total 28,878. Umatilla County’s manufacturing industry showed the full impact of jobs lost
$(20,000,000)
$-
$20,000,000
$40,000,000
$60,000,000
$80,000,000
$100,000,000
$120,000,000
$140,000,000
Morrow Umatilla
Columbia Basin Payroll Growth - 2006 to 2009
2009 2008
2007 2006
Graph 1

4 Oregon Employment Department Workforce Analysis Morrow/Umatilla Trends July 2010
at the end of 2008, falling $8.5 million to total $90.2 million (-8.6%). The 2009 drop followed a loss of $9.7 million 2008, bringing the two-year payroll decline to $18.2 million with 613 jobs lost. Natural resources and mining (think agriculture) lost $4.7 million in 2009, reversing its fortune after gaining $3.5 million in 2008. Professional and business services provided Umatilla County with its biggest payroll boost, adding $12.7 million to total $113.8 million. Job losses at the start of 2010 will likely mean a payroll loss for professional and business services. Government payrolls continue to grow in Umatilla County, climbing to $306.9 million in 2009, an increase of $5.4 million or 1.8 percent. Average Pay Morrow County’s average pay gained $1,197 in 2009 to average $36,799. Umatilla County managed a slightly higher wage gain in 2009, climbing $1,406 to average $33,828; about $3,000 less than Morrow County and about $7,000 less than Oregon’s average. Average 2009 wages rose to $34,214 in the Columbia Basin Region – as shown in Graph 2. CPI-adjusted real wages also rose over the year, but remain about $900 below the 1976 peak. We didn’t know it then – but back in 1976, real inflation-adjusted pay was around $35,000. Although the region has some ground to make up, it has made great progress since bottoming out in 1996, when adjusted pay was $28,901. Oregon’s Employment Oregon’s seasonally adjusted unemployment rate was 10.6 percent in May, the same as in March and April. The rate has been essentially unchanged for the most recent seven months. Oregon’s unemployment rate was 11.6 percent in May 2009, which tied June 2009 as Oregon’s highest unemployment rate since the early 1980s. The U.S. seasonally adjusted unemployment rate dropped to 9.7 percent in May from 9.9 percent in April.
In May, 202,944 Oregonians were unemployed. In May 2009, 223,474 Oregonians were unemployed. In seasonally adjusted terms, both Oregon’s civilian labor force and its number of citizens employed increased modestly in May. This marked the fifth consecutive month of increases in both these figures. Oregon’s seasonally adjusted nonfarm payroll employment was flat in May, following a gain of 5,500 (as revised) in April. Government added 6,800 jobs in May at a time of year when a gain of 3,700 is expected due to seasonality. The addition of 4,451 intermittent Census workers boosted both federal government and total government for May, adding to the 1,952 already working for the Census in April.
$0
$5,000
$10,000
$15,000
$20,000
$25,000
$30,000
$35,000
$40,000
1976 1979 1982 1985 1988 1991 1994 1997 2000 2003 2006 2009
Real-Inflation Adjusted and Average PayColumbia Basin
Portland-Salem, OR-WA CPI-U
Average Pay
Real ($2008) Pay
Graph 2

Oregon Employment Department Workforce Analysis 5 Morrow/Umatilla Trends July 2010
In the private sector, several major industries posted job declines, while only two major industries produced substantial seasonally adjusted job gains: construction and manufacturing. Construction posted its third consecutive seasonally adjusted job gain. It added 1,700 jobs at a time of year when a gain of 1,200 is the normal seasonal movement. Construction employment stood at 64,200 jobs in May, still well below its May 2009 tally of 73,100.
Manufacturing continued to slowly recover from its recent trough. Seasonally adjusted employment rose 700 in May and is now up 1,400 from its February trough. Over the last several months, durable goods employment continued to hover above 110,000, while nondurable goods steadied slightly below 50,000. Trade, transportation, and utilities normally gains 1,700 jobs due to seasonal factors in May, so this May’s flat employment trend was 1,700 below normal seasonal expectations. Retail trade contributed most of the dismal performance as it added only 300 jobs during the normally rapidly growing spring month of May.
Financial activities gave back its April gains, dropping 800 jobs in May. The industry fell below 93,000 for only the second month in more than 12 years. Professional and business services added only 100 jobs in May when a gain of 800 is the normal seasonal movement. The industry is now close to its December employment level after showing modest gains during the first part of the year.
Educational and health services dropped 1,900 jobs in May, when it normally would drop by only 1,300 for the month. Despite the one-month decline there have been solid long-term gains. Over the past 12 months, health care and social assistance added 1,300 jobs. National Employment The number of unemployed persons was 15.0 million in May. The unemployment rate edged down to 9.7 percent, the same rate as in the first three months of 2010. Nonfarm payroll employment increased by 431,000 in May, reflecting the addition of 411,000 temporary workers for Census 2010. Total private employment showed little change over the month (+41,000), following increases in March and April. In May, manufacturing, temporary help services, and mining added jobs, while employment in construction declined.
4.0
6.0
8.0
10.0
12.0
14.0
Jan-05 Jul-05 Jan-06 Jul-06 Jan-07 Jul-07 Jan-08 Jul-08 Jan-09 Jul-09 Jan-10
Pe
rce
nt o
f La
bo
r Fo
rce
Month and Year
Oregon and U.S. Seasonally Adjusted Unemployment Rates, January 2005 - Current
U.S. Oregon

6 Oregon Employment Department Workforce Analysis Morrow/Umatilla Trends July 2010
Manufacturing employment increased by 29,000 over the month. Factory employment rose by 126,000 over the past five months. Within manufacturing, both fabricated metals and machinery added jobs in May. Temporary help services added 31,000 jobs over the month; employment in the industry rose by 362,000 since September 2009. Employment in mining continued to increase in May, with a gain of 10,000. Support activities for mining accounted for 8,000 of the over-the-month increase. Since October 2009, mining employment expanded by 50,000. Health care employment was little changed in May (+8,000). Over the prior 12 months, health care employment increased by an average of 20,000 per month. In May, employment in construction declined by 35,000, largely offsetting industry gains in the prior two months. May's job loss was spread throughout the sector. Employment in other private-sector industries, including wholesale trade, retail trade, transportation and warehousing, information, financial activities, and leisure and hospitality showed little or no change in May. Government employment rose by 390,000 in May. The federal government hired 411,000 temporary workers for Census 2010, bringing total temporary census staffing during the payroll survey reference period to 564,000. Employment in state government excluding education decreased by 13,000.

Oregon Employment Department Workforce Analysis 7 Morrow/Umatilla Trends July 2010
CHANGE FROM
Labor Force Status May-10 Apr-10 May-09 Apr-10 May-09Civilian Labor Force 5,643 5,651 5,744 (8) (101) Unemployment 466 510 662 (44) (196) Unemployment Rate 8.3 9.0 11.5 XXX XXX
Unemployment Rate, seasonally adjusted 9.4 9.5 13.0 XXX XXX
Total Employment 5,177 5,141 5,082 36 95
Nonfarm Payroll EmploymentTotal nonfarm 3,350 3,340 3,160 10 190 Total private 2,400 2,420 2,230 (20) 170 Mining and logging 10 10 10 0 0 Construction 50 50 40 0 10 Manufacturing 1,060 1,090 880 (30) 180 Trade, transportation, and utilities 770 770 800 0 (30) Wholesale trade 270 270 280 0 (10) Retail trade 180 180 180 0 0 Transportation, warehousing, and utilities 320 320 340 0 (20) Information 20 20 20 0 0 Financial activities 90 90 80 0 10 Professional and business services 70 70 60 0 10 Educational and health services 140 140 130 0 10 Leisure and hospitality 140 130 160 10 (20) Other services 50 50 50 0 0 Government 950 920 930 30 20 Federal government 80 70 70 10 10 State government 130 130 130 0 0 Local government 740 720 730 20 10
The most recent month is preliminary, the prior month is revised. Civilian labor force includes employed and unemployed individuals 16 years and older by place of residence. Data are adjusted for multiple job-holding and commuting. Includes nonfarm payroll employment, self-employed, unpaid family workers, domestics, agriculture,and labor disputants. Unemployment rate derived by dividing unemployment by civilian labor force.Nonfarm payroll employment data cover full- and part-time employees who worked during or received pay for the pay period that includes the 12th of the month. The data exclude the self-employed, volunteers,unpaid family workers, and domestics. Persons on sick leave, vacations, or holidays, and being paid for that period by their employer, are considered employed. Prepared in cooperation with the U.S. Dept. of Labor
Morrow County Labor Force and Industry Employment

8 Oregon Employment Department Workforce Analysis Morrow/Umatilla Trends July 2010
CHANGE FROM
Labor Force Status May-10 Apr-10 May-09 Apr-10 May-09Civilian Labor Force 39,304 39,382 38,773 (78) 531 Unemployment 3,609 3,931 3,735 (322) (126) Unemployment Rate 9.2 10.0 9.6 XXX XXX
Unemployment Rate, seasonally adjusted 10.0 9.9 10.5 XXX XXX
Total Employment 35,695 35,451 35,038 244 657
Nonfarm Payroll EmploymentTotal nonfarm 27,450 27,260 27,700 190 (250) Total private 19,560 19,350 19,500 210 60 Mining, logging and construction 990 980 1,030 10 (40) Manufacturing 2,750 2,710 2,630 40 120 Durable goods 1,140 1,110 960 30 180 Nondurable goods 1,610 1,600 1,670 10 (60) Food manufacturing 1,430 1,420 1,490 10 (60) Trade, transportation, and utilities 6,600 6,530 6,560 70 40 Wholesale trade 750 710 750 40 0 Retail trade 3,170 3,160 3,170 10 0 Food and beverage stores 690 690 590 0 100 General merchandise stores 810 810 900 0 (90) Transportation, warehousing, and utilities 2,680 2,660 2,640 20 40 Information 210 210 210 0 0 Financial activities 820 820 860 0 (40) Professional and business services 2,340 2,310 2,420 30 (80) Educational and health services 2,890 2,880 2,820 10 70 Nursing and residential care facilities 780 780 750 0 30 Leisure and hospitality 2,270 2,220 2,280 50 (10) Accommodation and food services 2,090 2,050 2,110 40 (20) Other services 690 690 690 0 0 Government 7,890 7,910 8,200 (20) (310) Federal government 950 880 890 70 60 State government 1,870 1,870 2,000 0 (130) Local government 5,070 5,160 5,310 (90) (240) Indian tribal 1,400 1,390 1,360 10 40 Local education 2,630 2,740 2,820 (110) (190) Local government other 1,040 1,030 1,130 10 (90)
The most recent month is preliminary, the prior month is revised. Civilian labor force includes employed and unemployed individuals 16 years and older by place of residence. Data are adjusted for multiple job-holding and commuting. Includes nonfarm payroll employment, self-employed, unpaid family workers, domestics, agriculture,and labor disputants. Unemployment rate derived by dividing unemployment by civilian labor force.Nonfarm payroll employment data cover full- and part-time employees who worked during or received pay for the pay period that includes the 12th of the month. The data exclude the self-employed, volunteers,unpaid family workers, and domestics. Persons on sick leave, vacations, or holidays, and being paid for that period by their employer, are considered employed. Prepared in cooperation with the U.S. Dept. of Labor
Umatilla County Labor Force and Industry Employment

July 2010
The Latest Employment Data
The state’s seasonally adjusted unemployment rate was 10.6 percent in May, unchanged from April (10.6%). The nation’s rate was 9.7 percent in May. The total number of people employed in Oregon – estimated from a survey of households – was almost unchanged in April, increasing by only 784 from April to May but the number of people unemployed decreased by about 7,000. Total employment was about 1,700 higher this May than last year and the number of unemployed people dropped by about 20,000 over the year. Nonfarm payroll employment in Oregon – estimated from a survey of businesses – increased by about 12,000 in May but was about 20,000 lower than one year before. The seasonally adjusted unemployment rates in May were lower in Columbia and Tillamook counties than in April and Clatsop County’s rate was essentially unchanged. Total employment rose in Clatsop and Tillamook counties and the number of people unemployed decreased in all three counties. CLATSOP COUNTY Clatsop County’s seasonally adjusted unemployment rate in May was 9.5 percent, essentially the same as its 9.4 percent rate in April. The rate was 9.5 percent the previous May. The estimated number of unemployed in May fell by 150 to 1,789 – this was about the same as one year before. The estimated number of employed Clatsop County residents climbed by 123 to 18,872. This was 42 more than one year before. Seasonally adjusted total nonfarm payroll employment in Clatsop County dropped by 60 jobs in May.
Economic Indicators Unemployment Rates
Seasonally Adjusted Clatsop May 9.5% April 9.4% Columbia May 12.0% April 12.5% Tillamook May 9.1% April 9.6% Portland PMSA May 10.3% April 10.4% Oregon May 10.6% April 10.6% United States May 9.7% April 9.9%
Average Pay Per Job – 2009
Clatsop County $30,879 Columbia County $32,474 Tillamook County $30,512
Consumer Price Index (CPI) Monthly Annual Change Change
United States +0.1% +2.0% (May) Portland PMSA 0.5%
(July-Dec. 2009)
Consumer Confidence From the Conference Board
Monthly Index Change
May 63.3 +5.6
Federal Reserve Data Monthly Level Change
Prime Rate June19 3.25% 0
OR GDP Index May +0.20%

2 Oregon Employment Department Workforce Analysis Northwest Oregon Trends July 2010
A gain of 300 jobs is normal for the month, but nonfarm employment in the county increased by only 240 to 16,720. The private sector added 190 jobs and governments added 50. Leisure and hospitality added 90 jobs and food manufacturing added 150. The federal government added 50 jobs due to the 2010 Census. May’s total nonfarm payroll employment was 290 jobs below its year-before level. The county lost jobs in construction, manufacturing, professional and business services, and educational and health services but gained some in leisure and hospitality. Community News Nepal on Exchange is a new clothing store in Astoria that sells clothing from Nepal. ViReal Studios opened in Seaside. ViReal is a video production company for commercial marketing. The Daily Astorian, June 3, 2010 Shane Dean Construction in Seaside expanded its employment and now offers weatherization services. Daily Astorian, June 10, 2010 The Port of Astoria leased some of its property to Tongue Point Investors. The company hopes to build a 20-megawatt, electric-generating plant fueled by biomass. Columbia Wind is a new kite shop in Astoria. The Daily Astorian, May 27, 2010 The Lewis and Clark National Historical Park, near Astoria, hired eight students for the summer to build a trail. The Daily Astorian, June 15, 2010 Cannon Beach Hardware and Public House is a new, combined hardware store and pub that offers fasteners, garden tools and beer on tap. The Daily Astorian, June 17 2010
0
2
4
6
8
10
12
14
May-05 May-06 May-07 May-08 May-09 May-10
Pe
rce
nt
Seasonally Adjusted Unemployment Rates
Oregon Clatsop County
-1,500
-1,000
-500
0
500
1,000
May-08 Aug-08 Nov-08 Feb-09 May-09 Aug-09 Nov-09 Feb-10 May-10
Clatsop County: Year-to-Year Employment Change May 2008 to May 2010
Northwest Oregon Labor Trends is published by the Workforce and Economic Research Division of the Oregon Employment Department. Northwest Oregon Labor Trends also can be found on the Publications page at www.QualityInfo.org. Material contained in this publication is in the public domain and May be reproduced without permission. Please credit Northwest Oregon Labor Trends, Oregon Employment Department.
Laurie Warner, Director Graham Slater, Administrator for Workforce and Economic Research Erik Knoder, Regional Economist Jill Cuyler, Workforce Analyst (503) 612-4277 Joyce Aho, Field Office Manager Astoria (503) 325-4821 St. Helens (503) 397-4995 Tillamook (503) 842-4488
Please direct address changes to: Oregon Employment Department Workforce and Economic Research 875 Union St NE Salem OR 97311 Phone (503) 947-1204 TDD (503) 947-1391 e-mail [email protected] The Oregon Employment Department is an equal opportunity employer. Auxiliary aids and services are available upon request to individuals with disabilities.

Oregon Employment Department Workforce Analysis 3 Northwest Oregon Trends July 2010
COLUMBIA COUNTY Columbia County’s seasonally adjusted unemployment rate was 12.0 percent in May – a drop from 12.5 percent in April. The county’s rate was 14.0 percent one year before. The number of unemployed people decreased by 201 in May to 2,855. This was 536 fewer unemployed than one year before. The number of employed people fell by 69 to 21,461. This was 93 fewer than one year before. Columbia County’s seasonally adjusted total nonfarm employment rose by 120 in May. A gain of 110 jobs is normal for the month but nonfarm employment in the county increased by 230 to 9,940. The private sector added 110 jobs and governments added 120 jobs. About half the industries in the county added small numbers of jobs in May. Local governments added 20 jobs and the federal government added 60 primarily for the 2010 Census. Total nonfarm employment in the county was 20 more than one year before. This is the first over-the-year gain in jobs since the recession began and it supports the conclusion that the recession is probably over for Columbia County. The county gained jobs in finance and professional and business services but lost jobs in many other industries. Community News Estate Auctions NW is a new St. Helens business with two employees. Pacific Stainless Products of St. Helens is opening a new business unit, PSP Powder Coatings. The Chronicle, June 2, 2010 TILLAMOOK COUNTY Tillamook County’s seasonally adjusted unemployment rate in May was 9.1 percent, a decrease from April (9.6%). The rate was 10.1 percent one year before. The estimated number of unemployed fell by 103 in May to 1,121. This was 82 fewer than one year
0
2
4
6
8
10
12
14
16
May-05 May-06 May-07 May-08 May-09 May-10
Pe
rce
nt
Seasonally Adjusted Unemployment Rates
Oregon Columbia County, OR
-1,400
-1,200
-1,000
-800
-600
-400
-200
0
200
400
600
May-08 Aug-08 Nov-08 Feb-09 May-09 Aug-09 Nov-09 Feb-10 May-10
Columbia County: Year-to-Year Employment Change May 2008 to May 2010
0
2
4
6
8
10
12
14
May-05 May-06 May-07 May-08 May-09 May-10
Pe
rce
nt
Seasonally Adjusted Unemployment Rates
Oregon Tillamook County, OR

4 Oregon Employment Department Workforce Analysis Northwest Oregon Trends July 2010
before. The number of employed rose by 30 to 12,179. This was 511 more people employed than one year before. Tillamook County’s seasonally adjusted total nonfarm payroll employment dropped by 60 in May. A gain of 170 jobs is normal for the month but the county added only 110. The private sector didn’t add any jobs and governments supplied all 110. Local governments added 50 jobs and the federal government contributed another 50, primarily because of the 2010 Census. Nonfarm employment was 200 above the level one year before. Most service industries added some jobs over the year and government employment grew by 80 jobs. Community News Sure Win Enterprises, an automotive repair and towing business, and NAPA Auto Parts, both in Cloverdale, closed, at least temporarily, due to fire damage. The Second Street Market in Tillamook opened. The market will lease space to around 15 vendors. Headlight Herald, June 2, 2010 Tillamook School District plans to cut nine full-time and six part-time teaching positions and 20 half-time classified positions due to budget cuts next year. Wild Flower Thrift Store in Tillamook expanded by hiring an appliance service technician to refurbish large appliances the shop will now sell. Headlight Herald, June 9, 2010 Oregon’s Commercial Fishing Revenue Increased in 2009 Oregon’s commercial fishing industry had another good year in 2009. Total landed value increased by about $3 million from 2008. The gain in the value of the Dungeness crab harvest offset declines in revenue from salmon, pink shrimp and whiting – which is used to make artificial crab meat. The landed value of all fish increased from about $102 million in 2008 to $105 million in 2009. Crab harvests in 2009 were nearly 22 million pounds and prices remained around the $2 per pound mark, allowing the fleet to land about $42 million worth of crab – well above the average harvest. The crab harvest was worth about $29 million in 2008. The closure of part of the salmon grounds resulted in a harvest of only 2.3 million pounds – a little over half its average level since 2000. Prices slipped in 2009 and the landed value of the salmon fishery was $3.5 million – about the average for the 1990s. The pink shrimp harvest fell 13 percent and the price also fell so total value dropped by roughly half from 2008 to around $7 million in 2009. The amount of whiting landed increased but a drop in price led to a 40 percent drop in the total landed value for this fishery. Most other major fisheries
-400
-300
-200
-100
0
100
200
300
May-08 Aug-08 Nov-08 Feb-09 May-09 Aug-09 Nov-09 Feb-10 May-10
Tillamook County: Year-to-Year Employment Change May 2008 to May 2010

Oregon Employment Department Workforce Analysis 5 Northwest Oregon Trends July 2010
changed little from 2008, although, interestingly, the harvests of many types of shellfish increased in 2009. Estimated employment in commercial fishing seems to have increased in 2009, to 1,767 from 1,603 in 2008. Measuring employment in fishing is more difficult than measuring the harvests. Legislation in 1999 allowed most fishermen to be exempt from unemployment insurance coverage – the primary source of employment data. The Oregon Employment Department now estimates the total number of fishermen based on survey data and the number of fishing licenses sold. The number of fishermen covered by insurance has dropped considerably since 1999. The apparent decrease could be from fewer fishermen working but mainly is probably from fewer fishermen electing to maintain unemployment insurance coverage. Although the number of fishing vessels has declined from historic highs, fishing is generating more revenue per boat and is probably becoming a higher-paying occupation. In addition to direct employment, commercial fishing provides the resource for processors. There were 26 seafood processors in Oregon in 2009, one fewer than the previous year. Their average annual employment was 1,007. Some ports, such as Florence and Reedsport, have fish buyers who now transport the harvest to be processed elsewhere. National Employment The number of unemployed persons was 15.0 million in May. The unemployment rate edged down to 9.7 percent, the same rate as in the first three months of 2010. Nonfarm payroll employment increased by 431,000 in May, reflecting the addition of 411,000 temporary workers for Census 2010. Total private employment showed little change over the month (+41,000), following increases in March and April. In May, manufacturing, temporary help services,
$0
$20
$40
$60
$80
$100
$120
$140
$160
$180
$200
0
50
100
150
200
250
300
350
1980 1982 1984 1986 1988 1990 1992 1994 1996 1998 2000 2002 2004 2006 2008
(Mill
ion
s o
f 2
00
8 D
olla
rs)
(Mill
ion
s o
f P
ou
nd
s)
Oregon Commercial Fishing Landings and Revenue
Total Landings (millions of pounds)
Total Value (millions of 2009 dollars)
Source: PacFin and the Oregon Department of Fish and Wildlife Graph 1
$0
$20,000
$40,000
$60,000
$80,000
$100,000
$120,000
$140,000
0
500
1,000
1,500
2,000
2,500
3,000
3,500
1984 1986 1988 1990 1992 1994 1996 1998 2000 2002 2004 2006 2008
Nu
mb
er o
f Ac
tive
Ve
ss
els
Count of Fishing Vessels and Revenue Per Vessel (2009 Dollars)
Vessel count
Revenue per vessel (constant dollars)
Source: PacFin and Oregon Department of Fish and Wildlife Graph 2

6 Oregon Employment Department Workforce Analysis Northwest Oregon Trends July 2010
and mining added jobs, while employment in construction declined. Manufacturing employment increased by 29,000 over the month. Factory employment rose by 126,000 over the past five months. Within manufacturing, both fabricated metals and machinery added jobs in May. Temporary help services added 31,000 jobs over the month; employment in the industry rose by 362,000 since September 2009. Employment in mining continued to increase in May, with a gain of 10,000. Support activities for mining accounted for 8,000 of the over-the-month increase. Since October 2009, mining employment expanded by 50,000. Health care employment was little changed in May (+8,000). Over the prior 12 months, health care employment increased by an average of 20,000 per month. In May, employment in construction declined by 35,000, largely offsetting industry gains in the prior two months. May's job loss was spread throughout the sector. Employment in other private-sector industries, including wholesale trade, retail trade, transportation and warehousing, information, financial activities, and leisure and hospitality showed little or no change in May. Government employment rose by 390,000 in May. The federal government hired 411,000 temporary workers for Census 2010, bringing total temporary census staffing during the payroll survey reference period to 564,000. Employment in state government excluding education decreased by 13,000. Oregon Employment Oregon’s seasonally adjusted unemployment rate was 10.6 percent in May, the same as in March and April. The rate has been essentially unchanged for the most recent seven months. Oregon’s unemployment rate was 11.6 percent in May 2009, which tied June 2009 as Oregon’s highest unemployment rate since the early 1980s. The U.S. seasonally adjusted unemployment rate dropped to 9.7 percent in May from 9.9 percent in April.
In May, 202,944 Oregonians were unemployed. In May 2009, 223,474 Oregonians were unemployed. In seasonally adjusted terms, both Oregon’s civilian labor force and its number of citizens employed increased modestly in May. This marked the fifth consecutive month of increases in both these figures.
Interest rates provide clues about the future of the economy. Lower interest rates generally decrease the cost of doing business and tend to promote growth in output, employment, and prices. The Fed’s target rate for its funds is still 0.25 percent – essentially as low as it can go. The prime rate held steady from May to June at 3.25 percent. Conventional 30-year mortgage rates fell slightly to around 4.75 percent in June. Rates on 10-year Treasury notes also dropped in June. The rate for three-month Treasury bills remained near zero. The consumer price index rose slightly in May. The 12-month change in the index was a positive 2.0 percent. The Conference Board’s leading index for the national economy increased 0.4 percent in May – after no change in April. The consumer confidence index climbed to 63.3 in June from 57.7 in May. This is its third consecutive month of increase. Consumers thought present-day business conditions improved.

Oregon Employment Department Workforce Analysis 7 Northwest Oregon Trends July 2010
Oregon’s seasonally adjusted nonfarm payroll employment was flat in May, following a gain of 5,500 (as revised) in April. Government added 6,800 jobs in May at a time of year when a gain of 3,700 is expected due to seasonality. The addition of 4,451 intermittent Census workers boosted both federal government and total government for May, adding to the 1,952 already working for the Census in April. In the private sector, several major industries posted job declines, while only two major industries produced substantial seasonally adjusted job gains: construction and manufacturing. Construction posted its third consecutive seasonally adjusted job gain. It added 1,700 jobs at a time of year when a gain of 1,200 is the normal seasonal movement. Construction employment stood at 64,200 jobs in May, still well below its May 2009 tally of 73,100.
Manufacturing continued to slowly recover from its recent trough. Seasonally adjusted employment rose 700 in May and is now up 1,400 from its February trough. Over the last several months, durable goods employment continued to hover above 110,000, while nondurable goods steadied slightly below 50,000. Trade, transportation, and utilities normally gains 1,700 jobs due to seasonal factors in May, so this May’s flat employment trend was 1,700 below normal seasonal expectations. Retail trade contributed most of the dismal performance as it added only 300 jobs during the normally rapidly growing spring month of May.
Financial activities gave back its April gains, dropping 800 jobs in May. The industry fell below 93,000 for only the second month in more than 12 years. Professional and business services added only 100 jobs in May when a gain of 800 is the normal seasonal movement. The industry is now close to its December employment level after showing modest gains during the first part of the year.
Educational and health services dropped 1,900 jobs in May, when it normally would drop by only 1,300 for the month. Despite the one-month decline there have been solid long-term gains. Over the past 12 months, health care and social assistance added 1,300 jobs.

8 Oregon Employment Department Workforce Analysis Northwest Oregon Trends July 2010
(by place of residence)
Change From Change From May April May April May
2010 2010 2009 2010 2009Civilian labor force 20,661 20,688 20,615 -27 46 Unemployed 1,789 1,939 1,785 -150 4 Unemployment rate 8.7% 9.4% 8.7% -0.7 0.0 Unemployment rate, seasonally adjusted 9.5% 9.4% 9.5% 0.1 0.0 Total Employment 18,872 18,749 18,830 123 42
CLATSOP COUNTY NONFARM PAYROLL EMPLOYMENT(by place of work)
May April May April May
TOTAL NONFARM PAYROLL EMPLOYMENT 2010 2010 2009 2010 2009
Total nonfarm 16,720 16,480 17,010 240 -290Total nonfarm, seasonally adjusted 16,660 16,720 16,940 -60 -280
TOTAL PRIVATE 13,650 13,460 13,950 190 -300 Mining and Logging 210 220 220 -10 -10 Construction 750 740 810 10 -60 Manufacturing 1,900 1,770 2,040 130 -140 Durable goods 320 340 490 -20 -170 Wood product manufacturing 110 110 280 0 -170 Nondurable goods 1,580 1,430 1,550 150 30 Food manufacturing 620 470 540 150 80 Paper manufacturing 940 950 1,000 -10 -60 Trade, transportation, and utilities 2,900 2,880 2,880 20 20 Wholesale trade 170 170 170 0 0 Retail trade 2,430 2,420 2,420 10 10 Transportation, warehousing, and utilities 300 290 290 10 10 Information 160 160 160 0 0 Financial activities 590 610 610 -20 -20 Professional and business services 580 620 660 -40 -80 Educational and health services 2,080 2,080 2,150 0 -70 Leisure and hospitality 3,880 3,790 3,820 90 60 Accommodation and food services 3,650 3,560 3,560 90 90 Accommodation 1,230 1,190 1,210 40 20 Food services and drinking places 2,420 2,370 2,350 50 70 Other services 600 590 600 10 0 GOVERNMENT 3,070 3,020 3,060 50 10 Federal government 260 210 240 50 20 State government 430 420 450 10 -20 Local goverrnment 2,380 2,390 2,370 -10 10 Local education 1,220 1,280 1,240 -60 -20 Local government excluding education 1,160 1,110 1,130 50 30 Labor-management disputes 0 0 0 0 0
Nonfarm Payroll Employment: Data are by place of work and cover full- and part-time employees who worked or received pay for the pay period that includes the 12th of the month. The data exclude the self-employed, volunteers, unpaid family workers, and domestics.
CLATSOP COUNTY CURRENT LABOR FORCE AND INDUSTRY EMPLOYMENT
-Change from-
The most recent month is preliminary, the prior month is revised. Prepared by the Oregon Employment Department in cooperation with the U.S. Department of Labor, Bureau of Labor Statistics.Labor Force Status: Civilian labor force includes employed and unemployed individuals 16 years and older by place of residence. Employed includes nonfarm payroll employment, self-employed, unpaid family workers, domestics, agriculture, and labor disputants. Unemployment rate is calculated by dividing unemployed by civilian labor force.

Oregon Employment Department Workforce Analysis 9 Northwest Oregon Trends July 2010
(by place of residence)
Change From Change From May April May April May
2010 2010 2009 2010 2009Civilian labor force 24,316 24,586 24,945 -270 -629 Unemployed 2,855 3,056 3,391 -201 -536 Unemployment rate 11.7% 12.4% 13.6% -0.7 -1.9 Unemployment rate, seasonally adjusted 12.0% 12.5% 14.0% -0.5 -2.0 Total Employment 21,461 21,530 21,554 -69 -93
(by place of work) May April May April May
TOTAL NONFARM PAYROLL EMPLOYMENT 2010 2010 2009 2010 2009
Total nonfarm 9,940 9,710 9,920 230 20Total nonfarm, seasonally adjusted 9,880 9,760 9,860 120 20
TOTAL PRIVATE 7,440 7,330 7,550 110 -110 Mining and Logging 160 160 200 0 -40 Construction 360 340 360 20 0 Manufacturing 1,290 1,250 1,440 40 -150 Durable goods 900 870 990 30 -90 Wood product manufacturing 280 280 310 0 -30 Nondurable goods 390 380 450 10 -60 Paper manufacturing 160 160 200 0 -40 Trade, transportation, and utilities 1,880 1,850 1,900 30 -20 Retail trade 1,300 1,280 1,310 20 -10 Information 100 110 100 -10 0 Financial activities 540 540 510 0 30 Professional and business services 680 670 590 10 90 Educational and health services 1,050 1,050 1,050 0 0 Leisure and hospitality 980 960 1,000 20 -20 Other services 400 400 400 0 0 GOVERNMENT 2,500 2,380 2,370 120 130 Federal government 160 100 110 60 50 State government 260 250 250 10 10 Local government 2,080 2,030 2,010 50 70 Local education 1,350 1,320 1,300 30 50 Local government excluding education 730 710 710 20 20Labor-management disputes 0 0 0 0 0
Columbia County is a part of the Portland Primary Metropolitan Statistical Area (PMSA). Although the labor force estimates are official, based on a procedure approved by the U.S. Bureau of Labor Statistics, they are not considered to be as accurate as those produced for the entire Portland PMSA. The Portland PMSA consists of Clackamas, Columbia, Multnomah, Washington, and Yamhill counties in Oregon, plus Clark County in Washington state.
COLUMBIA COUNTY CURRENT LABOR FORCE AND INDUSTRY EMPLOYMENT
The most recent month is preliminary, the prior month is revised. Prepared by the Oregon Employment Department in cooperation with the U.S. Department of Labor, Bureau of Labor Statistics.
Labor Force Status: Civilian labor force includes employed and unemployed individuals 16 years and older by place of residence. Employed includes nonfarm payroll employment, self-employed, unpaid family workers, domestics, agriculture, and labor disputants. Unemployment rate is calculated by dividing unemployed by civilian labor force.
Nonfarm Payroll Employment: Data are by place of work and cover full- and part-time employees who worked or received pay for the pay period that includes the 12th of the month. The data exclude the self-employed, volunteers, unpaid family workers, and domestics. "Natural resources" includes only Logging (NAICS 1133).
COLUMBIA COUNTY NONFARM PAYROLL EMPLOYMENT
-Change from-

10 Oregon Employment Department Workforce Analysis Northwest Oregon Trends July 2010
(by place of residence)
Change From Change From May April May April May
2010 2010 2009 2010 2009Civilian labor force 13,300 13,373 12,871 -73 429 Unemployed 1,121 1,224 1,203 -103 -82 Unemployment rate 8.4% 9.2% 9.3% -0.8 -0.9 Unemployment rate, seasonally adjusted 9.1% 9.6% 10.1% -0.5 -1.0 Total Employment 12,179 12,149 11,668 30 511
May April May April May
TOTAL NONFARM PAYROLL EMPLOYMENT 2010 2010 2009 2010 2009
Total nonfarm 8,680 8,570 8,480 110 200Total nonfarm, seasonally adjusted 8,630 8,690 8,430 -60 200
TOTAL PRIVATE 6,530 6,530 6,410 0 120 Mining and Logging 200 220 200 -20 0 Construction 320 320 320 0 0 Manufacturing 1,270 1,290 1,290 -20 -20 Durable goods 450 450 450 0 0 Wood product manufacturing 360 360 340 0 20 Nondurable goods 820 840 840 -20 -20 Food manufacturing 800 820 820 -20 -20 Trade, transportation, and utilities 1,270 1,240 1,260 30 10 Retail trade 960 930 940 30 20 Information 60 60 70 0 -10 Financial activities 380 380 380 0 0 Professional and business services 470 470 430 0 40 Educational and health services 880 900 870 -20 10 Leisure and hospitality 1,270 1,230 1,240 40 30 Accommodation and food services 1,200 1,170 1,190 30 10 Accommodation 350 330 340 20 10 Food services and drinking places 850 840 850 10 0 Other services 410 420 350 -10 60 GOVERNMENT 2,150 2,040 2,070 110 80 Federal government 200 150 160 50 40 State government 390 380 390 10 0 Local government 1,560 1,510 1,520 50 40 Local education 830 810 800 20 30 Local government excluding education 730 700 720 30 10Labor-management disputes 0 0 0 0 0
TILLAMOOK COUNTY CURRENT LABOR FORCE AND INDUSTRY EMPLOYMENT
The most recent month is preliminary, the prior month is revised. Prepared by the Oregon Employment Department in cooperation with the U.S. Department of Labor, Bureau of Labor Statistics.
Labor Force Status: Civilian labor force includes employed and unemployed individuals 16 years and older by place of residence. Employed includes nonfarm payroll employment, self-employed, unpaid family workers, domestics, agriculture, and labor disputants. Unemployment rate is calculated by dividing unemployed by civilian labor force.
Nonfarm Payroll Employment: Data are by place of work and cover full- and part-time employees who worked or received pay for the pay period that includes the 12th of the month. The data exclude the self-employed, volunteers, unpaid family workers, and domestics.
-Change from-
TILLAMOOK COUNTY NONFARM PAYROLL EMPLOYMENT(by place of work)

Oregon Employment Department Workforce Analysis 11 Northwest Oregon Trends July 2010
May 2010 April 2010 May 2009
United States 9.7 9.9 9.4
State of Oregon 10.6 10.6 11.6
Metropolitan Statistical Areas:Bend (Deschutes County) 14.7 14.0 16.1Corvallis (Benton County) 7.0 7.4 8.2Eugene-Springfield (Lane County) 10.7 10.9 12.8Medford (Jackson County) 12.3 12.3 13.2Portland-Vancouver-Hillsboro (2) 10.3 10.4 10.9Salem (Marion and Polk counties) 10.8 10.4 11.3
Counties (1):Baker 10.1 9.6 11.5Benton 7.0 7.4 8.2Clackamas 10.1 10.0 10.6Clatsop (3) 9.5 9.4 9.5Columbia 12.0 12.5 14.0Coos (3) 12.9 12.4 14.1Crook (3) 17.0 16.5 19.2Curry (3) 13.3 12.9 14.6Deschutes 14.7 14.0 16.1Douglas (3) 14.0 13.9 16.5Gilliam 7.4 7.0 8.1Grant 12.7 12.8 13.3Harney 15.7 15.0 16.9Hood River (3) 7.9 8.2 8.7Jackson 12.3 12.3 13.2Jefferson 14.2 13.9 15.5Josephine (3) 14.5 14.0 15.4Klamath (3) 13.3 12.9 14.7Lake 13.5 12.5 12.2Lane 10.7 10.9 12.8Lincoln 10.8 10.6 11.2Linn (3) 13.2 12.9 14.6Malheur (3) 11.0 9.6 10.6Marion 11.1 10.9 11.7Morrow (3) 9.4 9.5 13.0Multnomah 9.8 9.8 10.7Polk 9.1 8.9 9.7Sherman 9.2 9.2 8.5Tillamook 9.1 9.6 10.1Umatilla (3) 10.0 9.9 10.5Union (3) 9.8 10.3 12.2Wallowa 11.7 11.4 12.3Wasco (3) 8.9 9.3 10.2Washington 9.0 8.8 9.9Wheeler 9.9 9.9 9.4Yamhill 11.0 10.7 12.2
(3) This county is in a micropolitan statistical area. Malheur County is part of the Ontario micropolitan statistical area, which also includes Payette County, Idaho. Morrow and Umatilla counties combine to form the Pendleton-Hermiston micropolitan statistical area.
Oregon Seasonally Adjusted Unemployment Rates by Area (1)
(1) Seasonally adjusted rates for areas other than the United States and Oregon are not official Bureau of Labor Statistics series.
(2) Portland-Vancouver-Hillsboro MSA includes Clackamas, Columbia, Multnomah, Washington, and Yamhill counties in Oregon and Clark and Skamania counties in Washington.


July 2010 Employment Trends: Local The Portland metro area’s seasonally adjusted unemployment rate was 10.3 percent in May, compared to 10.4 percent in April. The year-ago rate was 10.9 percent. An estimated 119,300 area residents were unemployed and seeking work in May. Seasonally adjusted nonfarm employment declined by 200 jobs after increasing by 500 jobs in April. Three major industries lost jobs in May. Financial activities continued its slide, shedding 200 jobs. This sector started to decline a year before the recession officially started. Although the pace of job losses eased this year, it appears this sector has yet to hit bottom. Employment levels have fallen to 1997 levels. Professional and business services cut 100 jobs following three months of growth totaling 3,300 jobs. Gains in the seasonal component of services to buildings and dwellings were offset by typical losses in professional and business services following the April 15 tax deadline.
Seasonally Portland MSA Adjusted Raw
May 2010 10.3% 10.2%Apr 2010 10.4% 10.5%May 2009 10.9% 10.8%
OregonMay 2010 10.6% 10.4%Apr 2010 10.6% 10.7%
May 2009 11.6% 11.3%
United StatesMay 2010 9.7% 9.3%Apr 2010 9.9% 9.5%
May 2009 9.4% 9.1%
2010 2009
Total 958,500 978,600
Construction 43,800 49,100
Manufacturing 104,500 108,200
Trade, Trans., & Utilities 184,400 189,000
Information 21,900 22,900
Financial Activities 62,600 64,500
Professional & Bus. Svc 122,100 124,500
Educ. & Health Services 135,400 136,000
Leisure & Hospitality 94,000 95,100
Government 154,200 152,600
High Tech * 47,100 47,700* (manufacturing and nonmanufacturing)
United States May '10 2009
Yearly Change 2.0% -0.4%Next release: July 16, 2010
Portland-Salem 2nd Half '09 2009
Yearly Change 0.5% 0.1%Next release: August 13, 2010
Mar. 2010 89.1Apr 2010 89.2
2008-2009 % Change
Portland Metro 2,217,325 1.2%
Oregon 3,823,465 0.9%
www.bls.gov/cpi
University of Oregon Index of Economic Indicators
2009 Population
May
Economic Indicators
Unemployment Rates
Nonfarm Payroll Employment(not seasonally adjusted)
Consumer Price Index (CPI)
-12,000
-10,000
-8,000
-6,000
-4,000
-2,000
0
2,000
4,000
6,000
Jan-08 May-08 Sep-08 Jan-09 May-09 Sep-09 Jan-10 May-10
Monthly Nonfarm Job Growth/DeclinePortland Metro Area, seasonally adjusted

2 Oregon Employment Department Workforce Analysis Portland Trends July 2010
Educational and health services declined by 1,300 jobs, all of which occurred in the education component. Employment in the health care component, which added just 100 jobs, fell below year-ago levels for the first time in more than 20 years. This sector continued to add jobs throughout the recession but at an increasingly slower pace. It’s likely that the growing number of unemployed residents have put downward pressure on the demand for health care as some elect to forgo medical care. Construction added 1,000 jobs following gains totaling 700 in March and April. The number of single-family housing permits issued in the first four months of the year is up 67 percent over the same period last year. Manufacturing edged up 200 jobs following small gains in March and April. May’s growth occurred entirely in the nondurable goods component. Over the year, manufacturing employment is down 3,700 jobs. Since its most recent May peak (2006), it’s down 21,400 jobs (-17.1%). Leisure and hospitality gained 1,400 jobs over the month, in line with seasonal expectations. Hiring at the Census boosted employment in federal government (+2,000) from April to May. Over the past year, the metro area lost 20,000 jobs (-2.0%). Since peaking in April 2008, employment declined by 86,700 jobs (-8.3%). Employment Trends: State Oregon’s seasonally adjusted unemployment rate was 10.6 percent in May, the same as in March and April. The rate has been essentially unchanged for the most recent seven months. Oregon’s unemployment rate was 11.6 percent in May 2009, which tied June 2009 as Oregon’s highest unemployment rate since the early 1980s. The U.S. seasonally adjusted unemployment rate dropped to 9.7 percent in May from 9.9 percent in April. In May, 202,944 Oregonians were unemployed. In May 2009, 223,474 Oregonians were unemployed. In seasonally adjusted terms, both Oregon’s civilian labor force and its number of citizens employed
Portland Metro Labor Trends is published by the Workforce and Economic Research Division of the Oregon Employment Department. Portland Metro Labor Trends also can be found on the Publications page at www.QualityInfo.org. Material contained in this publication is in the public domain and may be reproduced without any special permission. Please credit Portland Metro Labor Trends, Oregon Employment Department. Laurie Warner, Director
Graham Slater, Administrator for Workforce and Economic Research Amy Vander Vliet, Regional Economist Portland (503) 280-6031
Jill Cuyler, Workforce Analyst Beaverton and Hillsboro (503) 612-4277
Malcolm Boswell, Workforce Analyst Gresham (503) 666-1985 x309
Lynn Wallis, Workforce Analyst Oregon City (971) 673-6453
Christian Kaylor, Workforce Analyst Portland (503) 280-6032
Jill Cuyler, Workforce Analyst St Helens (503) 612-4277
Bruce Powers, Field Office Manager Tualatin (503) 612-4200 Ron Freeman, Field Office Manager Gresham (503) 669-7112 Christina Aranda, Field Office Manager Beaverton (503) 526-2750
Michael Newstrom, Field Office Manager McMinnville (503) 472-5118 Tom Previs, Field Office Manager Oregon City (971) 673-6400 Cynthia Mullen, Field Office Manager Portland-North (503) 280-6046 Joyce Aho, Field Office Manager St Helens (503) 397-4995
Please direct address changes to: Oregon Employment Department Workforce and Economic Research 875 Union St NE Salem OR 97311 Phone (503) 947-1204 TDD (503) 947-1391 e-mail [email protected] The Oregon Employment Department is an equal opportunity employer. Auxiliary aids and services are available upon request to individuals with disabilities.

Oregon Employment Department Workforce Analysis 3 Portland Trends July 2010
increased modestly in May. This marked the fifth consecutive month of increases in both these figures. Oregon’s seasonally adjusted nonfarm payroll employment was flat in May, following a gain of 5,500 (as revised) in April. Government added 6,800 jobs in May at a time of year when a gain of 3,700 is expected due to seasonality. The addition of 4,451 intermittent Census workers boosted both federal government and total government for May, adding to the 1,952 already working for the Census in April. In the private sector, several major industries posted job declines, while only two major industries produced substantial seasonally adjusted job gains: construction and manufacturing. Construction posted its third consecutive seasonally adjusted job gain. It added 1,700 jobs at a time of year when a gain of 1,200 is the normal seasonal movement. Construction employment stood at 64,200 jobs in May, still well below its May 2009 tally of 73,100. Manufacturing continued to slowly recover from its recent trough. Seasonally adjusted employment rose 700 in May and is now up 1,400 from its February trough. Over the last several months, durable goods employment continued to hover above 110,000, while nondurable goods steadied slightly below 50,000. Trade, transportation, and utilities normally gains 1,700 jobs due to seasonal factors in May, so this May’s flat employment trend was 1,700 below normal seasonal expectations. Retail trade contributed most of the dismal performance as it added only 300 jobs during the normally rapidly growing spring month of May. Financial activities gave back its April gains, dropping 800 jobs in May. The industry fell below 93,000 for only the second month in more than 12 years. Professional and business services added only 100 jobs in May when a gain of 800 is the normal seasonal movement. The industry is now close to its December employment level after showing modest gains during the first part of the year.
-20,000
-15,000
-10,000
-5,000
0
5,000
10,000
15,000
20,000
2007 2008 2009 2010
Oregon Monthly Job Growth/Declineseasonally adjusted
143,500 jobs lost since thestart of the recession; - 8.3%.
149,000 jobs lost peak-current trough (Mar 2010); - 8.6%.
3.0
4.0
5.0
6.0
7.0
8.0
9.0
10.0
11.0
12.0
13.0
2000 2002 2004 2006 2008 2010
Oregon and U.S. Unemployment Rate2000 - April 2010, seasonally adjusted
U.S. Oregon

4 Oregon Employment Department Workforce Analysis Portland Trends July 2010
Educational and health services dropped 1,900 jobs in May, when it normally would drop by only 1,300 for the month. Despite the one-month decline there have been solid long-term gains. Over the past 12 months, health care and social assistance added 1,300 jobs. Employment Trends: National The number of unemployed persons was 15.0 million in May. The unemployment rate edged down to 9.7 percent, the same rate as in the first three months of 2010. Nonfarm payroll employment increased by 431,000 in May, reflecting the addition of 411,000 temporary workers for Census 2010. Total private employment showed little change over the month (+41,000), following increases in March and April. In May, manufacturing, temporary help services, and mining added jobs, while employment in construction declined. Manufacturing employment increased by 29,000 over the month. Factory employment rose by 126,000 over the past five months. Within manufacturing, both fabricated metals and machinery added jobs in May. Temporary help services added 31,000 jobs over the month; employment in the industry rose by 362,000 since September 2009. Employment in mining continued to increase in May, with a gain of 10,000. Support activities for mining accounted for 8,000 of the over-the-month increase. Since October 2009, mining employment expanded by 50,000. Health care employment was little changed in May (+8,000). Over the prior 12 months, health care employment increased by an average of 20,000 per month. In May, employment in construction declined by 35,000, largely offsetting industry gains in the prior two months. May's job loss was spread throughout the sector. Employment in other private-sector industries, including wholesale trade, retail trade, transportation and warehousing, information, financial activities, and leisure and hospitality showed little or no change in May. Government employment rose by 390,000 in May. The federal government hired 411,000 temporary workers for Census 2010, bringing total temporary census staffing during the payroll survey reference period to 564,000. Employment in state government excluding education decreased by 13,000.
-1,000
-800
-600
-400
-200
0
200
400
600
800
2007 2008 2009 2010
(in
tho
us
an
ds)
U.S. Monthly Job Growth/Declineseasonally adjusted

Oregon Employment Department Workforce Analysis 5 Portland Trends July 2010
Covered Employment and Wages in the Tri-County Area The three counties that make up the urban core of the Portland metropolitan area – Clackamas, Multnomah, and Washington – account for about half of the total covered employment in the state of Oregon. In terms of payroll, businesses in these three counties paid out 57 percent of the total covered wages paid in the state in 2009. All three counties are in the state’s top five in terms of average pay per worker. Washington County ranked first in 2009, with average pay of $51,351. Multnomah, where average pay was $46,229, ranked third. Clackamas County’s average pay of $41,386 ranked fifth highest in the state. Statewide average pay in 2009 was $40,740. The covered employment and wages series compiles employment and payroll from all employers covered by the unemployment insurance system, which includes most Oregon businesses, nonprofits, and government agencies with hired workers. Combined, covered businesses in Clackamas, Multnomah and Washington counties employed nearly 800,000 people in 2009, and paid wages totaling over $37 billion. While Portland’s urban core makes up a large share of statewide employment, its employment level hasn’t changed much since 2001. Statewide, employment increased about 1 percent between 2001 and 2009. Employment fell early in the decade after the dot.com bust, then recovered and expanded through 2007, and fell again with the Great Recession. All three counties and the state show effects of the Great Recession. Average annual employment dropped 6 percent between 2008 and 2009 statewide, as well as in Multnomah and Washington counties. Clackamas saw a slightly larger decrease, losing 7 percent over the year. Total payrolls suffered similar declines. Average pay per worker increased 1 percent statewide and in Clackamas County, while Multnomah and Washington counties had negligible increases in average pay between 2008 and 2009 – each adding about $200 per worker.
2009 Employment
and Wages
Percent Change
2008-2009Employment 1,608,819 -6%Payroll $65,542,683,403 -6%Average Pay $40,740 1%Employment 139,384 -7%Payroll $5,768,478,050 -6%Average Pay $41,386 1%Employment 423,801 -6%Payroll $19,591,973,451 -5%Average Pay $46,229 0%Employment 231,961 -6%Payroll $11,911,389,147 -6%Average Pay $51,351 0%
Covered Employment and Wages by Area
Washington
Oregon
Clackamas
Multnomah
Natural Resources & Mining
1%Construction
5%
Manufacturing11%
Trade, Transp. & Utilities
20%
Information2%
Financial Activities 6%
Prof. & Bus. Services
14%
Educ. & Health Services
13%
Leisure & Hospitality 10%
Other Services 4%
Government14%
Tri-County Employment by Industry, 2009

6 Oregon Employment Department Workforce Analysis Portland Trends July 2010
The tri-county economy is diverse. The largest sector across the region is trade, transportation, and utilities, which makes up one-fifth of employment. Professional and business services accounts for 14 percent of employment, a slightly larger share than statewide (11%). Education and health services and manufacturing round out the industries with more than 10 percent of regional employment – both represent similar shares of the statewide economy. Government accounts for 14 percent of the tri-county employment, compared with 17 percent of employment statewide. Industry wages are lowest in leisure and hospitality in all three counties, and statewide. The private information sector and federal government are pretty evenly matched for the highest paying sectors in Clackamas and Multnomah counties. Washington County’s highest wages are in the manufacturing sector – home to much of Oregon’s high-tech manufacturing employment, and information is a close second.
Industry JobsAverage
Pay JobsAverage
Pay Jobs Average
PayTotal All Ownerships 139,384 $41,386 423,801 $46,229 231,961 $51,351 Total Private Coverage 121,809 $41,381 353,788 $44,834 209,638 $52,215
Natural Resources & Mining 4,208 $24,068 1,783 $29,641 3,341 $26,714
Construction 8,861 $46,275 17,406 $56,535 11,176 $51,808
Manufacturing 16,272 $52,330 32,155 $49,061 40,793 $79,431
Trade, Transportation. & Utilities 30,923 $38,131 79,677 $39,307 47,228 $51,947
Information 2,176 $64,329 9,801 $70,887 7,897 $76,406
Financial Activities 7,401 $54,430 29,092 $60,254 13,352 $52,913
Professional & Business Services 15,087 $49,670 61,013 $58,318 31,922 $47,376
Education & Health Services 18,393 $46,521 59,347 $44,508 27,169 $43,281
Leisure & Hospitality 13,073 $15,977 45,182 $19,964 19,373 $16,530
Other Services 5,348 $25,917 18,205 $30,754 7,311 $35,822
Total All Government 17,575 $41,415 70,012 $53,280 22,324 $43,233 Federal Government 1,371 $62,496 12,617 $70,521 856 $58,005 State Government 2,285 $32,079 10,036 $39,874 2,618 $37,313 Local Government 13,919 $40,872 47,360 $51,527 18,850 $43,384
Covered Employment and Wages by Industry, 2009
Clackamas Multnomah Washington

Oregon Employment Department Workforce Analysis 7 Portland Trends July 2010
Around the Region
A listing of employment-related events making recent news
H&M, the popular Swedish clothier, will open at Pioneer Place in Portland. Portland Business Journal, 5-27-10
Agave Grill, a Mexican restaurant, opened at Bridgeport Village in Tigard. The Oregonian, 5-29-10
The City of Portland will eliminate 17 positions in its Bureau of Development Services. Daily Journal of Commerce, 5-27-10
Withers Lumber opened in Molalla. Molalla Pioneer, 5-27-10
Forest Grove Lumber in McMinnville closed. It employed 50 people. News Register, 5-30-10
Umpqua Bank opened a branch in the Sellwood area of Portland. Portland Business Journal, 5-19-10
Piccolina – a resale store offering children’s clothing, maternity wear, books, toys, and new locally handcrafted items – opened in southeast Portland. The Bee, 5-5-10
Several businesses have opened in Portland’s Sellwood-Westmoreland area. They include Bishops Barbershop; The Barbers; Urban’wiches; Oregon Ice Works; Unique Antique; WedPortland, a wedding and events planner; Portland Real Estate LLC; and Qmedtrix, a medical record auditing firm. The Bee, 6-8-10
Gresham Integrated Care clinic opened. It accommodates training for students and interns through chiropractic treatment, massage therapy, and naturopathic medicine. Gresham Outlook, 5-19-10
The Dollar Store in Newberg will close. It employs seven people. Newberg Graphic, 6-2-10
Pasta Veloce at the Scholls Center in Tigard closed. Daily Journal of Commerce, 5-26-10
Five Guys Burgers and Fries opened a second Vancouver franchise. It employs 47 full-and part-time workers. The Columbian, 6-8-10
Kryptiq Corp., a software company in Hillsboro that produces software used by health care providers, employs about 88 people and plans to increase its workforce to around 100 by the end of the year. The Oregonian, 6-15-10
World Class Wines opened in Lake Oswego. The Oregonian, 5-29-10
Rivers Edge Cafe & Catering opened a second Portland location. Daily Journal of Commerce, 5-4-10
Estate Auctions NW opened in St. Helens. It employs two people. The Chronicle, 6-2-10

8 Oregon Employment Department Workforce Analysis Portland Trends July 2010
The Charrette Art Studio opened in Carlton. News Register, 5-25-10
Silkwood, a boutique offering a vintage-inspired children’s clothing line and designer women’s apparel, opened in Lake Oswego. The Oregonian, 6-8-10
Corkscrew Wine Bar opened in southeast Portland. The Bee, 6-8-10
Allium, a bistro offering American and European cuisine, opened in West Linn. The Oregonian, 5-29-10
The Dapper Frog gallery will open in Portland’s Pearl District in July. News Register, 5-25-10
IBM anticipates hiring 600 new employees in Oregon as it introduces new mortgage software tied to its recent acquisition of Beaverton-based Wilshire Credit Corp. About 90 of the new jobs are expected to be at Wilshire’s office in Salem, with the remainder in Beaverton. The Oregonian, 6-21-10
Ajinomoto Frozen Foods, an ethnic frozen foods manufacturer, is in the midst of a $12.5-million expansion at its north Portland facility. Once complete, the company plans to add 30 employees. It currently has 160 full-time and 40 temporary workers. Daily Journal of Commerce, 6-23-10
Happy Family Restaurant opened in Newberg. It offers Cantonese-style Chinese food. Newberg Graphic, 5-19-10
Honest-1 Auto Care opened in Gresham. Gresham Outlook, 6-23-10
Lowe’s home improvement plans to build a store in Beaverton. It is expected to create more than 100 jobs. The Oregonian, 6-21-10
Papa John’s pizza opened in Lake Oswego. The Oregonian, 5-29-10
Two Mexican restaurants – La Superior Restaurante and Casa Mariachi – opened in Beaverton. The Oregonian, 6-11-10
Danner Factory Store will open in northeast Portland. Gresham Outlook, 6-16-10
Treasure Cat Consignments will open in McMinnville. It will offer outdoor games, athletic equipment, furniture, home decor, jewelry, electronics, and movies. News-Register, 6-8-10
Real Deal Grocery opened in Molalla. Molalla Pioneer, 6-16-10

Oregon Employment Department Workforce Analysis 9 Portland Trends July 2010
May April May April May2010 2010 2009 2010 2009
LABOR FORCE STATUSCivilian Labor Force 1,166,100 1,175,300 1,180,900 -9,200 -14,800 Unemployed 119,300 123,100 127,800 -3,800 -8,500 Unemployment Rate 10.2% 10.5% 10.8% Unemployment Rate, seasonally adjusted 10.3% 10.4% 10.9% Total Employed 1,046,800 1,052,200 1,053,200 -5,400 -6,400
3,400 -37,100
NONFARM PAYROLL EMPLOYMENTTotal nonfarm 958,500 953,900 978,600 4,600 -20,100
Total nonfarm, seasonally adjusted 956,500 956,700 976,500 -200 -20,000
Total private 804,300 802,500 826,000 1,800 -21,700 Mining and logging 1,100 1,000 1,200 100 -100 Construction 43,800 42,800 49,100 1,000 -5,300 Construction of buildings 9,500 9,600 11,000 -100 -1,500 Residential building construction 5,100 5,200 5,600 -100 -500 Nonresidential building construction 4,400 4,400 5,400 0 -1,000 Heavy and civil engineering construction 4,500 4,400 5,000 100 -500 Specialty trade contractors 29,800 28,800 33,100 1,000 -3,300 Manufacturing 104,500 104,300 108,200 200 -3,700 Durable goods 78,000 78,000 81,400 0 -3,400 Wood product manufacturing 3,600 3,500 3,800 100 -200 Primary metal manufacturing 5,600 5,600 6,000 0 -400 Fabricated metal product manufacturing 10,700 10,700 10,900 0 -200 Machinery manufacturing 6,600 6,600 7,000 0 -400 Computer and electronic product manufacturing 32,800 32,800 33,400 0 -600 Semiconductor and electronic component mfg. 25,200 25,200 25,300 0 -100 Electronic instrument manufacturing 4,400 4,400 4,700 0 -300 Transportation equipment manufacturing 6,200 6,200 7,100 0 -900 Nondurable goods 26,500 26,300 26,800 200 -300 Food manufacturing 8,900 8,900 8,900 0 0 Paper manufacturing 3,600 3,600 3,900 0 -300 Trade, transportation, and utilities 184,400 183,900 189,000 500 -4,600 Wholesale trade 53,100 52,900 55,000 200 -1,900 Merchant wholesalers, durable goods 23,900 23,900 25,000 0 -1,100 Merchant wholesalers, nondurable goods 20,800 20,600 21,500 200 -700 Electronic markets and agents and brokers 8,400 8,400 8,500 0 -100 Retail trade 98,900 98,500 99,800 400 -900 Motor vehicle and parts dealers 11,100 11,200 11,300 -100 -200 Food and beverage stores 19,700 19,500 19,700 200 0 Clothing and clothing accessories stores 9,200 9,200 9,900 0 -700 General merchandise stores 20,100 20,000 20,200 100 -100 Transportation, warehousing, and utilities 32,400 32,500 34,200 -100 -1,800 Air transportation 3,700 3,700 3,700 0 0 Truck transportation 9,400 9,400 9,700 0 -300 Couriers and messengers 4,000 4,000 4,300 0 -300 Warehousing and storage 3,400 3,400 3,500 0 -100 Information 21,900 21,800 22,900 100 -1,000 Publishing industries, except internet 8,800 8,800 9,100 0 -300 Software publishers 6,300 6,300 6,300 0 0 Telecommunications 5,300 5,300 5,800 0 -500
Portland-Vancouver-Hillsboro MSA Labor Force and Industry Employment
---Change from---

10 Oregon Employment Department Workforce Analysis Portland Trends July 2010
Nonfarm Payroll Employment (continued)
May April May April May2010 2010 2009 2010 2009
Financial activities 62,600 62,800 64,500 -200 -1,900 Finance and insurance 40,600 40,700 41,600 -100 -1,000 Credit intermediation and related activities 18,600 18,800 19,000 -200 -400 Insurance carriers and related activities 18,100 18,100 18,700 0 -600 Real estate and rental and leasing 22,000 22,100 22,900 -100 -900 Professional and business services 122,100 122,200 124,500 -100 -2,400 Professional and technical services 50,300 50,700 51,800 -400 -1,500 Architectural and engineering services 10,000 10,000 10,900 0 -900 Computer systems design and related services 8,000 7,900 8,000 100 0 Management of companies and enterprises 22,600 22,700 23,600 -100 -1,000 Administrative and waste services 49,200 48,800 49,100 400 100 Administrative and support services 46,800 46,400 46,600 400 200 Employment services 17,900 17,700 16,500 200 1,400 Business support services 6,300 6,400 6,900 -100 -600 Services to buildings and dwellings 13,500 13,200 13,900 300 -400 Educational and health services 135,400 136,700 136,000 -1,300 -600 Educational services 23,900 25,300 24,000 -1,400 -100 Colleges and universities 11,900 13,300 12,000 -1,400 -100 Health care and social assistance 111,500 111,400 112,000 100 -500 Ambulatory health care services 42,000 42,000 42,500 0 -500 Hospitals 28,700 28,700 29,200 0 -500 Nursing and residential care facilities 22,800 22,800 22,400 0 400 Social assistance 18,000 17,900 17,900 100 100 Leisure and hospitality 94,000 92,600 95,100 1,400 -1,100 Arts, entertainment, and recreation 13,900 13,700 14,200 200 -300 Amusement, gambling, and recreation 10,000 9,700 10,300 300 -300 Accommodation and food services 80,100 78,900 80,900 1,200 -800 Accommodation 9,100 8,900 9,000 200 100 Food services and drinking places 71,000 70,000 71,900 1,000 -900 Full-service restaurants 34,700 34,100 35,100 600 -400 Limited-service eating places 29,200 28,800 29,800 400 -600 Other services 34,500 34,400 35,500 100 -1,000 Membership associations and organizations 15,800 15,800 16,400 0 -600 Government 154,200 151,400 152,600 2,800 1,600 Federal government 20,700 18,700 18,900 2,000 1,800 State government 22,800 22,700 22,400 100 400 State education 8,400 8,300 8,300 100 100 Local government 110,700 110,000 111,300 700 -600 Local education 63,500 63,300 63,300 200 200
Labor Disputes 0 0 0 0 0
The most recent month is preliminary, the prior month is revised. Prepared in cooperation with the U.S. Department of Labor, Bureau of Labor Statistics.
Employed includes payroll employment, self-employed, unpaid family workers, domestics, agriculture, and labor disputants.Unemployment rate is calculated by dividing unemployed by civilian labor force.
includes the 12th of the month. The data exclude the self-employed, volunteers, unpaid family workers, and domestics.
"Mining and logging" formerly titled "Natural resources and mining". The definition is the same.
The Portland-Vancouver-Hillsboro metropolitan area includes Clackamas, Columbia, Multnomah, Washington, and Yamhill counties in Oregon, and Clark and Skamania counties in Washington State.
---Change from---
Labor Force Status: Civilian labor force includes employed and unemployed individuals 16 years and older by place of residence.
Nonfarm Payroll Employment: Data are by place of work and cover full- and part-time employees who worked or received pay for the pay period that

Oregon Employment Department Workforce Analysis 11 Portland Trends July 2010
-Change From-
May April May April May
2010 2010 2009 2010 2009
Portland-Vancouver-Hillsboro MSA
Civilian labor force 1,166,100 1,175,300 1,180,900 -9,200 -14,800
Unemployed 119,300 123,100 127,800 -3,800 -8,500
Unemployment rate 10.2 10.5 10.8 (0.3) -0.6
Unemployment rate, seasonally adjusted 10.3 10.4 10.9 (0.1) -0.6
Employed 1,046,800 1,052,200 1,053,200 -5,400 -6,400
Oregon portion of the MSA
Civilian Labor Force 946,800 950,200 959,200 -3,400 -12,400
Unemployed 91,800 92,500 100,500 -700 -8,700
Unemployment rate (not seasonally adjusted 9.7 9.7 10.5 0.0 -0.8
Total Employed 855,000 857,700 858,600 -2,700 -3,600
Clackamas County Civilian Labor Force 200,100 201,000 202,200 -900 -2,100
Unemployed 19,900 20,200 21,200 -300 -1,300
Unemployment rate 10.0 10.1 10.5 (0.1) -0.5
Unemployment rate, seasonally adjusted 10.1 10.0 10.6 0.1 -0.5
Total Employed 180,200 180,800 181,000 -600 -800
Columbia County Civilian Labor Force 24,320 24,590 24,950 -270 -630
Unemployed 2,860 3,060 3,390 -200 -530
Unemployment rate 11.7 12.4 13.6 (0.7) -1.9
Unemployment rate, seasonally adjusted 12.0 12.5 14.0 (0.5) -2.0
Total Employed 21,460 21,530 21,550 -70 -90
Multnomah County Civilian Labor Force 387,400 388,400 392,600 -1,000 -5,200
Unemployed 38,500 38,400 42,200 100 -3,700
Unemployment rate 9.9 9.9 10.7 0.0 -0.8
Unemployment rate, seasonally adjusted 9.8 9.8 10.7 0.0 -0.9
Total Employed 349,000 350,100 350,500 -1,100 -1,500
Washington County Civilian Labor Force 287,100 288,100 290,800 -1,000 -3,700
Unemployed 25,500 25,700 28,100 -200 -2,600
Unemployment rate 8.9 8.9 9.7 0.0 -0.8
Unemployment rate, seasonally adjusted 9.0 8.8 9.9 0.2 -0.9
Total Employed 261,600 262,400 262,700 -800 -1,100
Yamhill County Civilian Labor Force 47,800 48,090 48,600 -290 -800
Unemployed 5,040 5,200 5,660 -160 -620
Unemployment rate 10.5 10.8 11.6 (0.3) -1.1
Unemployment rate, seasonally adjusted 11.0 10.7 12.2 0.3 -1.2
Total Employed 42,760 42,890 42,940 -130 -180
Washington portion of the MSA(Clark and Skamania counties) Civilian Labor Force 219,400 225,000 221,800 -5,600 -2,400
Unemployed 27,500 30,600 27,200 -3,100 300
Percent of Labor Force 12.5 13.6 12.3 (1.1) 0.2
Total Employed 191,900 194,500 194,500 -2,600 -2,600
Components may not sum exactly to totals due to rounding.
Estimates of labor force and unemployment for MSA components are based in part on the most recent
population estimates and Unemployment Insurance claims data.
Resident Labor Force and Unemployment for Regions Within the Portland-Vancouver-Hillsboro MSA


July 2010
Jackson County Employment Jackson County payroll employment rose by 800 jobs in May. About one-half of the monthly gains were due to seasonally typical increases in leisure and hospitality jobs along with federal government hiring related to the 2010 Census effort. Over the year, the county’s total payroll employment declined by 700 jobs. In May, leisure and hospitality added 150 jobs in advance of the peak tourism season. The other substantial gain occurred in federal government employment. Federal government employment rose by 220 – mostly attributed to temporary jobs added by the Census Bureau. Construction employment rose by 90 jobs over the month, but lost 480 jobs over the past year. Manufacturing added 40 jobs over the month, a rare increase
Jackson RawMay 2010 12.2 12.3Month ago 12.7 12.3Year Ago 13.0 13.2
Josephine RawMay 2010 13.4 14.5Month ago 14.1 14.0Year Ago 14.2 15.4
Oregon RawMay 2010 10.4Month Ago 10.7Year Ago 11.3
United States RawMay 2010 9.3Month Ago 9.5Year Ago 9.1
May 10 May 09Jackson 85 27Josephine 10 12
May 09 to May 10 2.0%2009 Annual Average -0.4%
July to Dec 09* 0.5%
2009 Annual Average 0.1%
Source: Bureau of Labor Statistics, U.S. Census Bureau
Yearly Change
* percent change from the same 6-month period in previous year
Economic IndicatorsUnemployment Rates
Residential Building Permits
Consumer Price Index
Seasonally Adjusted
Seasonally Adjusted
10.610.6
All Urban Consumers
9.4
United States
9.79.9
Seasonally Adjusted
Seasonally Adjusted
Note: seasonally adjusted rates for areas other than the United States and Oregon are not official Bureau of Labor Statistics series
Portland-Salem, OR-WA
11.6
Percentage Change
Less Than -1%
-1% to 1%
More Than 1%
Oregon: Annual Job Change,May 2009 to May 2010

Oregon Employment Department Workforce Analysis Rogue Valley Labor Trends July 2010
2
in this sector that experienced deep losses during the recession. Retail trade employment posted a slight gain of 30 jobs in May. Professional and business services gained 60 jobs over the month. Local government education added 110 jobs in May and is up 40 jobs over the year. Only a couple sectors lost jobs in May – and those losses were slight. Financial activities and private educational and health services each lost 20 jobs. Over the year, the county still shows broad-based declines in many industries. Sectors posting the largest declines were construction (-480), manufacturing (-230), leisure and hospitality (-190), financial activities (-130), professional and business services (-130), and state education (-110). A few sectors showed over-the-year job growth. Those gaining jobs since May 2009 included retail trade (+120), private educational and health services (+160), and local education. Federal government employment currently shows an over-the-year gain of 270 jobs – most positions are related to the 2010 Census. Next year, the loss of those temporary jobs will show up as an over-the year loss in federal government and total government employment. In other words, without the temporary Census jobs, Jackson County would be showing an over-the-year job loss of about 970 jobs, rather than the 700 currently tallied. Josephine County Employment Josephine County payroll employment rose by 280 jobs in May. About one-third of the month’s increase was due to temporary federal government hiring related to the 2010 Census. The sector adding the most jobs over the month was leisure and hospitality, up 140 jobs from April. Over the year the county lost 610 payroll jobs. If not for the Census hiring, the over-the-year decline would be closer to 700 jobs. In May, construction rose by an estimated 30 jobs, for an over-the-year loss of 60 jobs. Retail trade posted a slight increase, up by 20 jobs in May. Other services employment also added 20 jobs over the month. Federal government employment climbed by 100 jobs, mostly temporary Census jobs. There was little change in other Josephine County published industries. Over the year, the industries showing the largest declines were retail trade (-150), manufacturing (-120), and leisure and hospitality (-120). Sectors posting more modest declines since May 2009 included health care and social assistance (-70); construction (-60); and transportation, warehousing, and utilities (-40). Federal government employment currently shows an over-the-year gain of 70 jobs, mostly related to Census employment. Wood product manufacturing shows a slight gain over the year, up by 20 jobs. Other than those wood product jobs, along with temporary Census
Rogue Valley Labor Trends is published by the Workforce and Economic Research Division of the Oregon Employment Department. Rogue Valley Labor Trends also can be found on the Publications page at www.QualityInfo.org. Material contained in this publication is in the public domain and may be reproduced without permission. Please credit Rogue Valley Labor Trends, Oregon Employment Department.
Laurie Warner, Director Graham Slater, Administrator for Workforce and Economic Research Guy Tauer, Regional Economist Ainoura Oussenbec, Workforce Analyst Medford (541) 776-6060 x233 Gail Gasso, Field Office Manager Medford (541) 776-6060 Grants Pass (541) 244-3215 White City (541) 864-8700
Please direct address changes to: Oregon Employment Department Workforce and Economic Research 875 Union St NE Salem OR 97311 Phone (503) 947-1204 TDD (503) 947-1391
e-mail [email protected] The Oregon Employment Department is an equal opportunity employer. Auxiliary aids and services are available upon request to individuals with disabilities.

Oregon Employment Department Workforce Analysis 3 Rogue Valley Trends July 2010
jobs, no other published industries in Josephine County show any significant employment gains over the year. Local Business Briefs Material gathered from published, nonconfidential sources. Josephine County still intends to rehire about 100 mental health workers as soon as July 1. In March, the Oregon Court of Appeals upheld a ruling from the state Employment Relations Board that the county illegally privatized Mental Health in retaliation for American Federation of State, County and Municipal Employees union members' four-day strike in 2006. The county has been working toward compliance with the decision that demands it rehire about 100 former employees. Thedailycourier.com, 6-3-2010 Central Point-based River Valley Equipment recently opened a new location in Grants Pass. They specialize in equipment and farm supplies and are an authorized New Holland dealer. Parts, services and rentals are also available. Grants Pass Daily Courier, 6-12-2010 Oregon Employment Oregon’s seasonally adjusted unemployment rate was 10.6 percent in May, the same as in March and April. The rate has been essentially unchanged for the most recent seven months. Oregon’s unemployment rate was 11.6 percent in May 2009, which tied June 2009 as Oregon’s highest unemployment rate since the early 1980s. The U.S. seasonally adjusted unemployment rate dropped to 9.7 percent in May from 9.9 percent in April.
In May, 202,944 Oregonians were unemployed. In May 2009, 223,474 Oregonians were unemployed. In seasonally adjusted terms, both Oregon’s civilian labor force and its number of citizens employed increased modestly in May. This marked the fifth consecutive month of increases in both these figures. Oregon’s seasonally adjusted nonfarm payroll employment was flat in May, following a gain of 5,500 (as revised) in April. Government added 6,800 jobs in May at a time of year when a gain of 3,700 is expected due to seasonality.
Watch the monthly press conference live! A press conference will be held on Tuesday, July 13, 2010 at 10:00 am to cover the June statewide unemployment rate. Watch the press conference video-streamed live at www.QualityInfo.org.
Oregon: Seasonally Adjusted Unemployment Rates by AreaMay 2010 (Preliminary Estimates)
Unemployment Rate
Less Than 10%
10% - 13%
More Than 13%

Oregon Employment Department Workforce Analysis Rogue Valley Labor Trends July 2010
4
The addition of 4,451 intermittent Census workers boosted both federal government and total government for May, adding to the 1,952 already working for the Census in April. In the private sector, several major industries posted job declines, while only two major industries produced substantial seasonally adjusted job gains: construction and manufacturing. Construction posted its third consecutive seasonally adjusted job gain. It added 1,700 jobs at a time of year when a gain of 1,200 is the normal seasonal movement. Construction employment stood at 64,200 jobs in May, still well below its May 2009 tally of 73,100.
Manufacturing continued to slowly recover from its recent trough. Seasonally adjusted employment rose 700 in May and is now up 1,400 from its February trough. Over the last several months, durable goods employment continued to hover above 110,000, while nondurable goods steadied slightly below 50,000. Trade, transportation, and utilities normally gains 1,700 jobs due to seasonal factors in May, so this May’s flat employment trend was 1,700 below normal seasonal expectations. Retail trade contributed most of the dismal performance as it added only 300 jobs during the normally rapidly growing spring month of May.
Financial activities gave back its April gains, dropping 800 jobs in May. The industry fell below 93,000 for only the second month in more than 12 years. Professional and business services added only 100 jobs in May when a gain of 800 is the normal seasonal movement. The industry is now close to its December employment level after showing modest gains during the first part of the year.
Educational and health services dropped 1,900 jobs in May, when it normally would drop by only 1,300 for the month. Despite the one-month decline there have been solid long-term gains. Over the past 12 months, health care and social assistance added 1,300 jobs. National Employment The number of unemployed persons was 15.0 million in May. The unemployment rate edged down to 9.7 percent, the same rate as in the first three months of 2010. Nonfarm payroll employment increased by 431,000 in May, reflecting the addition of 411,000 temporary workers for Census 2010. Total private employment showed little change over the month (+41,000), following increases in March and April. In May, manufacturing, temporary help services, and mining added jobs, while employment in construction declined. Manufacturing employment increased by 29,000 over the month. Factory employment rose by 126,000 over the past five months. Within manufacturing, both fabricated metals and machinery added jobs in May. Temporary help services added 31,000 jobs over the month; employment in the industry rose by 362,000 since September 2009.

Oregon Employment Department Workforce Analysis 5 Rogue Valley Trends July 2010
Employment in mining continued to increase in May, with a gain of 10,000. Support activities for mining accounted for 8,000 of the over-the-month increase. Since October 2009, mining employment expanded by 50,000. Health care employment was little changed in May (+8,000). Over the prior 12 months, health care employment increased by an average of 20,000 per month. In May, employment in construction declined by 35,000, largely offsetting industry gains in the prior two months. May's job loss was spread throughout the sector. Employment in other private-sector industries, including wholesale trade, retail trade, transportation and warehousing, information, financial activities, and leisure and hospitality showed little or no change in May. Government employment rose by 390,000 in May. The federal government hired 411,000 temporary workers for Census 2010, bringing total temporary census staffing during the payroll survey reference period to 564,000. Employment in state government excluding education decreased by 13,000. 2010 Oregon Wage Information Now Available The Oregon Employment Department’s annual Oregon Wage Information publication, online at www.qualityinfo.org/pubs/owi/owi2010.pdf, is a useful tool for a wide audience that includes job seekers, employees, employers, career counselors, and other professionals who deal with labor market information. Wages for the various occupations are calculated statewide and for each of Oregon’s 15 workforce regions. Region 8 wage data for 2010 are published for more than 360 occupations that vary from those paying minimum wage to occupations paying six-figure annual salaries. The number of occupations published varies by region. More populous regions tend to have more occupations published than regions with smaller populations, because larger samples are obtained from regions with larger populations. The annual mean wage is calculated by multiplying the mean hourly wage by 2,080, the yearly equivalent of a 40-hour week. One thing to consider when looking at the annual mean wage for occupations is that many do not provide full-time, year-round work. When identifying wages for a particular occupation, be sure the SOC code and title refer to the same occupation for which you are seeking wage information. Some occupational titles can be misleading, as the SOC description may not match all jobs with similar titles. To obtain SOC descriptions:
1. visit www.QualityInfo.org 2. click on “Publications” on the left side of the home page 3. the “Standard Occupational Classification Descriptions” document listing is near the bottom
right of the “Publications” page. Benefits information is not included in this publication. One source of benefits data can be found at the Bureau of Labor Statistics’ (BLS) National Compensation Survey website at www.bls.gov/ncs/ebs/home.htm. There, you will find information on benefit provision and incidence (the percentage of workers with access to and participation in employer provided benefit plans) for two major benefit areas (health insurance and retirement).

Oregon Employment Department Workforce Analysis Rogue Valley Labor Trends July 2010
6
What is a Percentile? Wages are presented as percentiles. The 10th percentile wage is the level at which 10 percent of the workers in that occupation earn less and 90 percent earn more. For example, if the 10th percentile wage for an occupation is $15 per hour, 10 percent of the people working in this occupation earn less than $15 per hour and 90 percent earn more. How are Wages Affected by Education and Work Experience? Oregon Wage Information reports do not take levels of education or work experience into account. The survey used to collect wage data from employers does not ask for wages paid based on education or work experience. The survey asks employers only what wage level is paid to each employee in each occupation. Wages vary by education and experience. Generally, the more education and work experience people have, the higher their pay. How to use Oregon Wage Information if you are an Employer Employers looking to hire new employees or analyze wages paid to current employees must look at the entire range of wages published. If an employer wants to hire a worker but is unsure what wage to offer, the employer must consider the duties of the position and the education and work experience required for the job. If the job is an entry-level position, the employer may want to consider offering a wage in the 10th or 25th percentile range. If, on the other hand, an employer is looking to hire someone with many years of experience, the more appropriate wage may be near the 90th percentile. Employee or Job Seeker To determine the wage level that is likely to be the most appropriate for you, first evaluate your experience and education levels. Are they low or high? Do you have a lot of experience in the occupation or are you new to it? If you are new to the occupation and meet its minimal education and experience requirements, the wage that may be most appropriate for you is in the 10th to 25th percentile range. This generally is considered a level earned by those just starting in an occupation. If you have worked in an occupation for a while and feel you are very experienced in it, then you may consider the median, 75th, or 90th percentile to be a level that would be appropriate for your experience and education.

Oregon Employment Department Workforce Analysis 7 Rogue Valley Trends July 2010
MEDFORD-ASHLAND MSA (JACKSON COUNTY)
May Apr May Apr MayLabor Force Status 2010 2010 2009 2010 2009
Civilian Labor Force 101,707 101,886 102,237 -179 -530 Unemployed 12,392 12,964 13,276 -572 -884 Unemployment Rate 12.2% 12.7% 13.0% -0.5 -0.8 Seasonally Adjusted Unemployment Rate 12.3% 12.3% 13.2% 0.0 -0.9 Employed 89,315 88,922 88,961 393 354
Nonfarm Payroll EmploymentMay Apr May Apr May2010 2010 2009 2010 2009
Total Nonfarm Payroll Employment 75,030 74,230 75,730 800 -700
Total private 62,010 61,630 62,990 380 -980
Mining and logging 540 510 530 30 10
Construction 2,820 2,730 3,300 90 -480
Manufacturing 5,710 5,670 5,940 40 -230
Trade, transportation, and utilities 16,820 16,780 16,780 40 40
Wholesale trade 2,250 2,240 2,260 10 -10 Retail trade 11,930 11,900 11,810 30 120
Transportation, warehousing, and utilities 2,640 2,640 2,710 0 -70
Information 1,590 1,590 1,630 0 -40
Financial activities 3,940 3,960 4,070 -20 -130
Professional and business services 6,810 6,750 6,940 60 -130
Educational and health services 12,460 12,480 12,300 -20 160
Health care and social assistance 11,730 11,730 11,640 0 90
Health care 10,440 10,450 10,430 -10 10
Leisure and hospitality 8,750 8,600 8,940 150 -190
Accomodation and food services 7,350 7,170 7,410 180 -60
Other services 2,570 2,560 2,560 10 10
Government 13,020 12,600 12,740 420 280
Federal government 2,070 1,850 1,800 220 270
State government 3,030 3,030 3,010 0 20
State education 1,400 1,400 1,510 0 -110
Local government 7,920 7,720 7,930 200 -10
Local education 5,100 4,990 5,060 110 40
Labor/Management Disputants 0 0 0 0 0
The most recent month is preliminary, the prior month is revised. Prepared in cooperation w ith the U.S. Department of Labor, Bureau of Labor Statistics.
-Change from-
-Change from-
Current Labor Force and Industry Employment
Nonfarm Payroll Employment: Data are by place of work and cover full- and part-time employees who worked or received pay for the pay period that includes the 12th of the month. The data exclude the self-employed, volunteers, unpaid family workers, and domestics.
Labor Force Status: Civilian labor force includes employed and unemployed individuals 16 years and older by place of residence. Employed includes nonfarm payroll employment, self-employed, unpaid family workers, domestics, agriculture, and labor disputants. Unemployment rate is calculated by dividing unemployed by civilian labor force.

Oregon Employment Department Workforce Analysis Rogue Valley Labor Trends July 2010
8
CURRENT LABOR FORCE AND INDUSTRY EMPLOYMENT JOSEPHINE COUNTY
May Apr. May Apr. MayLabor Force Status 2010 2010 2009 2010 2009
Civilian Labor Force 34,963 35,054 35,580 -91 -617 Unemployed 4,677 4,934 5,041 -257 -364 Unemployment rate 13.4% 14.1% 14.2% -0.7 -0.8 Seasonally Adjusted Unemployment Rate 14.5% 14.0% 15.4% 0.5 -0.9 Employed 30,286 30,120 30,539 166 -253
May Apr. May Apr. MayNonfarm Payroll Employment 2010 2010 2009 2010 2009
Total Nonfarm Payroll Employment 22,920 22,640 23,530 280 -610
Total private 18,880 18,700 19,540 180 -660
Mining and logging 130 130 150 0 -20
Construction 820 790 880 30 -60
Manufacturing 2,230 2,240 2,350 -10 -120
Wood product manufacturing 420 410 400 10 20
Trade, transportation, and utilities 4,820 4,790 5,020 30 -200
Wholesale trade 960 960 970 0 -10
Retail trade 3,460 3,440 3,610 20 -150
Food and beverage stores 860 860 870 0 -10
Transportation, warehousing, and utilities 400 390 440 10 -40
Information 310 310 320 0 -10
Financial activities 1,480 1,490 1,500 -10 -20
Professional and business services 1,430 1,440 1,460 -10 -30
Educational and health services 4,190 4,200 4,250 -10 -60
Educational services 190 190 180 0 10
Health care and social assistance 4,000 4,010 4,070 -10 -70
Ambulatory health care services 1,460 1,470 1,480 -10 -20
Nursing and residential care facilities 1,180 1,180 1,190 0 -10
Leisure and hospitality 2,590 2,450 2,710 140 -120
Other services 880 860 900 20 -20
Government 4,040 3,940 3,990 100 50
Federal government 410 310 340 100 70
State government 850 840 860 10 -10
Local government 2,780 2,790 2,790 -10 -10
Local education 1,950 1,960 1,970 -10 -20
Labor/Management Disputants 0 0 0 0 0
The most recent month is preliminary, the prior month is revised. Prepared in cooperation w ith the U.S. Department of Labor, Bureau of Labor Statistics.
-Change from-
-Change from-
Labor Force Status: Civilian labor force includes employed and unemployed individuals 16 years and older by place of residence. Employed includes nonfarm payroll employment, self-employed, unpaid family workers, domestics, agriculture, and labor disputants. Unemployment rate is calculated by dividing unemployed by civilian labor force.
Nonfarm Payroll Employment: Data are by place of work and cover full- and part-time employees who worked or received pay for the pay period that includes the 12th of the month. The data exclude the self-employed, volunteers, unpaid family workers, and domestics.

July 2010
Local News In the Salem Metropolitan Statistical Area (MSA), the seasonally adjusted jobless rate increased in May to 10.8 percent from April’s revised rate of 10.4 percent. The Salem MSA’s unemployment rate nearly matched the statewide seasonally adjusted rate of 10.6 percent in May. The unemployment rate for the Salem MSA in May was 0.5 percentage point lower than the rate 12 months earlier in May 2009. In the Salem MSA, nonfarm employment dropped 600 jobs over the past 12 months. Labor Force Summary There were an estimated 20,250 Marion and Polk County residents unemployed in a civilian labor force of 197,519 for the month, and there were 177,269 residents employed including payroll employees, self-employed, farm workers, and
Economic Indicators
Unemployment Rates Seasonally Salem MSA Raw Adjusted May 2010 10.3% 10.8% Apr. 2010 10.7% 10.4% Oregon May 2010 10.4% 10.6% Apr. 2010 10.7% 10.6% United States May 2010 9.3% 9.7% Apr. 2010 9.5% 9.9%
Nonfarm Payroll Employment (Preliminary Estimates)
Annual Salem Metro Employment change Total Employment 145,100 -600 Manufacturing 11,400 -200 Construction 6,400 -500 Trade, Trans, & Utl. 22,700 -800 Financial Act. 6,900 -200 Prof. & Bus Svcs. 12,200 100 Educ. & Health Svcs. 21,400 300 Leisure & Hosp. 11,800 -600 Other Private 7,500 -100 Government 44,800 1,400
Consumer Price Index (CPI) United States (May 2010) 218.2 Yearly % Change 2.0% Portland/Salem OR-WA MSA 215.6 Annual Average 2009 +0.1%
http://www.bls.gov/cpi
-900 -600 -300 0 300 600 900 1,200 1,500
Manufacturing
Construction
Trade, Trans., and Utilities
Financial Activities
Prof. and Business Services
Educational and Health Services
Leisure and Hospitality
Other Private
Government
Change in Nonfarm Payroll Employment
Salem MSA: Employment Change, May 2010
past month
past year

2 Oregon Employment Department Workforce Analysis Salem Metro Trends July 2010
residents commuting outside of the counties for work. Overall, there were 834 fewer people unemployed in the Salem MSA than in May 2009. Nonfarm Payroll Employment In the Salem MSA, May total nonfarm employment was 145,100, a loss of 600 jobs since May 2009. Private nonfarm employment lost 2,000 over the past 12 months, while public-sector employment was up 1,400 over that period. Educational and health services gained 300 jobs over the past 12 months. From April to May, the Salem MSA’s total nonfarm employment increased 1,700 jobs; private-sector employment added 600 jobs during the month while government employment added 1,100 jobs from its April level. May’s employment growth was larger than is typical for the Salem MSA, which normally adds about 1,300 jobs between April and May. Seasonally adjusted employment increased 400 from April to May. Much of May’s job growth was the result of employment related to the 2010 Census. Federal government employment added 1,000 jobs in May, most of which were temporary jobs. The construction sector added 200 jobs in May. Over the past 12 months, construction employment dropped 500. Manufacturing employment also added 200 in May, but remains 200 below the May 2009 level. Retail trade employment added 100 in May; the sector dropped 600 jobs over the past 12 months. Professional and business services employment was unchanged in May; however, the sector is now showing positive over-the-year growth of 100. Professional and business services includes temporary help employment agencies, this industry is seen as a “leading indicator” as to the direction the overall economy may be moving. Professional and business services showed slow, but positive, over-the-year employment growth the last six months, a sign the local economy is slowly starting to move in a positive direction. In the public sector, federal government added 1,000 jobs while state and local government employment remained unchanged in May.
Nonfarm payroll employment statistics are by place of work and estimate how many jobs have been added or lost in an area. They measure an area’s economic health and are based on a survey of employers. Nonfarm payroll employment shows how many people were employed in a given area, on average, during the month.
Salem Metro Labor Trends is published by the Workforce and Economic Research Division of the Oregon Employment Department. Salem Metro Labor Trends also can be found on the Publications page at www.QualityInfo.org. Material contained in this publication is in the public domain and may be reproduced without permission. Please credit Salem Metro Labor Trends, Oregon Employment Department.
Laurie Warner, Director Graham Slater, Administrator for Workforce and Economic Research Patrick O’Connor, Regional Economist Gail Krumenauer, Workforce Analyst Salem (503) 302-8568 Danell Butler, Field Office Manager Salem (503) 378-8080 Dallas (503) 831-1950 Woodburn (503) 982-2817
Please direct address changes to: Oregon Employment Department Workforce and Economic Research 875 Union St NE Salem OR 97311 Phone (503) 947-1204 TDD (503) 947-1391 e-mail [email protected] The Oregon Employment Department is an equal opportunity employer. Auxiliary aids and services are available upon request to individuals with disabilities.

Oregon Employment Department Workforce Analysis 3 Salem Metro Trends July 2010
Outlook Construction and manufacturing employment were the hardest-hit sectors in the Salem MSA during the recession. Losses in these sectors and slower consumer spending have caused job loss in Salem to spread to other sectors such as retail trade and leisure and hospitality. Job loss has slowed in recent months in the Salem MSA. Employment growth in professional and business services is a sign the economy may be starting to move in a positive direction. However, unemployment rates remain quite high, and higher-than-normal unemployment rates will likely persist through 2010. These preliminary estimates will be revised as new data from businesses becomes available. Yamhill County Jobless Rates and Employment In Yamhill County, the seasonally adjusted jobless rate increased to 11.0 percent in May from April’s revised rate of 10.7 percent. Yamhill County’s unemployment rate was higher than the statewide seasonally adjusted rate, which was 10.6 percent in May. Yamhill County’s unemployment rate of 11.0 percent in May was lower than the 12.2 percent rate 12 months earlier. Statewide, the seasonally adjusted unemployment rate was 1.0 percentage point lower than its rate of 11.6 percent in May 2009. In Yamhill County, nonfarm employment declined 200 or 0.7 percent over the past 12 months. Labor Force Summary There were an estimated 5,041 Yamhill County residents unemployed in a civilian labor force of 47,798 for the month, and there were 42,757 residents employed including payroll employees, self-employed, farm workers, and residents commuting outside of the county for work. The number of unemployed in the county decreased 154 from the level in April. Overall, there were 617 fewer people unemployed in Yamhill County than in May 2009. Since May 2009, Yamhill County’s civilian labor force has shed 800 people, or 1.6 percent. Nonfarm Payroll Employment In Yamhill County, May total nonfarm employment was 30,000, down 200 jobs since May 2009. Private nonfarm employment declined 270 since May 2009 while public-sector employment added 70 jobs over that period. Manufacturing employment lost 70 jobs over the past 12 months. The county’s construction sector showed large employment losses during the recession, but losses have slowed over the past year. Construction employment declined 200 or 14 percent since May 2009. From August 2007 to May 2010, Yamhill County lost 2,270 jobs, or 7.1 percent. From April to May, Yamhill County’s total nonfarm employment increased 130 jobs; the private sector dropped 60 jobs while the public sector added 190 jobs. May’s job growth was larger than normal for Yamhill County, which normally adds about 60 jobs between April and May. Seasonally adjusted employment increased 70 between April and May. Much of May’s job growth was the result of federal government employment growing 100 largely due to temporary work being done for the 2010 Census.

4 Oregon Employment Department Workforce Analysis Salem Metro Trends July 2010
Outlook Employment over the past 12 months has declined 0.7 percent. Construction and wholesale trade both declined significantly over the past year. The county’s unemployment rate had shown signs of improvement earlier this year but it has increased the last three months and has jumped back above the statewide rate. Higher-than-normal unemployment rates are likely to persist through 2010. These preliminary estimates will be revised as new data from businesses becomes available. News From Around the Region Material gathered from published, nonconfidential sources. The 45th Grill opened at the Keizer Renaissance Inn & Conference Center. It employs nine people. Willamette Auto Group in Salem closed on June 15. It employed about 30 people. Divine Dog Boarding opened in Stayton. It features nine hotel-style kennels called “divine suites.” Some suites feature TVs and webcams so owners can log onto the company’s website to check on their dog while they are away. Momiji Japanese Crepes & Sushi opened in Salem. Tangled Purls, a yarn and craft store, opened in Salem. It also offers classes, workshops, and gift items. The First Presbyterian Church of Salem will close its preschool and kindergarten child development center on June 30. It employs nine people. Rue21, a retail chain known for its emphasis on apparel and fashion accessories for teens, will open a store at Lancaster Mall in Salem next month. Beirhaus, a German-themed sports bar, will open in Mt. Angel. Barriles El Caribe, a business selling custom-built, handmade barrels, opened in Keizer. Daybreak Snack Shop Donuts and Deli opened in Monmouth. Bread Board, an artisan bakery, will open in Falls City.
-300 -200 -100 0 100 200 300
Manufacturing
Construction
Trade, Trans., and Utilities
Financial Activities
Prof. and Business Services
Educational and Health Services
Leisure and Hospitality
Other Private
Government
Change in Nonfarm Payroll Employment
Yamhill County: Employment Change, May 2010
past month
past year

Oregon Employment Department Workforce Analysis 5 Salem Metro Trends July 2010
West Valley Mobile Detailing opened in Dallas. It offers detailing services for cars, trucks, boats and recreational vehicles. Just Stuff, a second-hand store, opened in Dallas. The Deck Poker Club opened in Monmouth. Top of the Line House and Pet Sitting Service opened in Carlton. Happy Family Restaurant opened in Newberg. It offers Cantonese-style Chinese food. The Charrette Art Studio opened in Carlton. Forest Grove Lumber in McMinnville closed. It employed 50 people. The Dollar Store in Newberg will close. It employs seven people. Treasure Cat Consignments will open in McMinnville. It will offer outdoor games, athletic equipment, furniture, home decor, jewelry, electronics, and movies. Oregon Employment Oregon’s seasonally adjusted unemployment rate was 10.6 percent in May, the same as in March and April. The rate has been essentially unchanged for the most recent seven months. Oregon’s unemployment rate was 11.6 percent in May 2009, which tied June 2009 as Oregon’s highest unemployment rate since the early 1980s. The U.S. seasonally adjusted unemployment rate dropped to 9.7 percent in May from 9.9 percent in April.
In May, 202,944 Oregonians were unemployed. In May 2009, 223,474 Oregonians were unemployed. In seasonally adjusted terms, both Oregon’s civilian labor force and its number of citizens employed increased modestly in May. This marked the fifth consecutive month of increases in both these figures. Oregon’s seasonally adjusted nonfarm payroll employment was flat in May, following a gain of 5,500 (as revised) in April.
0%
2%
4%
6%
8%
10%
12%
14%
Jan-99 Jan-00 Jan-01 Jan-02 Jan-03 Jan-04 Jan-05 Jan-06 Jan-07 Jan-08 Jan-09 Jan-10
Seasonally Adjusted Unemployment Rates
US
Oregon
Salem MSA
Yamhill County

6 Oregon Employment Department Workforce Analysis Salem Metro Trends July 2010
Government added 6,800 jobs in May at a time of year when a gain of 3,700 is expected due to seasonality. The addition of 4,451 intermittent Census workers boosted both federal government and total government for May, adding to the 1,952 already working for the Census in April. In the private sector, several major industries posted job declines, while only two major industries produced substantial seasonally adjusted job gains: construction and manufacturing. Construction posted its third consecutive seasonally adjusted job gain. It added 1,700 jobs at a time of year when a gain of 1,200 is the normal seasonal movement. Construction employment stood at 64,200 jobs in May, still well below its May 2009 tally of 73,100.
Manufacturing continued to slowly recover from its recent trough. Seasonally adjusted employment rose 700 in May and is now up 1,400 from its February trough. Over the last several months, durable goods employment continued to hover above 110,000, while nondurable goods steadied slightly below 50,000. Trade, transportation, and utilities normally gains 1,700 jobs due to seasonal factors in May, so this May’s flat employment trend was 1,700 below normal seasonal expectations. Retail trade contributed most of the dismal performance as it added only 300 jobs during the normally rapidly growing spring month of May.
Financial activities gave back its April gains, dropping 800 jobs in May. The industry fell below 93,000 for only the second month in more than 12 years. Professional and business services added only 100 jobs in May when a gain of 800 is the normal seasonal movement. The industry is now close to its December employment level after showing modest gains during the first part of the year.
Educational and health services dropped 1,900 jobs in May, when it normally would drop by only 1,300 for the month. Despite the one-month decline there have been solid long-term gains. Over the past 12 months, health care and social assistance added 1,300 jobs. National Employment The number of unemployed persons was 15.0 million in May. The unemployment rate edged down to 9.7 percent, the same rate as in the first three months of 2010. Nonfarm payroll employment increased by 431,000 in May, reflecting the addition of 411,000 temporary workers for Census 2010. Total private employment showed little change over the month (+41,000), following increases in March and April. In May, manufacturing, temporary help services, and mining added jobs, while employment in construction declined. Manufacturing employment increased by 29,000 over the month. Factory employment rose by 126,000 over the past five months. Within manufacturing, both fabricated metals and machinery added jobs in May. Temporary help services added 31,000 jobs over the month; employment in the industry rose by 362,000 since September 2009.

Oregon Employment Department Workforce Analysis 7 Salem Metro Trends July 2010
Employment in mining continued to increase in May, with a gain of 10,000. Support activities for mining accounted for 8,000 of the over-the-month increase. Since October 2009, mining employment expanded by 50,000. Health care employment was little changed in May (+8,000). Over the prior 12 months, health care employment increased by an average of 20,000 per month. In May, employment in construction declined by 35,000, largely offsetting industry gains in the prior two months. May's job loss was spread throughout the sector. Employment in other private-sector industries, including wholesale trade, retail trade, transportation and warehousing, information, financial activities, and leisure and hospitality showed little or no change in May. Government employment rose by 390,000 in May. The federal government hired 411,000 temporary workers for Census 2010, bringing total temporary census staffing during the payroll survey reference period to 564,000. Employment in state government excluding education decreased by 13,000.

8 Oregon Employment Department Workforce Analysis Salem Metro Trends July 2010
Salem MSA LABOR FORCE SUMMARY (by place of residence)
May Apr. May Apr. May2010 2010 2009 2010 2009
C ivilian Labor Force 197,519 197,424 196,706 95 813 Unemployment 20,250 21,164 21,084 -914 -834 Percent of Labor Force 10.3% 10.7% 10.7% XX XX Total Employment 177,269 176,260 175,622 1,009 1,647Seasonally Adjusted Unemployment Rate 10.8% 10.4% 11.3% XX XX
Salem MSA NONFARM PAYROLL EMPLOYMENT(by place of work)
May Apr. May Apr. May2010 2010 2009 2010 2009
TOTAL NONFAR M PAYROLL EMPLOYMENT 145,100 143,400 145,700 1,700 -600
SEASONALLY ADJUSTED NONFARM PAYROLL EMPLOYMENT 145,000 144,600 145,600 400 -600
TOTAL PRIVATE 100,300 99,700 102,300 600 -2,000 Mining and logging 900 900 1,000 0 -100 Construction 6,400 6,200 6,900 200 -500 Manufacturing Total 11,400 11,200 11,600 200 -200 Durable Goods 5,000 5,000 5,300 0 -300 N ondurable Goods 6,400 6,200 6,300 200 100 Food Products Manufacturing 4,300 4,100 4,300 200 0 Trade, Transportation, and Utilities 22,700 22,700 23,500 0 -800 W holesale Trade 3,400 3,400 3,600 0 -200 R etail Trade 15,700 15,600 16,300 100 -600 Transportation, W arehousing, and Utilities 3,600 3,700 3,600 -100 0 Information 1,300 1,300 1,300 0 0 Financial Activities 6,900 6,900 7,100 0 -200 Professional and Business Services 12,200 12,200 12,100 0 100 Administrative and Support Services 6,200 6,100 6,200 100 0 Educational and Health Services 21,400 21,400 21,100 0 300 Health Care and Social Assistance 18,300 18,300 18,000 0 300 Health Care 15,400 15,400 15,200 0 200 Leisure and Hospitality 11,800 11,600 12,400 200 -600 Accomodation and Food Services 10,400 10,300 10,900 100 -500 Other Services 5,300 5,300 5,300 0 0 Government 44,800 43,700 43,400 1,100 1,400 Federal Government 2,800 1,800 1,600 1,000 1,200 S tate Government 21,900 21,800 21,500 100 400 State Government Educational Services 2,300 2,300 2,300 0 0 Local Government 20,100 20,100 20,300 0 -200 Tribal Government 1,800 1,800 1,900 0 -100 Local Government Educational Services 12,100 12,100 12,000 0 100
LABOR-MANAGEMENT DISPUTES 0 0 0 0 0
Nonfarm Payroll Employment: Data are by place of work and cover full- and part- time employees who worked or received pay for the pay period that includes the 12 th of the month. The data exclude the self-emp loyed, volunteers, unpaid family workers, and domestics. "Natu ral resources" includes only Logging (NAICS 1133).
Current Labor Force and Industry Employment
-C hange from-
-C hange from-
The most recent month is preliminary, the pr ior month is revised. Prepared in cooperation with the U.S. Department of Labor, Bureau of Labor Statistics.
Labor Force Status: Civilian labor force includes employed and unemployed individuals 16 years and o lder by p lace of residence . Emp loyed includes non farm payroll employment, self-employed, unpaid family workers, domestics, ag riculture, and labor disputants. Unemployment rate is calculated by div id ing unemployed by civilian labor force.

Oregon Employment Department Workforce Analysis 9 Salem Metro Trends July 2010
Yamhill County LABOR FORCE SUMMARY (by place of residence)
May. Apr. May. Apr. May.Labor Force Status 2010 2010 2009 2010 2009
Civilian Labor Force 47,798 48,088 48,598 -290 -800 Unemployment 5,041 5,195 5,658 -154 -617 Percent of Labor Force 10.5% 10.8% 11.6% XX XX Total Employment 42,757 42,893 42,940 -136 -183Seasonally Adjusted Unemployment Rate 11.0% 10.7% 12.2% xx XX
YAMHILL COUNTY NONFARM PAYROLL EMPLOYMENT(by place of work)
TOTAL NONFARM PAYROLL EMPLOYMENT 30,000 29,870 30,200 130 -200SEASONALLY ADJUSTED NONFARM PAYROLL EMPLOYMENT 29,510 29,440 29,710 70 -200
Total private 24,690 24,750 24,960 -60 -270 Mining and logging 160 160 170 0 -10 Construction 1,190 1,150 1,390 40 -200 Manufacturing 5,670 5,640 5,740 30 -70 Trade, transportation, and utilities 4,190 4,200 4,340 -10 -150 W holesale trade 500 500 550 0 -50 Retail trade 3,020 3,030 3,090 -10 -70 Motor vehicle and parts dealers 510 510 500 0 10 Food and beverage stores 780 760 800 20 -20 General merchandise stores 670 690 720 -20 -50 Transportation, warehousing, and utilities 670 670 700 0 -30 Information 190 190 190 0 0 Financial activities 1,160 1,170 1,200 -10 -40 Professional and business services 1,470 1,470 1,500 0 -30 Educational and health services 6,840 6,970 6,870 -130 -30 Educational services 2,810 2,930 2,860 -120 -50 Health care and social assistance 4,030 4,040 4,010 -10 20 Leisure and hospitality 2,810 2,790 2,570 20 240 Other services 1,010 1,010 990 0 20 Government 5,310 5,120 5,240 190 70 Federal government 600 500 490 100 110 State government 450 450 420 0 30 Local government 4,260 4,170 4,330 90 -70 Local education 2,740 2,680 2,730 60 10 Local government, excluding educational ser 1,520 1,490 1,600 30 -80
Labor Disputes 0 0 0 0 0
The most recent month is preliminary, the prior month is revised.
---Change from---
Current Labor Force and Industry Employment
Nonfarm Payroll Employment: Data are by place of work and cover full- and part-time employees who worked or received pay for the pay period that includes the 12th of the month. The data exclude the self-employed, vo lunteers, unpaid family workers, and domestics. "Natural resources" includes only Logging (NAICS 1133).
Labor Force Status: Civilian labor force includes employed and unemployed individuals 16 years and o lder by p lace of residence . Employed includes nonfarm payroll employment, self-employed, unpaid family workers, domestics, agriculture , and labor disputants. Unemployment rate is calculated by divid ing unemployed by civilian labor force.


July 2010
Coos County Coos County payroll employment rose by 340 jobs in May. Federal government hiring related to temporary jobs to conduct the 2010 Census accounted for about 100 of the month’s employment increase. Over the year, total payroll employment slipped by 280 jobs. If it were not for the Census hiring, the over-the-year decline would be closer to 400 jobs. In May, leisure and hospitality added 80 jobs in advance of the peak tourism season. Local government education employment rose by 110 jobs, a typical change for the month. Over the year, local government education fell by 10 jobs. Private educational and health services added 50 jobs in May and 90 jobs over the year. Professional and business services showed a slight increase of 20 jobs in May.
Economic Indicators Unemployment Rates
Seasonally
Raw Adjusted Coos County May 2010 11.9% 12.9% Previous month 12.6% 12.4% Year ago 13.0% 14.1% Curry County May 2010 12.1% 13.3% Previous month 13.2% 12.9% Year ago 13.3% 14.6% Oregon May 2010 10.4% 10.6% Previous month 10.7% 10.6% Year ago 11.3% 11.6% United States May 2010 9.3% 9.7% Previous month 9.5% 9.9% Year ago 9.1% 9.4%
Consumer Price Index (CPI)
1982-1984 = 100 All Urban Consumers
United States
May 2009 213.856 May 2010 218.178 Percent change 2.0% Portland-Salem OR-WA
July-Dec 2008 216.159 July-Dec 2009 217.191 Percent change 0.5% Source: Bureau of Labor Statistics
Percentage Change
Less Than -1%
-1% to 1%
More Than 1%
Oregon: Annual Job Change,May 2009 to May 2010

Oregon Employment Department Workforce Analysis South Coast Trends July 2010
2
Over the year the largest employment losses were in construction (-120), manufacturing (-110), mining and logging (-90), and professional and business services (-80). Sectors gaining jobs over the year included wood product manufacturing (+30), educational and health services (+90), Indian tribal local government (+40), and federal government (+120), related to temporary hiring by the U.S. Census Bureau. Curry County Curry County payroll employment gained 220 jobs in May, with a wide array of sectors boosting job counts. Over the year, employment fell 80 jobs but would be closer to a loss of 100 jobs without the temporary federal government hiring related to the 2010 Census. In May, construction employment increased slightly gaining 20 jobs. Retail trade also added 20 jobs over the month. Educational and health services employment added 50 jobs, in part due to hiring for the newly opened Sea View Assisted Living Center in Brookings. Leisure and hospitality employment gained 50 jobs – no surprise for this time of the year. Federal government employment added 40 jobs over the month, mostly due to temporary positions to conduct the 2010 Census. Over the year, sectors showing the greatest job losses were construction (-70), manufacturing (-40), and leisure and hospitality (-50). A few industries showed job gains since May 2009. Those in positive territory include retail trade (+40), financial activities (+20), health care (+20), federal government (+20), and local government (+20). As those temporary Census jobs wind down, federal government employment is likely to be showing a year-over-year loss next May. Local Business News All material gleaned from published, nonconfidential sources. The Rodeo Steakhouse Grill is slated to open about the middle of July next to the Super 8 hotel in Coos Bay. The World, 5-29-2010 The owners of Bay Area Hot Spring Spas are opening Farmers Harvest Market inside the building housing the spa store in Coos Bay. The World, 5-29-2010 Fellowship Art and Literature is a used book store that is located in the former home of Fiction 101 in Coos Bay. An espresso bar will open soon, and the business is also a book exchange and Wi-fi hotspot. The World, 5-29-2010
South Coast Labor Trends is published by the Workforce and Economic Research Division of the Oregon Employment Department. South Coast Labor Trends also can be found on the Publications page at www.QualityInfo.org. Material contained in this publication is in the public domain and may be reproduced without permission. Please credit South Coast Labor Trends, Oregon Employment Department.
Laurie Warner, Director Graham Slater, Administrator for Workforce and Economic Research Guy Tauer, Regional Economist Workforce Analyst Coos Bay Area (541) 464-2348 Kathie Creasey, Field Office Manager Brookings (541) 469-9836 Coos Bay Area (541) 751-8502
Please direct address changes to: Oregon Employment Department Workforce and Economic Research 875 Union St NE Salem OR 97311 Phone (503) 947-1204 TDD (503) 947-1391 e-mail [email protected] The Oregon Employment Department is an equal opportunity employer. Auxiliary aids and services are available upon request to individuals with disabilities.

Oregon Employment Department Workforce Analysis 3 South Coast Trends July 2010
Haven Décor LLC, offering a wide variety of home and garden knickknacks, recently opened in downtown North Bend. The World, 6-5-10 Time Bomb is a trendy new apparel store that recently opened in downtown Coos Bay. Customers can exchange brand-name attire and hip threads for in-store credit or cash. The World, 6-5-10 Coquille’s only tattoo shop is reopening after the owner took some time off to be a new mom. Inspired Ink is now slightly larger with an expanded waiting area. Along with creating new tattoos for customers, she can add new dimensions to old ones. The World, 6-12-10
Bayside Bakery Deli and Cafe is set to open in July in North Bend. The business is intended to satisfy a craving for fresh and homemade baked goods and authentic paninis. The World, 6-21-2010
Oregon Employment Oregon’s seasonally adjusted unemployment rate was 10.6 percent in May, the same as in March and April. The rate has been essentially unchanged for the most recent seven months. Oregon’s unemployment rate was 11.6 percent in May 2009, which tied June 2009 as Oregon’s highest unemployment rate since the early 1980s. The U.S. seasonally adjusted unemployment rate dropped to 9.7 percent in May from 9.9 percent in April.
In May, 202,944 Oregonians were unemployed. In May 2009, 223,474 Oregonians were unemployed. In seasonally adjusted terms, both Oregon’s civilian labor force and its number of citizens employed increased modestly in May. This marked the fifth consecutive month of increases in both these figures. Oregon’s seasonally adjusted nonfarm payroll employment was flat in May, following a gain of 5,500 (as revised) in April. Government added 6,800 jobs in May at a time of year when a gain of 3,700 is expected due to seasonality. The addition of 4,451 intermittent Census workers boosted both federal government and total government for May, adding to the 1,952 already working for the Census in April.
Watch the monthly press conference live! A press conference will be held on Tuesday, July 13, 2010 at 10:00 am to cover the June statewide unemployment rate. Watch the press conference video-streamed live at www.QualityInfo.org.
Oregon: Seasonally Adjusted Unemployment Rates by AreaMay 2010 (Preliminary Estimates)
Unemployment Rate
Less Than 10%
10% - 13%
More Than 13%

Oregon Employment Department Workforce Analysis South Coast Trends July 2010
4
In the private sector, several major industries posted job declines, while only two major industries produced substantial seasonally adjusted job gains: construction and manufacturing. Construction posted its third consecutive seasonally adjusted job gain. It added 1,700 jobs at a time of year when a gain of 1,200 is the normal seasonal movement. Construction employment stood at 64,200 jobs in May, still well below its May 2009 tally of 73,100. Manufacturing continued to slowly recover from its recent trough. Seasonally adjusted employment rose 700 in May and is now up 1,400 from its February trough. Over the last several months, durable goods employment continued to hover above 110,000, while nondurable goods steadied slightly below 50,000. Trade, transportation, and utilities normally gains 1,700 jobs due to seasonal factors in May, so this May’s flat employment trend was 1,700 below normal seasonal expectations. Retail trade contributed most of the dismal performance as it added only 300 jobs during the normally rapidly growing spring month of May.
Financial activities gave back its April gains, dropping 800 jobs in May. The industry fell below 93,000 for only the second month in more than 12 years. Professional and business services added only 100 jobs in May when a gain of 800 is the normal seasonal movement. The industry is now close to its December employment level after showing modest gains during the first part of the year.
Educational and health services dropped 1,900 jobs in May, when it normally would drop by only 1,300 for the month. Despite the one-month decline there have been solid long-term gains. Over the past 12 months, health care and social assistance added 1,300 jobs.
National Employment The number of unemployed persons was 15.0 million in May. The unemployment rate edged down to 9.7 percent, the same rate as in the first three months of 2010. Nonfarm payroll employment increased by 431,000 in May, reflecting the addition of 411,000 temporary workers for Census 2010. Total private employment showed little change over the month (+41,000), following increases in March and April. In May, manufacturing, temporary help services, and mining added jobs, while employment in construction declined. Manufacturing employment increased by 29,000 over the month. Factory employment rose by 126,000 over the past five months. Within manufacturing, both fabricated metals and machinery added jobs in May. Temporary help services added 31,000 jobs over the month; employment in the industry rose by 362,000 since September 2009. Employment in mining continued to increase in May, with a gain of 10,000. Support activities for mining accounted for 8,000 of the over-the-month increase. Since October 2009, mining employment expanded by 50,000.

Oregon Employment Department Workforce Analysis 5 South Coast Trends July 2010
Health care employment was little changed in May (+8,000). Over the prior 12 months, health care employment increased by an average of 20,000 per month. In May, employment in construction declined by 35,000, largely offsetting industry gains in the prior two months. May's job loss was spread throughout the sector. Employment in other private-sector industries, including wholesale trade, retail trade, transportation and warehousing, information, financial activities, and leisure and hospitality, showed little or no change in May. Government employment rose by 390,000 in May. The federal government hired 411,000 temporary workers for Census 2010, bringing total temporary census staffing during the payroll survey reference period to 564,000. Employment in state government excluding education decreased by 13,000. 2010 Oregon Wage Information Now Available The Oregon Employment Department’s annual Oregon Wage Information publication, online at www.qualityinfo.org/pubs/owi/owi2010.pdf, is a useful tool for a wide audience that includes job seekers, employees, employers, career counselors, and other professionals who deal with labor market information. Wages for the various occupations are calculated statewide and for each of Oregon’s 15 workforce regions. Region 7 wage data for 2010 are published for more than 200 occupations that vary from those paying minimum wage to occupations paying six-figure annual salaries. The number of occupations published varies by region. More populous regions tend to have more occupations published than regions with smaller populations, because larger samples are obtained from regions with larger populations. The annual mean wage is calculated by multiplying the mean hourly wage by 2,080, the yearly equivalent of a 40-hour week. One thing to consider when looking at the annual mean wage for occupations is that many do not provide full-time, year-round work. When identifying wages for a particular occupation, be sure the SOC code and title refer to the same occupation for which you are seeking wage information. Some occupational titles can be misleading, as the SOC description may not match all jobs with similar titles. To obtain SOC descriptions:
1. visit www.QualityInfo.org 2. click on “Publications” on the left side of the home page 3. the “Standard Occupational Classification Descriptions” document listing is near the bottom
right of the “Publications” page.
Benefits information is not included in this publication. One source of benefits data can be found at the Bureau of Labor Statistics’ (BLS) National Compensation Survey website (www.bls.gov/ncs/ebs/home.htm). There, you will find information on benefit provision and incidence (the percentage of workers with access to and participation in employer provided benefit plans) for two major benefit areas (health insurance and retirement). What is a Percentile? Wages are presented as percentiles. The 10th percentile wage is the level at which 10 percent of the workers in that occupation earn less and 90 percent earn more. For example, if the 10th percentile

Oregon Employment Department Workforce Analysis South Coast Trends July 2010
6
wage for an occupation is $15 per hour, 10 percent of the people working in this occupation earn less than $15 per hour and 90 percent earn more. How are Wages Affected by Education and Work Experience? Oregon Wage Information reports do not take levels of education or work experience into account. The survey used to collect wage data from employers does not ask for wages paid based on education or work experience. The survey asks employers only what wage level is paid to each employee in each occupation. Wages vary by education and experience. Generally, the more education and work experience people have, the higher their pay. How to use Oregon Wage Information if you are an Employer Employers looking to hire new employees or analyze wages paid to current employees must look at the entire range of wages published. If an employer wants to hire a worker but is unsure what wage to offer, the employer must consider the duties of the position and the education and work experience required for the job. If the job is an entry-level position, the employer may want to consider offering a wage in the 10th or 25th percentile range. If, on the other hand, an employer is looking to hire someone with many years of experience, the more appropriate wage may be near the 90th percentile. Employee or Job Seeker To determine the wage level that is likely to be the most appropriate for you, first evaluate your experience and education levels. Are they low or high? Do you have a lot of experience in the occupation or are you new to it? If you are new to the occupation and meet its minimal education and experience requirements, the wage that may be most appropriate for you is in the 10th to 25th percentile range. This generally is considered a level earned by those just starting in an occupation. If you have worked in an occupation for a while and feel you are very experienced in it, then you may consider the median, 75th or 90th percentile to be a level that would be appropriate for your experience and education.

Oregon Employment Department Workforce Analysis 7 South Coast Trends July 2010
COOS COUNTY CURRENT LABOR FORCE AND INDUSTRY EMPLOYMENT
May Apr. May Apr. May2010 2010 2009 2010 2009
Labor Force Status
Civilian Labor Force 28,357 28,335 28,426 22 -69 Unemployed 3,368 3,565 3,702 -197 -334 Unemployment rate 11.9% 12.6% 13.0% -0.7 -1.1 Seaonally Adjusted Unemployment Rate 12.9% 12.4% 14.1% 0.5 -1.2 Employed 24,989 24,770 24,724 219 265
Nonfarm Payroll EmploymentMay Apr. May Apr. May2010 2010 2009 2010 2009
Total Nonfarm Payroll Employment 21,140 20,800 21,420 340 -280
Total private 14,680 14,560 15,050 120 -370
Mining and logging 350 360 440 -10 -90
Construction 620 630 740 -10 -120
Manufacturing 1,410 1,400 1,520 10 -110
Wood product manufacturing 700 700 670 0 30
Food manufacturing 220 220 290 0 -70 Trade, transportation, and utilities 3,990 4,000 4,010 -10 -20
Wholesale trade 330 340 340 -10 -10
Retail trade 2,910 2,910 2,900 0 10
Food and beverage stores 730 730 720 0 10
General merchandise stores 790 800 800 -10 -10
Transportation, warehousing, and utilities 750 750 770 0 -20
Information 210 210 230 0 -20
Financial activities 820 820 860 0 -40
Professional and business services 1,950 1,930 2,030 20 -80
Educational and health services 2,440 2,390 2,350 50 90
Leisure and hospitality 2,340 2,260 2,330 80 10
Other services 550 560 540 -10 10
Government 6,460 6,240 6,370 220 90
Federal government 500 400 380 100 120
State government 990 990 1,010 0 -20
Local government 4,970 4,850 4,980 120 -10
Indian tribal 760 750 720 10 40
Local education 1,930 1,820 1,940 110 -10
Labor/Management Disputants 0 0 0 0 0
The most recent month is preliminary, the prior month is revised. Prepared in cooperation with the U.S. Department of Labor, Bureau of Labor S
-Change from-
-Change from-
Nonfarm Payroll Employment: Data are by place of work and cover full- and part-time employees who worked or received pay for the pay period that includes the 12th of the month. The data exclude the self-employed, volunteers, unpaid family workers, and domestics.
Labor Force Status: Civilian labor force includes employed and unemployed individuals 16 years and older by place of residence. Employed includes nonfarm payroll employment, self-employed, unpaid family workers, domestics, agriculture, and labor disputants. Unemployment rate is calculated by dividing unemployed by civilian labor force.

Oregon Employment Department Workforce Analysis South Coast Trends July 2010
8
CURRY COUNTY CURRENT LABOR FORCE AND INDUSTRY EMPLOYMENT
May Apr. May Apr. MayLabor Force Status 2010 2010 2009 2010 2009
Civilian Labor Force 9,303 9,204 9,442 99 -139 Unemployed 1,130 1,212 1,254 -82 -124 Unemployment rate 12.1% 13.2% 13.3% -1.0 -1.1 Seasonally Adjusted Unemployment Rate 13.3% 12.9% 14.6% 0.4 -1.3 Employed 8,173 7,992 8,188 181 -15
May Apr. May Apr. MayNonfarm Payroll Employment 2010 2010 2009 2010 2009
Total Nonfarm Payroll Employment 6,200 5,980 6,280 220 -80
Total private 4,780 4,630 4,900 150 -120
Mining and logging 70 70 80 0 -10
Construction 340 320 410 20 -70
Manufacturing 520 520 560 0 -40
Wood product manufacturing 360 360 400 0 -40
Trade, transportation, and utilities 1,180 1,150 1,130 30 50 Retail trade 970 950 930 20 40
Information 90 90 80 0 10
Financial activities 410 410 390 0 20
Professional and business services 420 420 420 0 0
Educational and health services 600 550 620 50 -20
Health care 520 460 500 60 20
Leisure and hospitality 980 930 1,030 50 -50
Arts, entertainment, and recreation 40 40 50 0 -10
Accommodation and food services 940 890 980 50 -40
Other services 170 170 180 0 -10
Government 1,420 1,350 1,380 70 40
Federal government 130 90 110 40 20
State government 210 210 220 0 -10
Local government 1,070 1,050 1,050 20 20
Labor/Management Disputants 0 0 0 0 0
The most recent month is preliminary, the prior month is revised. Prepared in cooperation with the U.S. Department of Labor, Bureau of Labor S
-Change from-
-Change from-
Labor Force Status: Civilian labor force includes employed and unemployed individuals 16 years and older by place of residence. Employed includes nonfarm payroll employment, self-employed, unpaid family workers, domestics, agriculture, and labor disputants. Unemployment rate is calculated by dividing unemployed by civilian labor force.
Nonfarm Payroll Employment: Data are by place of work and cover full- and part-time employees who worked or received pay for the pay period that includes the 12th of the month. The data exclude the self-employed, volunteers, unpaid family workers, and domestics.