Trends in young people’s wellbeing and the effects …Trends in young people’s wellbeing and the...
12
NHI NGUYEN, NCVER LONGITUDINAL SURVEYS OF AUSTRALIAN YOUTH BRIEFING PAPER 27 Trends in young people’s wellbeing and the effects of the school-to-work transition OVERVIEW The Longitudinal Surveys of Australian Youth (LSAY) ask participants how satisfied they are with aspects of their lives.Their answers give us a measure of the subjective wellbeing of our youth and can be used to explore the link between education, employment and wellbeing. Yet, wellbeing is broader than satisfaction with life. It also encompasses physical, mental and emotional health, as well as social aspects of life.Therefore, to gain a better understanding of the state of young people’s wellbeing, this briefing paper uses national statistics from the Australian Bureau of Statistics (ABS) to examine the major trends that can affect their participation in education and employment. Based on this broader definition of wellbeing, young people are generally disability-free and rate their state of health as ‘excellent’,‘very good’ or ‘good’. However, there are some concerning trends in their wellbeing over time; for instance, one in four young people suffers from a mental health disorder and over 30% are overweight or obese. This paper also analyses the responses of LSAY participants interviewed between 1995 and 2006 to explore how subjective wellbeing changes during the transition from school to work, and finds evidence of notable changes to the average life satisfaction ratings of the cohort between ages 16 to 25. The period between their late teens and early 20s is a particularly happy time for young people. They are finishing school and embarking on early work experiences or post-school study.The majority of them are still living at home and enjoying their social lives.This is also a time when young people’s satisfaction with their future and their level of independence begin to grow. By age 25, young people are less happy with their social life, home life, and career prospects and work. This may be related to unmet expectations or not having a satisfying career. Data from the Household, Income and Labour Dynamics in Australia (HILDA) survey indicate that this downward trend in life satisfaction continues beyond age 25. Previous research on the relationship between education, employment and wellbeing is summarised and we discuss some of the measures of wellbeing, particularly those used in LSAY. This discussion highlights the need for further work on definitions of wellbeing and the development of a consistent framework for measuring this complex construct.
Transcript of Trends in young people’s wellbeing and the effects …Trends in young people’s wellbeing and the...

N H I N G U Y E N , N C V E R
LONGITUDINAL SURVEYS OF AUSTRALIAN YOUTH
B R I E F I N G PA P E R 2 7
Trends in young people’s wellbeing and the effects of the school-to-work transition
OVERVIEW
The Longitudinal Surveys of Australian Youth (LSAY) ask participants how satisfied they are with aspects of their lives. Their answers give us a measure of the subjective wellbeing of our youth and can be used to explore the link between education, employment and wellbeing.
Yet, wellbeing is broader than satisfaction with life. It also encompasses physical, mental and emotional health, as well as social aspects of life. Therefore, to gain a better understanding of the state of young people’s wellbeing, this briefing paper uses national statistics from the Australian Bureau of Statistics (ABS) to examine the major trends that can affect their participation in education and employment. Based on this broader definition of wellbeing, young people are generally disability-free and rate their state of health as ‘excellent’, ‘very good’ or ‘good’. However, there are some concerning trends in their wellbeing over time; for instance, one in four young people suffers from a mental health disorder and over 30% are overweight or obese.
This paper also analyses the responses of LSAY participants interviewed between 1995 and 2006 to explore how subjective wellbeing changes during the transition from school to work, and finds evidence of notable changes to the average life satisfaction ratings of the cohort between ages 16 to 25.
The period between their late teens and early 20s is a particularly happy time for young people. They are finishing school and embarking on early work experiences or post-school study. The majority of them are still living at home and enjoying their social lives. This is also a time when young people’s satisfaction with their future and their level of independence begin to grow.
By age 25, young people are less happy with their social life, home life, and career prospects and work. This may be related to unmet expectations or not having a satisfying career. Data from the Household, Income and Labour Dynamics in Australia (HILDA) survey indicate that this downward trend in life satisfaction continues beyond age 25.
Previous research on the relationship between education, employment and wellbeing is summarised and we discuss some of the measures of wellbeing, particularly those used in LSAY. This discussion highlights the need for further work on definitions of wellbeing and the development of a consistent framework for measuring this complex construct.

2
INTRODUCTION
Wellbeing is a key indicator of the health status of the population. It has also become a focus of school and education policies, with some studies showing a relationship between educational attainment and wellbeing (Stanwick, Ong & Karmel 2006; Noble et al. 2008). Furthermore, the Australian Institute of Health and Welfare (2011) notes that the wellbeing of young people affects their educational outcomes, their transitions into full-time employment, their adult health and their family formation.
However, the literature does not provide a consistent definition or framework to measure wellbeing. This is because wellbeing is a complex notion and encompasses different dimensions, such as physical and mental health, as well as the emotional and social aspects of life. There are also differing opinions about which indicators best measure wellbeing, with different schools of thought on whether objective measures should be used or whether subjective measures (commonly used) are adequate. Fraillon (2004), for example, recommends the use of objective measures – where teachers assess student wellbeing – as opposed to students providing a self-rating of their wellbeing.
These indicators also vary according to the different groups of the population in question (Fraillon 2004). For example, when referring to school-aged students, the definition of wellbeing may be specific to the school setting and be referred to as ‘student wellbeing’ (Noble et al. 2008; Fraillon 2004):
optimal student wellbeing is a sustained state of positive emotions and attitude, resilience, and satisfaction with self, as well as with relationships and experiences at school. (Noble et al. 2008)
A broader definition emerges from the national reporting of population statistics, summarised in two key national reports: Young Australians: their health and wellbeing (Australian Institute of Health and Welfare) and State of Australia’s young people (Muir et al. 2009). These reports provide measures of physical
and mental health and also monitor the progress of other indicators that influence health and wellbeing, such as health behaviours and the leading causes of death, using data from the Australian Bureau of Statistics. This approach is used in this briefing paper to provide an overview of how the wellbeing of young people has changed over time.
However defined, the emotional and social aspects of wellbeing in particular are more difficult constructs to measure. Potential measures for these aspects of wellbeing are the focus of a recent report based on a collaborative project between the Australian Research Alliance for Children and Youth (ARACY) and the Australian Institute of Health and Welfare. The report concluded that, while no single indicator would directly measure social and emotional wellbeing, a ‘first choice’ measure would be an indicator or index of life satisfaction and happiness (Hamilton, Redmond & Muir 2010).
The Longitudinal Surveys of Australian Youth (LSAY) measure the life satisfaction and happiness of young people using a four-point satisfaction scale. From the age of 16, respondents are asked to rate their satisfaction with individual aspects of their life up until age 25. This allows us to explore the link between subjective wellbeing and the stages of transition of LSAY participants.
This paper begins by looking at the different measures of wellbeing in LSAY and at population statistics to explore the changes in young people’s wellbeing over time. The paper also examines how the transition from school to work affects the life satisfaction ratings of LSAY respondents between 1995 and 2006 (Y95 cohort).

3
Life satisfaction ratings are the only consistent measure of wellbeing collected by LSAY, which is primarily concerned with measuring the transitions of young people from school into work, with the main focus being on education and employment outcomes. Given that satisfaction with life or subjective wellbeing only measures one aspect of young people’s wellbeing, we have turned to population statistics from the ABS to explore recent trends in physical and psychological wellbeing. These measures, along with the information collected from LSAY, are summarised in table 1.
The measures listed in table 1 are not designed to be an exhaustive list but are intended to complement the information we use from LSAY to examine the major trends that potentially affect young people’s participation in education and employment. It is beyond the scope of this paper to evaluate the different measures of wellbeing in the literature, but it should be noted that definitions of wellbeing continue to be debated.
WELLBEING MEASURES
Table 1 Summary of wellbeing measures used in this paper
Measures of wellbeing Description Sources used in this paper
Satisfaction with life Satisfaction ratings (4-point scale) or ‘happiness’ across a range of life aspects, including ‘satisfaction with life overall’
• LSAY–allcohortswave3onwards
• Household,IncomeandLabourDynamics in Australia (HILDA) survey
Physical activity Level of exercise
Participation in sport in spare time
Level of exercise during two weeks prior to the survey
• LSAY–Y03cohortwave3
• LSAY–allcohortswave2onwards
• NationalHealthSurvey(ABS)
Body Mass Index (BMI) Ratio of weight in kilograms to the square height in centimetres (kg/m2)
• LSAY–wave3,Y03cohort
• NationalHealthSurvey(ABS)
Self-assessed health status Individual rating of overall health status (5-point scale)
• NationalHealthSurvey(ABS)
Disability or health problems
Disability rate – has a disability or long-term health problem
• Disability, Australia (ABS)
Mental health disorder Experience of a mental health disorder in the past 12 months
• NationalSurveyofMentalHealth(ABS)
Rate of psychological distress
Kesslerscale(K-10)–emotionalstate30daysprior to the survey
• NationalHealthSurvey(ABS)
Suicide rate Cause of death (age-standardised death rate per 100 000)
• Causes of death, Australia (ABS)
1 ThesequestionswereintroducedtotheY03questionnaireforwave2onlyasawayofgaugingthephysicalhealthofthecohort,but have not been repeated for later cohorts.
2 PeoplewithacalculatedBodyMassIndex(BMI)intherangeof25–30areclassifiedas‘overweight’andthosewithacalculatedBMIintherangeof30oraboveareclassifiedas‘obese’.BMIcalculationissolelydependentonheightandweight,itdoesnotconsider the distribution of muscle and bone, nor does it differentiate between body fat and muscle mass. Therefore, there is the potential to arrive at misleading information about the amount of ‘fat’ of an individual using BMI for particular groups of individuals.
Other measures of health captured by LSAY include Body Mass Index (BMI) and an overall rating of health. However, these are only collected for one cohort(Y03)atonepointintime(ataverageage17,wave3).1 BMI is one of the key health indicators
and is linked to the risk of disease and death and commonly used as an indicator for physical health,2 with people categorised into healthy or unhealthy weight ranges.

4
Similarly, disability and health problems are only capturedforthosefirstinterviewedin2003atage17(averageageinwave3).Forothercohorts,thisinformation is collected indirectly as part of reasons why a respondent has difficulty participating in the workforce, and is not collected for the entire sample. Finally, incidence of sporting activity or exercise is another health behaviour linked to physical health captured for all LSAY cohorts as part of activities undertaken in their spare time.
Because the information about BMI is a one-off occurrence in LSAY, data from the National Health Survey (ABS 2002, 2006, 2009) is used to examine patterns of obesity and other health risk factors. Obesity has been given a national focus under the National Health Priority Areas because of the burden of illness and injury it places on in the Australian population. Mental health disorders also fall under the National Health Priority Areas. The increasing prevalence of young people experiencing
mental health disorders is a worrying trend. Data from the National Survey of Mental Health and Wellbeing (ABS 1998, 2008) are presented to explore this issue further.
Another important measure of mental wellbeing is the level of psychological distress. One of the scales suggested by the Australian Research Alliance for Children and Youth as a ‘second choice’ measure of emotional and social wellbeing is the Kessler scale (K-10 or K-6), which provides a measure of psychological distress, based on a respondent’s emotional state four weeks prior to the survey. This information is provided by the National Health Survey (ABS 2002, 2006, 2009).
To complete the picture, mortality indicators, for example, suicide rates (suicide being the leading cause of death for young people), will also be considered, using information collected by the ABS (ABS 2011b).
Overall, young Australians aged 15–24 years experience good health, with only 7% reporting fair or poor health (ABS 2009). But the proportion of people reporting fair or poor health is higher for those from Indigenous and low socioeconomic backgrounds3 (Australian Institute of Health and Welfare 2011). These groups of young people are also more likely to have poorer education outcomes.
Compared with the remainder of the population, young people aged 15–24 have one of the lowest rates of disability or long-term health problems (figure 1).
However, a significant proportion of young people aged 18–24 report experiencing high to very high psychological distress (12%; ABS 2009). In 2007–08, this proportion was higher for young females than for young males (17.4% and 6.5% respectively), but has actually decreased since 2001 (figure 2).
Figure 1 All persons, disability rates by age group, 2009 (%)
Source: ABS (2011a).
3 Thedifferencesbetweentheself-assessedhealthstatusofthoselivinginareasoflowersocioeconomicstatusandthoselivinginthe highest socioeconomic status are not statistically significant.
TRENDS IN YOUNG PEOPLE’S WELLBEING
0
10
20
30
40
50
60
70
80
90
100
90+85–8980–8475–7970–7465–6960–6455–5945–5435–4425–3415–245–140–4
Prop
ortio
n (%
)
Age group (years)

5
Figure 2 Proportion reporting high to very high psychological distress by age group, 2001 and 2007–08 (%)
Source: ABS (2002, 2009).
High scores on the K-10 psychological distress scale are strongly associated with diagnoses of anxiety and affective disorders. The scale is commonly used as an instrument to screen for likely cases of anxiety and depression in the community (Andrew & Slade 2001;Kessleretal.2003).
Mental health disorders are the leading contributor to disease among young people (Australian Institute of Health and Welfare 2011), with significant consequences for young people’s capacity to
participate in education and training and their ability to enjoy life. Statistics from the National Survey of Mental Health and Wellbeing (ABS 2008) show that the proportion of young people reporting a mental health disorder in the last 12 months continues to be the highest compared with any other age group (figure3).Approximatelyoneinfouryoungpeopleaged 16–24 years reports experiencing a mental health disorder in the past year ; this proportion has not improved in the last decade.
0
2
4
6
8
10
12
14
16
182007–082001
75+65–74 55–64 45–54 35–44 25–3418–24
Hig
h to
ver
y hi
gh p
sych
olog
ical
str
ess
(%)
Age (years)
Figure 3 Mental disorders in the last 12 months by age, 2007 (%)
Note: * In 1997, this information was only available for those aged 18–24 years. Comparisons are for illustrative purposes only as there are differences in how data are collected for the 1997 and 2007 surveys.
Source: ABS (1998, 2008).
0
5
10
15
20
25
3019972007
65+55–6445–5435–4425–3416–24*Age (years)
Prop
ortio
n re
port
ing
men
tal h
ealth
dis
orde
r (%
)
In addition, mental health disorders are a risk factor for self-harm and suicide (Australian Institute for Health and Welfare 2010). Overall, age-standardised death rates for young people have significantly decreased over the past 20 years, mainly due to the decrease in deaths caused by transport accidents
and suicide. However, suicide has now taken over as the leading cause of death for young people aged 15–24. Despite a significant decrease between 2000 and 2009, these rates remain higher for males than females (figure 4).
6
Figure 4 Age-specific death rates, suicide for young people aged 15–24 years by sex, 2000–09
Source: ABS (2011b).
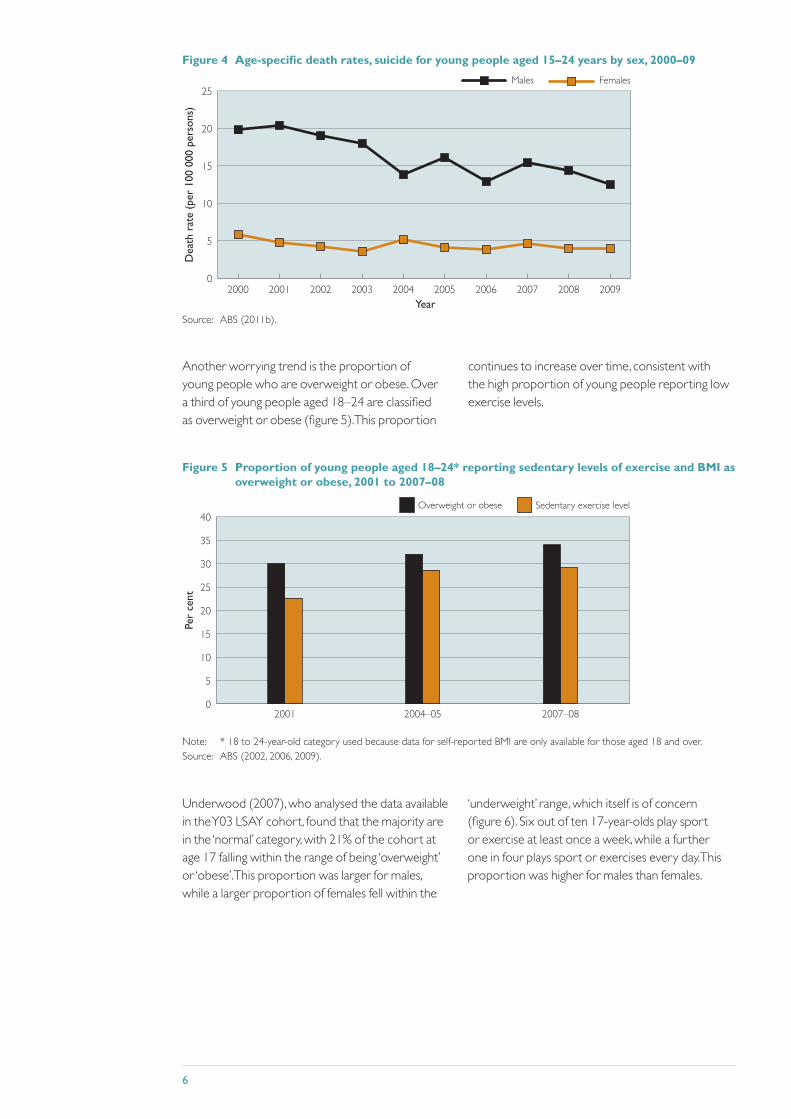
Another worrying trend is the proportion of young people who are overweight or obese. Over a third of young people aged 18–24 are classified as overweight or obese (figure 5). This proportion
continues to increase over time, consistent with the high proportion of young people reporting low exercise levels.
Figure 5 Proportion of young people aged 18–24* reporting sedentary levels of exercise and BMI as overweight or obese, 2001 to 2007–08
Note: * 18 to 24-year-old category used because data for self-reported BMI are only available for those aged 18 and over. Source: ABS (2002, 2006, 2009).
Underwood (2007), who analysed the data available intheY03LSAYcohort,foundthatthemajorityarein the ‘normal’ category, with 21% of the cohort at age 17 falling within the range of being ‘overweight’ or ‘obese’. This proportion was larger for males, while a larger proportion of females fell within the
‘underweight’ range, which itself is of concern (figure 6). Six out of ten 17-year-olds play sport or exercise at least once a week, while a further one in four plays sport or exercises every day. This proportion was higher for males than females.
0
5
10
15
20
25FemalesMales
2009200820072006200520042003200220012000
Dea
th r
ate
(per
100
000
per
sons
)
Year
0
5
10
15
20
25
30
35
40Sedentary exercise levelOverweight or obese
2007–082004–052001
Per
cent

7
Figure 6 Distribution of 17-year-olds’ BMI category
Source: Underwood (2007).
0 20 40 60 80 100
ObeseOverweightNormalUnderweight
Males
Females
Per cent
30
15
55
61
12
19
3
5
THE IMPACT OF TRANSITIONS ON WELLBEING
THE RELATIONSHIP BETWEEN EDUCATION AND WELLBEINGEvidence from previous research suggests that there is a positive relationship between education and measures of health or wellbeing. However, this relationship is complex and involves intermediate variables such as employment and income (Stanwick, Ong & Karmel 2006).
Hillman and McMillan (2005) found that general satisfaction with life and career satisfaction levels accelerated as young people increased the amount of time they spent in post-school study and work, although this relationship was relatively small and was stronger between post-school pathways and career satisfaction.
Analysis on data from the Household, Income and Labour Dynamics in Australia survey by Stanwick, Ong and Karmel (2006) also found that education had some small effects on health. People with degrees as their highest qualification were more likely to have better physical and mental health than those with only Year 11 and below attainment. Although the size of the effect is not as large as that for people with degrees, males and females with diplomas/advanced diplomas as their highest qualification also tended to have better physical and mental health than people with only Year 11 and below attainment. These effects on health and wellbeing were larger for males than for females. The analysis also highlighted how education can indirectly affect health, particularly through its influence on employment and income.
Dockery’s (2010) recent analysis of the LSAY Y95 cohort suggests that the relationship between educational attainment and wellbeing is non-linear. He found that undertaking an apprenticeship stands out as a rewarding experience. In addition, by the age of 25, apprentices and trainees who secure a job they would like as a career after completing their studies were happier than early school leavers and even those with university-level qualifications. By comparison, those with university-level qualifications are initially more satisfied while at school and are relatively happy during their universitystudies,butfromtheagesof23to25they switch to being relatively less happy or satisfied compared with those with intermediate vocational qualifications. One explanation is that school and university life are ‘happy times’ for these young people, and that post-university life does not seem quite as good in relative terms.
Dockery’s analysis of the Y95 cohort also shows evidence of notable changes to the average life satisfaction ratings of the respondents between the ages of 16 and 25 which coincide with milestones in the school-to-work transition. Although these changes are small (table 2), the ratings are statistically different for each subsequent year4 to warrant further exploration.
4 In addition, attrition in the survey does not appear to be a significant issue, with respondents remaining in the survey demonstrating stable life satisfaction ratings over time.

8
Table 2 Self-ratings of happiness with ‘your life as a whole’, 1997–2006 (%)
Average age of cohort (years)
Happiness rating 16.5 17.5 18.5 19.5 20.5 21.5 22.5 23.5 24.5 25.5
Very unhappy 0.3 0.2 0.4 0.2 0.1 0.1 0.1 0.1 0.1 0.2
Fairly unhappy 2.5 1.7 1.7 1.0 1.0 0.9 0.8 0.9 0.9 1.2
Fairly happy 51.3 46.9 45.8 45.8 45.3 45.8 45.4 42.6 45.7 49.2
Very happy 45.9 51.1 52.1 53.0 53.7 53.2 53.7 56.4 53.3 49.4
Total 100.0 100.0 100.0 100.0 100.0 100.0 100.0 100.0 100.0 100.0
Mean 3.43 3.49 3.50 3.52 3.52 3.52 3.53 3.55 3.52 3.48
Sample 10 278 9 721 8773 7 878 6863 6 089 5345 4 655 4 226 3907
Source: Dockery (2010).
EXPLORING THE IMPACT OF TRANSITIONS ON SUBJECTIVE WELLBEINGFigures 7–11 plot the mean happiness of those first interviewed in 1995 at age 16 until 25 with individual aspects of their lives, which include their home life, career and future prospects and their social life and independence.
Average happiness levels with home life (particularly standard of living) are highest during young people’s late teens (1997–2000, figure 7). This period of the survey marks the transition from school into early
post-school education and work for most young people, when the majority of the cohort is still living in the parental home (71% around age 20). Satisfaction with these home life aspects begins to decline in their early 20s and continues to drop as young people reach age 25, after a slight increase at age23.Thiscoincideswiththeirdeparturefromthefamily home, with over two-thirds of the cohort living independently.
Figure 7 Mean happiness with home life aspects and proportion of those still living at home over the transition, LSAY Y95 cohort
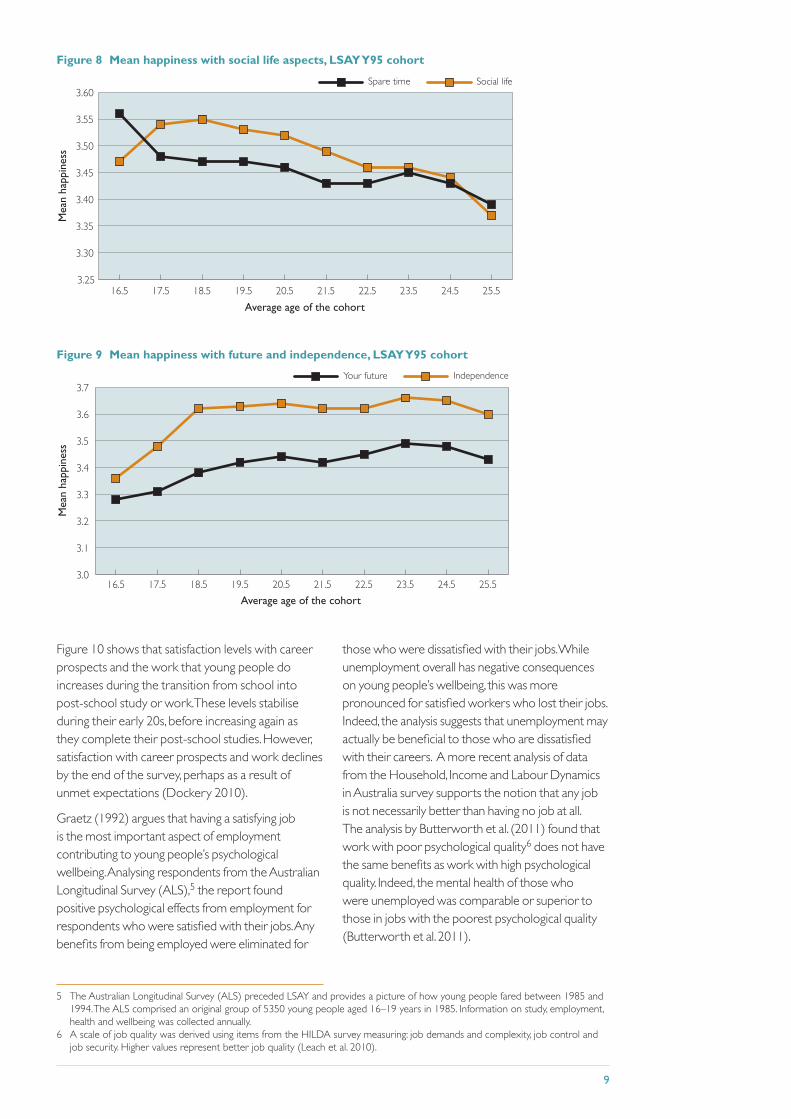
Similarly, young people are more satisfied with their social life and what they do in their spare time during the period of transition from school into post-school study and their early experiences with work. But these satisfaction levels gradually decline as the cohort reaches age 25 (figure 8).
By contrast, we see that young people feel increasingly satisfied with their future and their level of independence during the length of the survey (figure 9). This pattern is also observed for young people’s satisfaction with their career and work aspects of life as they progress into post-school study and employment.
0
10
20
30
40
50
60
70
80
90
100Still living at home
25.524.523.522.521.520.519.518.517.516.5Average age (years)
Prop
ortio
n st
ill li
ving
at
hom
e (%
)
Standard of living Life at home Where you live
3.00
3.08
3.16
3.24
3.32
3.40
3.48
3.56
3.64
3.72
Mea
n ha
ppin
ess
9
Figure 8 Mean happiness with social life aspects, LSAY Y95 cohort
3.25
3.30
3.35
3.40
3.45
3.50
3.55
3.60Social lifeSpare time
25.524.523.522.521.520.519.518.517.516.5
Average age of the cohort
Mea
n ha
ppin
ess
Figure 9 Mean happiness with future and independence, LSAY Y95 cohort
Figure 10 shows that satisfaction levels with career prospects and the work that young people do increases during the transition from school into post-school study or work. These levels stabilise during their early 20s, before increasing again as they complete their post-school studies. However, satisfaction with career prospects and work declines by the end of the survey, perhaps as a result of unmet expectations (Dockery 2010).
Graetz (1992) argues that having a satisfying job is the most important aspect of employment contributing to young people’s psychological wellbeing. Analysing respondents from the Australian Longitudinal Survey (ALS),5 the report found positive psychological effects from employment for respondents who were satisfied with their jobs. Any benefits from being employed were eliminated for
those who were dissatisfied with their jobs. While unemployment overall has negative consequences on young people’s wellbeing, this was more pronounced for satisfied workers who lost their jobs. Indeed, the analysis suggests that unemployment may actually be beneficial to those who are dissatisfied with their careers. A more recent analysis of data from the Household, Income and Labour Dynamics in Australia survey supports the notion that any job is not necessarily better than having no job at all. The analysis by Butterworth et al. (2011) found that work with poor psychological quality6 does not have the same benefits as work with high psychological quality. Indeed, the mental health of those who were unemployed was comparable or superior to those in jobs with the poorest psychological quality (Butterworth et al. 2011).
3.0
3.1
3.2
3.3
3.4
3.5
3.6
3.7IndependenceYour future
25.524.523.522.521.520.519.518.517.516.5
Average age of the cohort
Mea
n ha
ppin
ess
5 The Australian Longitudinal Survey (ALS) preceded LSAY and provides a picture of how young people fared between 1985 and 1994.TheALScomprisedanoriginalgroupof5350youngpeopleaged16–19yearsin1985.Informationonstudy,employment,health and wellbeing was collected annually.
6 A scale of job quality was derived using items from the HILDA survey measuring: job demands and complexity, job control and job security. Higher values represent better job quality (Leach et al. 2010).

10
Figure 10 Mean happiness with career life aspects, LSAY Y95 cohort
Figure 11 Mean happiness with money received and average gross weekly pay (FT) over the transition, LSAY Y95 cohort
Overall, young people are ‘happy’ with the money they receive. And apart from a slight slump during their late teens and early 20s when a significant proportion of the cohort is undertaking full-time post-school study, satisfaction levels do not fluctuatesignificantlyfromameanof3duringthelength of the survey. This is despite an increase in self-reported gross weekly wage from $258.7 at around age 16 to $924.1 at around age 25 (figure 11) and the transition of young people from part-time lower-skilled occupations into full-time higher-skilled occupations (for example, professionals and associate professionals). But this trend may be associated with the cost of increasing independence and becoming self-reliant, with two-
thirds of the cohort moving out of the family home by this time (see figure 7). It should also be noted that these young people have been interviewed during good economic times; therefore, caution should be used when generalising these results to other cohorts interviewed during less buoyant economic conditions.
Satisfaction levels appear to follow a downward trend after young people reach their mid-20s, before increasing again from age 55. Data from the Household, Income and Labour Dynamics in Australia survey give us some indication of whether life satisfaction levels continue to fluctuate beyond age 25, the endpoint of the LSAY survey.
3.10
3.15
3.20
3.25
3.30
3.35
3.40Career prospectsWork you do
25.524.523.522.521.520.519.518.517.516.5Average age of the cohort
Mea
n ha
ppin
ess
200
300
400
500
600
700
800
900
1000 Average gross weekly pay (FT)
25.524.523.522.521.520.519.518.517.516.5Average age (years)
Ave
rage
wee
kly
wag
e ($
)
2.30
2.38
2.46
2.54
2.62
2.70
2.78
2.86
2.94
3.02
3.10Money you get
2.30
2.38
2.46
2.54
2.62
2.70
2.78
2.86
2.94
3.02
3.10Money you get
Mea
n ha
ppin
ess

11
Table 3 Mean life satisfaction by age and sex, 2001–08 (%), HILDA
2001 2003 2005 2006 2007 2008Age group Males Females Males Females Males Females Males Females Males Females Males Females
15–19 8.2 8.1 8.3 8.1 8.3 8.1 8.3 8.2 8.4 8.2 8.4 8.3
20–24 7.8 7.8 7.9 7.8 7.7 8.0 7.8 7.8 7.8 7.9 8.0 7.9
25–34 7.6 7.8 7.8 7.8 7.7 7.7 7.6 7.7 7.6 7.8 7.7 7.8
35–44 7.5 7.8 7.5 7.7 7.5 7.7 7.4 7.7 7.5 7.7 7.6 7.6
45–54 7.8 8.0 7.7 7.9 7.7 7.8 7.7 7.7 7.6 7.7 7.6 7.7
55–64 8.0 8.1 7.9 8.1 8.0 8.0 8.0 8.1 7.9 7.9 7.9 8.0
65+ 8.4 8.5 8.4 8.6 8.3 8.4 8.3 8.3 8.3 8.2 8.2 8.3
Total 7.9 8.0 7.9 8.0 7.8 7.9 7.8 7.9 7.8 7.9 7.9 7.9
Source: Wilkins et al. (2011).
Based on the Household, Income and Labour Dynamics in Australia survey, mean life satisfaction is highest among people aged 65 and over, followed byyoungpeopleaged15–19years(table3).Thisindicates that the period between their late teens
and early 20s is a particularly happy time for young people, perhaps because they are yet to face the stresses and responsibilities of adulthood (Wilkins et al. 2011).
CONCLUSION
While national statistics show that young people generally have good physical health and are more likely to be disability-free, they continue to have the highest prevalence of mental health disorders in the population. The majority of those aged 18–24 years experience low levels of psychological distress; however, 12% report experiencing high to very high levels of psychological distress. Moreover, the proportion overweight or obese is increasing.
Aspects of young people’s subjective wellbeing can also change throughout the school-to-work transition and coincide with milestones at particular stages. Analysis of the satisfaction ratings of LSAY participants from 1995 and 2006 show high levels of happiness with home and social life while these young people in their late-teens are still living at home, but levels decrease as the cohort takes on the growing responsibility and financial obligations of living independently. It is no surprise then to see a corresponding increase in their general satisfaction with their level of independence and their future.
But towards the end of the transition, satisfaction levels follow a downward trend. This could be related to unmet expectations – school and post-school life are particularly happy times for most
young people and life after this period does not seem quite as good. Another explanation is that the positive effects of employment on young people’s psychological wellbeing may be negated if they are not in a satisfying career (Graetz 1992).
LSAY respondents complete their participation in the survey at age 25, which does not provide us with an opportunity to see whether satisfaction levels fluctuate beyond this age. Results from the Household, Income and Labour Dynamics in Australia survey indicate that young people aged 15–19 are among the happiest in the cohort, perhaps because they are yet to face the stresses and responsibilities of adulthood (Wilkins et al. 2011). Only those aged 65 and over report higher ratings of happiness, with lower ratings reported for other age groups, indicating that the downward trend continues well beyond age 25.
The examination of wellbeing measures in this paper also highlights the need for the ongoing debate on the definitional issues of wellbeing and for the development of a consistent framework to measure this complex construct. A more technical project using LSAY is planned to examine this issue further.

12
REFERENCES
Andrew, G & Slade, T 2001, ‘Interpreting scores on the Kessler Psychological Distress Scale’, Australian and New Zealand Journal of Public Health, vol.25, no.6, pp.494–7.
ABS (Australian Bureau of Statistics) 1998, National survey of mental health and wellbeing 1997,cat.no.4326.0,Canberra.
—2002, National health survey 2001,cat.no.4364.0,Canberra.—2006, National health survey 2004–05,cat.no.4364.0,Canberra.—2008, National survey of mental health and wellbeing 2007,cat.no.4326.0,
Canberra.—2009, National health survey 2007–08(re-issue),cat.no.4364.0,Canberra.—2011a, Disability, Australia 2009, cat.no.4446.0, Canberra. —2011b, Causes of death, Australia,cat.no.3303.0,Canberra.Australian Institute for Health and Welfare 2010, Health and wellbeing of
young Australians, bulletin 77, AIHW, Canberra.—2011, Young Australians: their health and wellbeing 2011, AIHW, Canberra.Butterworth, P, Leach, LS, Strazdins, L, Olesen, SC, Rodgers, B & Broom, DH
2011, ‘The psychosocial quality of work determines whether employment has benefits for mental health: results from a longitudinal national household panel survey’, Journal of Occupational and Environmental Medicine, viewed June 2011, < http://press.psprings.co.uk/oem/march/oem59030.pdf>
Dockery, AM 2010, Education and happiness in the school-to-work transition, NCVER, Adelaide.
Fraillon, J 2004, Measuring student well-being in the context of Australian schooling: discussion paper, ACER, Melbourne, for the South Australian Department of Education and Children’s Services (DECS) and the Ministerial Council on Education, Employment, Training and Youth Affairs (MCEETYA), Melbourne.
Graetz, B 1992, ‘Health, consequences of employment and unemployment’, in Youth in the eighties: papers from Australian Longitudinal Surveys Research project, eds RG Gregory & T Karmel, Centre for Economic PolicyResearch,ANU,Canberra,pp.352–71.
Hamilton, M, Redmond, G & Muir, K 2010, Conceptualisation of social and emotional wellbeing for children and young people, and policy implications, Social Policy Research Centre, University of New South Wales, for the Australian Research Alliance for Children and Youth (ARACY) and Australian Institute of Health and Welfare (AIHW), Sydney.
Hillman, K & McMillan, J 2005, RR43: life satisfaction of young Australians: relationships between further education, training and general and career satisfaction, ACER, Melbourne.
Kessler,RC2003,‘Screeningforseriousmentalillnessinthegeneralpopulation’, Arch Gen Psychiatry, vol.60, pp.184–9, viewed June 2011, <http://www.archgenpsychiatry.com>.
Leach L, Butterworth, P, Rodgers, B & Strazdins, L 2010, ‘Deriving an evidence-based measure of job quality from the HILDA survey’, Australian Policy Journal, no.9, pp.67–86.
Muir, K, Mullan, K, Powell, A, Flaxman, S, Thompson, D & Griffiths, M 2009, The state of Australia’s young people: a report on the social, economic, health and family lives of young people, Social Policy Research Centre, University of New South Wales, Office for Youth, Canberra.
Noble, T, McGrath, H, Wyatt, T, Carbines, R & Robb, L 2008, Scoping study into approaches to student wellbeing, report to the Department of Education, Employment and Workplace Relations, Australian Catholic University and Erebus International, Canberra.
Stanwick, J, Ong, K & Karmel, T 2006, Vocational education and training, health and wellbeing: is there a relationship? NCVER, Adelaide.
Underwood, C 2007, BP13: hoops, hurdles and high-jumps: physical activity and bodyweight among 17 year olds, ACER, Melbourne.
Wilkins, R, Warren, D, Hahn, M & Houng, B 2011, Families, income and jobs volume 6: a statistical report on waves 1 to 8 of the Household, Income and Labour Dynamics in Australian survey, Melbourne Institute of Applied Economic and Social Research, University of Melbourne, Melbourne.
National Centre for Vocational Education Research Ltd Level 11, 33 King William Street, Adelaide, South Australia M PO Box 8288, Station Arcade, SA 5000 Australia T +61 8 8230 8400 F +61 8 8212 3436 W www.ncver.edu.au E [email protected]
© Commonwealth of Australia, 2011
With the exception of the Commonwealth Coat of Arms, the Department’s logo, any material protected by a trade mark and where otherwise noted all material presented in this document is provided under a Creative Commons Attribution 3.0 Australia <http://creativecommons.org/licenses/by/3.0/au> licence.
The details of the relevant licence conditions are available on the Creative Commons website (accessible using the links provided) as is the full legal code for the CC BY 3.0 AU licence <http://creativecommons.org/licenses/by/3.0/legalcode>.
The Creative Commons licence conditions do not apply to all logos, graphic design, artwork and photographs. Requests and enquiries concerning other reproduction and rights should be directed to the National Centre for Vocational Education Research (NCVER).
LSAY Briefing Papers is a series produced by the National Centre for Vocational Education Research (NCVER) drawing on data from the
Longitudinal Surveys of Australian Youth (LSAY). The aims of the series are to bring summaries of findings from LSAY research to a wider
audience and to examine particular topics in brief. Further information about the LSAY program can be found at www.lsay.edu.au.
This document should be attributed as Nguyen, N 2011, Trends in young people’s wellbeing and the effects of the school-to-work transition, NCVER.
This work has been produced by NCVER through the Longitudinal Surveys of Australian Youth (LSAY) Program, on behalf of the Australian Government and state and territory governments, with funding provided through the Australian Department of Education, Employment and Workplace Relations.
The views and opinions expressed in this document are those of the authors and do not necessarily reflect the views of the Australian Government or state and territory governments.
ISBN 978 1 921955 57 0 web edition 978 1 921955 58 7 print edition TD/TNC 105.01
Published by NCVER, ABN 87 007 967 311 <www.ncver.edu.au>