Trends in Retirement Income and Retiree Medical Plans
33
Prepared by: Aon Consulting 111 Market Place Baltimore, MD 21202 www.aon.com Trends in Retirement Income and Retiree Medical Plans
Transcript of Trends in Retirement Income and Retiree Medical Plans
Prepared by: Aon Consulting
111 Market Place Baltimore, MD 21202
www.aon.com
Trends in Retirement Income and Retiree Medical Plans
What’s inside
1 Introduction
2 Defined Benefit Trends
5 Defined Contribution Plan Trends
7 Rationale Behind the Trends
9 Retiree Health Trends
11 Key Changes in Retiree Health Coverage
14 Appendix 1: DB Design Trends
16 Appendix 2: DC Design Trends
17 Appendix 3: Charts and Figures
29 Appendix 4: Recent Articles on DB Trends
30 Appendix 3: Recent Articles on Retiree Medical Trends
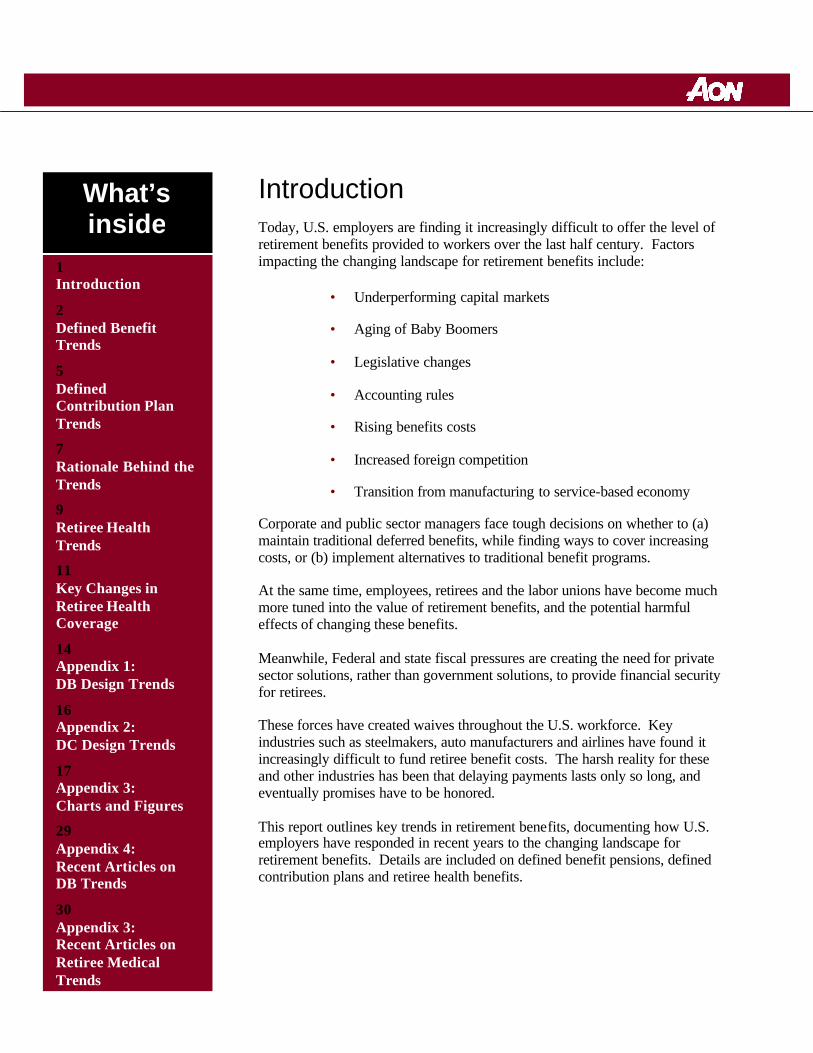
Introduction Today, U.S. employers are finding it increasingly difficult to offer the level of retirement benefits provided to workers over the last half century. Factors impacting the changing landscape for retirement benefits include:
• Underperforming capital markets
• Aging of Baby Boomers
• Legislative changes
• Accounting rules
• Rising benefits costs
• Increased foreign competition
• Transition from manufacturing to service-based economy
Corporate and public sector managers face tough decisions on whether to (a) maintain traditional deferred benefits, while finding ways to cover increasing costs, or (b) implement alternatives to traditional benefit programs. At the same time, employees, retirees and the labor unions have become much more tuned into the value of retirement benefits, and the potential harmful effects of changing these benefits. Meanwhile, Federal and state fiscal pressures are creating the need for private sector solutions, rather than government solutions, to provide financial security for retirees. These forces have created waives throughout the U.S. workforce. Key industries such as steelmakers, auto manufacturers and airlines have found it increasingly difficult to fund retiree benefit costs. The harsh reality for these and other industries has been that delaying payments lasts only so long, and eventually promises have to be honored. This report outlines key trends in retirement benefits, documenting how U.S. employers have responded in recent years to the changing landscape for retirement benefits. Details are included on defined benefit pensions, defined contribution plans and retiree health benefits.
2 Trends in Retirement Income and Retiree Medical Plans November 2005
Defined Benefit Plan Trends Defined benefit (DB) plans are plans that provide a predetermined benefit at retirement. Traditional defined benefit plans are generally characterized by:
• Providing a set monthly income for the retiree.
• The monthly income is usually based on the employee’s compensation and service.
• The employer bears the investment risk.
• The employer bears the longevity risk.
• Employees typically earn the majority of their benefits later in their careers.
DB plans, once the preferred type of pension plan in the U.S. when the Employee Retirement Income Security Act of 1974 (ERISA) was enacted, have decreased in number over recent years.i
However, many large employers still maintain DB plans, generally in conjunction with 401(k) or other types of defined contribution (DC) plans. Others have opted to maintain only a 401(k) or other DC plan for participants.
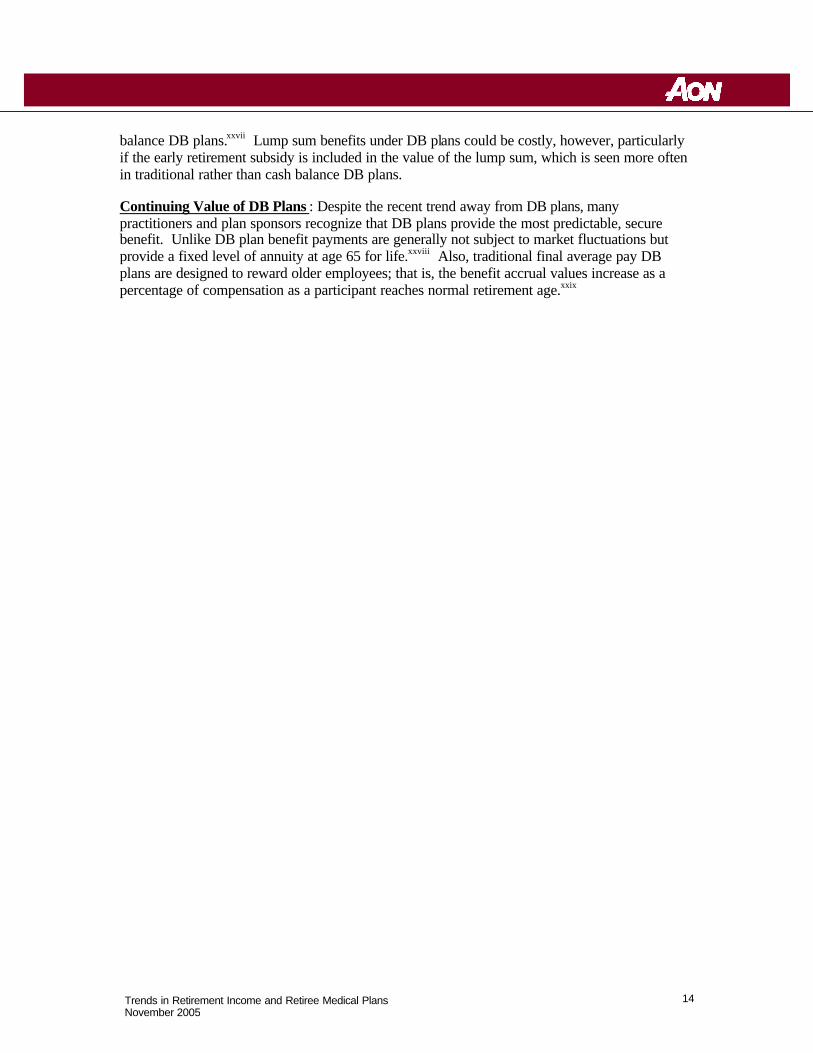
According to the Pension Benefit Guaranty Corporation (PBGC), a federal government corporation responsible for insuring DB plan benefits, the number of private sector DB plans reached an all-time high of 112,000 in the mid-1980s.ii At that time, about one-third of U.S. employees were covered by DB plans. However, the number of active workers covered by a DB plan in the private sector declined from 22 million in 1985 to 17 million currently. Figure 1, in Appendix 3, shows the trends of DB plans covered by the PBGC over the last 25 years.
In recent years many employers (particularly small and mid-sized) have opted not to adopt DB plans, to terminate their existing DB plans, or to freeze their plans (i.e. stop future benefit accruals for some or all participants while continuing to administer and fund the plan for existing benefits). From 1986-2004, 101,000 single -employer plans with about 7.5 million participants terminated. Approximately 99,000 of those plans had enough assets to cover pension liabilities to current employees and retirees. The remaining 2,000 shifted their liabilities to the PBGC.iii However, the larger employers in the oldest, most mature industries still maintain DB plans and make up the roughly 30,000 DB plans that currently exist.iv
A very recent trend is DB plan freezes. According to an Aon Consulting survey of more than 1,000 private sector DB plan sponsors, as of the fall of 2003, more than 20% of their DB plans were frozen or a freeze was actively being considered.v The most commonly cited reasons for the plan freezes were the amount and volatility of defined benefit plan contributions, followed closely by the impact of defined benefit plans on corporate expense, and general business conditions.
3 Trends in Retirement Income and Retiree Medical Plans November 2005
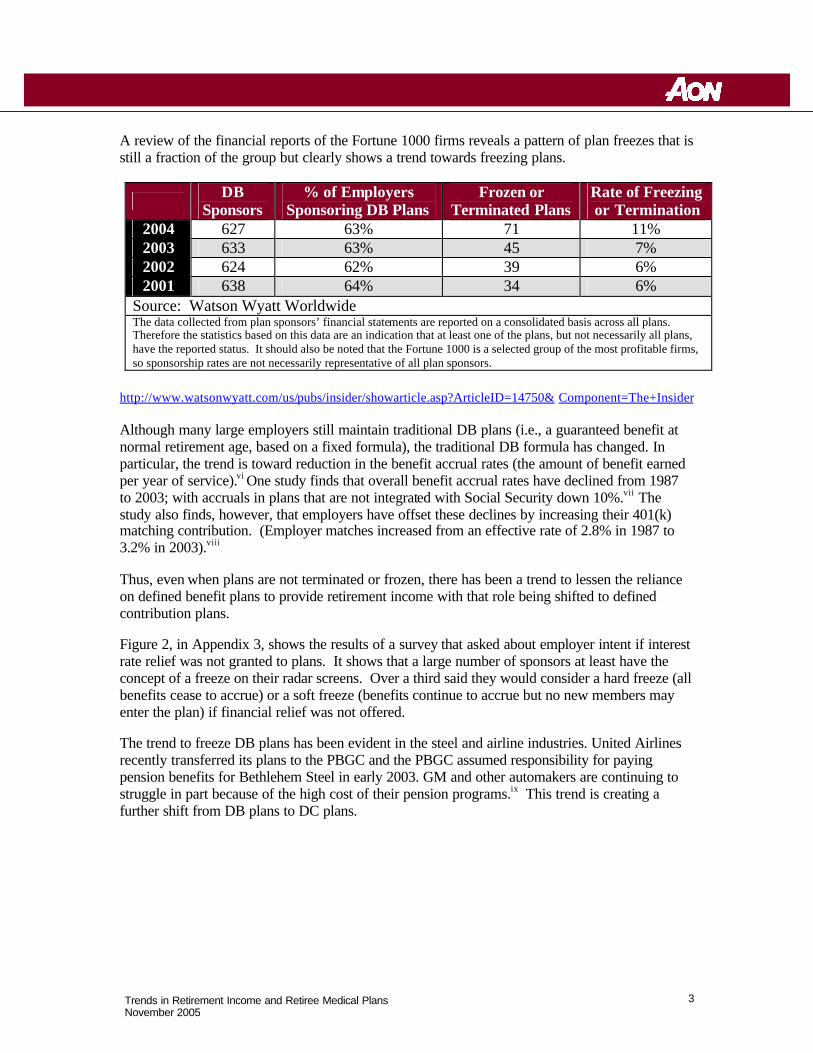
A review of the financial reports of the Fortune 1000 firms reveals a pattern of plan freezes that is still a fraction of the group but clearly shows a trend towards freezing plans.
DB Sponsors
% of Employers Sponsoring DB Plans
Frozen or Terminated Plans
Rate of Freezing or Termination
2004 627 63% 71 11% 2003 633 63% 45 7% 2002 624 62% 39 6% 2001 638 64% 34 6%
Source: Watson Wyatt Worldwide The data collected from plan sponsors’ financial statements are reported on a consolidated basis across all plans. Therefore the statistics based on this data are an indication that at least one of the plans, but not necessarily all plans, have the reported status. It should also be noted that the Fortune 1000 is a selected group of the most profitable firms, so sponsorship rates are not necessarily representative of all plan sponsors.
http://www.watsonwyatt.com/us/pubs/insider/showarticle.asp?ArticleID=14750& Component=The+Insider Although many large employers still maintain traditional DB plans (i.e., a guaranteed benefit at normal retirement age, based on a fixed formula), the traditional DB formula has changed. In particular, the trend is toward reduction in the benefit accrual rates (the amount of benefit earned per year of service).vi One study finds that overall benefit accrual rates have declined from 1987 to 2003; with accruals in plans that are not integrated with Social Security down 10%.vii The study also finds, however, that employers have offset these declines by increasing their 401(k) matching contribution. (Employer matches increased from an effective rate of 2.8% in 1987 to 3.2% in 2003).viii
Thus, even when plans are not terminated or frozen, there has been a trend to lessen the reliance on defined benefit plans to provide retirement income with that role being shifted to defined contribution plans.
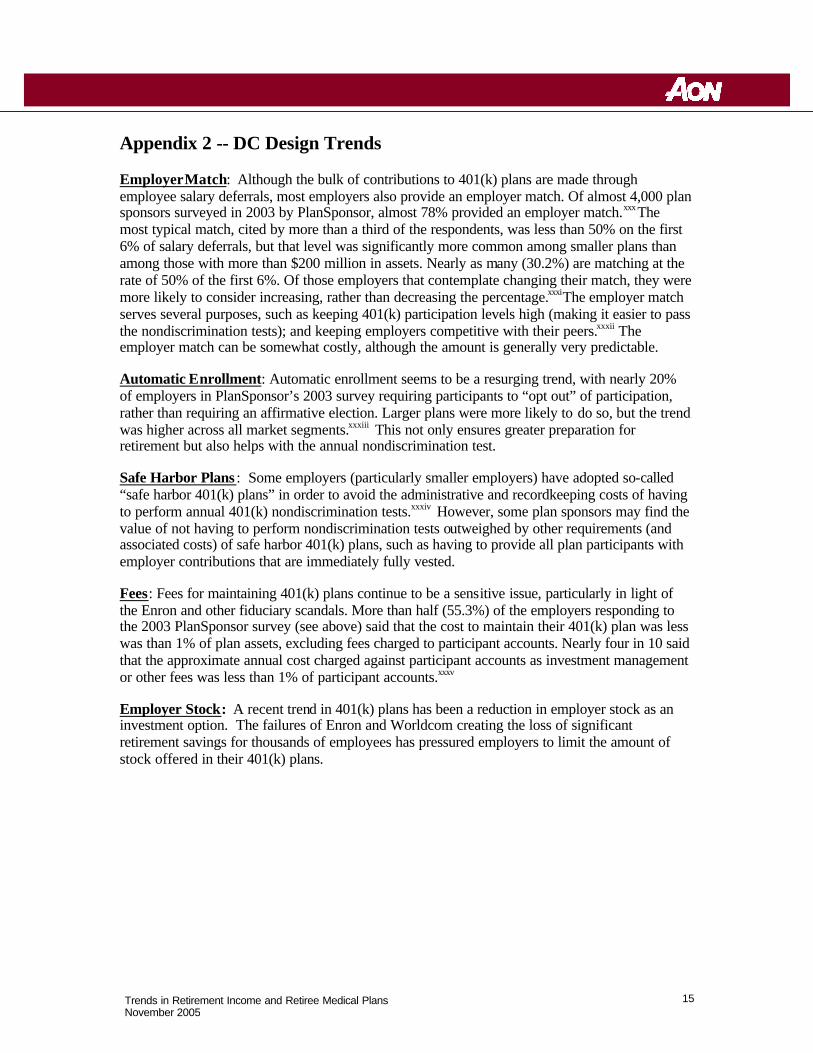
Figure 2, in Appendix 3, shows the results of a survey that asked about employer intent if interest rate relief was not granted to plans. It shows that a large number of sponsors at least have the concept of a freeze on their radar screens. Over a third said they would consider a hard freeze (all benefits cease to accrue) or a soft freeze (benefits continue to accrue but no new members may enter the plan) if financial relief was not offered.
The trend to freeze DB plans has been evident in the steel and airline industries. United Airlines recently transferred its plans to the PBGC and the PBGC assumed responsibility for paying pension benefits for Bethlehem Steel in early 2003. GM and other automakers are continuing to struggle in part because of the high cost of their pension programs.ix This trend is creating a further shift from DB plans to DC plans.
4 Trends in Retirement Income and Retiree Medical Plans November 2005
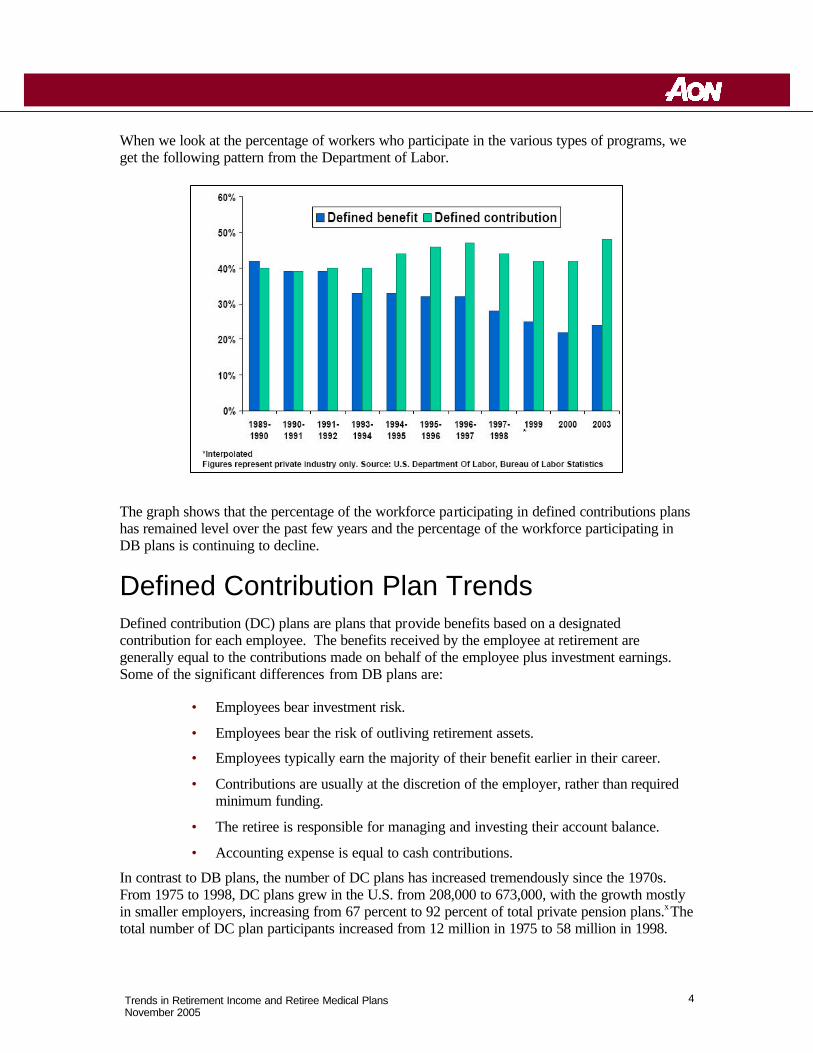
When we look at the percentage of workers who participate in the various types of programs, we get the following pattern from the Department of Labor.
The graph shows that the percentage of the workforce participating in defined contributions plans has remained level over the past few years and the percentage of the workforce participating in DB plans is continuing to decline.
Defined Contribution Plan Trends Defined contribution (DC) plans are plans that provide benefits based on a designated contribution for each employee. The benefits received by the employee at retirement are generally equal to the contributions made on behalf of the employee plus investment earnings. Some of the significant differences from DB plans are:
• Employees bear investment risk.
• Employees bear the risk of outliving retirement assets.
• Employees typically earn the majority of their benefit earlier in their career.
• Contributions are usually at the discretion of the employer, rather than required minimum funding.
• The retiree is responsible for managing and investing their account balance.
• Accounting expense is equal to cash contributions.
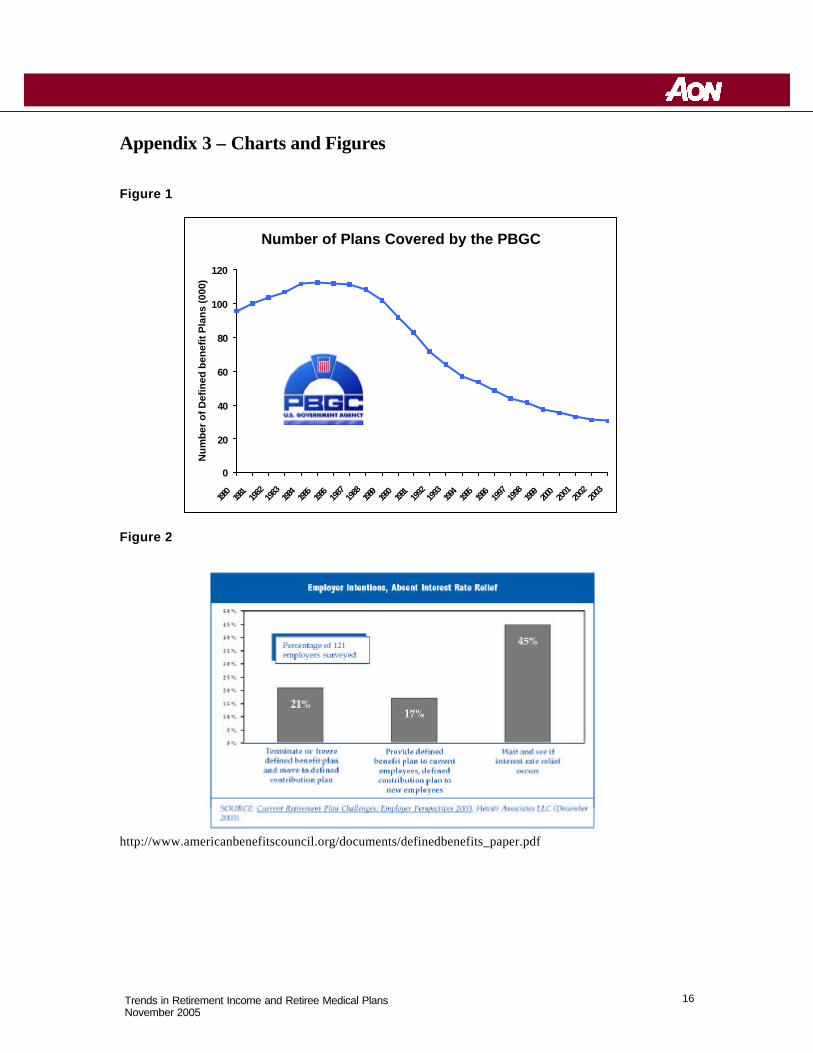
In contrast to DB plans, the number of DC plans has increased tremendously since the 1970s. From 1975 to 1998, DC plans grew in the U.S. from 208,000 to 673,000, with the growth mostly in smaller employers, increasing from 67 percent to 92 percent of total private pension plans.x The total number of DC plan participants increased from 12 million in 1975 to 58 million in 1998.
5 Trends in Retirement Income and Retiree Medical Plans November 2005
The growth in one particular type of DC plan –the 401(k) plan –has been remarkable. In 1978, Section 401(k) was added to the Internal Revenue Code, allowing an expanded opportunity for before-tax savings by employees (through sala ry deferrals) for employees of for profit companies (later extended to not-for-profits.) The 401(k) plan expanded rapidly after regulations for 401(k) plans were published by the IRS in 1981. In 1984, there were slightly in excess of 17,000 401(k) plans, with 7.5 million participants; in 1998, there were more than 300,000 401(k) plans with more than 37 million participants (making up 51 percent of all private retirement plans and 74 percent of all private DC plans.)xi
Figure 3, in Appendix 3, based on Department of Labor statistics (through the end of 1999, extrapolated by Aon Consulting through 2003), shows the steady increase in the number of DC plans over the last 25 years.
What has caused the tremendous growth in the number of 401(k) plans in recent years? Some of the answers include the following:
• Employees change jobs more frequently than in the past. The Department of Labor found that in 1999, the average U.S. employee held nine jobs by the age of 32.xii As a result, many of these employees wanted portable retirement accounts, such as those offered by 401(k) plans. Traditional DB plan benefit accruals become more valuable as a participant approaches normal retirement, and usually pay benefits in the form of an annuity or in installments. In contrast, DC plans are less “age-sensitive,” and pay out benefits (often in the form of lump sums) at job termination, rather than requiring an employee to wait until retirement age for payout.
• Many attribute the tremendous growth of 401(k) plans to aggressive marketing by service providers and others.xiii
• 401(k) plans do not have minimum funding obligations (aside from having to pay an employer match, if any) and, therefore, have a more predictable contribution pattern.
• Accounting for DC plans is much simpler, with expense equal to contributions. DB plans require a special valuation recognizing current interest rates and market value of assets, leading to considerable volatility.
• An employer with an underfunded plan may have to recognize a liability for the underfunding on its balance sheet.
• DB plans tend to be more administratively complex, due to paying benefits in the form of annuities rather than lump sums.
• DB plans must pay PBGC premiums. These premiums also vary with asset values and interest rates.
• Virtually all expenses of DC plans may be paid from plan assets. Many of the expenses associated with DB plans, e.g. FAS expense and disclosures, must be paid by the plan sponsor.
• Easier to understand by employees and easier to communicate to employees.
6 Trends in Retirement Income and Retiree Medical Plans November 2005
• Some plans have no employer contributions, just employee deferrals.
Value of 401(k) Plans: Employers may find some unique advantages to 401(k) plans versus DB plans.
• The cost obligations for 401(k) plans are more predictable than for DB plans.
• The annual charge against operating earnings is equal to the contribution.
• There cannot be any underfunding in an account balance plan, so no balance sheet liability can be required.
• It is also much easier to terminate a 401(k) plan than a DB plan.
On the other hand, there are some drawbacks to 401(k) plans.
• Most 401(k) plans have to perform annual nondiscrimination tests. Failing test usually means refunds and restrictions for highly compensated employees.
• There is a danger of participants outliving accumulated assets. One-half of all participants will outlive their life expectancy.
• Participants’ may fail to invest account balance assets wisely, resulting in inadequate benefits.xiv Participants may limit the value of their benefits by investing too conservatively or run the risk of losing benefits during depressed market periods.
• 401(k) plan sponsors are under heightened fiduciary scrutiny after the Enron and other debacles involving employer bankruptcies and poorly run 401(k) plans.
• Highly compensated employees can be significantly limited in DC plans.
Rationale Behind the Trends In recent years, DB plans are being supplemented with, or supplanted by, DC plans.xv When ERISA was enacted, approximately 29% of total private qualified plan assets were held in DC plans; now more than 50% of such assets are held in DC plans.xvi Appendix 4 shows a list of recent articles describing the trend of employers shifting from defined benefit to defined contribution plans.
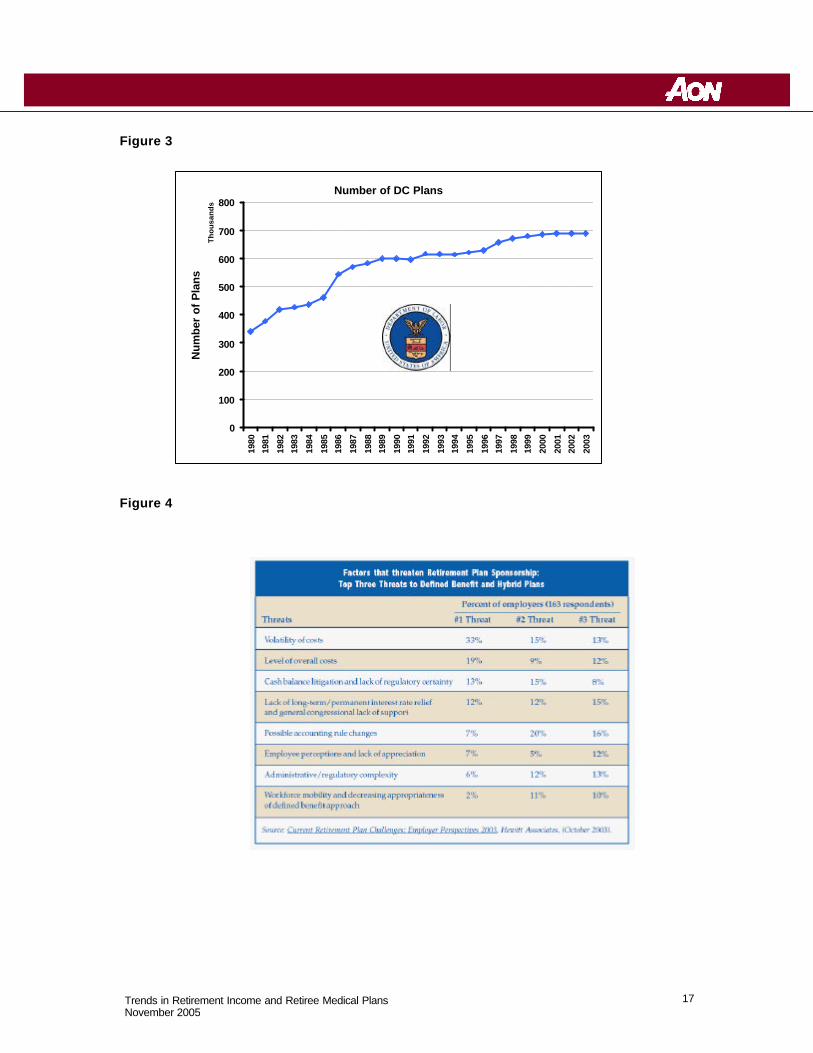
Figure 4, in Appendix 3, shows that the three most identified threats of DB plans for employers were all cost related: volatility, accounting changes and overall costs. The top threat is volatility of cost. Employers’ biggest problem with DB plans is that the cash and accounting costs are difficult to predict. The remaining major threats to DB plans include underfunding in plan, recruitment considerations, administration cost of plans, and complicated legislation.
Underfunding: A very recent trend is severe underfunding of DB plans, due, in large part, to an extended bear market and low interest rates. Pension Benefit Guaranty Corporation (PBGC) Executive Director Bradley Belt told the Senate Finance Committee on June 1, 2005 that large single-employer DB plans were underfunded by more than $354 billion in total based on 2004
7 Trends in Retirement Income and Retiree Medical Plans November 2005
filings. As of September 30, 2004 the PBGC estimated that the total shortfall in all insured pension plans exceeded $450 billion, the largest amount on record. As recently as December 31, 2000, total underfunding in such plans was less than $50 billion.xvii
The recent underfunding in pension plans has created significant increases in cash requirements and expense recognition for companies that sponsor DB plans. In addition to the increase in expense on companies' income statements, the underfunding in pension plans has also created significant increases in liabilities on companies' balance sheets and correlating decreases in owner's equity or retained earnings.
Recruitment: A question that has long been debated in benefit circles is whether retirement benefits are a factor in recruiting employees. It is generally felt younger employees prefer cash. This could be in the form of compensation or in contributions to an account balance in a DC plan.
The answer is not as clear for mid-career hires. Traditional wisdom is that they prefer DB plans, since the latter part of their career is when they accrue the most value. However, as fewer employers offer ongoing DB plans, the number of employees accruing DB benefits is decreasing. Thus, individuals would not have any sense of loss in moving to a company not providing them with a DB benefit. For those to whom this is important, the issue could be addressed by possibly providing additional cash compensation.
Administration Costs : Administration for 401(k) plans has generally be less than DB plans due mainly to a shift in expenses from the employer to the employee and changes in legislation for DB plans. The investment broker for the 401(k) plan offers the plan "cheap" recordkeeping fees in exchange for investment fees on plan assets. The recordkeeping fees and investment fees are paid from the assets of the plan. Because the employees bear the investment risk under a 401(k) plan, they are paying for recordkeeping and investment fees instead of the employer. Legislation: As DB plans started to grow in the post World War II era, legislation of the plans has continued to increase. The recent legislation that has affected pension plans include the Americans Jobs Creation Act of 2004, Pension Funding Equity Act of 2004, Job Creation and Workers’ Assistance Act of 2002, the Economic Growth and Tax Relief Reconciliation Act of 2001, and the Tax Relief Act of 1997. The current legislations are extremely complex and continue to increase the administration cost of DB plans and the volatility of cash contributions. Recent changes in legislation that have increased the administration cost of pension plans include relative value regulations and retroactive annuity starting dates. Current pending legislation (S.1783) for DB plan funding will increase the volatility of pension costs and increase administrative costs through higher PBGC premiums.
8 Trends in Retirement Income and Retiree Medical Plans November 2005
Retiree Health Trends Retire health benefits provide a significant source of income protection for millions of American workers covered through employer-sponsored plans. Employers providing retiree medical coverage typically offer comprehensive coverage for early retirees as well as supplemental coverage for Medicare-eligible retirees. Coverage is generally tied to service and retirement age, with key characteristics being:
Plan Design Copays, deductibles and other cost-sharing arrangements
Premium Contributions Ongoing (e.g., monthly) cost of coverage
Eligibility Rules governing who can participate
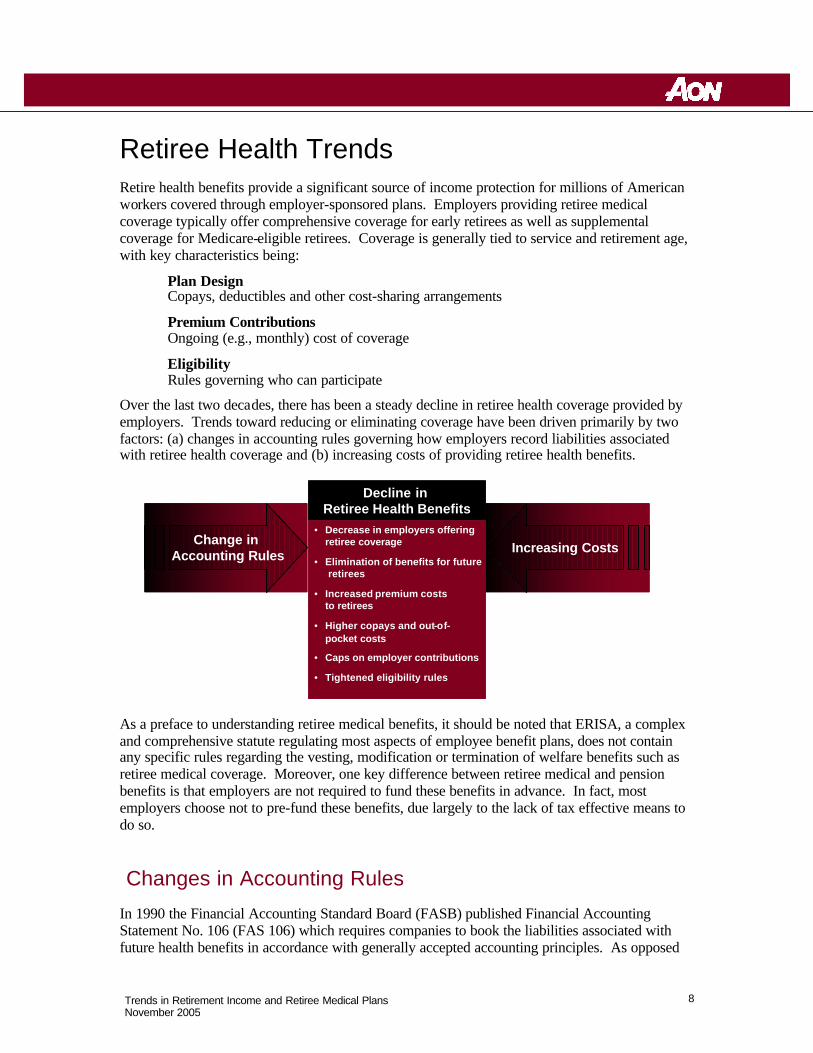
Over the last two decades, there has been a steady decline in retiree health coverage provided by employers. Trends toward reducing or eliminating coverage have been driven primarily by two factors: (a) changes in accounting rules governing how employers record liabilities associated with retiree health coverage and (b) increasing costs of providing retiree health benefits.
As a preface to understanding retiree medical benefits, it should be noted that ERISA, a complex and comprehensive statute regulating most aspects of employee benefit plans, does not contain any specific rules regarding the vesting, modification or termination of welfare benefits such as retiree medical coverage. Moreover, one key difference between retiree medical and pension benefits is that employers are not required to fund these benefits in advance. In fact, most employers choose not to pre-fund these benefits, due largely to the lack of tax effective means to do so.
Changes in Accounting Rules
In 1990 the Financial Accounting Standard Board (FASB) published Financial Accounting Statement No. 106 (FAS 106) which requires companies to book the liabilities associated with future health benefits in accordance with generally accepted accounting principles. As opposed
Change in Accounting Rules Increasing Costs
Decline in Retiree Health Benefits
• Decrease in employers offeringretiree coverage
• Elimination of benefits for futureretirees
• Increased premium costs to retirees
• Higher copays and out-of-pocket costs
• Caps on employer contributions
• Tightened eligibility rules
9 Trends in Retirement Income and Retiree Medical Plans November 2005
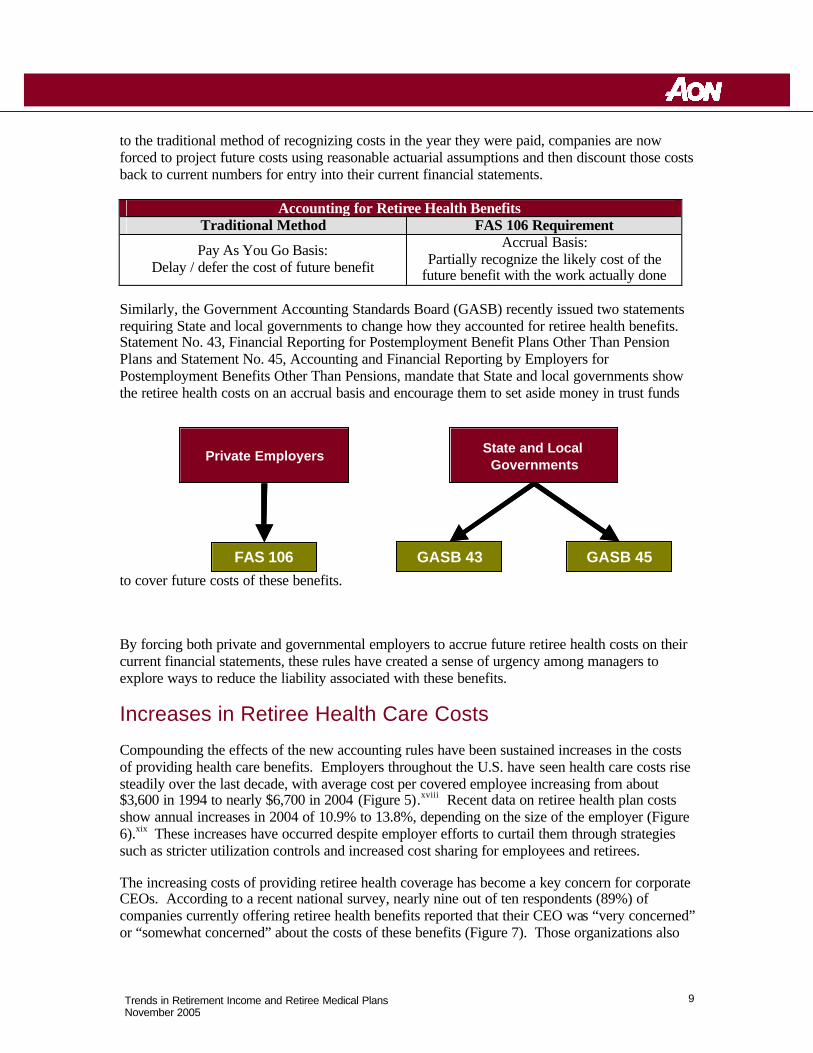
to the traditional method of recognizing costs in the year they were paid, companies are now forced to project future costs using reasonable actuarial assumptions and then discount those costs back to current numbers for entry into their current financial statements.
Accounting for Retiree Health Benefits Traditional Method FAS 106 Requirement
Pay As You Go Basis: Delay / defer the cost of future benefit
Accrual Basis: Partially recognize the likely cost of the
future benefit with the work actually done
Similarly, the Government Accounting Standards Board (GASB) recently issued two statements requiring State and local governments to change how they accounted for retiree health benefits. Statement No. 43, Financial Reporting for Postemployment Benefit Plans Other Than Pension Plans and Statement No. 45, Accounting and Financial Reporting by Employers for Postemployment Benefits Other Than Pensions, mandate that State and local governments show the retiree health costs on an accrual basis and encourage them to set aside money in trust funds
to cover future costs of these benefits.
By forcing both private and governmental employers to accrue future retiree health costs on their current financial statements, these rules have created a sense of urgency among managers to explore ways to reduce the liability associated with these benefits.
Increases in Retiree Health Care Costs
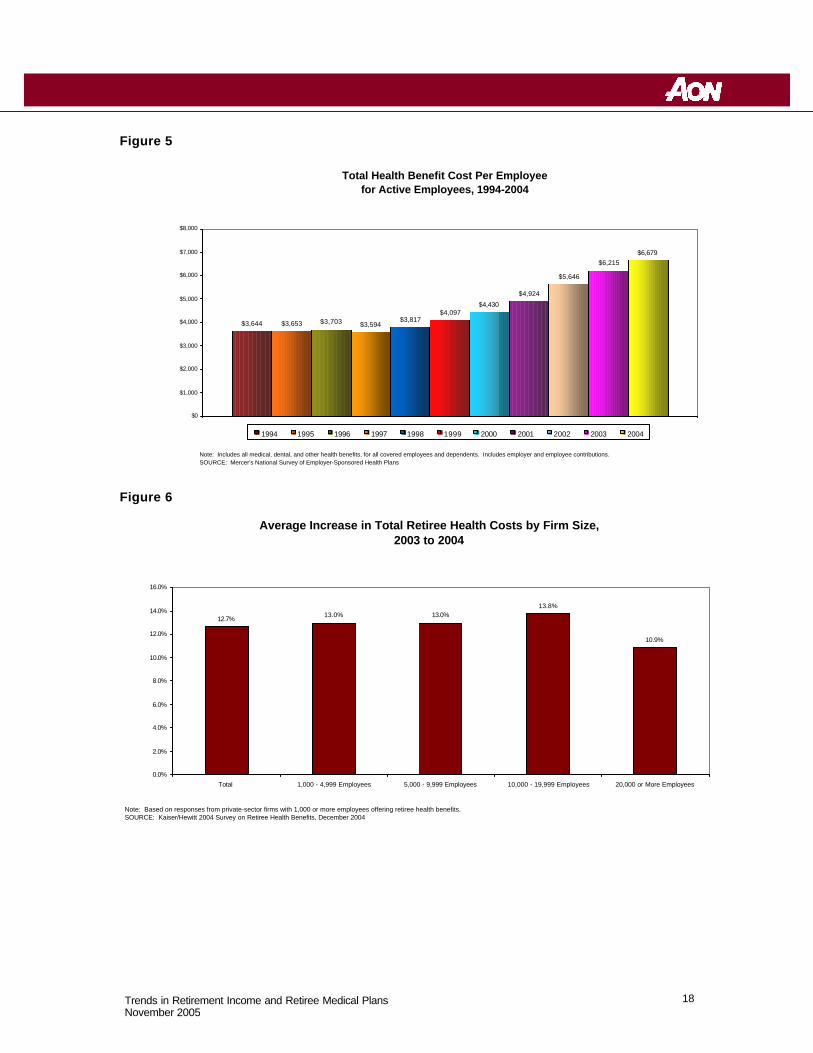
Compounding the effects of the new accounting rules have been sustained increases in the costs of providing health care benefits. Employers throughout the U.S. have seen health care costs rise steadily over the last decade, with average cost per covered employee increasing from about $3,600 in 1994 to nearly $6,700 in 2004 (Figure 5).xviii Recent data on retiree health plan costs show annual increases in 2004 of 10.9% to 13.8%, depending on the size of the employer (Figure 6).xix These increases have occurred despite employer efforts to curtail them through strategies such as stricter utilization controls and increased cost sharing for employees and retirees.
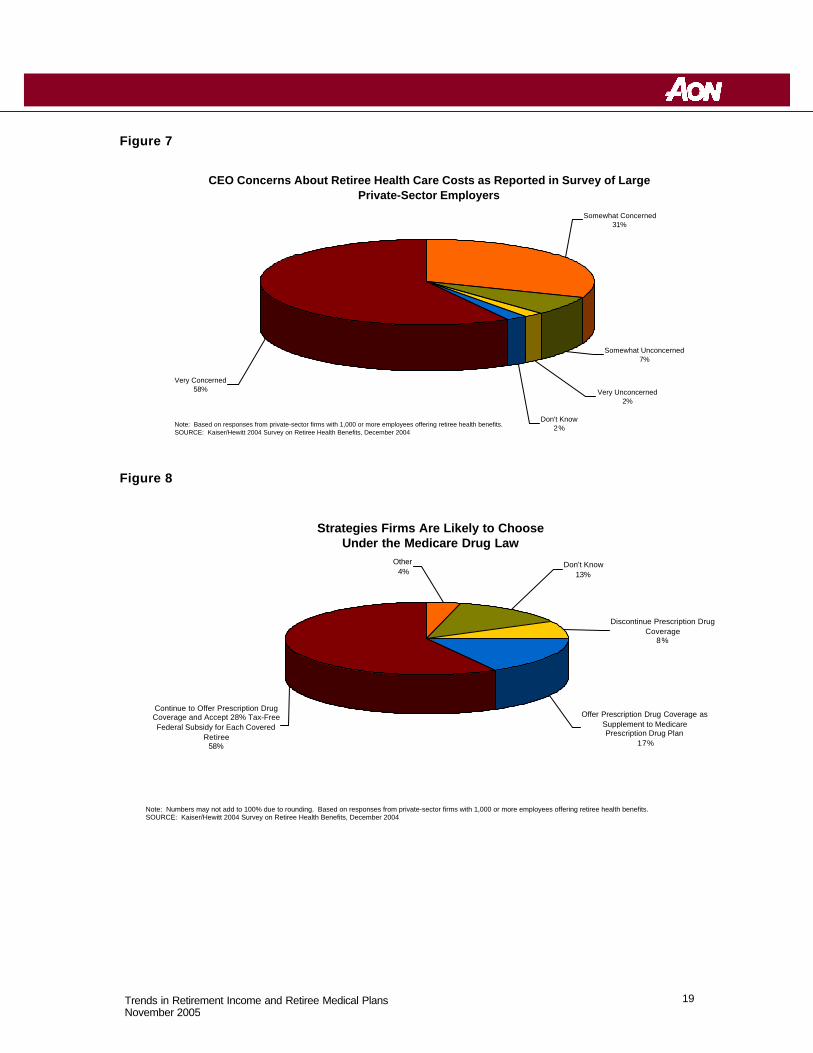
The increasing costs of providing retiree health coverage has become a key concern for corporate CEOs. According to a recent national survey, nearly nine out of ten respondents (89%) of companies currently offering retiree health benefits reported that their CEO was “very concerned” or “somewhat concerned” about the costs of these benefits (Figure 7). Those organizations also
Private Employers State and Local Governments
FAS 106 GASB 43 GASB 45
Private Employers State and Local Governments
FAS 106 GASB 43 GASB 45
10 Trends in Retirement Income and Retiree Medical Plans November 2005
reported that retiree health costs consumed over a quarter (29%) of their total health care costs, including active employee, dependents and retirees xx.
Medicare Modernization Act of 2003 One piece of good news for employers concerned about the costs of providing retiree health coverage has been the Medicare Modernization Act of 2003 (MMA). The legislation adds a prescription drug benefit to Medicare, beginning in 2006, known as Medicare Part D. MMA provides financial incentives for employers who provide prescription drug coverage to Medicare-eligible retirees and dependents that is actuarially equivalent to (i.e., at least as good as) the new Medicare drug benefit. Employers who meet the actuarial equivalence test may apply to receive a tax-free subsidy of 28% of a covered retiree’s incurred drug claims (net of administrative costs, rebates and other discounts) between $250 and $5,000xxi. In addition to the subsidy option, the legislation provides several other options for employers who prefer to supplement or enhance the Medicare Part D benefit available to their retirees.
Much attention has been focused on how employers will respond to the new legislation, particularly on how it may lead to further erosion in retiree health coverage. In a 2004 survey, over half (58%) of responding companies said they were likely to continue offering drug coverage to retirees and accept the 28% subsidy from the Federal Government (Figure 8). Seventeen percent (17%) said they would provide drug coverage that supplements the Medicare Part D coverage, while 8% said they would terminate drug coverage for retirees.xxii Recent anecdotal evidence suggests that a higher percentage of employers are taking the subsidy option in 2006.
Key Changes in Retiree Health Coverage The combination of accounting rule changes and sustained increases in health care costs has had significant impact on retiree health benefits provided by U.S. employers. Key trends have included:
• Decline in employers offering coverage to current retirees
• Elimination of benefits for future retirees
• Increased premium costs to retirees
• Decreased benefits including higher copays and out-of-pocket costs, caps on employer contributions and tightened eligibility rules
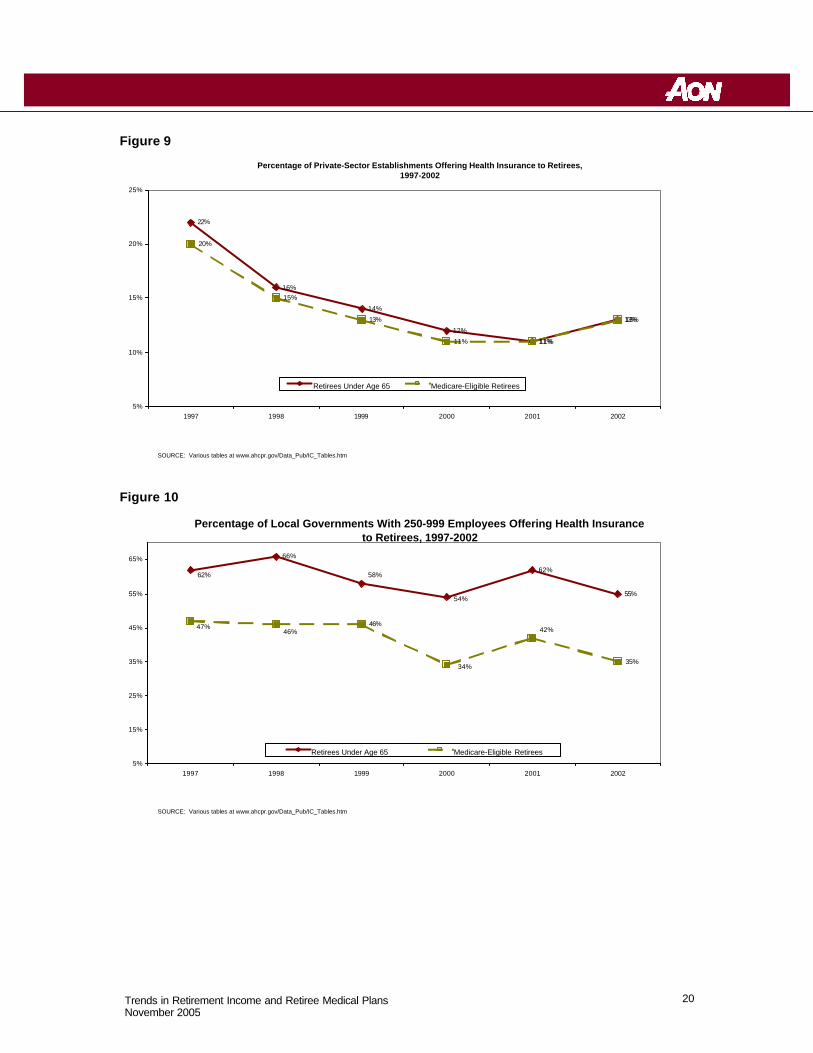
Decline in Employers Offering Coverage to Current Retirees The percentage of private-sector employers offering retiree health coverage has dropped considerably in recent years. According to the Agency for Healthcare Research and Quality (AHRQ), only 13% of private employers provided health benefits to retirees in 2002, down from 22% in 1997 (Figure 9). Local (i.e., city and county) governments are more likely to offer coverage than private employers, but here too the percentage offering coverage has declined since 1997. In particular, local governments are much less likely to offer coverage to Medicare-eligible
11 Trends in Retirement Income and Retiree Medical Plans November 2005
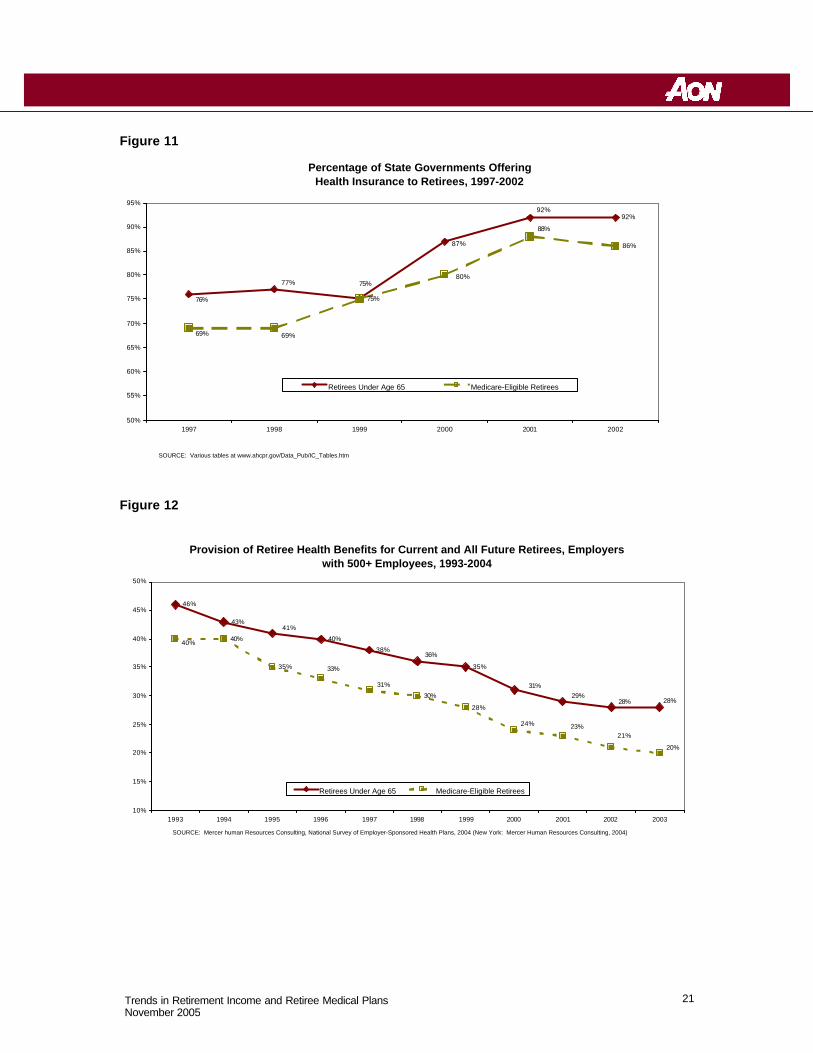
retirees than they were in prior years (Figure 10). One exception to the trend of not offering coverage can be seen on state governments. The percentage of state governments providing coverage to retirees has actually increased since 1997 (Figure 11).
Large employers have traditionally been more likely to offer retiree medical coverage than their smaller counterparts. However, coverage among larger groups had declined as well in recent years. Appendix 5 shows a list of recent articles discussing this trend. Within a given organization, early retirees (i.e., those under age 65, the age at which Medicare coverage begins) are generally more likely to have employer-sponsored medical coverage than those age 65 and over. This disparity in coverage is driven in part by a lack of affordable coverage options available to early retirees in the individual insurance market (the lack of which creates a need for employers to bridge the gap to age 65).
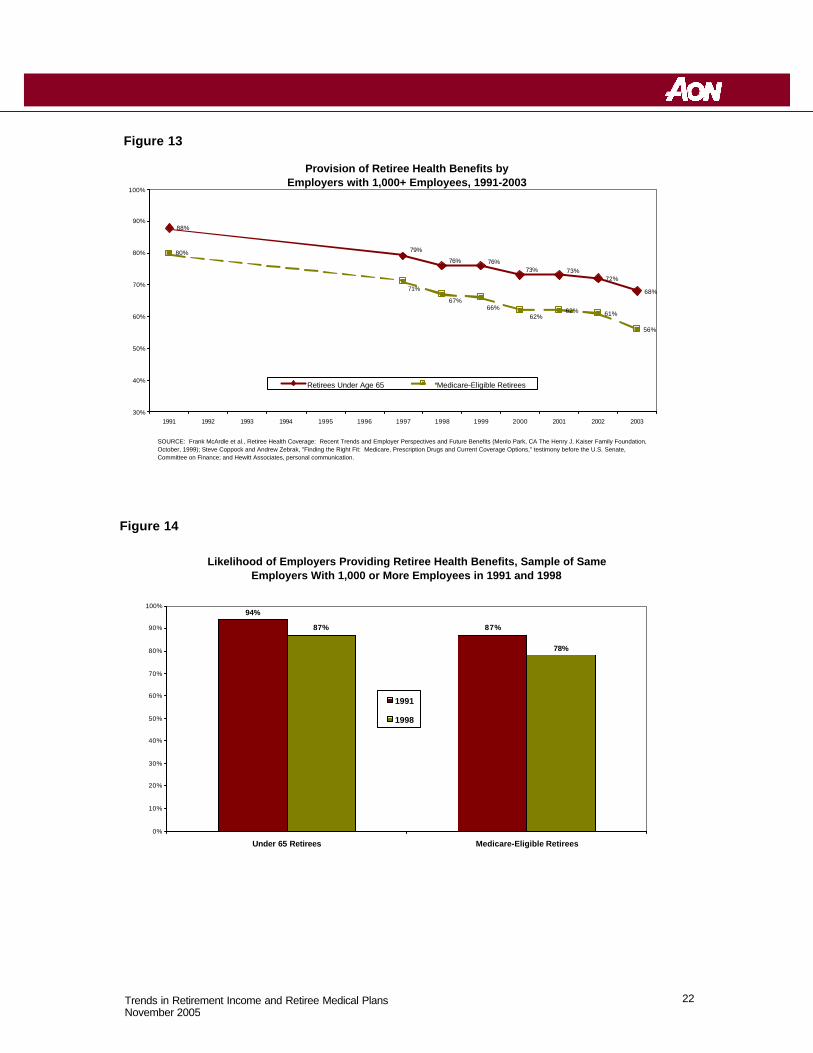
Decline in Employers Offering Coverage to Future Retirees The percentage of employers who anticipate providing coverage to future retirees has also declined in recent years. According to a 2004 national survey, only 28% of firms with 500+ employees expect to continue offering coverage to early retirees, down from 46% in 1993. The percentage expecting to offer coverage to Medicare-eligible retirees has dropped from 40% to 20% over that same time period (Figure 12). Similarly, a survey of employers with 1,000+ employees found that, in 2003, 68% of large employers expected to provide coverage to early retirees, compared to 88% in 1991. The percentage of Medicare-eligible retirees fell from 80% to 56% over that same time period (Figure 13). To some extent, the declines noted above can be attributed to new companies not offering coverage (i.e., the decline has been driven by more than just existing companies dropping coverage). One study has documented the drop in coverage among a constant group of employers tracked from 1991 to 1998. Over that time period, the percentage offering health coverage to early retirees dropped from 94% to 87% and the percentage offering coverage to Medicare-eligible retirees dropped from 87% to 78% (Figure 14).
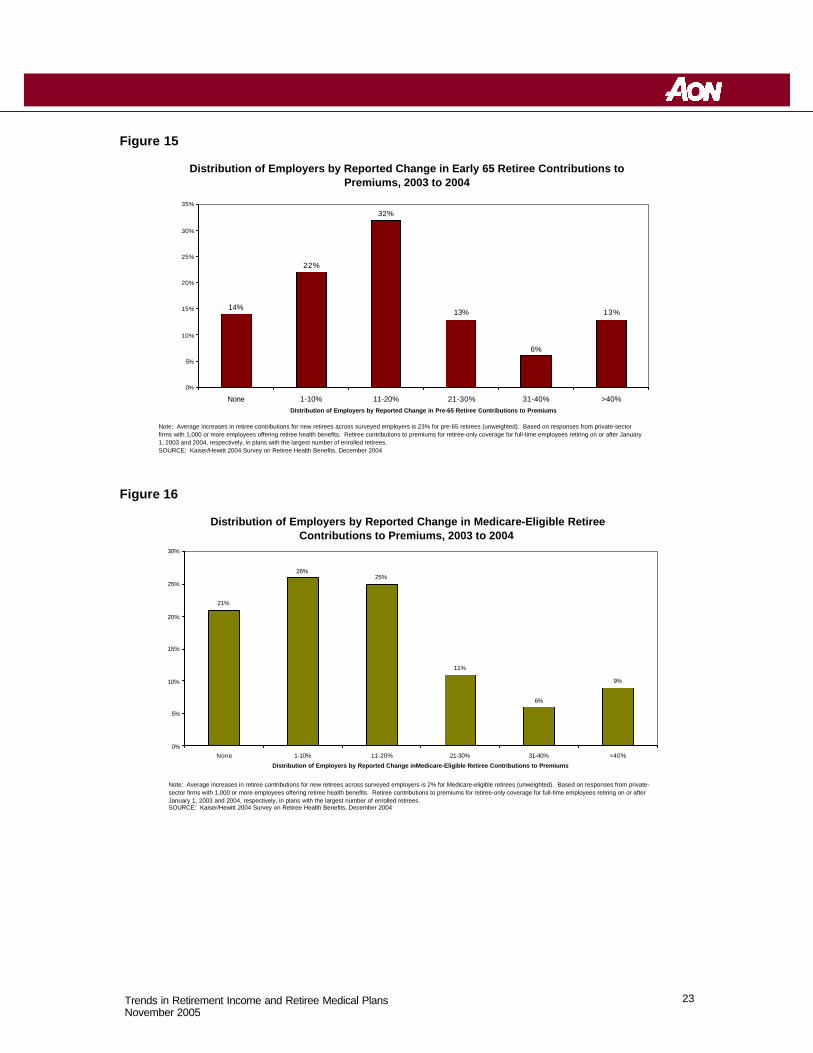
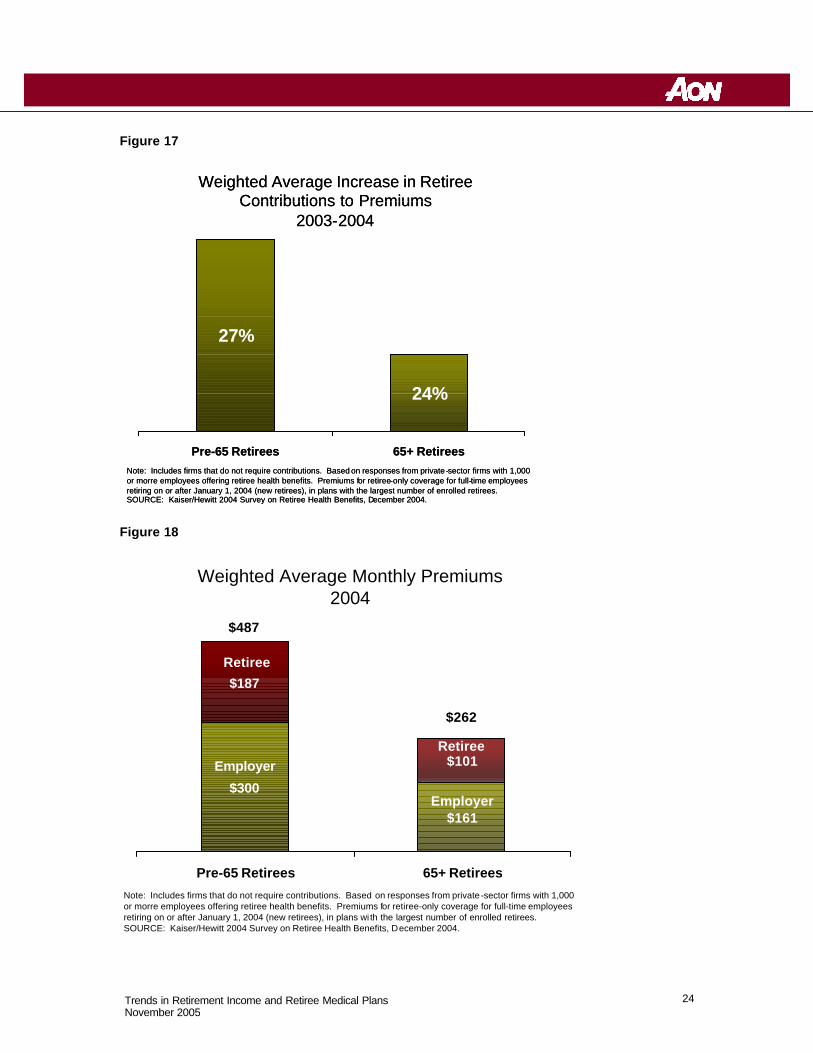
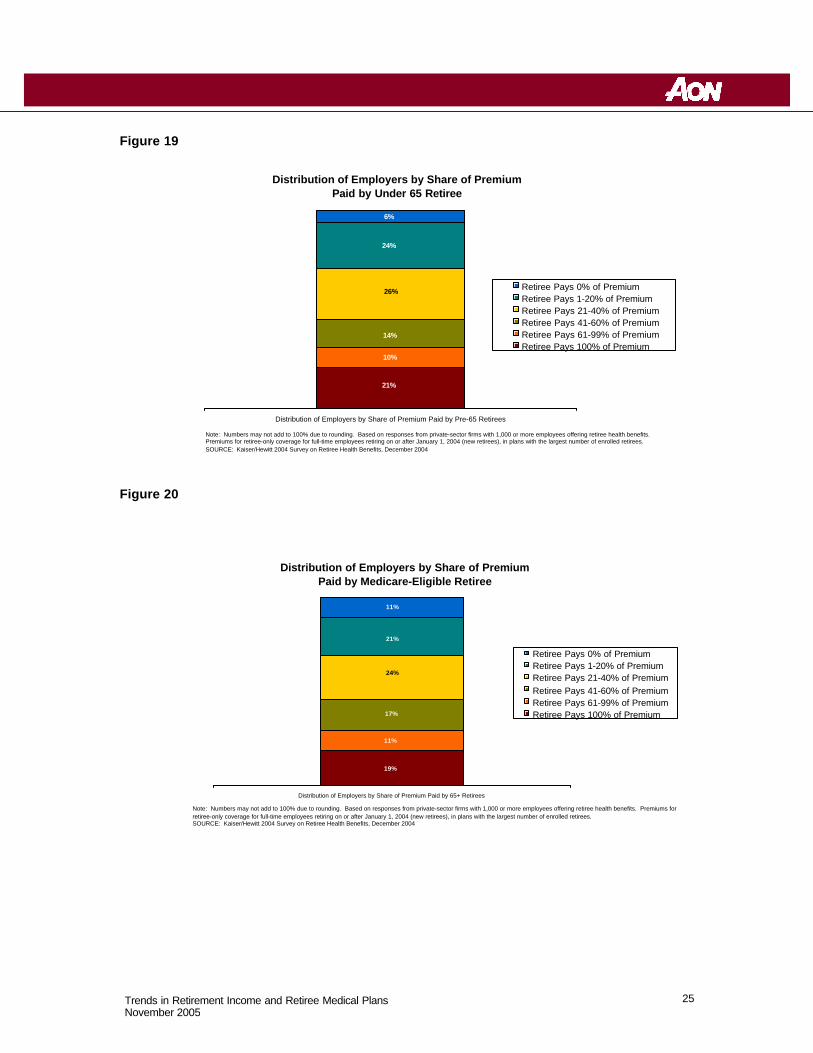
Increased Retiree Contributions Current retirees fortunate enough to have employer-sponsored health coverage have experienced significant increases what they pay for that coverage. According to a 2004 national survey, over 60% of responding employers increased health premiums for early retirees by more than 10% between 2003 and 2004 (Figure 15). Nearly one in five employers (19%) increased premiums for this group by more than 30%. On a weighted average basis, the average cost to early retirees jumped 27% between 2003 and 2004 (Figure 17). Premium costs to Medicare-eligible retirees increased by more than 10% for over half (51%) of he employers, with 15% increasing premiums by more than 30% (Figure 16). Overall, retirees currently pay about 38% of the total premium costs (with their former employers picking up the other 62%), as shown in Figure 18. Actual retiree / employer share of premium costs varies widely by employer, as shown in Figures 19 and 20.
12 Trends in Retirement Income and Retiree Medical Plans November 2005
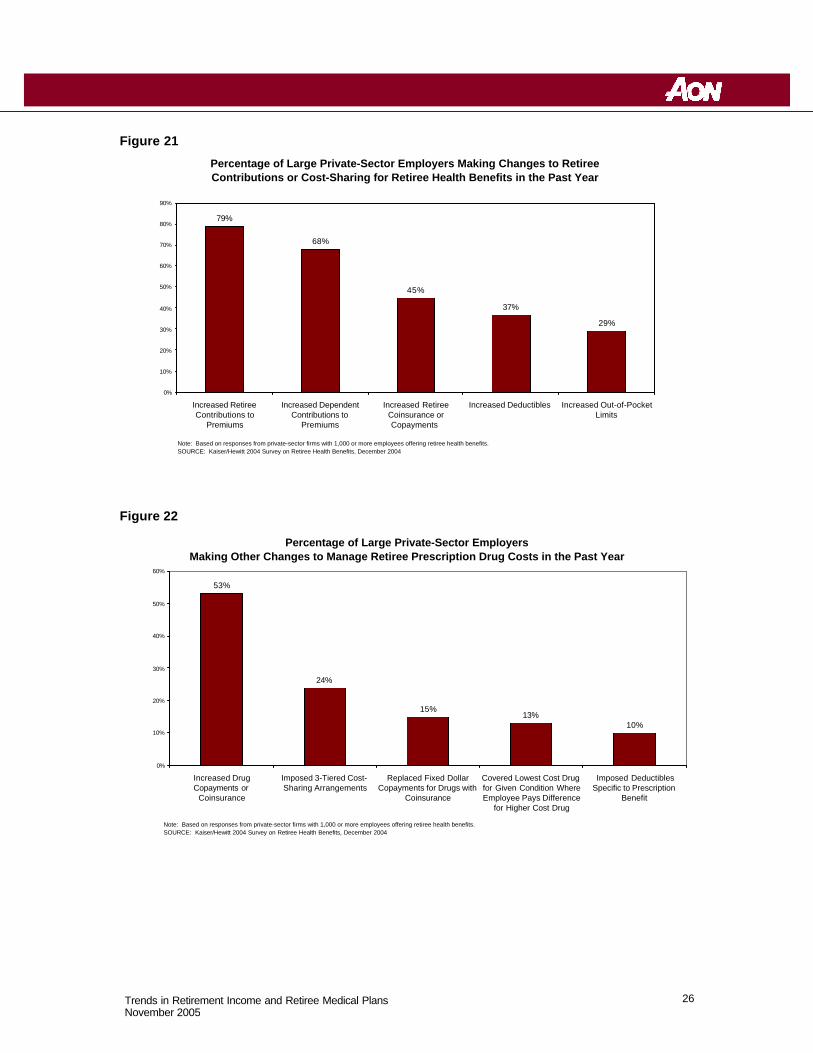
Increased Out-of-Pocket Costs In addition to requiring higher contributions, most employers who still offer retiree health coverage have increased out-of-pocket costs to retirees. According to a 2004 Kaiser Family Foundation survey, nearly half (45%) of large employers increased copays or coinsurance levels in 2004, over a third (37%) increased deductibles and more than one in four (29%) raised out-of-pocket limits (see Figure 21). Significant changes were also made by employers on pharmacy benefits, according to the Kaiser survey. Over half (53%) increase drug copays for drugs while nearly a quarter (24%) switched to a three-tiered copay structure that featured different copays for generic, formulary brand and non-formulary brand drugs (see Figure 22). Other changes enacted by employers in 2004, according to the Kaiser survey, included:
• Offering a Medicare Advantage / Medicare + Choice plan as an option, whereby the employer picks up most or all of the cost of a private HMO plan (10% of respondents);
• Imposing a cap on the employer’s contributions for group of retirees for which there currently was not a cap (7% of respondents);
• Shifting to a defined contribution approach, (e.g., one that allows employees to accumulate credits per year of service to offset the cost of medical coverage when they retire) (3% of respondents); and
• Offering a catastrophic plan with a high deductible (e.g., $1,500), combined with a health savings account (3% of respondents)
Looking Ahead As employers struggle with to need to manage retiree health costs, some key historical trends that are likely to continue are:
• Diminishing number of employers promising coverage to future retirees
• Increasing out of pocket costs for retirees (current and future) including higher copays, deductibles and out-of-pocket maximums
• More restrictive eligibility rules
• Increasing contributions for retiree or dependent coverage
• Introduction of caps or enforcement of existing caps on the employer’s contribution to coverage
• Introduction of account-based plans, such as a Health Reimbursement Account (HRA) or a Health Savings Account (HSA)
• Increasing cost sharing for prescription drugs through higher copays or conversion to coinsurance-based drug plans
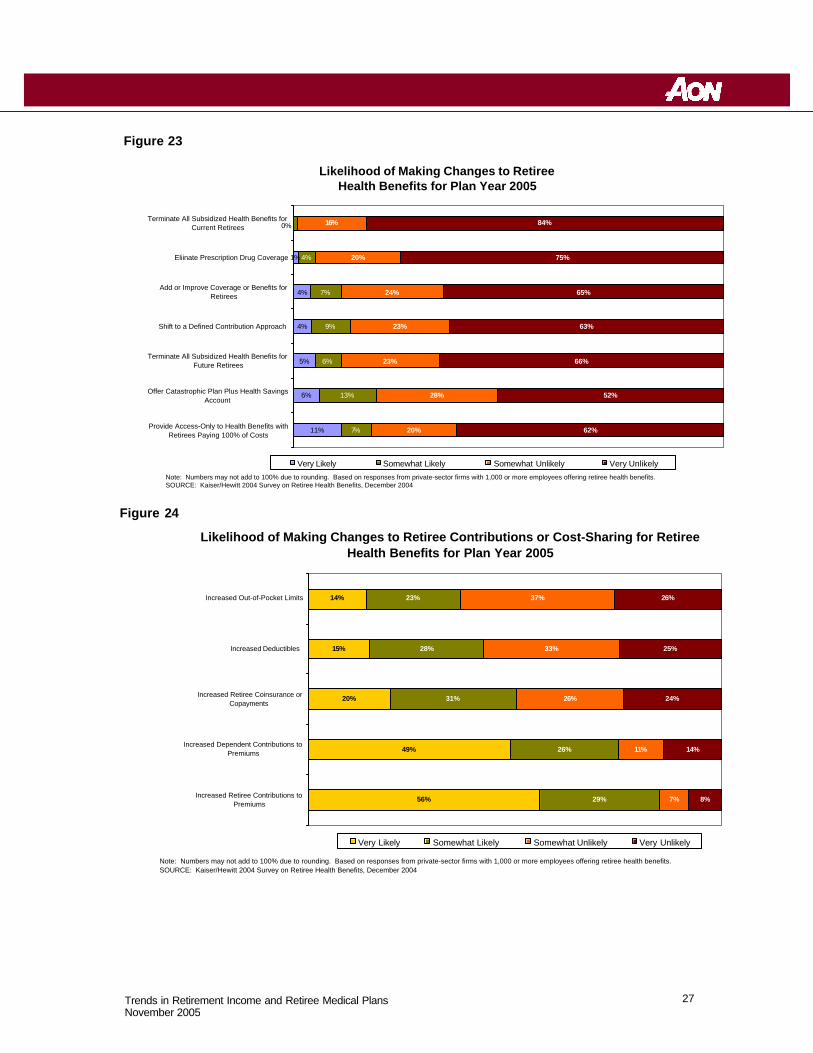
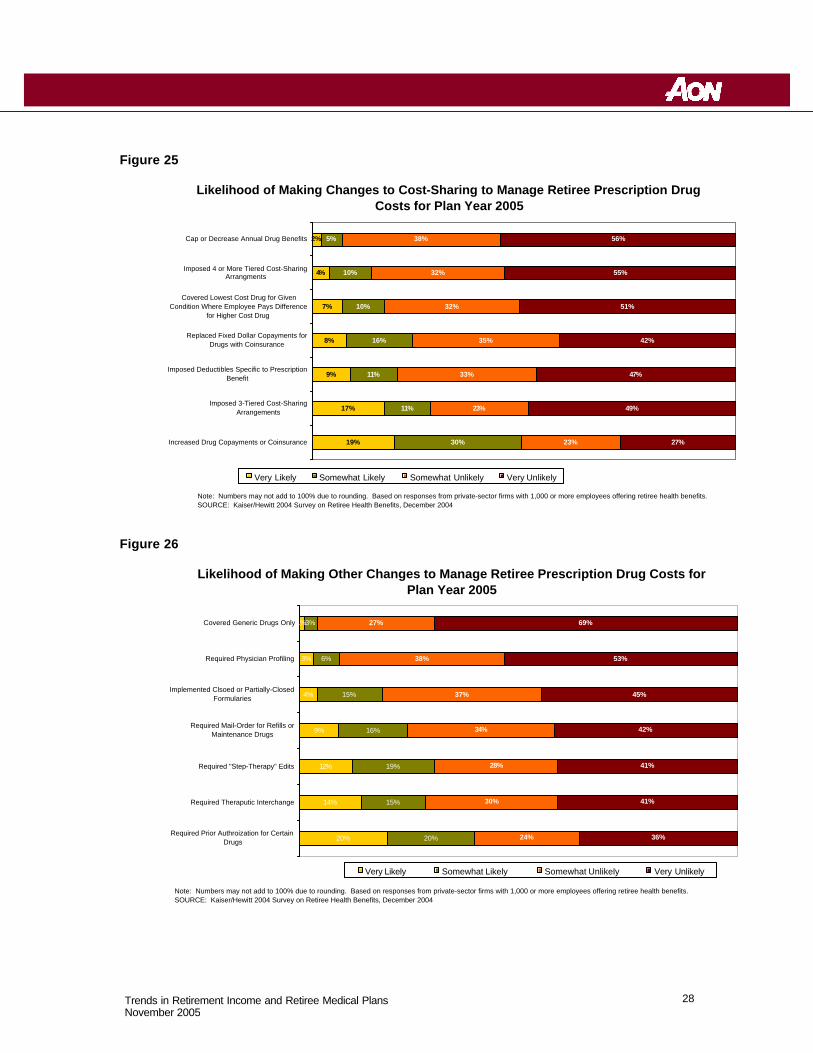
For more details on specific strategies being considered by employers who offer retiree health coverage, please see Figures 23 through 26.
13 Trends in Retirement Income and Retiree Medical Plans November 2005
Appendix 1 -- DB Design Trends Early Retirement Windows : As an alternative to layoffs, in the 1970s and 1980s many employers were offering early retirement incentives (also called early retirement windows) under (or outside) their DB plans to encourage employees to terminate employment before normal retirement age. Over the past 15 years, early retirement incentives in DB plans are not as popular.xxiii One study, for example, found that early retirement incentives have dropped from 30% of large employer plans in 1987 to 13% in 2003. xxiv
Nevertheless, early retirement windows may still be a valuable tool for those employers that want to reduce their workforce as part of a cost reduction effort or for other reasons. The costs/benefits of early retirement windows vary based on the design of the program and how many employees opt for the program. Typical window designs include:
• Additional age, service and/or pay credits under the DB plan (e.g., an employee who retires at age 50 with 10 years of service, gets credited with an additional 5 years of age and service, so that the employee’s pension benefit is determined as if the employee retired at age 55 with 15 years of service);
• Unreduced benefits for employees that retire at a certain age (e.g., 55 or over);
• Supplemental payments that bridge the period before an employee is eligible for Social Security; or
• Cash payments (e.g., a cash bonus).
Window programs can be very costly for employers because they require providing increased benefits or cash to eligible employees. The expected savings in compensation and other benefits costs needs to be compared to the expected cost of the window to determine if a window is a beneficial strategy for the particular employer situation.
It is virtually impossible to provide such additional benefits in a DC plan. DC plans have no common asset pool to provide benefits, only individual account balances. Further, the amount that may be added to an individual’s account balance in any year is limited to the lesser of 25% of pay and $42,000, all but precluding providing any type of supplemental or temporary benefit.
Early Retirement Subsidies: While a DB plan's "normal retirement date" is typically age 65, many plans allow participants to commence reduced early retirement benefits as early as age 55. Early retirement subsidies can be quite costly. An actuarially equivalent early retirement benefit has the same present value as a normal retirement benefit. For example, an equivalent early retirement benefit paid at age 55 might be equal to about 40%-50% of the normal retirement benefit payable at age 65. This reduction is based on actuarial equivalence to take into account the longer period of time the early retirement benefit will be payable. However, many plans pay subsidized early retirement benefits that equal up to 70%-80% of the normal retirement benefit.xxv This, obviously, is a costly plan feature.
Lump Sums Payments : DB plans have traditionally paid out benefits in some form of an annuity or installment payment. In recent years, more plans are offering some type of lump-sum benefit option. A 2000 Bureau of Labor Statistics survey found that that 44 % of all employees in DB plans were offered some type of lump-sum benefit option, versus 23 % in 1997.xxvi The BLS survey found that the large jump in lump-sum benefit options is due to the increase in cash
14 Trends in Retirement Income and Retiree Medical Plans November 2005
balance DB plans.xxvii Lump sum benefits under DB plans could be costly, however, particularly if the early retirement subsidy is included in the value of the lump sum, which is seen more often in traditional rather than cash balance DB plans.
Continuing Value of DB Plans : Despite the recent trend away from DB plans, many practitioners and plan sponsors recognize that DB plans provide the most predictable, secure benefit. Unlike DB plan benefit payments are generally not subject to market fluctuations but provide a fixed level of annuity at age 65 for life.xxviii Also, traditional final average pay DB plans are designed to reward older employees; that is, the benefit accrual values increase as a percentage of compensation as a participant reaches normal retirement age.xxix
15 Trends in Retirement Income and Retiree Medical Plans November 2005
Appendix 2 -- DC Design Trends Employer Match: Although the bulk of contributions to 401(k) plans are made through employee salary deferrals, most employers also provide an employer match. Of almost 4,000 plan sponsors surveyed in 2003 by PlanSponsor, almost 78% provided an employer match.xxx The most typical match, cited by more than a third of the respondents, was less than 50% on the first 6% of salary deferrals, but that level was significantly more common among smaller plans than among those with more than $200 million in assets. Nearly as many (30.2%) are matching at the rate of 50% of the first 6%. Of those employers that contemplate changing their match, they were more likely to consider increasing, rather than decreasing the percentage.xxxiThe employer match serves several purposes, such as keeping 401(k) participation levels high (making it easier to pass the nondiscrimination tests); and keeping employers competitive with their peers.xxxii The employer match can be somewhat costly, although the amount is generally very predictable.
Automatic Enrollment: Automatic enrollment seems to be a resurging trend, with nearly 20% of employers in PlanSponsor’s 2003 survey requiring participants to “opt out” of participation, rather than requiring an affirmative election. Larger plans were more likely to do so, but the trend was higher across all market segments.xxxiii This not only ensures greater preparation for retirement but also helps with the annual nondiscrimination test.
Safe Harbor Plans : Some employers (particularly smaller employers) have adopted so-called “safe harbor 401(k) plans” in order to avoid the administrative and recordkeeping costs of having to perform annual 401(k) nondiscrimination tests.xxxiv However, some plan sponsors may find the value of not having to perform nondiscrimination tests outweighed by other requirements (and associated costs) of safe harbor 401(k) plans, such as having to provide all plan participants with employer contributions that are immediately fully vested.
Fees: Fees for maintaining 401(k) plans continue to be a sensitive issue, particularly in light of the Enron and other fiduciary scandals. More than half (55.3%) of the employers responding to the 2003 PlanSponsor survey (see above) said that the cost to maintain their 401(k) plan was less was than 1% of plan assets, excluding fees charged to participant accounts. Nearly four in 10 said that the approximate annual cost charged against participant accounts as investment management or other fees was less than 1% of participant accounts.xxxv
Employer Stock: A recent trend in 401(k) plans has been a reduction in employer stock as an investment option. The failures of Enron and Worldcom creating the loss of significant retirement savings for thousands of employees has pressured employers to limit the amount of stock offered in their 401(k) plans.
16 Trends in Retirement Income and Retiree Medical Plans November 2005
Appendix 3 – Charts and Figures Figure 1
Figure 2
http://www.americanbenefitscouncil.org/documents/definedbenefits_paper.pdf
Number of Plans Covered by the PBGC
0
20
40
60
80
100
120
1980
1981
1982
1983
1984
1985
1986
1987
1988
1989
1990
1991
1992
1993
1994
1995
1996
1997
1998
1999
2000
2001
2002
2003
Nu
mb
er o
f Def
ined
ben
efit
Pla
ns
(000
)
17 Trends in Retirement Income and Retiree Medical Plans November 2005
Figure 3
Figure 4
From http://www.americanbenefitscouncil.org/documents/definedbenefits_paper.pdf
Number of DC Plans
0
100
200
300
400
500
600
700
800
1980
1981
1982
1983
1984
1985
1986
1987
1988
1989
1990
1991
1992
1993
1994
1995
1996
1997
1998
1999
2000
2001
2002
2003
Th
ou
san
ds
Num
ber
of P
lans
18 Trends in Retirement Income and Retiree Medical Plans November 2005
Figure 5
Figure 6
Total Health Benefit Cost Per Employee for Active Employees, 1994-2004
$3,644 $3,653 $3,703 $3,594$3,817
$4,097$4,430
$4,924
$5,646
$6,215$6,679
$0
$1,000
$2,000
$3,000
$4,000
$5,000
$6,000
$7,000
$8,000
1994 1995 1996 1997 1998 1999 2000 2001 2002 2003 2004
Note: Includes all medical, dental, and other health benefits, for all covered employees and dependents. Includes employer and employee contributions.SOURCE: Mercer's National Survey of Employer-Sponsored Health Plans
Average Increase in Total Retiree Health Costs by Firm Size, 2003 to 2004
12.7% 13.0% 13.0%13.8%
10.9%
0.0%
2.0%
4.0%
6.0%
8.0%
10.0%
12.0%
14.0%
16.0%
Total 1,000 - 4,999 Employees 5,000 - 9,999 Employees 10,000 - 19,999 Employees 20,000 or More Employees
Note: Based on responses from private-sector firms with 1,000 or more employees offering retiree health benefits.SOURCE: Kaiser/Hewitt 2004 Survey on Retiree Health Benefits, December 2004
19 Trends in Retirement Income and Retiree Medical Plans November 2005
Figure 7
Figure 8
CEO Concerns About Retiree Health Care Costs as Reported in Survey of Large Private-Sector Employers
Somewhat Concerned31%
Somewhat Unconcerned7%
Very Unconcerned2%
Don't Know2%
Very Concerned58%
Note: Based on responses from private-sector firms with 1,000 or more employees offering retiree health benefits.SOURCE: Kaiser/Hewitt 2004 Survey on Retiree Health Benefits, December 2004
Strategies Firms Are Likely to Choose Under the Medicare Drug Law
Discontinue Prescription Drug Coverage
8%
Don't Know13%
Other4%
Continue to Offer Prescription Drug Coverage and Accept 28% Tax-Free Federal Subsidy for Each Covered
Retiree58%
Offer Prescription Drug Coverage as Supplement to Medicare Prescription Drug Plan
17%
Note: Numbers may not add to 100% due to rounding. Based on responses from private-sector firms with 1,000 or more employees offering retiree health benefits.SOURCE: Kaiser/Hewitt 2004 Survey on Retiree Health Benefits, December 2004
20 Trends in Retirement Income and Retiree Medical Plans November 2005
Figure 9
Figure 10
Percentage of Private-Sector Establishments Offering Health Insurance to Retirees, 1997-2002
22%
16%
14%
12%
11%
13%
20%
15%
13%
11% 11%
13%
5%
10%
15%
20%
25%
1997 1998 1999 2000 2001 2002
Retirees Under Age 65 Medicare-Eligible Retirees
SOURCE: Various tables at www.ahcpr.gov/Data_Pub/IC_Tables.htm
Percentage of Local Governments With 250-999 Employees Offering Health Insurance to Retirees, 1997-2002
66%
62%
55%
46%
35%
54%
58%62%
34%
42%46%47%
5%
15%
25%
35%
45%
55%
65%
1997 1998 1999 2000 2001 2002
Retirees Under Age 65 Medicare-Eligible Retirees
SOURCE: Various tables at www.ahcpr.gov/Data_Pub/IC_Tables.htm
21 Trends in Retirement Income and Retiree Medical Plans November 2005
Figure 11
Figure 12
Percentage of State Governments Offering Health Insurance to Retirees, 1997-2002
92%
75%
86%
77%
92%
87%
75%
76%
80%
88%
69%69%
50%
55%
60%
65%
70%
75%
80%
85%
90%
95%
1997 1998 1999 2000 2001 2002
Retirees Under Age 65 Medicare-Eligible Retirees
SOURCE: Various tables at www.ahcpr.gov/Data_Pub/IC_Tables.htm
Provision of Retiree Health Benefits for Current and All Future Retirees, Employers with 500+ Employees, 1993-2004
46%
43%
40%
38%
35%
40%
35%
30%
28%28%
31%
28%29%
36%
41%
40%
33%
31%
20%
21%23%24%
10%
15%
20%
25%
30%
35%
40%
45%
50%
1993 1994 1995 1996 1997 1998 1999 2000 2001 2002 2003
Retirees Under Age 65 Medicare-Eligible Retirees
SOURCE: Mercer human Resources Consulting, National Survey of Employer-Sponsored Health Plans, 2004 (New York: Mercer Human Resources Consulting, 2004)
22 Trends in Retirement Income and Retiree Medical Plans November 2005
Figure 13
Figure 14
Likelihood of Employers Providing Retiree Health Benefits, Sample of Same Employers With 1,000 or More Employees in 1991 and 1998
94%
87%87%
78%
0%
10%
20%
30%
40%
50%
60%
70%
80%
90%
100%
Under 65 Retirees Medicare-Eligible Retirees
1991
1998
Provision of Retiree Health Benefits by Employers with 1,000+ Employees, 1991-2003
88%
72%
68%
80%
62% 61%
56%
79%
76% 76%73% 73%
62%66%
67%
71%
30%
40%
50%
60%
70%
80%
90%
100%
1991 1992 1993 1994 1995 1996 1997 1998 1999 2000 2001 2002 2003
Retirees Under Age 65 Medicare-Eligible Retirees
SOURCE: Frank McArdle et al., Retiree Health Coverage: Recent Trends and Employer Perspectives and Future Benefits (Menlo Park, CA The Henry J. Kaiser Family Foundation, October, 1999); Steve Coppock and Andrew Zebrak, "Finding the Right Fit: Medicare, Prescription Drugs and Current Coverage Options," testimony before the U.S. Senate, Committee on Finance; and Hewitt Associates, personal communication.
23 Trends in Retirement Income and Retiree Medical Plans November 2005
Figure 15
Figure 16
Distribution of Employers by Reported Change in Early 65 Retiree Contributions to Premiums, 2003 to 2004
14%
22%
32%
13%
6%
13%
0%
5%
10%
15%
20%
25%
30%
35%
None 1-10% 11-20% 21-30% 31-40% >40%Distribution of Employers by Reported Change in Pre-65 Retiree Contributions to Premiums
Note: Average increases in retiree contributions for new retirees across surveyed employers is 23% for pre-65 retirees (unweighted). Based on responses from private-sector firms with 1,000 or more employees offering retiree health benefits. Retiree contributions to premiums for retiree-only coverage for full-time employees retiring on or after January 1, 2003 and 2004, respectively, in plans with the largest number of enrolled retirees.SOURCE: Kaiser/Hewitt 2004 Survey on Retiree Health Benefits, December 2004
Distribution of Employers by Reported Change in Medicare-Eligible Retiree Contributions to Premiums, 2003 to 2004
21%
26%25%
11%
6%
9%
0%
5%
10%
15%
20%
25%
30%
None 1-10% 11-20% 21-30% 31-40% >40%
Distribution of Employers by Reported Change inMedicare-Eligible Retiree Contributions to Premiums
Note: Average increases in retiree contributions for new retirees across surveyed employers is 2% for Medicare-eligible retirees (unweighted). Based on responses from private-sector firms with 1,000 or more employees offering retiree health benefits. Retiree contributions to premiums for retiree-only coverage for full-time employees retiring on or after January 1, 2003 and 2004, respectively, in plans with the largest number of enrolled retirees.SOURCE: Kaiser/Hewitt 2004 Survey on Retiree Health Benefits, December 2004
24 Trends in Retirement Income and Retiree Medical Plans November 2005
Figure 17
Figure 18
27%
24%
Pre-65 Retirees 65+ Retirees
Weighted Average Increase in Retiree Contributions to Premiums
2003-2004
Note: Includes firms that do not require contributions. Based on responses from private -sector firms with 1,000 or morre employees offering retiree health benefits. Premiums for retiree-only coverage for full-time employees retiring on or after January 1, 2004 (new retirees), in plans with the largest number of enrolled retirees.SOURCE: Kaiser/Hewitt 2004 Survey on Retiree Health Benefits, December 2004.
$300
$161
$187
$101
Pre-65 Retirees 65+ Retirees
Weighted Average Monthly Premiums2004
Note: Includes firms that do not require contributions. Based on responses from private-sector firms with 1,000 or morre employees offering retiree health benefits. Premiums for retiree-only coverage for full-time employees retiring on or after January 1, 2004 (new retirees), in plans wi th the largest number of enrolled retirees.SOURCE: Kaiser/Hewitt 2004 Survey on Retiree Health Benefits, December 2004.
Retiree
EmployerRetiree
Employer
$487
$262
25 Trends in Retirement Income and Retiree Medical Plans November 2005
Figure 19
Figure 20
Distribution of Employers by Share of Premium Paid by Under 65 Retiree
21%
10%
14%
26%
24%
6%
Distribution of Employers by Share of Premium Paid by Pre-65 Retirees
Retiree Pays 0% of PremiumRetiree Pays 1-20% of PremiumRetiree Pays 21-40% of PremiumRetiree Pays 41-60% of PremiumRetiree Pays 61-99% of PremiumRetiree Pays 100% of Premium
Note: Numbers may not add to 100% due to rounding. Based on responses from private-sector firms with 1,000 or more employees offering retiree health benefits. Premiums for retiree-only coverage for full-time employees retiring on or after January 1, 2004 (new retirees), in plans with the largest number of enrolled retirees.SOURCE: Kaiser/Hewitt 2004 Survey on Retiree Health Benefits, December 2004
Distribution of Employers by Share of Premium Paid by Medicare-Eligible Retiree
19%
11%
17%
24%
21%
11%
Distribution of Employers by Share of Premium Paid by 65+ Retirees
Retiree Pays 0% of PremiumRetiree Pays 1-20% of PremiumRetiree Pays 21-40% of PremiumRetiree Pays 41-60% of PremiumRetiree Pays 61-99% of PremiumRetiree Pays 100% of Premium
Note: Numbers may not add to 100% due to rounding. Based on responses from private-sector firms with 1,000 or more employees offering retiree health benefits. Premiums for retiree-only coverage for full-time employees retiring on or after January 1, 2004 (new retirees), in plans with the largest number of enrolled retirees.SOURCE: Kaiser/Hewitt 2004 Survey on Retiree Health Benefits, December 2004
26 Trends in Retirement Income and Retiree Medical Plans November 2005
Figure 21
Figure 22
Percentage of Large Private-Sector Employers Making Changes to Retiree Contributions or Cost-Sharing for Retiree Health Benefits in the Past Year
79%
68%
45%
37%
29%
0%
10%
20%
30%
40%
50%
60%
70%
80%
90%
Increased RetireeContributions to
Premiums
Increased DependentContributions to
Premiums
Increased RetireeCoinsurance orCopayments
Increased Deductibles Increased Out-of-PocketLimits
Note: Based on responses from private-sector firms with 1,000 or more employees offering retiree health benefits.SOURCE: Kaiser/Hewitt 2004 Survey on Retiree Health Benefits, December 2004
Percentage of Large Private-Sector Employers Making Other Changes to Manage Retiree Prescription Drug Costs in the Past Year
53%
24%
15%13%
10%
0%
10%
20%
30%
40%
50%
60%
Increased DrugCopayments or
Coinsurance
Imposed 3-Tiered Cost-Sharing Arrangements
Replaced Fixed DollarCopayments for Drugs with
Coinsurance
Covered Lowest Cost Drugfor Given Condition WhereEmployee Pays Difference
for Higher Cost Drug
Imposed DeductiblesSpecific to Prescription
Benefit
Note: Based on responses from private-sector firms with 1,000 or more employees offering retiree health benefits.SOURCE: Kaiser/Hewitt 2004 Survey on Retiree Health Benefits, December 2004
27 Trends in Retirement Income and Retiree Medical Plans November 2005
Figure 23
Figure 24
Likelihood of Making Changes to Retiree Health Benefits for Plan Year 2005
11%
6%
5%
4%
4%
1%
7%
13%
6%
9%
7%
4%
20%
28%
23%
23%
24%
20%
16%
62%
52%
66%
63%
65%
75%
84%0%
1%
Provide Access-Only to Health Benefits withRetirees Paying 100% of Costs
Offer Catastrophic Plan Plus Health SavingsAccount
Terminate All Subsidized Health Benefits forFuture Retirees
Shift to a Defined Contribution Approach
Add or Improve Coverage or Benefits forRetirees
Eliinate Prescription Drug Coverage
Terminate All Subsidized Health Benefits forCurrent Retirees
Very Likely Somewhat Likely Somewhat Unlikely Very Unlikely
Note: Numbers may not add to 100% due to rounding. Based on responses from private-sector firms with 1,000 or more employees offering retiree health benefits.SOURCE: Kaiser/Hewitt 2004 Survey on Retiree Health Benefits, December 2004
Likelihood of Making Changes to Retiree Contributions or Cost-Sharing for Retiree Health Benefits for Plan Year 2005
56%
49%
20%
15%
14%
29%
26%
31%
28%
23%
7%
11%
26%
33%
37%
8%
14%
24%
25%
26%
Increased Retiree Contributions toPremiums
Increased Dependent Contributions toPremiums
Increased Retiree Coinsurance orCopayments
Increased Deductibles
Increased Out-of-Pocket Limits
Very Likely Somewhat Likely Somewhat Unlikely Very Unlikely
Note: Numbers may not add to 100% due to rounding. Based on responses from private-sector firms with 1,000 or more employees offering retiree health benefits.SOURCE: Kaiser/Hewitt 2004 Survey on Retiree Health Benefits, December 2004
28 Trends in Retirement Income and Retiree Medical Plans November 2005
Figure 25
Figure 26
Likelihood of Making Changes to Cost-Sharing to Manage Retiree Prescription Drug Costs for Plan Year 2005
19%
17%
9%
8%
7%
4%
2%
30%
11%
11%
16%
10%
10%
5%
23%
23%
33%
35%
32%
32%
38%
27%
49%
47%
42%
51%
55%
56%
Increased Drug Copayments or Coinsurance
Imposed 3-Tiered Cost-SharingArrangements
Imposed Deductibles Specific to PrescriptionBenefit
Replaced Fixed Dollar Copayments forDrugs with Coinsurance
Covered Lowest Cost Drug for GivenCondition Where Employee Pays Difference
for Higher Cost Drug
Imposed 4 or More Tiered Cost-SharingArrangments
Cap or Decrease Annual Drug Benefits
Very Likely Somewhat Likely Somewhat Unlikely Very Unlikely
Note: Numbers may not add to 100% due to rounding. Based on responses from private-sector firms with 1,000 or more employees offering retiree health benefits.SOURCE: Kaiser/Hewitt 2004 Survey on Retiree Health Benefits, December 2004
Likelihood of Making Other Changes to Manage Retiree Prescription Drug Costs for Plan Year 2005
20%
14%
12%
9%
4%
3%
1%
20%
15%
19%
16%
15%
6%
3%
24%
30%
28%
34%
37%
38%
27%
36%
41%
41%
42%
45%
53%
69%
Required Prior Authroization for CertainDrugs
Required Theraputic Interchange
Required "Step-Therapy" Edits
Required Mail-Order for Refills orMaintenance Drugs
Implemented Clsoed or Partially-ClosedFormularies
Required Physician Profiling
Covered Generic Drugs Only
Very Likely Somewhat Likely Somewhat Unlikely Very Unlikely
Note: Numbers may not add to 100% due to rounding. Based on responses from private-sector firms with 1,000 or more employees offering retiree health benefits.SOURCE: Kaiser/Hewitt 2004 Survey on Retiree Health Benefits, December 2004
29 Trends in Retirement Income and Retiree Medical Plans November 2005
Appendix 4 – Recent Articles on DB Plan Trends 1. Large firms not abandoning DB plans, survey says , Susanna Moon, Employee Benefit
News, August 2005, pp. 57-58.
2. The end of pensions, Roger Lowenstein, The New York Times, October 30, 2005, www.newyorktimes.com.
3. Company thaws frozen defined benefit plan, Sally Roberts, Business Insurance, June 27,
2005, pp. 1,22.
4. ERISA at 30: The decline of private-sector defined benefit promises and annuity payments. What will it mean? Jack VanDerhei and Craig Copeland, EBRI Issue Brief #269, May 2004, pp. 1-35.
5. 1 in 5 corporations freeze DB plans , Vineeta Anand, Pensions & Investments, April 5, 2004,
pp. 3,37.
6. A DB deep ‘freeze’? Sponsors look for rate relief to stem plan freezes, terminations , Manu Mazumdar, Employee Benefit Plan Review, September 2003, pp. 11-14.
7. What’s happening with defined benefit plans? Dawn Bizzell, Deloitte Consulting Survey,
2004, pp. 1-6.
8. You’ve frozen your pension plan – now the work really begins, Stewart Lawrence and John DeMairo, Financial Executive, September 2005, pp. 24-26.
9. Standing pat? Nevin Adams, Plan Sponsor, March 2004, www.plansponsor.com.
10. Motorola to phase out pension plan, Jerry Geisel, Business Insurance, March 25, 2005,
www.businessinsurance.com.
11. Northwest Airlines freezes pension plans , Rebecca Moore, Plan Sponsor, September 9, 2005, www.plansponsor.com.
12. Lockheed drops pension plan to new workers , The Associated Press, The New York Times,
October 6, 2005, www.newyorktimes.com.
13. Pensions freezing out younger workers , The Associated Press, Yahoo Financial News, July 24, 2005, http://biz.yahoo.com.
14. More employers freezing, phasing out DB pensions , Sally Roberts, Business Insurance,
August 30, 2004, p. 14.
15. Harsh market puts a freeze on pensions , Craig Gunsauley, Employee Benefit News, January 2004, www.benefitnews.com.
16. Pension funds: Companies kill more DB plans; Even healthy corporations freeze or
terminate their pension plans, Nicholas Braude, Pensions & Investments, June 27, 2005, p. 3.
17. Desire for certainty, savings drives shift from DB plans , Judy Greenwald, Business
Insurance, September 19, 2005, p. 19.
30 Trends in Retirement Income and Retiree Medical Plans November 2005
Appendix 5 – Recent Articles on Retiree Medical Trends
1. The future of employer-provided retiree medical coverage, Lawrence Grudzien, Journal of Pension Benefits, Summer 2005, pp. 28-33.
2. Sinkhole! Nanette Byrnes and Christopher Palmeri, BusinessWeek online, June 13, 2005,
www.businessweek.com.
3. Financing retiree health care , TIAA-CREF, A Collection of TIAA-CREF Institute Reports, 2005, pp. 1-62.
4. Retiree health care solutions: An examination of the current medical benefit plan and
funding mechanism landscape for retirees , Bruce J. McNeil and Thomas B. Henke, Journal of Deferred Compensation, Fall, 2005, pp. 78-86.
5. Erie County, other challenges threaten retiree health benefits , Janemarie Mulvey, EPF
Issuebackgrounder, May 19, 2005, pp. 1-4.
6. Evaporation of retiree benefits may be health plan opportunity, John Carroll, Managed Care Magazine, May 2005, pp.
7. The impact of erosion of retiree health benefits on workers and retirees , Paul Fronstin,
EBRI Issue Brief #279, March 2005, pp. 1-19.
8. Retirement ain’t gonna be what it used to be , Elayne Robertson Demby, Plan Sponsor, March, 2005, pp. 45-47.
9. Retiree health benefits decline, Leah Carlson, Employee Benefit News, February 2005, pp.
1,50.
10. Employers ask retirees to pay more for health care, many won’t drop coverage despite Medicare drug law, CCH Employee Benefits Management – Directions, January 4, 2005, p. 3.
11. High costs threaten retiree health cover, Jerry Geisel, Business Insurance, December 20,
2004, pp. 4,16.
12. More retirees may see health cuts , Ellen E. Schultz, The Wall Street Journal , October 14, 2004, www.wsj.com.
13. U.S. Steel cuts its retiree obligations , Theo Francis and Ellen E. Schultz, The Wall Street
Journal , February 26, 2004, p. A2.
14. Companies limit health coverage of many retirees , Milt Freudenheim, The New York Times, February 3, 2004, p. 1.
15. Sears scales back defined benefit, retiree med access, Joanne Wojcik, Business Insurance,
February 2, 2004, pp. 4,30.
16. Rising costs spur employers to look at retiree benefit cuts , Jerry Geisel, Business Insurance, January 19, 2004, pp. 4,9.
31 Trends in Retirement Income and Retiree Medical Plans November 2005
Endnotes i EBRI: “An Evolving Pension System: Trends in Defined Benefit and Defined Contribution Plans”
September 2002 (hereafter “EBRI DB/DC Trends”), p. 1. See also: http://www.bls.gov/opub/cwc/cm20030325tb01.htm#revisionnote
ii Testimony of Bradley D. Belt, PBGC Executive Director, before the Subcommittee on Select Revenue Measures, Committee on Ways and Means, U.S. House of Representatives (March 8, 2005).
iii Id. iv See PBGC 2004 Annual Report, which is at http://www.pbgc.gov/publications/annrpt/04annrpt.pdf. v “More than 20% of Surveyed Plan Sponsored Froze Plans or Intend to Do So,” Oct.
2003. Note: Under a typical freeze scenario, participants as of the freeze date accrue no further DB benefits and new hires are not allowed to participate in the plan.
vi “The Changing Nature of Defined Benefit Plans,” Watson Wyatt Insider (Feb. 2005) http://www.watsonwyatt.com/us/pubs/insider/showarticle.asp?ArticleID=14328&Component=The+Insider. [Note that in many cases, a DB plan formula looks like the following: (accrual rate) x (years of service) x (final average pay) = benefit at normal retirement date.]
vii Id. viii Id.
ix “Rising Benefits Burden”, Christian Science Monitor http://www.csmonitor.com/2005/0609/00/sol-usec.html
x Id., p. 4, 6. xi Id., p. 10. xii Id., p. 24. xiii Id., p. 26 xiv Id., p. 25. xv Id. Over a 15-year period, a trend has emerged in which more employees are participating in defined
contribution plans than defined benefit plans. In 1985, when four-fifths of full-time employees participated in defined benefit plans, less than half of employees participated in defined contribution plans. In contrast, by 2000 only a little more than one-third of employees participated in defined benefit plans, whereas half participated in defined contribution plans. Overall, employee participation in all retirement plans decreased during this period. Id.
xvi Id. xvii Id. xviii Mercer 2004 National Survey of Employer-Sponsored Health Plans xix Kaiser / Hewitt 2004 Survey on Retiree Health Benefits xx Kaiser / Hewitt 2004 Survey on Retiree Health Benefits xxi 2006 cost threshold and cost limit xxii Kaiser / Hewitt 2004 Survey on Retiree Health Benefits
32
Trends in Retirement Income and Retiree Medical Plans November 2005
xxiii “The Changing Nature of Defined Benefit Plans,” Watson Wyatt Insider (Feb. 2005) http://www.watsonwyatt.com/us/pubs/insider/showarticle.asp?ArticleID=14328&Component=The+Insider.
Id, Figure 3. xxiv Id., Figure 3. xxv See “DB plan sponsors scrutinize early retirement contracts,” Employee Benefits News (December
2004) at http://www.benefitnews.com/detail.cfm?id=6789. xxvi A. Blostin, “Distribution of retirement income benefits: lump sums have become more popular as an
alternative to annuity payments in defined benefit retirement plans and remain the prevalent distribution option in defined contribution plans,” Monthly Labor Review (April 2003) at http://www.findarticles.com/p/articles/mi_m1153/is_4_126/ai_104080474.
xxvii Id. xxviii Summary of Comments on Defined Benefit Plans received by the PBGC Defined Benefit Plan Working
Group (July 14, 1998) at http://www.pbgc.gov/about/FINDINGS.HTM. xxix EBRI DB/DC Trends, p. 42. xxx PlanSponsor 2004 Defined Contribution Survey (November 2004) at
www.plansponsor.com/hp_type2/?RECORD_ID=4874. xxxi Id. xxxii “Plan Design and 401(k) Savings Outcomes,” written for the National Tax Journal Forum (June 2004),
p.5. http://post.economics.harvard.edu/faculty/laibson/papers/plandesign.pdf. xxxiii Id. xxxiv “Safe Harbor 401(k) Plans for 2005,” McKay Hochman Co, Inc. (11/18/04) at
http://www.mhco.com/Commentary/2004/SafeHarbor401kfor2005_111104.htm. xxxv Id.