Trends in reporting of wildlife strikes with civil ... · I examined the overall number of strikes...
45
Trends in reporting of wildlife strikes with civil aircraft and in identification of species struck under a primarily voluntary reporting system, 1990-2013 Special report submitted to the Federal Aviation Administration Richard A. Dolbeer, PhD Science Adviser, U.S. Department of Agriculture Animal and Plant Health Inspection Service Wildlife Services 7 May 2015
Transcript of Trends in reporting of wildlife strikes with civil ... · I examined the overall number of strikes...

Trends in reporting of wildlife strikes with civil aircraft and
in identification of species struck under a primarily
voluntary reporting system, 1990-2013
Special report submitted to the Federal Aviation Administration
Richard A. Dolbeer, PhD
Science Adviser, U.S. Department of Agriculture
Animal and Plant Health Inspection Service
Wildlife Services
7 May 2015

Trends in strike reporting, 1990-2013 R. A. Dolbeer May 2015 1
Trends in reporting of wildlife strikes with civil aircraft and in identification
of species struck under a primarily voluntary reporting system, 1990-2013
Richard A. Dolbeer, Science Adviser, Airport Wildlife Hazards Program, U.S. Department of
Agriculture, APHIS, Wildlife Services, 1228 Laguna Drive, Huron, Ohio 44839 USA
Executive Summary
Reporting of wildlife strikes with civil aircraft is voluntary for airports and pilots but strongly
encouraged by the FAA via Advisory Circulars and other activities. In 2009, the FAA undertook
a review of the trends in strike reporting from 1990-2008 to determine if mandatory reporting
was needed, as was recommended by the National Transportation Safety Board in 2009. The
review concluded that given the positive trends in reporting rates and species identification
coupled with the decline or stabilization in damage strikes, mandatory reporting was not
recommended at that time (2009) to achieve the objectives of the database. Recommendations
were made to further enhance the reporting of strikes. The objective of this report is to determine
if the positive trends in reporting documented in 2009 have been sustained based on the
recommended outreach actions and if any changes are needed in FAA policies regarding strike
reporting at this time. The primary focus is to examine strike reporting for the past 5 years
(2009-2013) compared to the previous 5 years (2004-2008). Although this report covers both
commercial and general aviation aircraft at Part 139-certificated and non-certificated airports as
was done in the 2009 study, the focus of this report is strike reporting for commercial aircraft at
Part 139 airports.
I examined the overall number of strikes and damage strikes reported to the FAA by wildlife
type (birds, mammals, reptiles) and by airport type (14 CFR Part 139 certificated airports, non-
certificated General Aviation [GA] airports in the National Plan of Integrated Airport System
[NPIAS], and other GA airports). To derive estimates of the percentage of strikes being reported
to the NWSD by commercial aircraft and by all civil aircraft (commercial and general aviation)
at Part 139 airports nationwide, I compared strike reporting rates at 20 selected Part 139 airports
that have well established wildlife hazard management programs that emphasize the reporting of
all known strikes with strike reporting rates at other Part 139 airports. As another means of
gauging the number of known bird strikes that are not being reported to the NWSD, I examined
bird strike reports submitted independent of the NWSD through the Air Traffic Organization
(ATO) Mandatory Occurrence Reporting (MOR) system. Another objective was to document
the number of strike events that are being reported independently by multiple sources to
determine if the breadth of reporting by the aviation community is increasing. I also documented
trends in the percent of strikes reported to the FAA that provide an identification of the birds
struck to species. Finally, I documented actions that the FAA has undertaken since 2009 to
promote the reporting of strikes.
The overall number of reported strikes for all aircraft and airport types has increased 6.2 fold
from 1,851 in 1990 to a record 11,399 in 2013. In contrast, the number of strikes indicating
damage to the aircraft increased from 340 in 1990 to a peak of 764 in 2000 but has subsequently
declined by 21% to 605 in 2013. The percent of reported strikes indicating damage ranged from
15% to 19% from 1990-1998 but has subsequently steadily declined to 5% in 2013.
Trends in strike reporting, 1990-2013 R. A. Dolbeer May 2015 2
Reported strikes for all aircraft types at Part 139 airports and NPIAS GA airports increased by
43% and 61%, respectively, in 2009-2013 compared to 2004-2008. In contrast, damage strikes
declined by 2% at Part 139 airports and increased by only 5% at NPIAS GA airports. In addition
to the slight decline in damage strikes reported at Part 139 airports, the mean number of wildlife-
induced aborted take-offs and precautionary landings declined by 16% and 9%, respectively.
Commercial aircraft movements (take-off or landing) at Part 139 airports declined by 13% from
2004-2008 to 2009-2013. Thus, whereas, the number of reported strikes for commercial aircraft
at Part 139 airports increased by 46% from 2004-2008 to 2009-2013, the strike rate
(strikes/100,000 movements) increased by 67%. The number of damage strikes declined by 2%
and the damage strike rate increased by 12% (note: these numbers refer to strikes with
commercial aircraft only and not to strikes with all aircraft types at Part 139 airports as discussed
in previous paragraph).
GA aircraft movements at NPIAS GA airports declined by 8% in 2009-2013 compared to 2004-
2008. Thus, whereas the number of reported strikes with GA aircraft increased by 43% from
2004-2008 to 2009-2013, the strike rate increased by 55%. The number of damage strikes to GA
aircraft at NPIAS GA airports increased by 13% and the damage strike rate increased 23% (note:
these numbers refer to strikes with GA aircraft only and not to strikes with all aircraft at NPIAS
GA airports as discussed 2 paragraphs above).
Based on a comparison of strike rates at 20 selected Part 139 airports with strike rates at 484
other Part 139 airports, reporting of known strikes for commercial aircraft increased from an
estimated 78% to 91% and damage strike reporting increased from an estimated 76% to 93%,
2004-2008 to 2009-2013. Reporting of known strikes for all civil aviation (commercial and
general aviation aircraft) increased from an estimated 42% to 47% and damage strike reporting
increased from an estimated 50% to 59%, 2004-2008 to 2009-2013. An analysis of strike data
from the ATO MOR system supported the findings on percent of known strikes reported for
commercial aviation. The MOR system added only about 7% more strikes and 4% more damage
strikes (all minor) to the NWSD.
The number of strike events with multiple reports submitted from independent sources has
increased even more dramatically than the number of strike reports. Whereas the number of
strike events reported in 2009-2013 increased by 42% compared to 2004-2008, the number of
individual strike reports examined increased by 60%. This finding highlights the increased
participation by the aviation community as a whole to ensure that strike events are reported to the
NWSD.
The mean number of strikes in which the bird was identified to species increased by 103% from
2,619/year in 2004-2008 to 5,324/year in 2009-2013. The percentage of all bird strikes in which
the species was identified increased from a mean of 37% in 2004-2008 to 53% in 2009-2013 (a
record 60% in 2013).
The various actions undertaken by the FAA, in partnership with other government and aviation
industry groups from 2009 to 2013, have enhanced the quantity and quality of reporting of
wildlife strikes involving civil aircraft under a voluntary system. Of significant note is the
inclusion of statements in revised Advisory Circulars to emphasize a commitment to reporting all
known strikes. These statements provide clear guidance that strike reporting is a critical
component of every Wildlife Hazard Management Plan (WHMP) which, when approved, is a
part of each Part 139 airport’s certification manual.
Trends in strike reporting, 1990-2013 R. A. Dolbeer May 2015 3
Another significant development was FAA Order JO 7210.632 (effective 30 Jan 2012) which
requires ATO personnel to report all bird strikes of which they become aware. These reports are
entered in the MOR system and, as of January 2014, are being integrated into the NWSD if they
provide new information.
Also, the open accessibility of the NWSD to the aviation industry and general public for
information and analysis, the availability of on-line customized “Airport Wildlife Strike
Summary and Risk Analysis Reports” for each Part 139 airport, and enhancements in on-line
reporting have all contributed to a greater public and industry awareness of the usefulness of the
database and to the importance of strike reporting.
Given the strong, positive trends in reporting rates (an estimated 91% of strikes with commercial
aircraft at Part 139 airports are now reported) and species identification coupled with the decline
or stabilization in damage strikes, mandatory reporting other than what is already required under
ATO Order JO 7210.632 is not recommended at this time to achieve the objectives of the
database. I conclude the reporting procedures in place are fully compliant with the International
Civil Aviation Organization standard regarding the establishment of a national procedure for
recording and reporting wildlife strikes. The level of reporting is adequate to track national trends
in wildlife strikes, determine the hazard level of wildlife species that are being struck, and to
provide a scientific foundation for FAA policies and guidance regarding the mitigation of risk
from wildlife strikes with civil aircraft. The NWSD also provides a means for Part 139 airports
to monitor and evaluate the effectiveness of their WHMPs through “Airport Wildlife Strike
Summary and Risk Analysis Reports” that are generated annually.
______________________________________________________________________________
1. INTRODUCTION
Bird and other wildlife strikes have become a serious aviation safety issue as demonstrated by
the emergency forced landing of an Airbus 320 with 155 passengers and crew in the Hudson
River in January 2009 after Canada geese were ingested in both engines (National Transportation
Safety Board 2010, Marra et al. 2009). Two factors that have contributed to this threat in the
USA, as documented by Dolbeer et al. (2014a), are:
1. Most populations of large bird and mammal species commonly involved in strikes have
increased markedly in the last few decades in North America and adapted to living in
urban environments, including airports, and
2. Commercial air carriers have replaced their older three or four-engine aircraft fleets with
more efficient and quieter, two-engine aircraft which, in the event of a multiple ingestion
event (e.g., the Hudson River incident cited above), may have vulnerabilities not shared
by their three or four engine-equipped counterparts. In addition, previous research has
indicated that birds are less able to detect and avoid modern jet aircraft with quieter
turbofan engines.
The Federal Aviation Administration (FAA) has initiated several programs to address this
important safety issue. Among the various programs is a national procedure for recording and
reporting wildlife strikes in compliance with International Civil Aviation Organization (ICAO)
standards for airports (ICAO 2013). The FAA began collecting wildlife strike data nationally in
Trends in strike reporting, 1990-2013 R. A. Dolbeer May 2015 4
19651. However, except for cursory examinations of the strike reports to determine general
trends, the data were never submitted to rigorous analysis until the 1990s. In 1995, the FAA,
through an interagency agreement with the USDA, Wildlife Services (USDA/WS), initiated a
project to obtain more objective estimates of the magnitude and nature of the national wildlife
strike problem for civil aviation. This project involves having specialists from the USDA/WS:
(1) edit all strike reports (FAA Form 5200-7, Bird/Other Wildlife Strike Report) received by the
FAA since 1990 to ensure consistent, error-free data; (2) enter all edited strike reports in the
FAA National Wildlife Strike Database (NWSD); (3) supplement strikes reported on Form 5200-
7 with additional, non-duplicated strike reports from other sources; (4) provide the FAA with an
updated computer file each month containing all edited strike reports; and (5) assist the FAA
with the production of annual and special reports summarizing the results of analyses of the data
from the NWSD. Such analyses are critical to determining the economic cost of wildlife strikes,
the magnitude of safety issues, and most important, the nature of the problems (e.g., wildlife
species involved, types of damage, height and phase of flight during which strikes occur, and
seasonal patterns). The information obtained from these analyses provides the foundation for
FAA national policies and guidance and for refinements in the development and implementation
of integrated research and management efforts to reduce wildlife strikes. Data on the number of
strikes causing damage to aircraft or other adverse effects (e.g., aborted take-off) also provide a
benchmark for individual airports to evaluate and improve their Wildlife Hazard Management
Plans (WHMP) in the context of a Safety Management System (Dolbeer and Begier 2012).
The first annual report on wildlife strikes to civil aircraft in the USA was completed in 1995
(Dolbeer et al. 1995) and has been followed by 19 annual reports including the latest report
covering the years 1990-2013 (Dolbeer et al 2014a). Current and historic annual reports are
accessible as PDF files at: http://www.faa.gov/airports/airport_safety/wildlife/
2. BACKGROUND AND OBJECTIVES OF THIS REPORT
Reporting of wildlife strikes with civil aircraft is voluntary for airports and pilots2 but strongly
encouraged by the FAA (Advisory Circular 150/5200-32A: Reporting wildlife aircraft strikes [22
December 2004]) updated as AC 150/5200-32B [May 2013]). In 2009, the National
Transportation Safety Board (NTSB) issued Safety Recommendation A-09-75 to require all 14
Code of Federal Regulations (CFR) Part 139 airports and 14 CFR Part 121, Part 135, and Part 91
Subpart K aircraft operators to report all wildlife strikes, including, if possible, species
identification, to the FAA NWSD. NTSB issued this recommendation to the FAA as a result of
their investigation of a March 4, 2008, accident in which a Cessna 500 entered a steep descent
and crashed after colliding in flight with a flock of large birds (American white pelicans) about 2
minutes after takeoff from Wiley Post Airport, Oklahoma City, Oklahoma.
In 2009, following the forced landing of Flight 1549 in the Hudson, River and the NTSB Safety
Recommendation A-09-75, the FAA undertook a review of the trends in strike reporting from
1990-2008 to determine if mandatory reporting was needed (Dolbeer 2009a,b). The review
concluded that given the positive trends in reporting rates and species identification coupled with
the decline or stabilization in damage strikes, mandatory reporting was not recommended at that
1 Advisory Circular 150/5200-2 Bird Strike Incident Report Form (27 Nov 1965) provided the first strike reporting
form: FAA Form 3830 Bird Strike/Incident Report (10-65).
2 Under FAA Order JO 7210.632, (effective 30 Jan 2012), Air Traffic Organization personnel are required to report
all bird strikes of which they become aware.
Trends in strike reporting, 1990-2013 R. A. Dolbeer May 2015 5
time to achieve the objectives of the database. Based on the statistical trends measured in the
study, the database appeared to be adequate for defining the overall national problem, identifying
the species posing the greatest and least hazards, and measuring national and regional trends in
strikes. Thus, the FAA opted to comply with Safety Recommendation A-09-75 by 1) enhanced
promotion of the voluntary reporting of strikes via education and awareness programs throughout
the aviation community, 2) revised Advisory Circulars to provide clearer guidance on the
importance and means for reporting strikes, 3) improved procedures to transfer strike data from
various FAA and industry databases to the NWSD, 4) making the database openly accessible to
the aviation industry and general public, 5) refinements in the electronic reporting system for
Form 5200-7, and 6) continued publication of annual reports and other studies to document the
usefulness of the NWSD in providing an objective, scientific foundation for FAA and aviation
industry policies and guidance related to bird and other wildlife strikes.
The objective of this report, based on recommendations of Dolbeer (2009b), is to conduct a
follow up study to document trends in strike reporting in the 5 years since 2008 compared to
previous years to determine if any recommended changes are needed in FAA policies regarding
strike reporting at this time.
3. PROCEDURES OF ANALYSES
The primary focus of this analysis was to examine strike reporting for the past 5 years (2009-
2013) compared to the previous 5 years (2004-2008). In addition, an examination of trends from
1990 to 2013 (24 years) was presented for some strike statistics to provide a longer-term
perspective.
First, I examined the overall number of strikes and damage strikes reported to the FAA by
wildlife type (bird, terrestrial mammal, bat [flying mammal], and reptile) by year. This included
an analysis of the trend in the mean size (based on biomass) of birds reported struck.
Second, I examined overall trends in strike reporting for all aircraft types at airports certificated
for passenger service under 14 CFR Part 139 (Part 139 airports, FAA 2014a), for non-
certificated General Aviation (GA) airports in the National Plan of Integrated Airport System
(NPIAS, FAA 2014b), and for other (non-NPIAS) GA airports.
Third, I compared reporting rates (strikes per 100,000 aircraft movements) for strikes involving
commercial (air carrier/air taxi) and GA aircraft at Part 139 and NPIAS GA airports,
respectively.
Fourth, to derive an estimate of the percentage of known strikes being reported to the NWSD by
commercial aircraft and all civil aircraft (commercial and GA) at Part 139 airports nationwide, I
compared strike reporting rates at 20 selected Part 139 airports (that have well established
wildlife hazard management programs that emphasize the reporting of all known strikes) with
strike reporting rates at all other Part 139 airports averaging over 1,000 movements/year, 2009-
2013 (484 airports)3. The assumption for this analysis was that the reported strikes for the 20
selected Part 139 airports is reflective of the actual known strikes for these airports, 2009-2013.
Strikes involving aircraft without a 3-letter Operator ID (private, business, and government
aircraft) were excluded from the analysis of strikes with commercial aircraft but included for the
analysis of strikes with all civil aircraft. “Carcass found” strikes were included with the
3 35 Part 139 airports that averaged <1,000 movements/year, 2009-2013 were excluded from the analysis. These
airports had <0.1% of the total commercial aircraft movements at Part 139 airports, 2009-2013.

Trends in strike reporting, 1990-2013 R. A. Dolbeer May 2015 6
commercial aircraft since the vast majority of these strikes at Part 139 airports would involve
commercial aircraft.
As another means of gauging the number of known bird strikes that are not being reported to the
NWSD, I examined bird strike reports submitted independent of the NWSD through the Air
Traffic Organization (ATO) Mandatory Occurrence Reporting (MOR) system. Under FAA
Order JO 7210.632, (effective 30 Jan 2012), ATO personnel are required to report all bird strikes
of which they become aware (see Appendix A-8 in the Order). Thus, I examined the strikes
reported by ATO through the MOR system from January to September 2014 to determine how
many of these strikes were 1) duplicates (with no new information) of strikes reported
independently to the NWSD, 2) duplicates (but with additional information) of strikes reported
independently to the NWSD, and 3) new strike events that had not been reported to the NWSD
by other means.
A fifth objective, related to the MOR reports, was to examine trends in the sources of strike
reports from 2004-2008 to 2009-2013. In particular, I documented the number of strike events
that are being reported independently by multiple sources to gauge the breadth of reporting
within the aviation community.
A sixth objective was to document trends in the percent of strikes reported to the FAA that
provide an identification of the birds struck to species level (e.g., ring-billed gull [Larus
delawarensis] as opposed to the generic “sea gull” or “unknown bird”)4. There are about 900
species of wild birds that have been observed at least once in North America north of Mexico
(Alsop 2001) of which about 650 are nesting species (Robbins et al. 1983). These species range
in body mass from about 2 to 12,000 grams (Dunning 2007). Identification of the species
responsible for a strike is critical for 3 reasons: 1) aeronautical studies analyzing the impact force
of the object striking the aircraft component; 2) developing and evaluating species-focused
WHMPs under airport Safety Management Systems (SMS) to mitigate the risk of strikes by
hazardous species (Dolbeer and Wright 2009, Dolbeer and Begier 2012); and 3), determining the
legal (protective) status of the species involved in the strikes under federal regulations such as
the Migratory Bird Treaty Act and Endangered Species Act, as well as under state and local laws
(Cleary and Dolbeer 2005). Species identification is critical to 1) obtain necessary federal, state,
and local permits for management actions under an airport’s SMS, 2) ensure that management
actions are directed at the appropriate species that pose a risk to aviation safety, and 3) justify to
the public and defend the management actions taken.
A seventh objective was to document actions that the FAA has undertaken since 2009 to further
promote the reporting of strikes.
Based on the findings of these seven objectives, a final objective was to assess if 1) the reporting
procedures in place are compliant with the ICAO standard regarding the establishment of a
national procedure for recording and reporting wildlife strikes (ICAO 2013), and 2) data
presently collected under the reporting system in place are adequate for understanding the
problem of wildlife strikes in the USA and for monitoring and evaluating WHMPs at airports or
if additional measures, such as mandatory reporting beyond what is now required under the ATO
4 This analysis only examines species identification for bird strikes and not for other wildlife species. Birds
comprise 97% of all wildlife strikes (Table 1). Terrestrial mammals, which comprise 2.2% of strikes, are identified
to species in 95% of cases.
Trends in strike reporting, 1990-2013 R. A. Dolbeer May 2015 7
MOR system, need to be taken to collect sufficient information for regulatory and policy
decisions.
4. SOURCES OF DATA
Wildlife strike data for civil aircraft from 1990-2013 were obtained from the NWSD (Dolbeer et
al. 2014a) using Version 2014.6. Military aircraft strikes at civil airports were excluded from the
analyses. A list of Part 139-certificated airports was obtained from FAA (2014a). Aircraft
movement data for all Part 139-certificated airports and NPIAS GA airports were obtained from
the FAA Terminal Area Forecast (TAF) System (FAA 2014c). Wildlife strikes in the ATO MOR
system were provided by the FAA.
Strike rates and damage strike rates for commercial aircraft at Part 139 airports and GA aircraft at
NPIAS GA airports were calculated in terms of number of strikes and number of damage strikes
reported per 100,000 aircraft movements (take-off or landing).
5. RESULTS
5.1 Reported strikes and damage strikes for all airport and aircraft types by birds,
terrestrial mammals, bats, reptiles
5.1.1 Years 1990-2013
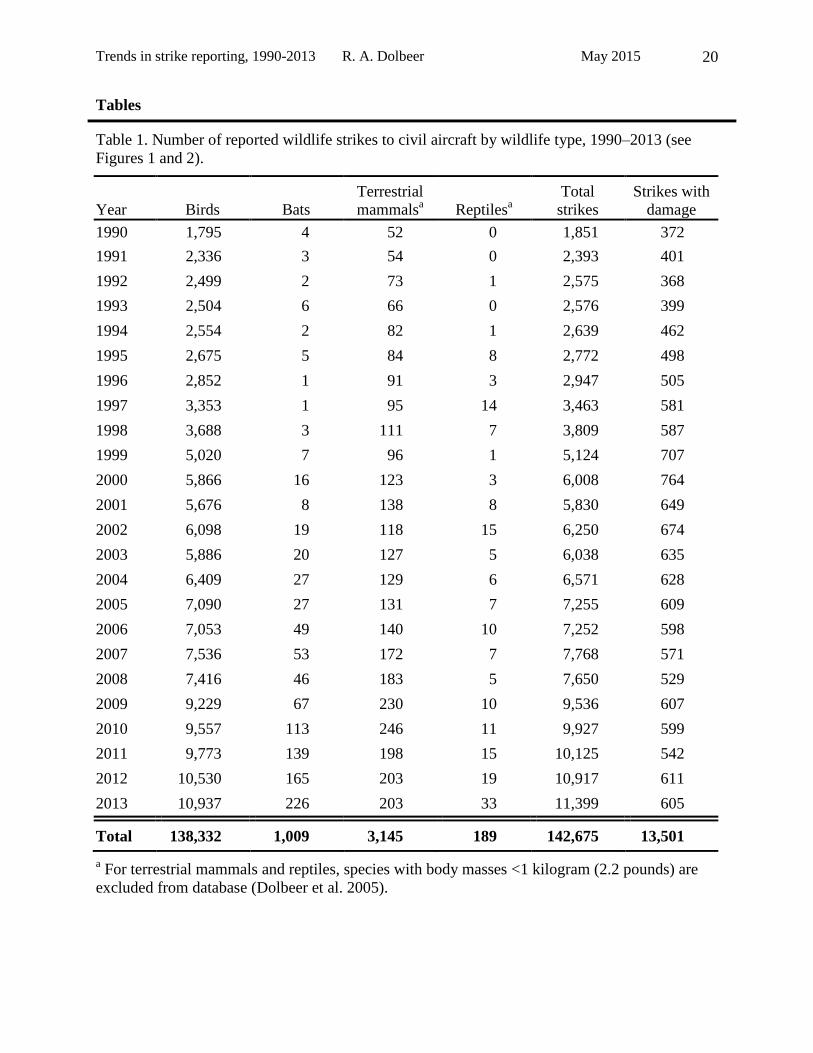
For the 24-year period, 142,675 strikes were reported to the FAA. Birds were involved in 97.0%
of the reported strikes, terrestrial mammals in 2.2%, bats in 0.7% and reptiles in 0.1% (Table 1).
The overall number of reported strikes increased 6.2 fold from 1,851 in 1990 to 11,399 in 2013.
In contrast, the number of strikes indicating damage to the aircraft increased from 340 in 1990 to
a peak of 764 in 2000 but has subsequently declined by 21% to 605 in 2013 (Figure 1). The
percent of reported strikes indicating damage ranged from 15% to 19% in 1990-1998 but has
subsequently steadily declined to 5% in 2013 (Figure 1).
5.1.2 Years 2009-2013 compared to 2004-2008
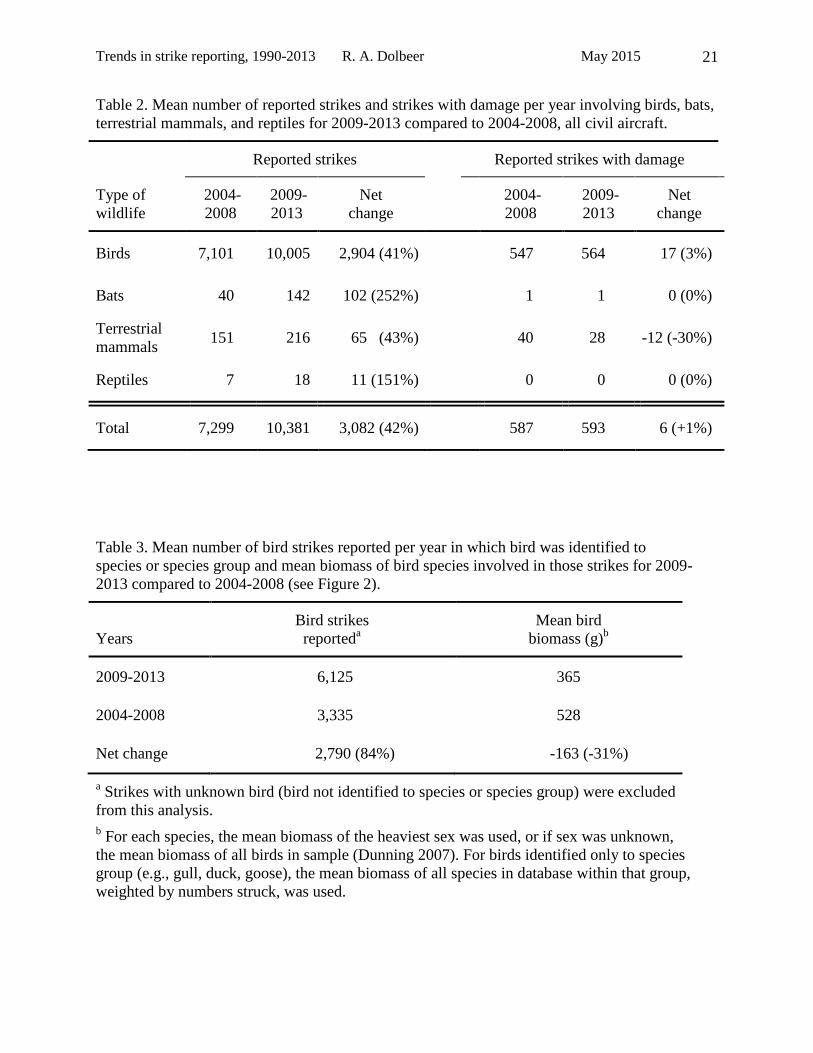
Overall, reported wildlife strikes increased by a mean of 42% in 2009-2013 compared to 2004-
2008 (Table 2). Bird, bat, terrestrial mammals, and reptile strikes each increased by means of
41%, 252%, 43%, and 151%, respectively. Although the overall number of strike reports
increased by a mean of 42%, the number of strikes causing damage was stable, changing by only
1% between these two 5-year periods.
5.1.3 Mean size of birds struck, 1990-2013 and 2009-2013 compared to 2004-2008
The mean size (based on biomass) of birds reported struck by civil aircraft has declined by over
50% from about 800 grams in the mid-1990s to less than 400 grams in 2013 (Figure 2). From
2004-2008 to 2009-2013, the mean biomass of birds involved in reported strikes decreased 31%
from a mean of 528 grams to 365 grams (Table 3). This decrease in mean biomass is likely
related to the increased rate of reporting of all bird strikes, most of which are non-damaging
strikes (see Figure 1) involving smaller birds.
5.2 Reported strikes and damage strikes for all aircraft by airport type, 2009-2013
compared to 2004-2008
The number of airports reporting strikes increased substantially for all airport types in 2009-2013
compared to 2004-2008 (Part 139 airports by 17%, NPIAS GA airports by 37%, other GA
airports by 114%, and foreign airports by 27%; Table 4, Figure 3). The numbers of strikes
Trends in strike reporting, 1990-2013 R. A. Dolbeer May 2015 8
reported for each airport type showed even greater percent increases (Part 139 airports by 43%,
NPIAS GA airports by 61%, other GA airports by 123%, and foreign airports by 46%; Table 4,
Figure 4). For all airport types, there was an overall 26% increase in the number of airports
reporting strikes and a 45% increase in the number of strikes reported.
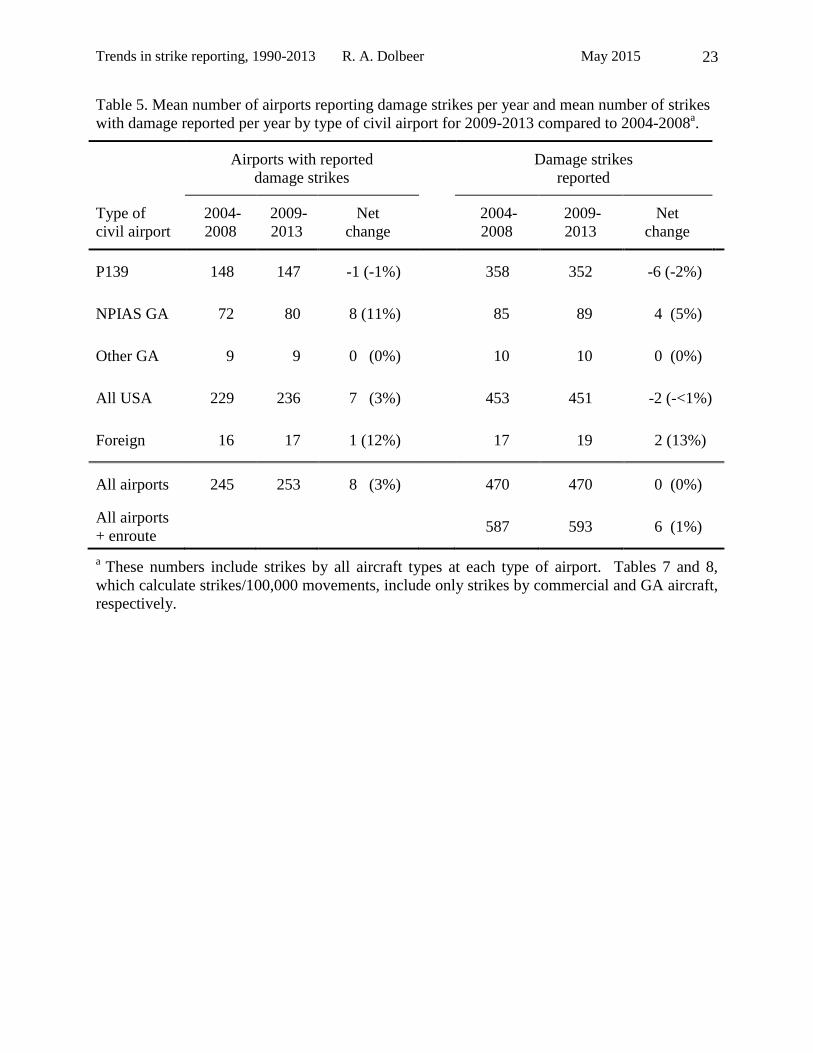
In contrast to the substantial increase of 43% in reported strikes at Part 139 airports in 2009-2013
compared to 2004-2008, the mean number of damage strikes at Part 139 airports showed a 2%
decline (Table 5, Figure 4). In addition to the slight decline in damage strikes reported at Part
139 airports, the mean number of wildlife-induced aborted take-offs and precautionary landings
declined by 16% and 9%, respectively, from 2004-2008 to 2009-2013 (Table 6). NPIAS GA
airports, which showed a 61% increase in reported strikes in 2009-2013 compared to 2004-2008
(Table 4, Figure 4), showed only a 5% increase in damage strikes (Table 5, Figure 4) and aborted
take-offs (Table 6). Precautionary landings declined by 2%.
Tables A1 and A2 and Figures A1, A2, and A3 in Appendix A provide data on the long-term
trends (1990-2013) for reported strikes, damage strikes, aborted take-offs, and precautionary
landings by airport type.
5.3 Strike rates for commercial and GA aircraft at Part 139 and NPIAS GA airports, 2009-
2013 compared to 2004-2008
Commercial aircraft movements at Part 139 airports declined by an average of 13% in 2009-2013
compared to 2004-2008 (Table 7). Thus, whereas the number of reported strikes for commercial
aircraft increased by 46% from 2004-2008 to 2009-2013, the strike rate increased by 67% from
21.62 to 36.09. The number of damage strikes to commercial aircraft at Part 139 airports
declined by 2% from 2004-2008 to 2009-2013. However, because there was a 12% decline in
movements, the damage strike rate increased 12% from 1.11 to 1.25.
GA aircraft movements at NPIAS GA airports declined by an average of 8% in 2009-2013
compared to 2004-2008 (Table 8). Thus, whereas the number of reported strikes increased by
43% from 2004-2008 to 2009-2013, the strike rate increased by 55% from 0.343 to 0.531. The
number of damage strikes to GA aircraft at NPIAS GA airports increased by 13% from 2004-
2008 to 2009-2013 and the damage strike rate increased 23% from 0.127 to 0.156.
5.4 Estimated percent of strikes reported at Part 139 airports
5.4.1 Strike rates involving commercial aircraft for selected Part 139 airports compared to
other Part 139 airports
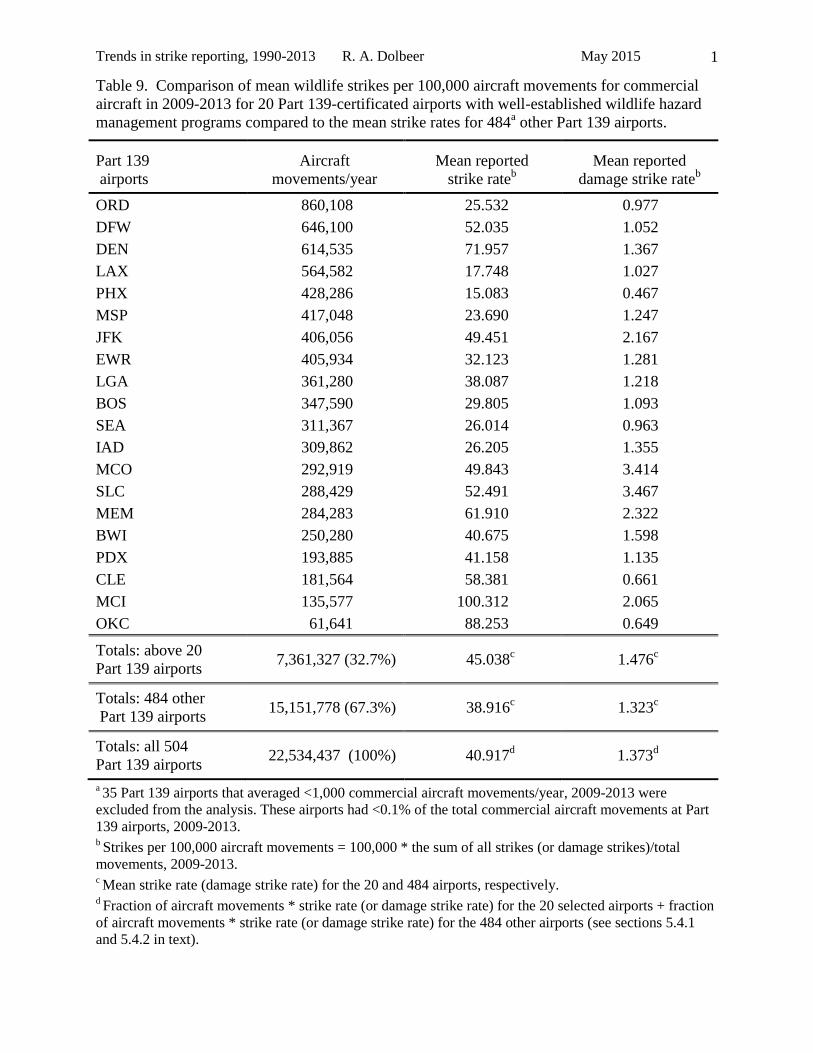
In this analysis, the mean strike rate and mean damage strike rate were compared for reported
strikes involving all commercial aircraft at 20 selected Part 139 airports with the strike rates at
484 other Part 139 airports, 2009-2013 (Table 9). The 20 airports selected as a baseline or
control sample have well-established wildlife hazard management programs in place for at least
the past 10 years that are overseen by a wildlife biologist, either from USDA/WS (Begier and
Dolbeer 2015), the private sector, in-house, or a combination thereof. These airports were
selected based on their established programs and known effort to document all wildlife strikes. I
made no a priori examination of strike rates. The selection of these 20 Part 139 airports as the
baseline sample does not imply that the other Part 139 airports have inadequate wildlife hazard
management programs.
An estimate of the percentage of strikes involving commercial aircraft reported at Part 139
airports nationwide, 2009-2013, can be obtained if the following assumptions are made:
Trends in strike reporting, 1990-2013 R. A. Dolbeer May 2015 9
1. the mean reported strike rate of 45.038 for the 20 selected Part 139 airports (Table 9) is
reflective of the actual known strike rates for these airports, 2009-2013, and
2. the mean reported strike rate of 38.916 for the 484 other airports should actually be the
same (45.038) as that of the 20 selected airports.
The 20 selected airports and 484 other Part 139 airports had, respectively, 32.7% and 67.3%, of
the commercial air carrier movements from 2009-2013 (Table 9). Thus, the proportion of actual
strikes reported by each group of airports can be calculated by multiplying the fraction of total
aircraft movements by the reported strike rate or 0.327 * 45.038 + 0.673 * 38.916 = 40.917. If
both groups of Part 139 airports had reported strikes at the same rate as the 20 selected Part 139
airports (45.038), the respective proportions would have been 0.327 * 45.038 + 0.673 * 45.038 =
45.038. Therefore, based on the two assumptions above, it can be estimated that 91% (100 *
40.917/45.038) of the known strikes involving commercial aircraft were reported at the 504 Part
139 airports from 2009-2013 (Table 9).
Using the same assumptions and procedures, it can be estimated that 93% (100 * 1.373/1.476) of
the known damage strikes involving commercial aircraft were reported at the 504 Part 139
airports from 2009-2013 (Table 9).
Furthermore, using the same assumptions and procedures, it can be calculated that 79% (100 *
22.317/28.256) of the known strikes and 78% (100 * 1.196/1.539) of the known damage strikes
involving commercial aircraft for the same 504 Part 139 airports were reported in 2004-2008
(Table 10). Thus, strike reporting for commercial aircraft increased from an estimated 79% to
91% and damage strike reporting increased from an estimated 78% to 93%, 2004-2008 to 2009-
2013 (Table 13).
5.4.2 Strike rates involving all civil aircraft (commercial and GA) for selected Part 139
airports compared to other Part 139 airports
This analysis was identical to the analysis in Section 5.4.1 above except that aircraft movements
and strikes for all civil aircraft at the 504 Part 139 airports were included.
The 20 selected airports and 484 other Part 139 airports had, respectively, 19.5% and 80.5%, of
the total civil aircraft movements from 2009-2013 (Table 11). Thus, the proportion of actual
strikes reported by each group of airports can be calculated by multiplying the fraction of total
aircraft movements by the reported strike rate or 0.195 * 42.312 + 0.805 * 14.494 = 19.906. If
both groups of Part 139 airports had reported strikes for all civil aircraft at the same rate as the 20
selected Part 139 airports (42.312), the respective proportions would have been 0.195 * 42.312 +
0.805 * 42.312 = 42.312. Therefore, based on the two assumptions above, it can be estimated
that 47% (100 * 19.906/42.312) of the known strikes involving all civil aircraft were reported at
the 504 Part 139 airports from 2009-2013 (Tables 11, 13).
Using the same assumptions and procedures, it can be estimated that 59% (100 * 0.853/1.436) of
the known damage strikes involving all civil aircraft were reported at the 504 Part 139 airports
from 2009-2013 (Tables 11, 13).
Furthermore, using the same assumptions and procedures, it can be calculated that 42% (100 *
10.958/26.333) of the known strikes and 50% (100 * 0.747/1.486) of the known damage strikes
involving all civil aircraft for the same 504 Part 139 airports were reported in 2004-2008 (Table
12). Thus, strike reporting for all civil aircraft at Part 139 airports increased from an estimated

Trends in strike reporting, 1990-2013 R. A. Dolbeer May 2015 10
42% to 47% and damage strike reporting increased from an estimated 50% to 59%, 2004-2008 to
2009-2013 (Table 13).
5.4.3 Comparison of strikes reported to ATO MOR system with strikes reported to NWSD
by other means
From January to September 2014, there were 2,914 reports in the ATO MOR system indicating a
bird strike (Table 14). Of these 2,914 strike reports, 765 (26%) had not been reported to the
NWSD by other means and thus were new strike reports that may not have been entered in the
NWSD otherwise. These 765 new reports represented 7% of the 10,422 strike reports entered in
the NWSD from January - September 2014. Of note, only 14 (1.8%) of these 765 new reports
indicated damage to the aircraft; thus these new MOR reports indicating damage represented
only 3.6% of the 391 reports indicating damage in the NWSD from January-September 2014.
None of the new damage reports from MOR indicated substantial damage to the aircraft.
Of the 2,149 MOR reports that covered strike events already entered in the NWSD, 1,423 (66%)
provided no new information and 726 reports (34%) provided additional information about the
strike event such as the registration number of aircraft, time of day, or distance from airport.
5.5 Strike reporting via multiple sources
Not only has there been a mean increase of 42% in the number of strike events reported from
2004-2008 to 2009-2013 (Table 2), but the number of strike events with multiple reports
submitted from independent sources has increased even more dramatically (Table 15). In 2004-
2008, 6,833 (19%) of the 36,496 strike events had multiple submissions that had to be processed
and reconciled before finalizing the entry into the NWSD. In 2009-2013, the number of strike
events with multiple reports submitted from various sources increased 2.4 fold to 16,280; 31% of
all strike events had multiple (2 to 9) reports submitted. Overall, an estimated 76,571 separate
reports had to be examined in 2009-2013 to finalize the entry of 51,904 strike events compared
to 47,757 reports for the 36,496 strike events in 2004-2008. Thus, while the number of reported
strike events increased by 42%, the number of strike reports examined increased by 60%.
This analysis (Table 15) also shows the greater reliance in recent years by groups such as airlines
and airports to use FAA Form 5200-7 to electronically report strikes as opposed to reporting the
strikes by other means. The proportion of strikes reported via Form 5200-7 increased from 70%
in 2004-2008 to 87% in 2009-2013 (91% in 2013).
5.6 Trend in number and percent of reported bird strikes that identify the species struck
There has been continued improvement in bird species identification in 2009-2013 compared to
2004-2008 and to previous years back to 1990 (Table 16, Figure 5). The mean number of bird
strikes in which the species was identified to species increased by 103% from 2,619/year in
2004-2008 to 5,324/year in 2009-2013. The percentage of all bird strikes in which the species
was identified increased from a mean of 37% in 2004-2008 to 53% in 2009-2013 (a record 60%
in 2013). Concurrently, the mean number of individual bird species identified as struck increased
by 48% from 191 species in 2004-2008 to 283 species in 2009-2013 (a record 312 species in
2013). From 1990-2013, 506 identified species of birds were involved in strikes with civil
aircraft of which 483 were species from North America and 23 were species struck by U.S.-
registered aircraft in locations outside North America (the 483 species represent about 75% of the
650 bird species found nesting in North America and 54% of the 900 species ever observed in
North America). Of the 483 identified bird species struck from North America, 456 (94%) are
Trends in strike reporting, 1990-2013 R. A. Dolbeer May 2015 11
species federally protected under the Migratory Bird Treaty Act. In addition, 19 species of bats,
42 species of terrestrial mammals, and 15 species of reptiles involved in strikes were identified
from 1990-2013 (Dolbeer et al. 2014a).
5.7 Actions by FAA to improve bird strike reporting, 2009-2013
5.7.1 Advisory Circulars (ACs)
AC 150/5200-32B “Reporting Wildlife Aircraft Strikes” was revised in May 2013 to include
an important addition:
“The effectiveness of a Wildlife Hazard Management Plan (WHMP) to reduce wildlife
hazards both on and near an airport and the reevaluation of all facets of damage/non-
damage strikes from year to year requires accurate and consistent reporting. Therefore,
every WHMP should include a commitment to document and report to the NWSD all
wildlife strikes that occur within the separation distances described in sections 1-2 and 1-
3 of Advisory Circular 150/5200-33, Hazardous Attractants On or Near Airports (current
version), to better identify, understand, and reduce threats to safe aviation.”
AC 150/5200-38 “Protocol for the conduct and review of Wildlife Hazard Site Visits,
Wildlife Hazard Assessments, and Wildlife Hazard Management Plans”. This AC, in final
draft stage to be published in 2015, contains a statement similar to that quoted above for AC
150/5200-32B that emphasizes a commitment to reporting all known strikes.
AC 150/5200-36A “Qualifications for Wildlife Biologist Conducting Wildlife Hazard
Assessments and Training Curriculums for Airport Personnel Involved in Controlling
Wildlife Hazards on Airports” was revised in January 2012. The AC requires that the NWSD
and strike reporting be a component of 1) the required annual recurrent training for all airport
employees involved in implementing an airport’s WHMP and 2) the curriculum for people
taking the 3-day FAA-approved course to become a “qualified airport biologist.” From 2009-
2013, approximately 300 people have taken an FAA-approved 3-day course to become a
“qualified airport biologist”.
5.7.2 FAA Air Traffic Organization (ATO) Mandatory Occurrence Reporting (MOR)
System
Under FAA Order JO 7210.632, (effective 30 Jan 2012), ATO personnel are required (Appendix
A-8 in the Order) to report all bird strikes of which they become aware. These reports are
entered in the MOR system and, as of January 2014, are being integrated into the NWSD if they
provide new information (as discussed in Section 5.4.2 above).
5.7.3 Memorandum of Understanding (MOU) between FAA and Bird Strike Committee-
USA (May 2012)
The International Civil Aviation Organization recommends (Chapter 2 in ICAO 2012) that each
member country establish a national committee to advise the Civil Aviation Authority and
aviation industry regarding wildlife risks. Bird Strike Committee-USA is an organization with
membership from various federal agencies, the aviation industry and other private-sector entities.
Among other activities, BSC-USA holds an annual meeting attended by over 300 people to
provide training and information exchange. A MOU between FAA and BSC-USA was initially
drafted in 2009 and signed in May 2012 to provide a formal means for FAA to receive assistance
from the membership of BSC-USA in the development and promotion of programs to mitigate

Trends in strike reporting, 1990-2013 R. A. Dolbeer May 2015 12
the risk of bird strikes. A primary objective of BSC-USA, as stated in the organization’s by-
laws, is to promote the collection and analysis of accurate wildlife strike data. Thus, BSC-USA
is providing active support to FAA in promoting accurate strike reporting by airports, pilots, air
carriers, and engine manufacturers. As one example, BSC-USA has distributed over 1,000 strike
reporting kits in the past 5 years which provide the supplies needed to collect bird strike remains
for submission to the Smithsonian Feather Lab for species identification. BSC-USA has also
participated as an exhibitor at numerous aviation industry conferences in the past five years to
promote the reporting of strikes.
5.7.4 FAA hired a second Wildlife Biologist
From the 1989 to 2009 the FAA had one Wildlife Biologist staff position at headquarters to
oversee the national program for mitigating the risks of wildlife strikes. In 2010, the FAA added
a second Wildlife Biologist staff position which has enhanced the various outreach and technical
assistance activities for Part 139 and especially NPIAS GA airports, as well as with airport
certification inspectors in each FAA region.
5.7.5 Wildlife Hazard Assessments (WHA), Wildlife Hazard Management Plans (WHMP)
Since 2009, the FAA has made a major effort to proactively ensure that all Part 139 airports
conduct a WHA and develop a WHMP, regardless if they have had a triggering event as defined
in 14 CFR Part 139.337. As of December 2014, all Part 139 airports have completed or are in
the process of initiating or conducting a WHA. For those airports that do not already have a
WHMP, WHMPs will be developed or modified based on the findings of the WHA. For NPIAS
GA airports, the FAA is presently developing a plan, as discussed in Dolbeer et al. 2014a, to
conduct site visits or WHAs for the over 2,700 NPIAS GA airports.
5.7.6 Accessibility of NWSD to aviation industry and general public for information
The NWSD was not accessible (without FAA permission and a password) from its initial
development in 1995 through 2008. Since 2009, the FAA has allowed open access to the
database; the contents of the database can now be examined and queried on-line or downloaded
for analysis by anyone.
In addition, the FAA has developed an on-line “Airport Wildlife Strike Summary and Risk
Analysis Report” for each Part 139 airport that is updated annually
http://wildlifecenter.pr.erau.edu/strikeInformation.php). Each custom report provides a summary
of strike data for the airport (on airport and off-airport strikes) in relation to regional and national
means for other Part 139 airports. The report also provides a simple wildlife species risk analysis
to assist in setting risk management priorities at the selected airport.
Finally, the FAA, in cooperation with USDA/WS, has continued to publish detailed annual
reports that summarize all the wildlife strike data from 1990 through the latest year. These
reports document trends in strikes, wildlife species posing the most and least risk, and estimates
of the strike-related economic losses.
5.7.7 Enhancement in on-line reporting
Since 2009, the FAA has made various enhancements to the on-line reporting system (Form
5200-7) including improved drop-down menus, a mobile device application, and the ability to
edit/update previously submitted strikes. These enhancements, combined with the open
accessibility of the database, the detailed annual reports, and on-line customized airport reports,
Trends in strike reporting, 1990-2013 R. A. Dolbeer May 2015 13
have led to a greater use of the on-line system to report strikes and edit/update strike reports as
new information becomes available.
6. DISCUSSION
6.1 Reported strikes and damage strikes for all airport and aircraft types by birds,
terrestrial mammals, bats, reptiles
This analysis demonstrated a significant increase in reporting in 2009-2013 compared to previous
years for strikes involving all four wildlife types. Overall, reported strikes involving all species
increased by a mean of 42 percent in 2009-2013 compared to 2004-2008. The fact that during
this time period reported strikes with damage increased by only 1% clearly documents that the
risk caused by wildlife strikes is not increasing; rather, the increase in reported strikes indicates
that airports, pilots and commercial aviation, in general, are doing a better job of documenting
wildlife that are struck. The stabilization of strikes with damage in spite of a 42% increase in
reported strikes is even more remarkable when one considers that 17 of the 21 species of birds in
North America with mean body masses >4 lbs (1.8 kg) and at least 10 strikes with civil aircraft
showed population increases from 1990-2012 with a net gain of 17 million birds (Dolbeer and
Begier 2013, Dolbeer et al. 2014b). This pattern in strike reporting is likely due to the continuing
improvement in WHMPs at Part 139 (and some NPIAS GA) airports nationwide that result in 1)
a better documentation of all wildlife strikes and 2) mitigation efforts focused on the larger, more
hazardous species (Dolbeer et al. 2014b). The fact that the mean biomass of bird species
involved in reported strikes has declined by 31% from 2004-2009 to 2009-2013 (and by over
50% since the mid-1990s) also supports this hypothesis of an increased rate of reporting of all
strikes, most of which involve smaller birds that cause no damage.
6.2 Reported strikes and damage strikes for all aircraft by airport type, 2009-2013
compared to 2004-2008
The pattern of a major increase in reported strikes and the lack of an increase in strikes with
damage for wildlife type discussed above were also shown for all airport types. In contrast to the
substantial increase of 43% in reported strikes at Part 139 airports in 2009-2013 compared to
2004-2008, the mean number of damage strikes at Part 139 airports showed a 2% decline.
NPIAS GA airports, which showed a 61% increase in reported strikes in 2009-2013 compared to
2004-2008, showed only a 5% increase in damage strikes. Incidences of aborted take-offs and
precautionary landings after wildlife strikes also showed declines at Part 139 airports and no
change at NPIAS GA airports in 2009-2013 compared to 2004-2008. These data also support the
hypothesis that the major increases in reported strikes with little or no increase in damage strikes,
aborted take-offs and precautionary landings are indicators of improved wildlife mitigation
efforts at airports directed at species of higher risk (i.e., more likely to cause damage) and a
greater attention to reporting all known wildlife strikes.
6.3 Strike rates for commercial and GA aircraft at Part 139 and NPIAS GA airports, 2009-
2013 compared to 2004-2008
Because commercial aircraft movements at Part 139 airports declined by an average of 13% in
2009-2013 compared to 2004-2008 and the number of reported strikes for commercial aircraft
increased by 46%, the reported strike rate increased by 67%. In contrast to the 67% increase in
the reported strike rate, the damage strike rate increased by only 12%.
Trends in strike reporting, 1990-2013 R. A. Dolbeer May 2015 14
The pattern for GA aircraft at NPIAS GA airports was similar. Because GA aircraft movements
at NPIAS GA airports declined by an average of 8% in 2009-2013 compared to 2004-2008 and
the number of reported strikes for GA aircraft increased by 43%, the strike rate increased by
55%. In contrast to the 55% increase in the reported strike rate, the damage strike rate increased
23%.
6.4 Estimated percent of strikes involving commercial aircraft reported at Part 139 airports
Based on the comparison of reported strike rates at 20 airports known to do a thorough job of
documenting all known strikes with the strike rates at 484 other Part 139 airports, strike reporting
for commercial aircraft at Part 139 airports increased from 79% to 91% and damage strike
reporting increased from 78% to 93%, 2004-2008 to 2009-2013.
It is important to note that these estimates do not include some unknown number of non-damage
strikes that are never noticed (e.g., events in which small passerine species [e.g., warblers,
sparrows, swallows] are blown through the by-pass of large turbofan engines or bounce off the
fuselage or landing gear), even at the airports that work closely with the air carriers to do the
most thorough job of documenting strikes. Thus, actual strike numbers may be much higher than
what is reported. However, these unknown strikes are not important relative to airport WHMPs
and are irrelevant from a risk perspective for civil aircraft.
The estimated 79% and 91% reporting rates of known strikes for commercial aircraft at Part 139
airports in 2004-2008 and 2009-2013, respectively, are higher than the estimated 39% reporting
rate derived for 2004-2008 in the previous analysis (Dolbeer (2009a). However, this previous
estimate of 39% for 2004-2008 used all strikes and all movements for GA and commercial
aircraft. When I included GA movements and strikes in the present analysis (Tables 11, 12), I
obtained a 42% reporting rate for 2004-2008 which was similar to the 39% rate obtained in the
previous (Dolbeer 2009a) study. The combination of 1) a 46% increase in strike reporting for
commercial aircraft at Part 139 airports in 2009-2013 compared to 2004-2008, and 2) the
exclusion of GA aircraft (which have a much lower reporting rate [Dolbeer 2009a]) from the
analysis resulted in the higher estimates of strike reporting for commercial aircraft in this present
analysis.
The analysis of reports involving bird strikes gathered through the mandatory ATO MOR system
from January-September 2014 is supportive of the 91% reporting rate for commercial aircraft at
Part 139 airports. The MOR system provided 7% more strikes to the NWSD, but added only
3.6% more damage strikes (all minor).
6.5 Reporting via multiple sources
The fact that from 2004-2008 to 2009-2013 there was a 2.4-fold increase in the number of strike
events with multiple reports submitted from independent sources documents the increased
participation by the aviation community as a whole to ensure that strike events are reported to the
FAA NWSD. Multiple submissions of a strike often provide a more complete documentation of
the event, but these submissions also often require considerable time to process, resolve
conflicting information, and ensure that single strike events are not entered into the NWSD as
duplicates. Whereas the number of strike events reported in 2009-2013 increased by 42%
compared to 2004-2008, the number of individual strike reports examined increased by 60%
because of multiple reporting.
Trends in strike reporting, 1990-2013 R. A. Dolbeer May 2015 15
This analysis also showed that the efforts by FAA to improve on-line reporting are working for
user groups such as airlines and airports. The proportion of strikes reported electronically via
Form 5200-7 increased from 70% in 2004-2008 to 87% in 2009-2013 (91% in 2013).
6.6 Trend in number and percent of reported bird strikes that identify the species struck
The continued improvement in bird species identification in 2009-2013 compared to 2004-2008
and to previous years back to 1990 is significant. Support provided by the FAA to the
Smithsonian Feather Lab for identification of bird strike remains using feather remains and DNA
analysis (Dove et al, 2008) has been a major factor in this improvement. Species identification,
when coupled with data on location, phase of flight, height above ground level, aircraft model
and speed, and aircraft parts struck and damaged, provide the foundation for understanding and
mitigating the risk of bird and other wildlife strikes. The quality and completeness of
information provided with each strike report is more important than the mere quantity of strike
reports that are filed. Without accurate and relevant information, strike reports are of limited
usefulness as has been shown with other national and military databases.
6.7 Actions by FAA to improve bird strike reporting, 2009-2013
The various actions undertaken by the FAA, in partnership with BSC-USA, USDA/WS, and
various private-sector and aviation industry groups as outlined in Section 5.7 above, have all
enhanced the quantity and quality of reporting of wildlife strikes involving civil aircraft. Of
significant note is the inclusion of statements in revised Advisory Circulars to emphasize a
commitment to reporting all known strikes. Although these statements in ACs do not (and
cannot) mandate the reporting of strikes, they provide clear guidance that strike reporting is a
critical component of every WHMP. WHMPs, once approved by an FAA Airport Certification
Inspector, are a part of each Part 139 airport’s certification manual.
Another significant development was FAA Order JO 7210.632 (effective 30 Jan 2012) which
requires ATO personnel to report all bird strikes of which they become aware. These reports are
entered in the MOR system and, as of January 2014, are being integrated into the NWSD if they
provide new information (as discussed in Section 5.4.2).
Also, the open accessibility of the NWSD to the aviation industry and general public for
information and analysis, the availability of on-line customized “Airport Wildlife Strike
Summary and Risk Analysis Reports” for each Part 139 airport, and enhancements in on-line
reporting have all contributed to a greater public and industry awareness of the usefulness and
importance of the database.
7. CONCLUSIONS AND RECOMMENDATIONS
1) Based on a) the significant positive trend observed in overall strike reporting from 1990
to 2013, and especially since 2008, b) the decline or stabilization in damage strikes since
2000, c) the implementation of professionally run wildlife hazard programs at many Part
139 airports throughout the U.S. that are reporting all known strikes, and d) the significant
improvement in species identification, I conclude that the current overall reporting rate,
estimated at 91% for all known strikes events involving commercial aircraft at Part 139
airports, is adequate to track national and regional trends in wildlife strikes, determine the
hazard level of wildlife species that are being struck, and to provide a scientific
foundation for FAA policies and guidance regarding the mitigation of risk from wildlife
strikes. The NWSD also provides a means for Part 139 airports to monitor and evaluate
Trends in strike reporting, 1990-2013 R. A. Dolbeer May 2015 16
the effectiveness of their WHMPs through “Airport Wildlife Strike Summary and Risk
Analysis Reports” that are generated annually. The database is presently (2013) capturing
over 11,000 strike events per year involving over 300 species of birds and other wildlife
(142,675 strikes involving over 500 species of birds and 76 species of other wildlife from
1990-2013).
2) Given the positive trends and levels in reporting and species identification coupled with
the decline or stabilization in damage strikes, I do not recommend mandatory reporting
other than what is already required under ATO Order JO 7210.632 at this time to achieve
the objectives of the database. I conclude the reporting procedures in place are fully
compliant with the ICAO standard regarding the establishment of a national procedure for
recording and reporting wildlife strikes (ICAO 2013).
3) If the FAA were to consider mandatory reporting beyond what is now required (which I
do not recommend at this time based on the findings in this report), careful thought would
be required regarding:
a) precisely who would be required to report a strike? Would ATO, pilots, airline and
airport operations, engine manufacturers, and repair facilities all be required to
report a strike of which they become aware and would this include GA pilots and
airports?
b) what details of each strike event would be required and who would be responsible
for collecting and sending the information to the NWSD in a coherent format that
resolved conflicting information? Would it be required to only report that the strike
happened or would all known details be mandatory, including costs and sending
remains to Smithsonian Feather Lab for identification?
c) who would be responsible for enforcement and what actions would be taken for
non-compliance? and,
d) what benefits would be gained over the level of reporting now in place?
4) The FAA needs to sustain the momentum that has been generated in the past 5 years to
ensure that strike reporting continues to be a priority at Part 139 airports and for air
carriers using those airports. Specific recommendations include:
a) an emphasis on not just reporting strike events but in providing all known details of
each event to enhance the usefulness of each report;
b) use of the “Airport Wildlife Strike Summary and Risk Analysis Reports” by FAA
Airport Certification Inspectors during annual inspections to ensure each Part 139
airport is reporting strikes, getting species identified when possible, and using the
information to evaluate and adjust the airport’s WHMP under a Safety Management
System; and,
c) continued work with the commercial air transport industry to ensure that strikes
recorded by air carriers that may not be noted by operations personnel at airports or
ATO are entered into the NWSD. It is in the air carriers’ self-interest that all strikes
associated with airports (approach, landing, taxi, take-off, and climb) be entered in
the NWSD so that mitigation efforts at those airports can be implemented to prevent
future strikes.
Trends in strike reporting, 1990-2013 R. A. Dolbeer May 2015 17
5) The FAA needs to sustain the momentum that has been generated in the past 5 years to
ensure that strike reporting continues to increase at NPIAS GA airports. The planned
conduct of site visits and WHAs at these airports, as outlined in section 5.7.5 above, is
critical to achieve this objective.
6) The FAA should continue publishing annual wildlife strike reports to document trends
and characteristics of strikes to civil aircraft. These detailed analyses provide current
information to the aviation industry and public regarding efforts to mitigate the risk of
wildlife strikes and publicize the usefulness of the NWSD. As a bonus, these detailed
annual analyses provide a means to check the database for errors or inconsistencies in
records.
7) A follow-up study should be conducted in 5 years to determine trends in strike reporting
and if additional measures, such as mandatory reporting beyond what is now required,
need to be reconsidered.
Acknowledgments
I thank S. Wright, P. Miller, M. Begier, and T. DeVault, USDA/WS, for advice and reviews in
the preparation of this report. I also acknowledge the following people who provided valuable
input by serving on a panel discussion regarding mandatory versus voluntary strike reporting at
the 2014 Bird Strike Committee-USA meeting in Atlanta, Georgia: C. Boyles, Dallas-Fort Worth
International Airport; A. de Hoon, Netherlands Ministry of Defense; C. Dove, Smithsonian
Institution; S. Foskey, Delta Airlines; S. Jangelis, Air Lines Pilots Association; L. McVey,
General Electric Aircraft Engines; R. Nicholson, Boeing Aircraft Company; D. Sullivan, U.S.
Air Force; and J. Weller, FAA. I also thank E. Louie, FAA, for providing the ATO MOR reports.
The findings and conclusions expressed do not necessarily reflect current FAA policy decisions
regarding the reporting of wildlife strikes or the control of wildlife on or near airports. Data
presented regarding specific airports, air carriers, and other entities does not reflect on the quality
or adequacy of programs and policies in place to mitigate the risk of wildlife strikes.

Trends in strike reporting, 1990-2013 R. A. Dolbeer May 2015 18
8. LITERATURE CITED
Alsop, F. J., III. 2001. Birds of North America, Eastern Region (751 pages), Western Region
(752 pages). DK Publishing, Inc., New York, New York, USA.
Begier, M. J., and R. A. Dolbeer. 2015. Protecting the flying public and minimizing economic
losses within the aviation industry: assistance provided by USDA-APHIS-Wildlife Services
to reduce wildlife hazards to aviation, fiscal year 2014. Special report, U.S. Department of
Agriculture, Animal and Plant Health Inspection Service, Wildlife Services. Washington,
D.C., USA. 17 pages.
Cleary, E. C., and R. A. Dolbeer. 2005. Wildlife hazard management at airports, a manual for
airport operators. Second edition. Federal Aviation Administration, Office of Airport Safety
and Standards, Washington, D.C., USA. 348 pages. (http://wildlife-mitigation.tc.faa.gov).
Dolbeer, R. A. 2009a. Trends in wildlife strike reporting, Part 1—voluntary system, 1990-2008.
U.S. Department of Transportation, Federal Aviation Administration, Office of Research and
Technology Development, DOT/FAA/AR/09/65. Washington D.C., USA. 20 pages.
Dolbeer, R. A. 2009b. Wildlife strike reporting, Part 2—sources of data in voluntary system.
U.S. Department of Transportation, Federal Aviation Administration, Office of Research and
Technology Development, DOT/FAA/AR/09/63. Washington D.C., USA. 37 pages.
Dolbeer, R. A., and M. J. Begier. 2012. Comparison of wildlife strike data among airports to
improve aviation safety. Proceedings of the 30th International Bird Strike Committee
meeting. Stavanger, Norway.
Dolbeer, R. A., and M. J. Begier. 2013. Population trends for large bird species in North America
in relation to aircraft engine standards. Bird Strike Committee-USA meeting, Milwaukee,
Wisconsin, USA.
Dolbeer, R. A., J. L. Seubert, and M. J. Begier. 2014b. Population trends of resident and
migratory Canada geese in relation to strikes with civil aircraft. Human-Wildlife Interactions
8 (1): 88 - 99.
Dolbeer, R. A., and S. E. Wright. 2009. Safety Management Systems: how useful will the FAA
National Wildlife Strike Database be? Human-Wildlife Conflicts 3(2):167-178.
Dolbeer, R. A., S. E. Wright, and E. C. Cleary. 1995. Bird and other wildlife strikes to civilian
aircraft in the United States, 1994. Interim report, DTFA01-91-Z-02004. U.S. Department
of Agriculture, for Federal Aviation Administration, FAA Technical Center, Atlantic City,
New Jersey, USA. 38 pages.
Dolbeer, R. A., S. E. Wright, and P. Eschenfelder. 2005. Animal ambush at the airport: the need
to broaden ICAO standards for bird strikes to include terrestrial wildlife. Pages 102-113 in
Proceedings of the 27th
International Bird Strike Committee meeting (Volume 1). Athens,
Greece.
Dolbeer, R. A., S. E. Wright, J. Weller, and M. J. Beiger. 2014a. Wildlife strikes to civil aircraft
in the United States, 1990-2013. U.S. Department of Transportation, Federal Aviation
Administration, Office of Airport Safety and Standards, Serial Report No. 20, Washington,
DC., USA. 98 pages.

Trends in strike reporting, 1990-2013 R. A. Dolbeer May 2015 19
Dove C. J., N. Rotzel, M. Heacker, and L. A. Weigt. 2008. Using DNA barcodes to identify bird
species involved in birdstrikes. Journal of Wildlife Management 72:1231–1236.
Dunning, J. B., Jr. (Editor). 2007. CRC handbook of avian body masses. CRC Press. Boca
Raton, Florida, USA. 655 pages.
FAA. 2014a. 14CFR Part 139-certificated airports. Federal Aviation Administration,
Washington, D.C., USA.
(http://www.faa.gov/airports_airtraffic/airports/airport_safety/part139_cert/media/part139_ce
rt_status_table.xls).
FAA. 2014b. National Plan of Integrated Airport Systems (NPIAS). 2013-2017 NPIAS Report.
http://www.faa.gov/airports/planning_capacity/npias/reports/
FAA. 2014c. Terminal area forecast (TAF) system. Federal Aviation Administration.
Washington, D.C., USA. (http://aspm.faa.gov/main/taf.asp).
ICAO. 2012. Airport services manual, Part 3. Wildlife control and reduction. 4th edition.
Document 9137, AN/898. International Civil Aviation Organization. Montreal, Canada.
ICAO. 2013. Annex 14, Aerodromes —Volume I, Aerodrome design and operations.
International standards and recommended practices. 6th edition. International Civil Aviation
Organization. Montreal, Canada.
Marra, P. P., C. J. Dove, R. A. Dolbeer, N. F. Dahlan, M. Heacker, J. F. Whatton, N. E. Diggs,
C. France, and G. A. Henkes. 2009. Migratory Canada geese cause crash of US Airways
Flight 1549. Frontiers in Ecology and the Environment. 7(6): 297-301.
National Transportation Safety Board. 2010. Loss of thrust in both engines after encountering a
flock of birds and subsequent ditching on the Hudson River, US Airways Flight 1549, Airbus
A320-214, N106US, Weehawken, New Jersey, January 15, 2009. Aircraft Accident Report
NTSB/AAR-10 /03. Washington, D.C., USA.
Robbins, C. S., B. Bruun, and H. S. Zim. 1983. A guide to identification: Birds of North
America. Golden Press. New York, New York, USA. 360 pages.
Steele, R. G. D., and J. H. Torre. 1960. Principles and procedures of statistics. McGraw-Hill
Book Company, New York, New York, USA. 481 pages.
Trends in strike reporting, 1990-2013 R. A. Dolbeer May 2015 20
Tables
Table 1. Number of reported wildlife strikes to civil aircraft by wildlife type, 1990–2013 (see
Figures 1 and 2).
Year Birds Bats
Terrestrial
mammalsa
Reptilesa
Total
strikes
Strikes with
damage
1990 1,795 4 52 0 1,851 372
1991 2,336 3 54 0 2,393 401
1992 2,499 2 73 1 2,575 368
1993 2,504 6 66 0 2,576 399
1994 2,554 2 82 1 2,639 462
1995 2,675 5 84 8 2,772 498
1996 2,852 1 91 3 2,947 505
1997 3,353 1 95 14 3,463 581
1998 3,688 3 111 7 3,809 587
1999 5,020 7 96 1 5,124 707
2000 5,866 16 123 3 6,008 764
2001 5,676 8 138 8 5,830 649
2002 6,098 19 118 15 6,250 674
2003 5,886 20 127 5 6,038 635
2004 6,409 27 129 6 6,571 628
2005 7,090 27 131 7 7,255 609
2006 7,053 49 140 10 7,252 598
2007 7,536 53 172 7 7,768 571
2008 7,416 46 183 5 7,650 529
2009 9,229 67 230 10 9,536 607
2010 9,557 113 246 11 9,927 599
2011 9,773 139 198 15 10,125 542
2012 10,530 165 203 19 10,917 611
2013 10,937 226 203 33 11,399 605
Total 138,332 1,009 3,145 189 142,675 13,501
a For terrestrial mammals and reptiles, species with body masses <1 kilogram (2.2 pounds) are
excluded from database (Dolbeer et al. 2005).
Trends in strike reporting, 1990-2013 R. A. Dolbeer May 2015 21
Table 2. Mean number of reported strikes and strikes with damage per year involving birds, bats,
terrestrial mammals, and reptiles for 2009-2013 compared to 2004-2008, all civil aircraft.
Reported strikes Reported strikes with damage
Type of
wildlife
2004-
2008
2009-
2013
Net
change
2004-
2008
2009-
2013
Net
change
Birds 7,101 10,005 2,904 (41%) 547 564 17 (3%)
Bats 40 142 102 (252%) 1 1 0 (0%)
Terrestrial
mammals 151 216 65 (43%) 40 28 -12 (-30%)
Reptiles 7 18 11 (151%) 0 0 0 (0%)
Total 7,299 10,381 3,082 (42%) 587 593 6 (+1%)
Table 3. Mean number of bird strikes reported per year in which bird was identified to
species or species group and mean biomass of bird species involved in those strikes for 2009-
2013 compared to 2004-2008 (see Figure 2).
Years
Bird strikes
reporteda
Mean bird
biomass (g)b
2009-2013 6,125 365
2004-2008 3,335 528
Net change 2,790 (84%) -163 (-31%)
a Strikes with unknown bird (bird not identified to species or species group) were excluded
from this analysis.
b For each species, the mean biomass of the heaviest sex was used, or if sex was unknown,
the mean biomass of all birds in sample (Dunning 2007). For birds identified only to species
group (e.g., gull, duck, goose), the mean biomass of all species in database within that group,
weighted by numbers struck, was used.

Trends in strike reporting, 1990-2013 R. A. Dolbeer May 2015 22
Table 4. Mean number of airports reporting strikes per year and mean number of strikes reported
per year by type of civil airport for 2009-2013 compared to 2004-2008.a
Airports with reported strikes Strikes reported
Type of
civil airport
2004-
2008
2009-
2013
Net
change
2004-
2008
2009-
2013
Net
change
P139 322 375 58 (17%) 5,971 8,599 2,588 (43%)
NPIAS GA 148 203 55 (37%) 296 476 180 (61%)
Other GA 18 38 20 (114%) 23 51 28 (123%)
All USA 488 615 127 (26%) 6,290 9,086 2,796 (45%)
Foreign 76 97 21 (27%) 167 243 76 (46%)
All airports 564 772 148 (26%) 6,457 9,329 2,872 (45%)
All airports
+ enroute 7,299 10,381 3,081 (42%)
a These numbers include strikes by all aircraft types at each type of airport. Tables 7 and 8,
which calculate strikes/100,000 movements, include only strikes by commercial and GA aircraft,
respectively.
Trends in strike reporting, 1990-2013 R. A. Dolbeer May 2015 23
Table 5. Mean number of airports reporting damage strikes per year and mean number of strikes
with damage reported per year by type of civil airport for 2009-2013 compared to 2004-2008a.
Airports with reported
damage strikes
Damage strikes
reported
Type of
civil airport
2004-
2008
2009-
2013
Net
change
2004-
2008
2009-
2013
Net
change
P139 148 147 -1 (-1%) 358 352 -6 (-2%)
NPIAS GA 72 80 8 (11%) 85 89 4 (5%)
Other GA 9 9 0 (0%) 10 10 0 (0%)
All USA 229 236 7 (3%) 453 451 -2 (-<1%)
Foreign 16 17 1 (12%) 17 19 2 (13%)
All airports 245 253 8 (3%) 470 470 0 (0%)
All airports
+ enroute 587 593 6 (1%)
a These numbers include strikes by all aircraft types at each type of airport. Tables 7 and 8,
which calculate strikes/100,000 movements, include only strikes by commercial and GA aircraft,
respectively.

Trends in strike reporting, 1990-2013 R. A. Dolbeer May 2015 24
Table 6. Mean number of wildlife-induced aborted take-offs and precautionary landings per
year at Part 139 and NPIAS GA airports for 2009-2013 compared to 2004-2008 (see Figure
A3 for trend analysis, 1990-2013).
Aborted take-offsa
Precautionary landingsb
Years
Part 139
airports
NPIAS GA
airports
Part 139
airports
NPIAS GA
airports
2009-2013 57 20 152 41
2004-2008 68 19 167 42
Net change -11 (-16%) 1 (5%) -15 (-9%) -1 (-2%)
a Pilot initiated take-off run but then aborted take-off after aircraft struck or encountered wildlife
on runway.
b Pilot completed take-off but returned to land at departure airport or at an “other-than-
destination” airport after strike.

Trends in strike reporting, 1990-2013 R. A. Dolbeer May 2015 25
Table 7. Mean number of commercial aircraft movements at Part 139 airports and mean number
of strikes and strike rates for commercial aircraft in 2009-2013 compared to 2004-2008.
Commercial
aircraft
movements
(x 1 million)
Number
of strikes
Strikes/100,000
movements
Years
All
strikes
Damage
strikes
All
strikes
Damage
strikes
2009-2013 22.53 8,132 281 36.086 1.245
2004-2008 25.78 5,572 286 21.614 1.109
Net change -3.25
(-13%)
2,560
(46%)
-5
(-2%)
14.472
(67%)
0.136
(12%)
Table 8. Mean number of General Aviation (GA) aircraft movements at NPIAS GA airports
and mean number of strikes and strike rates for GA aircraft in 2009-2013 compared to 2004-
2008.
Number
of strikes
Strikes/100,000
movements
Years
GA aircraft
movements
(x 1 million)
All
strikes
Damage
strikes
All
strikes
Damage
strikes
2009-2013 52.61 279 82 0.531 0.156
2004-2008 57.04 196 73 0.343 0.127
Net change -4.43
(-8%)
83
(43%)
9
(13%)
0.188
(55%)
0.029
(23%)
Trends in strike reporting, 1990-2013 R. A. Dolbeer May 2015 1
Table 9. Comparison of mean wildlife strikes per 100,000 aircraft movements for commercial
aircraft in 2009-2013 for 20 Part 139-certificated airports with well-established wildlife hazard
management programs compared to the mean strike rates for 484a other Part 139 airports.
Part 139
airports
Aircraft
movements/year
Mean reported
strike rateb
Mean reported
damage strike rateb
ORD 860,108 25.532 0.977
DFW 646,100 52.035 1.052
DEN 614,535 71.957 1.367
LAX 564,582 17.748 1.027
PHX 428,286 15.083 0.467
MSP 417,048 23.690 1.247
JFK 406,056 49.451 2.167
EWR 405,934 32.123 1.281
LGA 361,280 38.087 1.218
BOS 347,590 29.805 1.093
SEA 311,367 26.014 0.963
IAD 309,862 26.205 1.355
MCO 292,919 49.843 3.414
SLC 288,429 52.491 3.467
MEM 284,283 61.910 2.322
BWI 250,280 40.675 1.598
PDX 193,885 41.158 1.135
CLE 181,564 58.381 0.661
MCI 135,577 100.312 2.065
OKC 61,641 88.253 0.649
Totals: above 20
Part 139 airports 7,361,327 (32.7%) 45.038
c 1.476
c
Totals: 484 other
Part 139 airports 15,151,778 (67.3%) 38.916
c 1.323
c
Totals: all 504
Part 139 airports 22,534,437 (100%) 40.917
d 1.373
d
a 35 Part 139 airports that averaged <1,000 commercial aircraft movements/year, 2009-2013 were
excluded from the analysis. These airports had <0.1% of the total commercial aircraft movements at Part
139 airports, 2009-2013. b Strikes per 100,000 aircraft movements = 100,000 * the sum of all strikes (or damage strikes)/total
movements, 2009-2013. c Mean strike rate (damage strike rate) for the 20 and 484 airports, respectively.
d Fraction of aircraft movements * strike rate (or damage strike rate) for the 20 selected airports + fraction
of aircraft movements * strike rate (or damage strike rate) for the 484 other airports (see sections 5.4.1
and 5.4.2 in text).
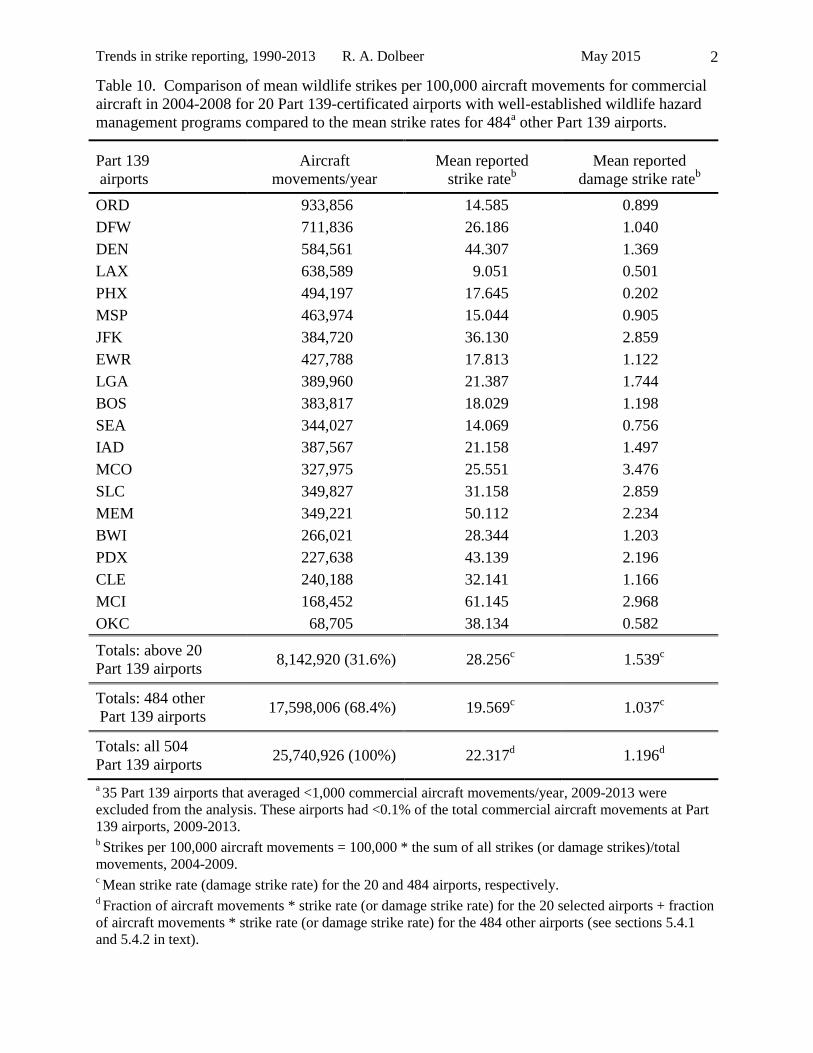
Trends in strike reporting, 1990-2013 R. A. Dolbeer May 2015 2
Table 10. Comparison of mean wildlife strikes per 100,000 aircraft movements for commercial
aircraft in 2004-2008 for 20 Part 139-certificated airports with well-established wildlife hazard
management programs compared to the mean strike rates for 484a other Part 139 airports.
Part 139
airports
Aircraft
movements/year
Mean reported
strike rateb
Mean reported
damage strike rateb
ORD 933,856 14.585 0.899
DFW 711,836 26.186 1.040
DEN 584,561 44.307 1.369
LAX 638,589 9.051 0.501
PHX 494,197 17.645 0.202
MSP 463,974 15.044 0.905
JFK 384,720 36.130 2.859
EWR 427,788 17.813 1.122
LGA 389,960 21.387 1.744
BOS 383,817 18.029 1.198
SEA 344,027 14.069 0.756
IAD 387,567 21.158 1.497
MCO 327,975 25.551 3.476
SLC 349,827 31.158 2.859
MEM 349,221 50.112 2.234
BWI 266,021 28.344 1.203
PDX 227,638 43.139 2.196
CLE 240,188 32.141 1.166
MCI 168,452 61.145 2.968
OKC 68,705 38.134 0.582
Totals: above 20
Part 139 airports 8,142,920 (31.6%) 28.256
c 1.539
c
Totals: 484 other
Part 139 airports 17,598,006 (68.4%) 19.569
c 1.037
c
Totals: all 504
Part 139 airports 25,740,926 (100%) 22.317
d 1.196
d
a 35 Part 139 airports that averaged <1,000 commercial aircraft movements/year, 2009-2013 were
excluded from the analysis. These airports had <0.1% of the total commercial aircraft movements at Part
139 airports, 2009-2013. b Strikes per 100,000 aircraft movements = 100,000 * the sum of all strikes (or damage strikes)/total
movements, 2004-2009. c Mean strike rate (damage strike rate) for the 20 and 484 airports, respectively.
d Fraction of aircraft movements * strike rate (or damage strike rate) for the 20 selected airports + fraction
of aircraft movements * strike rate (or damage strike rate) for the 484 other airports (see sections 5.4.1
and 5.4.2 in text).
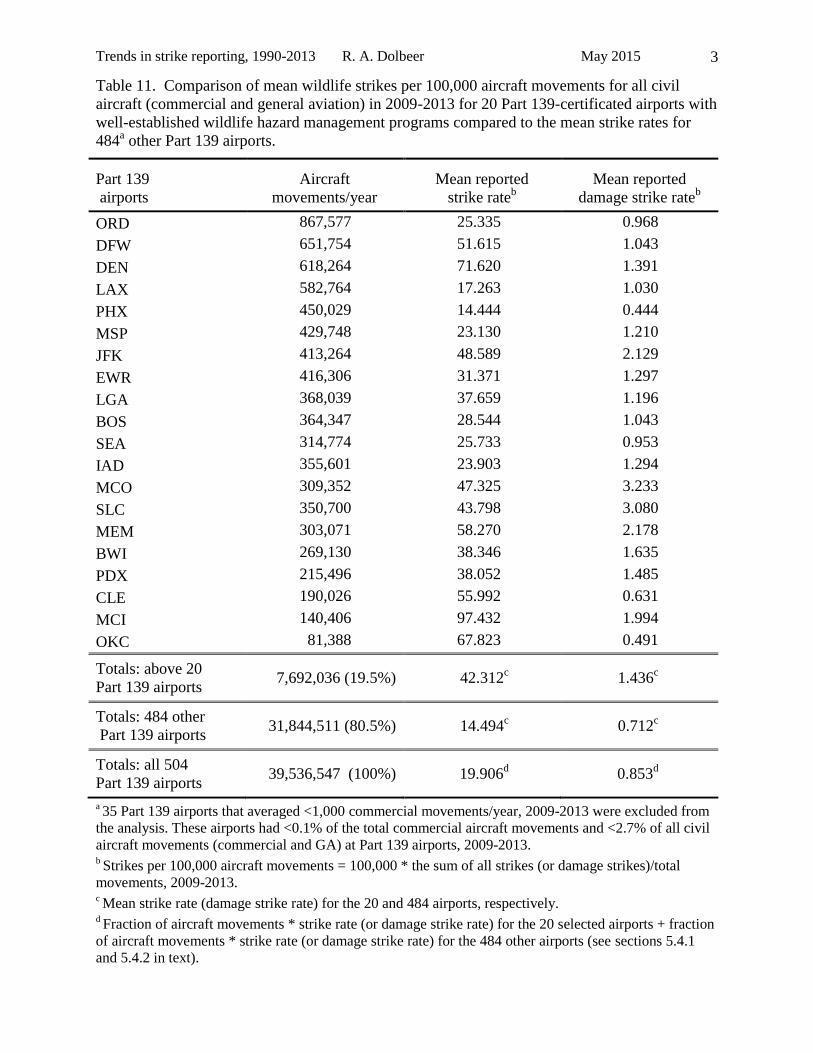
Trends in strike reporting, 1990-2013 R. A. Dolbeer May 2015 3
Table 11. Comparison of mean wildlife strikes per 100,000 aircraft movements for all civil
aircraft (commercial and general aviation) in 2009-2013 for 20 Part 139-certificated airports with
well-established wildlife hazard management programs compared to the mean strike rates for
484a other Part 139 airports.
Part 139
airports
Aircraft
movements/year
Mean reported
strike rateb
Mean reported
damage strike rateb
ORD 867,577 25.335 0.968
DFW 651,754 51.615 1.043
DEN 618,264 71.620 1.391
LAX 582,764 17.263 1.030
PHX 450,029 14.444 0.444
MSP 429,748 23.130 1.210
JFK 413,264 48.589 2.129
EWR 416,306 31.371 1.297
LGA 368,039 37.659 1.196
BOS 364,347 28.544 1.043
SEA 314,774 25.733 0.953
IAD 355,601 23.903 1.294
MCO 309,352 47.325 3.233
SLC 350,700 43.798 3.080
MEM 303,071 58.270 2.178
BWI 269,130 38.346 1.635
PDX 215,496 38.052 1.485
CLE 190,026 55.992 0.631
MCI 140,406 97.432 1.994
OKC 81,388 67.823 0.491
Totals: above 20
Part 139 airports 7,692,036 (19.5%) 42.312
c 1.436
c
Totals: 484 other
Part 139 airports 31,844,511 (80.5%) 14.494
c 0.712
c
Totals: all 504
Part 139 airports 39,536,547 (100%) 19.906
d 0.853
d
a 35 Part 139 airports that averaged <1,000 commercial movements/year, 2009-2013 were excluded from
the analysis. These airports had <0.1% of the total commercial aircraft movements and <2.7% of all civil
aircraft movements (commercial and GA) at Part 139 airports, 2009-2013. b Strikes per 100,000 aircraft movements = 100,000 * the sum of all strikes (or damage strikes)/total
movements, 2009-2013. c Mean strike rate (damage strike rate) for the 20 and 484 airports, respectively.
d Fraction of aircraft movements * strike rate (or damage strike rate) for the 20 selected airports + fraction
of aircraft movements * strike rate (or damage strike rate) for the 484 other airports (see sections 5.4.1
and 5.4.2 in text).
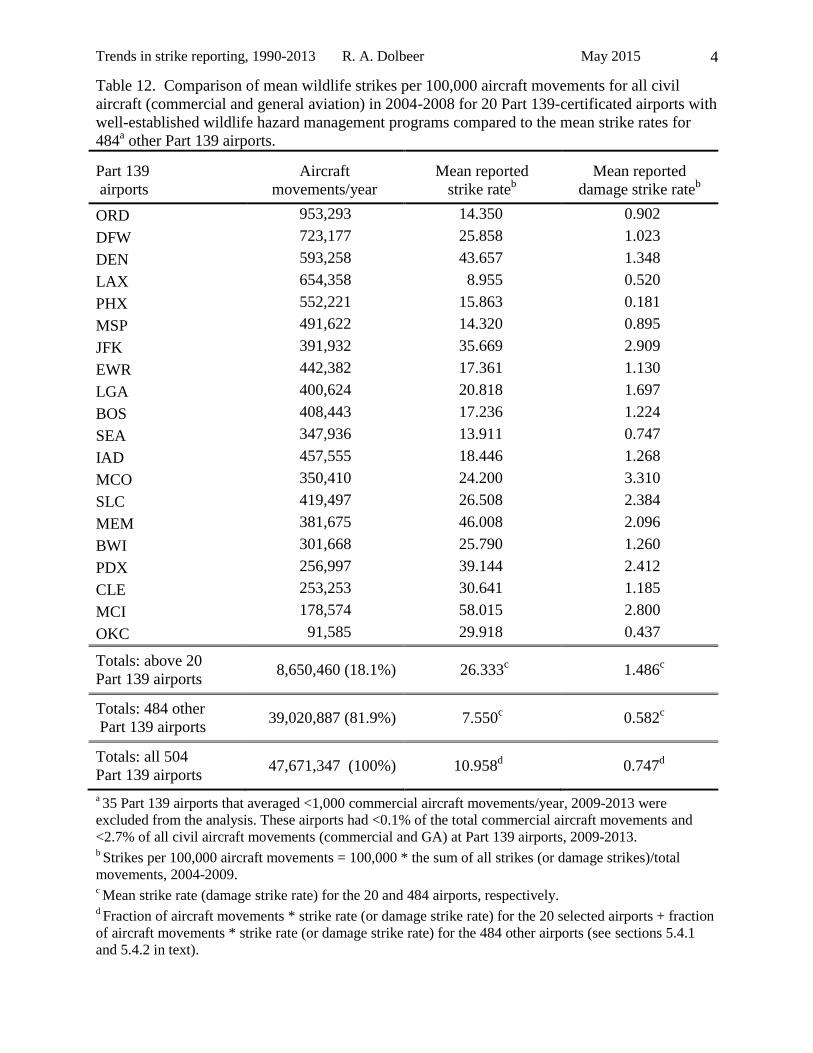
Trends in strike reporting, 1990-2013 R. A. Dolbeer May 2015 4
Table 12. Comparison of mean wildlife strikes per 100,000 aircraft movements for all civil
aircraft (commercial and general aviation) in 2004-2008 for 20 Part 139-certificated airports with
well-established wildlife hazard management programs compared to the mean strike rates for
484a other Part 139 airports.
Part 139
airports
Aircraft
movements/year
Mean reported
strike rateb
Mean reported
damage strike rateb
ORD 953,293 14.350 0.902
DFW 723,177 25.858 1.023
DEN 593,258 43.657 1.348
LAX 654,358 8.955 0.520
PHX 552,221 15.863 0.181
MSP 491,622 14.320 0.895
JFK 391,932 35.669 2.909
EWR 442,382 17.361 1.130
LGA 400,624 20.818 1.697
BOS 408,443 17.236 1.224
SEA 347,936 13.911 0.747
IAD 457,555 18.446 1.268
MCO 350,410 24.200 3.310
SLC 419,497 26.508 2.384
MEM 381,675 46.008 2.096
BWI 301,668 25.790 1.260
PDX 256,997 39.144 2.412
CLE 253,253 30.641 1.185
MCI 178,574 58.015 2.800
OKC 91,585 29.918 0.437
Totals: above 20
Part 139 airports 8,650,460 (18.1%) 26.333
c 1.486
c
Totals: 484 other
Part 139 airports 39,020,887 (81.9%) 7.550
c 0.582
c
Totals: all 504
Part 139 airports 47,671,347 (100%) 10.958
d 0.747
d
a 35 Part 139 airports that averaged <1,000 commercial aircraft movements/year, 2009-2013 were
excluded from the analysis. These airports had <0.1% of the total commercial aircraft movements and
<2.7% of all civil aircraft movements (commercial and GA) at Part 139 airports, 2009-2013. b Strikes per 100,000 aircraft movements = 100,000 * the sum of all strikes (or damage strikes)/total
movements, 2004-2009. c Mean strike rate (damage strike rate) for the 20 and 484 airports, respectively.
d Fraction of aircraft movements * strike rate (or damage strike rate) for the 20 selected airports + fraction
of aircraft movements * strike rate (or damage strike rate) for the 484 other airports (see sections 5.4.1
and 5.4.2 in text).
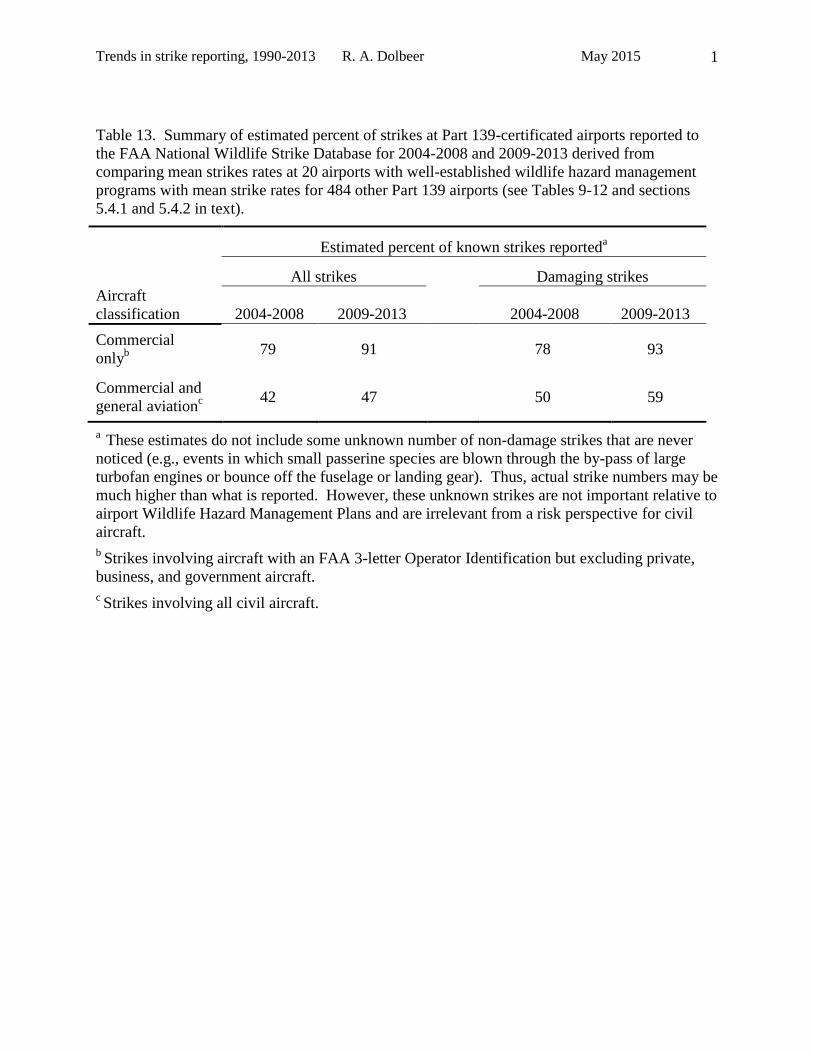
Trends in strike reporting, 1990-2013 R. A. Dolbeer May 2015 1
Table 13. Summary of estimated percent of strikes at Part 139-certificated airports reported to
the FAA National Wildlife Strike Database for 2004-2008 and 2009-2013 derived from
comparing mean strikes rates at 20 airports with well-established wildlife hazard management
programs with mean strike rates for 484 other Part 139 airports (see Tables 9-12 and sections
5.4.1 and 5.4.2 in text).
Estimated percent of known strikes reported
a
All strikes Damaging strikes
Aircraft
classification 2004-2008 2009-2013 2004-2008 2009-2013
Commercial
onlyb 79 91 78 93
Commercial and
general aviationc 42 47 50 59
a These estimates do not include some unknown number of non-damage strikes that are never
noticed (e.g., events in which small passerine species are blown through the by-pass of large
turbofan engines or bounce off the fuselage or landing gear). Thus, actual strike numbers may be
much higher than what is reported. However, these unknown strikes are not important relative to
airport Wildlife Hazard Management Plans and are irrelevant from a risk perspective for civil
aircraft.
b Strikes involving aircraft with an FAA 3-letter Operator Identification but excluding private,
business, and government aircraft.
c Strikes involving all civil aircraft.
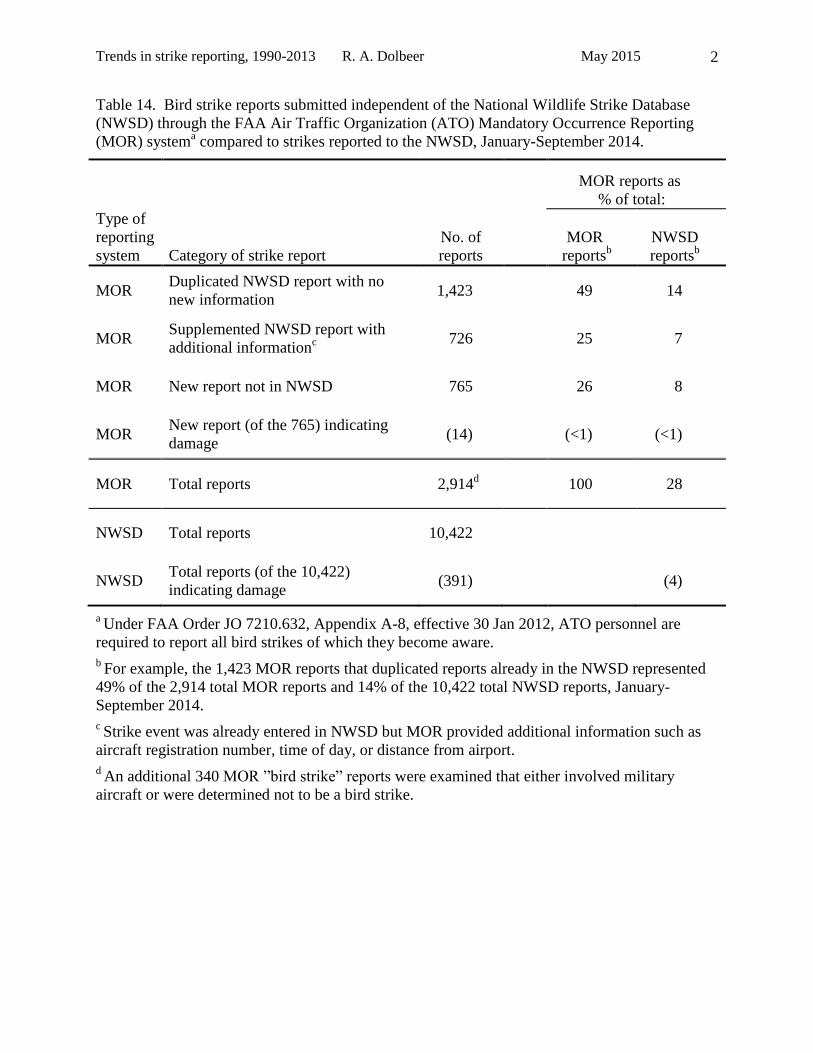
Trends in strike reporting, 1990-2013 R. A. Dolbeer May 2015 2
Table 14. Bird strike reports submitted independent of the National Wildlife Strike Database
(NWSD) through the FAA Air Traffic Organization (ATO) Mandatory Occurrence Reporting
(MOR) systema compared to strikes reported to the NWSD, January-September 2014.
MOR reports as
% of total:
Type of
reporting
system Category of strike report
No. of
reports
MOR
reportsb
NWSD
reportsb
MOR Duplicated NWSD report with no
new information 1,423
49 14
MOR Supplemented NWSD report with
additional informationc 726
25 7
MOR New report not in NWSD 765
26 8
MOR New report (of the 765) indicating
damage (14)
(<1) (<1)
MOR Total reports 2,914d
100 28
NWSD Total reports 10,422
NWSD Total reports (of the 10,422)
indicating damage (391)
(4)
a Under FAA Order JO 7210.632, Appendix A-8, effective 30 Jan 2012, ATO personnel are
required to report all bird strikes of which they become aware.
b For example, the 1,423 MOR reports that duplicated reports already in the NWSD represented
49% of the 2,914 total MOR reports and 14% of the 10,422 total NWSD reports, January-
September 2014.
c Strike event was already entered in NWSD but MOR provided additional information such as
aircraft registration number, time of day, or distance from airport.
d An additional 340 MOR ”bird strike” reports were examined that either involved military
aircraft or were determined not to be a bird strike.
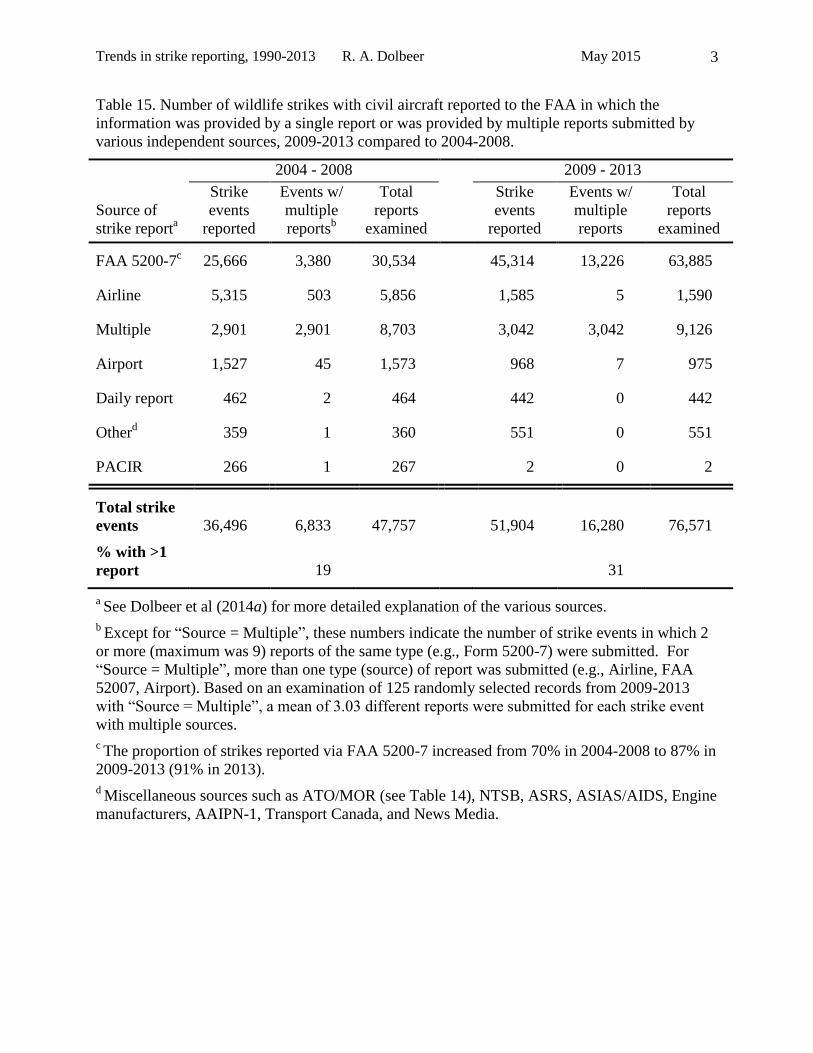
Trends in strike reporting, 1990-2013 R. A. Dolbeer May 2015 3
Table 15. Number of wildlife strikes with civil aircraft reported to the FAA in which the
information was provided by a single report or was provided by multiple reports submitted by
various independent sources, 2009-2013 compared to 2004-2008.
2004 - 2008
2009 - 2013
Source of
strike reporta
Strike
events
reported
Events w/
multiple
reportsb
Total
reports
examined
Strike
events
reported
Events w/
multiple
reports
Total
reports
examined
FAA 5200-7c
25,666 3,380 30,534
45,314 13,226 63,885
Airline 5,315 503 5,856
1,585 5 1,590
Multiple 2,901 2,901 8,703
3,042 3,042 9,126
Airport 1,527 45 1,573
968 7 975
Daily report 462 2 464
442 0 442
Otherd
359 1 360
551 0 551
PACIR 266 1 267
2 0 2
Total strike
events 36,496 6,833 47,757
51,904 16,280 76,571
% with >1
report 19
31
a See Dolbeer et al (2014a) for more detailed explanation of the various sources.
b Except for “Source = Multiple”, these numbers indicate the number of strike events in which 2
or more (maximum was 9) reports of the same type (e.g., Form 5200-7) were submitted. For
“Source = Multiple”, more than one type (source) of report was submitted (e.g., Airline, FAA
52007, Airport). Based on an examination of 125 randomly selected records from 2009-2013
with “Source = Multiple”, a mean of 3.03 different reports were submitted for each strike event
with multiple sources.
c The proportion of strikes reported via FAA 5200-7 increased from 70% in 2004-2008 to 87% in
2009-2013 (91% in 2013).
d Miscellaneous sources such as ATO/MOR (see Table 14), NTSB, ASRS, ASIAS/AIDS, Engine
manufacturers, AAIPN-1, Transport Canada, and News Media.
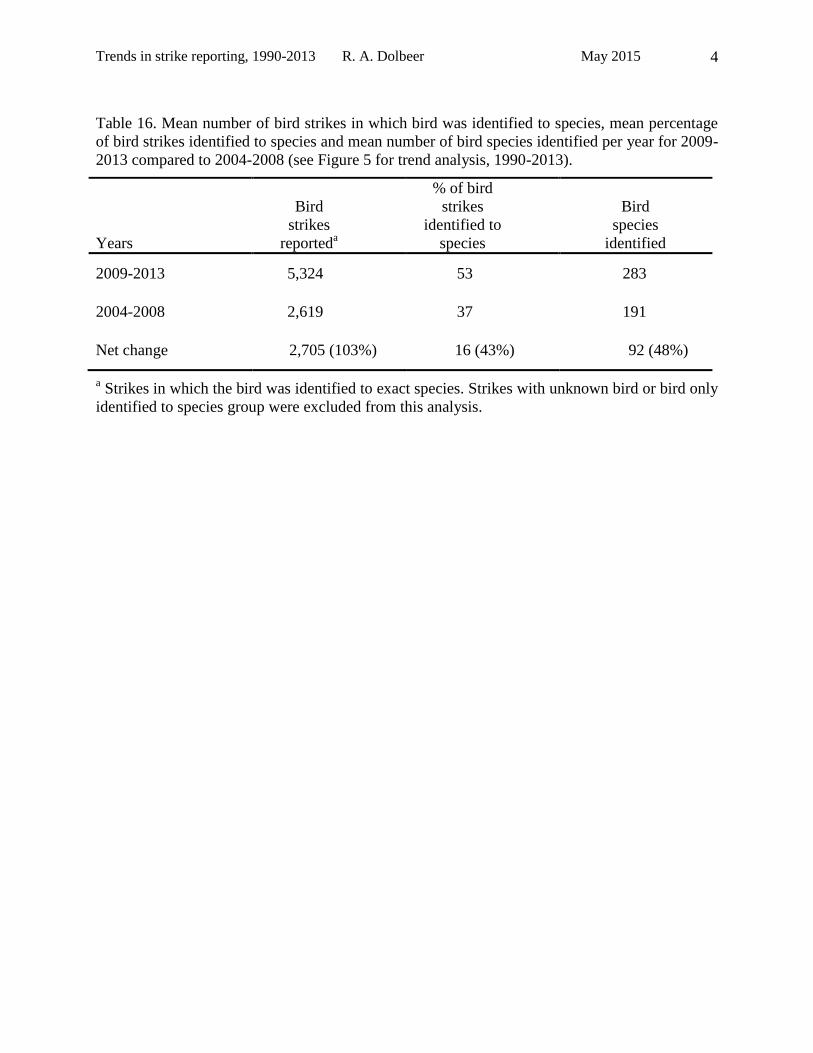
Trends in strike reporting, 1990-2013 R. A. Dolbeer May 2015 4
Table 16. Mean number of bird strikes in which bird was identified to species, mean percentage
of bird strikes identified to species and mean number of bird species identified per year for 2009-
2013 compared to 2004-2008 (see Figure 5 for trend analysis, 1990-2013).
Years
Bird
strikes
reporteda
% of bird
strikes
identified to
species
Bird
species
identified
2009-2013 5,324 53 283
2004-2008 2,619 37 191
Net change 2,705 (103%) 16 (43%) 92 (48%)
a Strikes in which the bird was identified to exact species. Strikes with unknown bird or bird only
identified to species group were excluded from this analysis.
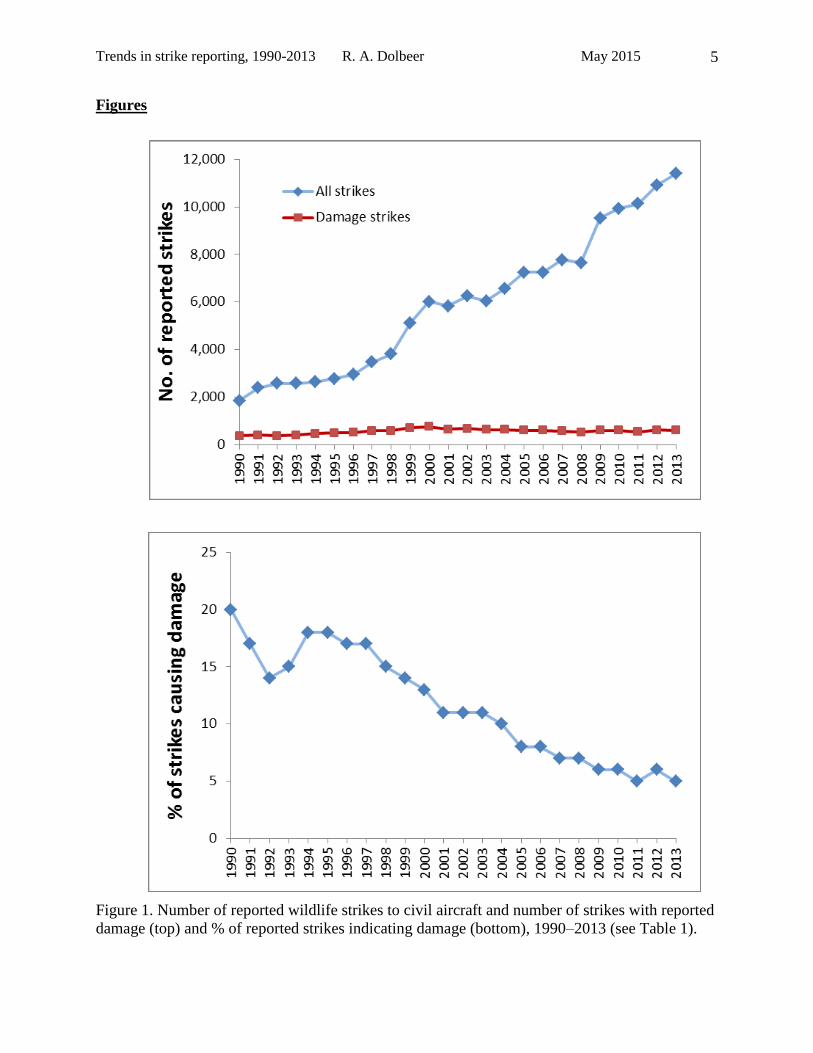
Trends in strike reporting, 1990-2013 R. A. Dolbeer May 2015 5
Figures
Figure 1. Number of reported wildlife strikes to civil aircraft and number of strikes with reported
damage (top) and % of reported strikes indicating damage (bottom), 1990–2013 (see Table 1).
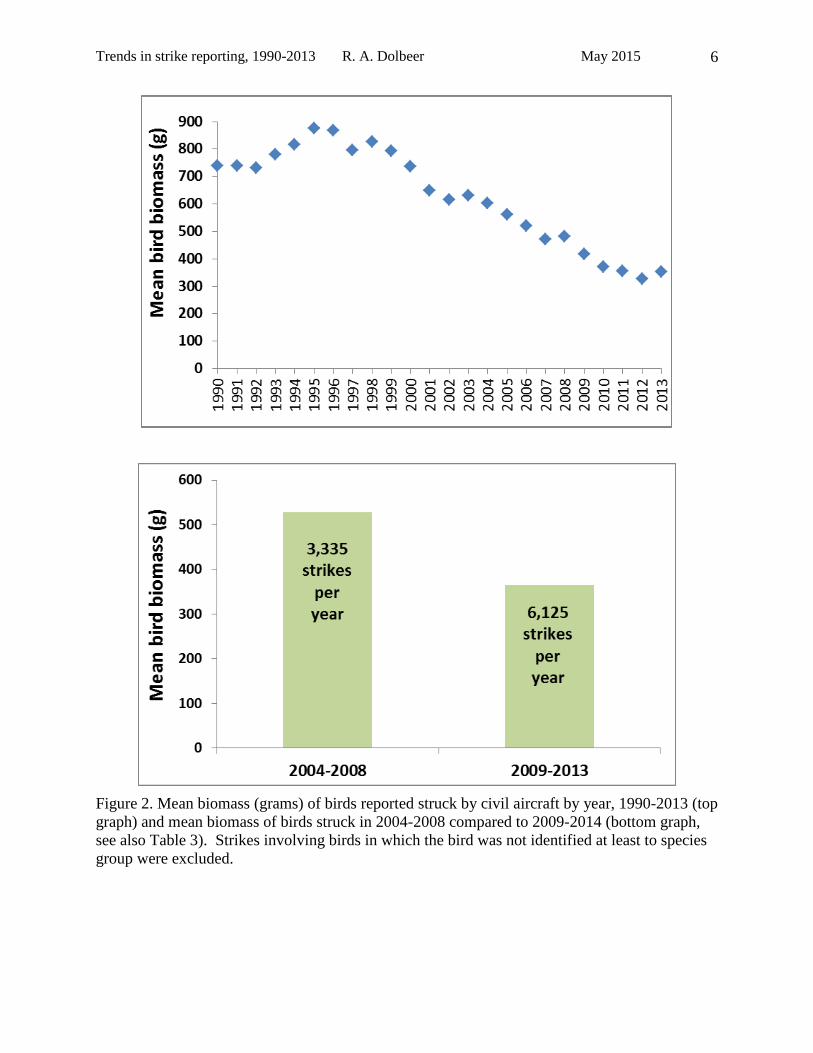
Trends in strike reporting, 1990-2013 R. A. Dolbeer May 2015 6
Figure 2. Mean biomass (grams) of birds reported struck by civil aircraft by year, 1990-2013 (top
graph) and mean biomass of birds struck in 2004-2008 compared to 2009-2014 (bottom graph,
see also Table 3). Strikes involving birds in which the bird was not identified at least to species
group were excluded.
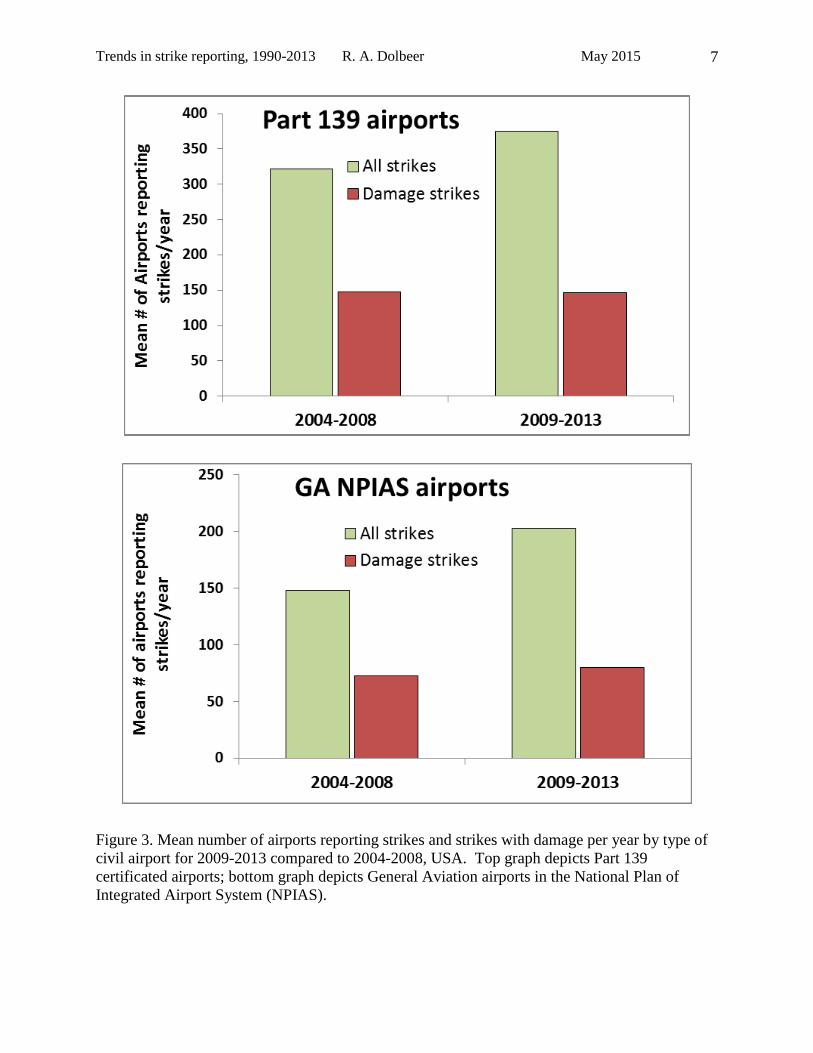
Trends in strike reporting, 1990-2013 R. A. Dolbeer May 2015 7
Figure 3. Mean number of airports reporting strikes and strikes with damage per year by type of
civil airport for 2009-2013 compared to 2004-2008, USA. Top graph depicts Part 139
certificated airports; bottom graph depicts General Aviation airports in the National Plan of
Integrated Airport System (NPIAS).
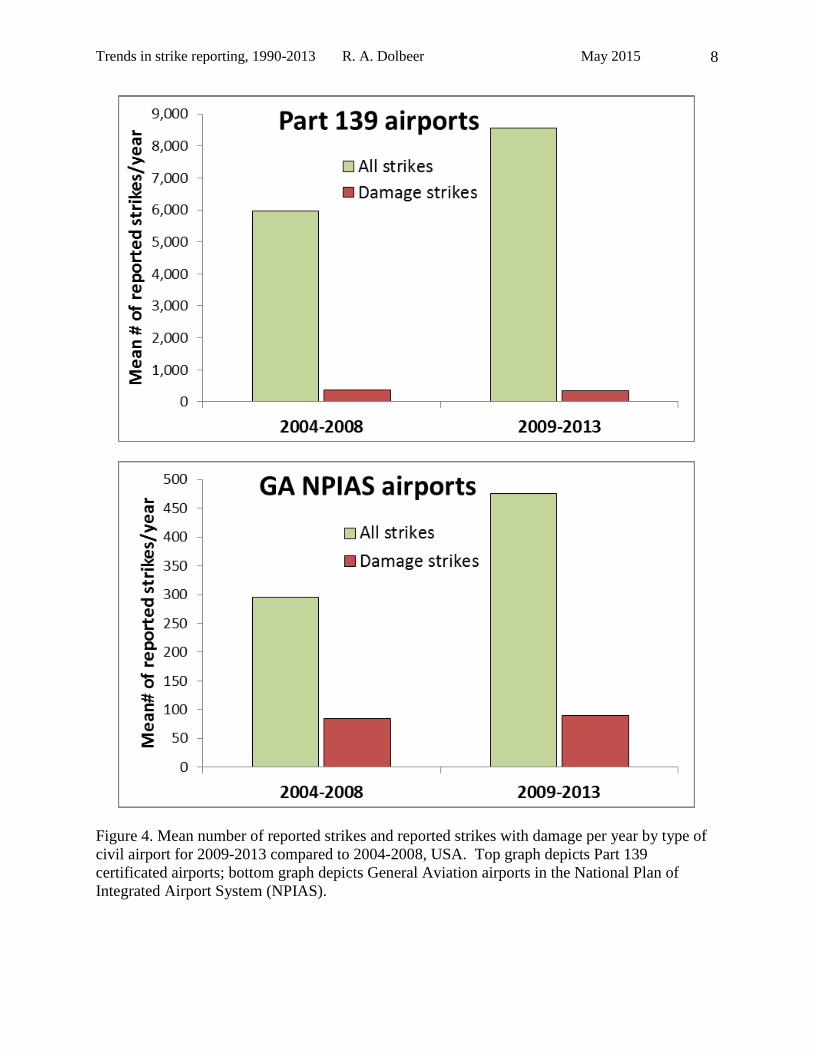
Trends in strike reporting, 1990-2013 R. A. Dolbeer May 2015 8
Figure 4. Mean number of reported strikes and reported strikes with damage per year by type of
civil airport for 2009-2013 compared to 2004-2008, USA. Top graph depicts Part 139
certificated airports; bottom graph depicts General Aviation airports in the National Plan of
Integrated Airport System (NPIAS).
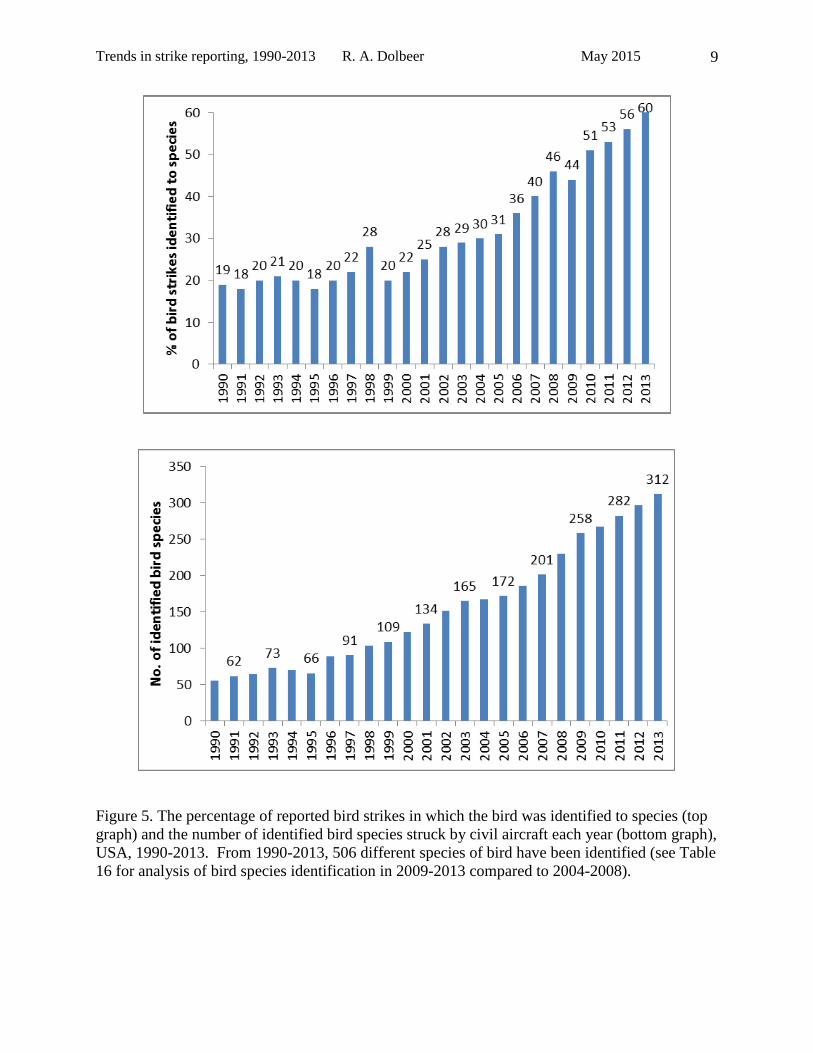
Trends in strike reporting, 1990-2013 R. A. Dolbeer May 2015 9
Figure 5. The percentage of reported bird strikes in which the bird was identified to species (top
graph) and the number of identified bird species struck by civil aircraft each year (bottom graph),
USA, 1990-2013. From 1990-2013, 506 different species of bird have been identified (see Table
16 for analysis of bird species identification in 2009-2013 compared to 2004-2008).

Trends in strike reporting, 1990-2013 R. A. Dolbeer May 2015
Appendix A 10
APPENDIX A. Trends in wildlife strikes, 1990 – 2013
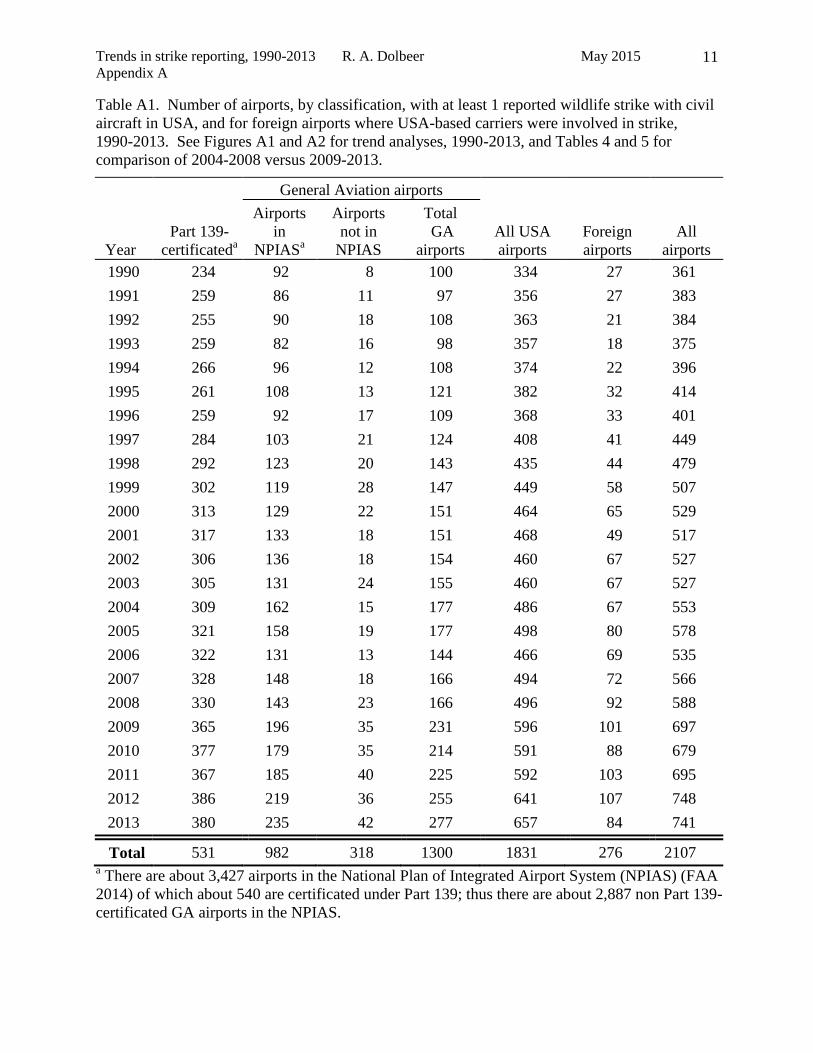
Trends in strike reporting, 1990-2013 R. A. Dolbeer May 2015
Appendix A 11
Table A1. Number of airports, by classification, with at least 1 reported wildlife strike with civil
aircraft in USA, and for foreign airports where USA-based carriers were involved in strike,
1990-2013. See Figures A1 and A2 for trend analyses, 1990-2013, and Tables 4 and 5 for
comparison of 2004-2008 versus 2009-2013.
General Aviation airports
Year
Part 139-
certificateda
Airports
in
NPIASa
Airports
not in
NPIAS
Total
GA
airports
All USA
airports
Foreign
airports
All
airports
1990 234 92 8 100 334 27 361
1991 259 86 11 97 356 27 383
1992 255 90 18 108 363 21 384
1993 259 82 16 98 357 18 375
1994 266 96 12 108 374 22 396
1995 261 108 13 121 382 32 414
1996 259 92 17 109 368 33 401
1997 284 103 21 124 408 41 449
1998 292 123 20 143 435 44 479
1999 302 119 28 147 449 58 507
2000 313 129 22 151 464 65 529
2001 317 133 18 151 468 49 517
2002 306 136 18 154 460 67 527
2003 305 131 24 155 460 67 527
2004 309 162 15 177 486 67 553
2005 321 158 19 177 498 80 578
2006 322 131 13 144 466 69 535
2007 328 148 18 166 494 72 566
2008 330 143 23 166 496 92 588
2009 365 196 35 231 596 101 697
2010 377 179 35 214 591 88 679
2011 367 185 40 225 592 103 695
2012 386 219 36 255 641 107 748
2013 380 235 42 277 657 84 741
Total 531 982 318 1300 1831 276 2107 a There are about 3,427 airports in the National Plan of Integrated Airport System (NPIAS) (FAA
2014) of which about 540 are certificated under Part 139; thus there are about 2,887 non Part 139-
certificated GA airports in the NPIAS.
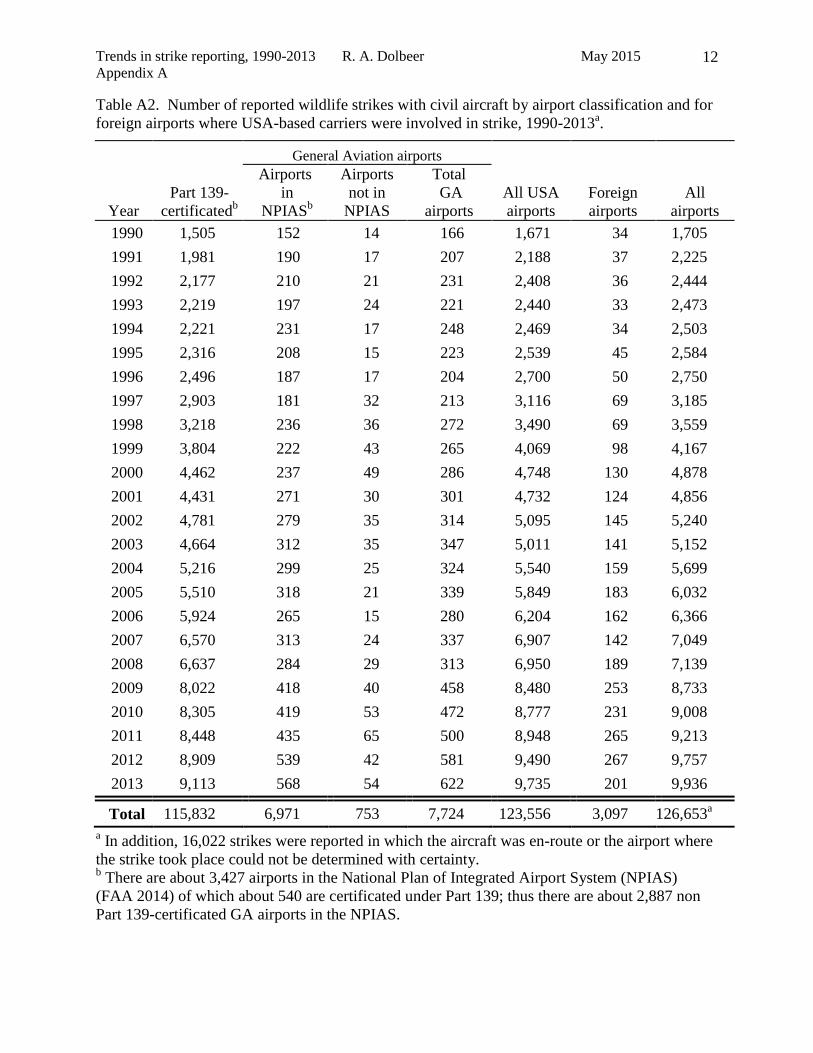
Trends in strike reporting, 1990-2013 R. A. Dolbeer May 2015
Appendix A 12
Table A2. Number of reported wildlife strikes with civil aircraft by airport classification and for
foreign airports where USA-based carriers were involved in strike, 1990-2013a.
General Aviation airports
Year
Part 139-
certificatedb
Airports
in
NPIASb
Airports
not in
NPIAS
Total
GA
airports
All USA
airports
Foreign
airports
All
airports
1990 1,505 152 14 166 1,671 34 1,705
1991 1,981 190 17 207 2,188 37 2,225
1992 2,177 210 21 231 2,408 36 2,444
1993 2,219 197 24 221 2,440 33 2,473
1994 2,221 231 17 248 2,469 34 2,503
1995 2,316 208 15 223 2,539 45 2,584
1996 2,496 187 17 204 2,700 50 2,750
1997 2,903 181 32 213 3,116 69 3,185
1998 3,218 236 36 272 3,490 69 3,559
1999 3,804 222 43 265 4,069 98 4,167
2000 4,462 237 49 286 4,748 130 4,878
2001 4,431 271 30 301 4,732 124 4,856
2002 4,781 279 35 314 5,095 145 5,240
2003 4,664 312 35 347 5,011 141 5,152
2004 5,216 299 25 324 5,540 159 5,699
2005 5,510 318 21 339 5,849 183 6,032
2006 5,924 265 15 280 6,204 162 6,366
2007 6,570 313 24 337 6,907 142 7,049
2008 6,637 284 29 313 6,950 189 7,139
2009 8,022 418 40 458 8,480 253 8,733
2010 8,305 419 53 472 8,777 231 9,008
2011 8,448 435 65 500 8,948 265 9,213
2012 8,909 539 42 581 9,490 267 9,757
2013 9,113 568 54 622 9,735 201 9,936
Total 115,832 6,971 753 7,724 123,556 3,097 126,653a
a In addition, 16,022 strikes were reported in which the aircraft was en-route or the airport where
the strike took place could not be determined with certainty. b There are about 3,427 airports in the National Plan of Integrated Airport System (NPIAS)
(FAA 2014) of which about 540 are certificated under Part 139; thus there are about 2,887 non
Part 139-certificated GA airports in the NPIAS.

Trends in strike reporting, 1990-2013 R. A. Dolbeer May 2015
Appendix A 13
Figure A1. Number of airports with at least 1 reported wildlife strike for Part 139-certificated
airports (top graph), and for General Aviation [GA]) airports that are a part of the National Plan
of Integrated Airport System (NPIAS) and for other GA airports that are not in NPIAS (bottom
graph), 1990-2013 (see Table 4 and Table A1). R2 values >0.163 (22 df) are significant (Steele
and Torre 1960).

Trends in strike reporting, 1990-2013 R. A. Dolbeer May 2015
Appendix A 14
Figure A2. Number of reported wildlife strikes for Part 139-certificated airports (top graph), and
for General Aviation [GA]) airports that are a part of the National Plan of Integrated Airport
System (NPIAS) and for other GA airports that are not in NPIAS (bottom graph), 1990-2013
(see Table 4 and Table A2). R2 values > 0.163 (22 df) are significant (Steele and Torre 1960).
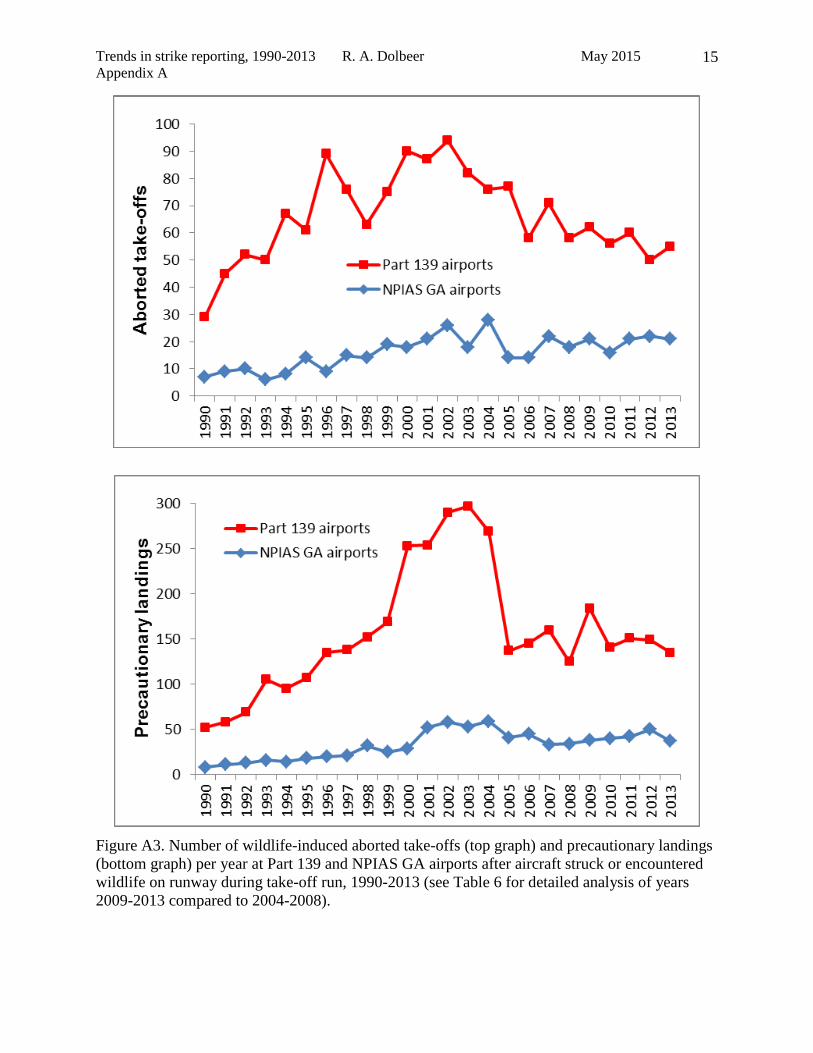
Trends in strike reporting, 1990-2013 R. A. Dolbeer May 2015
Appendix A 15
Figure A3. Number of wildlife-induced aborted take-offs (top graph) and precautionary landings
(bottom graph) per year at Part 139 and NPIAS GA airports after aircraft struck or encountered
wildlife on runway during take-off run, 1990-2013 (see Table 6 for detailed analysis of years
2009-2013 compared to 2004-2008).