Trends in Public Transportation Ridership: Implications ... · 6 Jonathan Richmond, “A...
19
Trends in Public Transportation Ridership: Implications for Federal Policy William J. Mallett Specialist in Transportation Policy March 26, 2018 Congressional Research Service 7-5700 www.crs.gov R45144
-
Upload
trinhhuong -
Category
Documents
-
view
213 -
download
0
Transcript of Trends in Public Transportation Ridership: Implications ... · 6 Jonathan Richmond, “A...
Trends in Public Transportation Ridership:
Implications for Federal Policy
William J. Mallett
Specialist in Transportation Policy
March 26, 2018
Congressional Research Service
7-5700
www.crs.gov
R45144
Trends in Public Transportation Ridership: Implications for Federal Policy
Congressional Research Service
Summary Despite significant investments in public transportation at the federal, state, and local levels,
transit ridership has fallen in many of the top 50 transit markets. If strong gains in the New York
area are excluded, ridership nationally declined by 7% over the past decade. This report examines
the implications for federal transit policy of the current weakness and possible future changes in
transit ridership.
Although there has been a lot of research into the factors that explain transit ridership, there
seems to be no comprehensive explanation for the recent decline. One complication is that
national trends in public transportation ridership are not necessarily reflected at the local level;
thus, different areas may have different reasons for growth or decline. But at the national level,
the two factors that most affect public transportation ridership are competitive factors and the
supply of transit service. Several competitive factors, notably the drop in the price of gasoline
over the past few years and the growing popularity of bikeshare and ridesourcing services, appear
to have adversely affected transit ridership. The amount of transit service supplied has generally
grown over time, but average fares have risen faster than inflation, possibly deterring riders.
The future of public transportation ridership in the short to medium term is likely to depend on
population growth; the public funding commitment to supplying transit; and factors that make
driving more or less attractive, such as the price of parking, the extent of highway congestion, and
the implementation of fuel taxes, tolls, and mileage-based user fees. Over the long term, ridership
is also likely to depend on the introduction of autonomous vehicle technology, although its timing
is uncertain. Fleets of driverless taxis that can be hailed with a smartphone, a plausible scenario,
promise to be much cheaper than taxis and ridesourcing today. Widespread deployment of
driverless taxis could reduce transit ridership, unless restrictions or fees make them an expensive
alternative in some areas.
Two major federal transit policies related to these issues are the general funding of public
transportation, distributed mainly by formula, and the discretionary funding of new large capital
projects such as rail and bus rapid transit systems through the Capital Investment Grant (CIG)
Program, also known as New Starts. One option to boost ridership without raising funding would
be to tie federal formula funds to ridership or fare revenue. If the most consequential uncertainty
for transit ridership is the introduction of autonomous vehicles, federal funding might focus on
buses, which last about 10 years, and not new rail systems that last 30 years or more. Another
option would be to redirect CIG funding from building new rail systems and lines to refurbishing
rail transit in the large and dense cities where rail transit currently carries large numbers of riders.
If fully autonomous ridesourcing vehicles become available, policymakers may face pressure to
subsidize ridesourcing trips for disabled and elderly passengers alongside or in place of
traditional transit and paratransit services.
Trends in Public Transportation Ridership: Implications for Federal Policy
Congressional Research Service
Contents
Introduction ..................................................................................................................................... 1
Trends in Public Transportation Ridership ...................................................................................... 1
Factors Affecting Public Transportation Ridership ......................................................................... 5
Transportation Options .............................................................................................................. 5 Public Transportation Service Supply ....................................................................................... 8 Economics, Population, and Urban Geography ........................................................................ 9
The Future of Public Transportation Ridership ............................................................................. 10
Implications for Federal Policy ..................................................................................................... 13
Federal Public Transportation Funding ................................................................................... 13 Incentive Funding ............................................................................................................. 13 Funding for Operations ..................................................................................................... 13 Bus Funding Versus Rail Funding .................................................................................... 14 Funding for Shared-Ride Services .................................................................................... 14
Capital Investment Grant Program .......................................................................................... 15 Raising User Fees on Automobiles ......................................................................................... 16
Figures
Figure 1. Annual Public Transportation Ridership, 1980-2016 ....................................................... 2
Figure 2. Change in Public Transportation Ridership in Top 10 Transit Markets ........................... 3
Figure 3. Ridership Change in Smaller Transit Markets, 2006-2016 .............................................. 3
Figure 4. Annual Public Transportation Ridership by Bus and Rail, 2006-2016 ............................ 4
Figure 5. Annual Transit Ridership and Average Gasoline Prices, 2006-2016................................ 6
Tables
Table 1. Public Transportation Fares, 2004 and 2014 ..................................................................... 8
Contacts
Author Contact Information .......................................................................................................... 16
Trends in Public Transportation Ridership: Implications for Federal Policy
Congressional Research Service 1
Introduction Many public transportation agencies across the United States are losing riders. While ridership
nationally has risen about 3% over the past decade, that increase is due largely to strong gains in
the New York area, which accounts for about 40% of all U.S. transit riders. Patronage has fallen
in many of the other top 50 transit markets.
This downward trend, despite significant investments in light rail, streetcar, and bus rapid transit
lines in many communities, has led to warnings that transit service in the United States is in
crisis.1 Some of the factors contributing to the ridership decline, such as low gasoline prices and
service problems at particular transit systems, may be transitory, but others, such as the growing
popularity of telework and the rise of ridesourcing companies such as Uber and Lyft, may be
longer lasting. Technological changes on the horizon, such as autonomous highway vehicles,
might revolutionize transportation mobility, but whether this will increase or decrease transit
ridership is by no means clear.
The federal government supports public transportation by distributing general funding for capital
and operating expenses, mainly by formula, and by providing grants for major capital projects on
a discretionary basis. This report discusses the implications of recent trends in transit ridership for
future federal policy.
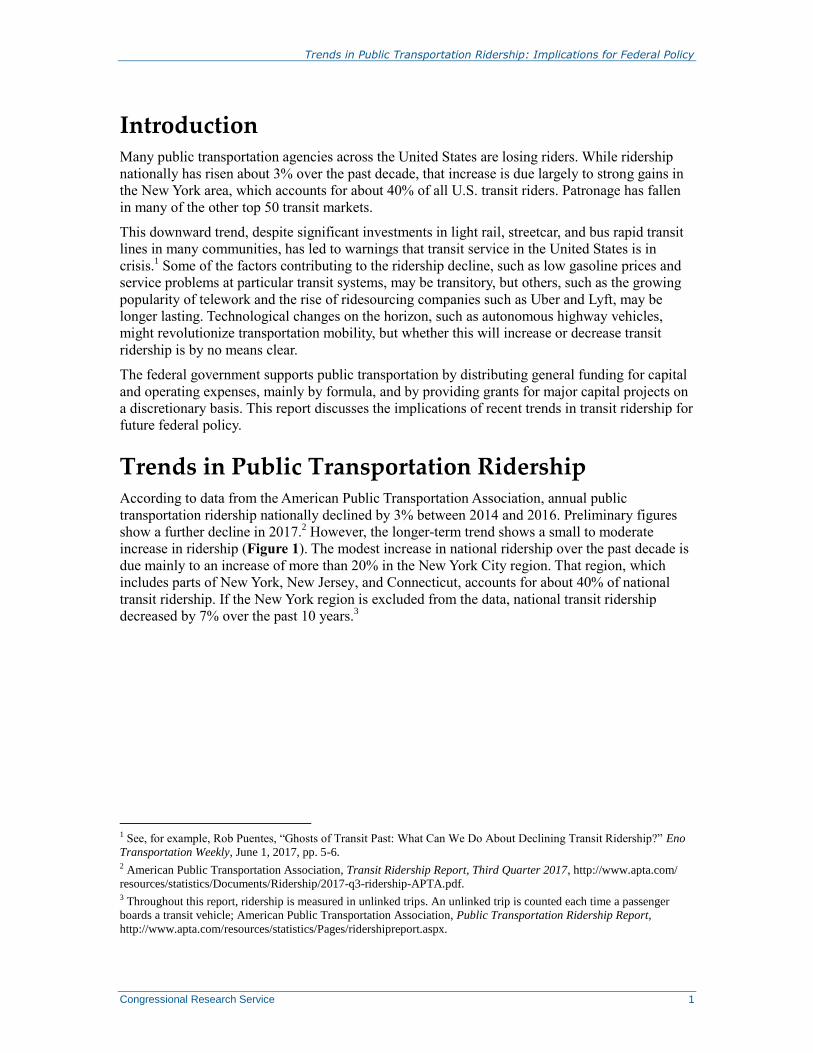
Trends in Public Transportation Ridership According to data from the American Public Transportation Association, annual public
transportation ridership nationally declined by 3% between 2014 and 2016. Preliminary figures
show a further decline in 2017.2 However, the longer-term trend shows a small to moderate
increase in ridership (Figure 1). The modest increase in national ridership over the past decade is
due mainly to an increase of more than 20% in the New York City region. That region, which
includes parts of New York, New Jersey, and Connecticut, accounts for about 40% of national
transit ridership. If the New York region is excluded from the data, national transit ridership
decreased by 7% over the past 10 years.3
1 See, for example, Rob Puentes, “Ghosts of Transit Past: What Can We Do About Declining Transit Ridership?” Eno
Transportation Weekly, June 1, 2017, pp. 5-6. 2 American Public Transportation Association, Transit Ridership Report, Third Quarter 2017, http://www.apta.com/
resources/statistics/Documents/Ridership/2017-q3-ridership-APTA.pdf. 3 Throughout this report, ridership is measured in unlinked trips. An unlinked trip is counted each time a passenger
boards a transit vehicle; American Public Transportation Association, Public Transportation Ridership Report,
http://www.apta.com/resources/statistics/Pages/ridershipreport.aspx.
Trends in Public Transportation Ridership: Implications for Federal Policy
Congressional Research Service 2
Figure 1. Annual Public Transportation Ridership, 1980-2016
Unlinked Trips
Source: American Public Transportation Association, 2016 Public Transportation Fact Book Appendix A; American
Public Transportation Association, Transit Ridership Report.
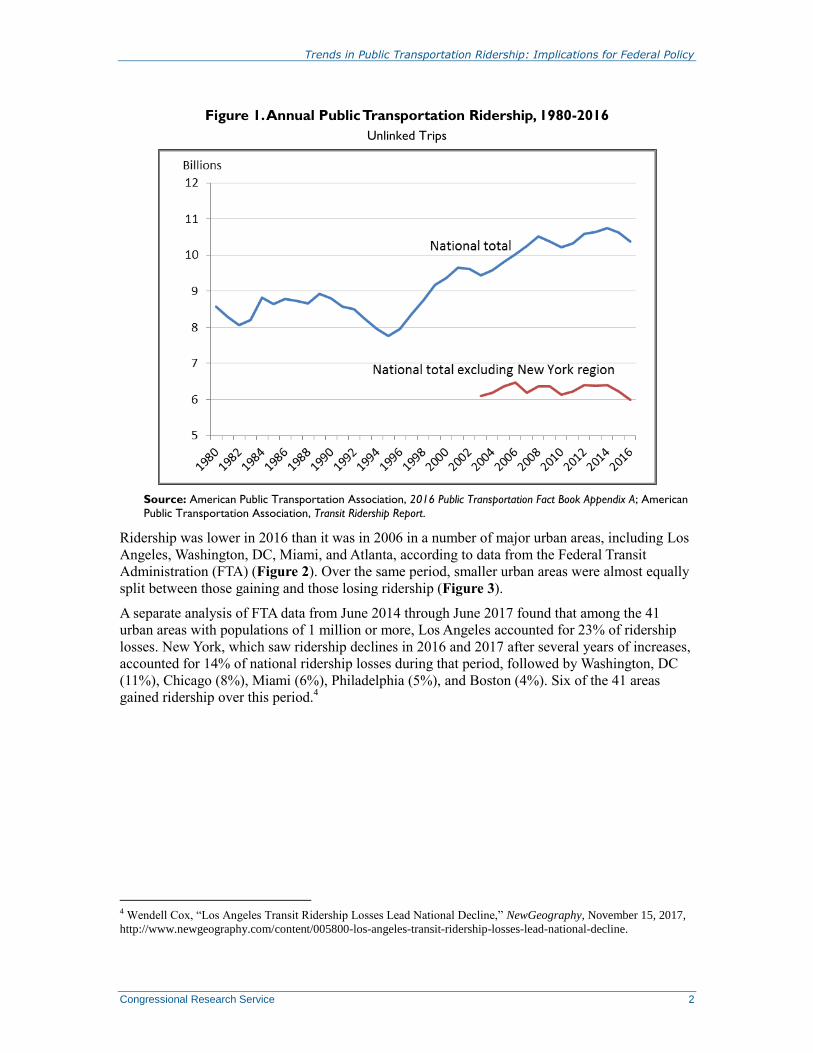
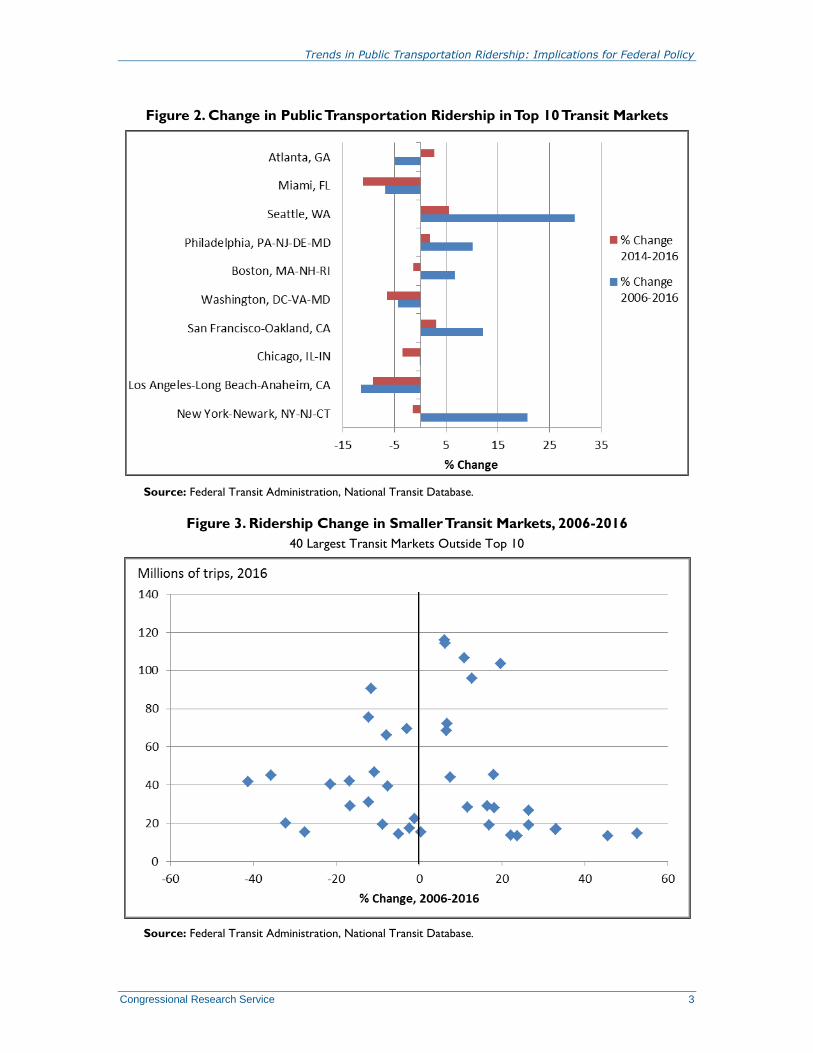
Ridership was lower in 2016 than it was in 2006 in a number of major urban areas, including Los
Angeles, Washington, DC, Miami, and Atlanta, according to data from the Federal Transit
Administration (FTA) (Figure 2). Over the same period, smaller urban areas were almost equally
split between those gaining and those losing ridership (Figure 3).
A separate analysis of FTA data from June 2014 through June 2017 found that among the 41
urban areas with populations of 1 million or more, Los Angeles accounted for 23% of ridership
losses. New York, which saw ridership declines in 2016 and 2017 after several years of increases,
accounted for 14% of national ridership losses during that period, followed by Washington, DC
(11%), Chicago (8%), Miami (6%), Philadelphia (5%), and Boston (4%). Six of the 41 areas
gained ridership over this period.4
4 Wendell Cox, “Los Angeles Transit Ridership Losses Lead National Decline,” NewGeography, November 15, 2017,
http://www.newgeography.com/content/005800-los-angeles-transit-ridership-losses-lead-national-decline.
Trends in Public Transportation Ridership: Implications for Federal Policy
Congressional Research Service 3
Figure 2. Change in Public Transportation Ridership in Top 10 Transit Markets
Source: Federal Transit Administration, National Transit Database.
Figure 3. Ridership Change in Smaller Transit Markets, 2006-2016
40 Largest Transit Markets Outside Top 10
Source: Federal Transit Administration, National Transit Database.
Trends in Public Transportation Ridership: Implications for Federal Policy
Congressional Research Service 4
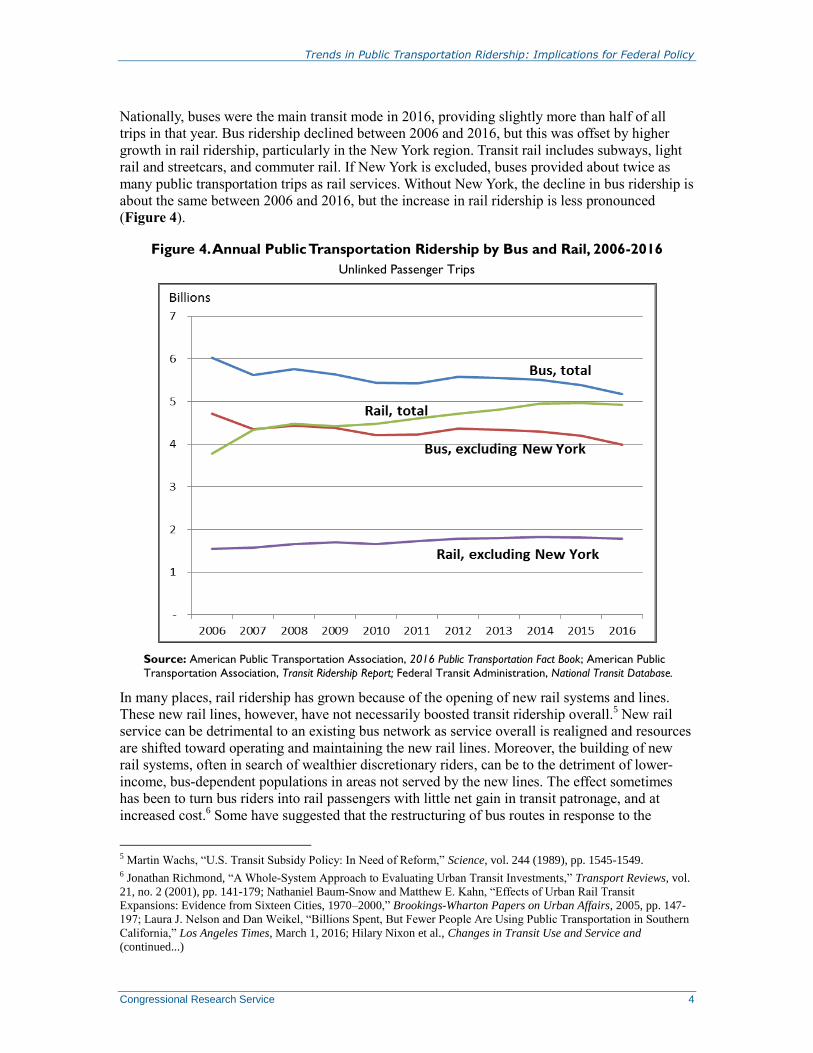
Nationally, buses were the main transit mode in 2016, providing slightly more than half of all
trips in that year. Bus ridership declined between 2006 and 2016, but this was offset by higher
growth in rail ridership, particularly in the New York region. Transit rail includes subways, light
rail and streetcars, and commuter rail. If New York is excluded, buses provided about twice as
many public transportation trips as rail services. Without New York, the decline in bus ridership is
about the same between 2006 and 2016, but the increase in rail ridership is less pronounced
(Figure 4).
Figure 4. Annual Public Transportation Ridership by Bus and Rail, 2006-2016
Unlinked Passenger Trips
Source: American Public Transportation Association, 2016 Public Transportation Fact Book; American Public
Transportation Association, Transit Ridership Report; Federal Transit Administration, National Transit Database.
In many places, rail ridership has grown because of the opening of new rail systems and lines.
These new rail lines, however, have not necessarily boosted transit ridership overall.5 New rail
service can be detrimental to an existing bus network as service overall is realigned and resources
are shifted toward operating and maintaining the new rail lines. Moreover, the building of new
rail systems, often in search of wealthier discretionary riders, can be to the detriment of lower-
income, bus-dependent populations in areas not served by the new lines. The effect sometimes
has been to turn bus riders into rail passengers with little net gain in transit patronage, and at
increased cost.6 Some have suggested that the restructuring of bus routes in response to the
5 Martin Wachs, “U.S. Transit Subsidy Policy: In Need of Reform,” Science, vol. 244 (1989), pp. 1545-1549. 6 Jonathan Richmond, “A Whole-System Approach to Evaluating Urban Transit Investments,” Transport Reviews, vol.
21, no. 2 (2001), pp. 141-179; Nathaniel Baum-Snow and Matthew E. Kahn, “Effects of Urban Rail Transit
Expansions: Evidence from Sixteen Cities, 1970–2000,” Brookings-Wharton Papers on Urban Affairs, 2005, pp. 147-
197; Laura J. Nelson and Dan Weikel, “Billions Spent, But Fewer People Are Using Public Transportation in Southern
California,” Los Angeles Times, March 1, 2016; Hilary Nixon et al., Changes in Transit Use and Service and
(continued...)
Trends in Public Transportation Ridership: Implications for Federal Policy
Congressional Research Service 5
opening of new rail lines, along with an increase in bus fares, has contributed to lower ridership
in Los Angeles.7
Factors Affecting Public Transportation Ridership There is no comprehensive explanation for the overall decline in ridership outside of New York.
National trends in public transportation ridership are not necessarily reflected at the local level;
thus, different areas may have different reasons for growth or decline. Probably the two most
relevant factors in the current context are the attractiveness of other transportation options and
transit service supply issues.
Transportation Options
Public transportation ridership is affected by other competitive or complementary transportation
options, particularly the cost of owning and operating a personal vehicle. Compared with other
countries, car ownership, licensing, and use, including parking, are relatively cheap in the United
States. Consequently, U.S. public transportation ridership is relatively low. For example,
compared with people from a number of European countries, Americans take from one-half to
one-tenth the number of transit trips per year.8
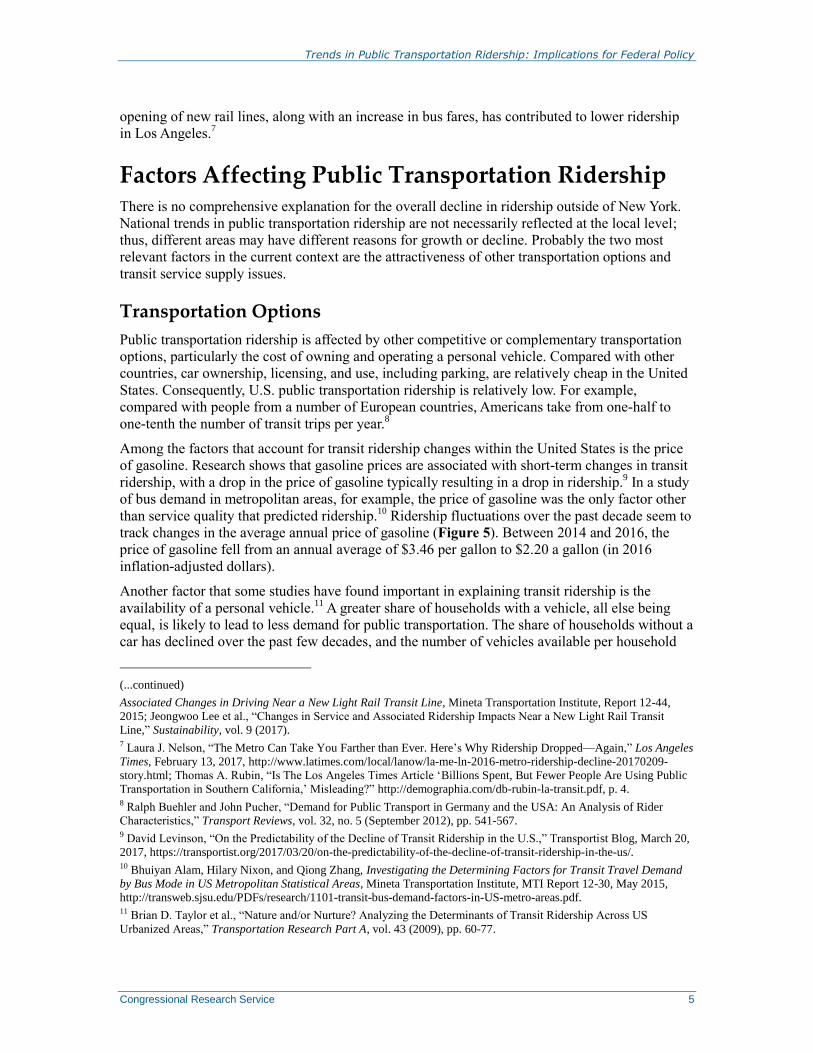
Among the factors that account for transit ridership changes within the United States is the price
of gasoline. Research shows that gasoline prices are associated with short-term changes in transit
ridership, with a drop in the price of gasoline typically resulting in a drop in ridership.9 In a study
of bus demand in metropolitan areas, for example, the price of gasoline was the only factor other
than service quality that predicted ridership.10
Ridership fluctuations over the past decade seem to
track changes in the average annual price of gasoline (Figure 5). Between 2014 and 2016, the
price of gasoline fell from an annual average of $3.46 per gallon to $2.20 a gallon (in 2016
inflation-adjusted dollars).
Another factor that some studies have found important in explaining transit ridership is the
availability of a personal vehicle.11
A greater share of households with a vehicle, all else being
equal, is likely to lead to less demand for public transportation. The share of households without a
car has declined over the past few decades, and the number of vehicles available per household
(...continued)
Associated Changes in Driving Near a New Light Rail Transit Line, Mineta Transportation Institute, Report 12-44,
2015; Jeongwoo Lee et al., “Changes in Service and Associated Ridership Impacts Near a New Light Rail Transit
Line,” Sustainability, vol. 9 (2017). 7 Laura J. Nelson, “The Metro Can Take You Farther than Ever. Here’s Why Ridership Dropped—Again,” Los Angeles
Times, February 13, 2017, http://www.latimes.com/local/lanow/la-me-ln-2016-metro-ridership-decline-20170209-
story.html; Thomas A. Rubin, “Is The Los Angeles Times Article ‘Billions Spent, But Fewer People Are Using Public
Transportation in Southern California,’ Misleading?” http://demographia.com/db-rubin-la-transit.pdf, p. 4. 8 Ralph Buehler and John Pucher, “Demand for Public Transport in Germany and the USA: An Analysis of Rider
Characteristics,” Transport Reviews, vol. 32, no. 5 (September 2012), pp. 541-567. 9 David Levinson, “On the Predictability of the Decline of Transit Ridership in the U.S.,” Transportist Blog, March 20,
2017, https://transportist.org/2017/03/20/on-the-predictability-of-the-decline-of-transit-ridership-in-the-us/. 10 Bhuiyan Alam, Hilary Nixon, and Qiong Zhang, Investigating the Determining Factors for Transit Travel Demand
by Bus Mode in US Metropolitan Statistical Areas, Mineta Transportation Institute, MTI Report 12-30, May 2015,
http://transweb.sjsu.edu/PDFs/research/1101-transit-bus-demand-factors-in-US-metro-areas.pdf. 11 Brian D. Taylor et al., “Nature and/or Nurture? Analyzing the Determinants of Transit Ridership Across US
Urbanized Areas,” Transportation Research Part A, vol. 43 (2009), pp. 60-77.
Trends in Public Transportation Ridership: Implications for Federal Policy
Congressional Research Service 6
has increased. According to a major survey conducted by the U.S. Department of Transportation
(DOT), between 1969 and 2009, the share of households without a vehicle dropped from about
21% to about 9%. Over this period, the average number of vehicles available per household
increased from 1.16 to 1.86.12
Researchers studying southern California found that vehicle access
increased dramatically between 2000 and 2015, especially among groups that tend to be heavy
transit users, such as foreign-born households. They argue that while there are other factors at
work, vehicle access may be the largest determinant in declining transit ridership in that region.13
Figure 5. Annual Transit Ridership and Average Gasoline Prices, 2006-2016
Source: American Public Transportation Association, Transit Ridership Report; U.S. Energy Information
Administration, Monthly Energy Review (June 2017), Table 9.4.
There is some evidence that the share of households without a vehicle may have bottomed out
recently or even slightly increased. DOT’s survey found that the share of households without a
vehicle increased between 2001 and 2009 from 8.1% to 8.7%. More recent data from the Census
Bureau suggest that the share of carless households averaged 9.1% between 2011 and 2015.14
Car
ownership may be dropping, in some places, due to a drop in driver licensing among younger age
groups, due in part to federal policies that promote graduated drivers licenses, and an increase in
shared-use mobility, such as bikesharing, carsharing, and ridesourcing.15
12 Federal Highway Administration, Summary of Travel Trends: 2009 National Household Travel Survey, Table 17,
http://nhts.ornl.gov/2009/pub/stt.pdf. 13 Michael Manville, Brian D. Taylor, and Evelyn Blumenberg, Falling Transit Ridership: California and Southern
California, UCLA Institute of Transportation Studies, January 2018, http://www.scag.ca.gov/Documents/
ITS_SCAG_Transit_Ridership.pdf. 14 Census Bureau, “Selected Housing Characteristics, 2011-2015 American Community Survey 5-year Estimates,”
https://qz.com/873704/no-car-households-are-becoming-more-common-in-the-us-after-decades-of-decline/. 15 Michael Sivak and Brandon Schoettle, “Recent Decreases in the Proportion of Persons with a Driver’s License across
All Age Groups,” University of Michigan, Transportation Research Institute, UMTRI-2016-4, January 2016,
http://umich.edu/~umtriswt/PDF/UMTRI-2016-4.pdf.
Trends in Public Transportation Ridership: Implications for Federal Policy
Congressional Research Service 7
Although ridesourcing has grown rapidly in many large cities—tripling in New York City from
spring 2015 to fall 2016, for example—the effect on transit ridership is unclear. It is possible that
ridesourcing could complement transit in some ways and substitute for it in others. A large share
of transit trips involve journeys to work at rush hours, whereas much ridesourcing occurs at times
when transit service is lacking or infrequent. Ridesourcing companies might carry passengers
between outlying homes and transit stations, along routes that are inefficient for transit agencies
to serve, or between places poorly served by transit entirely.
A survey of ridesouring users in San Francisco found that ridesourcing substituted for transit
about one-third of the time. However, there was some evidence that ridesourcing also provided
first mile/last mile service for transit users and allowed people to live car-free. As the authors
note, “the survey provides evidence that ridesourcing both complements and competes with
public transit.”16
A separate survey of Boston, Chicago, Los Angeles, New York, San Francisco,
Seattle, and Washington, DC, found that among those who began using ridesourcing, on average,
transit use dropped 6%.17
A separate survey sponsored by the American Public Transportation
Association found that ridesourcing complements transit use by providing trips at times and
places not well-served by transit and allowing urban dwellers to live without a personal vehicle.18
A study of ridesourcing in New York City notes that after a period of rapid growth in trip making
by transit, the city has shifted over the past few years to rapid growth in trip making by
ridesourcing.19
Similar changes have been noted in Philadelphia.20
Some transit ridership losses could be the result of people working from home. One survey found
that 37% of workers say they telecommuted in 2015, up from 32% in 2006 and 9% in 1995.21
This affects all modes of transportation, not just public transportation, but the incentives for
working from home may be greatest in major urban areas where transit mode commuting shares
are the largest.
Another recent change in travel behavior has been the rise of public bikesharing schemes in many
cities and the growth of private bicycling as a result of better on-road and off-road infrastructure,
such as bike lanes and bike paths. While bikesharing may lead some individuals to take a short
bike trip instead of a short transit trip, it also provides a way for people to get to and from transit
stations and stops. One study in the United States and Canada found that bikeshare users were, on
balance, less likely to use public transit after they started using the service. However, in one of
the cities surveyed, Minneapolis, bikeshare users were more likely to use public transit.22
Many
16 Lisa Rayle et al., “Just a Better Taxi? A Survey-based Comparison of Taxis, Transit, and Ridesourcing Services in
San Francisco,” Transport Policy, vol. 45 (2016), p. 176. 17 Regina R. Clewlow and Gouri Shankar Mishra, “Disruptive Transportation: The Adoption, Utilization, and Impacts
of Ride-Hailing in the United States,” University of California, Davis, Institute of Transportation Studies, Research
Report UCD-ITS-RR-17-07, October 2017. 18 American Public Transportation Association, Shared Mobility and the Transformation of Public Transit, March
2016, https://www.apta.com/resources/reportsandpublications/Documents/APTA-Shared-Mobility.pdf. 19 Bruce Schaller, Unsustainable? The Growth of App-Based Ride Services and Traffic, Travel and the Future of New
York City, February 27, 2017, Schaller Consulting, http://schallerconsult.com/rideservices/unsustainable.htm. 20 Inga Saffron, “Ride-hailing Apps Are Killing Taxis. Is Public Transit Next?” Philadelphia Inquirer, March 23, 2017,
http://www.philly.com/philly/living/Ride-hailing-apps-Lyft-Uber-taxis-public-transit-next-saffron-SEPTA.html. 21 Jeffrey M. Jones, “In U.S., Telecommuting for Work Climbs to 37%,” Gallup News, August 19, 2015,
http://www.gallup.com/poll/184649/telecommuting-work-climbs.aspx. 22 Susan A. Shaheen et al., Public Bikesharing in North America: Early Operator and User Understanding, San Jose
State University, Mineta Transportation Institute, Report 11-26, June 2012, http://transweb.sjsu.edu/PDFs/research/
1029-public-bikesharing-understanding-early-operators-users.pdf.
Trends in Public Transportation Ridership: Implications for Federal Policy
Congressional Research Service 8
transit systems now equip buses with bicycle racks, allowing customers the option of a
multimodal commute by bike and bus.
Public Transportation Service Supply
Among the factors that affect public transportation ridership, service supply variables are
typically some of the most important. These include factors such as fares, hours of service,
service frequency, safety, and geographic coverage. One study has noted that “the greater the
supply, the greater the demand for transit.”23
Both access to transit, such as distance to a transit stop, and hours of service and service
frequency (the time between trains or buses) are associated with how much someone will use it.
But some efforts to improve transit usage have found the best way to attract riders is to reduce
travel times by increasing service frequencies rather than by improving access to stations and
stops.24
Fares are also an important supply factor. Higher-income residents typically will weigh
the fare against the cost of other travel options, whereas lower-income residents typically will not
travel if the price is too high, or will choose a slower mode, such as buses, if travel by subway or
commuter rail is more expensive.
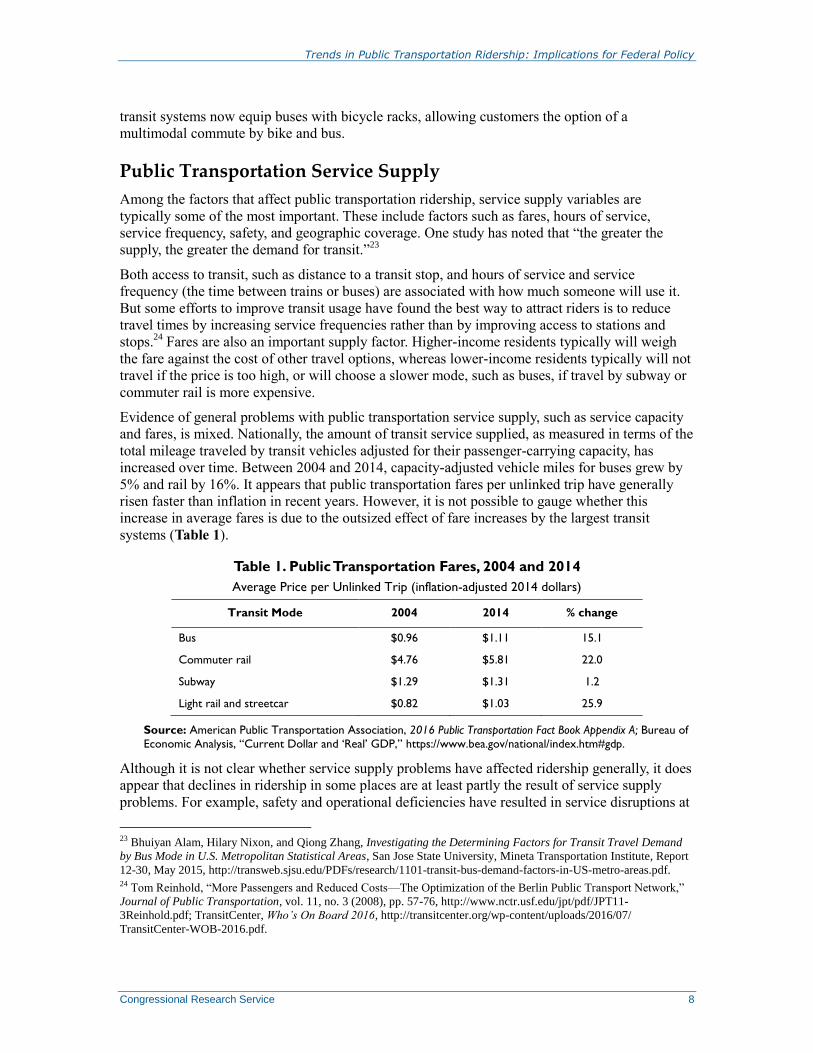
Evidence of general problems with public transportation service supply, such as service capacity
and fares, is mixed. Nationally, the amount of transit service supplied, as measured in terms of the
total mileage traveled by transit vehicles adjusted for their passenger-carrying capacity, has
increased over time. Between 2004 and 2014, capacity-adjusted vehicle miles for buses grew by
5% and rail by 16%. It appears that public transportation fares per unlinked trip have generally
risen faster than inflation in recent years. However, it is not possible to gauge whether this
increase in average fares is due to the outsized effect of fare increases by the largest transit
systems (Table 1).
Table 1. Public Transportation Fares, 2004 and 2014
Average Price per Unlinked Trip (inflation-adjusted 2014 dollars)
Transit Mode 2004 2014 % change
Bus $0.96 $1.11 15.1
Commuter rail $4.76 $5.81 22.0
Subway $1.29 $1.31 1.2
Light rail and streetcar $0.82 $1.03 25.9
Source: American Public Transportation Association, 2016 Public Transportation Fact Book Appendix A; Bureau of
Economic Analysis, “Current Dollar and ‘Real’ GDP,” https://www.bea.gov/national/index.htm#gdp.
Although it is not clear whether service supply problems have affected ridership generally, it does
appear that declines in ridership in some places are at least partly the result of service supply
problems. For example, safety and operational deficiencies have resulted in service disruptions at
23 Bhuiyan Alam, Hilary Nixon, and Qiong Zhang, Investigating the Determining Factors for Transit Travel Demand
by Bus Mode in U.S. Metropolitan Statistical Areas, San Jose State University, Mineta Transportation Institute, Report
12-30, May 2015, http://transweb.sjsu.edu/PDFs/research/1101-transit-bus-demand-factors-in-US-metro-areas.pdf. 24 Tom Reinhold, “More Passengers and Reduced Costs—The Optimization of the Berlin Public Transport Network,”
Journal of Public Transportation, vol. 11, no. 3 (2008), pp. 57-76, http://www.nctr.usf.edu/jpt/pdf/JPT11-
3Reinhold.pdf; TransitCenter, Who’s On Board 2016, http://transitcenter.org/wp-content/uploads/2016/07/
TransitCenter-WOB-2016.pdf.
Trends in Public Transportation Ridership: Implications for Federal Policy
Congressional Research Service 9
the Washington Metropolitan Area Transit Authority, particularly its subway service. Recent
notable events include a customer fatality from smoke inhalation on a train in January 2015 and
weeks-long shutdowns of parts of the Metrorail system since June 2016 to address safety
problems and rehabilitate aging infrastructure. This appears to have contributed to a decline in
ridership of 15% from 2009 to 2016, with bus ridership declining by 6% and rail ridership
declining by 20%.25
The recent decline in ridership in New York is probably also due in part to
infrastructure-related disruptions, but train and station congestion caused by longer-term ridership
growth may also play a role.26
The failure of transit agencies to adjust service in response to changing travel patterns has also
been blamed for ridership declines. Evidence for this comes from ridership increases in places
that have restructured bus routes, such as Houston and Seattle.27
Economics, Population, and Urban Geography
It is well established that economic activity leads to more travel as employment and income grow.
The prolonged economic expansion since the end of a deep recession in June 2009 might
therefore be expected to lead to higher transit ridership. However, research has shown that many
individuals consider transit to be inferior to driving. Consequently, the share of travel taken by
transit decreases as household incomes increase, unemployment falls, and the cost of buying and
operating a car becomes more manageable. On balance, it appears that the decline in transit’s
share of trips more than offsets overall urban travel growth, leading to a drop in ridership during
good economic times.28
There is some evidence to support the notion that residential and employment density are
associated with higher transit ridership, and that the long-term growth of low-density suburban
and exurban areas has been a major impediment to gaining transit riders. Some communities,
encouraged by federal policy, have therefore promoted transit-oriented development as a way to
support transit ridership.29
Whether such urban design policies work or not, urban density changes
slowly and thus is not likely to reverse the recent decline of transit ridership in the near term. In
addition, the relationship between density and transit use or the longer-term increase in transit
ridership is complicated by other related variables such as growth of household income, vehicle
availability, and the availability of free parking.
Although there is some evidence of a “back to the city” movement led by millennials and empty-
nester baby boomers, this trend appears to have brought significant inner-city population growth
25 American Public Transportation Association, Public Transportation Ridership Report, Third Quarter 2009 and 2016,
http://www.apta.com/resources/statistics/Pages/RidershipArchives.aspx; Faiz Siddiqui, “Ridership Losses, Exacerbated
by SafeTrack, Push Metro to Financial Tipping Point,” Washington Post, February 21, 2017,
https://www.washingtonpost.com/local/trafficandcommuting/ridership-losses-exacerbated-by-safetrack-push-metro-to-
financial-tipping-point/2017/02/21/6ec0b7ec-f85f-11e6-9845-576c69081518_story.html?utm_term=.de084dfbcc28. 26 Emma G. Fitzsimmons, Ford Fessenden, and K. K. Rebecca Lai, “Every New York City Subway Line Is Getting
Worse. Here’s Why,” New York Times, June 28, 2017, https://www.nytimes.com/interactive/2017/06/28/nyregion/
subway-delays-overcrowding.html. 27 Angie Schmitt, “Transit Ridership Falling Everywhere—But Not in Cities With Redesigned Bus Networks,”
Streetsblog USA, February 24, 2017, http://usa.streetsblog.org/2017/02/24/transit-ridership-falling-everywhere-but-not-
in-cities-with-redesigned-bus-networks; TransitCenter, “Seattle: America’s Next Top Transit City,”
http://transitcenter.org/2017/01/03/seattle-americas-next-top-transit-city/. 28 Brian D. Taylor et al., “Nature and/or Nurture? Analyzing the Determinants of Transit Ridership Across US
Urbanized Areas,” Transportation Research Part A, vol. 43, pp. 60-77, 2009. 29 Federal Transit Administration, “Transit-Oriented Development,” https://www.transit.dot.gov/TOD.
Trends in Public Transportation Ridership: Implications for Federal Policy
Congressional Research Service 10
in only a few metropolitan areas, such as New York, Washington, DC, and San Francisco. Cities
grew faster than their suburbs between 2010 and 2015, reversing a long-term trend, but Census
data for 2016 show this may have now ended.30
In terms of jobs, cities grew faster than suburbs
for the first time in decades between 2007 and 2011, but it is unclear whether this trend will be
sustained. Between 2011 and 2014, suburbs once again grew slightly faster than cities.31
Population characteristics such as race and ethnicity, age, and immigrant status are another set of
factors that have been examined in terms of transit ridership. Of these factors, immigration trends
seem to have received the most attention recently.32
Recent immigrants typically travel much
more by transit than the native born, but this difference declines the longer an immigrant lives in
the country. This longevity effect has been posited as a reason for the decline in transit ridership
in Los Angeles and may also apply nationwide.33
Nationally, the number of new lawful
permanent residents has generally declined between 2006 and 2015. Moreover, according to one
estimate, the number of unauthorized immigrants was also lower in 2016 than it was in 2007,
falling from 12.2 million to 11.3 million over this period.34
These changes may be associated with
declining use of public transportation.
The Future of Public Transportation Ridership In the short to medium term, roughly 10 to 20 years, transit demand is likely to be determined by
population growth and the public commitment to supplying transit. Ridership is likely to increase
and decrease as gas prices rise and fall, and as other factors make driving more or less attractive.
These include the extent, duration, and intensity of highway congestion; the price of parking; and
the implementation of fuel taxes, tolls, and mileage-based user fees. However, the most important
factors are likely to be the attractiveness of public transportation in terms of fares, speed,
reliability, and coverage. For this, public transportation providers will rely heavily on federal,
state, and local funding. Success will depend, to some extent, on how much of this funding goes
to service improvements.
Service improvements can be made by changes that are not necessarily dependent on funding
increases. Some transit agencies have recently sought to reconfigure antiquated bus routes to
30 William H. Frey, “City Growth Dips Below Suburban Growth, Census Shows,” May 30, 2017,
https://www.brookings.edu/blog/the-avenue/2017/05/30/city-growth-dips-below-suburban-growth-census-shows/; Jed
Kolko, “Americans’ Shift to the Suburbs Sped Up Last Year,” FiveThirtyEight, March 23, 2017,
https://fivethirtyeight.com/features/americans-shift-to-the-suburbs-sped-up-last-year/. 31 Daniel Hertz, “City Center Job Growth Continues Strength; Suburbs Rebounding from Recession,” City
Observatory, May 24, 2016, http://cityobservatory.org/city-center-job-growth-continues/; Wendell Cox, “Suburbs
(Continue to) Dominate Jobs and Job Growth,” NewGeography, May 25, 2016, http://www.newgeography.com/
content/005264-suburbs-continue-dominate-jobs-and-job-growth; Elizabeth Kneebone, Job Sprawl Stalls: The Great
Recession and Metropolitan Employment Location, Brookings Institution, April 2013, https://www.brookings.edu/wp-
content/uploads/2016/06/Srvy_JobSprawl.pdf. 32 Brian D. Taylor et al., “Nature and/or Nurture? Analyzing the Determinants of Transit Ridership Across US
Urbanized Areas,” Transportation Research Part A, vol. 43 (2009), pp. 60-77. 33 Steven A. Camarota and Karen Zeigler, “Immigrants in the United States: A Profile of the Foreign-born Using 2014
and 2015 Census Bureau Data,” Center for Immigration Studies, October 2016, https://cis.org/sites/cis.org/files/
immigrant-profile_0.pdf; Laura J. Nelson, “The Metro Can Take You Farther than Ever. Here’s Why Ridership
Dropped—Again,” Los Angeles Times, February 13, 2017, http://www.latimes.com/local/lanow/la-me-ln-2016-metro-
ridership-decline-20170209-story.html. 34 Jeffrey S. Passel and D’Vera Cohn, “As Mexican Share Declined, U.S. Unauthorized Immigrant Population Fell in
2015 Below Recession Level,” Pew Research Center, April 25, 2017, http://www.pewresearch.org/fact-tank/2017/04/
25/as-mexican-share-declined-u-s-unauthorized-immigrant-population-fell-in-2015-below-recession-level/.
Trends in Public Transportation Ridership: Implications for Federal Policy
Congressional Research Service 11
better serve current demand, despite local political pressure to protect the status quo.35
In some
instances, this involves increasing bus frequency with fewer stops on less circuitous routes. It can
also involve making bus travel faster by designing streets with dedicated bus lanes and priority
for buses at traffic signals and by using technology to enable riders to pay their fares before
boarding.36
According to the Census Bureau, the U.S. resident population is expected to increase by about 26
million in the next 10 years (an 8% increase) and about 48 million in the next 20 years (a 15%
increase).37
Southern and western cities such as Atlanta, Dallas, Houston, and Phoenix are likely
to move up the rankings of the largest urban areas over the coming years, but the fastest-growing
urban areas are likely to be small and medium-sized places in the South and West where transit
use is relatively low.38
There is some evidence that in larger metropolitan areas major employers
are seeking out locations that are well served by transit, but the general trend remains job
dispersion across suburbs with low employment density. The combination of relatively low-
density residential growth and low-density employment growth may limit the extent to which
population growth brings higher transit ridership.
Although ridesourcing seems likely to depress overall demand for transit, that outcome is not a
foregone conclusion. Ridesourcing companies appear to be subsidizing their service, such that the
total amount paid by riders from 2012 through the first half of 2016 may have been only 60% of
the cost of providing the service.39
If the cost of ridesourced trips were to increase to at least a
breakeven proposition, ridesourcing may become a less attractive alternative to public
transportation. While some transit agencies have begun cooperating with ridesourcing companies
to provide the first mile/last mile of a transit trip,40
decisions about transit service supply made on
the assumption that these types of service will always be available at the current price might
cause problems in the future.
35 Daniel Vock, “Buses, Yes Buses, Are ‘the Hottest Trend in Transit,’” Governing, September 18, 2017,
http://www.governing.com/topics/transportation-infrastructure/gov-big-city-bus-systems.html. 36 TransitCenter, Turnaround: Fixing New York City’s Buses, 2016, http://transitcenter.org/publications/turnaround-
fixing-new-york-citys-buses/#download-the-report. 37 U.S. Census Bureau, “2014 National Population Projections Tables,” Table 1, https://www.census.gov/data/tables/
2014/demo/popproj/2014-summary-tables.html. 38 The United States Conference of Mayors, U.S. Metro Economies: Past and Future Employment Levels, May 2017,
http://www.usmayors.org/wp-content/uploads/2017/05/Metro-Economies-Past-and-Future-Employment-12.pdf;
Wendell Cox, “UN Projects 2030 U.S. Urban Area Population,” Figure 3, http://www.newgeography.com/content/
004464-un-projects-2030-us-urban-area-populations. 39 Riley McDermid, “Uber is Losing $2 Billion a Year, New Report Says, With Passengers Paying for Only 41% of
Each Ride,” San Francisco Business Times, December 2, 2016, https://www.bizjournals.com/sanfrancisco/news/2016/
12/02/uber-losses.html; Jarrett Walker, “Sounding the Alarm about Uber’s Impacts on Transit, and on Cities,” Human
Transit Blog, December 15, 2016, http://humantransit.org/2016/12/sounding-the-alarm-about-ubers-impacts-on-
transit.html. Some of the reported costs may involve one-time expenditures that will not recur. See also Heather
Somerville, “True Price of an Uber Ride in Question as Investors Assess Firm’s Value,” Reuters, August 23, 2017,
https://www.reuters.com/article/us-uber-profitability/true-price-of-an-uber-ride-in-question-as-investors-assess-firms-
value-idUSKCN1B3103. 40 “Some Cities Are Subsidizing Uber Rides to Cut Public Transportation Costs,” Business Insider, December 15, 2016,
http://www.businessinsider.com/some-cities-are-subsidizing-uber-rides-to-cut-public-transportation-costs-2016-12;
Henry Grabar, “They Can Just Take an Uber: Cities Across the Country are Cutting Public Transportation Because
They Think Ride-hailing Services Will Fill the Gap. They’ll Regret It.” Slate, December 14, 2016,
http://www.slate.com/articles/business/metropolis/2016/12/
cities_are_cutting_transportation_service_because_they_think_uber_will_fill.html.
Trends in Public Transportation Ridership: Implications for Federal Policy
Congressional Research Service 12
The introduction of driverless vehicle technology is perhaps the biggest unknown, but potentially
the most disruptive factor for future public transportation ridership. Estimates of when fully
autonomous vehicles will be in use in urban environments vary wildly from a few years to a few
decades.41
Based on the introduction of past vehicle technology, it is likely that even if fully
autonomous vehicles are available in a few years, it will take decades for them to become
ubiquitous.42
Fleets of driverless taxis that can be hailed with a smartphone could potentially offer service
much more cheaply than taxis and ridesourcing do today, as labor, which makes up about half of
the cost of such a trip, would no longer be a significant factor.43
Autonomous vehicles may
provide a new option for those currently unable to drive, such as children, the elderly, and the
disabled. Widespread deployment of autonomous vehicles and driverless taxis, therefore, could
lead to a greater number of vehicle trips and a decline in traditional transit ridership.
Although autonomous vehicles may use road space more efficiently and cause fewer crashes than
human-driven vehicles, it is possible that their widespread use would increase traffic congestion
in the largest cities, thereby creating a need for some form of shared-ride service. Traditional
transit buses may be able to adopt the same driverless technology to cut costs, but in many places
this is likely to be on-demand service provided by small buses, vans, and other types of
“microtransit.”44
Some microtransit pilot projects along these lines, with drivers, are being run by
transit agencies in Los Angeles; Austin, TX; Kansas City, MO; Santa Clara County, CA; and the
Alameda-Contra Costa Transit District near San Francisco.45
Ridesourcing companies are
experimenting with shared-ride services as well.
Because road space is severely limited in the largest and most dense cities, rail transit service will
likely remain important in those places. Autonomous vehicles may even provide a relatively
cheap and easy way to access rail service. However, in general, autonomous vehicles will
significantly reduce the costs of traveling by automobile, shifting demand to road from rail.46
It is
possible that travel time will become less of a concern to motorists, as fully autonomous vehicles
will allow riders to engage in other activities while traveling, such as working, eating, and
sleeping. Consequently, autonomous vehicles could make it more attractive, at least in
transportation terms, to live in low-density places that are distant from other activity centers.
Transit, particularly rail transit, is unlikely to thrive in such places.
41 Sarah Kessler, “A Timeline of When Self-driving Cars Will Be on the Road, According to the People Making
Them,” Quartz, March 29, 2017, https://qz.com/943899/a-timeline-of-when-self-driving-cars-will-be-on-the-road-
according-to-the-people-making-them/; CRS Report R44940, Issues in Autonomous Vehicle Deployment, by Bill Canis. 42 Todd Litman, Autonomous Vehicle Implementation Predictions: Implications for Transport Planning, Victoria
Transport Policy Institute, September 8, 2017, p. 13, http://www.vtpi.org/avip.pdf. 43 Timothy B. Lee, “Uber Lost $2.8 Billion in 2016. Will it Ever Become Profitable?” Vox, April 15, 2017,
https://www.vox.com/new-money/2017/1/9/14194202/uber-lost-22-billion-9-months. 44 Robert Cervero, “Mobility Niches: Jitneys to Robo-Taxis,” Journal of the American Planning Association, vol. 83,
no. 4 (Autumn 2017), pp. 404-412; Johanna Zmud et al., Strategies to Advance Automated and Connected Vehicles,
Transportation Research Board, 2017, https://www.nap.edu/catalog/24873/strategies-to-advance-automated-and-
connected-vehicles. 45 Austin’s pilot project is known as Pickup (see https://www.capmetro.org/pickup/); for Los Angeles Metro’s
microtransit pilot, see https://www.metro.net/projects/microtransit/; Eno Center for Transportation, UpRouted:
Exploring Microtransit in the United States, January 2018, https://www.enotrans.org/etl-material/uprouted-exploring-
microtransit-united-states/. 46 Joel Hazan et al., Will Autonomous Vehicles Derail Trains? Boston Consulting Group, September 30, 2016,
https://www.bcg.com/publications/2016/transportation-travel-tourism-automotive-will-autonomous-vehicles-derail-
trains.aspx.
Trends in Public Transportation Ridership: Implications for Federal Policy
Congressional Research Service 13
Implications for Federal Policy The federal government is involved in the provision of public transportation in two main ways.
First, it provides about 18%, on average, of the capital and operating funds spent by public
transportation agencies throughout the country. Fares and other revenues make up about 26%,
local funding about 34%, and state funding about 22%.47
Second, through the Capital Investment
Grant (CIG) program (also known as the New Starts program), the federal government plays a
significant role in the building of new transit rail and bus rapid transit systems and the extension
and expansion of existing systems.48
The future of public transportation ridership has implications
for both general funding and CIG program funding.
Federal Public Transportation Funding
Incentive Funding
National transit ridership is somewhat dependent on the level of federal funding. Less federal
funding would likely lead to less total spending on public transportation, at least for a time as
state and local governments adjust, and thus would likely lead to less service and lower ridership.
Conversely, more federal outlays in the short term would likely provide for ridership at a higher
level than it otherwise would be, unless they result in state and local governments cutting back on
their own spending for transit purposes.
Currently, more than three-quarters of federal public transportation funding is distributed by a set
of formulas that are tenuously related to ridership. For example, about 6% of funding under the
Urbanized Area Formula Program49
is distributed on the basis of passenger miles through what
are known as “incentive tiers” (49 U.S.C. §5336(b)(2)(B) and 49 U.S.C. §5336(c)(2)).50
An alternative approach might tie federal funding to changes in ridership, such as the number of
revenue passengers, or to productivity, such as the average number of passengers per bus-mile.
Such an approach would provide transit agencies an incentive to improve their performance while
allowing them to innovate by redesigning their bus networks, introducing technology to speed up
boarding, or adjusting service levels. A possible downside is that encouraging transit agencies to
focus exclusively on ridership may discourage them from serving isolated areas with transit-
dependent populations.
Funding for Operations
Although small transit agencies frequently receive federal operating assistance, most transit
operators in urbanized areas with populations above 200,000 or with more than 100 buses can use
federal funds only for capital expenses or maintenance. Greater federal support for transit
operations could increase the quantity of transit service offered by local transit agencies,
potentially expanding ridership.
47 American Public Transportation Association, 2016 Public Transportation Fact Book Appendix A, Table 95. 48 CRS Report R42706, Federal Public Transportation Program: In Brief, by William J. Mallett. 49 49 U.S.C. §5307. 50 A fraction of an additional 1.5% is distributed to Small Intensive Transit Cities based on passenger miles and
passengers; American Public Transportation Association, APTA Primer on Transit Funding: The Fixing America’s
Surface Transportation Act and Other Related Laws, FY 2016 Through FY 2020, April 2016, p. 56,
https://www.apta.com/resources/reportsandpublications/Documents/APTA-Primer-FAST-Act.pdf.
Trends in Public Transportation Ridership: Implications for Federal Policy
Congressional Research Service 14
There are three main issues with federal operating support: its effects on service, productivity, and
asset condition. Research on the rapid expansion of operating support in the 1970s generally
concluded that it allowed transit agencies to maintain a higher level of transit service than would
have prevailed without it, but that such support also caused productivity to decline. Much of the
decline was related to the increased supply-side cost of providing service, particularly in wages
and fringe benefits.51
Some productivity decline comes from the problem of providing service in
places with less demand, a problem that might be mitigated with a focus on incentives funding.
The effects of operating support on asset condition are much less clear. It is possible that greater
flexibility in the use of federal funding for operating expenses may be associated with a more
rapid decline in the condition of capital assets, as some transit agencies focus on pressing day-to-
day needs rather than asset renewal. However, existing flexibility to use capital funds for
maintenance may help agencies to preserve equipment and facilities.
Bus Funding Versus Rail Funding
Uncertainty about the introduction of autonomous vehicles has increased the difficulty of
forecasting the ridership of rail systems that are designed to operate for many decades. It is
imaginable that autonomous vehicles could be widely used to shuttle passengers to and from rail
transit stations in areas with low residential or employment density, potentially increasing
demand for rail transit. However, it is also imaginable that autonomous vehicles could make it
more attractive for people living or working in high-density areas to travel considerable distances
by car and without parking concerns, reducing demand for rail transit. Which outcome occurs
may depend, in part, on whether state and local governments seek to restrain use of autonomous
vehicles through road user charges or other measures.
This uncertainty poses challenges for transit systems considering long-term capital investments
and for the federal programs that fund such investments. The main federal program supporting
capital expenditures by transit agencies, the CIG program, was originally developed to fund
construction of new rail transit and commuter rail projects, but in recent years a growing
proportion of its outlays have gone for bus rapid transit projects. A key policy issue is whether
future federal funding should focus on buses, which last about 10 years and can be redeployed as
demand changes, rather than on rail systems that last 30 years or more and are inflexible but are
far more efficient at transporting large numbers of passengers in dense corridors.
Funding for Shared-Ride Services
If demand for traditional transit service declines, there may be demand for other types of shared-
ride service. In that case, there may be pressure to shift public subsidies from traditional transit
services, such as buses, to on-demand shared autonomous vehicle services, whether operated
publicly or privately. This could mitigate the congestion and emissions of individually owned
autonomous vehicles. It might be possible to subsidize autonomous vehicle services for particular
groups with limited mobility, such as disabled, elderly, and low-income populations, reducing the
need for distinct transit services, such as paratransit, which tend to be expensive to provide.52
51 Douglass B. Lee, Evaluation of Federal Transit Operating Subsidies, Staff Study (Cambridge, MA: Department of
Transportation, Transportation Systems Center, September 1987); John Pucher, Anders Markstedt, and Ira Hirshman,
“Impacts of Subsidies on the Costs of Urban Public Transport,” Journal of Transport Economics and Policy (May
1983), pp. 155-176. 52 Johanna Zmud et al., Advancing Automated and Connected Vehicles: Policy and Planning Strategies for State and
Local Transportation Agencies, Transportation Research Board, NCHRP Research Report 845, 2017, p. 41,
(continued...)
Trends in Public Transportation Ridership: Implications for Federal Policy
Congressional Research Service 15
While federal funding of on-demand shared-ride service provided publicly is not necessarily
prohibited, it could raise issues of competition with private providers, access by disadvantaged
groups, and the provision of operating support. Federal support of privately operated shared-
mobility services is currently permissible in certain limited circumstances.53
It might make sense
to broaden the circumstances where federal funds can be used to support these types of services.
Another possibility would be to allow tax-subsidized commuter benefits to cover on-demand
shared autonomous vehicle services.54
Capital Investment Grant Program
The CIG program provides funding to support the construction of new fixed-guideway transit
systems and to add to existing systems. Funding is also permitted for investments in existing
fixed-guideway systems that increase the capacity of a corridor by at least 10%. Fixed-guideway
services include transit rail, bus rapid transit, and ferry systems. Funding for the program is
authorized from the general fund of the U.S. Treasury.
The CIG program has not been without controversy. FTA contends the program “is needed
because it allows transit agencies to undertake major capital projects that would otherwise be
infeasible for local governments and transit agencies to finance alone.”55
Supporters insist that
growing demand for CIG funds is evidence of its success.56
Critics, however, have contended that
CIG funding encourages communities to build expensive fixed-guideway infrastructure rather
than invest lesser sums in improving bus service.57
No comprehensive benefit-cost studies of completed CIG projects have been conducted to
evaluate the CIG program as federal policy. Research has shown that some rail transit lines built
at great cost with federal support have low ridership, but there are significant differences in
benefit/cost ratios among systems. According to one study, two of the systems with the largest net
benefits include the subway systems in San Francisco and New York City, while the rail system in
Buffalo and those operated by New Jersey Transit in Newark, Jersey City, and Trenton have some
of the largest net costs.58
(...continued)
http://www.trb.org/Main/Blurbs/176418.aspx. 53 Federal Transit Administration, “Shared Mobility FAQs: Eligibility Under FTA Grant Programs,”
https://www.transit.dot.gov/regulations-and-guidance/shared-mobility-faqs-eligibility-under-fta-grant-programs. 54 Zmud et al., pp. 45-49. 55 Federal Transit Administration, Budget Estimates FY2017, CIG-10, https://www.transportation.gov/sites/dot.gov/
files/docs/FTA-FY-2017-CJ.pdf. 56 American Public Transportation Association, APTA Recommendations on Federal Public Transportation
Authorizing Law, December 2013, http://www.apta.com/gap/legissues/authorization/Documents/
APTA%20Authorizing%20Law%20Recommendations_FINAL_adopted%206Dec2013.pdf. 57 Nathaniel Baum-Snow and Matthew E. Kahn, “Effects of Urban Rail Transit Expansions: Evidence from Sixteen
Cities, 1970–2000,” Brookings-Wharton Papers on Urban Affairs, Brookings Institution Press, 2005, pp. 147-197,
https://muse.jhu.edu/article/192572/pdf. 58 Robert Cervero and Erick Guerra, “To T or Not to T: A Ballpark Assessment of the Costs and Benefits of Urban Rail
Transportation,” Public Works Management & Policy, vol. 16, no. 2 (2011), pp. 111-128. For a more critical
assessment, see Peter Gordon and Paige Elise Kolesar, “A Note on Rail Transit Cost—Benefit Analysis: Do Nonuser
Benefits Make a Difference?” Public Works Management & Policy, vol. 16, no. 2 (2011), pp. 100-110; and Lisa
Schweitzer, “Benefit-Cost Analysis of Rail Projects: A Commentary,” Public Works Management & Policy, vol. 16,
no. 2 (2011), pp. 129-131.
Trends in Public Transportation Ridership: Implications for Federal Policy
Congressional Research Service 16
If the full promise of autonomous vehicles is realized, the benefits of rail in all but the largest and
most dense cities are likely to decline dramatically. In this situation, one policy option would be
to eliminate the CIG program and redirect the funding through the formula programs, possibly
using formulas that have been changed to encourage ridership. Another option would be to
redirect CIG funding from building rail and perhaps even bus rapid transit in relatively small and
dispersed urban areas to the large and dense cities where rail transit currently carries very large
numbers of riders, such as New York, Chicago, and Washington, DC. With new funds to refurbish
old infrastructure and to add new capacity in congested areas, it might be possible to substantially
increase national transit ridership in the short to medium term.59
Raising User Fees on Automobiles
The cost of car ownership and use is low in the United States compared with most other highly
developed countries, a contributing factor for the major differences in transit use. For example,
according to the Federal Highway Administration, the average tax per gallon on gasoline in this
country was $0.43 in December 2014, including federal and state taxes, compared with $2.22 in
Japan, $4.19 in Germany, and $4.83 in Italy.60
Highway user fees, including fuels tax, tolls, and vehicle registration fees, cover about 60% of the
cost of highway infrastructure in 2012, with the other 40% coming from, among other things,
general funds, property taxes, and bond issuance.61
As a share of highway expenditures, user fees
have generally declined over the past decade.62
Additionally, many economists note that there are
external costs of driving, such as congestion, air pollution, and publicly borne costs of crashes.63
Raising user fees on automobiles would make transit comparatively more attractive. Many fees,
such as vehicle registration fees and parking charges, are controlled at the state and local level.
Options at the federal level include raising the federal fuels tax, implementing a mileage-based
user charge at a level above today’s fuels tax, and encouraging greater use of tolling, including
congestion pricing.64
Author Contact Information
William J. Mallett
Specialist in Transportation Policy
[email protected], 7-2216
59 Aaron Renn, “Does America Need More Urban Rail Transit?” Manhattan Institute, May 3, 2017,
https://www.manhattan-institute.org/sites/default/files/IB-AR-0517.pdf. 60 FHWA, Highway Statistics, Table IN-1, https://www.fhwa.dot.gov/policyinformation/statistics/2015/in1.cfm. 61 This calculation includes highway user revenue diverted to nonhighway uses. Federal Highway Administration,
Highway Statistics 2015, Table HF-10, https://www.fhwa.dot.gov/policyinformation/statistics/2015/hf10.cfm. 62 Department of Transportation, 2015 Status of the Nation’s Highways, Bridges, and Transit: Conditions and
Performance, January 2017, Chapter 6, https://www.fhwa.dot.gov/policy/2015cpr/pdfs/chap6.pdf. 63 Todd Litman, Socially Optimal Transport Prices and Markets, Victoria Transport Policy Institute, July 18, 2017,
http://www.vtpi.org/sotpm.pdf. 64 CRS Report R44674, Funding and Financing Highways and Public Transportation, by Robert S. Kirk and William
J. Mallett.