Chinas Overseas Investments in Wind and Solar Trends and Drivers
Trends in Overseas Subsidiaries
(Quarterly Survey of Overseas Subsidiaries)
Results for January – March 2004
Prospects for April 2004 – September 2004
June 29, 2004
Enterprise Statistics Office
Research and Statistics Department
Ministry of Economy, Trade and Industry
2
Contents
Ⅰ. Quarterly Survey of Overseas Subsidiaries (formerly “Trend Survey of
Japanese Companies”) 1. Outline of the survey........................................................................................................3 2. Usage notes.......................................................................................................................4
II. Findings of the survey
1. Sales trends......................................................................................................... 5 ― 11 2. Equipment investment trends..........................................................................12 ― 13 3. Employment trends (number of employees)....................................................14 ― 15 4. Intra-company transaction trends....................................................................16 ― 17 5. Trends by region (country)
(1) North America ................................................................................................18 ― 19 (2) ASEAN4 ........................................................................................................20 ― 21 (3) NIES3 ............................................................................................................22 ― 23 (4) China (including Hong Kong) ......................................................................24 ― 25 (5) Europe ...........................................................................................................26 ― 27
【Topics】....................................................................................................................28 ― 29 (References)
1. Comparison of US dollar and Japanese yen exchange rates .....................................30 2. Changes in the exchange rates of major currencies against the US dollar, by region
(average term rates published by IMF) .....................................................................30 3. Results by major country and area...............................................................................31
『References』
1. Classification of countries (regions)..............................................................................32 2. Record of changes in the content of the survey ...............................................32 ― 33
3
I. Quarterly survey of Overseas Subsidiaries (formerly “Trend Survey of Japanese Companies”) 1. Outline of the survey (1) Purpose of the survey The purpose of this survey is to identify future overseas economic trends by surveying the results and prospects of overseas business activities of Japanese companies, and to understand the economic trends of Japanese companies overseas and actual circumstances of economic globalization. An additional goal is to contribute to the drafting of flexible industrial and trade policies. (2) Legal basis of the survey These are official statistics based on Article 4 of the Statistics Report Adjustment Law. (3) Date of the survey The survey was based on the period ending the last day of March 2004. (The deadline for submitting survey responses for this quarter was May 14, 2004.) (4) Subject of the survey Companies that met all of the following conditions as of the end of March 2003 were subject to the survey:
① All industries except finance, insurance, and real estate ② Companies capitalized at more than 100 million yen ③ Companies with more than 50 employees ④ Companies with overseas subsidiaries
With regard to overseas subsidiaries owned by the above Japanese parent companies, this survey targets overseas subsidiaries that meet all of the following criteria (including overseas subsidiaries that were established during the term of the survey) as of the end of each quarter:
① Manufacturing companies ② Companies with more than 50 employees ③ Companies with more than 50% investment (including both direct and
indirect investment) by parent companies (5) Response rate The responses to the survey for this quarter are summarized below:
Number of companies subject to survey
(overseas subsidiaries)
Number of companies that responded
Response rate
3555 2559 72.0% (6) Method of the survey The survey was conducted via mail, using self-declarations made by parent companies subject to the survey.
4
2. Usage notes (1) With regard to listed currencies This “Quarterly Survey of Overseas Subsidiaries,” which consists of the former “Trend Survey of Japanese Companies” (excluding the “Survey of Parent Companies”), has been conducted since the April – June quarter of 2003, and focuses on overseas subsidiaries engaged in manufacturing overseas. Accordingly, amounts relating to overseas subsidiaries listed in local currencies are analyzed by converting them into US dollars at the average exchange rate for the quarter announced by the IMF. (For exchange rates of major currencies relative to US dollars, please refer to page28) (2) Adjustment to deal with the gap in published values There is a gap between the results of this quarter and those of previous quarters, due to expansion of the scope of the survey (see 1-(4)-③ above: “investment rate over 50%” was changed to “50% or more”) since the April – June quarter of 2003. Therefore, comparisons between the current quarter and the corresponding quarter of the previous year are calculated and estimated by totaling figures only for overseas subsidiaries continuously subject to the survey since the corresponding quarter of the previous year. (3) Method for determining numerical values ① Quarterly numerical values Numerical values for this quarter will be finalized in the following quarter. ② Numerical values for the previous year (quarter and fiscal year totals) These are finalized in the quarter following the last quarter of the fiscal year (i.e., the April – June quarter) (inter-fiscal year amendment). Fiscal year totals are indicated by the letter “p” in the January – March quarter. (4) Annotations in the statistical tables - :No results. p : Preliminary estimated values. The numerical values for this quarter are preliminary
estimates, and may be changed in the following quarter. x : Signifies that data is being kept confidential, when there are only one or two parent
companies of overseas subsidiaries. This may even be done in cases where there are three or more companies, in order to avoid the risk of enabling the calculation of “x” from the data provided.
r : Shows the change from the publicized value (other than preliminary estimate) for the previous quarter.
(5) Tabulation method Data for all companies subject to the survey will be tabulated after estimating results for the companies that did not submit their responses, based on the following formula in each region and industry (the number of employees given in the previous quarter will be used in the case of employees). All items are estimated except “the amount of acquired tangible fixed assets.” Estimated values for this quarter for companies not submitting data
= value for corresponding quarter in previous year for relevant companies
total values for this quarter of companies that submitted data both this quarter and the same quarter in previous year
total values for same quarter in previous year of companies that submitted data both this quarter and the same quarter in previous year ×
5
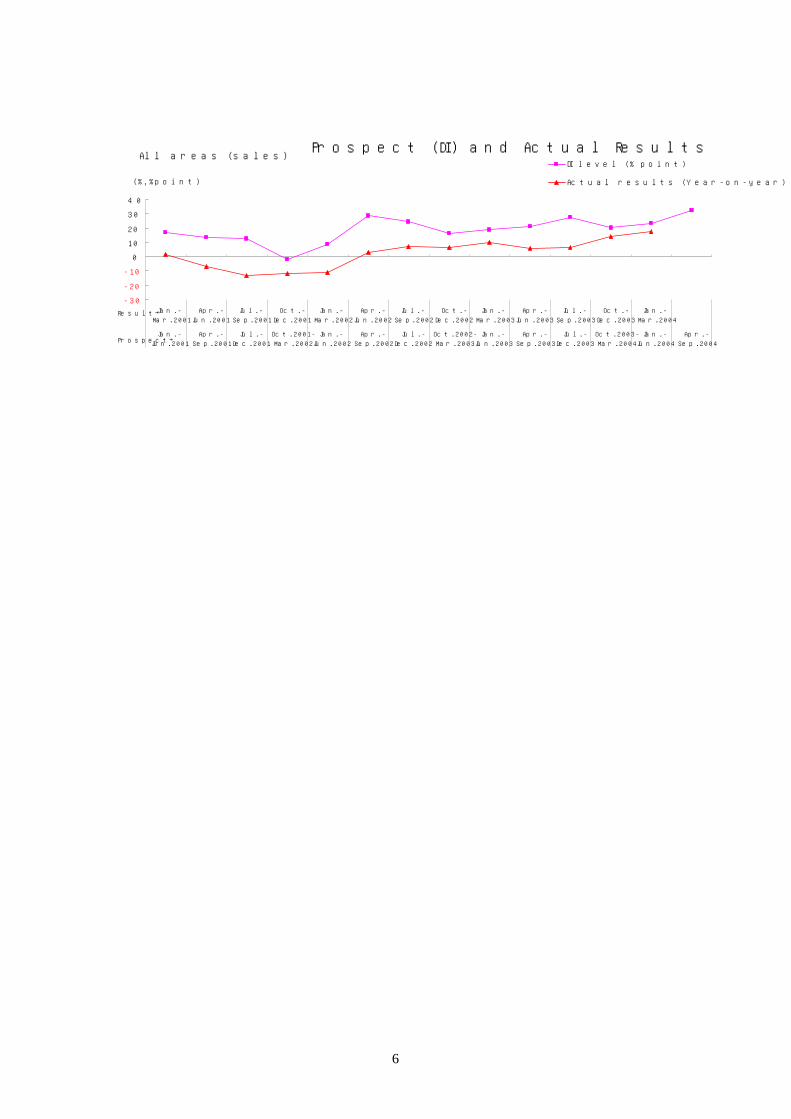
II. Findings of the survey 1. Sales trends [Results] Sales by overseas subsidiaries in the January – March quarter of 2004 totaled 124.76369 billion dollars (13.3784 trillion yen), a 17.3% increase compared to the same quarter of the previous year, and up for the eighth consecutive quarter. Conditions were favorable in major industries such as transportation equipment, general machinery, and electrical machinery, increasing by double digits for the seventh, third, and second consecutive quarters, respectively. Sales increased in all regions: China maintained a high level; Europe registered an increase for the eighth consecutive quarter; and the North American economic recovery contributed, as well. ・By industry, sales figures increased in 12 out of 13 industries. In particular, general machinery (up by 21.6% compared to the same quarter of the previous year) and transportation equipment (up 20.7%) have increased for the eighth consecutive quarters. In addition, electrical machinery (up 13.9%) increased by double digits for the second consecutive quarter due to a recovery in demand for personal computers and an expansion of digital household appliances. ・By region (country), Asia increased by 27.6% compared to the same quarter of the previous year, maintaining favorable conditions. In particular, China (including Hong Kong) (up 38.9%) increased in the 30% range, reflecting active business in IT-related industries. Europe (up 19.9%) maintained favorable conditions in transportation equipment and electrical machinery. In addition, in North America (up 9.2%) transportation equipment (up 12.6%) continued to increase its momentum, growing by double digits for the second consecutive quarter, while stagnant electrical machinery (down 0.6%) declined at a lower rate. [Prospects (for April – September 2004)] The indicator of overseas subsidiaries’ prospects (or “DI,” defined as the percentage of companies expecting an increase minus the percentage of companies expecting a decrease) for this quarter stood at 32.3 points, remaining positive for the 10th consecutive quarter. Compared to the previous quarter (current DI minus previous-quarter DI), there was an improvement of 8.9 points, reflecting the recovery in the world economy, as well as improvement in all regions for the second consecutive quarter. ・By industry, the DI was positive in all 13 industries such as transportation equipment (33.2 points), and electrical machinery (32.1 points). Compared to the previous quarter, improvements were notable in electrical machinery (up by 10.4 points), transportation equipment (up by 7.2 points), and general machinery (up by 5.2 points). ・By region (country), the DI was in positive double digits in all regions. In Asia (37.4 points), China (including Hong Kong) remained particularly high, at 46.4 points, with 6 industries recording DIs of more than 50 points. Compared to the previous quarter, improvements in North America (up by 5.4 points) and in Asia (up by 11.2 points) were notable. There were improvements in all regions (countries), and NIES3 in particular (up by 15.7 points) improved markedly. ・Compared to the previous quarter, NIES3 improved in 8 industries due to an improvement in general machinery (up by 35.0 points) and electrical machinery (up by 15.4 points).
6
Prospect (DI) and Actual Results
-30
-20
-10
0
10
20
30
40
Jan.-
Mar.2001
Apr.-
Jun.2001
Jul.-
Sep.2001
Oct.-
Dec.2001
Jan.-
Mar.2002
Apr.-
Jun.2002
Jul.-
Sep.2002
Oct.-
Dec.2002
Jan.-
Mar.2003
Apr.-
Jun.2003
Jul.-
Sep.2003
Oct.-
Dec.2003
Jan.-
Mar.2004
Jan.-
Jun.2001
Apr.-
Sep.2001
Jul.-
Dec.2001
Oct.2001-
Mar.2002
Jan.-
Jun.2002
Apr.-
Sep.2002
Jul.-
Dec.2002
Oct.2002-
Mar.2003
Jan.-
Jun.2003
Apr.-
Sep.2003
Jul.-
Dec.2003
Oct.2003-
Mar.2004
Jan.-
Jun.2004
Apr.-
Sep.2004
(%,%point)
DI level (% point)
Actual results (Year-on-year)
Result→
Prospect→
All areas (sales)
7
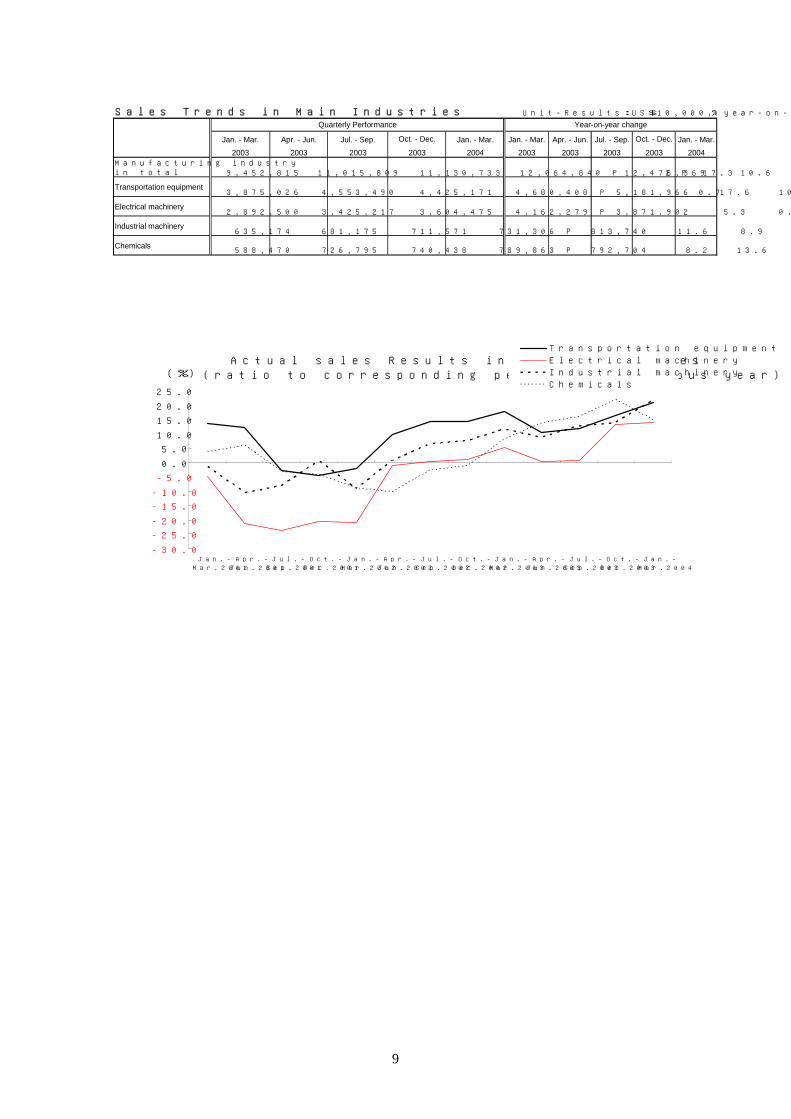
(1) Trends in primary industries ① Transportation equipment (sales share 41.5%) [Results] Sales in transportation equipment for this quarter amounted to 51.81966 billion dollars (5.5566 trillion yen), an increase of 20.7% compared to the same quarter of the previous year. ・By region (country), transportation equipment sales in North America, which accounted for 60% of sales in all regions, amounted to 29.35596 billion dollars (3.1478 trillion yen) reflecting a recovery in business. Sales here were up by 12.6% compared to the same quarter of the previous year, enjoying a double-digit increase for the second consecutive quarter. Sales in Europe, where Japanese automobiles have been increasing market share, registered 7.42578 billion dollars (796.3 billion yen), up by 25.4%, a double-digit increase for the eighth consecutive quarter. Sales in ASEAN4 amounted to 5.59741 billion dollars (600.2 billion yen) due to favorable conditions in Thailand and Indonesia, up by 27.3%. China (including Hong Kong) registered 1.78301 billion dollars (191.2 billion yen) due to positive domestic demand, up by 76.9%. Furthermore, NIES3 registered 1.00001 billion dollars (107.2 billion yen), up by 20.0%. [Prospects (for April – September 2004)] The DI was 33.2 points, remaining at a double-digit level for the 10th consecutive quarter. Compared to the previous quarter, it improved by 7.2 points (26.0 → 33.2). ・By region (country), the DI was in positive double digits in all regions (countries). Compared to the previous quarter, North America (up by 9.7 points) and Asia (up by 7.2 points) improved greatly, and an improvement in ASEAN4 was also notable. ② Electrical machinery (sales share 31.0%) [Results] Sales in electrical machinery for this quarter amounted to 38.71902 billion dollars (4.1518 trillion yen), an increase of 13.9% compared to the same quarter of the previous year. It increased by double digits for the second consecutive quarter due to a recovery in demand for personal computers and expansion in digital household appliances. ・By region (country), electrical machinery sales in Europe amounted to 9.61596 billion dollars (1.0311 trillion yen), up by 20.7% compared to the same quarter of the previous year, while sales in Asia amounted to 18.54614 billion dollars (1.9887 trillion yen), up by 21.5%. In particular, China (including Hong Kong) registered 6.52685 billion dollars (699.9 billion yen) due to positive domestic and foreign demand–a sharp rise of 39.7%. In contrast, sales in North America amounted to 9.94469 billion dollars (1.0664 trillion yen), a decline of 0.6%, but the drop was cushioned by a recovery in personal consumption. [Prospects (for April – September 2004)] The DI stood at 32.1 points, maintaining its double-digit level for the fifth consecutive quarter. Compared to the previous quarter, it improved by 10.4 points (21.7 → 32.1). ・By region (country), the DI has remained positive in all regions (countries) for the fourth consecutive quarters. Compared to the previous quarter, Asia improved by 14.1 points, and improvements in China (including Hong Kong; up by 16.1 points), and NIES3 (up by 15.4 points) were particularly notable. On the other hand, the DI declined in Europe (down by 1.3 points), worsening for the third consecutive quarter.
8
③ General machinery (sales share 6.5%) [Results] Sales in general machinery for this quarter amounted to 8.13740 billion dollars (872.6 billion yen), an increase of 21.6% compared to the same quarter of the previous year. ・By region (country), general machinery sales showed double digit increases in all regions. Sales in Asia amounted to 2.70053 billion dollars (289.6 billion yen), up by 28.9%, due to favorable conditions in office machinery. In particular, China (including Hong Kong) increased by 32.1%, a double digit rise for the fifth consecutive quarter. Furthermore, North America registered 3.30127 billion dollars (354.0 billion yen), up by 19.8%, and Europe registered 2.01202 billion dollars (215.7 billion yen), up by 15.7%. [Prospects (for April – September 2004)] The DI was 34.0 points, maintaining double-digit growth for the fifth consecutive quarter. Compared to the previous quarter, it improved by 5.2 points (28.8 → 34.0), up for the fifth consecutive quarter. ・By region (country), the DI showed positive double-digit growth in all regions (countries) including Asia (39.2 points), Europe (26.3 points), and North America (20.9 points). Compared to the previous quarter, North America (up by 5.0 points) and Asia (up by 5.6 points) recovered from a declining trend that had continued for two consecutive quarters. ④ Chemicals (sales share 6.4%) [Results] Sales of chemicals for this quarter amounted to 7.92704 billion dollars (850.0 billion yen), an increase of 14.8% compared to the same quarter of the previous year, rising for the fifth consecutive quarter. ・Chemicals sales increased in all regions except North America. Sales in Asia amounted to 2.92594 billion dollars (313.7 billion yen), up by 33.7%, and those in Europe amounted to 2.58120 billion dollars (276.0 billion yen), up by 17.3%. [Prospects (for April – September 2004)] The DI has been in positive double digits for the 10th consecutive quarters. Compared to the previous quarter, it improved by 12.3 points (25.0 → 37.3). ・The DI was positive in all regions. Compared to the previous quarter, Asia (up by 17.4 points) showed a double digit increase for the first time in the third consecutive quarters, and both North America (up by 8.0 points) and Europe (up by 3.7 points) showed improvements.
9
Sales Trends in Main Industries Unit-Results:US$10,000, year-on-year change:%
Manufacturing industryin total 9,452,815 11,015,809 11,130,733 12,064,840 P 12,476,369 10.6 6.0 6.6 14.2 P 17.3
Transportation equipment3,875,026 4,553,490 4,425,171 4,680,408 P 5,181,966 17.6 10.3 11.8 16.3 P 20.7
Electrical machinery2,892,500 3,425,217 3,604,475 4,162,279 P 3,871,902 5.3 0.3 0.7 13.3 P 13.9
Industrial machinery635,174 681,175 711,571 731,306 P 813,740 11.6 8.9 12.8 13.9 P 21.6
Chemicals588,470 726,795 740,438 789,863 P 792,704 8.2 13.6 16.0 21.9 P 14.8
2004 2003 2003 2003
Quarterly Performance Year-on-year change
Jan. - Mar. Apr. - Jun. Jul. - Sep. Oct. - Dec. Jan. - Mar. Jul. - Sep.2003 2003
Oct. - Dec. Jan. - Mar.200420032003 2003
Jan. - Mar. Apr. - Jun.
Actual sales Results in Main Industries(ratio to corresponding period of previous year)
-30.0
-25.0
-20.0
-15.0
-10.0
-5.0
0.0
5.0
10.0
15.0
20.0
25.0
Jan.-
Mar.2001
Apr.-
Jun.2001
Jul.-
Sep.2001
Oct.-
Dec.2001
Jan.-
Mar.2002
Apr.-
Jun.2002
Jul.-
Sep.2002
Oct.-
Dec.2002
Jan.-
Mar.2003
Apr.-
Jun.2003
Jul.-
Sep.2003
Oct.-
Dec.2003
Jan.-
Mar.2004
(%)
Transportation equipment
Electrical machinery
Industrial machinery
Chemicals
10
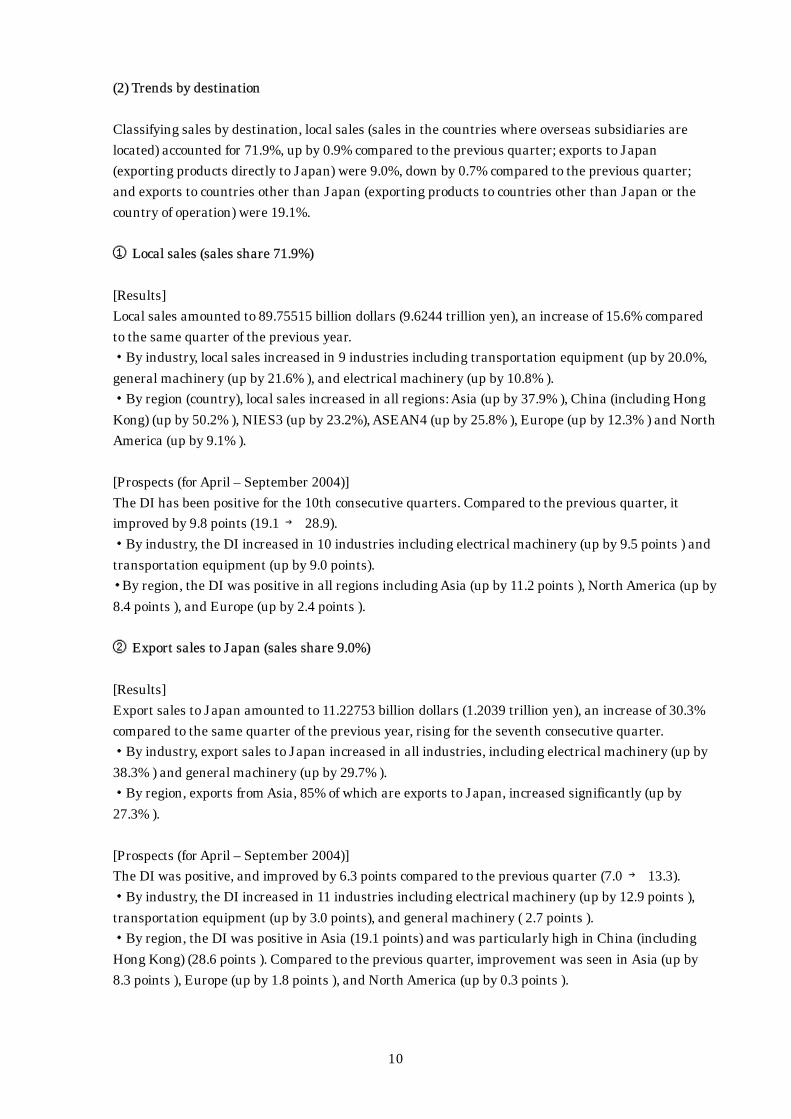
(2) Trends by destination Classifying sales by destination, local sales (sales in the countries where overseas subsidiaries are located) accounted for 71.9%, up by 0.9% compared to the previous quarter; exports to Japan (exporting products directly to Japan) were 9.0%, down by 0.7% compared to the previous quarter; and exports to countries other than Japan (exporting products to countries other than Japan or the country of operation) were 19.1%. ① Local sales (sales share 71.9%) [Results] Local sales amounted to 89.75515 billion dollars (9.6244 trillion yen), an increase of 15.6% compared to the same quarter of the previous year. ・By industry, local sales increased in 9 industries including transportation equipment (up by 20.0%, general machinery (up by 21.6% ), and electrical machinery (up by 10.8% ). ・By region (country), local sales increased in all regions: Asia (up by 37.9% ), China (including Hong Kong) (up by 50.2% ), NIES3 (up by 23.2%), ASEAN4 (up by 25.8% ), Europe (up by 12.3% ) and North America (up by 9.1% ). [Prospects (for April – September 2004)] The DI has been positive for the 10th consecutive quarters. Compared to the previous quarter, it improved by 9.8 points (19.1 → 28.9). ・By industry, the DI increased in 10 industries including electrical machinery (up by 9.5 points ) and transportation equipment (up by 9.0 points). ・By region, the DI was positive in all regions including Asia (up by 11.2 points ), North America (up by 8.4 points ), and Europe (up by 2.4 points ). ② Export sales to Japan (sales share 9.0%) [Results] Export sales to Japan amounted to 11.22753 billion dollars (1.2039 trillion yen), an increase of 30.3% compared to the same quarter of the previous year, rising for the seventh consecutive quarter. ・By industry, export sales to Japan increased in all industries, including electrical machinery (up by 38.3% ) and general machinery (up by 29.7% ). ・By region, exports from Asia, 85% of which are exports to Japan, increased significantly (up by 27.3% ). [Prospects (for April – September 2004)] The DI was positive, and improved by 6.3 points compared to the previous quarter (7.0 → 13.3). ・By industry, the DI increased in 11 industries including electrical machinery (up by 12.9 points ), transportation equipment (up by 3.0 points), and general machinery ( 2.7 points ). ・By region, the DI was positive in Asia (19.1 points) and was particularly high in China (including Hong Kong) (28.6 points ). Compared to the previous quarter, improvement was seen in Asia (up by 8.3 points ), Europe (up by 1.8 points ), and North America (up by 0.3 points ).
11
③ Export sales to countries other than Japan (sales share 19.1%) [Results] Export sales to countries other than Japan amounted to 23.78101 billion dollars (2.5500 trillion yen), representing an increase of 18.6% compared to the same quarter of the previous year and a rise for the seventh consecutive quarter. ・By industry, the increases in transportation equipment (up by 32.8% ) and general machinery (up by 17.9% ) were outstanding. Electrical machinery (up by 8.1%), which represents 50% of export sales to countries other than Japan, also increased. ・By region (country), export sales to countries other than Japan increased in all regions. Europe (up by 37.8%) increased sharply due to favorable conditions in electrical machinery. Among Asian nations (up by 14.1%), outstanding growth was seen in China (including Hong Kong) (up by 35.4%). Furthermore, North America (up by 4.0%) also showed an increase. [Prospects (for April – September 2004)] The DI has been in positive double digits for the fifth consecutive quarters. Compared to the previous quarter, it improved by 6.0 points (11.3 → 17.3). ・By industry, the DI improved in 10 industries including electrical machinery (up by 8.8 points ), rising for the first time in the third consecutive quarters, and transportation equipment (up by 4.6 points ), rising for the second consecutive quarter. In contrast, general machinery declined by 1.3 points. ・ By region, the DI improved in Asia (8.7 points), Europe (5.8 points ), and North America (up by 0.1
points ). 1.Results by destination Units (results:US$10,000; number of employees:persons) year-on-year change:%
Sales 9,452,815 11,015,809 11,130,733 12,064,840 P 12,476,369 10.6 6.0 6.6 14.2 P 17.3
Local sales 7,010,661 8,054,517 7,909,430 8,568,685 P 8,975,515 9.7 4.1 4.8 13.3 P 15.6
Exports to Japan 762,336 970,808 1,070,754 1,168,492 P 1,122,753 13.6 17.3 20.0 27.1 P 30.3
Exports to countries otherthan Japan 1,679,818 1,962,534 2,150,549 2,327,663 P 2,378,101 13.0 8.6 7.2 11.3 P 18.6
(Parent-subsidiary deals)
Export to the parentcompany in Japan 528,044 633,172 640,406 677,612 P 689,480 25.7 19.2 8.0 13.5 P 19.1Import from the parentcompany in Japan 1,131,127 1,229,426 1,269,626 1,422,514 P 1,433,437 22.3 0.8 -0.6 14.5 P 17.5
r 315,970 312,379 304,720 349,247 P 396,135 r 15.3 14.1 7.2 12.2 P 1.1
Number of employees1,976,297 2,261,572 2,316,947 2,331,489 P 2,346,034 3.9 2.5 2.8 3.2 P 3.2
2. Outlook by destination(DI) (Unit:%points)
DI
Sales21.4 28.0 20.3 23.4 P 32.3 2.7 6.6 -7.7 3.1 P 8.9
Local sales18.0 22.9 17.7 19.1 P 28.9 0.7 4.9 -5.2 1.4 P 9.8
Exports to Japan3.8 8.2 5.9 7.0 P 13.3 1.6 4.4 -2.3 1.1 P 6.3
Exports to countries otherthan Japan 11.7 13.0 10.8 11.3 P 17.3 4.5 1.3 -2.2 0.5 P 6.0
(Parent-subsidiary deals)
Export to the parentcompany in Japan 3.8 8.2 6.2 7.4 P 12.8 0.7 4.4 -2.0 1.2 P 5.4Import from the parentcompany in Japan 9.5 8.7 6.0 7.6 P 12.6 3.4 -0.8 -2.7 1.6 P 5.0
12.7 17.4 12.8 17.0 P 20.5 0.8 4.7 -4.6 4.2 P 3.5
Number of employees1.0 4.2 2.3 6.5 P 8.7 -2.9 3.2 -1.9 4.2 P 2.2
2004
Oct. - Dec.
2003 -Mar.2004 200320042004
2004
2003
2003 2003 20032003 2003 20032003
2004
2003
2003 -Mar.2004 2004
Jul. - Sep. Oct. - Dec.
Quarterly Performance Year-on-year change
Jan. - Mar.
Acquisition of tangible fixedassets
Ratio to previous quarter
Jan. - Mar. Jan. - Mar. Apr. - Jun. Jul. - Sep.Jan. - Mar. Apr. - Jun.
Apr. - Sep. Jul. - Dec. Oct.2003 Jan. - Jun. Jan. - Jun. Apr. - Sep.
Acquisition of tangible fixedassets
Apr. - Sep. Apr. - Sep. Jul. - Dec. Oct.2003
12
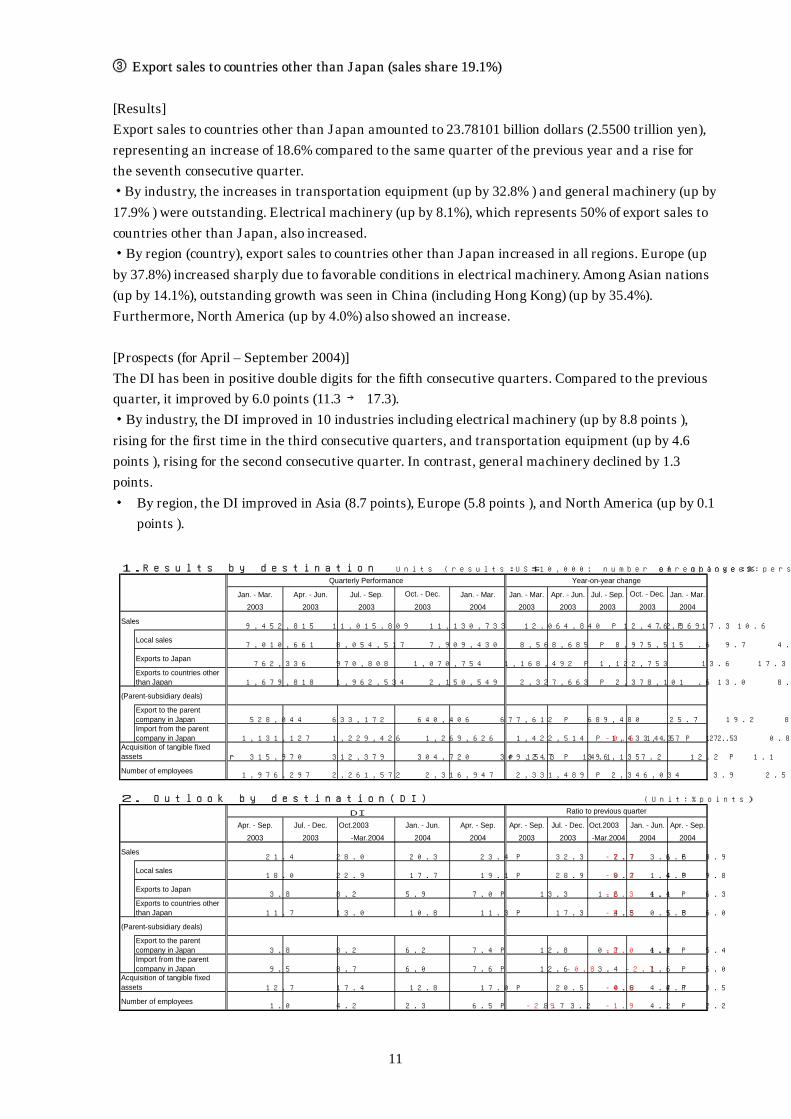
2. Equipment investment trends [Results] Equipment investment (the amount of acquired tangible fixed assets, excluding land) totaled 3.96135 billion dollars (424.8 billion yen), an increase of 1.1% compared to the same quarter of the previous year, up for the fifth consecutive quarter. ・By industry, equipment investment in electrical machinery totaled 1.10566 billion dollars (118.6 billion yen) (up by 32.7% ), rising for the third consecutive quarter. On the other hand, investment in transportation equipment totaled just 2.10855 billion dollars (226.1 billion yen), a decrease of 20.0%. This decline was a reaction to large amounts of investment the previous year. ・By region, the increase in Asia (up by 21.2% ) was notable, especially in ASEAN4 (up by 37.2% ). China (including Hong Kong) (up by 9.9% ) also registered significant growth for the fifth consecutive quarter. In contrast, equipment investment in Europe (down by 7.9% ) decreased for the fifth consecutive quarter. ・Investment in transportation equipment increased notably in ASEAN4 (up by 59.3% ), and investment in electrical machinery showed significant growth in North America (up by 50.0%). 1.Changes in equipment investments by major industry Unit-Results:US$10,000, year-on-year change:%
Quarterly Perfomance Year-on-year change
Jan.-Mar.2003
Apr.-Jun.2003
Jul.- Sep.2003
Oct.-Dec.2003
Jan.-Mar.2004
Jan.-Mar.2003
Apr.-Jun.2003
Jul.- Sep.2003
Oct.-Dec.2003
Jan.-Mar.2004
Total r 315,970 312,379 304,720 349,247 P 396,135 r 15.3 14.1 7.2 12.2 P 1.1Transportation
equipment 206,286 182,562 173,039 205,848 P 210,855 36.9 37.8 8.0 13.8 P -20.0 Electricalmachinery r 65,718 68,580 66,653 79,128 P 110,566 r 0.5 -14.1 16.5 35.2 P 32.7Industrialmachinery 7,307 6,894 12,811 11,924 P 10,934 -29.5 -18.6 66.7 72.9 P 43.1
Chemicals 10,909 22,825 20,413 15,697 P 24,473 1.1 9.0 -15.6 -22.8 P 100.4
Actual results of equipment investment by major industry(ratio to corresponding period of previous year)
-60.0
-40.0
-20.0
0.0
20.0
40.0
60.0
80.0
100.0
Oct.-Dec.2002 Jan.-Mar.2003 Apr.-Jun.2003 Jul.-Sep.2003 Oct.-Dec.2003 Jan.-Mar.2004
(%)Total
Transportation equipment
Electrical machinery
Industrial machinery
Chemicals
13
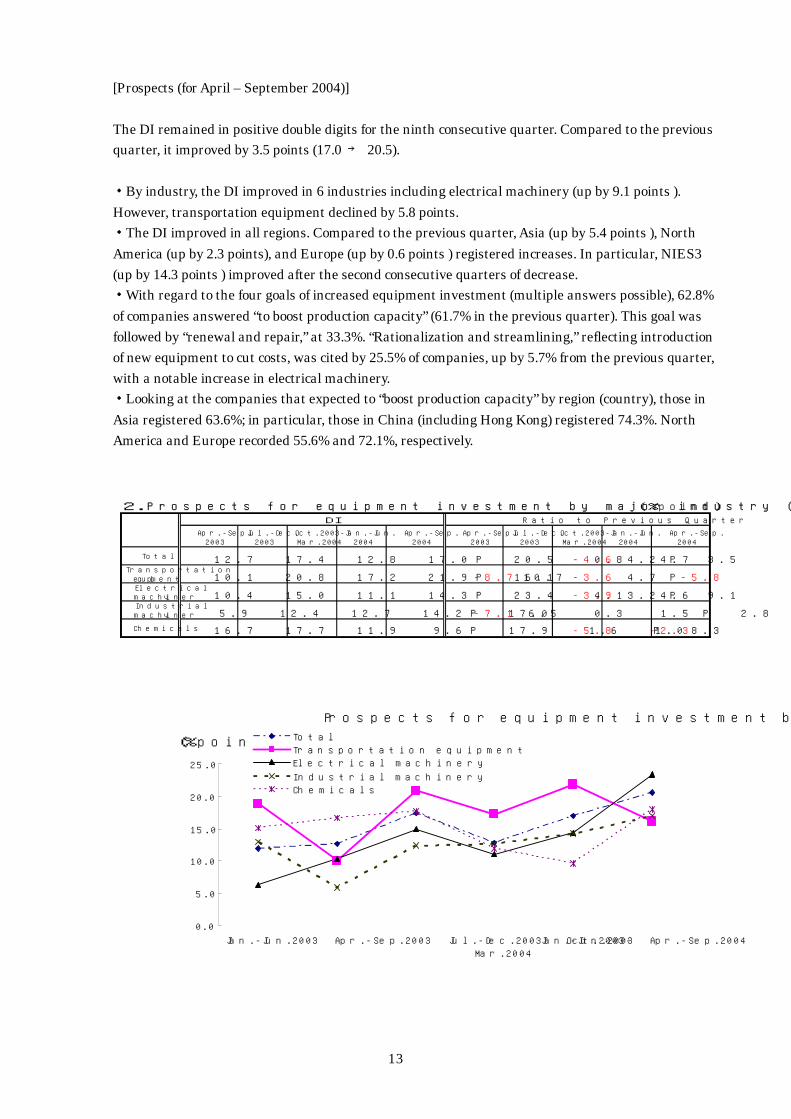
[Prospects (for April – September 2004)] The DI remained in positive double digits for the ninth consecutive quarter. Compared to the previous quarter, it improved by 3.5 points (17.0 → 20.5). ・By industry, the DI improved in 6 industries including electrical machinery (up by 9.1 points ). However, transportation equipment declined by 5.8 points. ・The DI improved in all regions. Compared to the previous quarter, Asia (up by 5.4 points ), North America (up by 2.3 points), and Europe (up by 0.6 points ) registered increases. In particular, NIES3 (up by 14.3 points ) improved after the second consecutive quarters of decrease. ・With regard to the four goals of increased equipment investment (multiple answers possible), 62.8% of companies answered “to boost production capacity” (61.7% in the previous quarter). This goal was followed by “renewal and repair,” at 33.3%. “Rationalization and streamlining,” reflecting introduction of new equipment to cut costs, was cited by 25.5% of companies, up by 5.7% from the previous quarter, with a notable increase in electrical machinery. ・Looking at the companies that expected to “boost production capacity” by region (country), those in Asia registered 63.6%; in particular, those in China (including Hong Kong) registered 74.3%. North America and Europe recorded 55.6% and 72.1%, respectively. 2.Prospects for equipment investment by major industry (DI) (%point)
DI Ratio to Previous Quarter
Apr.-Sep.2003
Jul.-Dec.2003
Oct.2003-Mar.2004
Jan.-Jun.2004
Apr.-Sep.2004
Apr.-Sep.2003
Jul.-Dec.2003
Oct.2003-Mar.2004
Jan.-Jun.2004
Apr.-Sep.2004
Total 12.7 17.4 12.8 17.0 P 20.5 0.8 4.7 -4.6 4.2 P 3.5Transportation
equipment 10.1 20.8 17.2 21.9 P 16.1 -8.7 10.7 -3.6 4.7 P -5.8 Electricalmachinery 10.4 15.0 11.1 14.3 P 23.4 4.1 4.6 -3.9 3.2 P 9.1Industrialmachinery 5.9 12.4 12.7 14.2 P 17.0 -7.1 6.5 0.3 1.5 P 2.8
Chemicals 16.7 17.7 11.9 9.6 P 17.9 1.6 1.0 -5.8 -2.3 P 8.3
Prospects for equipment investment by major industry (DI)
0.0
5.0
10.0
15.0
20.0
25.0
Jan.-Jun.2003 Apr.-Sep.2003 Jul.-Dec.2003 Oct.2003-
Mar.2004
Jan.-Jun.2003 Apr.-Sep.2004
(%point) Total
Transportation equipment
Electrical machinery
Industrial machinery
Chemicals
14
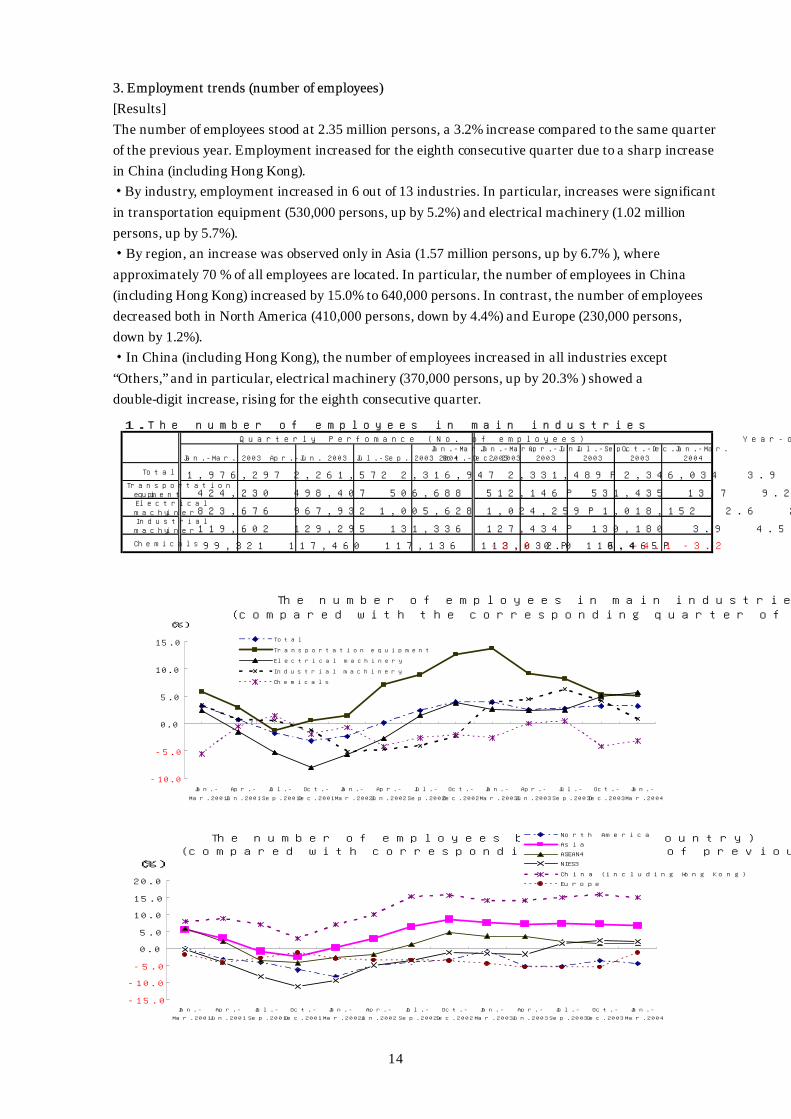
3. Employment trends (number of employees) [Results] The number of employees stood at 2.35 million persons, a 3.2% increase compared to the same quarter of the previous year. Employment increased for the eighth consecutive quarter due to a sharp increase in China (including Hong Kong). ・By industry, employment increased in 6 out of 13 industries. In particular, increases were significant in transportation equipment (530,000 persons, up by 5.2%) and electrical machinery (1.02 million persons, up by 5.7%). ・By region, an increase was observed only in Asia (1.57 million persons, up by 6.7% ), where approximately 70 % of all employees are located. In particular, the number of employees in China (including Hong Kong) increased by 15.0% to 640,000 persons. In contrast, the number of employees decreased both in North America (410,000 persons, down by 4.4%) and Europe (230,000 persons, down by 1.2%). ・In China (including Hong Kong), the number of employees increased in all industries except “Others,” and in particular, electrical machinery (370,000 persons, up by 20.3% ) showed a double-digit increase, rising for the eighth consecutive quarter.
1.The number of employees in main industriesQuarterly Perfomance (No. of employees) Year-on-year change (%)
Jan.-Mar. 2003 Apr.-Jun. 2003 Jul.-Sep. 2003 Oct.-Dec. 2003Jan.-Mar.
2004Jan.-Mar.
2003Apr.-Jun.
2003Jul.-Sep.
2003Oct.-Dec.
2003Jan.-Mar.
2004
Total 1,976,297 2,261,572 2,316,947 2,331,489 P 2,346,034 3.9 2.5 2.8 3.2 P 3.2Transportation
equipment 424,230 498,407 506,688 512,146 P 531,435 13.7 9.2 8.2 5.3 P 5.2Electricalmachinery 823,676 967,932 1,005,628 1,024,259 P 1,018,152 2.6 2.3 2.5 5.0 P 5.7Industrialmachinery 119,602 129,295 131,336 127,434 P 130,180 3.9 4.5 6.3 4.1 P 0.9
Chemicals 99,321 117,460 117,136 113,032 P 115,465 -2.6 0.0 0.4 -4.1 P -3.2
The number of employees in main industries(compared with the corresponding quarter of previous year)
-10.0
-5.0
0.0
5.0
10.0
15.0
Jan.-
Mar.2001
Apr.-
Jun.2001
Jul.-
Sep.2001
Oct.-
Dec.2001
Jan.-
Mar.2002
Apr.-
Jun.2002
Jul.-
Sep.2002
Oct.-
Dec.2002
Jan.-
Mar.2003
Apr.-
Jun.2003
Jul.-
Sep.2003
Oct.-
Dec.2003
Jan.-
Mar.2004
(%)
Total
Transportation equipment
Electrical machinery
Industrial machinery
Chemicals
The number of employees by region (country)(compared with corresponding quarter of previous year)
-15.0
-10.0
-5.0
0.0
5.0
10.0
15.0
20.0
Jan.-
Mar.2001
Apr.-
Jun.2001
Jul.-
Sep.2001
Oct.-
Dec.2001
Jan.-
Mar.2002
Apr.-
Jun.2002
Jul.-
Sep.2002
Oct.-
Dec.2002
Jan.-
Mar.2003
Apr.-
Jun.2003
Jul.-
Sep.2003
Oct.-
Dec.2003
Jan.-
Mar.2004
(%)
North America
Asia
ASEAN4
NIES3
China (including Hong Kong)
Europe
15
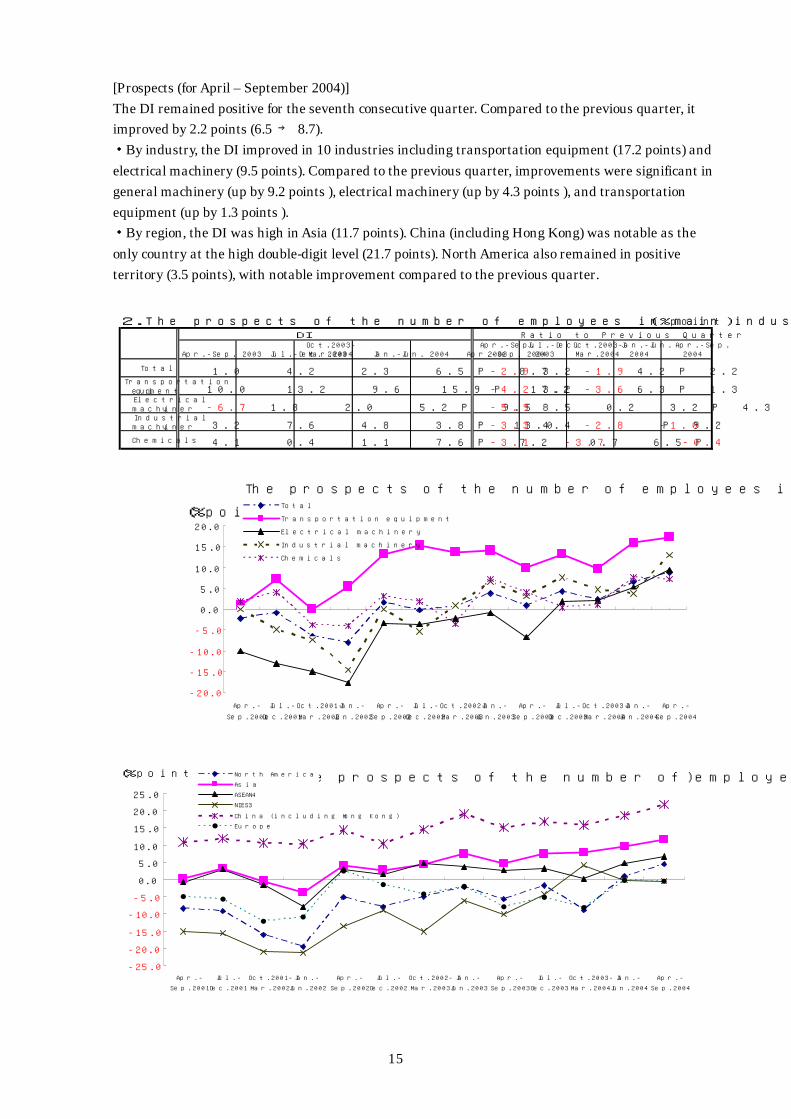
[Prospects (for April – September 2004)] The DI remained positive for the seventh consecutive quarter. Compared to the previous quarter, it improved by 2.2 points (6.5 → 8.7). ・By industry, the DI improved in 10 industries including transportation equipment (17.2 points) and electrical machinery (9.5 points). Compared to the previous quarter, improvements were significant in general machinery (up by 9.2 points ), electrical machinery (up by 4.3 points ), and transportation equipment (up by 1.3 points ). ・By region, the DI was high in Asia (11.7 points). China (including Hong Kong) was notable as the only country at the high double-digit level (21.7 points). North America also remained in positive territory (3.5 points), with notable improvement compared to the previous quarter. 2.The prospects of the number of employees in main industries (%point)
DI Ratio to Previous Quarter
Apr.-Sep. 2003 Jul.-Dec. 2003Oct.2003-Mar.2004 Jan.-Jun. 2004 Apr.-Sep. 2004
Apr.-Sep.2003
Jul.-Dec.2003
Oct.2003-Mar.2004
Jan.-Jun.2004
Apr.-Sep.2004
Total 1.0 4.2 2.3 6.5 P 8.7 -2.9 3.2 -1.9 4.2 P 2.2Transportation
equipment 10.0 13.2 9.6 15.9 P 17.2 -4.2 3.2 -3.6 6.3 P 1.3Electricalmachinery -6.7 1.8 2.0 5.2 P 9.5 -5.9 8.5 0.2 3.2 P 4.3Industrialmachinery 3.2 7.6 4.8 3.8 P 13.0 -3.3 4.4 -2.8 -1.0 P 9.2
Chemicals 4.1 0.4 1.1 7.6 P 7.2 -3.1 -3.7 0.7 6.5 P -0.4
The prospects of the number of employees in main industries (DI)
-20.0
-15.0
-10.0
-5.0
0.0
5.0
10.0
15.0
20.0
Apr.-
Sep.2001
Jul.-
Dec.2001
Oct.2001-
Mar.2002
Jan.-
Jun.2002
Apr.-
Sep.2002
Jul.-
Dec.2002
Oct.2002-
Mar.2003
Jan.-
Jun.2003
Apr.-
Sep.2003
Jul.-
Dec.2003
Oct.2003-
Mar.2004
Jan.-
Jun.2004
Apr.-
Sep.2004
(%point)Total
Transportation equipment
Electrical machinery
Industrial machinery
Chemicals
The prospects of the number of employees by region (country) (DI)
-25.0
-20.0
-15.0
-10.0
-5.0
0.0
5.0
10.0
15.0
20.0
25.0
Apr.-
Sep.2001
Jul.-
Dec.2001
Oct.2001-
Mar.2002
Jan.-
Jun.2002
Apr.-
Sep.2002
Jul.-
Dec.2002
Oct.2002-
Mar.2003
Jan.-
Jun.2003
Apr.-
Sep.2003
Jul.-
Dec.2003
Oct.2003-
Mar.2004
Jan.-
Jun.2004
Apr.-
Sep.2004
(%point) North America
Asia
ASEAN4
NIES3
China (including Hong Kong)
Europe
16
4. Intra-company transaction trends (1) Exports to parent companies in Japan [Results] Exports to parent companies in Japan amounted to 6.89480 billion dollars (739.3 billion yen), an increase of 19.1% compared to the same quarter of the previous year. ・By industry, exports to parent companies in Japan increased in 11 industries including electrical machinery (up by 25.1%), which accounts for 60% of this category of exports. ・By region, exports from North America (up by 33.0% ), Asia (up by 16.3% ), and Europe (up by 87.9% ) all increased. [Prospects (for April – September 2004)] The DI remained positive for the ninth consecutive quarter. Compared to the previous quarter, it improved by 5.4 points (7.4 → 12.8). ・By industry, the DI was positive in all industries including electrical machinery (19.7 points) and general machinery (11.8 points). Compared to the previous quarter, increases were observed in 11 industries. Decreases were seen in electrical machinery (down by 1.1 points ) and fabricated metals (down by 21.4 points ). ・By region, the DI was high in Asia (19.0 points), especially in China (including Hong Kong) which registered 26.7 points. Compared to the previous quarter, improvements were observed in Asia (up by 7.5 points ), North America (up by 1.8 points ), and Europe (up by 0.1 points ). (2) Imports from parent companies in Japan [Results] Imports from parent companies in Japan amounted to 14.33437 billion dollars (1.5371 trillion yen), an increase of 17.5% compared to the same quarter of the previous year. ・By industry, there were increases in 11 industries, including electrical machinery (up by 20.5%), which accounts for 39% of these imports, transportation equipment (up by 6.6% ), which accounts for 37% of these imports, precision instruments (up by 1.0%) and general machinery (up by 56.6%). ・By region, growth in Asia (up by 25.7% ) for imports from parent companies in Japan was significant. In particular, China (including Hong Kong) increased notably (up by 52.7 %). Increases were also seen in Europe (up by 33.7%) and North America (up by 7.0%). [Prospects (for April – September 2004)] The DI remained positive for the ninth consecutive quarter. Compared to the previous quarter, it improved by 5.0 points (7.6 → 12.6). ・By industry, the DI improved in 11 industries including transportation equipment (up by 10.1 points ) and general machinery (up by 1.9 points ). ・By region, the DI increased in Asia (up by 8.5 points ) and Europe (up by 4.4 points ). However, it declined in North America (down by 5.1 points ).
17
(3) Intra-company trade balances With regard to intra-company trade balances (imports and exports from and to parent companies in Japan), imports from parent companies in Japan exceeded exports by 7.43957 billion dollars (797.8 billion yen), up by 23.4% compared to the same quarter of the previous year. ・By industry, transportation equipment accounted for approximately 70% of total excess imports, up by 4.6%. Electrical machinery accounted for 20% of total excess imports, down by 9.7%. ・By region, excess imports to North America, accounting for 71.7% of total excess imports, amounted to 5.33420 billion dollars (572.0 billion yen), up by 7.4%. Excess exports from Asia amounted to 1.12433 billion dollars (120.6 billion yen), down by 12.5 %.
18
5. Trends by region (1) North America (sales share 41.7%) [Results] ① Sales in North America amounted to 52.01600 billion dollars (5.5777 trillion yen), an increase of 9.2% compared to the same quarter of the previous year. ・By industry, sales of electrical machinery declined (down by 0.6% ). Meanwhile, increases were seen in the heavily-weighted category of transportation equipment (up by 12.6%) and in general machinery (up by 19.8%). ・By destination, total local sales amounted to 47.64874 billion dollars (5.1086 trillion yen), an increase of 9.1%. This accounted for 91.6% of sales in North America. ② Equipment investment (the amount of acquired tangible fixed assets excluding land) amounted to 1.82373 billion dollars (195.6 billion yen), a decrease of 8.6%. ・By industry, investment decreased in 4 industries including transportation equipment (down by 27.6% ). In contrast, investment in electrical machinery increased significantly (up by 50.0 %). ③ Employment (the number of employees) decreased again to 410,000 persons, a decline of 4.4%. ・By industry, employment decreased in 11 industries including electrical machinery (down by 14.9% ) and general machinery (down by 5.5% ), whereas it increased in transportation equipment (up by 6.5% ). [Prospects (for April – September 2004)] ① The sales DI was positive in all industries except precision instruments (down by 33.3 points). It increased 5.4 points compared to the previous quarter ・By industry, the sales DI improved in 6 out of 13 industries. Transportation equipment increased by 9.7 points, continuing to improve from the previous quarter. ② The equipment investment DI (the amount of acquired tangible fixed assets excluding land) was 14.0 points, rising for the 10th consecutive quarter. Compared to the previous quarter, it improved by 2.3 points. ・By industry, the equipment investment DI improved in 7 industries including transportation equipment and electrical machinery. ③ The employment DI was 4.4 points, rising for the second consecutive quarter. Compared to the previous quarter, it improved by 3.5 points. ・By industry, the employment DI was positive in 8 industries including transportation equipment, whereas electrical machinery declined for the 14th consecutive quarter. Compared to the previous quarter, the employment DI improved in 7 industries including transportation equipment and general machinery

19
1.Trends among overseas subsidiaries in North America Units (results:US$10,000; number of employees:persons) year-on-year change:%
Sales4,459,608 4,781,144 4,662,939 4,866,641 P 5,201,600 5.4 -1.6 1.0 7.9 P 9.2
Local sales4,109,130 4,398,880 4,268,508 4,463,673 P 4,764,874 5.2 -2.1 1.0 8.7 P 9.1
Exports to Japan65,772 71,021 80,742 83,166 P 100,290 12.5 -0.8 17.3 28.3 P 42.0
Exports to countries otherthan Japan 284,706 303,755 313,689 319,802 P 336,437 8.1 4.9 -2.6 -6.2 P 4.0
r 172,129 156,405 147,166 177,263 P 182,373 r 14.9 36.3 19.4 22.8 P -8.6
Number of employees401,771 420,980 425,724 422,166 P 412,981 -0.7 -5.3 -5.3 -3.6 P -4.4
Trends in main industry sales Units (results:US$10,000;) Year-on-year change:%
Manufacturing industryin total 4,459,608 4,781,144 4,662,939 4,866,641 P 5,201,600 5.4 -1.6 1.0 7.9 P 9.2
Transportation equipment2,434,228 2,702,235 2,514,037 2,627,107 P 2,935,596 11.1 2.1 5.5 12.7 P 12.6
Electrical machinery943,677 906,653 961,463 1,048,526 P 994,469 0.9 -8.5 -6.6 -1.2 P -0.6
Industrial machinery262,835 255,167 274,958 282,722 P 330,127 7.8 -1.7 9.0 9.9 P 19.8
Chemicals207,191 239,079 244,084 247,194 P 231,301 11.0 11.1 17.6 18.3 P -3.2
Jul. - Sep. Oct. - Dec. Jan. - Mar.2003 2003 20042003
Quarterly Performance Year-on-year change
Jan. - Mar. Apr. - Jun. Jul. - Sep. Oct. - Dec. Jan. - Mar. Jan. - Mar. Apr. - Jun.2003 2003 2003 2003 2004 2003
2003 2003 20032003 2003 2003 2003 2003 20042004
Oct. - Dec.
Quarterly performance Year-on-year change
Oct. - Dec. Jan. - Mar.
Acquisition of tangible fixedassets
Jan. - Mar. Jan. - Mar. Apr. - Jun. Jul. - Sep.Jan. - Mar. Apr. - Jun. Jul. - Sep.
2.Outlook for North America (Unit:%points)
DI
Sales19.7 21.6 12.5 19.0 P 24.4 3.8 1.9 -9.1 6.5 P 5.4
Local sales21.9 21.4 12.8 19.9 P 28.3 6.7 -0.5 -8.6 7.1 P 8.4
Exports to Japan-2.9 -5.5 0.7 -0.7 P -0.4 2.2 -2.6 6.2 -1.4 P 0.3
Exports to countries otherthan Japan 7.2 7.1 6.5 9.2 P 9.3 2.1 -0.1 -0.6 2.7 P 0.1
13.1 18.8 8.8 11.7 P 14.0 7.5 5.7 -10.0 2.9 P 2.3
Number of employees-5.7 -1.7 -9.0 0.9 P 4.4 -3.5 4.0 -7.3 9.9 P 3.5
Trends in main industry outlook (Unit:%points)
DI
Manufacturing industryin total 19.7 21.6 12.5 19.0 P 24.4 3.8 1.9 -9.1 6.5 P 5.4
Transportation equipment26.0 13.0 5.1 14.1 P 23.8 -4.7 -13.0 -7.9 9.0 P 9.7
Electrical machinery5.7 28.3 20.6 13.7 P 13.7 7.1 22.6 -7.7 -6.9 P 0.0
Industrial machinery2.8 25.0 19.3 15.9 P 20.9 2.8 22.2 -5.7 -3.4 P 5.0
Chemicals13.6 15.4 7.1 17.0 P 25.0 1.4 1.8 -8.3 9.9 P 8.0
Apr. - Sep.Apr. - Sep. Apr. - Sep. Jul. - Dec. Oct.2003Apr. - Sep. Jul. - Dec. Oct.2003 Jan. - Jun.
Oct.2003 Jan. - Jun.
Jan. - Jun.
Apr. - Sep.
Ratio to previous quarter
Apr. - Sep. Jul. - Dec. Oct.2003 Jan. - Jun. -Mar.2004 2004 2004
Ratio to previous quarter
Acquisition of tangible fixedassets
Apr. - Sep. Apr. - Sep.2004 2003 20032003 -Mar.2004 2004
Jul. - Dec.
-Mar.2004 2004 20042003 2003 2003 2004
2003
2003 -Mar.20042004
Prospects (DI) and Actual Results
-30
-20
-10
0
10
20
30
40
Jan.-Mar.2001 Apr.-Jun.2001 Jul.-Sep.2001 Oct.-Dec.2001 Jan.-Mar.2002 Apr.-Jun.2002 Jul.-Sep.2002 Oct.-Dec.2002 Jan.-Mar.2003 Apr.-Jun.2003 Jul.-Sep.2003 Oct.-Dec.2003 Jan.-Mar.2004
Jan.-Jun.2001 Apr.-Sep.2001 Jul.-Dec.2001 Oct.2001-
Mar.2002
Jan.-Jun.2002 Apr.-Sep.2002 Jul.-Dec.2002 Oct.2002-
Mar.2003
Jan.-Jun.2003 Apr.-Sep.2003 Jul.-Dec.2003 Oct.2003-
Mar.2004
Jan.-Jun.2004 Apr.-Sep.2004
(%,%point) DI level (% point)
Actual results (rate to corresponding period of previous year)
Results→Prospects→
North America(sales)
20
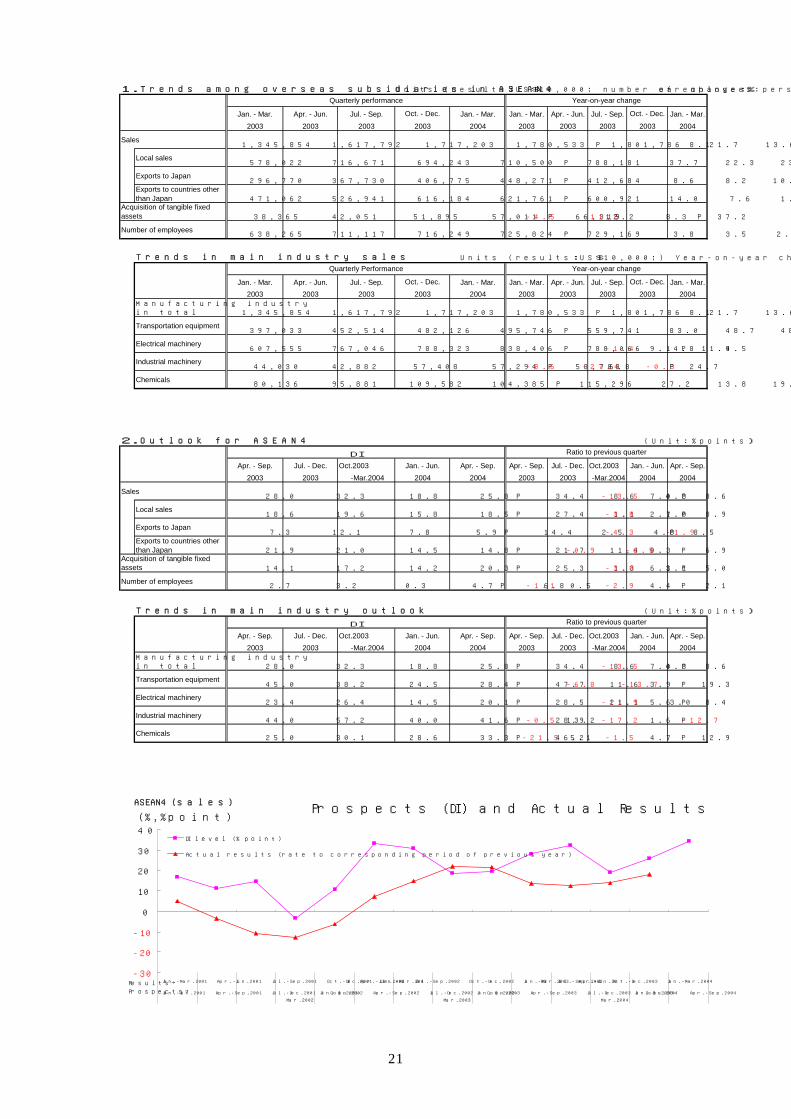
(2) ASEAN4 (sales share 14.4%) [Results] ① Sales in ASEAN4 amounted to 18.01786 billion dollars (1.9321 trillion yen), an increase of 18.1% compared to the same quarter of the previous year. ・By industry, sales of transportation equipment (up by 27.3% ) increased sharply in Thailand and Indonesia, while sales of general machinery also increased (up by 11.9% ). ・By destination, sales increased for all destinations. Total local sales, which accounts for 40% of total sales, amounted to 7.88181 billion dollars (844.9 billion yen), an increase of 25.8%. Export sales to countries other than Japan amounted to 6.00921 billion dollars (644.4 billion yen), up by 6.5%, and export sales to Japan amounted to 4.12684 billion dollars (442.5 billion yen), up by 21.5%. ② Equipment investment amounted to 663.19 million dollars (71.1 billion yen), an increase of 37.2%. ・By industry, transportation equipment increased by 59.3%, rising sharply for the eighth consecutive quarter. Electrical machinery also increased by 37.0%. ③ Employment (the number of employees) increased by 1.5% to 730,000 persons, rising for the seventh consecutive quarter. ・By industry, employment increased in 5 industries including electrical machinery (up by 4.6% ) and transportation equipment (up by 1.7% ). [Prospects (for April – September 2004)] ① The sales DI was 34.4 points, an increase of 8.6 points compared to the previous quarter. ・By industry, the sales DI was positive in all industries. Compared to the previous quarter, it improved in 8 industries including transportation equipment and electrical machinery, whereas it declined in general machinery. ② The equipment investment DI improved by 5.0 points. ・By industry, the equipment investment DI improved in 6 industries including general machinery and electrical machinery. ③ The employment DI improved by 2.1 points. ・By industry, it improved in 7 industries including transportation equipment and electrical machinery.
21
1.Trends among overseas subsidiaries in ASEAN4 Units (results:US$10,000; number of employees:persons) year-on-year change:%
Sales1,345,854 1,617,792 1,717,203 1,780,533 P 1,801,786 21.7 13.6 12.5 13.9 P 18.1
Local sales578,022 716,671 694,243 710,500 P 788,181 37.7 22.3 23.7 16.3 P 25.8
Exports to Japan296,770 367,730 406,775 448,271 P 412,684 8.6 8.2 10.1 15.9 P 21.5
Exports to countries otherthan Japan 471,062 526,941 616,184 621,761 P 600,921 14.0 7.6 1.9 9.2 P 6.5
38,365 42,051 51,895 57,011 P 66,319 -4.5 -11.5 12.2 8.3 P 37.2
Number of employees638,265 711,117 716,249 725,824 P 729,169 3.8 3.5 2.1 1.5 P 1.5
Trends in main industry sales Units (results:US$10,000;) Year-on-year change:%
Manufacturing industryin total 1,345,854 1,617,792 1,717,203 1,780,533 P 1,801,786 21.7 13.6 12.5 13.9 P 18.1
Transportation equipment397,033 452,514 482,126 495,746 P 559,741 83.0 48.7 48.3 24.8 P 27.3
Electrical machinery607,555 767,046 788,323 838,406 P 788,066 4.8 4.5 -1.4 9.1 P 11.9
Industrial machinery44,030 42,882 57,408 57,294 P 58,788 -8.6 -27.4 6.8 -0.3 P 24.7
Chemicals80,136 95,881 109,582 104,385 P 115,296 27.2 13.8 19.9 19.3 P 29.0
Jan. - Mar. Jan. - Mar. Apr. - Jun. Jan. - Mar.
Oct. - Dec. Jan. - Mar.
Acquisition of tangible fixedassets
Quarterly Performance Year-on-year change
Jan. - Mar. Apr. - Jun. Jul. - Sep.20042003
Jan. - Mar. Apr. - Jun. Jul. - Sep.
Jan. - Mar.Jan. - Mar. Apr. - Jun. Jul. - Sep. Oct. - Dec.
2003 2003
Quarterly performance Year-on-year change
2004
20042003 2003 2003
2003 2003
Jul. - Sep. Oct. - Dec.
2003 2003
2003 2003
Oct. - Dec.
2003 2003 2004 2003
2003
2.Outlook for ASEAN4 (Unit:%points)
DI
Sales28.0 32.3 18.8 25.8 P 34.4 8.6 4.3 -13.5 7.0 P 8.6
Local sales18.6 19.6 15.8 18.5 P 27.4 1.1 1.0 -3.8 2.7 P 8.9
Exports to Japan7.3 12.1 7.8 5.9 P 14.4 2.5 4.8 -4.3 -1.9 P 8.5
Exports to countries otherthan Japan 21.9 21.0 14.5 14.8 P 21.7 11.4 -0.9 -6.5 0.3 P 6.9
14.1 17.2 14.2 20.3 P 25.3 1.3 3.1 -3.0 6.1 P 5.0
Number of employees2.7 3.2 0.3 4.7 P 6.8 -1.1 0.5 -2.9 4.4 P 2.1
Trends in main industry outlook (Unit:%points)
DI
Manufacturing industryin total 28.0 32.3 18.8 25.8 P 34.4 8.6 4.3 -13.5 7.0 P 8.6
Transportation equipment45.0 38.2 24.5 28.4 P 47.7 11.6 -6.8 -13.7 3.9 P 19.3
Electrical machinery23.4 26.4 14.5 20.1 P 28.5 21.1 3.0 -11.9 5.6 P 8.4
Industrial machinery44.0 57.2 40.0 41.6 P 28.9 -0.5 13.2 -17.2 1.6 P -12.7
Chemicals25.0 30.1 28.6 33.3 P 46.2 -21.5 5.1 -1.5 4.7 P 12.9
Apr. - Sep.
Apr. - Sep.2003 2003
2004 -Mar.2004
-Mar.2004 2004
Ratio to previous quarter
Apr. - Sep. Jul. - Dec. Oct.2003 Jan. - Jun. Apr. - Sep. Apr. - Sep. Jul. - Dec. Oct.2003 Jan. - Jun.
Acquisition of tangible fixedassets
Ratio to previous quarter
Apr. - Sep. Jul. - Dec. Oct.2003 Jan. - Jun. Apr. - Sep. Apr. - Sep. Jul. - Dec.
20032004
2004 2004 2003 2003
200320042003 2003 -Mar.2004
-Mar.2004 2004
2004
Oct.2003 Jan. - Jun.
Prospects (DI) and Actual Results
-30
-20
-10
0
10
20
30
40
Jan.-Mar.2001 Apr.-Jun.2001 Jul.-Sep.2001 Oct.-Dec.2001 Jan.-Mar.2002 Apr.-Jun.2002 Jul.-Sep.2002 Oct.-Dec.2002 Jan.-Mar.2003 Apr.-Jun.2003 Jul.-Sep.2003 Oct.-Dec.2003 Jan.-Mar.2004
Jan.-Jun.2001 Apr.-Sep.2001 Jul.-Dec.2001 Oct.2001-
Mar.2002
Jan.-Jun.2002 Apr.-Sep.2002 Jul.-Dec.2002 Oct.2002-
Mar.2003
Jan.-Jun.2003 Apr.-Sep.2003 Jul.-Dec.2003 Oct.2003-
Mar.2004
Jan.-Jun.2004 Apr.-Sep.2004
(%,%point)
DI level (% point)
Actual results (rate to corresponding period of previous year)
ASEAN4(sales)
Results→
Prospects→
22
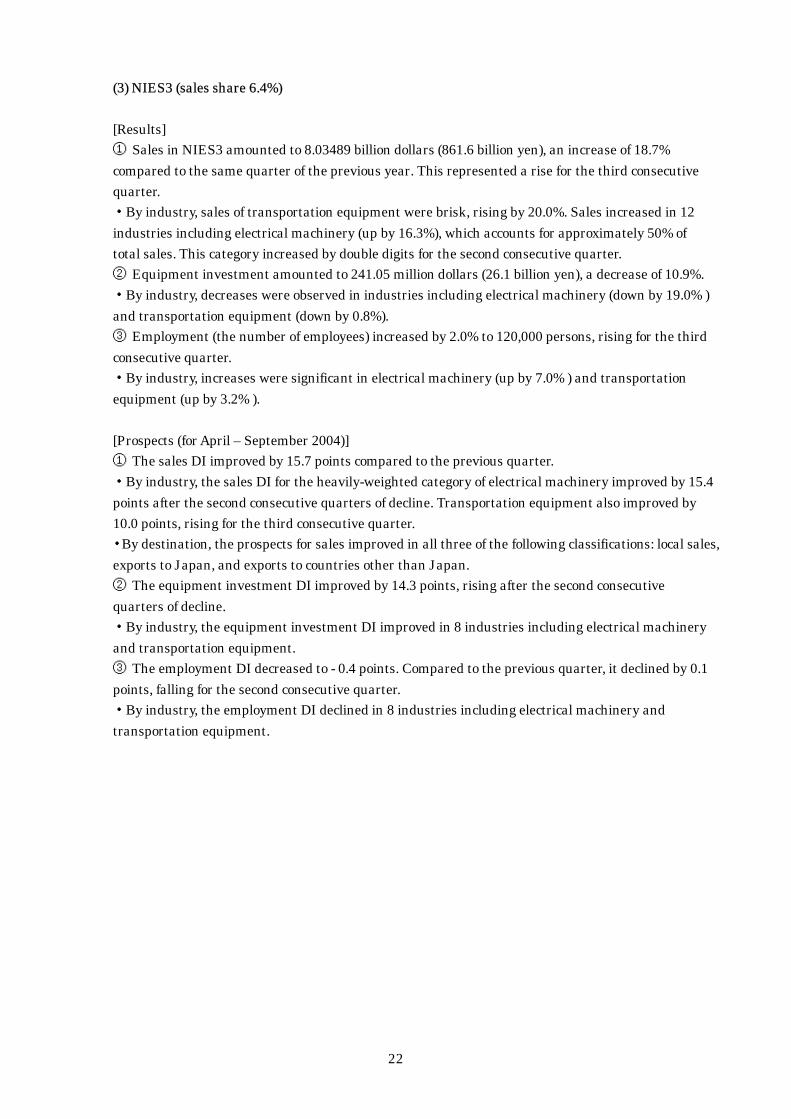
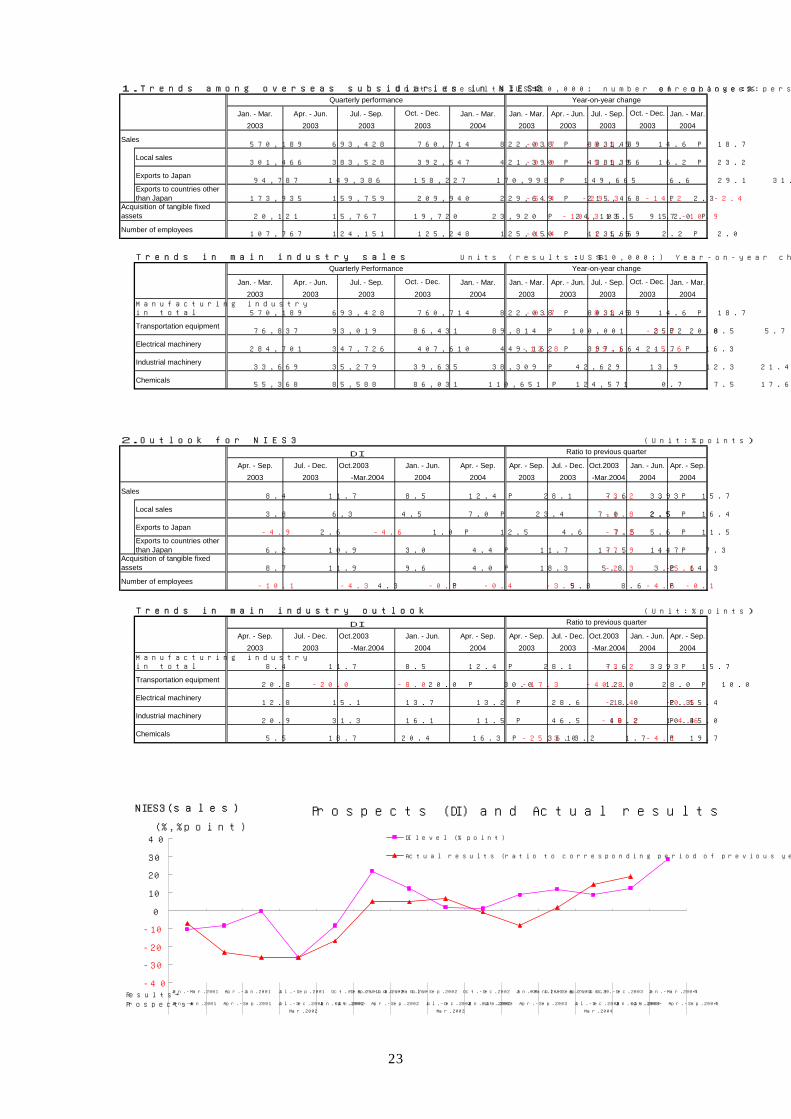
(3) NIES3 (sales share 6.4%) [Results] ① Sales in NIES3 amounted to 8.03489 billion dollars (861.6 billion yen), an increase of 18.7% compared to the same quarter of the previous year. This represented a rise for the third consecutive quarter. ・By industry, sales of transportation equipment were brisk, rising by 20.0%. Sales increased in 12 industries including electrical machinery (up by 16.3%), which accounts for approximately 50% of total sales. This category increased by double digits for the second consecutive quarter. ② Equipment investment amounted to 241.05 million dollars (26.1 billion yen), a decrease of 10.9%. ・By industry, decreases were observed in industries including electrical machinery (down by 19.0% ) and transportation equipment (down by 0.8%). ③ Employment (the number of employees) increased by 2.0% to 120,000 persons, rising for the third consecutive quarter. ・By industry, increases were significant in electrical machinery (up by 7.0% ) and transportation equipment (up by 3.2% ). [Prospects (for April – September 2004)] ① The sales DI improved by 15.7 points compared to the previous quarter. ・By industry, the sales DI for the heavily-weighted category of electrical machinery improved by 15.4 points after the second consecutive quarters of decline. Transportation equipment also improved by 10.0 points, rising for the third consecutive quarter. ・By destination, the prospects for sales improved in all three of the following classifications: local sales, exports to Japan, and exports to countries other than Japan. ② The equipment investment DI improved by 14.3 points, rising after the second consecutive quarters of decline. ・By industry, the equipment investment DI improved in 8 industries including electrical machinery and transportation equipment. ③ The employment DI decreased to - 0.4 points. Compared to the previous quarter, it declined by 0.1 points, falling for the second consecutive quarter. ・By industry, the employment DI declined in 8 industries including electrical machinery and transportation equipment.
23
1.Trends among overseas subsidiaries in NIES3 Units (results:US$10,000; number of employees:persons) year-on-year change:%
Sales570,189 693,428 760,714 822,038 P 803,489 -0.7 -8.3 1.5 14.6 P 18.7
Local sales301,466 383,528 392,547 421,390 P 438,356 -0.0 -5.9 1.9 16.2 P 23.2
Exports to Japan94,787 149,386 158,227 170,998 P 149,665 6.6 29.1 31.7 42.6 P 34.2
Exports to countries otherthan Japan 173,935 159,759 209,940 229,649 P 215,468 -5.4 -29.3 -14.2 -2.4 P 2.3
20,121 15,767 19,720 23,920 P 24,105 91.2 -10.3 13.5 57.0 P -10.9
Number of employees107,767 124,151 125,248 125,050 P 123,669 -1.4 -1.5 1.5 2.2 P 2.0
Trends in main industry sales Units (results:US$10,000;) Year-on-year change:%
Manufacturing industryin total 570,189 693,428 760,714 822,038 P 803,489 -0.7 -8.3 1.5 14.6 P 18.7
Transportation equipment76,837 93,019 86,431 89,814 P 100,001 25.2 8.5 5.7 -3.7 P 20.0
Electrical machinery284,701 347,726 407,610 449,162 P 397,664 -12.8 -19.1 -5.6 21.7 P 16.3
Industrial machinery33,669 35,279 39,635 38,309 P 42,629 13.9 12.3 21.4 8.2 P 25.2
Chemicals55,368 85,588 86,031 110,651 P 124,571 0.7 7.5 17.6 35.1 P 47.3
Oct. - Dec. Oct. - Dec. Jan. - Mar.Jan. - Mar. Jan. - Mar. Apr. - Jun. Jul. - Sep.
Quarterly performance Year-on-year change
2003 2004
Jan. - Mar. Apr. - Jun. Jul. - Sep.
2003
200320042003 2003 2003 2003
2003 2003
Quarterly Performance
20042003
Oct. - Dec. Jan. - Mar.2003
2003
2003
2003
2003 20042003
Acquisition of tangible fixedassets
Year-on-year change
Jan. - Mar. Apr. - Jun. Jul. - Sep. Oct. - Dec. Jan. - Mar. Jan. - Mar. Apr. - Jun. Jul. - Sep.
2.Outlook for NIES3 (Unit:%points)
DI
Sales8.4 11.7 8.5 12.4 P 28.1 7.6 3.3 -3.2 3.9 P 15.7
Local sales3.8 6.3 4.5 7.0 P 23.4 7.0 2.5 -1.8 2.5 P 16.4
Exports to Japan-4.9 2.6 -4.6 1.0 P 12.5 4.6 7.5 -7.2 5.6 P 11.5
Exports to countries otherthan Japan 6.2 10.9 3.0 4.4 P 11.7 17.5 4.7 -7.9 1.4 P 7.3
8.7 11.9 9.6 4.0 P 18.3 5.8 3.2 -2.3 -5.6 P 14.3
Number of employees-10.1 -4.3 4.3 -0.3 P -0.4 -3.9 5.8 8.6 -4.6 P -0.1
Trends in main industry outlook (Unit:%points)
DI
Manufacturing industryin total 8.4 11.7 8.5 12.4 P 28.1 7.6 3.3 -3.2 3.9 P 15.7
Transportation equipment20.8 -20.0 -8.0 20.0 P 30.0 -17.3 -40.8 12.0 28.0 P 10.0
Electrical machinery12.8 15.1 13.7 13.2 P 28.6 28.0 2.3 -1.4 -0.5 P 15.4
Industrial machinery20.9 31.3 16.1 11.5 P 46.5 40.2 10.4 -15.2 -4.6 P 35.0
Chemicals5.5 18.7 20.4 16.3 P 36.0 -25.3 13.2 1.7 -4.1 P 19.7
20042003 2003 -Mar.2004 2004 2003 -Mar.2004 20042004 2003
2004 20032004 2003 2004 -Mar.2004 2004 -Mar.20042003 2003
Ratio to previous quarter
Apr. - Sep. Jul. - Dec. Oct.2003 Jan. - Jun. Apr. - Sep. Apr. - Sep. Jul. - Dec. Oct.2003 Jan. - Jun. Apr. - Sep.
Acquisition of tangible fixedassets
Ratio to previous quarter
Apr. - Sep. Jul. - Dec. Oct.2003 Jan. - Jun. Apr. - Sep. Apr. - Sep. Jul. - Dec. Oct.2003 Jan. - Jun. Apr. - Sep.
Prospects (DI) and Actual results
-40
-30
-20
-10
0
10
20
30
40
Jan.-Mar.2001 Apr.-Jun.2001 Jul.-Sep.2001 Oct.-Dec.2001 Jan.-Mar.2002 Apr.-Jun.2002 Jul.-Sep.2002 Oct.-Dec.2002 Jan.-Mar.2003 Apr.-Jun.2003 Jul.-Sep.2003 Oct.-Dec.2003 Jan.-Mar.2004
Jan.-Jun.2001 Apr.-Sep.2001 Jul.-Dec.2001 Oct.2001-
Mar.2002
Jan.-Jun.2002 Apr.-Sep.2002 Jul.-Dec.2002 Oct.2002-
Mar.2003
Jan.-Jun.2003 Apr.-Sep.2003 Jul.-Dec.2003 Oct.2003-
Mar.2004
Jan.-Jun.2004 Apr.-Sep.2004
(%,%point)DI level (% point)
Actual results (ratio to corresponding period of previous year)
Results→
Prospects→
NIES3(sales)
24
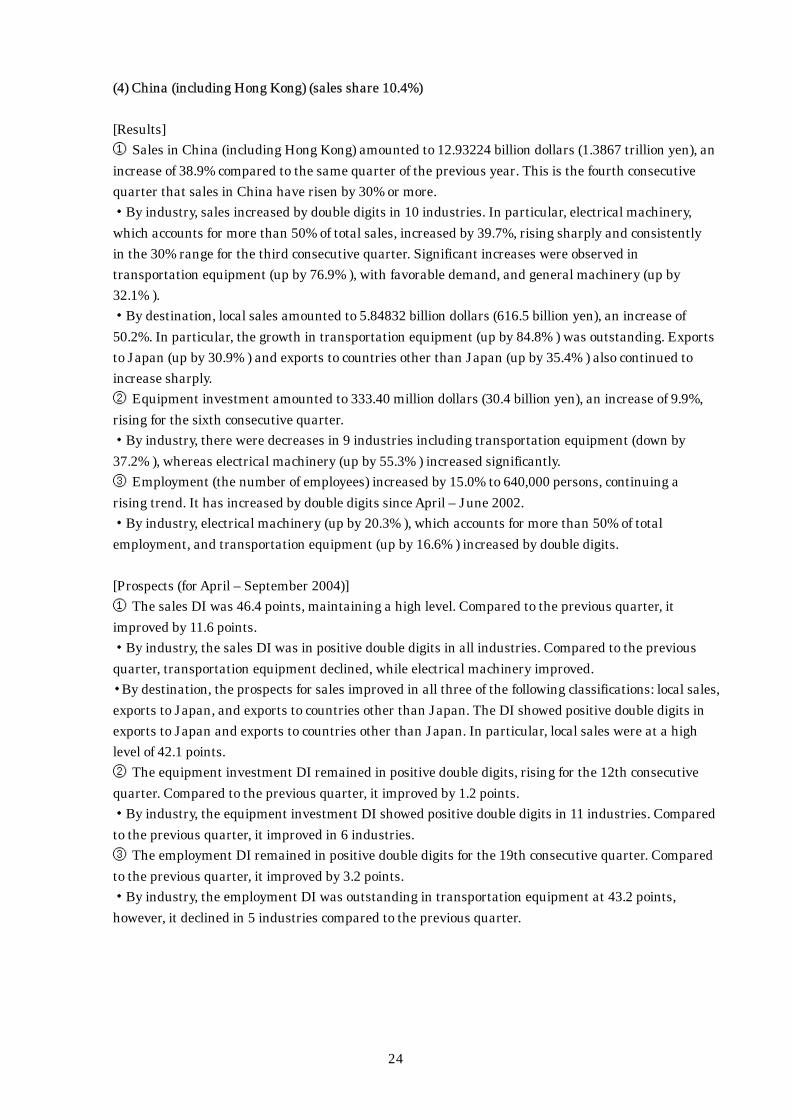
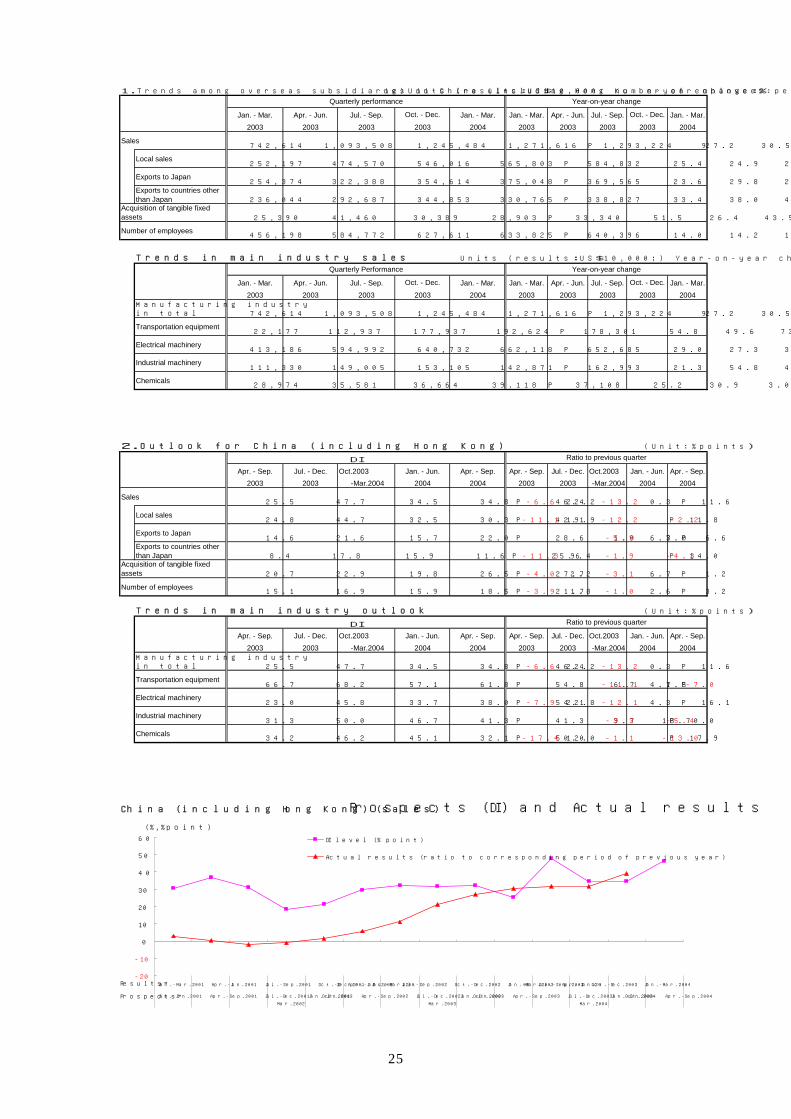
(4) China (including Hong Kong) (sales share 10.4%) [Results] ① Sales in China (including Hong Kong) amounted to 12.93224 billion dollars (1.3867 trillion yen), an increase of 38.9% compared to the same quarter of the previous year. This is the fourth consecutive quarter that sales in China have risen by 30% or more. ・By industry, sales increased by double digits in 10 industries. In particular, electrical machinery, which accounts for more than 50% of total sales, increased by 39.7%, rising sharply and consistently in the 30% range for the third consecutive quarter. Significant increases were observed in transportation equipment (up by 76.9% ), with favorable demand, and general machinery (up by 32.1% ). ・By destination, local sales amounted to 5.84832 billion dollars (616.5 billion yen), an increase of 50.2%. In particular, the growth in transportation equipment (up by 84.8% ) was outstanding. Exports to Japan (up by 30.9% ) and exports to countries other than Japan (up by 35.4% ) also continued to increase sharply. ② Equipment investment amounted to 333.40 million dollars (30.4 billion yen), an increase of 9.9%, rising for the sixth consecutive quarter. ・By industry, there were decreases in 9 industries including transportation equipment (down by 37.2% ), whereas electrical machinery (up by 55.3% ) increased significantly. ③ Employment (the number of employees) increased by 15.0% to 640,000 persons, continuing a rising trend. It has increased by double digits since April – June 2002. ・By industry, electrical machinery (up by 20.3% ), which accounts for more than 50% of total employment, and transportation equipment (up by 16.6% ) increased by double digits. [Prospects (for April – September 2004)] ① The sales DI was 46.4 points, maintaining a high level. Compared to the previous quarter, it improved by 11.6 points. ・By industry, the sales DI was in positive double digits in all industries. Compared to the previous quarter, transportation equipment declined, while electrical machinery improved. ・By destination, the prospects for sales improved in all three of the following classifications: local sales, exports to Japan, and exports to countries other than Japan. The DI showed positive double digits in exports to Japan and exports to countries other than Japan. In particular, local sales were at a high level of 42.1 points. ② The equipment investment DI remained in positive double digits, rising for the 12th consecutive quarter. Compared to the previous quarter, it improved by 1.2 points. ・By industry, the equipment investment DI showed positive double digits in 11 industries. Compared to the previous quarter, it improved in 6 industries. ③ The employment DI remained in positive double digits for the 19th consecutive quarter. Compared to the previous quarter, it improved by 3.2 points. ・By industry, the employment DI was outstanding in transportation equipment at 43.2 points, however, it declined in 5 industries compared to the previous quarter.
25
1.Trends among overseas subsidiaries in China (including Hong Kong)Units (results:US$10,000; number of employees:persons) year-on-year change:%
Sales742,614 1,093,508 1,245,484 1,271,616 P 1,293,224 27.2 30.5 31.7 31.7 P 38.9
Local sales252,197 474,570 546,016 565,803 P 584,832 25.4 24.9 24.9 31.8 P 50.2
Exports to Japan254,374 322,388 354,614 375,048 P 369,565 23.6 29.8 27.4 30.5 P 30.9
Exports to countries otherthan Japan 236,044 292,687 344,853 330,765 P 338,827 33.4 38.0 44.9 33.0 P 35.4
25,390 41,460 30,389 28,903 P 33,340 51.5 26.4 43.5 8.3 P 9.9
Number of employees456,198 584,772 627,611 633,825 P 640,396 14.0 14.2 15.2 16.0 P 15.0
Trends in main industry sales Units (results:US$10,000;) Year-on-year change:%
Manufacturing industryin total 742,614 1,093,508 1,245,484 1,271,616 P 1,293,224 27.2 30.5 31.7 31.7 P 38.9
Transportation equipment22,177 112,937 177,937 192,624 P 178,301 54.8 49.6 73.3 62.7 P 76.9
Electrical machinery413,186 594,992 640,732 662,118 P 652,685 29.0 27.3 32.0 36.0 P 39.7
Industrial machinery111,330 149,005 153,105 142,871 P 162,993 21.3 54.8 43.5 26.7 P 32.1
Chemicals28,974 35,581 36,664 39,118 P 37,108 25.2 30.9 3.0 4.8 P 19.5
2003 2004
Oct. - Dec. Jan. - Mar.
2003 2003 2003 2003 2004
2003 2003 2003 2004
Jan. - Mar. Apr. - Jun.2003 2003
20032003 2003Jul. - Sep.
2004 2003 2003
Quarterly performance Year-on-year change
Jan. - Mar.Jul. - Sep. Oct. - Dec. Jan. - Mar. Jan. - Mar.
Acquisition of tangible fixedassets
Quarterly Performance
Jan. - Mar. Apr. - Jun. Jul. - Sep. Oct. - Dec. Jan. - Mar.2003
Year-on-year change
Jan. - Mar. Apr. - Jun.
Apr. - Jun. Jul. - Sep. Oct. - Dec.
2.Outlook for China (including Hong Kong) (Unit:%points)
DI
Sales25.5 47.7 34.5 34.8 P 46.4 -6.6 22.2 -13.2 0.3 P 11.6
Local sales24.8 44.7 32.5 30.3 P 42.1 -11.1 19.9 -12.2 -2.2 P 11.8
Exports to Japan14.6 21.6 15.7 22.0 P 28.6 1.0 7.0 -5.9 6.3 P 6.6
Exports to countries otherthan Japan 8.4 17.8 15.9 11.6 P 25.6 -11.3 9.4 -1.9 -4.3 P 14.0
20.7 22.9 19.8 26.5 P 27.7 -4.0 2.2 -3.1 6.7 P 1.2
Number of employees15.1 16.9 15.9 18.5 P 21.7 -3.9 1.8 -1.0 2.6 P 3.2
Trends in main industry outlook (Unit:%points)
DI
Manufacturing industryin total 25.5 47.7 34.5 34.8 P 46.4 -6.6 22.2 -13.2 0.3 P 11.6
Transportation equipment66.7 68.2 57.1 61.8 P 54.8 6.7 1.5 -11.1 4.7 P -7.0
Electrical machinery23.0 45.8 33.7 38.0 P 54.1 -7.9 22.8 -12.1 4.3 P 16.1
Industrial machinery31.3 50.0 46.7 41.3 P 41.3 9.7 18.7 -3.3 -5.4 P 0.0
Chemicals34.2 46.2 45.1 32.1 P 50.0 -17.4 12.0 -1.1 -13.0 P 17.9
2004 2004
2004
Ratio to previous quarter
2003 2003 -Mar.2004 2004 2004 2003 2003 -Mar.2004
2003 2003 -Mar.2004 20042004 -Mar.2004 20042003 2003Oct.2003 Jan. - Jun. Jan. - Jun. Apr. - Sep.
Acquisition of tangible fixedassets
Ratio to previous quarter
Apr. - Sep. Apr. - Sep. Jul. - Dec. Oct.2003Apr. - Sep. Jul. - Dec.
Oct.2003Apr. - Sep. Jul. - Dec. Oct.2003 Jan. - Jun. Apr. - Sep. Apr. - Sep. Jul. - Dec. Jan. - Jun. Apr. - Sep.
Prospects (DI) and Actual results
-20
-10
0
10
20
30
40
50
60
Jan.-Mar.2001 Apr.-Jun.2001 Jul.-Sep.2001 Oct.-Dec.2001 Jan.-Mar.2002 Apr.-Jun.2002 Jul.-Sep.2002 Oct.-Dec.2002 Jan.-Mar.2003 Apr.-Jun.2003 Jul.-Sep.2003 Oct.-Dec.2003 Jan.-Mar.2004
Jan.-Jun.2001 Apr.-Sep.2001 Jul.-Dec.2001 Oct.2001-
Mar.2002
Jan.-Jun.2002 Apr.-Sep.2002 Jul.-Dec.2002 Oct.2002-
Mar.2003
Jan.-Jun.2003 Apr.-Sep.2003 Jul.-Dec.2003 Oct.2003-
Mar.2004
Jan.-Jun.2004 Apr.-Sep.2004
(%,%point)
DI level (% point)
Actual results (ratio to corresponding period of previous year)
Results→
Prospects→
China (including Hong Kong) (sales)
26
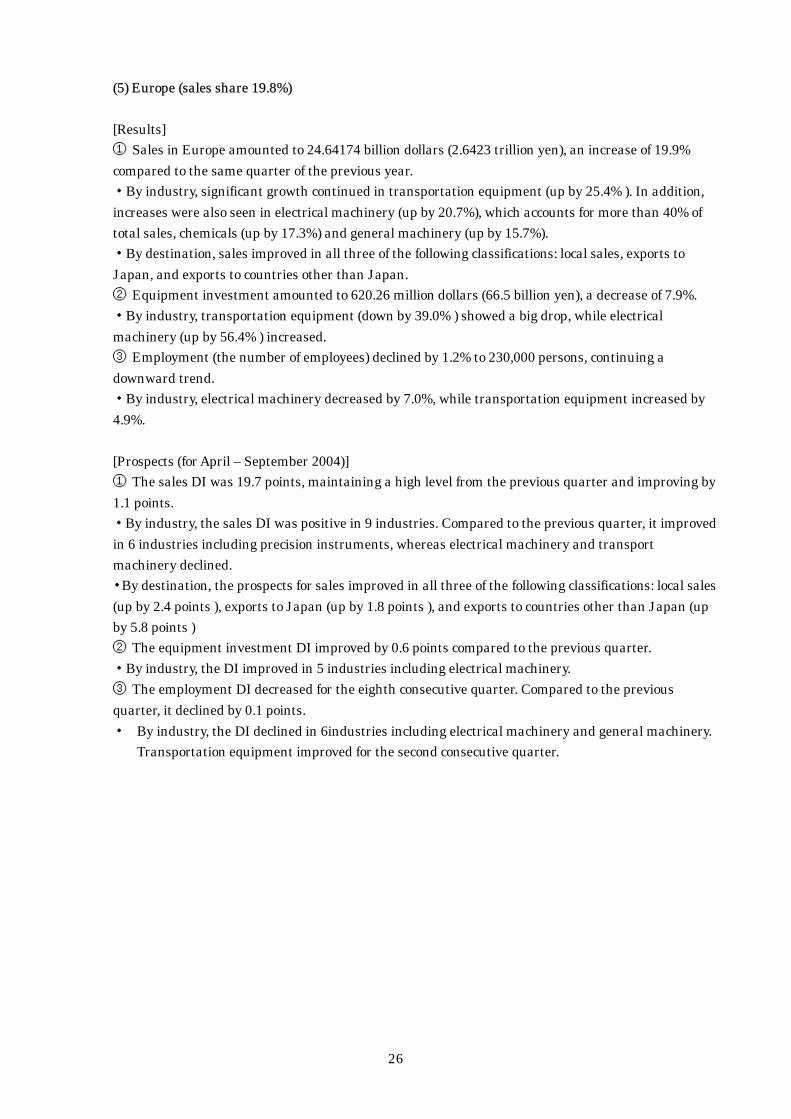
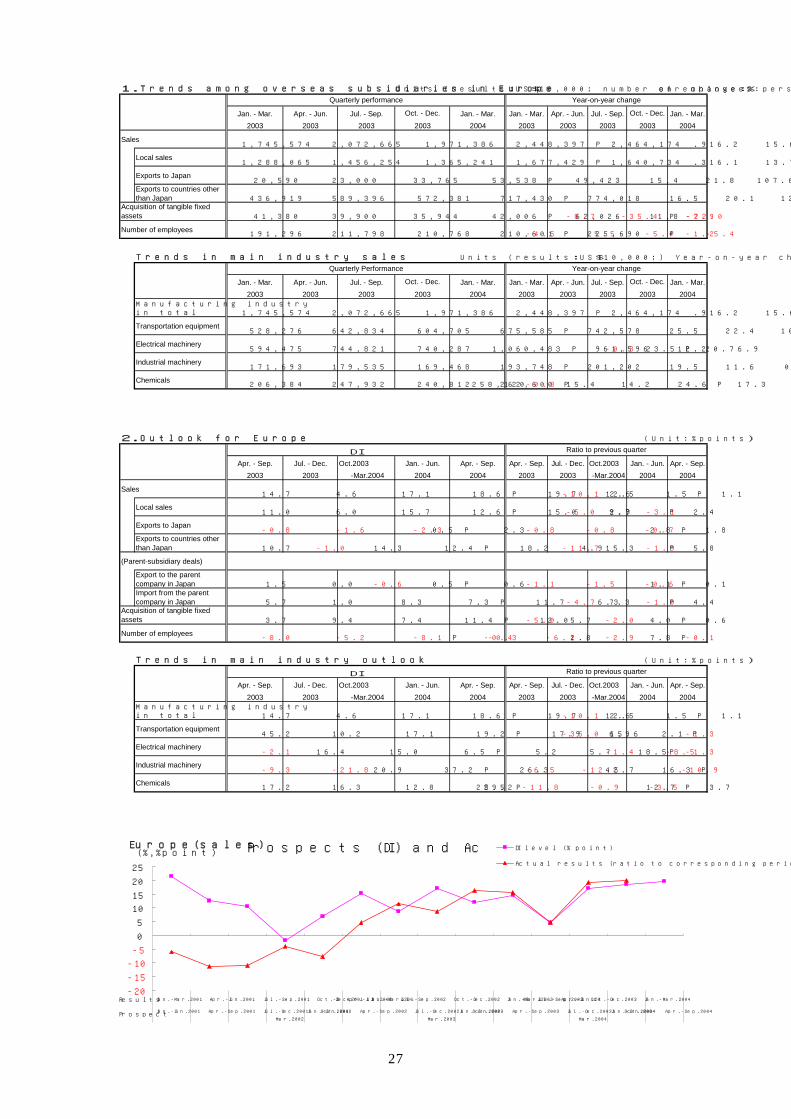
(5) Europe (sales share 19.8%) [Results] ① Sales in Europe amounted to 24.64174 billion dollars (2.6423 trillion yen), an increase of 19.9% compared to the same quarter of the previous year. ・By industry, significant growth continued in transportation equipment (up by 25.4% ). In addition, increases were also seen in electrical machinery (up by 20.7%), which accounts for more than 40% of total sales, chemicals (up by 17.3%) and general machinery (up by 15.7%). ・By destination, sales improved in all three of the following classifications: local sales, exports to Japan, and exports to countries other than Japan. ② Equipment investment amounted to 620.26 million dollars (66.5 billion yen), a decrease of 7.9%. ・By industry, transportation equipment (down by 39.0% ) showed a big drop, while electrical machinery (up by 56.4% ) increased. ③ Employment (the number of employees) declined by 1.2% to 230,000 persons, continuing a downward trend. ・By industry, electrical machinery decreased by 7.0%, while transportation equipment increased by 4.9%. [Prospects (for April – September 2004)] ① The sales DI was 19.7 points, maintaining a high level from the previous quarter and improving by 1.1 points. ・By industry, the sales DI was positive in 9 industries. Compared to the previous quarter, it improved in 6 industries including precision instruments, whereas electrical machinery and transport machinery declined. ・By destination, the prospects for sales improved in all three of the following classifications: local sales (up by 2.4 points ), exports to Japan (up by 1.8 points ), and exports to countries other than Japan (up by 5.8 points ) ② The equipment investment DI improved by 0.6 points compared to the previous quarter. ・By industry, the DI improved in 5 industries including electrical machinery. ③ The employment DI decreased for the eighth consecutive quarter. Compared to the previous quarter, it declined by 0.1 points. ・ By industry, the DI declined in 6industries including electrical machinery and general machinery.
Transportation equipment improved for the second consecutive quarter.
27
1.Trends among overseas subsidiaries in Europe Units (results:US$10,000; number of employees:persons) year-on-year change:%
Sales1,745,574 2,072,665 1,971,386 2,448,397 P 2,464,174 16.2 15.6 4.8 19.2 P 19.9
Local sales1,288,065 1,456,254 1,365,241 1,677,429 P 1,640,734 16.1 13.7 1.1 15.8 P 12.3
Exports to Japan20,590 23,000 33,765 53,538 P 49,423 15.4 21.8 107.6 156.0 P 119.4
Exports to countries otherthan Japan 436,919 589,396 572,381 717,430 P 774,018 16.5 20.1 12.0 22.6 P 37.8
41,380 39,900 35,944 42,006 P 62,026 11.8 -8.7 -35.4 -22.0 P -7.9
Number of employees191,296 211,798 210,768 210,601 P 225,690 -4.5 -5.5 -5.4 -5.4 P -1.2
Trends in main industry sales Units (results:US$10,000;) Year-on-year change:%
Manufacturing industryin total 1,745,574 2,072,665 1,971,386 2,448,397 P 2,464,174 16.2 15.6 4.8 19.2 P 19.9
Transportation equipment528,276 642,834 604,705 675,585 P 742,578 25.5 22.4 10.9 20.5 P 25.4
Electrical machinery594,475 744,821 740,287 1,060,483 P 961,596 12.2 6.9 -0.3 23.5 P 20.7
Industrial machinery171,693 179,535 169,468 193,748 P 201,202 19.5 11.6 0.8 16.4 P 15.7
Chemicals206,384 247,932 240,812 262,600 P 258,120 -0.3 15.4 14.2 24.6 P 17.3
2003 20032003 2003 2003 2004 20042003 20032003
2004 20032003 2003 2003 2003 2003 2003 20042003Apr. - Jun. Jul. - Sep. Oct. - Dec. Jan. - Mar.
Jul. - Sep.
Jan. - Mar.
Apr. - Jun.
Quarterly performance Year-on-year change
Jan. - Mar. Apr. - Jun. Jul. - Sep. Oct. - Dec. Jan. - Mar.
Acquisition of tangible fixedassets
Quarterly Performance Year-on-year change
Jan. - Mar. Apr. - Jun. Jul. - Sep. Oct. - Dec. Jan. - Mar. Jan. - Mar. Oct. - Dec. Jan. - Mar.
2.Outlook for Europe (Unit:%points)
DI
Sales14.7 4.6 17.1 18.6 P 19.7 2.6 -10.1 12.5 1.5 P 1.1
Local sales11.0 6.0 15.7 12.6 P 15.0 2.9 -5.0 9.7 -3.1 P 2.4
Exports to Japan-0.8 -1.6 -2.3 0.5 P 2.3 -0.8 -0.8 -0.7 2.8 P 1.8
Exports to countries otherthan Japan 10.7 -1.0 14.3 12.4 P 18.2 4.9 -11.7 15.3 -1.9 P 5.8
(Parent-subsidiary deals)
Export to the parentcompany in Japan 1.5 0.0 -0.6 0.5 P 0.6 -1.1 -1.5 -0.6 1.1 P 0.1Import from the parentcompany in Japan 5.7 1.0 8.3 7.3 P 11.7 6.3 -4.7 7.3 -1.0 P 4.4
3.7 9.4 7.4 11.4 P 12.0 -5.0 5.7 -2.0 4.0 P 0.6
Number of employees-8.0 -5.2 -8.1 -0.3 P -0.4 -6.1 2.8 -2.9 7.8 P -0.1
Trends in main industry outlook (Unit:%points)
DI
Manufacturing industryin total 14.7 4.6 17.1 18.6 P 19.7 2.6 -10.1 12.5 1.5 P 1.1
Transportation equipment45.2 10.2 17.1 19.2 P 17.9 15.6 -35.0 6.9 2.1 P -1.3
Electrical machinery-2.1 16.4 15.0 6.5 P 5.2 5.7 18.5 -1.4 -8.5 P -1.3
Industrial machinery-9.3 -21.8 20.9 37.2 P 26.3 -6.5 -12.5 42.7 16.3 P -10.9
Chemicals17.2 16.3 12.8 25.5 P 29.2 -11.8 -0.9 -3.5 12.7 P 3.7
2004 20042003 2003 -Mar.2004 2004 2004 2003 2003 -Mar.2004
20042003 20042003 -Mar.2004 2004 20042003Apr. - Sep. Apr. - Sep.
Acquisition of tangible fixedassets
Ratio to previous quarter
Apr. - Sep. Jul. - Dec. Oct.2003 Jan. - Jun. Apr. - Sep.
Oct.2003
Jul. - Dec. Oct.2003 Jan. - Jun.2003 -Mar.2004
Jan. - Jun. Apr. - Sep.
Ratio to previous quarter
Apr. - Sep. Jul. - Dec. Oct.2003 Jan. - Jun. Apr. - Sep. Apr. - Sep. Jul. - Dec.
Prospects (DI) and Actual results
-20
-15
-10
-5
0
5
10
15
20
25
Jan.-Mar.2001 Apr.-Jun.2001 Jul.-Sep.2001 Oct.-Dec.2001 Jan.-Mar.2002 Apr.-Jun.2002 Jul.-Sep.2002 Oct.-Dec.2002 Jan.-Mar.2003 Apr.-Jun.2003 Jul.-Sep.2003 Oct.-Dec.2003 Jan.-Mar.2004
Jan.-Jun.2001 Apr.-Sep.2001 Jul.-Dec.2001 Oct.2001-
Mar.2002
Jan.-Jun.2002 Apr.-Sep.2002 Jul.-Dec.2002 Oct.2002-
Mar.2003
Jan.-Jun.2003 Apr.-Sep.2003 Jul.-Dec.2003 Oct.2003-
Mar.2004
Jan.-Jun.2004 Apr.-Sep.2004
(%,%point)DI level (% point)
Actual results (ratio to corresponding period of previous year)
Results
Prospect
Europe(sales)
28
【 Topics 】
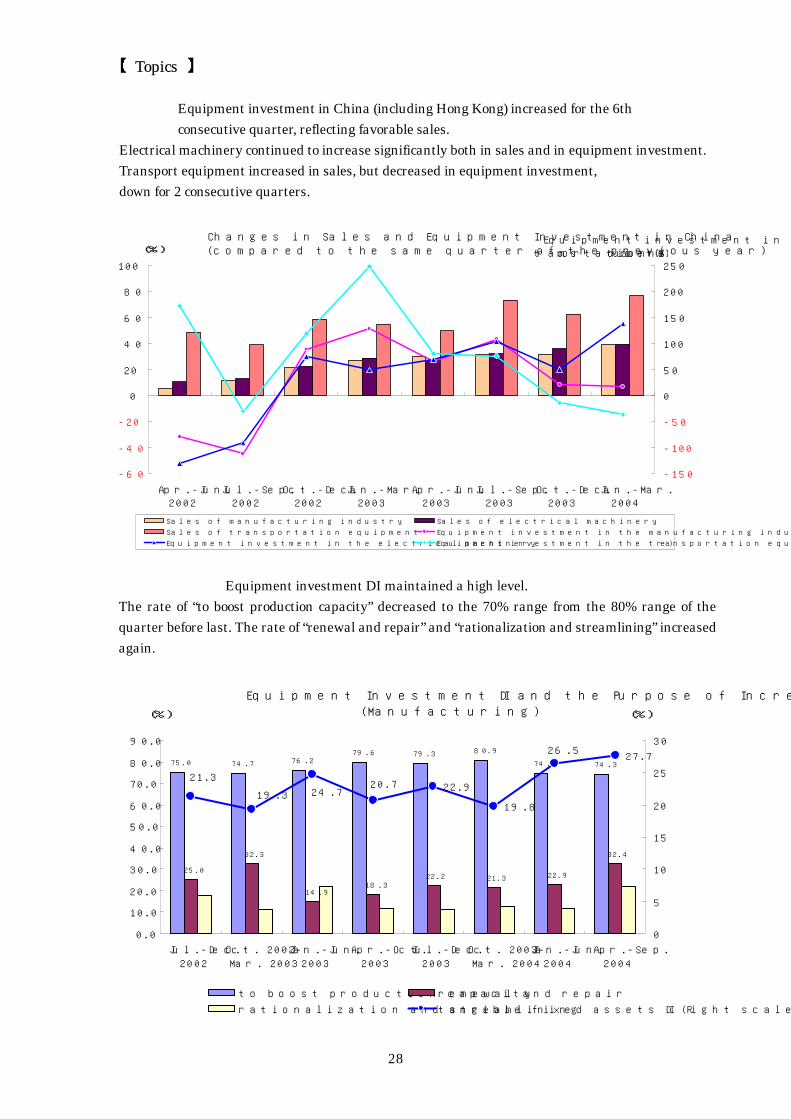
Equipment investment in China (including Hong Kong) increased for the 6th consecutive quarter, reflecting favorable sales.
Electrical machinery continued to increase significantly both in sales and in equipment investment. Transport equipment increased in sales, but decreased in equipment investment, down for 2 consecutive quarters.
Changes in Sales and Equipment Investment in China(compared to the same quarter of the previous year)
-60
-40
-20
0
20
40
60
80
100
Apr.-Jun.2002
Jul.-Sep.2002
Oct.-Dec.2002
Jan.-Mar.2003
Apr.-Jun.2003
Jul.-Sep.2003
Oct.-Dec.2003
Jan.-Mar.2004
-150
-100
-50
0
50
100
150
200
250
Sales of manufacturing industry Sales of electrical machinery
Sales of transportation equipment Equipment investment in the manufacturing industry
Equipment investment in the electrical machinery Equipment investment in the transportation equipment (Right scale)
(%)Equipment investment in
transportation equipment (% )
Equipment investment DI maintained a high level. The rate of “to boost production capacity” decreased to the 70% range from the 80% range of the quarter before last. The rate of “renewal and repair” and “rationalization and streamlining” increased again.
Equipment Investment DI and the Purpose of Increase (Manufacturing)
75.0 74.7 76.279.6 79.3 80.9
74.5 74.3
25.0
32.3
14.918.3
22.2 21.3 22.9
32.4
22.9
19.8
27.726.5
24.719.3
21.320.7
0.0
10.0
20.0
30.0
40.0
50.0
60.0
70.0
80.0
90.0
Jul.-Dec.
2002
Oct. 2002-
Mar. 2003
Jan.-Jun.
2003
Apr.-Oct.
2003
Jul.-Dec.
2003
Oct. 2003-
Mar. 2004
Jan.-Jun.
2004
Apr.-Sep.
2004
0
5
10
15
20
25
30
to boost production capacity renewal and repair
rationalization and streamlining tangible fixed assets DI (Right scale)
(%) (%)
29
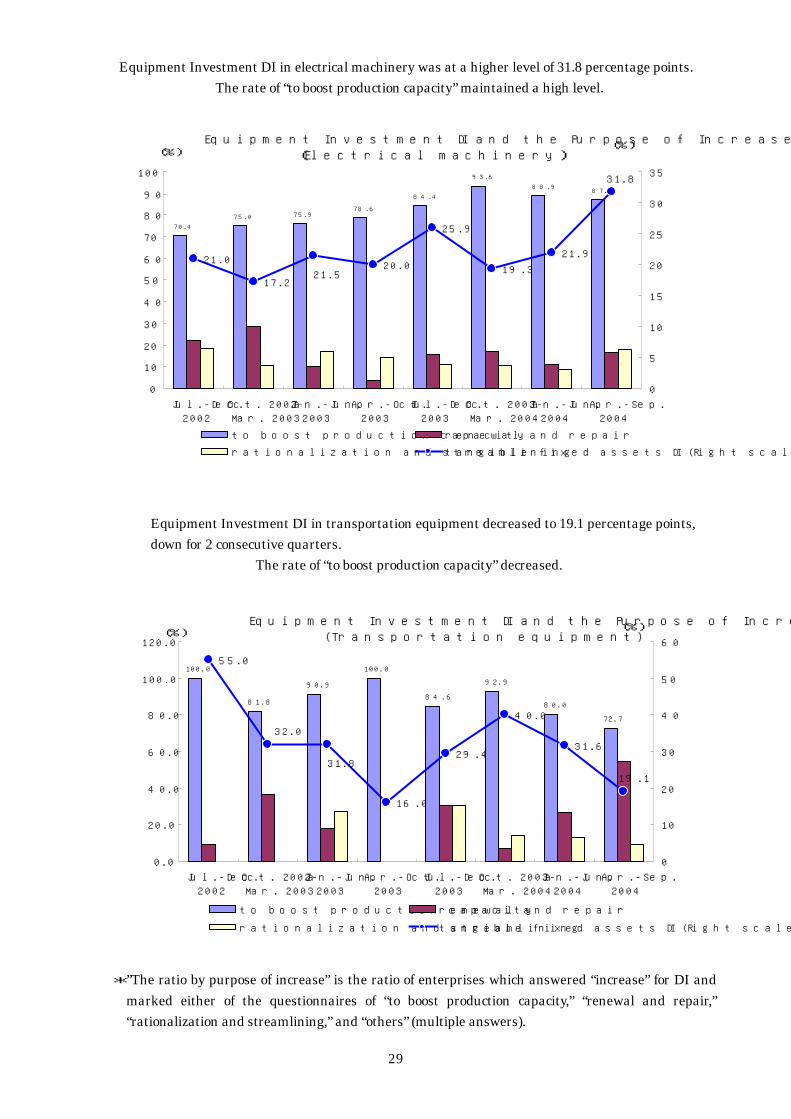
Equipment Investment DI in electrical machinery was at a higher level of 31.8 percentage points. The rate of “to boost production capacity” maintained a high level.
Equipment Investment DI and the Purpose of Increase (Electrical machinery)
70.4
75.0 75.978.6
84.4
93.6
88.987.3
21.0
17.2
20.0
25.9
19.3
21.9
31.8
21.5
0
10
20
30
40
50
60
70
80
90
100
Jul.-Dec.
2002
Oct. 2002-
Mar. 2003
Jan.-Jun.
2003
Apr.-Oct.
2003
Jul.-Dec.
2003
Oct. 2003-
Mar. 2004
Jan.-Jun.
2004
Apr.-Sep.
2004
0
5
10
15
20
25
30
35
to boost production capacity renewal and repair
rationalization and streamlining tangible fixed assets DI (Right scale)
(%)(%)
Equipment Investment DI in transportation equipment decreased to 19.1 percentage points, down for 2 consecutive quarters.
The rate of “to boost production capacity” decreased.
Equipment Investment DI and the Purpose of Increase(Transportation equipment)
100.0
81.8
90.9
100.0
84.6
92.9
80.0
72.7
55.0
16.0
29.4
40.0
31.6
32.0
31.8
19.1
0.0
20.0
40.0
60.0
80.0
100.0
120.0
Jul.-Dec.
2002
Oct. 2002-
Mar. 2003
Jan.-Jun.
2003
Apr.-Oct.
2003
Jul.-Dec.
2003
Oct. 2003-
Mar. 2004
Jan.-Jun.
2004
Apr.-Sep.
2004
0
10
20
30
40
50
60
to boost production capacity renewal and repair
rationalization and streamlining tangible fixed assets DI (Right scale)
(%)(%)
*”The ratio by purpose of increase” is the ratio of enterprises which answered “increase” for DI and
marked either of the questionnaires of “to boost production capacity,” “renewal and repair,” “rationalization and streamlining,” and “others” (multiple answers).
30
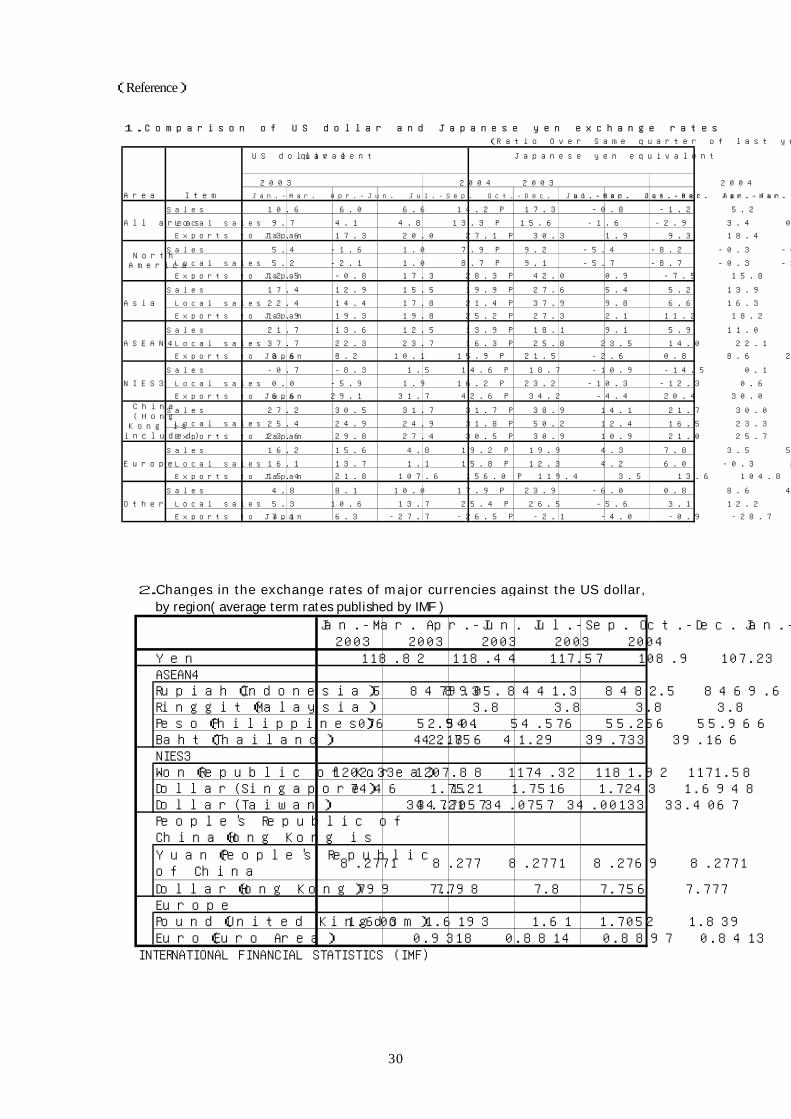
(Reference)
1.Comparison of US dollar and Japanese yen exchange rates (Ratio Over Same quarter of last year:%)
US dollar equivalent Japanese yen equivalent
2003 2004 2003 2004
Area Item Jan.-Mar. Apr.-Jun. Jul.-Sep. Oct.-Dec. Jan.-Mar. Jan.-Mar. Apr.-Jun. Jul.-Sep. Oct.-Dec. Jan.-Mar.
Sales 10.6 6.0 6.6 14.2 P 17.3 -0.8 -1.2 5.2 1.2 P 5.9
All areas Local sales 9.7 4.1 4.8 13.3 P 15.6 -1.6 -2.9 3.4 0.4 P 4.3
Exports to Japan 13.6 17.3 20.0 27.1 P 30.3 1.9 9.3 18.4 12.7 P 17.6
Sales 5.4 -1.6 1.0 7.9 P 9.2 -5.4 -8.2 -0.3 -4.4 P -1.4
Local sales 5.2 -2.1 1.0 8.7 P 9.1 -5.7 -8.7 -0.3 -3.7 P -1.6
Exports to Japan 12.5 -0.8 17.3 28.3 P 42.0 0.9 -7.5 15.8 13.7 P 28.2
Sales 17.4 12.9 15.5 19.9 P 27.6 5.4 5.2 13.9 6.3 P 15.2
Asia Local sales 22.4 14.4 17.8 21.4 P 37.9 9.8 6.6 16.3 7.6 P 24.5
Exports to Japan 13.9 19.3 19.8 25.2 P 27.3 2.1 11.2 18.2 10.9 P 14.9
Sales 21.7 13.6 12.5 13.9 P 18.1 9.1 5.9 11.0 0.9 P 6.5
ASEAN4 Local sales 37.7 22.3 23.7 16.3 P 25.8 23.5 14.0 22.1 3.0 P 13.5
Exports to Japan 8.6 8.2 10.1 15.9 P 21.5 -2.6 0.8 8.6 2.7 P 9.6
Sales -0.7 -8.3 1.5 14.6 P 18.7 -10.9 -14.5 0.1 1.6 P 7.1
NIES3 Local sales 0.0 -5.9 1.9 16.2 P 23.2 -10.3 -12.3 0.6 2.9 P 11.2
Exports to Japan 6.6 29.1 31.7 42.6 P 34.2 -4.4 20.4 30.0 26.4 P 21.1
Sales 27.2 30.5 31.7 31.7 P 38.9 14.1 21.7 30.0 16.7 P 25.4
Local sales 25.4 24.9 24.9 31.8 P 50.2 12.4 16.5 23.3 16.8 P 35.6
Exports to Japan 23.6 29.8 27.4 30.5 P 30.9 10.9 21.0 25.7 15.6 P 18.1
Sales 16.2 15.6 4.8 19.2 P 19.9 4.3 7.8 3.5 5.6 P 8.2
Europe Local sales 16.1 13.7 1.1 15.8 P 12.3 4.2 6.0 -0.3 2.6 P 1.3
Exports to Japan 15.4 21.8 107.6 156.0 P 119.4 3.5 13.6 104.8 126.8 P 98.0
Sales 4.8 8.1 10.0 17.9 P 23.9 -6.0 0.8 8.6 4.5 P 11.8
Other Local sales 5.3 10.6 13.7 25.4 P 26.5 -5.6 3.1 12.2 11.1 P 14.2
Exports to Japan 7.1 6.3 -27.7 -26.5 P -2.1 -4.0 -0.9 -28.7 -34.9 P -11.6
NorthAmerica
China(Hong
Kong isincluded)
2.Changes in the exchange rates of major currencies against the US dollar,by region( average term rates published by IMF )
Jan.-Mar. Apr.-Jun. Jul.-Sep. Oct.-Dec. Jan.-Mar.2003 2003 2003 2003 2004
Yen 118.82 118.44 117.57 108.9 107.23ASEAN4Rupiah(Indonesia) 8905.5 8479.3 8441.3 8482.5 8469.6Ringgit(Malaysia) 3.8 3.8 3.8 3.8 3.8Peso(Philippines) 54.076 52.904 54.576 55.256 55.966Baht(Thailand) 42.756 42.18 41.29 39.733 39.166NIES3Won(Republic of Korea) 1202.33 1207.88 1174.32 1181.92 1171.58Dollar(Singapore) 1.7446 1.7521 1.7516 1.7243 1.6948Dollar(Taiwan) 34.7057 34.721 34.0757 34.00133 33.4067People's Republic ofChina(Hong Kong isYuan(People's Republicof China
8.2771 8.277 8.2771 8.2769 8.2771
Dollar(Hong Kong) 7.799 7.798 7.8 7.756 7.777EuropePound(United Kingdom) 1.603 1.6193 1.61 1.7052 1.839Euro(Euro Area) 0.9318 0.8814 0.8897 0.8413 0.7998
INTERNATIONAL FINANCIAL STATISTICS (IMF)
31
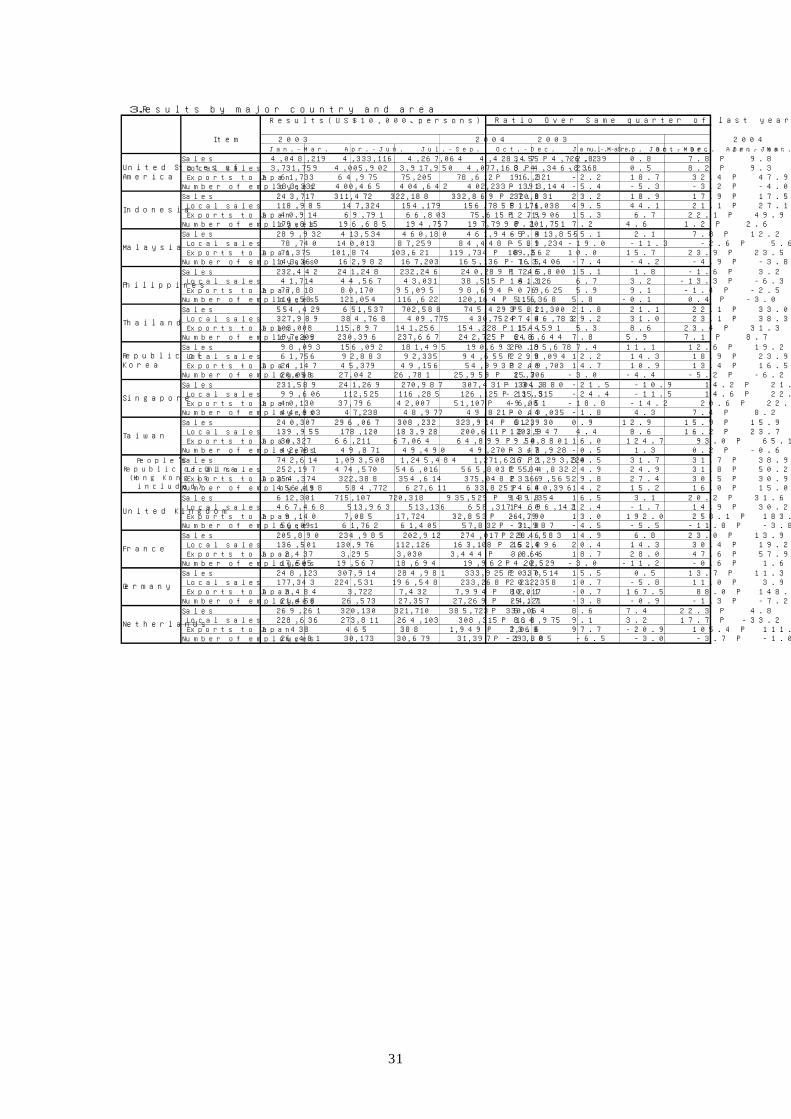
3.Results by major country and areaResults(US$10,000、persons) Ratio Over Same quarter of last year(%)
Item 2003 2004 2003 2004Jan.-Mar. Apr.-Jun. Jul.-Sep. Oct.-Dec. Jan.-Mar. Jan.-Mar. Apr.-Jun. Jul.-Sep. Oct.-Dec. Jan.-Mar.
Sales 4,048,219 4,333,116 4,267,064 4,428,455 P 4,726,839 3.7 -2.2 0.8 7.8 P 9.8 Local sales 3,731,759 4,005,902 3,917,950 4,077,168 P 4,346,836 3.4 -2.8 0.5 8.2 P 9.3 Exports to Japan 61,733 64,975 75,205 78,612 P 96,321 11.2 -2.2 18.7 32.4 P 47.9Number of employees 383,332 400,465 404,642 402,233 P 393,144 -1.1 -5.4 -5.3 -3.2 P -4.0Sales 243,717 311,472 322,188 332,869 P 320,831 27.8 23.2 18.9 17.9 P 17.5 Local sales 118,985 147,324 154,179 156,785 P 171,038 51.6 49.5 44.1 21.1 P 27.1 Exports to Japan 40,914 69,791 66,803 75,615 P 71,906 12.9 15.3 6.7 22.1 P 49.9Number of employees 179,815 196,685 194,757 197,799 P 201,751 8.1 7.2 4.6 1.2 P 2.6Sales 289,932 413,534 460,180 461,946 P 413,855 -5.8 -5.1 2.1 7.8 P 12.2 Local sales 78,740 140,013 87,259 84,448 P 89,234 -5.1 -19.0 -11.3 -2.6 P 5.6 Exports to Japan 71,375 101,874 103,621 119,734 P 109,562 8.2 10.0 15.7 23.9 P 23.5Number of employees 143,360 162,982 167,203 165,136 P 163,406 -7.5 -7.4 -4.2 -4.9 P -3.8Sales 232,442 241,248 232,246 240,289 P 245,800 17.6 15.1 1.8 -1.6 P 3.2 Local sales 41,714 44,567 43,031 38,515 P 41,126 16.3 6.7 3.2 -13.3 P -6.3 Exports to Japan 77,818 80,170 95,095 98,694 P 76,625 -0.9 5.9 9.1 -1.4 P -2.5Number of employees 114,585 121,054 116,622 120,164 P 115,368 5.6 5.8 -0.1 0.4 P -3.0Sales 554,429 651,537 702,588 745,429 P 821,300 35.1 21.8 21.1 22.1 P 33.0 Local sales 327,989 384,768 409,775 430,752 P 486,783 47.4 29.2 31.0 23.1 P 38.3 Exports to Japan 103,008 115,897 141,256 154,228 P 154,591 11.4 5.3 8.6 23.4 P 31.3Number of employees 197,209 230,396 237,667 242,725 P 248,644 6.6 7.8 5.9 7.1 P 8.7Sales 98,093 156,092 181,495 190,693 P 185,678 20.9 7.4 11.1 12.6 P 19.2 Local sales 61,756 92,883 92,335 94,655 P 99,094 22.8 12.2 14.3 18.9 P 23.9 Exports to Japan 24,147 45,379 49,156 54,993 P 49,703 32.0 14.7 10.9 13.4 P 16.5Number of employees 20,058 27,042 26,781 25,959 P 25,706 1.3 -3.0 -4.4 -5.2 P -6.2Sales 231,589 241,269 270,987 307,431 P 304,880 -13.3 -21.5 -10.9 14.2 P 21.4 Local sales 99,606 112,525 116,285 126,125 P 135,315 -21.5 -24.4 -11.5 14.6 P 22.3 Exports to Japan 40,130 37,796 42,007 51,107 P 49,081 -6.5 -18.8 -14.2 20.6 P 22.1Number of employees 44,903 47,238 48,977 49,821 P 49,035 -0.4 -1.8 4.3 7.4 P 8.2Sales 240,307 296,067 308,232 323,914 P 312,930 6.3 0.9 12.9 15.9 P 15.9 Local sales 139,955 178,120 183,928 200,611 P 203,947 12.5 4.4 8.6 16.2 P 23.7 Exports to Japan 30,327 66,211 67,064 64,899 P 50,880 9.4 116.0 124.7 93.0 P 65.1Number of employees 42,781 49,871 49,490 49,270 P 48,928 -3.7 -0.5 1.3 0.2 P -0.6Sales 742,614 1,093,508 1,245,484 1,271,616 P 1,293,224 27.2 30.5 31.7 31.7 P 38.9 Local sales 252,197 474,570 546,016 565,803 P 584,832 25.4 24.9 24.9 31.8 P 50.2 Exports to Japan 254,374 322,388 354,614 375,048 P 369,565 23.6 29.8 27.4 30.5 P 30.9Number of employees 456,198 584,772 627,611 633,825 P 640,396 14.0 14.2 15.2 16.0 P 15.0Sales 612,301 715,107 720,318 935,529 P 949,354 13.8 16.5 3.1 20.2 P 31.6 Local sales 467,468 513,963 513,136 658,317 P 696,142 14.0 12.4 -1.7 14.9 P 30.2 Exports to Japan 9,140 7,085 17,724 32,853 P 26,790 -4.9 13.0 192.0 258.1 P 183.2Number of employees 56,091 61,762 61,405 57,832 P 71,987 -3.8 -4.5 -5.5 -11.8 P -3.8Sales 205,890 234,985 202,912 274,017 P 284,583 29.6 14.9 6.8 23.0 P 13.9 Local sales 136,501 130,976 112,126 163,108 P 162,896 25.4 20.4 14.3 30.4 P 19.2 Exports to Japan 2,437 3,295 3,030 3,444 P 3,866 -0.4 18.7 28.0 47.6 P 57.9Number of employees 17,505 19,567 18,694 19,962 P 20,529 4.2 -3.0 -11.2 -0.6 P 1.6Sales 248,123 307,914 284,981 333,925 P 337,514 20.0 15.5 0.5 13.7 P 11.3 Local sales 177,343 224,531 196,548 233,268 P 232,358 20.2 10.7 -5.8 11.0 P 3.9 Exports to Japan 3,484 3,722 7,432 7,994 P 10,017 82.1 -0.7 167.5 88.0 P 148.2Number of employees 21,458 26,573 27,357 27,269 P 25,121 -4.7 -3.8 -0.9 -1.3 P -7.2Sales 269,261 320,130 321,710 385,723 P 330,064 5.1 8.6 7.4 22.3 P 4.8 Local sales 228,636 273,811 264,103 308,315 P 184,975 8.8 9.1 3.2 17.7 P -33.2 Exports to Japan 438 465 388 1,949 P 2,068 73.6 97.7 -20.9 105.4 P 111.8Number of employees 26,481 30,173 30,679 31,397 P 29,885 -13.0 -6.5 -3.0 -3.7 P -1.0
United States ofAmerica
Indonesia
Malaysia
Philippines
Thailand
Republic ofKorea
Singapore
Taiwan
Netherlands
People’sRepublic of China
(Hong Kong isincluded)
United Kingdom
France
Germany
32
『References』 1. Classification of countries (regions) The countries (regions) in which overseas subsidiaries were located were classified as follows (in alphabetical order): <Classification> ・ North America: Canada and USA ・ Asia (In addition to the three regions listed below, Bangladesh, India, Myanmar, Pakistan, Sri Lanka, and Vietnam are included.) ・ ASEAN4: Indonesia, Malaysia, the Philippines, Thailand ・ NIES3: Singapore, South Korea, Taiwan ・ China (including Hong Kong): the People's Republic of China (including Hong Kong Special
Administrative District) ・ Europe: Austria, Belgium, Czech Republic, Denmark, Finland, France, Germany, Greece, Hungary, Ireland, Italy, Netherlands, Poland, Portugal, Romania, Russia, Slovakia, Spain, Sweden, Switzerland, Turkey, UK ・ Others: Argentina, Australia, Brazil, Chile, Colombia, Costa Rica, Egypt, El Salvador, Guatemala, the Republic of Ivory Coast, Mexico, New Zealand, Nicaragua, Papua New Guinea, Peru, Puerto Rico (USA), South Africa, Swaziland, Tanzania, UAE, Venezuela 2. Record of changes in the content of the survey
( For details, refer to materials published for each term. ) ○The October-December quarter of 1996, and January-March quarter of 1997 ・ A test survey was conducted, and findings were published under the approval of the Management and Coordination Agency. ○From the April-June quarter of FY 1998 ・ Survey periods for "the amount of acquired tangible fixed assets excluding land" (with regard to parent companies, together with "overseas direct investment") were excluded from quarterly surveys, and researched every other quarter, such as July-September, and January-March. Accordingly, the results and prospects of surveys are conducted semi-annually instead of quarterly. The content of the surveys was also changed from "tangible fixed assets completed or acquired except land during the term" to “tangible fixed assets acquired (including temporary construction accounts) except land during the term.” With regard to parent companies, findings of the “Ministry of International Trade and Industry Survey on Investment in Plant and Equipment” were used. ・ Quarterly prospects were also changed to semi-annual prospects. ○From the April-June quarter of FY 1999 ・ A coefficient of connection was created and used for data before fiscal 1997 (the January-March quarter of 1998) to maintain consistency with past data, because dropped companies were added to the survey from fiscal 1998 (the April-June quarter of 1998). ・ Because of a change in estimating methods, results were decided not by the rate of increase compared with the previous term, but by the rate of increase compared with the same period of the previous year.
33
○From the April-June quarter of FY 2001 ・ “Company Trends Survey” was renewed by combining the “Industry Economic Trends Survey” with the “Company Trends Survey,” both of which had been under the control of the Ministry of Economy, Trade and Industry. In addition, the “Overseas Affiliated Company Edition” was published separately from the “Parent Company Edition.” ○From the April-June quarter of FY 2002 ・ A coefficient of connection was created and used for data before fiscal 2000 (the January-March quarter of 2001) to maintain consistency with past data, because companies included in the survey, questions to be asked, and other items surveyed were reviewed in order to reorganize and consolidate the surveys (the April-June quarter of 2001 and later). ・ Region/country classifications were revised to separate "China (including Hong Kong)" from "China and other Asian countries," and create another independent category. ○The April-June quarter of FY 2003 ・ The “Parent Company Survey” in the former “Company Trend Survey” was discontinued, and from the April-June quarter of 2003 the survey was conducted as the “Quarterly Survey of Overseas Subsidiaries,” which was focused on overseas subsidiaries conducting manufacturing abroad. Since companies included in the survey were reviewed and the scope of the survey was expanded (as noted in (4)-(ⅲ), from “over 50% of a controlling share” to “50% or more” of that) from the April-June quarter of 2003, differences between results in this quarter and those in the previous quarter or earlier have become apparent. The ratio to the same period of the previous year is estimated only on the basis of the total figures of companies which continued to be included in the survey from the previous fiscal year to the current quarter.
34
Data reference
〒100-8902 1-3-1, Kasumigaseki, Chiyoda-ku, Tokyo
Enterprise Statistics Office Research and Statistics Department
Ministry of Economy, Trade and Industry Tel.: 03-3501-1831 Fax.: 03-3580-6320 E_Mail:[email protected]
Data printing (Internet) http://www.meti.go.jp/statistics/index.html
* Time series tables for past data are on the web page at the above-mentioned address.