Trends in Manufacturer Prices of Brand-Name Prescription ... · Figure 4: Three-Month and...
14
DD146 TRENDS IN MANUFACTURER PRICES OF BRAND-NAME PRESCRIPTION DRUGS USED BY OLDER AMERICANS— SECOND QUARTER 2006 UPDATE INTRODUCTION This Data Digest reports on changes in manufacturer prescription drug prices during the second quarter of 2006 (April through June) for the 193 brand-name prescription drugs most widely used by Americans age 50 and older. This report is part of an ongoing study of changes in drug manufacturer prices. Previous reports by the AARP Public Policy Institute identified steady increases in the average annual manufacturer price from calendar year 2000 through the first three months of 2006. 1 These reports focus on changes in the prices brand-name drug manufacturers charge wholesalers and other direct purchasers for their sales to retail pharmacies. The manufacturer’s charge to wholesalers is the most substantial component of a brand- name prescription drug’s retail price. When manufacturers increase their price to wholesalers for a brand-name drug, the added cost is generally passed on in the retail price to most prescription purchasers. 2 Changes in drug manufacturer prices are measured by changes in the wholesale acquisition cost (WAC) published in the Medi- Span Price-Chek PC database. 3 This report presents three measures of price change during the second quarter of 2006, using both rolling average and point-to-point estimates (see methodological appendix). 4 The first set of findings are annual rates of change in manufacturer prices through the second quarter of 2006 (i.e., changes from July 1, 2005, through June 30, 2006) for widely used brand-name drugs, using both rolling average and point-to-point estimates; information is presented on the percentage change in manufacturer price and on potential dollar changes in consumer spending. The second set of findings focuses on three-month rates of change for the second quarter of 2006 (i.e., changes from March 31 through June 30). The third set of findings are year-to-date percentage changes in prices for the first six months of 2006 (i.e., changes from December 31, 2005, through June 30, 2006); the distribution of percentage price changes is shown, as are differences in average percentage price changes by manufacturer and by therapeutic category. FINDINGS I. Annual Trends in Manufacturer Price Changes for Most Widely Used Brand- Name Prescription Drugs To compare recent changes in prices charged by manufacturers with changes reported for previous years, an annual rate of price change for the 193 brand-name prescription drugs most widely used by older Americans 5 for the 12 months ending with the second quarter of 2006 was calculated. This period includes the months when Medicare drug coverage was first available as a result of the Medicare Prescription Drug, Improvement, and Modernization Act of 2003.
Transcript of Trends in Manufacturer Prices of Brand-Name Prescription ... · Figure 4: Three-Month and...

DD146
TRENDS IN MANUFACTURER PRICES OF BRAND-NAME PRESCRIPTION DRUGS USED BY OLDER AMERICANS—
SECOND QUARTER 2006 UPDATE INTRODUCTION This Data Digest reports on changes in manufacturer prescription drug prices during the second quarter of 2006 (April through June) for the 193 brand-name prescription drugs most widely used by Americans age 50 and older. This report is part of an ongoing study of changes in drug manufacturer prices. Previous reports by the AARP Public Policy Institute identified steady increases in the average annual manufacturer price from calendar year 2000 through the first three months of 2006.1 These reports focus on changes in the prices brand-name drug manufacturers charge wholesalers and other direct purchasers for their sales to retail pharmacies. The manufacturer’s charge to wholesalers is the most substantial component of a brand-name prescription drug’s retail price. When manufacturers increase their price to wholesalers for a brand-name drug, the added cost is generally passed on in the retail price to most prescription purchasers.2 Changes in drug manufacturer prices are measured by changes in the wholesale acquisition cost (WAC) published in the Medi-Span Price-Chek PC database.3 This report presents three measures of price change during the second quarter of 2006, using both rolling average and point-to-point estimates (see methodological appendix).4 The first set of findings are annual rates of change in manufacturer prices through the second quarter of 2006 (i.e., changes from July 1, 2005, through June 30, 2006) for widely used brand-name drugs, using both rolling average and point-to-point estimates; information is presented on the percentage change in manufacturer price and on potential dollar changes in consumer spending. The second set of findings focuses on three-month rates of change for the second quarter of 2006 (i.e., changes from March 31 through June 30). The third set of findings are year-to-date percentage changes in prices for the first six months of 2006 (i.e., changes from December 31, 2005, through June 30, 2006); the distribution of percentage price changes is shown, as are differences in average percentage price changes by manufacturer and by therapeutic category. FINDINGS
I. Annual Trends in Manufacturer Price Changes for Most Widely Used Brand-Name Prescription Drugs To compare recent changes in prices charged by manufacturers with changes reported for previous years, an annual rate of price change for the 193 brand-name prescription drugs most widely used by older Americans5 for the 12 months ending with the second quarter of 2006 was calculated. This period includes the months when Medicare drug coverage was first available as a result of the Medicare Prescription Drug, Improvement, and Modernization Act of 2003.

2
Annual percent change in manufacturer prices
• Manufacturer prices for brand-name drugs rose 6.3 percent in the 12 months ending with the second quarter (June) of 2006, when measured as a 12-month rolling average and weighted by actual 2003 sales to Americans age 50 and over (Figure 1).
• The manufacturer price increase for this most recent period was more than one and
one-half times the 3.8 percent rate of general inflation (as measured by the Consumer Price Index-All Urban Consumers, or CPI-U)6 for the same 12-month period.
• The average annual manufacturer price increase through the second quarter of 2006
represents an acceleration from the 6.0 percent average increase for the 12 months ending in December 2005. At the same time, the average annual rate of general inflation rose from 3.4 percent for the 12 months ending in December 2005 to 3.8 percent for the 12 months ending in the second quarter of 2006.
Figure 1: Average Annual Percentage Change in Manufacturer Prices for Most Widely Used Brand-Name Prescription Drugs, 2000 through Second Quarter 2006 Average increases for 2004, 2005, and the first two quarters of 2006 exclude Vioxx 12.5 mg and 25 mg tablets, which were withdrawn from the market in September 2004. Average increases for 2005 and the first two quarters of 2006 also exclude Bextra 10 mg and 20 mg tablets, which were withdrawn from the market in April 2005. Prepared by the AARP Public Policy Institute and the PRIME Institute, University of Minnesota, based on data found in Medi-Span Price-Chek PC (Indianapolis, IN: Wolters Kluwer Health Inc., August 2006).
4.1%4.7%
6.1%
7.0% 7.1%
6.0%6.3%
3.4%2.8%
1.6%2.3%
2.7%3.4%
3.8%
0.0%
1.0%
2.0%
3.0%
4.0%
5.0%
6.0%
7.0%
8.0%
2000 2001 2002 2003 2004 2005 July 2005-June 2006
Aver
age
Annu
al %
Cha
nge
Manufacturer Price (WAC) General Inflation (CPI-U)

3
The average annual price change reported in Figure 1 is a conservative measure that, by averaging annual point-to-point price changes over a 12-month period (referred to as a rolling average change), masks the annual amount of change in price that occurs for a given month (referred to as an annual point-to-point change). The percentage change in price compared to the same month in the previous year has been plotted along with the 12-month rolling average to allow more detailed examination of the rate and timing of price changes over the entire study period (Figure 2).
Figure 2 shows that the average annual point-to-point increase in prices recently decelerated after a brief period of acceleration that began in November 2005. This follows a period in which the rate of price increase hovered at or slightly above 6 percent (May 2005-November 2005) and, before that, a period in which the rate of price increase fell dramatically, from 8 percent to 5.5 percent.
Figure 2: Comparison of Rolling Average and Point-to-Point Changes in Manufacturer Prices for Most Widely Used Brand-Name Prescription Drugs, 2000 through Second Quarter 2006
0.0%
1.0%
2.0%
3.0%
4.0%
5.0%
6.0%
7.0%
8.0%
9.0%
Jan-
00M
ar-0
0M
ay-0
0Ju
l-00
Sep
-00
Nov
-00
Jan-
01M
ar-0
1M
ay-0
1Ju
l-01
Sep
-01
Nov
-01
Jan-
02M
ar-0
2M
ay-0
2Ju
l-02
Sep
-02
Nov
-02
Jan-
03M
ar-0
3M
ay-0
3Ju
l-03
Sep
-03
Nov
-03
Jan-
04M
ar-0
4M
ay-0
4Ju
l-04
Sep
-04
Nov
-04
Jan-
05M
ar-0
5M
ay-0
5Ju
l-05
Sep
-05
Nov
-05
Jan-
06M
ar-0
6M
ay-0
6
Month & Year
Ann
ual %
Cha
nge
WAC Annual Percent Change (weighted average, same month in previous year)WAC Annual Percent Change (weighted average, 12-month rolling average)CPI All Items (12-month rolling average, seasonally adjusted)
House and Senate pass Medicare bills
Congress passes
conference report
President signs MMA
Medicare Drug Discount Card
Available
Medicare Part D becomes available
Jun-
06
Average increases after August 2004 exclude Vioxx 12.5 mg and 25 mg tablets, which were withdrawn from the market in September 2004. Average increases after March 2005 also exclude Bextra 10 mg and 20 mg tablets, which were withdrawn from the market in April 2005. Prepared by the AARP Public Policy Institute and the PRIME Institute, University of Minnesota, based on data found in Medi-Span Price-Chek PC (Indianapolis, IN: Wolters Kluwer Health Inc., August 2006).
4
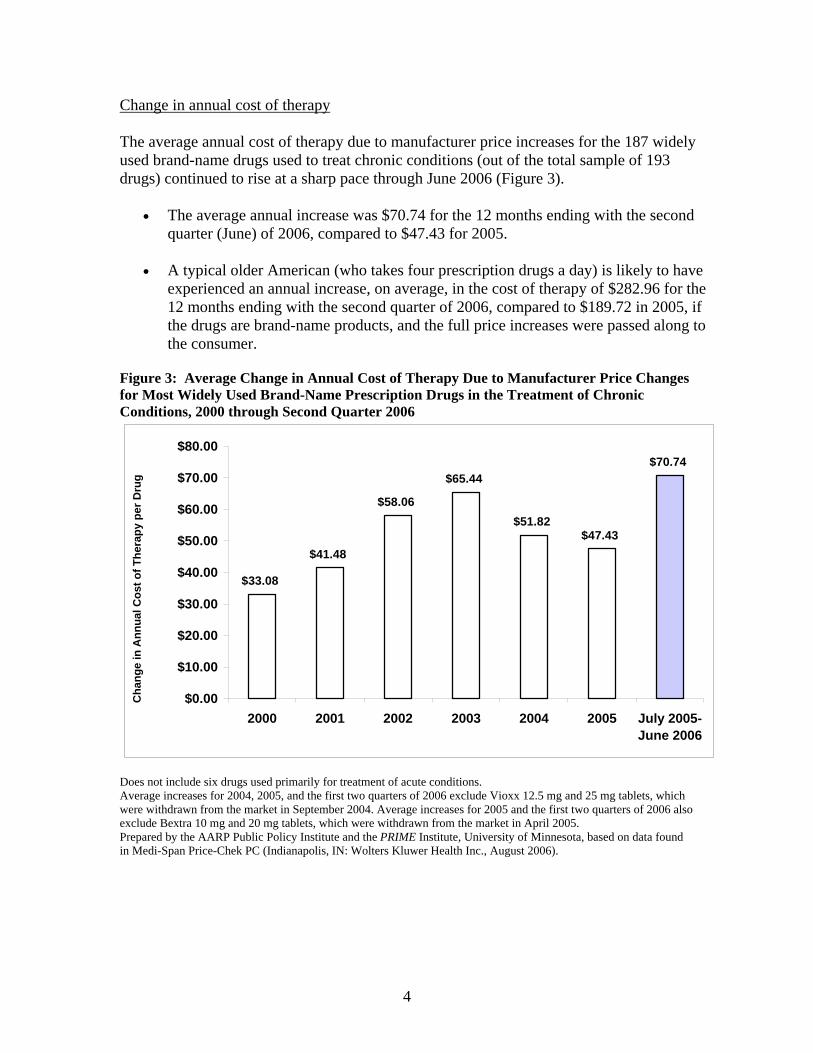
Change in annual cost of therapy The average annual cost of therapy due to manufacturer price increases for the 187 widely used brand-name drugs used to treat chronic conditions (out of the total sample of 193 drugs) continued to rise at a sharp pace through June 2006 (Figure 3).
• The average annual increase was $70.74 for the 12 months ending with the second quarter (June) of 2006, compared to $47.43 for 2005.
• A typical older American (who takes four prescription drugs a day) is likely to have
experienced an annual increase, on average, in the cost of therapy of $282.96 for the 12 months ending with the second quarter of 2006, compared to $189.72 in 2005, if the drugs are brand-name products, and the full price increases were passed along to the consumer.
Figure 3: Average Change in Annual Cost of Therapy Due to Manufacturer Price Changes for Most Widely Used Brand-Name Prescription Drugs in the Treatment of Chronic Conditions, 2000 through Second Quarter 2006
$33.08
$41.48
$58.06
$65.44
$51.82$47.43
$70.74
$0.00
$10.00
$20.00
$30.00
$40.00
$50.00
$60.00
$70.00
$80.00
2000 2001 2002 2003 2004 2005 July 2005-June 2006
Cha
nge
in A
nnua
l Cos
t of T
hera
py p
er D
rug
Does not include six drugs used primarily for treatment of acute conditions. Average increases for 2004, 2005, and the first two quarters of 2006 exclude Vioxx 12.5 mg and 25 mg tablets, which were withdrawn from the market in September 2004. Average increases for 2005 and the first two quarters of 2006 also exclude Bextra 10 mg and 20 mg tablets, which were withdrawn from the market in April 2005. Prepared by the AARP Public Policy Institute and the PRIME Institute, University of Minnesota, based on data found in Medi-Span Price-Chek PC (Indianapolis, IN: Wolters Kluwer Health Inc., August 2006).
5
0.5%
4.3%
3.9%
1.1% 1.3%
2.3%
0.0%
1.0%
2.0%
3.0%
4.0%
5.0%
First Quarter 2006 Second Quarter 2006 6-Month 2006
Ave
rage
3-M
onth
% C
hang
e
Manufacturer Price (WAC) General Inflation (CPI-U)
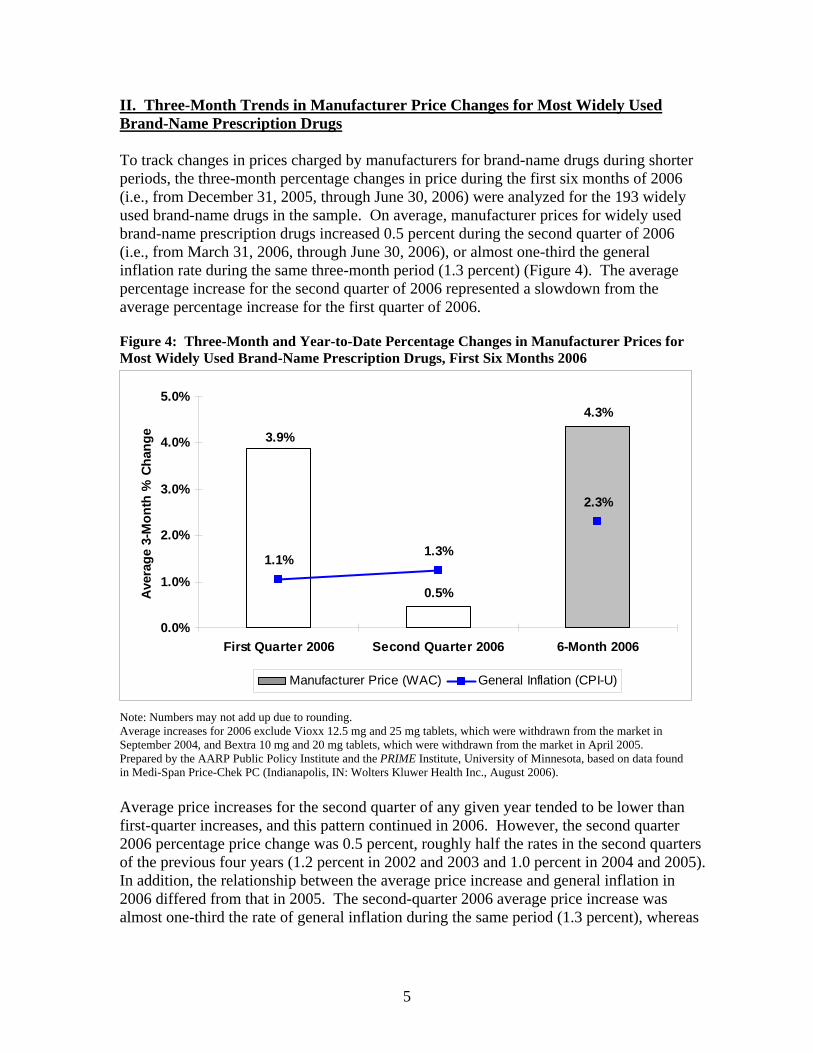
II. Three-Month Trends in Manufacturer Price Changes for Most Widely Used Brand-Name Prescription Drugs To track changes in prices charged by manufacturers for brand-name drugs during shorter periods, the three-month percentage changes in price during the first six months of 2006 (i.e., from December 31, 2005, through June 30, 2006) were analyzed for the 193 widely used brand-name drugs in the sample. On average, manufacturer prices for widely used brand-name prescription drugs increased 0.5 percent during the second quarter of 2006 (i.e., from March 31, 2006, through June 30, 2006), or almost one-third the general inflation rate during the same three-month period (1.3 percent) (Figure 4). The average percentage increase for the second quarter of 2006 represented a slowdown from the average percentage increase for the first quarter of 2006. Figure 4: Three-Month and Year-to-Date Percentage Changes in Manufacturer Prices for Most Widely Used Brand-Name Prescription Drugs, First Six Months 2006
Note: Numbers may not add up due to rounding. Average increases for 2006 exclude Vioxx 12.5 mg and 25 mg tablets, which were withdrawn from the market in September 2004, and Bextra 10 mg and 20 mg tablets, which were withdrawn from the market in April 2005. Prepared by the AARP Public Policy Institute and the PRIME Institute, University of Minnesota, based on data found in Medi-Span Price-Chek PC (Indianapolis, IN: Wolters Kluwer Health Inc., August 2006). Average price increases for the second quarter of any given year tended to be lower than first-quarter increases, and this pattern continued in 2006. However, the second quarter 2006 percentage price change was 0.5 percent, roughly half the rates in the second quarters of the previous four years (1.2 percent in 2002 and 2003 and 1.0 percent in 2004 and 2005). In addition, the relationship between the average price increase and general inflation in 2006 differed from that in 2005. The second-quarter 2006 average price increase was almost one-third the rate of general inflation during the same period (1.3 percent), whereas

6
in 2005, the average second-quarter price increase (0.9 percent) was nearly twice the 0.5 percent rate of general inflation for the same three-month time period. III. Year-To-Date Trends in Manufacturer Price Changes for Most Widely Used Brand-Name Prescription Drugs Distribution of year-to-date manufacturer price changes Manufacturer prices for 148 of the 193 most widely used brand-name prescription drug products increased during the first two quarters of 2006 (i.e., from December 31, 2005, through June 30, 2006). Manufacturer prices for the remaining 45 brand-name prescription drugs did not change in the first two quarters of 2006 (Figure 5).
• Among those brand-name drugs with price increases during the first six months of 2006, all increases were 3.0 percent or more, higher than the rate of inflation for the same period (2.3 percent).
• Seventy-seven drugs widely used by older Americans had increases of more than 5
percent during the first six months of 2006, including three drugs with six-month price increases of more than 10 percent.
Figure 5: Distribution of Year-to-Date Percentage Changes in Manufacturer Prices for Most Widely Used Brand-Name Prescription Drugs, First Six Months 2006
Percent Change in WAC(TOTAL= 193 Drugs)
6-Month Rate of Inflation= 2.3%
No change in price
5.1% - 7.5% increase
7.6%-10.0% increase16 Drugs
10.1% - 13.3% increase3 Drugs
3.0 % - 5.0% increase
71Drugs
45 Drugs
58 Drugs
Does not include Vioxx 12.5 mg and 25 mg tablets, which were withdrawn from the market in 2004, and Bextra 10 mg and 20 mg tablets, which were withdrawn from the market in 2005. Prepared by the AARP Public Policy Institute and the PRIME Institute, University of Minnesota, based on data found in Medi-Span Price-Chek PC (Indianapolis, IN: Wolters Kluwer Health Inc., August 2006).

7
9.0%
9.0%
9.4%
9.9%
12.0%
12.0%
13.3%
0.0% 2.0% 4.0% 6.0% 8.0% 10.0% 12.0% 14.0%
Clarinex 5 mg
Humulin N 100 IU
Wellbutrin 150 mg
Ambien 10 mg
Atrovent Inhaler 18 mcg/act
Combivent 120-20 mcg/act
Ambien 5 mg
6-Month % Change
Manufacturer Price (WAC) General Inflation (2.3%)
Figure 6: Brand-Name Prescription Drug Products with Highest Year-to-Date Percentage Change in Manufacturer Price, First Six Months 2006
General inflation is based on CPI-U. Prepared by the AARP Public Policy Institute and the PRIME Institute, University of Minnesota, based on data found in Medi-Span Price-Chek PC (Indianapolis, IN: Wolters Kluwer Health Inc., August 2006). The seven brand-name drug products with the highest six-month manufacturer price increases (i.e., the change from December 31, 2005, through June 30, 2006) in this study—ranging from 9.0 percent to 13.3 percent—are shown in Figure 6. Twenty-one of the 25 brand-name drugs with the greatest sales in 2003 had price increases during the first six months of 2006; these increases all exceeded the rate of general inflation during the same period (2.3 percent). Three of the 25 drugs had no price changes during the first six months of 2006 (Table 1). (The remaining drug, Vioxx 25 mg, was removed from the market in September 2004.) During the first six months of 2006, the highest percentage price change among the 25 brand-name drugs with the greatest sales in 2003 was for Aventis’s Ambien 10 mg (9.9 percent). This was followed by Pfizer’s Lipitor 10 mg and Celebrex 200 mg (6.5 percent each).

8
Table 1: Year-to-Date Percentage Change in Manufacturer Prices for Top 25 Brand-Name Prescription Drug Products, First Six Months 2006
Rank by Sales
among Study
Sample*
Product Name, Strength, and Dosage Form
Package Size Manufacturer Therapeutic Class
% Change in WAC,
December 31, 2005-June 30,
2006 1 Fosamax 70 mg 4 Merck Osteoporosis Agents 4.9%
2 Lipitor 10 mg 90 Pfizer HMG CoA Reductase Inhibitors 6.5%
3 Plavix 75 mg 90 Bristol-Myers Squibb
Platelet Aggregation Inhibitors 4.0%
4 Lipitor 20 mg 90 Pfizer HMG CoA Reductase Inhibitors 4.7%
5 Prevacid 30 mg Dr 100 TAP Proton Pump Inhibitors 3.5% 6 Celebrex 200 mg 100 Pfizer NSAIDs 6.5% 7 Protonix 40 mg 90 Wyeth Proton Pump Inhibitors 3.4% 8 Norvasc 5 mg 90 Pfizer Amlodipine Besylate 3.2%
9 Plavix 75 mg 30 Bristol-Myers Squibb
Platelet Aggregation Inhibitors 4.0%
10 Norvasc 10 mg 90 Pfizer Amlodipine Besylate 3.2% 11 Nexium 40 mg 30 AstraZeneca Proton Pump Inhibitors 3.5%
12 Flomax 0.4 mg 100 Boehringer Ingelheim
Prostatic Hypertrophy Agents 0.0%
13 Actonel 35 mg 4 Procter & Gamble Osteoporosis Agents 4.9% 14 Xalatan Sol 0.005% 2.5 Pfizer Prostaglandins-Ophthalmic 5.0% 15 Aricept 10 mg 30 Eisai Antidementia 6.0% 16 Vioxx 25 mg 100 Merck NSAIDs N/A** 17 Ambien 10 mg 100 Aventis Nonbarbiturate Hypnotics 9.9%
18 Pravachol 40 mg 90 Bristol-Myers Squibb
HMG CoA Reductase Inhibitors 4.0%
19 Pravachol 20 mg 90 Bristol-Myers Squibb
HMG CoA Reductase Inhibitors 4.0%
20 Evista 60 mg 30 Lilly Hormone Receptor Modulators 0.0%
21 Lipitor 40 mg 90 Pfizer HMG CoA Reductase Inhibitors 4.7%
22 Toprol XL 50 mg 100 AstraZeneca Beta Blockers Cardio-Selective 3.0%
23 Levaquin 500 mg 50 McNeil Anti-Infective Agents 4.9%
24 Zocor 20 mg 30 Merck HMG CoA Reductase Inhibitors 0.0%
25 Neurontin 300 mg 100 Pfizer Misc. Anticonvulsants 5.9% General inflation rate (as measured by growth in CPI-U), December 2005-June 2006 2.3%
*Ranking based on dollar value of prescriptions processed by the AARP Pharmacy Service during 2003. **Vioxx 25 mg tablets were removed from the market in September 2004. Prepared by the AARP Public Policy Institute and the PRIME Institute, University of Minnesota, based on data found in Medi-Span Price-Chek PC (Indianapolis, IN: Wolters Kluwer Health Inc., August 2006).

9
Year-to-date manufacturer price changes for most widely used brand-name prescription drugs, by manufacturer Eighteen of the 20 drug manufacturers with at least three drugs in the study of widely used brand-name drugs had average price increases exceeding the rate of inflation during the first two quarters of 2006 (i.e., from December 31, 2005, through June 30, 2006) (Figure 7). • Seven manufacturers—Aventis, Novartis, Purdue Pharmaceuticals, Eisai, Procter &
Gamble, Allergan, and Pfizer—had average six-month price increases that were at least twice the rate of general inflation (2.3 percent) during the same period.
• Two manufacturers—Monarch and Takeda—did not change prices during the first six
months of 2006 for drugs in the sample of products widely used by older Americans. Figure 7: Average Year-to-Date Percentage Change in Manufacturer Price for Brand-Name Prescription Drugs, by Manufacturer, First Six Months 2006
7.7
6.66.0 5.7
5.1 5.0 4.94.4 4.2 4.0 4.0 3.8 3.7 3.5 3.3 3.3 3.0 2.9
2.5
0.0 0.00.0
2.0
4.0
6.0
8.0
10.0
Ave
ntis
Nov
artis
Purd
uePh
arm
aceu
tical
s
Eisa
i
Proc
ter &
Gam
ble
Alle
rgan
Pfiz
er
Gla
xoSm
ithK
line
McN
eil
Boe
hrin
ger
Ingl
ehei
mB
risto
l-Mye
rsSq
uibb
Ast
raZe
neca
Mer
ck
Wye
th
Abb
ott
Jans
sen
All
othe
rs
Fore
st
Lilly
Mon
arch
Take
da
Ave
rage
6-M
onth
% C
hang
e
Manufacturer Price (WAC) General Inflation (2.3%)
Manufacturers with fewer than three drugs in the 2003 sample of most widely used brand-name prescription drugs are included in the “All Others” category. General inflation is based on CPI-U. Average increase for Merck excludes Vioxx 12.5 mg and 25 mg tablets, which were withdrawn from the market in September 2004. Average increase for Pfizer excludes Bextra 10 mg and 20 mg tablets, which were withdrawn from the market in April 2005. Prepared by the AARP Public Policy Institute and the PRIME Institute, University of Minnesota, based on data found in Medi-Span Price-Chek PC (Indianapolis, IN: Wolters Kluwer Health Inc., August 2006).
10
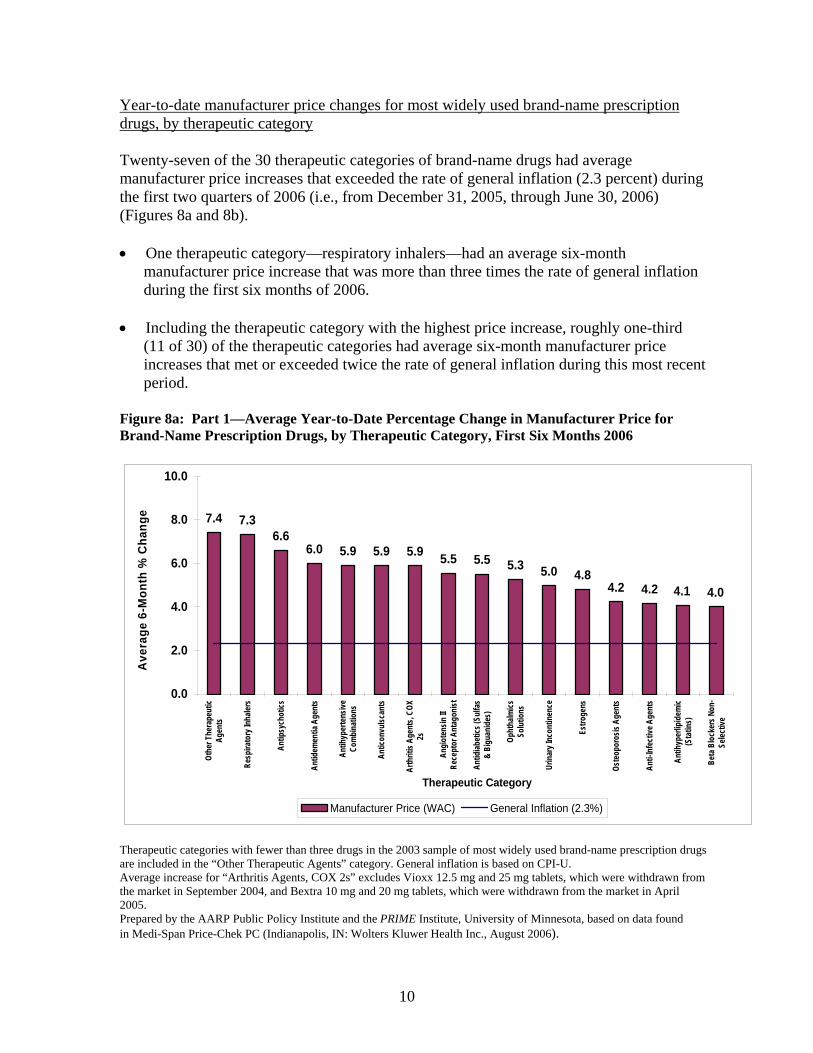
Year-to-date manufacturer price changes for most widely used brand-name prescription drugs, by therapeutic category Twenty-seven of the 30 therapeutic categories of brand-name drugs had average manufacturer price increases that exceeded the rate of general inflation (2.3 percent) during the first two quarters of 2006 (i.e., from December 31, 2005, through June 30, 2006) (Figures 8a and 8b). • One therapeutic category—respiratory inhalers—had an average six-month
manufacturer price increase that was more than three times the rate of general inflation during the first six months of 2006.
• Including the therapeutic category with the highest price increase, roughly one-third
(11 of 30) of the therapeutic categories had average six-month manufacturer price increases that met or exceeded twice the rate of general inflation during this most recent period.
Figure 8a: Part 1—Average Year-to-Date Percentage Change in Manufacturer Price for Brand-Name Prescription Drugs, by Therapeutic Category, First Six Months 2006
7.4 7.36.6
6.0 5.9 5.9 5.9 5.5 5.5 5.3 5.0 4.84.2 4.2 4.04.1
0.0
2.0
4.0
6.0
8.0
10.0
Othe
r The
rape
utic
Agen
ts
Resp
irato
ry In
haler
s
Antip
sych
otics
Antid
emen
tia A
gent
s
Antih
yper
tens
iveCo
mbi
natio
ns
Antic
onvu
lscan
ts
Arth
ritis
Agen
ts, C
OX2s
Angi
oten
sin II
Rece
ptor
Ant
agon
ist
Antid
iabet
ics (S
ulfa
s&
Bigu
anid
es)
Opht
halm
icsSo
lutio
ns
Urin
ary I
ncon
tinen
ce
Estro
gens
Oste
opor
osis
Agen
ts
Anti-
Infe
ctive
Age
nts
Antih
yper
lipid
emic
(Sta
tins)
Beta
Blo
cker
s Non
-Se
lectiv
e
Therapeutic Category
Ave
rage
6-M
onth
% C
hang
e
Manufacturer Price (WAC) General Inflation (2.3%)
Therapeutic categories with fewer than three drugs in the 2003 sample of most widely used brand-name prescription drugs are included in the “Other Therapeutic Agents” category. General inflation is based on CPI-U. Average increase for “Arthritis Agents, COX 2s” excludes Vioxx 12.5 mg and 25 mg tablets, which were withdrawn from the market in September 2004, and Bextra 10 mg and 20 mg tablets, which were withdrawn from the market in April 2005. Prepared by the AARP Public Policy Institute and the PRIME Institute, University of Minnesota, based on data found in Medi-Span Price-Chek PC (Indianapolis, IN: Wolters Kluwer Health Inc., August 2006).

11
Figure 8b: Part 2—Average Year-to-Date Percentage Change in Manufacturer Price for Brand-Name Prescription Drugs, by Therapeutic Category, First Six Months 2006
4.0 3.7 3.7 3.6 3.5 3.4 3.2 3.1 3.0 3.0 2.7 2.7
1.5 1.4
0.00.0
2.0
4.0
6.0
8.0
10.0
Ant
icoa
gula
nts
Ant
ihyp
erlip
idem
ic(O
ther
Age
nts)
Plat
elet
Agg
rega
tion
Inhi
bito
rs
Ulc
er A
gent
s(P
PIs)
Thyr
oid
Hor
mon
es
AC
E In
hibi
tors
Cal
cium
Blo
cker
s
Ant
ihis
tam
ines
,N
onse
datin
g
Bet
a B
lock
ers
Car
dio-
Sele
ctiv
e
Gen
itour
inar
yPr
oduc
ts
Nar
cotic
Ana
lges
ics
Ant
idep
ress
ants
,O
ther
Ant
idia
betic
s(In
sulin
-se
nsiti
zers
)
Ant
idep
ress
ants
,SS
RIs
Car
diac
Gly
cosi
des
Therapeutic Category
Ave
rage
6-M
onth
% C
hang
e
Manufacturer Price (WAC) General Inflation (2.3%)
Therapeutic categories with fewer than three drugs in the 2003 sample of most widely used brand name prescription drugs are included in the “Other Therapeutic Agents” category. General inflation is based on CPI-U. Prepared by PRIME Institute, University of Minnesota, based on data found in Medi-Span Price-Chek PC (Indianapolis, IN: Wolters Kluwer Health Inc., August 2006). CONCLUDING OBSERVATIONS Through the end of the second quarter of 2006, annual increases in manufacturer prices charged to wholesalers and other direct purchasers for widely used brand-name prescription drugs, on average, continued to substantially exceed the rate of general inflation. In addition, the average annual rate of price increase for the 12-month period ending in June 2006 (6.3 percent) is higher than the 6.0 percent average increase for the 12 months ending in December 2005. Over three-fourths of the drugs in the sample—148 of 193—had increases in manufacturer price during the period from December 31, 2005, through June 30, 2006, and all of these increases were higher than the rate of general inflation during the same six-month period. Average six-month price increases were substantial (i.e., at least twice the rate of general inflation) for more than one-third of the manufacturers and one-third of the therapeutic categories with at least three drugs in the sample.
12
METHODOLOGICAL APPENDIX This analysis is based on a sample of 197 brand-name drugs that are among the 200 most widely dispensed drugs (including both generic and brand-name drugs) or the 200 drugs with the highest sales levels among retail and mail-order prescriptions adjudicated by the AARP Pharmacy Service for 2003.7 Each product represents a unique combination of active chemical ingredient, strength, dosage form, package size, and manufacturer (for example, Prevacid 30 mg capsule, package of 100, TAP Pharmaceuticals). Products are identified by a unique 11-digit National Drug Code (NDC) identifier. In this analysis, when a manufacturer discontinues a NDC code for a particular product but assigns a new NDC to a product with the same chemical ingredient, strength, dosage form, and similar or identical package size as the product with the discontinued NDC, the products are considered the same for the purposes of tracking price per unit (i.e., tablet, capsules, etc.). Products are included in the analysis only for the period they were on the market. Although the drugs studied were identified using AARP Pharmacy Service data, changes in prices charged by drug manufacturers to wholesalers were measured using changes in the wholesale acquisition cost (WAC) as published in the Medi-Span Price-Chek PC database.8 WACs are the prices typically reported on invoices between the manufacturer and the drug wholesaler. WACs do not routinely capture the absolute level of prices paid (for example, they do not capture rebates that manufacturers provide to some third-party payers). Changes in the WAC, however, are the most consistent estimate available for change in both prices paid to manufacturers for brand-name drugs and the ingredient cost component of prices paid for those drugs by retail pharmacies. This is because manufacturers typically reference WAC or average wholesale price (AWP) as the basis for charging wholesalers and pharmacies that buy directly from drug manufacturers. In addition, nearly all third-party contracts (including both private programs and public programs such as Medicaid and Medicare) specifically reference WAC or AWP as the basis for determining prescription payment amounts. Furthermore, because Americans who must pay out-of-pocket for their own prescriptions (that is, “cash pay” consumers) typically do not have access to such rebates or discounts, consideration of rebates is not relevant to an assessment of changes in drug prices for sales to the retail market segment. Finally, even if drug manufacturer rebates to third-party payers were considered, they typically resulted in only a modest decrease in drug price—about 2.0 to 5.0 percent of total drug spending by a drug benefit plan.9 This report calculates average drug price changes in the following ways:
• The 12-month rolling average percentage price change is calculated by first comparing each month’s price with the price in the same month of the previous year (e.g., January 2003 vs. January 2002, February 2003 vs. February 2002, etc.), then taking the average of these point-to-point changes over the preceding 12 months. Thus, for example, the average annual price changes for 2004 refer to the average of the price changes for

13
each of the 12 months from January 2004 through December 2004 compared with the same months in the previous year.
• The annual point-to-point percentage price change is calculated as the
percentage change in price for a given month compared with the same month in the previous year.
• The year-to-date percentage price change (point-to-point) is calculated as
the percentage change in price from the last day of the previous year (i.e., December 31) to the last day of the quarter (e.g., June 30).10
• The three-month percentage price change (point-to-point) is calculated as
the percentage change in price from the last day of the previous quarter (e.g., March 31 for the second quarter price change) to the last day of the quarter (e.g., June 30).
When aggregate estimates of price or change in drug prices were calculated for this study, each drug product’s value was weighted by the 2003 sales for that drug in the AARP Pharmacy Service. The AARP Pharmacy Service weights were used as a proxy for average drug use for all older Americans. To assess the impact of price changes on dollars spent, an annual cost of therapy was calculated for each drug product. This analysis excludes the six products in the sample that are used primarily to treat acute conditions and typically taken for a limited period. The amount of a drug that an average adult person would take daily was determined using the “usual daily dose” reported in the Medi-Span Price-Chek PC database or, when this information was not available from Medi-Span, using dosing information in the U.S. Food and Drug Administration (FDA)-approved labeling for the drug product. Analyses of manufacturer price changes are presented by drug manufacturer and by therapeutic category. The analysis of drug manufacturers reported separately on the 20 manufacturers with at least three drug products, accounting for 183 of the drug products among the 197 most widely used brand-name drugs. The analysis by therapeutic category reported separately on groupings of three or more drugs with a similar use or mechanism of action in treating patients. There were 30 therapeutic categories covering 183 of the drug products in the overall study sample. 1 Previous reports in this series can be found on the AARP website at http://www.aarp.org/research/health/carefinancing/aresearch-import-869-2004-06--IB69.html. 2 Rebates paid by brand-name drug manufacturers, if any, have not been taken into account in this analysis. Rebates generally do not benefit retail pharmacies or their “cash pay” customers, i.e., people who pay upfront for their prescriptions because they have no drug coverage or they have indemnity insurance. 3 Medi-Span is a private organization that collects price data directly from drug manufacturers and wholesalers. 4 A brief description of the methodology used to produce these findings is provided in the methodological appendix. For a more detailed description of the methodology for the baseline study, including the rolling average approach, see Gross et al., Trends in Manufacturer Prices of Brand Name Prescription Drugs Used by

14
Older Americans, 2000 through 2003, AARP Public Policy Institute Issue Paper #2004-06 (Washington, DC: AARP), May 2004 (revised June 2004). 5 Although the original sample contained 197 brand-name prescription drugs, four of these drugs—Vioxx 12.5 mg tablets, Vioxx 25 mg tablets, Bextra 10 mg tablets, and Bextra 20 mg tablets—were withdrawn from the market in September 2004 (Vioxx) and April 2005 (Bextra). As a result, only 193 drugs are analyzed for any period that includes April 2005 or subsequent months. 6 Specifically, the general inflation rate reported is based on the average annual rate of change in the Consumer Price Index-All Urban Consumers for All Items (seasonally adjusted), Bureau of Labor Statistics series CUSR0000SA0. 7 Supra note 5. 8 Supra note 4. 9 See PriceWaterhouseCoopers, Study of Pharmaceutical Benefit Management, HCFA Contract No. 500-97-0399/0097, June 2001, p. 131; Patrick Holjo and Matthew Kamm, Pharmacy Benefit Managers: Keeping a Lid on Drug Costs, Banc of America Securities, February 20, 2002, p. 29. 10 Year-to-date rates of change for periods of nine months or less should not be compared to annual (i.e., 12 month) rates of change based on rolling average estimates, which are frequently reported in this series.
Clifford Binder, Leigh Gross Purvis, David J. Gross, and Susan O. Raetzman, AARP Public Policy Institute; and Stephen W. Schondelmeyer, PRIME Institute, University of Minnesota September 2006. ©2006, AARP. Reprinting with permission only. AARP, 601 E Street, NW, Washington, DC 20049 http://www.aarp.org/ppi


![LOWERING PRESCRIPTION DRUG PRICES IN THE …idjlaw/PDF/15-2/15-2 Ma.pdf · 2006] Lowering Prescription Drug Prices in the United States 347 ... Research and Education casts some doubt](https://static.fdocuments.net/doc/165x107/5a8f5f487f8b9a085a8db3e8/lowering-prescription-drug-prices-in-the-idjlawpdf15-215-2-mapdf2006-lowering.jpg)