Trends in LNG Markets. Global Liquefaction Capacity Forecast.
21
Trends in LNG Markets
-
Upload
bruno-wilkins -
Category
Documents
-
view
233 -
download
3
Transcript of Trends in LNG Markets. Global Liquefaction Capacity Forecast.

Trends in LNG Markets

Global Liquefaction Capacity Forecast .
Global Liquefaction Capacity Forecast (Based on Operator's Announced Dates)
0
100
200
300
400
500
600
19
90
19
91
19
92
19
93
19
94
19
95
19
96
19
97
19
98
19
99
20
00
20
01
20
02
20
03
20
04
20
05
20
06
20
07
20
08
20
09
20
10
20
11
20
12
20
13
20
14
20
15
20
16
20
17
20
18
20
19
20
20
Pacific
Middle East
Atlantic - Mediterranean

Higher Gas Prices in Asia
Historical and Forecasted Gas prices: Henry Hub (US) vs. Asia
0
5
10
15
20
25
19
88
19
90
19
92
19
94
19
96
19
98
20
00
20
02
20
04
20
06
20
08
20
10
20
12
20
14
20
16
20
18
20
20
Japan Korea Taiwan Henry Hub
• In the US, gas is a traded commodity with robust growth on the supply side, while is Asia LNG prices are defined by long – term contracts linked to the price of oil• The price differential between the US and Japan, currently - $2.00 /MMBtu, is forecasted to grow to ~ $6.00 - $8.00 /MMBtu by 2020
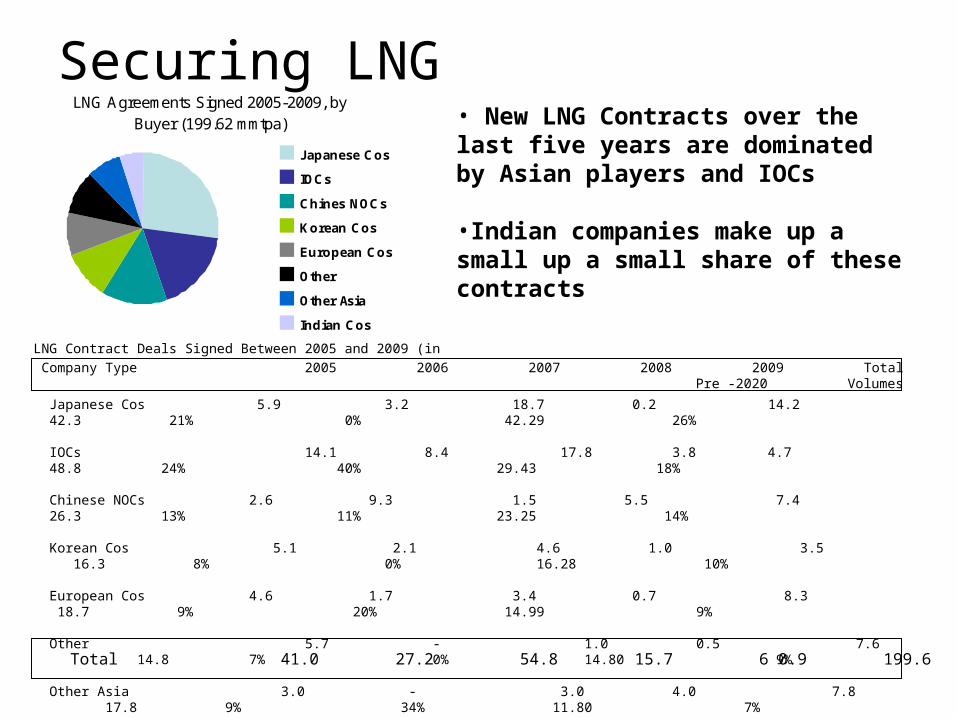
Securing LNGLNG Agreements Signed 2005-2009, by
Buyer (199.62 mmtpa)
Japanese Cos
IOCs
Chines NOCs
Korean Cos
European Cos
Other
Other Asia
Indian Cos
• New LNG Contracts over the last five years are dominated by Asian players and IOCs
•Indian companies make up a small up a small share of these contracts
LNG Contract Deals Signed Between 2005 and 2009 (in mmtpa)
Company Type 2005 2006 2007 2008 2009 Total Total% %Unlikely Pre-2020 Pre -2020 Volumes % Pre - 2020
Japanese Cos 5.9 3.2 18.7 0.2 14.2 42.3 21% 0% 42.29 26%
IOCs 14.1 8.4 17.8 3.8 4.7 48.8 24% 40% 29.43 18%
Chinese NOCs 2.6 9.3 1.5 5.5 7.4 26.3 13% 11% 23.25 14%
Korean Cos 5.1 2.1 4.6 1.0 3.5 16.3 8% 0% 16.28 10%
European Cos 4.6 1.7 3.4 0.7 8.3 18.7 9% 20% 14.99 9% Other 5.7 - 1.0 0.5 7.6 14.8 7% 0% 14.80 9%
Other Asia 3.0 - 3.0 4.0 7.8 17.8 9% 34% 11.80 7%
Indian Cos - 2.5 4.8 - 7.5 14.8 7% 41% 8.75 5%
Total 41.0 27.2 54.8 15.7 6 0.9 199.6 100% 19% 161.60 100%

Contracting LNG from Liquefaction Project
Global Liquefaction Capacity Forecast
0
100
200
300
400
500
600
2000
2001
2002
2003
2004
2005
2006
2007
2008
2009
2010
2011
2012
2013
2014
2015
2016
2017
2018
2019
2020
Announced Start
Pacific
Middle East
Atlantic - Mediterranean
Prosposed Liquefaction Projects for by Country (410mmtpa)
Australia
Iran
Nigeria
Russia
PNG
Venezuela
US
Egypt
Indonesia
Libya
Brazil
Canada
Angola
Eq. guinea
Erunei
UAE
Iraq
Cameroon
Timor
• Future supply growth is heavily weighted to the Pacific Basin
• Atlantic Basin Projects in particular are hampered by geopolitical risks and growing domestic demand

Australia Source for Majors
Proposed Liquefaction Projects for Majors by Location
0102030405060708090
100
BG CVX ENI RDS Total
Angola
Australia
Brazil
Brunei
Egypt
Indonesia
Iran
Iraq
Libya
Nigeria
PNG
Russia
UAE
Venezuela

Is Floating Liquefaction Potential Game Changer?• Floating liquefaction holds great potential for LNG producers:
- The new technology will allow for the development of smaller, more stranded gas reserves previously too distant from markets to monetize
- Once proven, new developments could be online faster than traditional liquefaction projects, as NIMBY and permitting concerns are avoided, and the actual liquefaction “plant” may already exist (and is mobile)
• Australia will likely be the proving ground for the world’s first floating liquefaction project. About a dozen such projects have been proposed; half of these are in Australia. The country provides an ideal place to test the new technology because:
- Producers face minimal to no political, environmental or regulatory risk in offshore Australia
- Sufficient feedstock exists and is not threatened by domestic demand needs
- Other proposed locations for floating plants include Brazil, Canada, Egypt, Indonesia, Iran, Iraq and Nigeria, most of which face greater risks for testing and proving this new technology
- Shell has two other proposed floating liquefaction projects in Australia waters, as well as a proposed project in Iraq and in Egypt
PRESENTATION ON“Global Overview of the LNG Business and
Key Trends”
LNG – A BRIEF STUDY
LNG Characteristics LNG Cycle Natural Gas: Production & Reserve Demand: Natural Gas LNG Scenario

THE LNG CYCLE
Upstream:• Gas Reservoir
Development• Gas Production Facilities
… Treatment and Liquefaction
• LNG Storage, Loading Terminal and Jetty
• LNG Tankers
Down stream:• LNG Unloading Terminal
and Jetty• Storage• Compression• Pipeline and Downstream
Consumer Development
LNG projects comprise several distinct distinct elements, each of which is necessary to implement a successful project:

LNG UPSTREAM – BLOCK DIAGRAM
Train - 1
SlugCatcher
GasSweetening
DehydrationMercuryRemoval
DehydrationMercuryRemoval
LNGStorage,Loading
Sulfur Recovery
LPGCondensateFractionation
SulfurStorage, Loading
Train - 2
Train - 3
Feed GasFromOffshore LNG
Liquids
Sulfur
CO2+H2S
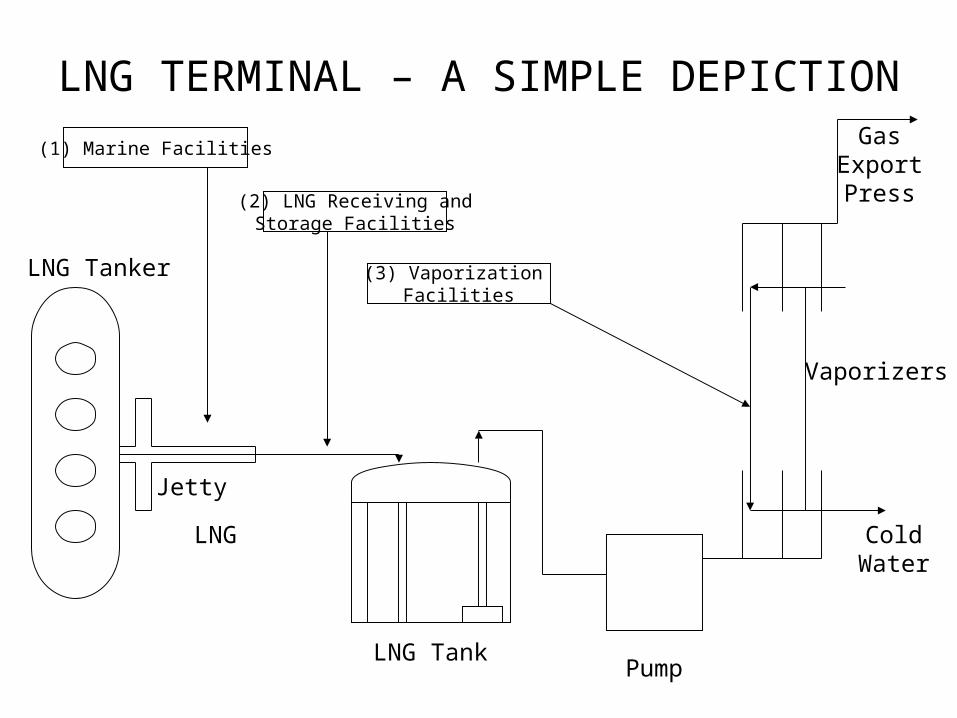
LNG TERMINAL – A SIMPLE DEPICTION
(1) Marine Facilities
(2) LNG Receiving andStorage Facilities
(3) Vaporization Facilities
LNG Tanker
Jetty
LNG
LNG TankPump
ColdWater
Vaporizers
GasExportPress

LNG DOWNSTREAM – BLOCK DIAGRAM
JETTY
UnloadingArms
Vapor ReturnArm
Return GasBlowers
Flare / Vent BOGcompressors
Storage Tanks
Recon denser
Vaporizer
HP Send- OutPump Re-gasification
System
ToPipelineLNG jetty, berth, unloading
LNG Storage tanksLNG re-gasification systemLNG Pumping System• In-tank and• External LNG PumpsVapor handling systemSupporting facilities

LNG CHARACTERISTICS Methane in Natural Gas does not liquefy under pressure. To make
LNG, Natural Gas must be liquefied through refrigeration. Becomes liquid at – 160 C at atmospheric pressure. Volume reduces by 620 times when liquefied. Spilled LNG will crack a steel plate like boiling water hitting frozen
glass.
LNG Composition (Typical Mol %)N --- 0 – 1.0%
Methane --- 85.1 – 96.7% (Lean)Ethane --- 1.9 – 8.6% (Rich)Propane --- 0.68 – 4.1%i – Butane, n – Butane --- Traces – 3.0%Mol. Wt. --- 16.8 – 20.0 (Rich)Gross Heating Value --- 10.450 Kcal / NMSpecific Gravity --- 0.44 – 0.50

LNG – GREEN AND SAFE
LNG is …• Odorless,• Non – toxic (harmful components removed)• And non – corrosive.
Less dense than water – evaporates if spilled in ocean or water bodies
LNG vapors are lighter than air – less chance of ignition if emitted.
LNG is not under pressure for shipping and storage.
LNG does not explode.
Natural gas burns more efficiently and cleaner than any other fuel.

Estimate of Natural Gas Reserves (TCM)
1997 2006 2009North Americe 8.3 8.0 8.0South / Central America
6.2 7.6 7.7
Europe & Eurasia 6.1 59.4 59.4Middle East 49.5 73.0 73.2Africa 10.6 14.5 14.6Asia Pacific 10.7 13.8 17.5Total 146.3 176.3 180.4

Estimate of Share of Gas Reserves
5%
41%
8%4%8%
34%
North America
S & Cent. America
Europe & Eurasia
Middle East
Africa
Asia Pacific
Country TCM %Share
Russian 43.30 23.44
Iran 29.61 16.03
Qatar 25.46 13.78
Turkmenistan 7.94 4.30
Saudi Arabia 7.57 4.10
America 15.80 8.55
United Arab Emirates
6.43 3.48
Nigeria 5.22 2.83
Egypt 2.02 1.09
Libya 1.50 0.81
Algeria 4.50 2.44
Indonesia 3.18 1.72
Malaysia 3.0 1.62
Iraq 3.17 1.72
Norway 2.91 1.58
Australia 2.51 1.36
Other 20.62 11.16
Total 184.74
• Major gas reserves awayfrom mature markets• Close to developing markets• Russia & Iran hold 40% of Gas reserve.• LNG exporting countries Hold 50% of reserves.

Estimate of Natural Gas Production (BCM / Year)
1997 2006 2009North America 735 754 785South / Central America
83 147 160
Europe & Eurasia
898 1076 1085
Middle East 175 339 400Africa 99 181 195Asia Pacific 245 373 400Total 2235 2870 3025

Prognosticated Natural Gas Demand
0
20
40
60
80
100
NATURAL GAS - NEXT 15 YEARS
N. America 26.931.834.4
W, europe 14.816.418.2
Asia 3.94.44.9
EE / FSU 23.527.330.9
Dev. Countries 21.225.229.8
200120102015

LNG Producing Countries EXISTING UNDER POSSIBLE TOTAL
CONSTRUCTION PROPOSED
ALGERIA 19.9 4.5 4.0 – 5.0 28.4 – 29.4
ANGOLA 0.0 5.2 0.0 5.2
AUSTRALIA 15.2 24.2 33.8 – 43.3 73.2 – 82.7
BRUNEI 7.2 0.0 0.0 7.2
EGYPT 12.3 3.6 5.1 21.0
EQUATEORIAL GUIENA 3.72 0.0 4.4 8.12
INDONESIA 26.2 7.6 2.0 35.8
IRAN 0.0 0.0 46.4 46.4
LIBYA 0.7 0.0 0.0 0.7
MALAYSIA 23.3 1.3 0.0 24.6
NIGERIA 22.2 8.40 22.0 52.6
NORWAY 4.18 0.0 0.0 4.18
OMAN 10.9 0.0 0.0 10.9
PAPUA NEW GUIENA 0.0 6.3 9 15.3
PERU 0.0 4.45 0.0 4.45
QATAR 30.4 46.8 0.0 7.2
RUSSIA 9.6 0.0 20 29.6
TRINDAD 15.3 0.0 5.2 20.5
UAE 5.6 0.0 0.0 5.6
USA 1.5 0.0 0.0 1.5
VENEZUYELA LNG 0.0 0.0 4.7 4.7
YEMEN 0.0 6.7 0.0 6.7
TOTAL 208.2 119.1 156.6 – 167.1 483.9 – 494.4

LNG CONSUMERS2005 2010 2015
Belgium 2.1 6.3 6.1
China 0.0 7.7 12.5
France 10.1 18.4 18.2
India 4.8 12.5 20.0
Italy 1.9 8.8 10.2
Japan 60.9 69.0 74.6
Mexico East 0.0 1.9 1.9
Mexico West 0.0 4.6 6.3
Singapore 0.0 0.0 1.1
South Korea 23.5 32.5 41.5
Spain 17.6 28.9 30.6
Taiwan 7.5 9.2 12.0
UK 0.4 14.0 21.6
US East 12.5 23.2 53.4
Others 5.9 13.4 30.5
Total 147.0 250.4 340.6