Trends in Highway Safety: From Crashworthiness to …€¦ · • New Jersey Manufacturers...
77
www.iihs.org Trends in Highway Safety: From Crashworthiness to Crash Avoidance Michigan Traffic Safety Summit Lansing, MI ● March 26, 2014 David Zuby, Chief Research Officer
-
Upload
doankhuong -
Category
Documents
-
view
214 -
download
0
Transcript of Trends in Highway Safety: From Crashworthiness to …€¦ · • New Jersey Manufacturers...

www.iihs.org
Trends in Highway Safety: From Crashworthiness to Crash Avoidance
Michigan Traffic Safety Summit Lansing, MI ● March 26, 2014 David Zuby, Chief Research Officer
www.iihs.org
The Insurance Institute for Highway Safety, founded in 1959, is an independent, nonprofit, scientific, and educational organization dedicated to reducing the losses — deaths, injuries, and property damage — from crashes on the nation’s roads. The Highway Loss Data Institute, founded in 1972, shares and supports this mission through scientific studies of insurance data representing the human and economic losses resulting from the ownership and operation of different types of vehicles and by publishing insurance loss results by vehicle make and model. Both organizations are wholly supported by auto insurers.

www.iihs.org
Where are we? Location of IIHS/HLDI and Vehicle Research Center
Washington, DC
Virginia
Charlottesville
Arlington
Virginia

www.iihs.org
IIHS members write 85% of private passenger market • Acceptance Insurance
• ACE Private Risk Services
• Affirmative Insurance
• Agency Insurance Company of Maryland
• Alfa Alliance Insurance Corporation
• Alfa Insurance
• Allstate Insurance Group
• American Family Mutual Insurance
• American National Property and Casualty Company
• Ameriprise Auto & Home
• Amica Mutual Insurance Company
• ARI Insurance Companies
• Auto Club Enterprises
• Auto Club Group
• Auto-Owners Insurance
• Aviva Insurance
• Bankers Insurance Group
• Bituminous Insurance Companies
• California Casualty Group
• California State Auto Group
• Capital Insurance Group
• Chubb & Son
• Colorado Farm Bureau Mutual Insurance Company
• Commonwealth Mutual Insurance Company of America
• Concord Group Insurance Companies
• COUNTRY Financial
• CSE Insurance Group
• Dallas National Insurance Company
• Direct General Corporation
• Driver's Insurance Group
• Erie Insurance Group
• Esurance
• Farm Bureau Financial Services
• Farm Bureau Insurance of Michigan
• Farm Bureau Mutual Insurance Company of Idaho
• Farmers Insurance Group of Companies
• Farmers Mutual Hail Insurance Company of Iowa
• Farmers Mutual of Nebraska
• Fireman's Fund Insurance Company
• Florida Farm Bureau Insurance Companies
• Frankenmuth Insurance
• Gainsco Insurance
• GEICO Group
• Georgia Farm Bureau Mutual Insurance Company
• Goodville Mutual Casualty Company
• Grange Insurance
• Hallmark Insurance Company
• Hanover Insurance Group
• The Hartford
• Haulers Insurance Company, Inc.
• Horace Mann Insurance Companies
• ICW Group
• Imperial Fire & Casualty Insurance Company
• Indiana Farmers Mutual Insurance Company
• Infinity Property & Casualty
• Kemper Preferred
• Kentucky Farm Bureau Insurance
• Liberty Mutual Insurance Company
• Louisiana Farm Bureau Mutual Insurance Company
• Maryland Automobile Insurance Fund
• Mercury Insurance Group
• MetLife Auto & Home
• Michigan Millers Mutual Insurance Company
• MiddleOak
• Mississippi Farm Bureau Casualty Insurance Company
• MMG Insurance
• Mutual of Enumclaw Insurance Company
• Nationwide
• New Jersey Manufacturers Insurance Group
• Nodak Mutual Insurance Company
• Norfolk & Dedham Group
• North Carolina Farm Bureau Mutual Insurance Company
• Northern Neck Insurance Company
• Ohio Mutual Insurance Group
• Old American County Mutual Fire Insurance
• Old American Indemnity Company
• Oregon Mutual Insurance
• Pekin Insurance
• PEMCO Insurance
• Plymouth Rock Assurance
• Progressive Corporation
• QBE
• The Responsive Auto Insurance Company
• Rockingham Group
• Safe Auto Insurance
• Safeco Insurance
• Samsung Fire & Marine Insurance Company
• SECURA Insurance
• Sentry Insurance
• Shelter Insurance
• Sompo Japan Insurance Company of America
• South Carolina Farm Bureau Mutual Insurance Company
• Southern Farm Bureau Casualty Insurance Company
• State Auto Insurance Companies
• State Farm
• Tennessee Farmers Mutual Insurance Company
• Texas Farm Bureau Insurance Companies
• Tower Group Companies
• The Travelers Companies
• United Educators
• USAA
• Utica National Insurance Group
• Virginia Farm Bureau Mutual Insurance
• West Bend Mutual Insurance Company
• Western National
• Westfield Insurance
• Young America Insurance Company
• Zurich North America
Presenter
Presentation Notes
As of Jan 31, 2014

www.iihs.org
Insurance Institute for Highway Safety Organization as of February 2014
Total employees (105)
• Arlington, Virginia – headquarters (66 employees) – Research & Communications (48)
– Highway Loss Data Institute (18)
• Ruckersville, Virginia – Vehicle Research Center (39 employees)

www.iihs.org
2014 IIHS and HLDI budget In millions
IIHS $18.1
HLDI $ 3.6
total $21.7

www.iihs.org
crash phase
changes in… before during after losses
people
•licensing (GDL, elderly)
•impaired driving laws
•camera enforcement
•restraints use
•helmets
•speed cameras
•alcohol •injuries
•deaths
•economic
vehicles
•driver assistance
•daytime running lights
•electronic control
•restraints effect
•vehicle structure
•bumpers
•crash notification
•fuel systems
•damage
•repairability
environment
•intersections design
•trouble spots treatment
•rumble strips
•roundabouts
•breakaway poles
•crash cushions
•emergency medicine
•economic
•fuel economy
crash phase
changes in… before during after
people
•licensing (GDL, elderly)
•impaired driving laws
•camera enforcement
•restraints (use)
•helmets
•speed cameras
•alcohol
vehicles
•driver assistance
•daytime running lights
•electronic control
•restraints (effect)
•vehicle structure
•Bumpers
•crash notification
•fuel systems
environment
•intersection design
•trouble-spot treatment
•rumble strips
•roundabouts
•breakaway poles
•crash cushions
•emergency medicine
Haddon matrix Recognizing opportunities to make a difference

www.iihs.org
0
20
40
60
80
30,000
35,000
40,000
45,000
50,000
55,000
60,000
1950 55 60 65 70 75 80 85 90 95 2000 05 10
IIHS and HLDI research has contributed significantly to the decline of motor vehicle crash injuries during the past 50+ years
motor vehicle crash deaths
crash deaths per billion vehicle miles traveled
11.3 per billion
33,561

www.iihs.org
Making drivers safer – Alcohol ignition interlocks

www.iihs.org
Percent of fatally injured passenger vehicle drivers with BACs at or above specified levels 1982-2012
0
10
20
30
40
50
1982 1985 1990 1995 2000 2005 2010
0.08 g/dL or more
0.15 g/dL or more

www.iihs.org
Alcohol ignition interlocks
• Driver blows into a tube to test breath for alcohol
• Vehicle won’t start if certain amount of alcohol detected
• Periodic retests while vehicle is in motion
• BAC ≤ 0.025 percent is typical threshold for DUI offenders

www.iihs.org
Laws mandating alcohol ignition interlock orders February 2014
MD
DE
DC
MA
OR
RI NJ
NH
ME
PA
WV
NC
SC
GA
FL
OH
MI
IN IL
WI
IA
MO
LA
NM
CO
SD ID
CA
WA
TN
VT
MS
MT ND
NV
AZ
UT
WY
NE
KS
OK
TX
AR
MN
AL
KY VA
NY
CT
AK
HI
judicial discretion only repeat offenders high-BAC first offenders
all offenders high-BAC first & repeat offenders
Presenter
Presentation Notes
Twenty-one states (Alaska, Arizona, Arkansas, Colorado, Connecticut, Hawaii, Illinois, Kansas, Louisiana, Maine, Minnesota, Missouri, Nebraska, New Mexico, New York, Oregon, Utah, Vermont, Virginia, Washington and West Virginia) and 4 California counties mandate interlocks for all offenders. Minnesota, Vermont and West Virginia were added as all offenders states upon further research, not due to a recent law change. Tennessee had a recent law change that despite the media hype, IIHS does not count as an all offender law.

www.iihs.org
Installed interlocks in United States 1986-2013
0
50,000
100,000
150,000
200,000
250,000
300,000
350,000
1986 1990 1994 1997 2002 2006 2010

Jan. 1, 1999
1987
Timeline of Washington state interlock laws
July 23, 2003
June 10, 2004
Jan. 1, 2009
Jan. 1, 2011
Issuance of interlock orders moves from
courts to Department of
Licensing
Minimum 4-month interlock
installment required for
license reinstatement
Courts must order interlocks for repeat
offenders and first offenders with BACs ≥ 0.15% or
alcohol test refusal
Courts permitted to
order interlocks
Interlock available
immediately after arrest in
lieu of administrative
license suspension
Interlocks required for first offenders
with BACs < 0.15% (simple DUI)
Issuance of interlock orders moves from
courts to Department of
Licensing
Interlocks required for first offenders
with BACs < 0.15% (simple DUI)

www.iihs.org
Predicted cumulative 2-year recidivism rate for 1st simple DUI convictions with & without 2004 law change By quarter of arrest, January 1999-June 2006
0%
2%
4%
6%
8%
10%
12%
without 2004 law change
with 2004 law changeall offender law
-12%
1999 2000 2001 2002 2003 2004 2005 2006

www.iihs.org
Cumulative 2-year recidivism rate and projected rate with 100 percent interlock use Arrests April-June 2006
0
2
4
6
8
10
1st simple DUI offenders(34% actual use rate)
all 1st DUI offenders(24% actual use rate)
recidivism with actual use
recidivism with 100% use

www.iihs.org
Recommendations to states
• Extend interlock laws to all DUI offenders
• Seek ways to increase use rates
• Reconsider loopholes that permit reductions in DUI charges to other traffic offenses without interlock requirements
• Publicize interlock laws to deter all drivers from driving when impaired
www.iihs.org
Making drivers safer – Graduated driver licensing

www.iihs.org
Passenger vehicle driver crash rates Per mile traveled, by driver age, 2008
0
5
10
15
20
25
30
35
16 17 18 19 20- 25- 30- 35- 40- 45- 50- 55- 60- 65- 70- 75- 80- 85+
all police-reported crashes per million miles traveled
fatal crashes per 100 million miles traveled
driver age
www.iihs.org www.iihs.org
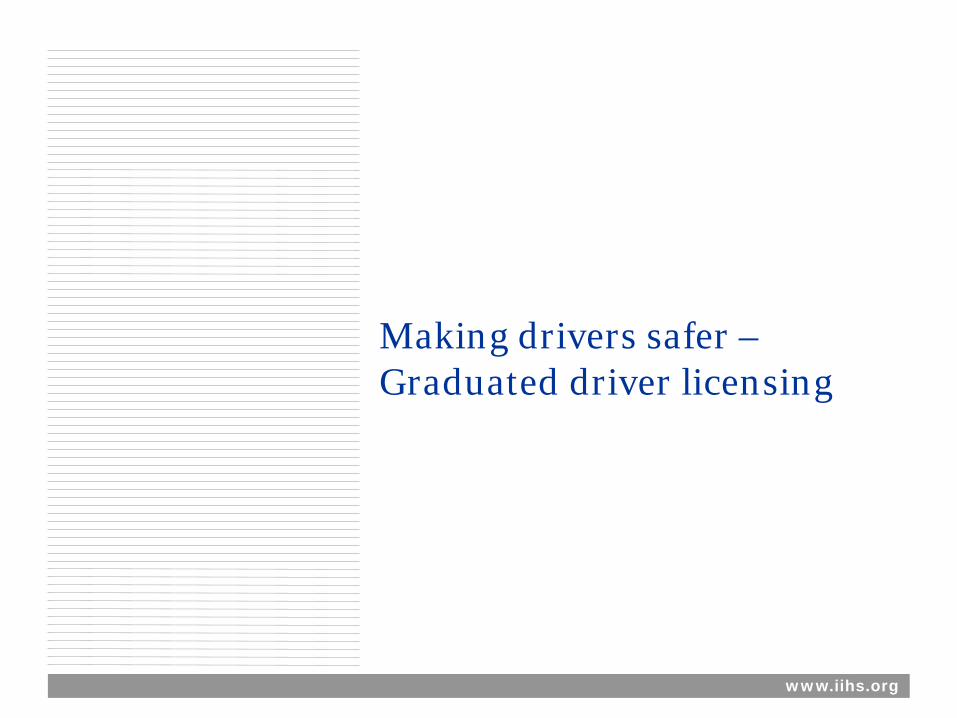
Percent reduction in teenagers’ crash rates By graduated licensing component
0 5 10 15 20
20 or more hours of practice driving
teen passengers limited to 0 or 1
9 p.m. driving restriction
1-year delay in license age
1-year delay in permit age
fatal crashes per population, 15-17-year-old driverscollision claim frequencies, 16-17-year-old drivers

www.iihs.org www.iihs.org
Graduated Driver Licensing Best practice provisions, May 2012
• Minimum permit age – 16 years
• Practice hours requirement – 65 hours
• Minimum licensing age (intermediate stage) – 17 years
• Intermediate stage driving restrictions – No teenage passengers
– No nighttime driving beginning at 8 pm

www.iihs.org
Estimated effects of teen driver licensing changes in Michigan
www.iihs.org
Making roads safer – Roundabouts

www.iihs.org
www.iihs.org
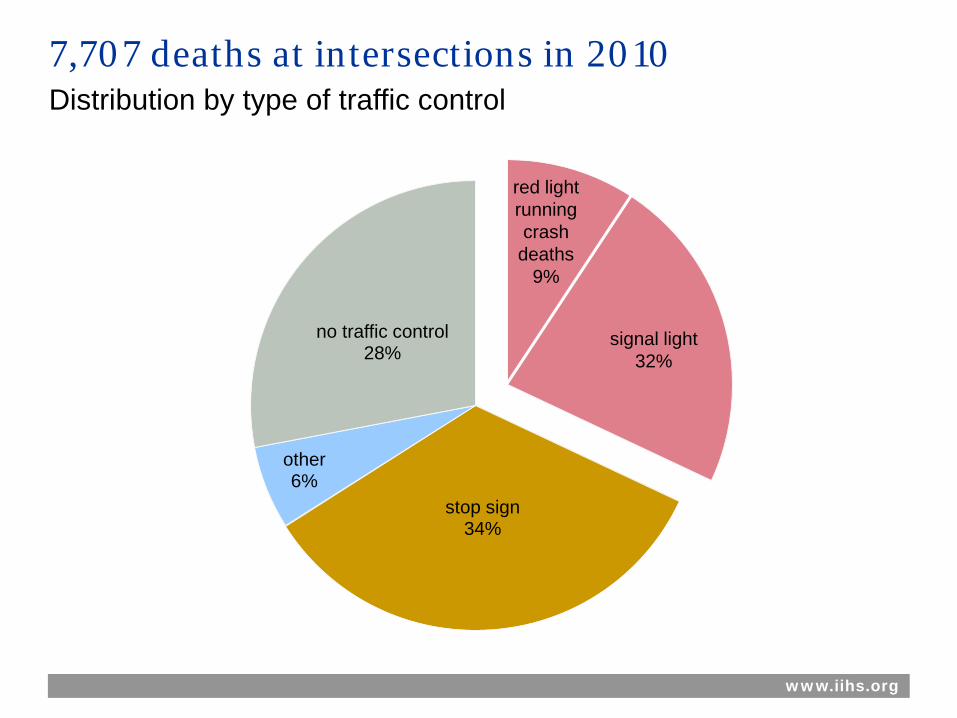
stop sign 34%
other 6%
no traffic control 28%
7,707 deaths at intersections in 2010 Distribution by type of traffic control
red light running crash
deaths 9%
signal light 32%

www.iihs.org
Roundabouts are circular intersections with design features that eliminate the need for stop signs or traffic signals

www.iihs.org
Conversion of stop sign and traffic signal intersections to roundabouts:
• 40% reduction in all crashes
• 80% reduction in injury crashes
• 90% reduction in fatal & incapacitating injury crashes

www.iihs.org
Progress in building roundabouts March 2014
MD
DE
DC
MA
OR
RI NJ
NH
ME
PA
WV
NC
SC
GA
FL
OH
MI
IN IL
WI
IA
MO
LA
NM
CO
SD ID
CA
WA
TN
VT
MS
MT ND
NV
AZ
UT
WY
NE
KS
OK
TX
AR
MN
AL
KY VA
NY
CT
AK
HI
50 or more 10-49 fewer than 10

www.iihs.org
If 10 percent of signalized intersections in the United States were converted to roundabouts
• Approximately 43,000 crashes prevented in 2011 including: – 170 fatal crashes
– 28,000 injury crashes
• Vehicle delays reduced by more than 900 million hours
• Fuel consumption reduced by more than 600 million gallons
Presenter
Presentation Notes
Crash estimates: Roundabouts- estimated crash reduction factors: Total Crashes -37 percent, Injury crashes- 75 percent (Eisenman et al., 2004) So, if 10% of the signalized intersections in the U.S. in 2011 had been converted to roundabouts, then approximately (0.10)(1,150,576)(0.37) = 42,571 crashes would have been prevented. Similarly, (0.10)(374,020)(0.75) = 28,051 injury crashes and (0.10)(2,298)(0.75) = 172 fatal crashes would have been prevented. Note: 2010 crash numbers: # of all crashes at signalized intersections 1,150,576 # of all fatal crashes at signalized intersections (GES) (FARS)--> 2,298 # of all non-fatal injury crashes at signalized intersections 374,020 Fuel and Delay savings: If 10% of the signalized intersections in the U.S. had been converted to roundabouts in 2010, Delay savings=(0.10)(312,000)(30,000) = 936 million hours Fuel savings=(0.10)(312,000)(20,000) = 624 million gallons (2010 Estimate of the Total number of signalized intersections in U.S=312, 000), ITE, 2004 (one signalized intersection per 1,000 population, 2011 population: 311,591,917) (Estimated delay savings per intersection =30,000 hrs –Bergh et.al 2005) (Estimated fuel savings per intersection =20,000 gallons –Bergh et.al 2005)
www.iihs.org
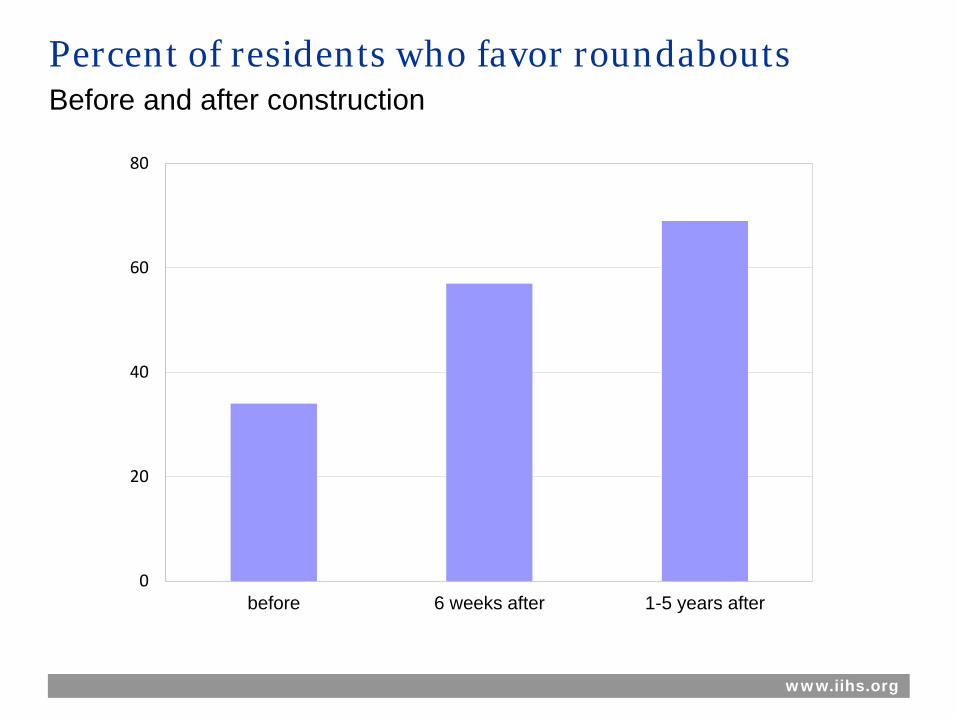
Percent of residents who favor roundabouts Before and after construction
0
20
40
60
80
before 6 weeks after 1-5 years after

www.iihs.org
Making vehicles safer – Crashworthiness testing

www.iihs.org
IIHS crashworthiness tests
• Front moderate overlap, beginning 1995
• Side impact, beginning 2003
• Rear crash (whiplash mitigation), beginning 2004
• Roof strength, beginning 2009

www.iihs.org
Video of Poor vs. Good crash test performance
www.iihs.org
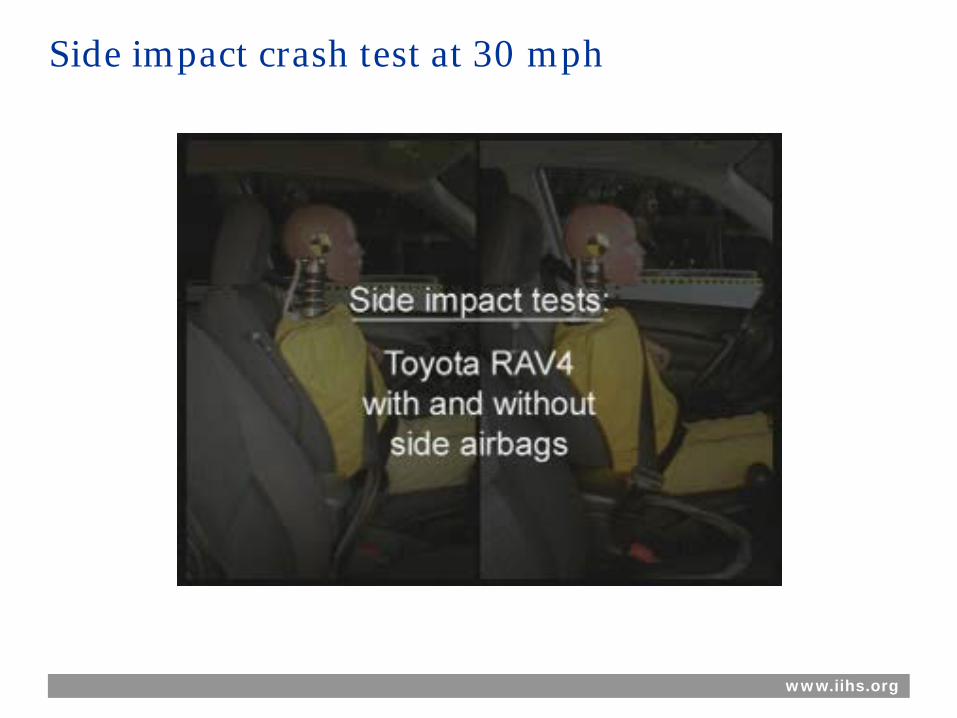
Side impact crash test at 30 mph

www.iihs.org
Two models both subjected to 15,000 lbs roof crush test

www.iihs.org
Death and injury reductions Good compared with Poor rating in IIHS tests
• Front offset with moderate overlap test at 40 mph – Fatality risk in head-on crashes is 46 percent lower
• Side impact crash test at 30 mph – Fatality risk in side impact crashes 70 percent lower
• Rear impact test simulates being struck from behind at 20 mph – Neck injury risk is 15 percent lower
– Risk of neck injury requiring 3+ moths treatment is 35 percent lower

www.iihs.org
0%
10%
20%
30%
40%
50%
60%
70%
80%
90%
100%
1995 97 99 01 03 05 07 09 11 13
Crash protection ratings by model year Improvements: Beginning in 1995
0%
20%
40%
60%
80%
100%
1995 1997 1999 2001 2003 2005 2007 2009 2011
0%
20%
40%
60%
80%
100%
1995 1997 1999 2001 2003 2005 2007 2009 20110%
20%
40%
60%
80%
100%
1995 1997 1999 2001 2003 2005 2007 2009 2011
Frontal Side
Rear Roof

www.iihs.org
Calendar years until 50% of rated vehicles are rated good Rated vehicles only
0
4
8
12
16
front side roof

www.iihs.org
Making vehicles safer – Small overlap crash test

www.iihs.org
small overlap
24%
moderate overlap
24% center 19%
underride 14%
low severity 11%
full width 6%
override 2%
Serious injuries in frontal crashes, by configuration

www.iihs.org
Overhead video small overlap test (car-to-car and car-to-barrier)
www.iihs.org
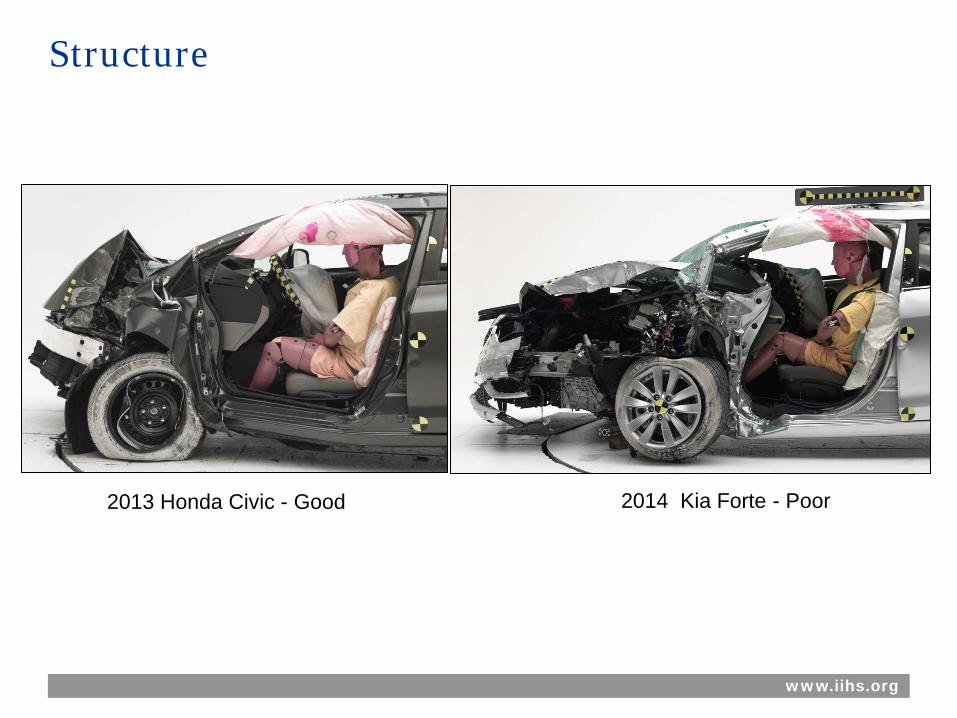
Structure
2013 Honda Civic - Good 2014 Kia Forte - Poor

www.iihs.org
Restraints and kinematics 2014 Kia Forte - Poor

www.iihs.org
Restraints and kinematics 2013 Honda Civic - Good

www.iihs.org
Small car small overlap ratings
changed for small overlap test

www.iihs.org

www.iihs.org
Effect of crash ratings on consumer behavior

www.iihs.org www.iihs.org
IIHS top 5 video news release audiences
date viewers broadcasts
Side impact crash tests – midsize cars April 18, 2004 239 million 2,412
First side impact crash tests – small SUVs June 17, 2003 234 million 2,316
Frontal crash tests – large pickups June 4, 2001 213 million 1,855
First small overlap crash tests – midsize luxury cars August 14, 2012 204 million 2,550
Children's booster seat ratings December 22, 2009 183 million 3,669

www.iihs.org www.iihs.org www.iihs.org
Survey of dealerships
• Volvo S60, rated good
• Results announced August 14, 2012
• Surveyed 206 U.S. Volvo dealerships August-September 2012
• Subaru Forester, rated good
• Jeep Patriot, rated poor
• Results announced May 16, 2013
• Surveyed 275 U.S. Subaru and Jeep dealerships June-July 2013
www.iihs.org www.iihs.org
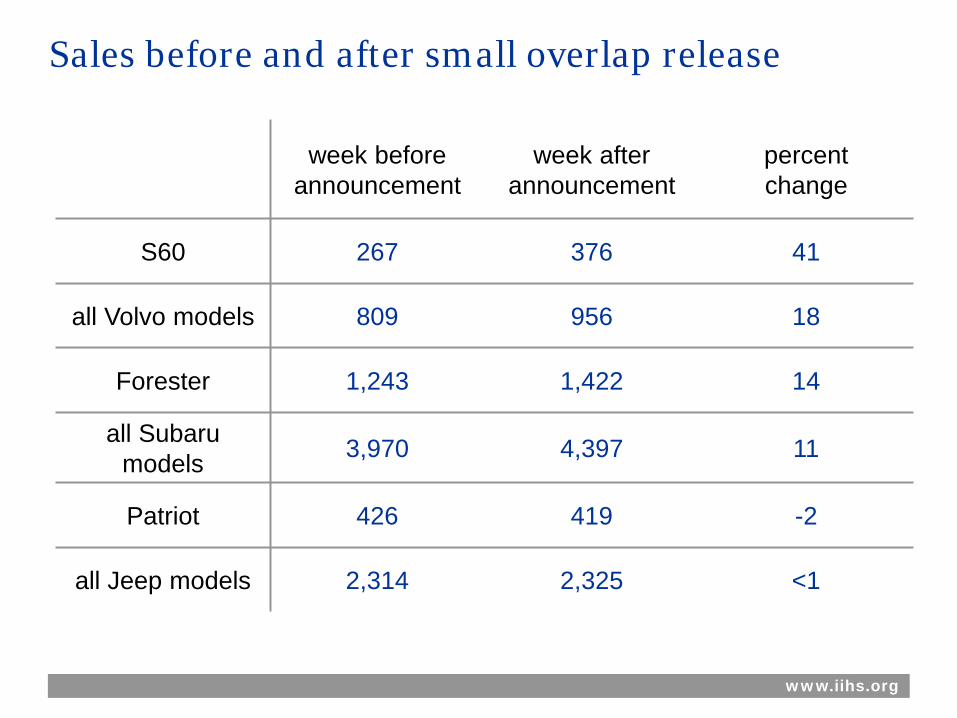
Sales before and after small overlap release
week before announcement
week after announcement
percent change
S60 267 376 41
all Volvo models 809 956 18
Forester 1,243 1,422 14
all Subaru models 3,970 4,397 11
Patriot 426 419 -2
all Jeep models 2,314 2,325 <1

www.iihs.org
Making vehicles safer – Evaluating crash avoidance technologies

www.iihs.org www.iihs.org
Driver assistance features Radar, LIDAR, ultrasonic, infrared, cameras, GPS

www.iihs.org
• Forward collision prevention systems are working
• Adaptive headlights are working
• The benefits of these systems are less clear – – Lane departure warning
– Blind spot warning
– Rearview cameras
– Parking proximity sensors

www.iihs.org
Front crash prevention systems are helping drivers avoid crashes Reductions in property damage liability claim frequency
-20%
-15%
-10%
-5%
0%
Volvo XC60vs. competitors
Volvo S60vs. competitors
Mercedes withvs. without
Volvo withvs. without
Acura withvs. without
FCW
FCW with autobrake
City Safety
low speed systems higher speed systems

www.iihs.org
Front crash prevention systems are preventing injuries Reductions in bodily injury liability claim frequency
-40%
-30%
-20%
-10%
0%
Volvo XC60vs. competitors
Volvo S60vs. competitors
Mercedes withvs. without
Volvo withvs. without
Acura withvs. without
FCW
FCW with autobrake
City Safety
low speed systems higher speed systems

www.iihs.org
Front crash prevention evaluations Consumer messages
• Forward collision warning (FCW) is beneficial
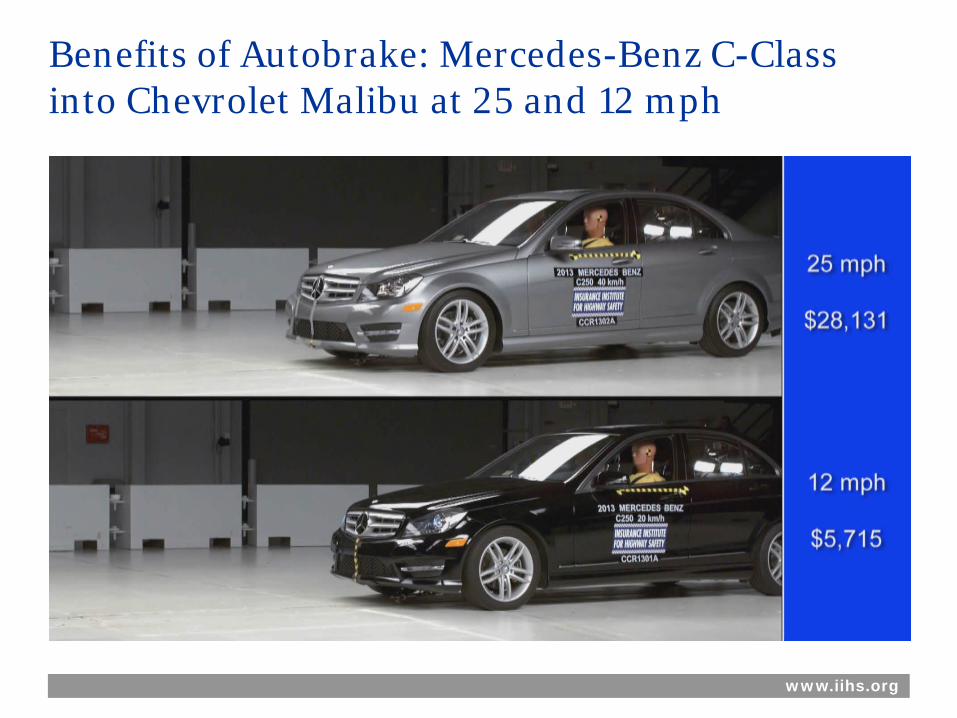
• Autobrake is more beneficial than FCW alone – Collision mitigation braking in combination with FCW
e.g. Acura Collision Mitigation Brake System, Mercedes-Benz Distronic Plus
– Low-speed collision prevention/mitigation alone e.g. Volvo City Safety
• Autobrake systems with greater capability than those HLDI studied are available – Examples
Subaru EyeSight
Volvo Collision Warning with Full Auto Brake and Pedestrian Detection
www.iihs.org
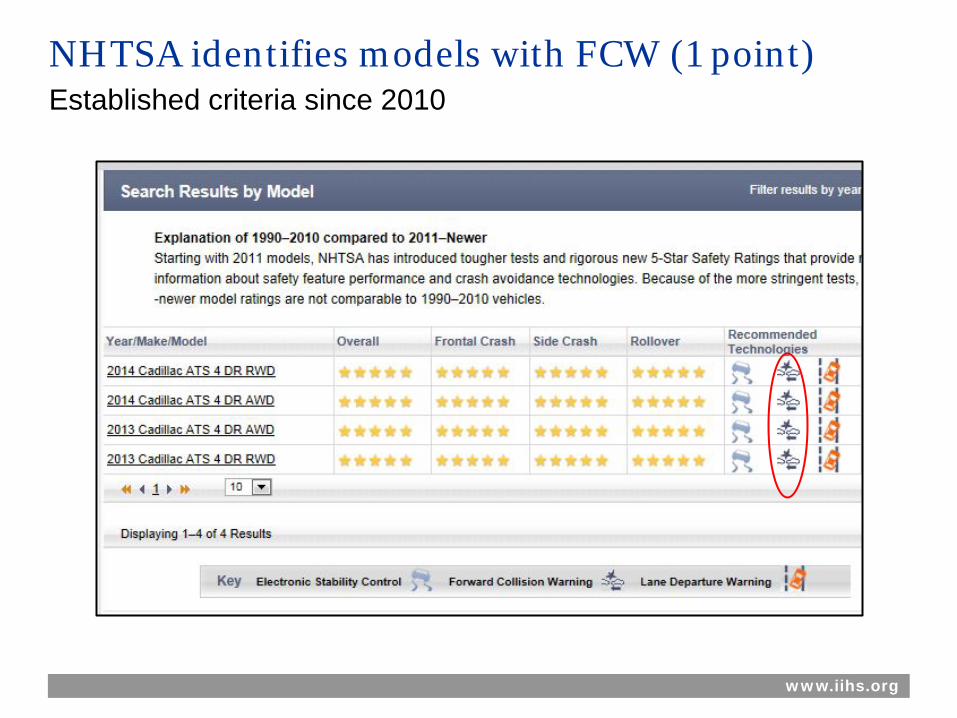
NHTSA identifies models with FCW (1 point) Established criteria since 2010

www.iihs.org
Front crash prevention ratings
vehicles without forward collision warning or autobrake; or vehicles equipped with a system that doesn’t meet NHTSA or IIHS criteria vehicles earning 1 point for forward collision warning or 1 point in either 12 or 25 mph test vehicles with autobrake that achieve 2-4 points for forward collision warning and/or performance in autobraking tests vehicles with autobrake that achieve 5-6 points for forward collision warning and/or performance in autobraking tests
www.iihs.org
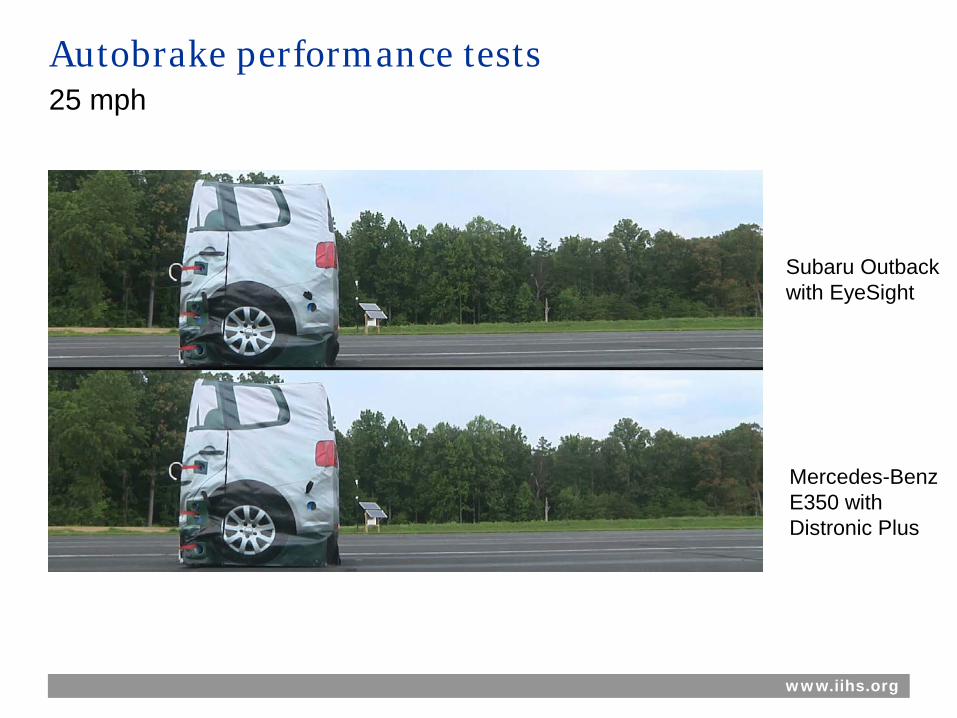
Autobrake performance tests 25 mph
Subaru Outback with EyeSight
Mercedes-Benz E350 with Distronic Plus
www.iihs.org
Benefits of Autobrake: Mercedes-Benz C-Class into Chevrolet Malibu at 25 and 12 mph

www.iihs.org
First public release of IIHS crash avoidance ratings September 27, 2013
www.iihs.org www.iihs.org
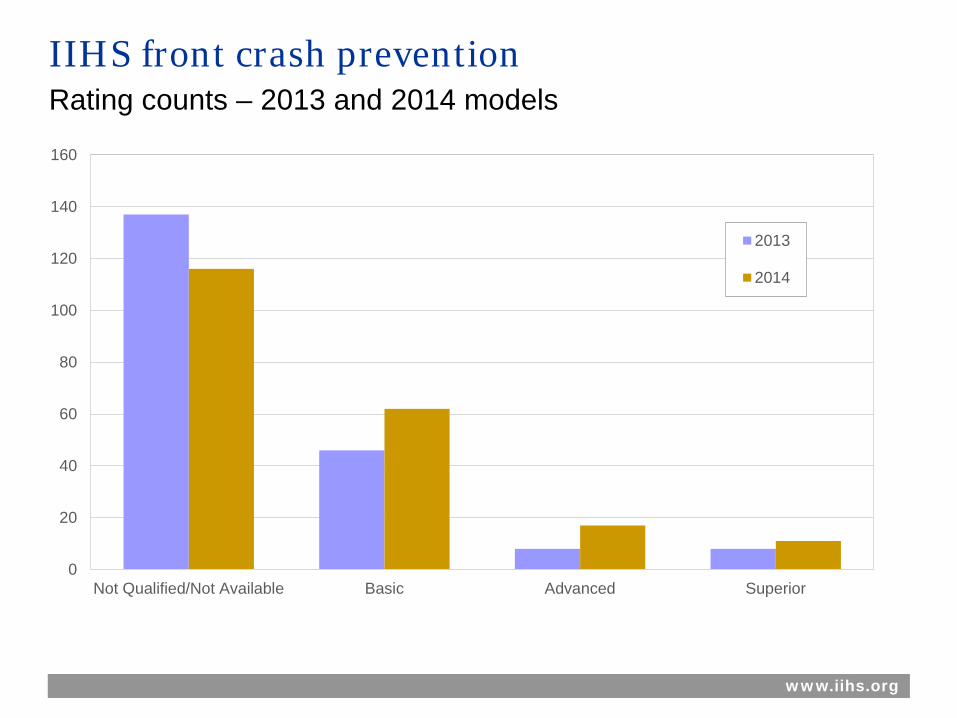
IIHS front crash prevention Rating counts – 2013 and 2014 models
0
20
40
60
80
100
120
140
160
Not Qualified/Not Available Basic Advanced Superior
2013
2014

www.iihs.org www.iihs.org
Requirements for TOP SAFETY PICK awards
rating in moderate overlap front test
rating in side test
rating in roof strength test
rating in head restraint test
or rating in small overlap front test A
G
G
G
G
G
meets TOP SAFETY PICK criteria, plus earns basic, advanced or superior rating for front crash prevention

www.iihs.org
2014 TOP SAFETY PICK+ winners February 2014
Small cars
• Honda Civic 4-door
• Mazda 3
• Toyota Prius
Midsize moderately priced cars
• Ford Fusion
• Honda Accord 2-door
• Honda Accord 4-door
• Mazda 6
• Subaru Legacy
• Subaru Outback
Midsize luxury/near luxury cars
• Infiniti Q50
• Lincoln MKZ
• Volvo S60
Large luxury cars
• Acura RLX
• Volvo S80
Small SUVs
• Mazda CX-5
• Mitsubishi Outlander
• Subaru Forester
Midsize SUVs
• Toyota Highlander
Midsize luxury SUVs
• Acura MDX
• Mercedes M class
• Volvo XC60
Minivans
• Honda Odyssey
Presenter
Presentation Notes
22 TSP+ original winners

www.iihs.org
Making vehicles safer – The importance of safety recalls
www.iihs.org
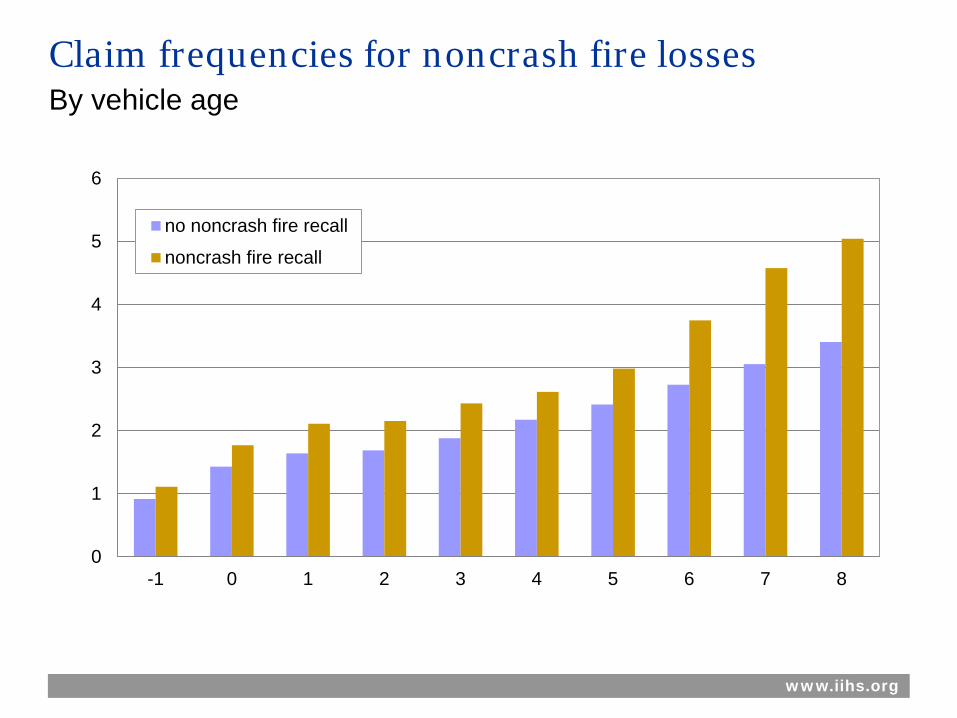
Claim frequencies for noncrash fire losses By vehicle age
0
1
2
3
4
5
6
-1 0 1 2 3 4 5 6 7 8
no noncrash fire recall
noncrash fire recall

www.iihs.org
Noncrash fire insurance losses Recalled vehicles compared with nonrecalled vehicles
-5%
5%
15%
25%
claim frequency severity overall losses
pre-recall
post-recall

www.iihs.org
Making vehicles safer – Trailer underride guards

www.iihs.org
Large trucks are still common crash partners Involvement when passenger vehicle occupant killed in a multiple-vehicle crash
0%
5%
10%
15%
20%
25%
2000 2002 2004 2006 2008 2010 2012

www.iihs.org
2010 IIHS study found inadequate real-world performance
www.iihs.org
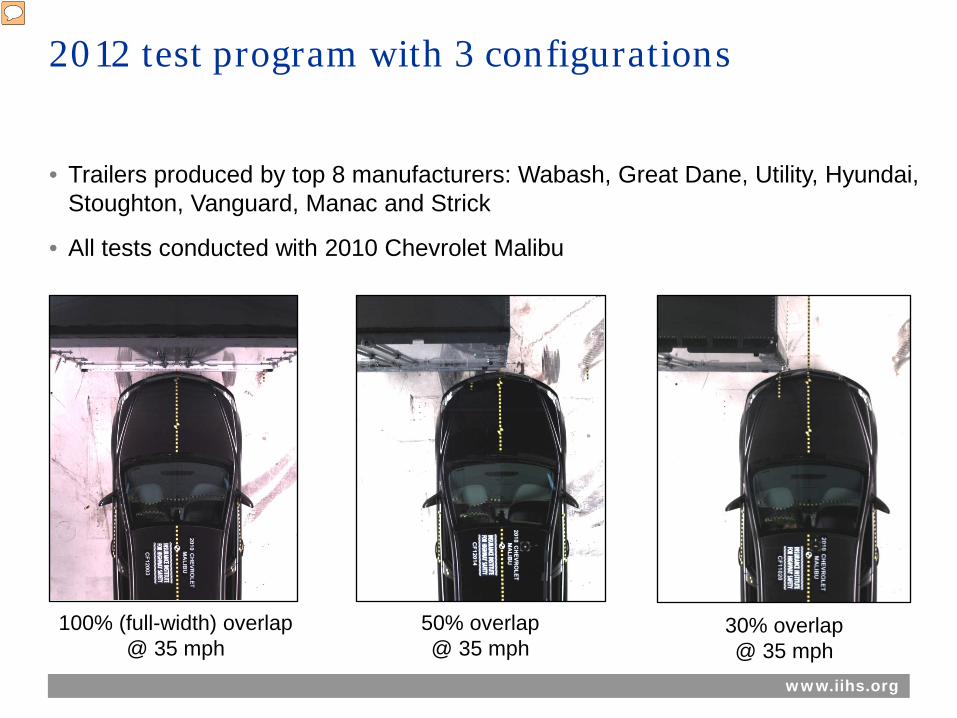
2012 test program with 3 configurations
• Trailers produced by top 8 manufacturers: Wabash, Great Dane, Utility, Hyundai, Stoughton, Vanguard, Manac and Strick
• All tests conducted with 2010 Chevrolet Malibu
30% overlap @ 35 mph
50% overlap @ 35 mph
100% (full-width) overlap @ 35 mph
Presenter
Presentation Notes
All of the dry vans tested this year have Canadian compliant underride guards!!!!!

www.iihs.org
Hyundai guard improvement Full-width test of old and new design

www.iihs.org
Test results Indicating success or failure to prevent underride
full-width 50% overlap 30% overlap
Wabash pass pass fail
Great Dane pass pass fail
Utility pass pass fail
Stoughton pass pass fail
Hyundai 2007-11 fail
2012-13 pass pass fail
Vanguard pass fail N/A*
Manac pass pass pass
Strick pass pass fail
All are 2012 or newer models except where noted * 30% overlap test not necessary since failure at 50%

www.hldi.org
Animal strikes

www.hldi.org
-
3
6
9
12
15
18
2006 2007 2008 2009 2010 2011 2012
National comprehensive claim frequencies for animal strikes January 2006 through December 2012

www.hldi.org
November animal strike claim frequencies by state During study period
MD
DE
MA
OR
RI NJ
NH
ME
PA
WV
NC
SC
GA
FL
OH
MI
IN IL
WI
IA
MO
LA
NM
CO
SD ID
CA
WA
TN
VT
MS
MT ND
NV
AZ
UT
WY
NE
KS
OK
TX
AR
MN
AL
KY VA
NY
CT
AK
HI
≥ 25 20 to 24 15 to 19
10 to 14 5 to 9 < 5 no animal data does not meet claims threshold
www.hldi.org Source of insurance loss statistics on most car, SUV, pickup, and motorcycle models on the road