Trends in Agriculture and Agricultural Practices in Ganga...
70
Report Code Trend Agr GRB EM Environm IIT Bombay IIT Delhi II Guw Indian e : 018_GBP_IIT_SEC_ANL_04_Ve ds in Agricultur ricultural Pract Ganga Part MP : Ganga River Ba ment Management by IT wahati IIT Kanpur IIT Kharagpur IIT Madras n Institutes of Technology er 1_Dec 2011 re and tices in a Basin t III: Bihar asin Plan IIT Roorkee
Transcript of Trends in Agriculture and Agricultural Practices in Ganga...

Report Code
Trends in Agriculture and Agricultural Practices in
GRB EMP : Ganga River BasinEnvironment Management Plan
IITBombay
IITDelhi
IITGuwahati
Indian Institutes of Technology
Report Code: 018_GBP_IIT_SEC_ANL_04_Ver 1_Dec 2011
Trends in Agriculture and Agricultural Practices in
Ganga BasinPart I
GRB EMP : Ganga River BasinEnvironment Management Plan
by
IITGuwahati
IITKanpur
IITKharagpur
IITMadras
Indian Institutes of Technology
_Ver 1_Dec 2011
Trends in Agriculture and Agricultural Practices in
Ganga BasinPart III: Bihar
GRB EMP : Ganga River BasinEnvironment Management Plan
IITRoorkee

Report Code: 018_GBP_IIT_SEC_ANL_04_Ver 1_Dec 2011
2 | P a g e

Report Code: 018_GBP_IIT_SEC_ANL_04_Ver 1_Dec 2011
3 | P a g e
PrefaceIn exercise of the powers conferred by sub-sections (1) and (3) of Section 3 of the Environment (Protection) Act, 1986 (29 of 1986), the Central Government has constituted National Ganga River Basin Authority (NGRBA) as a planning, financing, monitoring and coordinating authority for strengthening the collective efforts of the Central and State Government for effective abatement of pollution and conservation of the river Ganga. One of the important functions of the NGRBA is to prepare and implement a Ganga River Basin Management Plan (GRBMP).
A Consortium of 7 Indian Institute of Technology (IIT) has been given the responsibility of preparing Ganga River Basin Management Plan (GRBMP) by the Ministry of Environment and Forests (MoEF), GOI, New Delhi. Memorandum of Agreement (MoA) has been signed between 7 IITs (Bombay, Delhi, Guwahati, Kanpur, Kharagpur, Madras and Roorkee) and MoEF for this purpose on July 6, 2010.
This report is one of the many reports prepared by IITs to describe the strategy, information, methodology, analysis and suggestions and recommendations in developing Ganga River Basin Management Plan (GRBMP). The overall Framework for documentation of GRBMP and Indexing of Reports is presented on the inside cover page.
There are two aspects to the development of GRBMP. Dedicated people spent hours discussing concerns, issues and potential solutions to problems. This dedication leads to the preparation of reports that hope to articulate the outcome of the dialogue in a way that is useful. Many people contributed to the preparation of this report directly or indirectly. This report is therefore truly a collective effort that reflects the cooperation of many, particularly those who are members of the IIT Team. A list of persons who have contributed directly and names of those who have taken lead in preparing this report is given on the reverse side.
Dr Vinod TareProfessor and Coordinator
Development of GRBMPIIT Kanpur

Report Code: 018_GBP_IIT_SEC_ANL_04_Ver 1_Dec 2011
4 | P a g e
The TeamBhagirath Behera, IIT Kharagpur [email protected] Kumar, IIT Roorkee [email protected] K Nauriyal, IIT Roorkee [email protected] C Nayak, IIT Kharagpur [email protected] M Prasad, IIT Kanpur [email protected] Rajgopalan, IIT Madras [email protected] Mishra, IIT Kharagpur [email protected] L Trivedi, IIT Bombay [email protected] Agrawal, IIT Roorkee [email protected] P Singh, IIT Roorkee [email protected] Sharma, IIT Delhi [email protected] N Mazumder, IIT Kharagpur [email protected] B Upadhyay, IIT Delhi [email protected] Sharma, IIT Roorkee [email protected] Tare, IIT Kanpur [email protected]

Report Code: 018_GBP_IIT_SEC_ANL_04_Ver 1_Dec 2011
5 | P a g e
ContentsS No Page No.
1 Introduction 7
2 Land Use Pattern 8
3 Land Holdings 13
4 Sources of Irrigation 15
5 Rainfall 17
6 Fertilizer Consumption 17
7 Area, Production and Yield 20
8 Cost and Returns in Agriculture 25
9 Summary 26
References 27
Annexure 28

Report Code: 018_GBP_IIT_SEC_ANL_04_Ver 1_Dec 2011
6 | P a g e

Report Code: 018_GBP_IIT_SEC_ANL_04_Ver 1_Dec 2011
7 | P a g e
1. IntroductionBihar has been an agrarian economy and 90 percent of its population lives in rural areas (Economic Survey, 2010-11). The state is located in the fertile Gangetic Plains. Bihar is the ninth largest state of India in terms of its area and the second largest in terms of population. It is bounded by Nepal in the north, Orissa in the south, West Bengal in the east and Uttar Pradesh in the west. Bihar lies mid-way between the humid West Bengal in the east and the sub humid Uttar Pradesh in the west. The Bihar plain is divided into two unequal halves by the river Ganga which flows through the middle from west to east. The total area covered by the state of Bihar is 94,163 km2and is located between 21°58'10" N ~ 27°31'15" N latitude and 82°19'50" E ~ 88°17'40" E longitude. Bihar is mainly a vast stretch of very fertile flat land. Central parts of Bihar have some small hills, for example the Rajgir hills. The Himalayan mountainsare to the north of Bihar, in Nepal. Chota Nagpur plateau lies towards the south of Bihar.
In 1936, Bihar was separated from Orissa. Later in November 2000, Bihar was bifurcated and a new state Jharkhand was made by transferring 13 districts to the new state. The remaining 29 districts have been reorganized into 38 districts. Hence, currently Bihar is divided into 38 districts and 9 divisions for administrative purposes. After the bifurcation of Bihar in 2000, the industrial and mineral-rich zone has gone to Jharkhand and Bihar was left with fertile land and water resources. Bihar is richly endowed with water resources, both asthe ground water resource and the surface water resource. Bihar has substantial water from rainfall as well as the rivers which flow within the territory of the State. Bihar has a number of rivers, the most important of which is the Ganga. The river Ganga flows right across it from west to east. North Bihar is extremely fertile, the land being watered by the rivers Sarayu, Gandak and Ganga. Twelve districts of Bihar fall on the bank of river Ganga. The other rivers are the Sone, Poonpoon, Falgu, Karmanasa, Durgawati, Kosi, Ghaghara, etc.
The economy of Bihar is mainly based on agricultural and trading activities. The soil of Bihar is extremely fertile which makes it ideal for agriculture.Agriculture is the vital source of wealth in Bihar. Seventy-six percent of its population is engaged in agricultural pursuits.Paddy, wheat, maize and pulses are the principal food crops of Bihar. Main cash crops are sugarcane, potato, tobacco, oilseeds, onion, chillies and jute.Bihar is the third largest producer of vegetables and fourth largest producer of fruits in the country. It is the largest producer of litchi, makhana, guava, lady’s finger and honey in the country. However, with improved methods and better management, state’s contribution in food grain, fruit, vegetables, spices and flowers can be increased manifold. The major agro based industries of Bihar are rice, sugar, edible oil.
Though endowed with good soil, adequate rainfall and good ground water availability, Bihar has not yet realized its full agricultural potential. Its agricultural productivity is one of the lowest in the country, leading to rural poverty, low nutrition and migration of labour. Based on soil characterization, rainfall, temperature and terrain, three main agro-climatic zones in
Report Code: 018_GBP_IIT_SEC_ANL_04_Ver 1_Dec 2011
8 | P a g e
Bihar have been identified. These areZoneI:North Alluvial Plain;ZoneII, north East Alluvial Plain;ZoneIII: comprising of ZoneIIIA (South East Alluvial Plain) and ZoneIIIB (South West Alluvial Plain), each with its own unique prospects.
Zone I: This zone comprises of 13districts, namelyWest and East Champaran, Gopalganj, Siwan, Saran, Sitamarhi, Muzaffarpur, Vaishali, Madhubani, Begusarai, Seohar, Darbhanga and Samastipur with an area of 32,665 km2. The average annual rainfall in this zone is 1234.7 mm.
Zone II: This zone comprises of 8districts, namely Purnea, Katihar, Saharsa, Supaul, Arariya, Kishanganj, Madhepura and Khagaria, and covers 11.96% (20797.4 km2) of the total geographical area of Bihar. The average annual rainfall in this Zone is 1382.2 mm.
Zone III: This zone is located in the south of the river Ganga and comprises of 17districtsof Bhagalpur, Banka, Munger, Jamui, Lakhisarai, Shekhpura, Gaya, Aurangabad, Jahanabad, Nawada, Arwal, Nalanda, Patna, Bhojpur, Buxar, Bhabhua, and Rohtash. The total geographical area is 40,875.5 km2, which represents 25.75% of the total area of the State. The average annual rainfall in this Zone is 1102.1 mm.
Bihar is primarily an agrarian economy with largely rain-fed agriculture. Due to the poor irrigational facilities, only 50 to 60 per cent of land is covered by irrigation facilities. Its agricultural productivity is one of the lowest in the country, leading to rural poverty, low nutrition and migration of labour. In the forthcoming discussion, a detailed analysis of status of agriculture in Bihar has been presented.
2. Land Use PatternAfter division in 2000, Bihar is left with 54 percent of the total geographical area of erstwhile Bihar. It is important to note that after the formation of Jharkhand, only 21.8 percent of the previous forest cover was left with new Bihar and stands for 6.64 percent of the total area of current Bihar (Table 1 and Figure 1). Area under non agricultural use, which is 17.60 percent in 2005-06, has been almost constant in current Bihar with marginal rise in recent years (Figure 2). The barren land area in Bihar accounts for 4.66 percent of the total area. Current fallow land has been ranging between 5 to 7 percent in the post-division period (Figure 3). The net sown area has been fluctuating around 60% of the total reported area in the post-2001 period (Table 1 and Figure4). On the other hand, the area sown more than once has shown decline from 24.89% in 2000-01 to 19.52% in 2004-05 and further increased to 21.94% in 2006-07 (Figure 5).Gross sown area has shown decline resulting in decrease in cropping intensity from 1.41 in 2000-01 to 1.36 in 2006-07.The continuous decline in area sown more than once has a serious concern for the sustainability of agriculture in the state.

Report Code: 018_GBP_IIT_SEC_ANL_04_Ver 1_Dec 2011
9 | P a g e
2826000 2950004
616446 621635 621635
0
500000
1000000
1500000
2000000
2500000
3000000
3500000
1980-81 1990-91 2000-01 2003-04 2006-07
Area
in h
ecta
re
Pre Post
Figure 1: Forest Area of Bihar (in Hectares)
1716000
2109838
1638091 1644585 1646888
0
500000
1000000
1500000
2000000
2500000
1980-81 1990-91 2000-01 2003-04 2006-07
Area
in h
ecta
re
Pre Post
Figure 2: Area under Non Agricultural use in Bihar (in Hectares)
931610
1765101
575858 513044 566392
0200000400000600000800000
100000012000001400000160000018000002000000
1980-81 1990-91 2000-01 2003-04 2006-07
Area
in h
ecta
re
Pre Post
Figure 3: Current Fallow Land in Bihar (in Hectares)

Report Code: 018_GBP_IIT_SEC_ANL_04_Ver 1_Dec 2011
10 | P a g e
83150007658359
5662577 5712088 5665122
0
1000000
2000000
3000000
4000000
5000000
6000000
7000000
8000000
9000000
1980-81 1990-91 2000-01 2003-04 2006-07
Area
in h
ecta
re
Pre Post
Figure 4: Net Area Sown in Bihar (in Hectares)
28340002686026
23297022170289 2053826
0
500000
1000000
1500000
2000000
2500000
3000000
1980-81 1990-91 2000-01 2003-04 2006-07
Area
in h
ecta
re
Pre Post
Figure 5: Area Sown more than once in Bihar (in Hectares)
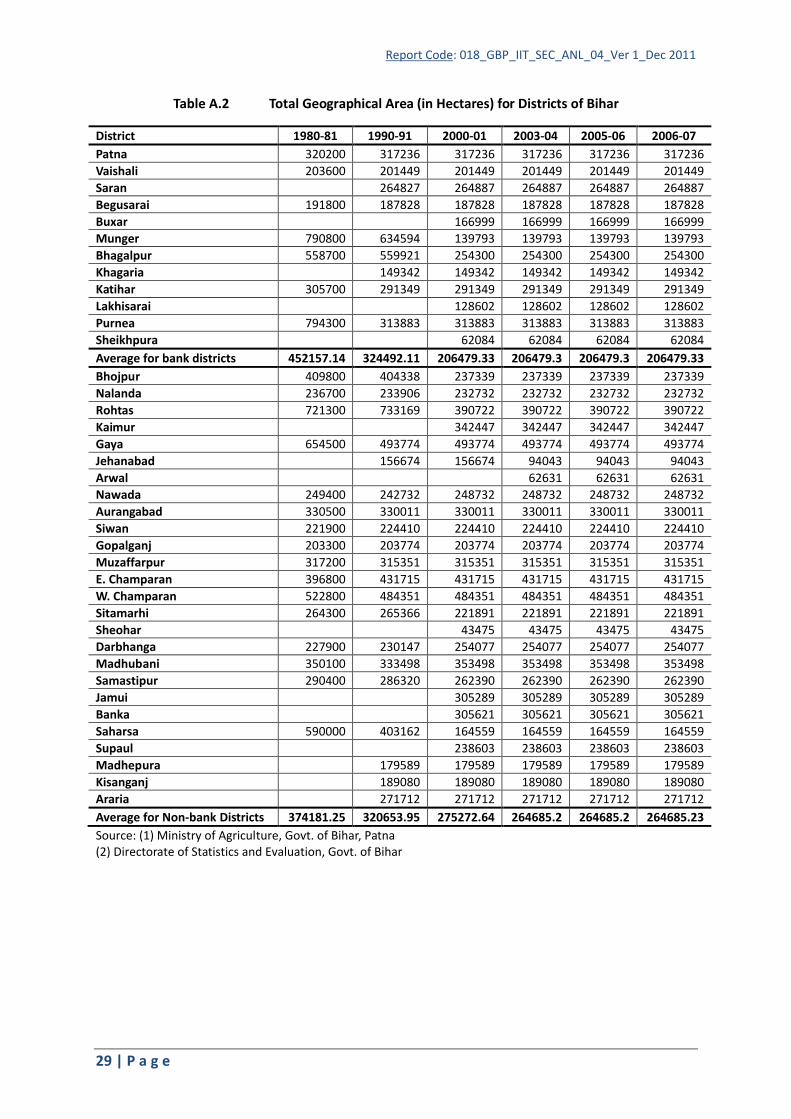
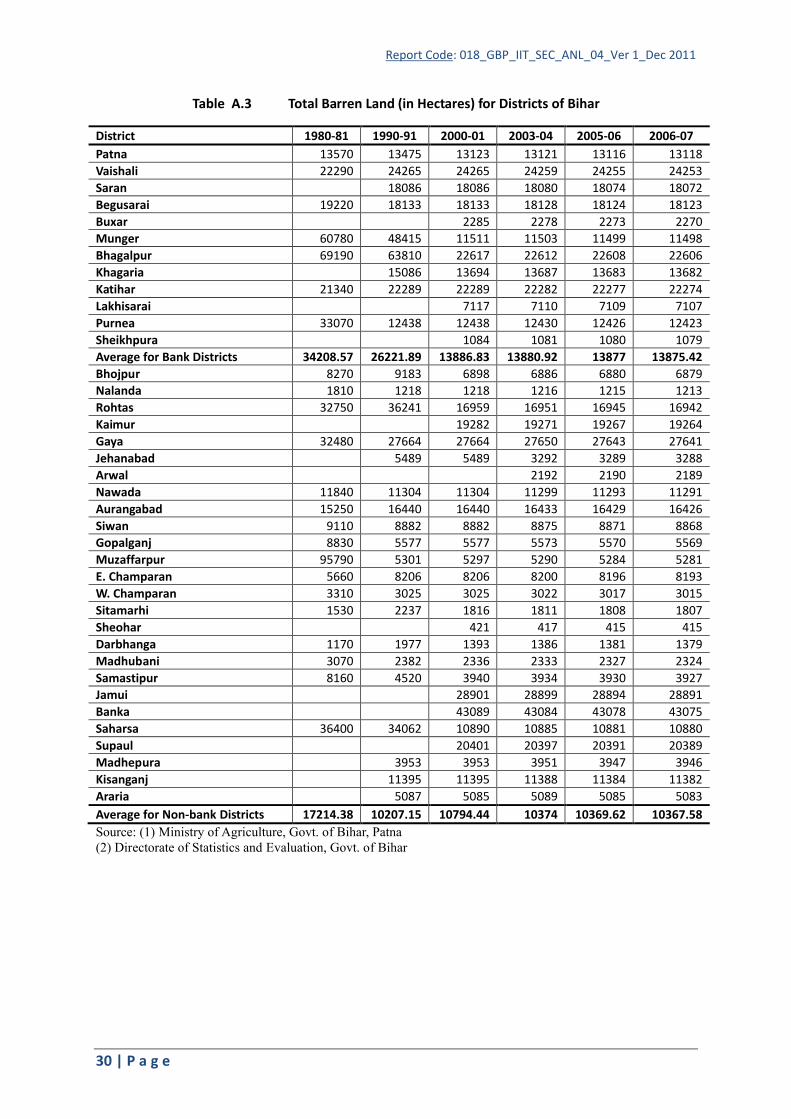
The geographical area of Bihar in bank districts has remained constant after the bifurcation of Bihar and in non-bank districts, there is a marginal fall in the year 2003-04 as compared to 2000-01 but after that it has remained almost constant (see Table 2 and Figure 6).The barren land of bank districts and non-bank districts on an average has remained constant after the bifurcation (Table A.3 and Figure 7).

Report Code: 018_GBP_IIT_SEC_ANL_04_Ver 1_Dec 2011
11 | P a g e
206479.3 206479.3 206479.3 206479.3
275272.6 264685.2 264685.2 264685.2
0.0
50000.0
100000.0
150000.0
200000.0
250000.0
300000.0
2000-01 2003-04 2005-06 2006-07
Area
in h
ecta
re
Bank Districts Non-bank Districts
Figure 6: Geographical Area of Bank and Non-bank Districts of Bihar
(Average in Hectares)
13886.8 13880.9 13877.0 13875.4
10794.4 10374.0 10369.6 10367.6
0.0
2000.0
4000.0
6000.0
8000.0
10000.0
12000.0
14000.0
16000.0
2000-01 2003-04 2005-06 2006-07
Area
in h
ecta
re
Bank Districts Non-bank Districts
Figure 7: Barren Land of Bank and Non-bank Districts of Bihar (Average in Hectares)
The area under current fallow land shows a fluctuating pattern in case of bank and non-bank districts (Table A.4 and Figure 8). However, the increase in recent years in case of non-bank
districts is significant. Net sown area has come down in case of non-bank districts (Table A.5and Figure 9).

Report Code: 018_GBP_IIT_SEC_ANL_04_Ver 1_Dec 2011
12 | P a g e
13855.7
12154.813769.6
9621.3 9136.7
12889.4
0.0
2000.0
4000.0
6000.0
8000.0
10000.0
12000.0
14000.0
16000.0
2000-01 2003-04 2005-06
In h
ecta
re
Average for Bank Districts Average for Non-bank Districts
Figure 8: Current Fallow Land of Bank and Non-bank Districts of Bihar
(Average in Hectares)
128517.7130032.2
127073.7128542.2
139208.8 139459.7
135011.5135807.0
120000.0
125000.0
130000.0
135000.0
140000.0
2000-01 2003-04 2005-06 2006-07
Area
in h
ecta
re
Bank Districts Non-bank Districts
Figure 9: Net Area Sown of Bank and Non-bank Districts in Bihar (Average in Hectares)
The land use pattern in the post-bifurcation period has remained more or less unchanged (Figure 10). District-wise analysis also reveals similar pattern except in case of current fallow land. Fallow land has shown increase in recent years, which is more significant in case of non-bank districts. Also the net sown area has come down in case of non-bank districts.

Report Code: 018_GBP_IIT_SEC_ANL_04_Ver 1_Dec 2011
13 | P a g e
6.5 6.6 6.6 6.6 6.6 6.6 6.6
17.5 17.5 17.5 17.5 17.5 17.5 17.5
4.6 4.6 4.6 4.6 4.6 4.6 4.66.1 6.0 5.3 5.4 6.9 7.1 6.0
60.5 61.1 61.1 61.0 59.5 59.3 60.5
0%10%20%30%40%50%60%70%80%90%
100%
2000-01 2001-2002 2002-03 2003-04 2004-05 2006-07 2007-08
Proportion (%) of Toal Reported Area
Net Area Sown Current Fallow LandBarren land in Bihar Area under Non Agriculture useForest Area
Figure 10: Trends in Land Use Pattern in Bihar
3. Land HoldingsTable A.6 reveals that there has been continuous rise in the number of marginal land holdings in Bihar from 1980-81 to 2005-06. The share of marginal holdings has increased from 75.44 percent in 1980-81 to 84.18 percent in 2000-01 and 89.54 percent in the year 2005-06. The pattern of holdings in 2005-06 is shown in Figure 11. Over the years, share of small, semi-medium, medium and large holdings has declined (Table A.6). Table A.7 presents total area under different sizes of holdings. As can be seen, area under marginal holdings has increased from 43.09 percent in 2001-01 to 52.57 percent in 2005-06. Share of other categories has shown declining trend (see Figure 12 also).This phenomenon can be linked to the rapid fragmentation of holdings in Bihar. Another finding of serious concern is that the average marginal holding in Bihar is 0.24 hectare during the year 2005-06 which has shown constant declining trend (Table A.8, Figure13). The average size of marginal holdings in Bihar was 0.24 hectare during 2005-06. This small average size is an obvious reflection of the predominance of the marginal holdings in Bihar.

Report Code: 018_GBP_IIT_SEC_ANL_04_Ver 1_Dec 2011
14 | P a g e
89.54
6.69
3.06
0.69
0.03
Marginal (Less than 1 Hectare) Small (1-2 Hectare)
Semi Medium (2-4 Hectare) Medium (4-10 Hectare)
Large Total (More than 10 Hectare)
Figure 11: Share in Total Number of Land Holdings in Bihar in 2005-06 (%)
43.09
52.57
19.2 19.6422.88
18.6312.76
8.33
2.07 0.830
10
20
30
40
50
60
2000-01 2005-06
Marginal (Less than 1 Hectare) Small (1-2 Hectare)Semi Medium (2-4 Hectare) Medium (4-10 Hectare)Large Total (More than 10 Hectare)
Figure 12: Share in Total Area of Land Holdings (%)
0
5
10
15
20
25
30
35
40
1980-81 1995-96 2000-01 2005-06
Marginal (Less than 1 Hectare) Small (1-2 Hectare)Semi Medium (2-4 Hectare) Medium (4-10 Hectare)Large Total (More than 10 Hectare)
Figure 13: Average Area per Holding (in Hectares)

Report Code: 018_GBP_IIT_SEC_ANL_04_Ver 1_Dec 2011
15 | P a g e
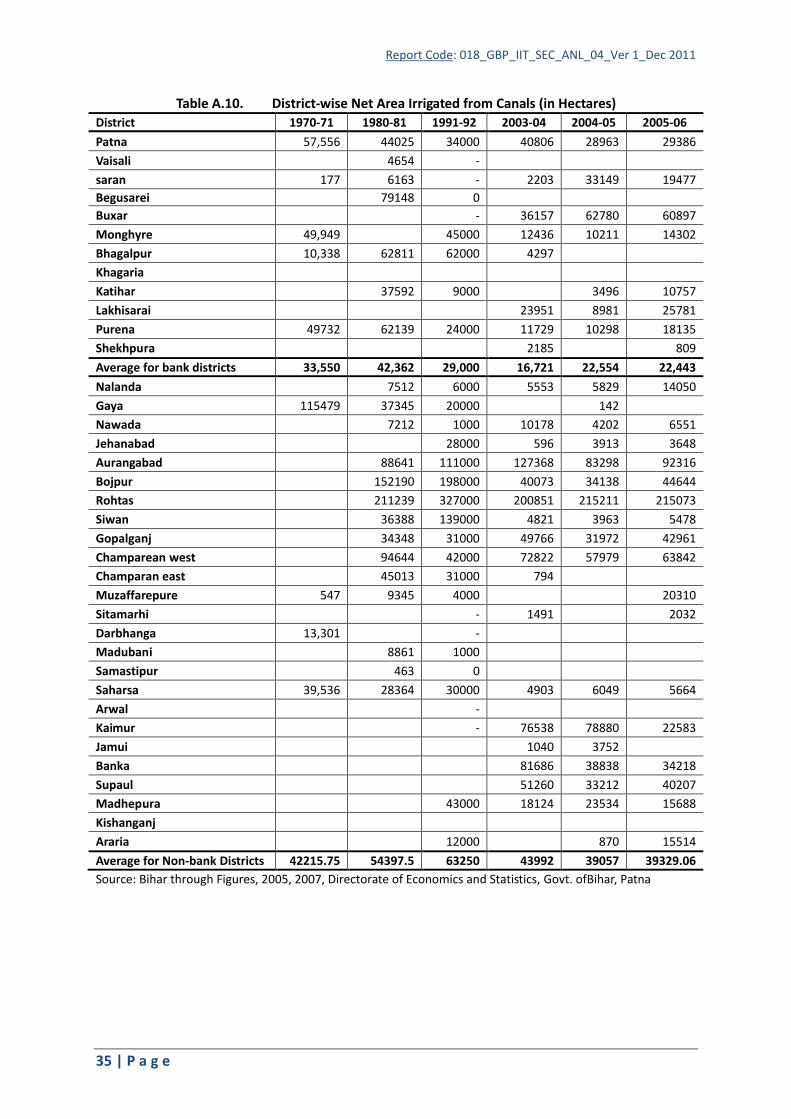
4. Sources of IrrigationThe ratio of net area irrigated to net sown area is declining in Bihar (Table A.9 and Figure 14).
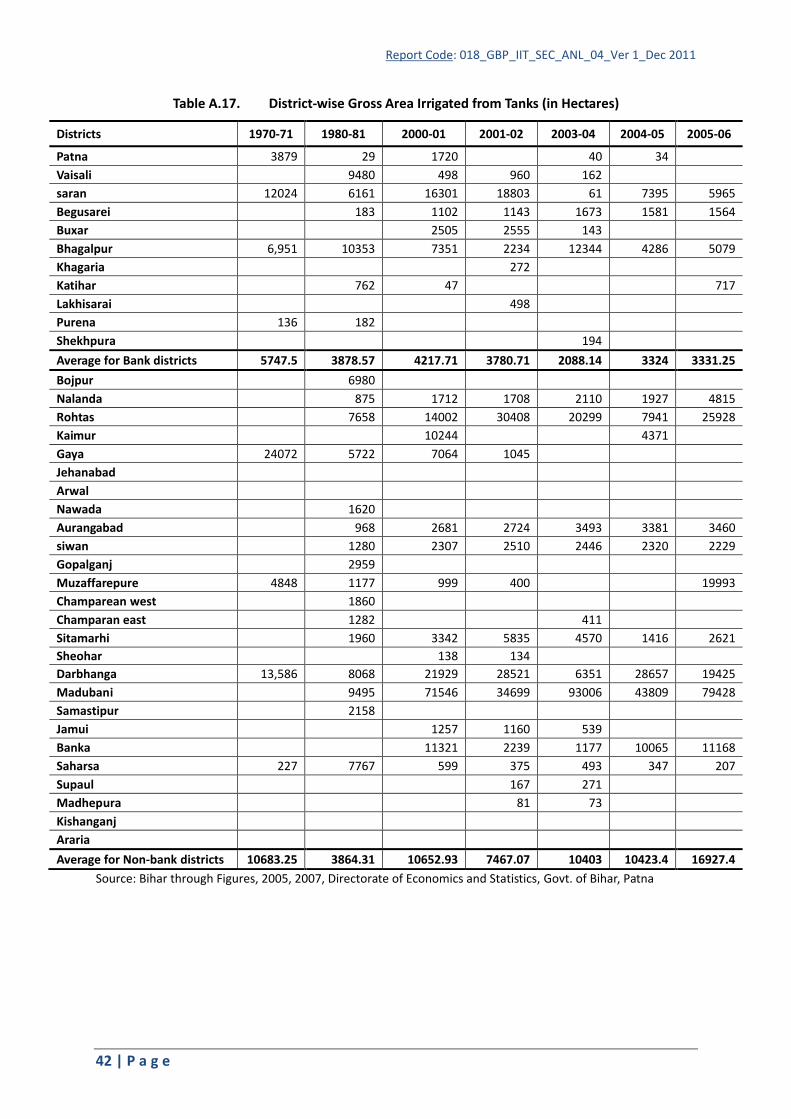
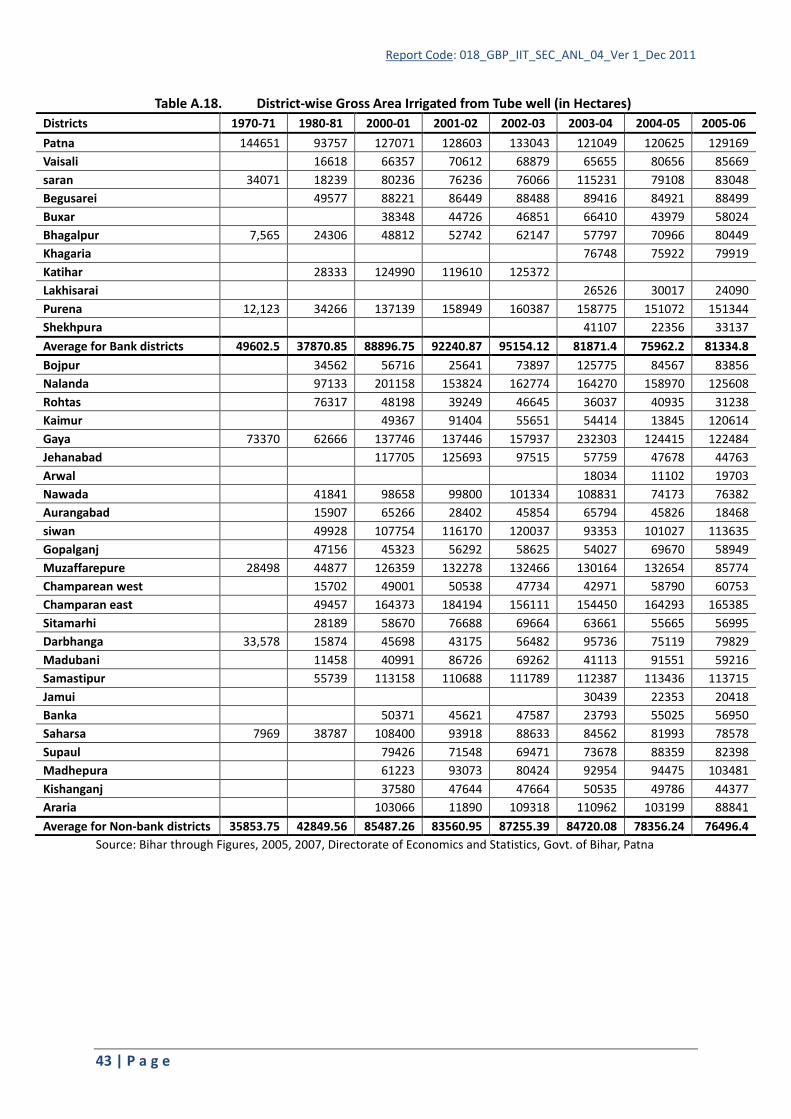
In 2005-06, 56.87 percent of net sown area was irrigated. The gross area irrigated has shown a fluctuating pattern with no clear trend (Table A.15). However, among all sources of
irrigation, tubewell has been the predominant source of irrigation in Bihar. In 2005-06, 64.72 percent of net and 66.94 percent of gross irrigated area was irrigated by tubewells
(TablesA.9 and A.10 and Figures15 and 16). Hence, it can be said that tube-well is the major
source of irrigation in Bihar.
61.15
79.85
60.153.18 56.87
0
10
20
30
40
50
60
70
80
90
2001-02 2002-03 2003-04 2004-05 2005-06
Figure 14: Net Area Irrigated as percent of Net sown Area
0
500000
1000000
1500000
2000000
2500000
3000000
3500000
4000000
4500000
5000000
1970-1971 1980-1981 1991-1992 2001-2002 2002-2003 2003-2004 2004-2005 2005-2006
Canal Tank Tube well Other well Other Sources Total
Figure 15: Sources of Net Area Irrigated (1971-2006)

Report Code: 018_GBP_IIT_SEC_ANL_04_Ver 1_Dec 2011
16 | P a g e
27.57%
4.32%
64.72%
0.37% 4.02%
Canal Tank Tube well Other well Other Sources
Figure 16: Sources of Net Area Irrigated (2005-2006)
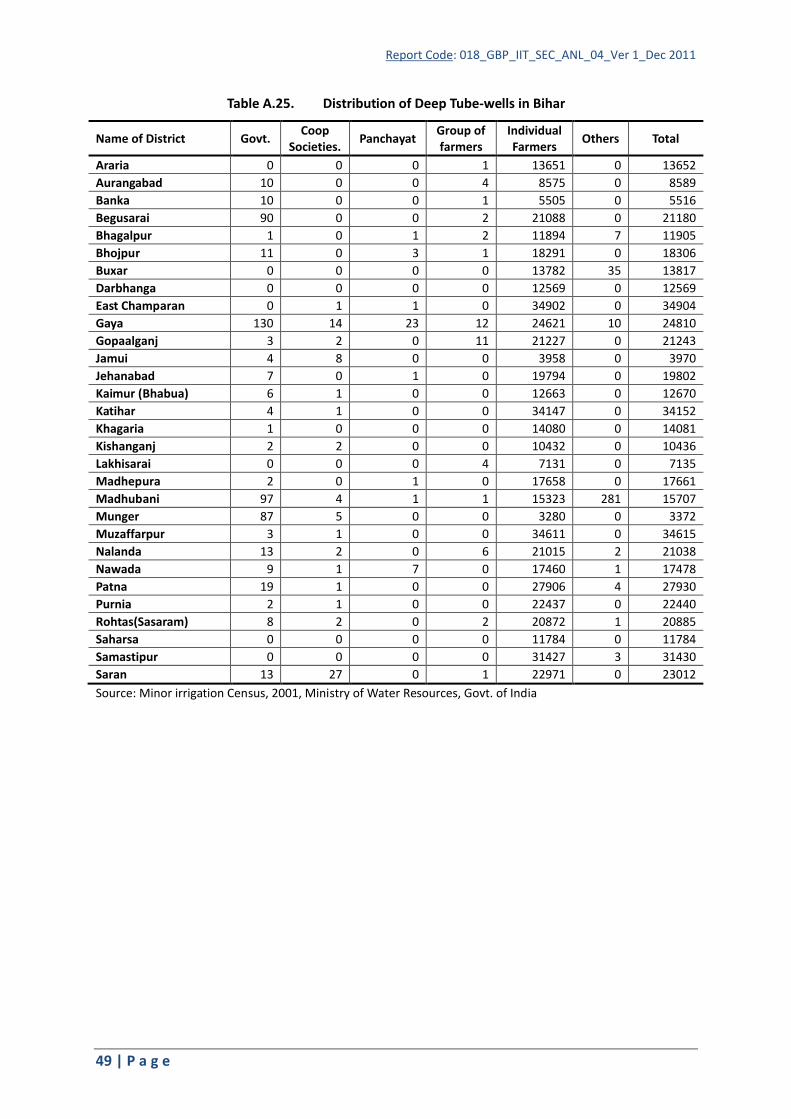
At district level, non-bank districts have shown decline in net area irrigated by canals (see Table A.10). Net area irrigated from tubewell showed decline in case of both bank and non-bank districts though the decline is relatively more in case of non-bank districts (Table A.12 and Figure 17).The number of deep tube wells and dug-wells has also declined over the years in Bihar (Tables A.23 and A.25). Another important finding is that share of Govt. tubewells is insignificant to that owned by individual farmers. This has a serious implication for basin management as the private ownership leads to enormous wastage of water.
59477
52889 52576
60558.04
54551.15 54388
48000
50000
52000
54000
56000
58000
60000
62000
2003-04 2005-06 2006-07
In h
ecta
re
Bank Districts Non-bank Districts
Figure 17: Net Area Irrigated from Tubewell in Bank and Non-bank Districts in Bihar (Average in Hectare)

Report Code: 018_GBP_IIT_SEC_ANL_04_Ver 1_Dec 2011
17 | P a g e
5. RainfallThe rainfall in Bihar has shown considerable variations over the years (Table A.21 and Figure 18).The average rainfall for the bank districts (Table A.22 and Figure 19) in Bihar during the post-bifurcation period has shown an increasing trend. In case of the non-bank districts, rainfall has been fluctuating around the average rainfall for bank districts. Vaishali witnessed highest rainfall among bank districts in the year 2007 where as Muzaffarpur recorded the maximum rainfall among non bank districts in the year 2007.
49249.55
41004.09 40968.45
27923.1529368.1
39904.237706.1
31194.8
37229.3
53516
0
10000
20000
30000
40000
50000
60000
1971 1981 1991 2001 2002 2003 2004 2005 2006 2007
In m
m
Pre Post
Figure 18: Rainfall in Bihar (in mm)
0
200
400
600
800
1000
1200
1400
1600
Dec-01 Dec-02 Dec-03 Dec-04 Dec-05 Dec-06 Dec-07
Average for Bank Districts Average for Non-bank Districts
Figure 19: Rainfall in Bank and Non-bank Districts in Bihar (Average in mm)
6. Fertilizer ConsumptionThe consumption of all the three fertilizers viz., Nitrogen, Phosphate and Potash has increased substantially over the years. Nitrogenous fertilizers have registered maximum increase in per hectare use of fertilizer (Figure 20). This fertilizer accounted for 64.41% of the total fertilizer consumption in 2010 (Table A.29). The total consumption of chemical

Report Code: 018_GBP_IIT_SEC_ANL_04_Ver 1_Dec 2011
18 | P a g e
fertilizers in Bihar has increased from 979.94thousand tonnes in 2001 to 1309.95 thousand tonnes in 2010. The consumption of nitrogenous fertilizer has steadily been increasing from 1971 to 2010 (Figure 21 and Table A.29).The consumption of phosphate fertilizer (Table A.29and Figure 22) has been more than the consumption of potash fertilizer (Figure 23) but less than the consumption of nitrogenous fertilizers. When compared with Bank districts, non bank districts have shown lesser consumption of all fertilizers (Table A.30, A.31, A.32 and Figures 24-26). Patna, Vaishali, Purnea, Bhojpur, Rohtas, Muzaffarpur and W. Champaran are the highest consumers of nitrogenous fertilizers (see Table A.30).Districts like Muzaffarpur, Purnea, Kartihar, Vaishali have consumed relatively more fertilizer (see Table A.31). The consumption of phosphate fertilizer has been higher in districts like Patna, Vaishali, Muzzafurpur, E. Champaran, W. Champaran, Khagaria and Samastipur (Table A.32).
0.076
0.096 0.105
0.0200.018 0.023
0.005 0.0130.011
0.000
0.020
0.040
0.060
0.080
0.100
0.120
2001 2006 2007
Nitrogen Fertilizer Phosphate Fertilizer Potash Fertilizer
Figure 20: Per hectare Use of Fertilizers (Tonnes)
65.36 98.53148.51
326.45
506.64607.57
708.25
843.69
0
100
200
300
400
500
600
700
800
900
1971 1976 1981 1986 1996 2001 2006 2010
in 0
00 to
nnes
Pre 2001 Post 2001
Figure 21: Consumption of Nitrogen Fertilizers in Bihar (in 000' tonnes)

Report Code: 018_GBP_IIT_SEC_ANL_04_Ver 1_Dec 2011
19 | P a g e
12.45 14.9125.74
96.31 99.79
163.68 176.1
247.45
0
50
100
150
200
250
300
1971 1976 1981 1986 1996 2001 2006 2010
in 0
00 to
nnes
Pre 2001 Post 2001
Figure 22: Consumption of Phosphate Fertilizers in Bihar (in 000' tonnes)
4.65 7.2612.8
41.89 40.7237.6
98.7
168.02
0
20
40
60
80
100
120
140
160
180
1971 1976 1981 1986 1996 2001 2006 2010
in 0
00 to
nnes
Pre 2001 Post 2001
Figure 23: Consumption of Potash Fertilizers in Bihar (in 000' tonnes)
17.2020.13
22.4920.43
26.95 26.09
10.96 10.6313.31
21.29
14.89 15.12
0.00
5.00
10.00
15.00
20.00
25.00
30.00
2001 2006 2007 2008 2009 2010
in 0
00 to
nnes
Bank Districts Non-bank Districts
Figure 24: Consumption of Nitrogen Fertilizer in Bank and Non-bank Districts in Bihar (Average in 000' tonnes)

Report Code: 018_GBP_IIT_SEC_ANL_04_Ver 1_Dec 2011
20 | P a g e
5.43
4.34
5.354.82
7.88 7.66
2.87 2.583.34
4.37 4.354.22
0.00
1.00
2.00
3.00
4.00
5.00
6.00
7.00
8.00
9.00
2001 2006 2007 2008 2009 2010
in 0
00 to
nnes
Bank Districts Non-bank Districts
Figure 25: Consumption of Phosphate Fertilizers on Bank and Non-bank Districts in Bihar (Average in 000' tonnes)
1.38
3.763.16
2.05
5.736.36
0.85
2.301.69
2.41
3.26 3.37
0.00
1.00
2.00
3.00
4.00
5.00
6.00
7.00
2001 2006 2007 2008 2009 2010
in 0
00 to
nnes
Bank Districts Non-bank Districts
Figure 27: Average consumption of Potash Fertilizers on Bank Districts and Non-bank Districts in Bihar (in 000' tonnes)
7. Area, Production and YieldBihar is primarily an agrarian economy. Table A.33 to A.35 present performance of
agriculture in Bihar in terms of area, production and productivity of major crops. Figure 28 suggest that area under rice cultivation is showing a gradual declining trend whereas area
under wheat has been increasing over the years. Maize cultivation however, has been constant. This signifies that farmers are shifting away from rice which is more water
consuming. The trends in production and yield for these crops are presented in Figures29
and30.

Report Code: 018_GBP_IIT_SEC_ANL_04_Ver 1_Dec 2011
21 | P a g e
0
500,000
1,000,000
1,500,000
2,000,000
2,500,000
3,000,000
3,500,000
4,000,000
2003-04 2005-06 2007-08 2008-09 2009-10
Rice W heat Maize
Figure 28: Area of Food Grains in Bihar (in Ha)
0
1,000,000
2,000,000
3,000,000
4,000,000
5,000,000
6,000,000
2003-04 2005-06 2007-08 2008-09 2009-10
Rice W heat Maize
Figure 29: Production of Food grains in Bihar (in MT)
0
500
1,000
1,500
2,000
2,500
3,000
2003-04 2005-06 2007-08 2008-09 2009-10
Rice W heat Maize
Figure 30: Yield of Food grains in Bihar (in Kg/ha)

Report Code: 018_GBP_IIT_SEC_ANL_04_Ver 1_Dec 2011
22 | P a g e
At district level, districts like E. Champaran, Aurangabad, W. Champaran, Rohtas and Madhubaniare having the largest area in the state (Table A.35). Maximum contribution to rice production has been made by Rohtas, Aurangabad, Kaimur, Banka, Bhojpur and Nalanda (Table A.36). Highest productivity is registered by Aurangabad, Banka, Bhojpur, Nalanda, Kaimur,Sheikhpura, Patna and Lakhisaria (Table A.37). In case of area under wheat cultivation, maximum area is reported by Rohtas, E. Champaran and Siwan, w. Champaran, Mabhubani, Muzzafarpur and Madhepura (Table A.38). In case of production, the contribution of Gopalganj, Saran, E. Champaran, Siwan and Bhojpur is highest (Table A.39). Maximum productivity is seen in case of Gopalganj, Samastipur, Vaishali, Rohtas and Lakhisaria (Table A.40).
Figure 31 it can be seen that the production of oilseeds has remained constant overtime. The production of jute is also exhibiting more or less constant production. Production of sugarcane however, has shown rising trend (see Table A.35). It can be seen from Figure 32 that area under jute has declined and that of sugarcane has shown rise.
0
1,000,000
2,000,000
3,000,000
4,000,000
5,000,000
6,000,000
2003-04 2005-06 2008-09 2009-10
Oil seeds Jute Sugarcane
Figure 31: Production of Non Food grains in Bihar (in MT)
0
20,000
40,000
60,000
80,000
100,000
120,000
140,000
160,000
180,000
2003-04 2005-06 2007-08 2009-10
Oil seeds Jute Sugarcane
Figure 32: Area under Non Food grains in Bihar (in Hectare)

Report Code: 018_GBP_IIT_SEC_ANL_04_Ver 1_Dec 2011
23 | P a g e
Among vegetables, the production and the area under cultivation for major vegetables have remained unchanged over the years (Figures 33 and 34). Among fruits, there is a clear bias emerging towards banana as the area has increased from 959.3 thousand hectare in 2005-06 to 1373.55 thousand hectare in 2008-09 (Table A.43 and Figures 35 and 36).
0
50
100
150
200
250
300
350Po
tato
Oni
on
Tom
ato
Caul
iflow
er
Cabb
age
Brin
jal
Chill
i
Bott
lego
urd
Spon
gego
urd
2005-06 2006-07 2007-08 2008-09
Figure 33: Production of Major Vegetables in 2008-09 (‘000 tonnes)
0
1000
2000
3000
4000
5000
6000
7000
Pota
to
Oni
on
Tom
ato
Caul
iflow
er
Cabb
age
Brin
jal
Chill
i
Bott
lego
urd
Spon
gego
urd
2005-06 2006-07 2007-08 2008-09
Figure 34: Area under Major Vegetables in 2008-09 (‘000 hectare)

Report Code: 018_GBP_IIT_SEC_ANL_04_Ver 1_Dec 2011
24 | P a g e
0
20
40
60
80
100
120
140
160
Mango Guava Litchi Lemon Banana Pineapple
2005-06 2006-07 2007-08 2008-09
Figure 35: Production of Major Fruits in 2008-09(‘000 tonnes)
0
200
400
600
800
1000
1200
1400
1600
Mango Banana Guava Litchi Lemon Pineapple
2005-06 2006-07 2007-08 2008-09
Figure 36: Area under Major Crops in 2008-09 (‘000 hectare)
Table A.44 and Figure 37 present the cropping pattern of Bihar in the post-bifurcation
period. The agricultural economy of Bihar exhibits a bias towards the food grains as approximately 95 percent of total cropped area has been under food grains. This indicates
the orientation of Bihar agriculture towards subsistence production. Further, within the food
grains, the percentage share of pulses in total cropped area has declined and cereals have shown an increase, though the changes are marginal. The oilseeds, fibers and sugarcane
together account for just about 5 percent of the cropped area and their individual shares in the total cropped area have shown insignificant changes.

Report Code: 018_GBP_IIT_SEC_ANL_04_Ver 1_Dec 2011
25 | P a g e
94.47 94.34 94.42 94.28 94.37 94.35 94.29 94.47 94.52
2.04 1.98 1.84 1.9 1.91 1.99 1.97 1.95 1.89
2.25 2.16 2.31 2.41 2.24 2.15 2.12 2.12 2.06
1.24 1.52 1.44 1.4 1.47 1.51 1.61 1.47 1.53
91%
92%
93%
94%
95%
96%
97%
98%
99%
100%
2000-01 2001-02 2002-03 2003-04 2004-05 2005-06 2006-07 2007-08 2008-09
Sugercane Fibre Crops Oilseeds Foodgrains
Figure 37: Cropping Pattern in Bihar (%age of Area)
8. Cost and Returns in AgriculturePer hectare net income earned from individual crops is one of the key factors in the allocation of scarce land resources for the cultivation of various crops. In this section results of the analysis conducted on cost and returns in the major crops, use of chemical fertilizer,human labour and draught power utilization in the agriculture in Bihar has been presented. The main purpose is to determine which crop is most profitable for the farmers. Table A.44shows the cost and returns, over the years, in paddy, wheat, maize and some other crops.
Paddy is one of the major crops in Bihar. As can be seen from the data presented in the table, net income has been fluctuating with negative trend. Return ratio has also declined during the study period. Hence paddy is not profitable for farmers. Productivity has marginally increased with CAGR as 1.91 percent. The draught power has declined drastically and fertilizer use has increased significantly with CAGR as 4.88 percent. Wheat is another important crop grown in this area. Table A.44 presents the cost and returns from the wheat cultivation. As is evident from the table, net income has been fluctuating upto 2004-05 and after that there is a remarkable increase in net income. On the other hand, the ratio of value of production (VOP) to cost of cultivation (CC) has been increasing after showing decline in 2002-03. Hence wheat is found profitable for farmers. In case of wheat, per hectare use of fertilizer has been fluctuating. Human as well as the animal labour (hrs/hec) have significantly declined during the period. It is important to note here that though the human labour has declined in both wheat and paddy cultivation the mechanical power use in wheat and paddy cultivation has significantly increased over the period. Human labour absorption in paddy cultivation is much higher than that in wheat cultivation. As can be seen from Table A.44, the rate of decline has been much higher in wheat (-5.4 percent) than paddycultivation (-0.68 percent).

Report Code: 018_GBP_IIT_SEC_ANL_04_Ver 1_Dec 2011
26 | P a g e
Maize cultivation is not found profitable for the farmers. As indicated in Table 7.1, net income has registered a negative compound annual growth rate of 9.26 percent. Also the return ratio has been fluctuating with negative trend. The fertilizer consumption has increased by 2.79 percent compound annually and the draught power has enormously declined by 8.25 percent.
Under pulses, masur came out to be the most profitable crop. The return ratio in case of masur has exhibited a rising trend with net income showing CAGR of 22.66 percent during the study period from 2001-02 to 2006-07. Productivity has increased by 3.14 percent compound annually. Another important feature of this crop is that the fertilizer consumption (kg/hec) has declined over the years with -5.35 percent CAGR during the study period. On the other hand, in case of gram, though the return ratio has increased but the productivity has constantly declined from 2002-03 onwards. The fertilizer use (kg/hec) has increased by 10.11 percent annually. Overall it may be stated that sugarcane, wheat and masur are the most profitable crops for farmers in Bihar.
9. SummaryThe key points of the analysis performed above are enumerated below:
Area sown more than once has shown declining trend in Bihar.
Cropping intensity is on decline in Bihar.
Current fallow land has increased in non-bank districts.
Net sown area has declined in non-bank districts.
Marginal holdings (less than one ha) account for 89.5 percent of the total land holdings in Bihar in 2005-06. Another alarming finding is that average size of marginal holding is 0.24 ha in Bihar in 2005-06.
Tubewell has emerged as the most dominating source of irrigation in Bihar. In 2005-06, Tubewells irrigated 64.72 percent of the net irrigated area and 66.94 percent of the gross irrigated area.
Consumption of chemical fertilizers has increased substantially in Bihar agriculture over the years. The rise in consumption has been more in case of bank districts.
Area under rice cultivation has declined gradually.
Area under wheat is showing rising trend.
Among the non-food grain crops, sugarcane and banana have shown increase in area as well as production over the years.
Looking at the cost and returns in major crops in Bihar, sugarcane, wheat and masur are found to be the profitable crops for farmers in Bihar whereas maize and paddy are not profitable for the farmers.
The human and animal absorption in agriculture is declining which has implications for employment and use of animal waste as input in agriculture.

Report Code: 018_GBP_IIT_SEC_ANL_04_Ver 1_Dec 2011
27 | P a g e
References
Agricultural Census Division, Agricultural Census of India, 2000-01, 2005-06, Ministry of Agriculture, Government of India. http://agcensus.nic.in/cendata/databasehome.aspx
Directorate of Statistics and Evaluation, 1985, Bihar Through Figures 1985, Government of Bihar, Patna.
Directorate of Statistics and Evaluation, 2003, Bihar Through Figures 2003, Government of Bihar, Patna.
Directorate of Economics and Statistics, 2005, Bihar Through Figures 2005, Government of Bihar, Patna.
Directorate of Economics and Statistics, 2007, Bihar Through Figures 2007, Government of Bihar, Patna.
Finance Department, 2011, Economic Survey 2010-2011, Government of Bihar, Patna.
Indian Harvest Database, Center for Monitoring Indian Economy (CMIE), Bombay
Ministry of Agriculture, Government of Bihar, www.krishi.bih.nic.in.
Ministry of Environment and Forests, 2011, Environmental and Social Management Framework, Volume I, National Ganga River Basin Authority, Government of India
Ministry of Water Resources, Minor irrigation Census, 2001, Government of India
www.indiastat.com.

Report Code: 018_GBP_IIT_SEC_ANL_04_Ver 1_Dec 2011
28 | P a g e
Annexure
Table A.1. Land use Pattern in Bihar from 1980-81 to 2006-07 (Area in hectares) 1980-81 1990-91 2000-01 2001-02 2002-03 2003-04 2004-05 2005-06 2006-07
Geographical Area 17330000 17284389 9359568 9359568 9359568 9359568 9359568 9359568 9359568
Forest Area2826000
(16.31)2950004
(17.07)616446
(6.59)621635
(6.64)621635
(6.64)621635
(6.64)621635
(6.64)621635
(6.64)621635
(6.64)
Area under Non-agriculture Use
1716000(9.90)
2109838(12.21)
1638091(17.50)
1642089(17.54)
1642976(17.55)
1644585(17.57)
1645680(17.58)
1646625(17.59)
1646888(17.60)
Barren Land in Bihar
1011000(5.83)
1013701(5.86)
436503(4.66)
436483(4.66)
436406(4.66)
436295(4.66)
436212(4.66)
436134(4.66)
436062(4.66)
Current Fallow Land
931610(5.38)
1765101(10.21)
575858(6.15)
562557(6.01)
499160(5.33)
513044(5.48)
648003(6.92)
666184(7.12)
566392(6.05)
Net Area Sown in Bihar
8315000(47.98)
7658359(44.31)
5662577(60.50)
5663552(60.51)
5725479(61.17)
5712088(61.03)
5572402(59.54)
5556186(59.36)
5665122(60.53)
Area Sown more than once
2834000 2686026 2329702 2233336 2231923 2170289 1826916 1840306 2053826
Gross Sown Area 11149000 10344385 7992279 7896888 7957402 7882377 7399318 7396492 7718948
Cropping Intensity 134.08 135.07 141.14 139.43 138.98 137.99 132.79 133.12 136.25
Note: Figures in parentheses are share in percentSource: (1) Ministry of Agriculture, Govt. of Bihar, Patna (2) Directorate of Statistics and Evaluation, Govt. of Bihar (3) Economic Survey, (Various issues), Finance Department, Govt. Of Bihar
Report Code: 018_GBP_IIT_SEC_ANL_04_Ver 1_Dec 2011
29 | P a g e
Table A.2 Total Geographical Area (in Hectares) for Districts of Bihar
District 1980-81 1990-91 2000-01 2003-04 2005-06 2006-07Patna 320200 317236 317236 317236 317236 317236Vaishali 203600 201449 201449 201449 201449 201449Saran 264827 264887 264887 264887 264887Begusarai 191800 187828 187828 187828 187828 187828Buxar 166999 166999 166999 166999Munger 790800 634594 139793 139793 139793 139793Bhagalpur 558700 559921 254300 254300 254300 254300Khagaria 149342 149342 149342 149342 149342Katihar 305700 291349 291349 291349 291349 291349Lakhisarai 128602 128602 128602 128602Purnea 794300 313883 313883 313883 313883 313883Sheikhpura 62084 62084 62084 62084Average for bank districts 452157.14 324492.11 206479.33 206479.3 206479.3 206479.33Bhojpur 409800 404338 237339 237339 237339 237339Nalanda 236700 233906 232732 232732 232732 232732Rohtas 721300 733169 390722 390722 390722 390722Kaimur 342447 342447 342447 342447Gaya 654500 493774 493774 493774 493774 493774Jehanabad 156674 156674 94043 94043 94043Arwal 62631 62631 62631Nawada 249400 242732 248732 248732 248732 248732Aurangabad 330500 330011 330011 330011 330011 330011Siwan 221900 224410 224410 224410 224410 224410Gopalganj 203300 203774 203774 203774 203774 203774Muzaffarpur 317200 315351 315351 315351 315351 315351E. Champaran 396800 431715 431715 431715 431715 431715W. Champaran 522800 484351 484351 484351 484351 484351Sitamarhi 264300 265366 221891 221891 221891 221891Sheohar 43475 43475 43475 43475Darbhanga 227900 230147 254077 254077 254077 254077Madhubani 350100 333498 353498 353498 353498 353498Samastipur 290400 286320 262390 262390 262390 262390Jamui 305289 305289 305289 305289Banka 305621 305621 305621 305621Saharsa 590000 403162 164559 164559 164559 164559Supaul 238603 238603 238603 238603Madhepura 179589 179589 179589 179589 179589Kisanganj 189080 189080 189080 189080 189080Araria 271712 271712 271712 271712 271712Average for Non-bank Districts 374181.25 320653.95 275272.64 264685.2 264685.2 264685.23Source: (1) Ministry of Agriculture, Govt. of Bihar, Patna(2) Directorate of Statistics and Evaluation, Govt. of Bihar
Report Code: 018_GBP_IIT_SEC_ANL_04_Ver 1_Dec 2011
30 | P a g e
Table A.3 Total Barren Land (in Hectares) for Districts of Bihar
District 1980-81 1990-91 2000-01 2003-04 2005-06 2006-07Patna 13570 13475 13123 13121 13116 13118Vaishali 22290 24265 24265 24259 24255 24253Saran 18086 18086 18080 18074 18072Begusarai 19220 18133 18133 18128 18124 18123Buxar 2285 2278 2273 2270Munger 60780 48415 11511 11503 11499 11498Bhagalpur 69190 63810 22617 22612 22608 22606Khagaria 15086 13694 13687 13683 13682Katihar 21340 22289 22289 22282 22277 22274Lakhisarai 7117 7110 7109 7107Purnea 33070 12438 12438 12430 12426 12423Sheikhpura 1084 1081 1080 1079Average for Bank Districts 34208.57 26221.89 13886.83 13880.92 13877 13875.42Bhojpur 8270 9183 6898 6886 6880 6879Nalanda 1810 1218 1218 1216 1215 1213Rohtas 32750 36241 16959 16951 16945 16942Kaimur 19282 19271 19267 19264Gaya 32480 27664 27664 27650 27643 27641Jehanabad 5489 5489 3292 3289 3288Arwal 2192 2190 2189Nawada 11840 11304 11304 11299 11293 11291Aurangabad 15250 16440 16440 16433 16429 16426Siwan 9110 8882 8882 8875 8871 8868Gopalganj 8830 5577 5577 5573 5570 5569Muzaffarpur 95790 5301 5297 5290 5284 5281E. Champaran 5660 8206 8206 8200 8196 8193W. Champaran 3310 3025 3025 3022 3017 3015Sitamarhi 1530 2237 1816 1811 1808 1807Sheohar 421 417 415 415Darbhanga 1170 1977 1393 1386 1381 1379Madhubani 3070 2382 2336 2333 2327 2324Samastipur 8160 4520 3940 3934 3930 3927Jamui 28901 28899 28894 28891Banka 43089 43084 43078 43075Saharsa 36400 34062 10890 10885 10881 10880Supaul 20401 20397 20391 20389Madhepura 3953 3953 3951 3947 3946Kisanganj 11395 11395 11388 11384 11382Araria 5087 5085 5089 5085 5083Average for Non-bank Districts 17214.38 10207.15 10794.44 10374 10369.62 10367.58Source: (1) Ministry of Agriculture, Govt. of Bihar, Patna(2) Directorate of Statistics and Evaluation, Govt. of Bihar

Report Code: 018_GBP_IIT_SEC_ANL_04_Ver 1_Dec 2011
31 | P a g e
Table A.4. Current Fallow Land (in Hectares) for Districts of Bihar
District 1980-81 1990-91 2000-01 2003-04 2005-06 2006-07Patna 18010 27237 16680 19190 62342 23221Vaishali 9300 7040 1520 3686 28427 3216Saran 19297 2328 8266 26773 8233Begusarai 7420 4854 4018 7241 29090 6293Buxar 8186 7686 12221 3641Munger 80170 59897 20632 16701 19754 13861Bhagalpur 44980 46266 5490 5115 5114 7266Khagaria 19642 9677 9108 18679 12341Katihar 31040 32923 30887 25921 39843 23866Lakhisarai 18070 18121 7722 18362Purnea 85600 38263 39270 20301 36440 32603Sheikhpura 9510 4522 6761 12332Average for Bank district 39502.86 28379.89 13855.67 12154.83 24430.5 13769.58Bhojpur 24720 24042 9992 6424 28951 5133Nalanda 8990 3103 2180 3933 30072 2512Rohtas 35250 33896 1040 922 37689 1904Kaimur 16830 14513 29801 8252Gaya 80520 70968 99001 91403 61528 90722Jehanabad 5725 16806 8703 12788 5263Arwal 6810 8539 6875Nawada 27400 6935 21683 22809 24622 30542Aurangabad 57970 52234 65062 32925 50785 23842Siwan 10880 4868 9515 10563 27436 10641Gopalganj 11820 1031 3260 4042 29761 8817Muzaffarpur 21240 17189 24020 21956 49446 30132E. Champaran 12410 19439 21635 28302 49259 17316W. Champaran 32010 18862 3111 4241 70059 4533Sitamarhi 7380 15020 23975 20661 43784 11713Sheohar 3835 1952 9224 2002Darbhanga 17710 25603 6975 5203 42971 15869Madhubani 15230 24844 12317 12561 69771 18133Samastipur 21380 8047 612 2263 52957 3137Jamui 38511 32012 34296 48553Banka 2315 2401 35236 2281Saharsa 42880 18539 2215 6221 21020 7973Supaul 7378 6011 37862 16682Madhepura 13936 1110 5742 25357 10133Kisanganj 16396 2935 3001 23874 8465Araria 23336 13277 11612 39365 9732Average for Non-bank Districts 20916.00 18215.13 9621.25 9136.67 36309.75 12889.42Source: (1) Ministry of Agriculture, Govt. of Bihar, Patna (2) Directorate of Statistics and Evaluation, Govt. of Bihar

Report Code: 018_GBP_IIT_SEC_ANL_04_Ver 1_Dec 2011
32 | P a g e
Table A.5. Net Sown Area (in Hectares) for Districts of BiharDistrict 1980-81 1990-91 2000-01 2003-04 2005-06 2006-07Patna 222530 207330 209135 206294 207288 202193Vaishali 127050 119665 129211 126660 126944 127099Saran 174988 199270 192938 191689 192598Begusarai 135830 120785 120722 117193 117078 118163Buxar 138245 138277 139661 142451Munger 370940 263101 44436 48029 49036 51217Bhagalpur 288960 269010 145565 145667 140869 144072Khagaria 75211 84433 84684 82313 81429Katihar 176920 159908 161679 167217 166372 169245Lakhisarai 68327 68044 60300 68498Purnea 518020 201235 201831 221166 208032 208834Sheikhpura 39358 44217 35302 36707Average for Bank districts 262892.86 176803.67 128517.67 130032.17 127073.67 128542.17Bhojpur 329330 315320 182362 185364 182184 186872Nalanda 182760 183374 183377 180872 182935 182236Rohtas 402620 400987 254710 254360 254387 253299Kaimur 152185 154226 156071 160937Gaya 368510 236151 193071 200333 149611 204610Jehanabad 115085 104485 63650 64722 67502Arwal 41784 39889 41002Nawada 123390 119584 112063 110565 93392 102721Aurangabad 191040 196127 169080 197912 200714 206479Siwan 170560 175881 164382 162889 165440 162923Gopalganj 150100 157629 151659 150524 146439 145724Muzaffarpur 226030 219043 205452 207145 197527 198831E. Champaran 337740 313823 295765 288804 297095 299987W. Champaran 262210 255996 281269 279758 280758 279809Sitamarhi 203070 178256 118123 121048 121801 130192Sheohar 24926 26483 26243 26469Darbhanga 161600 139877 171263 172716 166448 162020Madhubani 256400 212724 225686 225113 220825 219816Samastipur 193590 201678 186719 184718 184061 183919Jamui 74951 81117 58772 64836Banka 154227 153818 151689 154489Saharsa 371150 247544 113982 109633 108111 107864Supaul 154192 155251 145788 144544Madhepura 123818 136490 131531 125938 127105Kisanganj 113085 130634 131105 128530 125608Araria 185691 179312 180983 181932 182822Average for Non-bank districts 237162 175334.12 139208.75 139459.66 135011.5 135807
Source: (1) Ministry of Agriculture, Govt. of Bihar, Patna (2) Directorate of Statistics and Evaluation, Govt. of Bihar

Report Code: 018_GBP_IIT_SEC_ANL_04_Ver 1_Dec 2011
33 | P a g e
Table A.6 Number of Land Holdings in Bihar
Size Class 1980-1981 1995-1996 2000-2001 2005-2006
Marginal (Less than 1 Hectare) 8320600 (75.44%)
9577000 (84.15%)
9743016 (84.18%)
11485499 (89.54%)
Small ( 1-2 Hectare)1217900 (11.04%)
1051000 (9.23%)
1068785 (9.23%)
857997 (6.69%)
Semi Medium (2-4 Hectare)951100 (8.62%)
583000 (5.12%)
589288 (5.09%)
392563 (3.06%)
Medium (4-10 Hectare)471500 (4.28%)
161000 (1.41%)
164130 (1.42%)
88226 (0.69%)
Large Total (More than 10 Hectare) 67900 (0.62%)9000
(0.08%)9026 (0.08%)
3219(0.03%)
Total 11029000 11381000 11574245 12827504Source: (1) Bihar through Figures, 1985, Directorate of Statistics and Evaluation, Government of Bihar (2) Agricultural Census of India, 2000-01, 2005-06
Table A.7. Area of Holdings (in Hectares)
Size Class 1980-1981 1995-1996 2000-2001 2005-2006
Marginal (Less than 1 Hectare)2951600 (46.91%)
2934000(43.08%)
2907256 (43.09%)
2870755 (52.57%)
Small ( 1-2 Hectare)1647600 (26.19%)
1308000 (19.21%)
1295531 (19.2%)
1072378 (19.64%)
Semi Medium (2-4 Hectare)257400 (4.09%)
1558000 (22.88%)
1543901 (22.88%)
1017067 (18.63%)
Medium (4-10 Hectare)270900 (4.31%)
869000(12.76%)
860761 (12.76%)
454939 (8.33%)
Large Total (More than 10 Hectare)1164600(18.51%)
141000 (2.07%)
139941 (2.07%)
45547(0.83%)
Total 6292100 6810000 6747390 5460686
Source: (1) Bihar through Figures, 1985, Directorate of Statistics and Evaluation, Government of Bihar (2) Agricultural Census of India, 2000-01, 2005-06
Table A.8. Average Area per Holdings (in Hectares)
Size Class 1980-1981 1995-1996 2000-2001 2005-2006
Marginal (Less than 1 Hectare) 0.9 0.88 0.29 0.24Small ( 1-2 Hectare) 1.3 1.24 1.21 1.25Semi Medium (2-4 Hectare) 5.6 5.78 2.62 2.59Medium (4-10 Hectare) 18.8 19.08 5.24 5.16Large Total (More than 10 Hectare) 34.79 15.5 14.15
Source: (1) Bihar through Figures, 1985, Directorate of Statistics and Evaluation, Government of Bihar(2) Agricultural Census of India, 2000-01, 2005-06

Report Code: 018_GBP_IIT_SEC_ANL_04_Ver 1_Dec 2011
34 | P a g e
Table A.9. Sources of Net Area Irrigated in Bihar (in Hectares)
Year Canal Tank Tube wellOther well
Other Sources
Net Area Irrigated
(NAI)
Net Sown Area(NSA)
NAI as % of NSA
1970-1971814109
(37.71%)169020 (7.83%)
364674 (16.89%)
185016 (8.57%)
625956 (29%) 2158775
1980-19811094326 (37.05%)
96139 (3.26%)
793455 (26.87%)
202500 (6.86%)
766910 (25.97%)
2953330
1991-19921233000 (36.39%)
101000 (2.98%)
1389000 (41%)
97000 (5.98%)
568000 (16.77%)
3388000
2001-2002965000
(27.87%)112000 (3.23%)
2239000 (64.65%)
14000 (0.4%)
133000 (3.84%)
3463000 5663552 61.15
2002-2003 1259338 (27.55%)
149071 (3.26%)
2965410 (64.87%)
18260 (0.4%)
179503 (3.93%)
4571582 5725479 79.85
2003-2004904028
(26.33%)111691 (3.25%)
2288235 (66.65%)
12810 (0.37%)
116430 (3.39%) 3433194 5712088 60.10
2004-2005774717
(26.14%)88709
(2.99%)2006016 (67.7%)
6614 (0.22%)
87196 (2.94%)
2963252 5572402 53.18
2005-2006839594
(26.57%)136576 (4.32%)
2044998 (64.72%)
11618 (0.37%)
127116 (4.02%)
3159902 5556186 56.87
Source: Bihar through Figures, 2005, 2007, Directorate of Economics and Statistics, Govt. of Bihar, Patna
Report Code: 018_GBP_IIT_SEC_ANL_04_Ver 1_Dec 2011
35 | P a g e
Table A.10. District-wise Net Area Irrigated from Canals (in Hectares)District 1970-71 1980-81 1991-92 2003-04 2004-05 2005-06Patna 57,556 44025 34000 40806 28963 29386Vaisali 4654 -saran 177 6163 - 2203 33149 19477Begusarei 79148 0Buxar - 36157 62780 60897Monghyre 49,949 45000 12436 10211 14302Bhagalpur 10,338 62811 62000 4297KhagariaKatihar 37592 9000 3496 10757Lakhisarai 23951 8981 25781Purena 49732 62139 24000 11729 10298 18135Shekhpura 2185 809Average for bank districts 33,550 42,362 29,000 16,721 22,554 22,443Nalanda 7512 6000 5553 5829 14050Gaya 115479 37345 20000 142Nawada 7212 1000 10178 4202 6551Jehanabad 28000 596 3913 3648Aurangabad 88641 111000 127368 83298 92316Bojpur 152190 198000 40073 34138 44644Rohtas 211239 327000 200851 215211 215073Siwan 36388 139000 4821 3963 5478Gopalganj 34348 31000 49766 31972 42961Champarean west 94644 42000 72822 57979 63842Champaran east 45013 31000 794Muzaffarepure 547 9345 4000 20310Sitamarhi - 1491 2032Darbhanga 13,301 -Madubani 8861 1000Samastipur 463 0Saharsa 39,536 28364 30000 4903 6049 5664Arwal -Kaimur - 76538 78880 22583Jamui 1040 3752Banka 81686 38838 34218Supaul 51260 33212 40207Madhepura 43000 18124 23534 15688KishanganjAraria 12000 870 15514Average for Non-bank Districts 42215.75 54397.5 63250 43992 39057 39329.06Source: Bihar through Figures, 2005, 2007, Directorate of Economics and Statistics, Govt. ofBihar, Patna

Report Code: 018_GBP_IIT_SEC_ANL_04_Ver 1_Dec 2011
36 | P a g e
Table A.11. District-wise Net Area Irrigated from Tanks (in Hectares)District 1970-71 1980-81 1991-1992 2003-04 2004-05 2005-06Patna 3,448 9 - 40 34Vaisali 7051 - 162saran 12003 6151 - 61 7395 5965Begusarei 123 - 1555 1452 1437Buxar - 143Monghyre 4,813 2444 6000Bhagalpur 3,378 9461 15000 8193 4286 3055Khagaria -Katihar 616 -Lakhisarai -Purena 120 182 -Shekhpura - 194Average for bank districts 4,752 3,255 10,500 1,478 3,292 3,486Nalanda 647 9000 1116 1172 4224Gaya 23659 3258 1000Nawada 1058 -Aurangabad 780 - 3493 3381 3460Bojpur 6767 1000Rohtas 5985 1000 17994 5010 23922Siwan 1176 1000 2446 2320 2229Gopalganj 1401 1000Champarean west 1471 2000 1Champaran east 1189 1000 411Muzaffarepure 4540 1060 1000 19993Sitamarhi 1635 3000 4570 1416 1871Darbhanga 11,061 5238 10000 4883 20080 10883Madubani 7797 23000 64114 30472 51225Samastipur 2049 -Saharsa 208 5420 1000 311 205 207Arwal -Jamui - 539Banka - 1122 7804 8105Supaul - 271Madhepura - 73Kishanganj -Araria -Jehanabad 1000Kaimur - 3681Average for Non-bank Districts 9867 2933.19 4000 7795.62 6867.45 12611.9Source: Bihar through Figures, 2005, 2007, Directorate of Economics and Statistics, Govt. of Bihar, Patna

Report Code: 018_GBP_IIT_SEC_ANL_04_Ver 1_Dec 2011
37 | P a g e
Table A.12 District-wise Net area irrigated from Tube Well (in Hectares)District 1970-71 1980-81 1990-91 2003-04 2004-05 2005-06Patna 97,992 68991 66000 83906 81259 72344Buxar - 42373 35986 40747Saran 32558 17769 92000 105359 64821 73441Vashali 16400 62000 53964 60708 62333Munger 17,335 20959 51000 18059 18433 15142Begusarai 45097 68000 84584 73637 73438Shekhpura - 35910 17314 21108Lakhisarai - 19214 20851 15427Khagaria 35000 65103 67525 70472Bhagalpur 3,034 17222 28000 39906 50729 56512Purnea 9997 21039 51000 86288 76280 54691Katihar 17206 52000 79060 67128 75258Average for Bank Districts 32183 28085 56111 59477 52889 52576Nalanda 82131 103000 94523 99547 96808Bojpur 25179 62000 89503 65615 63814Rohtas 42489 38000 24596 27312 22432Kaimur - 42366 9281 81119Gaya 48071 529946 36000 177161 83396 81856Jehanabad 29000 54957 29520 24701Arwal - 15343 8135 16010Nawada 27978 33000 77829 49075 51376Aurangabad 7927 11000 54019 30215 18217Siwan 47191 16000 89041 91047 101509Gopalganj 44455 28000 47193 64910 53320Muzaffarpur 19617 40422 60000 106150 112168 67948East Champaran 46940 42000 122917 124482 147660West Champaran 13831 31000 23271 28600 36029Sitamarhi 22503 35000 48182 47331 51586Sheohar - 11897 14334 13860Darbhanga 21,687 13272 35000 74281 52585 57963Madhubani 7686 - 26738 77222 40042Samastipur 41305 97000 102020 97722 98067Jamui - 23989 17413 15970Banka - 16733 37397 46470Saharsa 6,446 34242 56000 49618 46201 47453Supaul - 49209 46985 49479Madhepura 19000 47170 64368 64404Kishanganj 16000 33203 27789 26215Araria 62000 72600 65680 39777Average for Non-bank Districts 23955.25 64218.56 42578.95 60558.04 54551.15 54387.88
Source: Bihar through Figures, 2005, 2007, Directorate of Economics and Statistics, Govt. of Bihar, Patna

Report Code: 018_GBP_IIT_SEC_ANL_04_Ver 1_Dec 2011
38 | P a g e
Table A.13. District-wise Net area irrigated from Other Wells (in Hectares)
District 1970-71 1980-81 1991-92 2003-04 2004-05 2005-06Patna 13,969 1520 -Buxar -Saran 74578 31221 -Vashali 11152 1000 4772 1373Munger 8,837 34151 4000 12 44 63Begusarai 436 1000Shekhpura - 310Lakhisarai - 6 85Khagaria -Bhagalpur 2,182 4291 15000 1061Purnea 113 376 1000Katihar 2893 -Average for Bank Districts 19936 10755 4400 1232 501 63Nalanda 18370 3000 15 7059Bojpur 2365 4000Rohtas 2690 -Kaimur -Gaya 29,760 7360 11000Jehanabad 2000Arwal - 177Nawada 17254 1000Aurangabad 2541 1000 4688 4742 4338Siwan 10447 1000 79 193 158Gopalganj 809 -Muzaffarpur 6027 3299 -East Champaran 587 1000West Champaran 262 16000Sitamarhi 641 -Sheohar -Darbhanga 1,326 14 -Madhubani 108 -Samastipur 2647 -Jamui - 1700Banka - 167Saharsa 162 4255 -Supaul -Madhepura 2000Kishanganj -Araria -Average for Non-bank Districts 9318.75 4603.06 4200.00 1329.80 1704.00 3851.67
Source: Bihar through Figures, 2005, 2007, Directorate of Economics and Statistics, Govt. of Bihar, Patna

Report Code: 018_GBP_IIT_SEC_ANL_04_Ver 1_Dec 2011
39 | P a g e
Table A.14. District-wise Net area irrigated from Other Sources (in Hectares)
District 1970-71 1980-81 1991-92 2003-04 2004-05 2005-06
Patna 89020 41213 20000 5755 5851Buxar - 1323 1401 1458Saran 131816 41233 11000 365Vashali 2465 - 5212 3456 4072Munger 1,06,679 24205 14000 3646Begusarai 6143 12000 12Shekhpura - 6539 397 1947Lakhisarai - 2386 2577 1787Khagaria 23000 4318 2006 2357Bhagalpur 45,975 37241 18000 2865Purnea 64544 4569 2000Katihar 3053 5000Average for Bank Districts 82839 20015 13125 4006 2615 1714Nalanda 68356 17000 10484 11132 17497Bojpur 66183 46000 5818 4922 1484Rohtas 25153 15000 6928 6366 7115Kaimur - 11141 8543 13779Gaya 537009 200785 67000 2787 2363Jehanabad 50000 8851 8588 21845Arwal - 1318 2963 130Nawada 67221 50000 2456 4869 625Aurangabad 58009 32000 7577 1684 25862Siwan 4283 1000 4310 1607 1098Gopalganj 3639 26000 2799 189 203Muzaffarpur 38701 8242 19000East Champaran 1407 9000West Champaran 3745 8000 2937 8750 11741Sitamarhi 3012 5000 1960 264 321Sheohar -Darbhanga 63,525 6275 21000 282 5764Madhubani 6715 7000 2944 3571Samastipur 10660 4000Jamui - 1718 2315 1356Banka - 499 324Saharsa 49040 17630 15000 3056 2013 5979Supaul - 813 567Madhepura 7000 5924 226Kishanganj 3000 319Araria 10000Average for Non-bank Districts 172068.75 34457.19 20600.00 4437.89 3576.90 7194.88
Source: Bihar through Figures, 2005, 2007, Directorate of Economics and Statistics, Govt. of Bihar, Patna

Report Code: 018_GBP_IIT_SEC_ANL_04_Ver 1_Dec 2011
40 | P a g e
Table A.15. Sources of Gross Area Irrigated (1971-2006)
Year Canal Tank Tube well Other wellOther
SourcesTotal
1970-1971 1118355 (41.85%)
149717 (5.6%)
515823 (19.3%)
221481(8.29%)
667221 (24.97%) 2672597
1980-19811397135 (38.47%)
117925 (3.21%)
1001000 (27.26%)
242861 (6.61%)
872758 (23.77%)
3631679
1991-19921509000 (36.3%)
124000 (2.98%)
1702000 (40.94%)
124000 (2.98%)
698000 (16.79%)
4157000
2000-20011229769 (26.96%)
179637 (3.94%)
2871170 (62.95%)
15874 (0.35%)
264665(5.8%)
4561115
2001-20021237156 (27.87%)
139580 (3.14%)
2864846 (64.54%)
15870 (0.36%)
181562 (4.09%)
4439014
2002-20031259338 (35.26%)
149071 (4.17%)
1965410 (55.03%)
18260(0.51%)
179503 (5.03%)
3571582
2003-2004 1143361 (25.04%)
149856 (3.28%)
3103326 (67.95%)
13222 (0.29%)
157070 (3.44%)
4566835
2004-20051062594 (0.25%)
117531 (2.8%)
2886959 (68.78%)
6694(0.16%)
123362 (2.94%)
4197140
2005-20061061478 (24.54%)
182599 (4.22%)
2894879 (66.94%)
11687 (0.27%)
174044 (4.02%)
4324687
Source: Bihar through Figures, 2005, 2007, Directorate of Economics and Statistics, Govt. of Bihar, Patna

Report Code: 018_GBP_IIT_SEC_ANL_04_Ver 1_Dec 2011
41 | P a g e
Table A.16. District-wise Gross Area Irrigated from Canals (In Hectares)
Gross Area Irrigated from Canals (in Hectares)
Districts 1970-71 1980-81 2000-01 2001-02 2002-03 2003-04 2004-05 2005-06
Patna 72716 48307 19121 28972 49992 51115 32431 34852Vaisali 5059Saran 177 6537 21049 23271 27035 2414 33149 19477BegusaraiBuxar 44421 80760 86671Bhagalpur 47,299 67153 5430 5256 4297KhagariaKatihar 15592 4415 4332 6558 4694 11444Lakhisarai 15616 23951 16640 25781Purenea 75366 70333 14434 10556 9144 11729 10298 18135Sheikhpura 10170 1826 2428 2185 809Average for Bank districts 48889.5 35496.8 12436.5 12368.8 18462.2 20016 29662 28167Bojpur 188430 115152 154308 112537 50781 54713 60238Nalanda 7678 6594 6452 7026 9442 9018 19453Rohtas 322081 274199 262369 271928 262570 250397 266829Kaimur 98998 75977 82126 98493 121038 28353Gaya 131123 40356 43204 64212 57447 142Jehanabad 596 3913 3648Arwal 28712 22358 20710Nawada 8387 13685 13227 12947 13944 6033 8546Aurangabad 101497 104471 180535 175901 140664 95416 100384Siwan 37539 3270 2912 5938 6314 5397 6686Gopalganj 40869 46444 46946 48103 50672 39407 46060Muzaffarpur 735 105611 454 138 20310Champaran West 38962 151224 130308 122192 128686 113917 109254Champaran East 49537 32220 2345 1818 794SitamarhiDarbhanga 15,899Madhubani 15371 4047Samastipur 463Jamui 5128 1316 1013 1040 3752Banka 51585 57268 61571 90062 50880 44654Saharsa 61,005 68539 3908 5469 8658 5527 9309 6616Supaul 41842 50699 53918 67352 49804 60816Madhepura 63561 46517 53258 32795 34942 26489KishanganjAraria 2795 870 17346Average for Non-bank districts 52190.5 73237.2 55935.8 64764.59 67273.81 58143.77 48405.9 49787.77
Source: Bihar through Figures, 2005, 2007, Directorate of Economics and Statistics, Govt. of Bihar, Patna
Report Code: 018_GBP_IIT_SEC_ANL_04_Ver 1_Dec 2011
42 | P a g e
Table A.17. District-wise Gross Area Irrigated from Tanks (in Hectares)
Districts 1970-71 1980-81 2000-01 2001-02 2003-04 2004-05 2005-06
Patna 3879 29 1720 40 34Vaisali 9480 498 960 162saran 12024 6161 16301 18803 61 7395 5965Begusarei 183 1102 1143 1673 1581 1564Buxar 2505 2555 143Bhagalpur 6,951 10353 7351 2234 12344 4286 5079Khagaria 272Katihar 762 47 717Lakhisarai 498Purena 136 182Shekhpura 194Average for Bank districts 5747.5 3878.57 4217.71 3780.71 2088.14 3324 3331.25Bojpur 6980Nalanda 875 1712 1708 2110 1927 4815Rohtas 7658 14002 30408 20299 7941 25928Kaimur 10244 4371Gaya 24072 5722 7064 1045JehanabadArwalNawada 1620Aurangabad 968 2681 2724 3493 3381 3460siwan 1280 2307 2510 2446 2320 2229Gopalganj 2959Muzaffarepure 4848 1177 999 400 19993Champarean west 1860Champaran east 1282 411Sitamarhi 1960 3342 5835 4570 1416 2621Sheohar 138 134Darbhanga 13,586 8068 21929 28521 6351 28657 19425Madubani 9495 71546 34699 93006 43809 79428Samastipur 2158Jamui 1257 1160 539Banka 11321 2239 1177 10065 11168Saharsa 227 7767 599 375 493 347 207Supaul 167 271Madhepura 81 73KishanganjArariaAverage for Non-bank districts 10683.25 3864.31 10652.93 7467.07 10403 10423.4 16927.4
Source: Bihar through Figures, 2005, 2007, Directorate of Economics and Statistics, Govt. of Bihar, Patna
Report Code: 018_GBP_IIT_SEC_ANL_04_Ver 1_Dec 2011
43 | P a g e
Table A.18. District-wise Gross Area Irrigated from Tube well (in Hectares)Districts 1970-71 1980-81 2000-01 2001-02 2002-03 2003-04 2004-05 2005-06Patna 144651 93757 127071 128603 133043 121049 120625 129169Vaisali 16618 66357 70612 68879 65655 80656 85669saran 34071 18239 80236 76236 76066 115231 79108 83048Begusarei 49577 88221 86449 88488 89416 84921 88499Buxar 38348 44726 46851 66410 43979 58024Bhagalpur 7,565 24306 48812 52742 62147 57797 70966 80449Khagaria 76748 75922 79919Katihar 28333 124990 119610 125372Lakhisarai 26526 30017 24090Purena 12,123 34266 137139 158949 160387 158775 151072 151344Shekhpura 41107 22356 33137Average for Bank districts 49602.5 37870.85 88896.75 92240.87 95154.12 81871.4 75962.2 81334.8Bojpur 34562 56716 25641 73897 125775 84567 83856Nalanda 97133 201158 153824 162774 164270 158970 125608Rohtas 76317 48198 39249 46645 36037 40935 31238Kaimur 49367 91404 55651 54414 13845 120614Gaya 73370 62666 137746 137446 157937 232303 124415 122484Jehanabad 117705 125693 97515 57759 47678 44763Arwal 18034 11102 19703Nawada 41841 98658 99800 101334 108831 74173 76382Aurangabad 15907 65266 28402 45854 65794 45826 18468siwan 49928 107754 116170 120037 93353 101027 113635Gopalganj 47156 45323 56292 58625 54027 69670 58949Muzaffarepure 28498 44877 126359 132278 132466 130164 132654 85774Champarean west 15702 49001 50538 47734 42971 58790 60753Champaran east 49457 164373 184194 156111 154450 164293 165385Sitamarhi 28189 58670 76688 69664 63661 55665 56995Darbhanga 33,578 15874 45698 43175 56482 95736 75119 79829Madubani 11458 40991 86726 69262 41113 91551 59216Samastipur 55739 113158 110688 111789 112387 113436 113715Jamui 30439 22353 20418Banka 50371 45621 47587 23793 55025 56950Saharsa 7969 38787 108400 93918 88633 84562 81993 78578Supaul 79426 71548 69471 73678 88359 82398Madhepura 61223 93073 80424 92954 94475 103481Kishanganj 37580 47644 47664 50535 49786 44377Araria 103066 11890 109318 110962 103199 88841Average for Non-bank districts 35853.75 42849.56 85487.26 83560.95 87255.39 84720.08 78356.24 76496.4
Source: Bihar through Figures, 2005, 2007, Directorate of Economics and Statistics, Govt. of Bihar, Patna

Report Code: 018_GBP_IIT_SEC_ANL_04_Ver 1_Dec 2011
44 | P a g e
Table A.19. District-wise Gross Area Irrigated from Other Wells (in Hectares)
Districts 1970-71 1980-81 2000-01 2001-02 2002-03 2003-04 2004-05 2005-06
Patna 16614 1652 1851Vaisali 11251 7281 8847 8402 5043 1373saran 77976 31279Begusarei 705 112 113 111BuxarBhagalpur 6444 10784 1539 4050 1061KhagariaKatihar 3633Lakhisarai 25 19 10 95Purena 123 422Shekhpura 85 310Average for Bank districts 25289.25 8532.28 2332.25 2631 3145.5 1606 734Bojpur 3492Nalanda 18895 528 544 541 29 7059Rohtas 6301Kaimur 3Gaya 41650 10868 955 2715JehanabadArwal 177Nawada 18608 9 10Aurangabad 3407 3527 1256 660 4811 4812 4348siwan 13232 188 188 185 79 193 158Gopalganj 834Muzaffarepure 7287 3495Champarean west 262Champaran east 730Sitamarhi 762Darbhanga 1,637 14Madubani 151Samastipur 3330Jamui 202 867 1164 1700Banka 668 245 76 167Saharsa 165 5874 4 324 324Supaul 1368MadhepuraKishanganjArariaAverage for Non-bank districts 12684.8 5640.93 867.42 600.12 630.88 1357.2 1727.33 3855
Source: Bihar through Figures, 2005, 2007, Directorate of Economics and Statistics, Govt. of Bihar, Patna

Report Code: 018_GBP_IIT_SEC_ANL_04_Ver 1_Dec 2011
45 | P a g e
Table A.19. District-wise Gross Area Irrigated from Other Sources (in Hectares)
Districts 1970-71 1980-81 2000-01 2001-02 2002-03 2003-04 2004-05 2005-06
Patna 89870 47229 26915 10522 7292 7391 6190Vaisali 2491 6938 9173 8866 6686 5138 6079saran 1313 41697 875 365Begusarei 6453 2407 2229 2246 12Buxar 8902 18896 10644 2936 2643 1458Bhagalpur 75148 46586 10001 14515 10520 2865Khagaria 1838 398 378 6645 5058 3903Katihar 4841Lakhisarai 3289 6816 9187 2937 4632 2652Purena 4966 6140 3360Shekhpura 6283 9455 6047 6984 397 2773Average for Bank districts 42824.25 22205.28 7770.33 8097.66 6897.5 5206.28 4009.66 2463.14
Bojpur 75935 7597 19133 9684 11538 10650 2684Nalanda 72835 12047 16868 15559 17437 14564 28556Rohtas 33390 698 856 11928 6395 9556Kaimur 3787 5377 11724 13630 14280 20800Gaya 320169 226754 8309 251 5251 2787 2363Jehanabad 8494 8851 8588 21845Arwal 1385 4516 206Nawada 74481 10961 15088 10181 3783 6537 625Aurangabad 62427 3598 4156 3917 9439 2355 36877Siwan 4572 10139 1053 4901 5070 2396 1481Gopalganj 4065 10820 2003 3366Muzaffarepure 10,119 9861 494Champarean west 4837 21446 7338 9276 5026 12257 15335Champaran east 9955 609Sitamarhi 4511 1182 2390 2425 1960 264 321Darbhanga 18,557 9145 11140 5957 282 5764Madubani 7838 7706 4264 4542 4432 4930Samastipur 12173 3 46Jamui 12622 4279 9351 3297 3113 2667Banka 22093 3305 7276 499 447Saharsa 3,087 19638 6707 4492 6292 4401 3996 9513Supaul 2510 2117 2010 813 567Madhepura 19792 7203 11907 7302 446Kishanganj 77 319Araria 1776Average (Non-bank ) 87983 39526.06 7691.95 5851.11 6971.64 6309.88 5207.68 10436.6
Source: Bihar through Figures, 2005, 2007, Directorate of Economics and Statistics, Govt. of Bihar, Patna
Table A.20. Rainfall in Bihar in mm (1971-2007)
Year 1971 1981 1991 2001 2002 2003 2004 2005 2006 2007
Rainfall 49249.55 41004.09 40968.45 27923.15 29368.1 39904.2 37706.1 31194.8 37229.3 53516Source: Indian Harvest Database, CMIE

Report Code: 018_GBP_IIT_SEC_ANL_04_Ver 1_Dec 2011
46 | P a g e
Table A.21. District-wise Rainfall in Bihar (in mm)
DistrictDec-61
Dec-71
Dec-81
Dec-86
Dec-91
Dec-96
Dec-01
Dec-02
Dec-03
Dec-04
Dec-05
Dec-06
Dec-07
Begusarai 1007 1327 999 992 1106 773 758 762 1225 804 732 903 1592
Bhagalpur 1004 1363 1083 997 1292 970 866 853 0 0 1134 1178 1249
Buxar 1084 1272 1137 1049 1077 762 583 691 922 454 735 777 934
Katihar 1085 1426 1203 1091 1412 1157 1018 986 1802 2194 993 1146 1224
Khagaria 990 1328 1013 973 1104 842 803 793 1512 908 1007 1024 1472
Lakhisarai 1017 1331 1009 994 1207 794 760 758 1237 724 986 1526 1450
Munger 1003 1347 1030 984 1227 859 800 792 0 1006 1003 983 1109
Patna 1055 1287 1017 1054 1125 739 662 719 745 608 710 1065 1493
Purnia 1064 1397 1166 1067 1260 1082 988 951 1654 2299 1149 1155 1403
Saran 1050 1264 1059 1076 924 769 614 722 1082 837 926 941 1602
Sheikpura 1046 1326 1004 1014 1212 761 727 737 885 489 571 1093 1246
Vaishali 1048 1298 1020 1068 1000 710 671 751 0 44 714 1196 1738
Average for Bank Districts 1038 1330 1062 1030 1162 852 771 793 922 864 888 1082 1376
Araria 1143 1489 1250 1152 1162 1091 1080 1030 1788 1582 1111 1137 1714
Aurangbad 1128 1311 1093 1118 1401 741 622 692 1345 608 599 967 1093
Banka 1054 1432 1141 1053 1485 961 871 866 967 1449 1028 1292 1617
Bhojpur 1067 1256 1065 1068 1074 758 598 696 1046 684 852 1040 1373Darbhanga 1024 1352 1053 1061 898 741 766 820 822 896 908 826 1611Gaya 1132 1340 1073 1128 1464 764 674 718 1011 694 500 1074 1273
Gopalganj 1084 1342 1277 1134 845 831 646 764 860 1220 857 1105 1815
Jamui 1086 1418 1122 1082 1489 888 812 814 1072 829 510 1270 1183Kaimur (Bhabua) 1157 1345 1233 1084 1315 767 647 719 1334 763 848 1080 1046Kishaganj 1357 1689 1484 1449 1551 1399 1339 1258 2417 2998 1299 1034 2172
Madhepur 1002 1326 1052 992 1068 890 856 838 1363 1439 1024 1190 1358
Madubani 1052 1383 1133 1123 919 785 825 875 660 878 781 685 1805Muzaffarpur 1052 1345 1087 1119 852 760 690 795 1051 958 835 1058 2272Nalanda 1057 1306 1006 1036 1200 733 693 721 1080 503 496 940 1258
Nawada 1100 1381 1083 1092 1450 811 737 754 1061 654 661 1208 1179
W. Champaran 1263 1645 1828 1488 1094 1041 861 1000 1775 1270 1100 999
E Champran 1126 1439 1337 1271 869 895 736 856 1236 1634 1071 1089 2042
Rohtas 1134 1315 1163 1093 1307 756 625 705 930 661 731 902 977
Saharsa 988 1313 1013 975 1035 836 812 800 983 965 612 864 1271
Samastpur 1013 1321 996 1017 999 728 733 766 1269 827 577 1031 1695
Sheoha 1093 1403 1200 1217 849 836 723 836 147 1748 1269 868 1605
Sitamarhi 1112 1458 1264 1269 885 833 800 896 1558 1343 976 895 1725
Siwan 1061 1296 1182 1079 821 800 611 727 1420 1015 803 811 1386
Supaul 1054 1380 1129 1069 991 894 915 904 1648 1721 1089 879 1450
Average for Non-bank Districts 1094 1395 1120 1220 1157 1030 843 755 824 1203 1184 889 955Source: Indian Harvest Database, CMIE
Table A.22. Construction of Deep Tubewells and Dugwell in Bihar
1994-95 1995-96 1996-97 1997-98 1998-99 1999-00 2000-01
Deep Tubewell 202 158 132 48 36 43 43Dug well 11380 8149 5096 3602 2467 1415 1039

Report Code: 018_GBP_IIT_SEC_ANL_04_Ver 1_Dec 2011
47 | P a g e
Table A.23. Distribution of Deep Tube-wells According to the Farmers in Bihar
Name of DistrictMarginal Small Medium Big
Total( 0 - 1 ha ) ( 1 - 2 ha) ( 2 - 10 ha) ( > 10 ha)
Aurangabad 0 0 0 0 0Banka 0 0 0 0 0Begusarai 0 0 0 0 0Bhagalpur 0 0 0 0 0Bhojpur 0 0 0 0 0Buxar 0 1 0 0 1Darbhanga 0 0 0 0 0East Champaran 0 0 0 0 0Gaya 0 0 2 1 3Gopaalganj 0 0 0 0 0Jamui 0 0 0 0 0Jehanabad 0 0 0 3 3Kaimur (Bhabua) 0 0 0 1 1Katihar 0 0 0 0 0Khagaria 0 0 0 0 0Kishanganj 0 0 0 0 0Lakhisarai 0 0 0 0 0Madhepura 0 0 0 0 0Madhubani 24 16 12 2 54Munger 0 0 0 0 0Muzaffarpur 0 0 0 0 0Nalanda 0 0 0 0 0Nawada 0 3 13 4 20Patna 1 1 0 0 2Purnia 0 0 0 0 0Rohtas(Sasaram) 0 0 0 15 15Saharsa 0 0 0 0 0Samastipur 0 0 0 0 0Saran 0 0 0 0 0Shekhpura 0 0 0 0 0 Source: Minor irrigation Census, 2001, Ministry of Water Resources, Govt. of India

Report Code: 018_GBP_IIT_SEC_ANL_04_Ver 1_Dec 2011
48 | P a g e
Table A.24. Construction of Deep Tube-wells in Bihar
Name of DistrictUpto
1993-941994-95 1995-96 1996-97 1997-98 1998-99 1999-00 2000-01 Total
Aurangabad 84 4 4 1 2 1 0 0 96Banka 3 0 0 0 0 0 0 0 3Begusarai 225 11 8 7 0 0 0 1 252Bhagalpur 150 2 2 0 0 0 0 1 155Bhojpur 121 15 1 4 0 0 0 1 142Buxar 144 3 6 0 2 0 0 0 155Darbhanga 203 8 1 3 0 1 0 0 216East Champaran 195 12 7 14 3 10 25 16 282Gaya 36 0 0 9 4 4 1 5 59Gopaalganj 49 3 1 1 0 0 0 2 56Jamui 3 0 0 0 0 0 0 0 3Jehanabad 23 2 2 9 0 0 0 0 36Kaimur (Bhabua) 127 2 0 2 3 1 9 3 147Katihar 65 1 0 0 0 0 0 1 67Khagaria 118 1 2 1 0 2 2 0 126Kishanganj 10 0 0 0 0 0 0 0 10Lakhisarai 45 0 0 0 0 0 0 0 45Madhepura 31 0 2 2 0 0 0 0 35Madhubani 494 52 42 26 17 6 2 3 642Munger 2 0 0 0 0 0 0 0 2Muzaffarpur 232 7 1 3 1 2 0 3 249Nalanda 138 9 27 4 6 0 0 4 188Nawada 94 25 16 13 1 1 0 0 150Patna 288 8 6 1 0 2 2 1 308Purnia 3 0 0 0 0 0 0 0 3Rohtas(Sasaram) 77 1 1 6 1 0 1 1 88Saharsa 15 0 0 0 0 0 0 0 15Samastipur 246 8 1 2 0 0 0 0 257Saran 103 4 8 21 8 6 1 0 151Shekhpura 93 24 20 3 0 0 0 1 141
Source: Minor irrigation Census, 2001, Ministry of Water Resources, Govt. of India
Report Code: 018_GBP_IIT_SEC_ANL_04_Ver 1_Dec 2011
49 | P a g e
Table A.25. Distribution of Deep Tube-wells in Bihar
Name of District Govt.Coop
Societies.Panchayat
Group of farmers
Individual Farmers
Others Total
Araria 0 0 0 1 13651 0 13652Aurangabad 10 0 0 4 8575 0 8589Banka 10 0 0 1 5505 0 5516Begusarai 90 0 0 2 21088 0 21180Bhagalpur 1 0 1 2 11894 7 11905Bhojpur 11 0 3 1 18291 0 18306Buxar 0 0 0 0 13782 35 13817Darbhanga 0 0 0 0 12569 0 12569East Champaran 0 1 1 0 34902 0 34904Gaya 130 14 23 12 24621 10 24810Gopaalganj 3 2 0 11 21227 0 21243Jamui 4 8 0 0 3958 0 3970Jehanabad 7 0 1 0 19794 0 19802Kaimur (Bhabua) 6 1 0 0 12663 0 12670Katihar 4 1 0 0 34147 0 34152Khagaria 1 0 0 0 14080 0 14081Kishanganj 2 2 0 0 10432 0 10436Lakhisarai 0 0 0 4 7131 0 7135Madhepura 2 0 1 0 17658 0 17661Madhubani 97 4 1 1 15323 281 15707Munger 87 5 0 0 3280 0 3372Muzaffarpur 3 1 0 0 34611 0 34615Nalanda 13 2 0 6 21015 2 21038Nawada 9 1 7 0 17460 1 17478Patna 19 1 0 0 27906 4 27930Purnia 2 1 0 0 22437 0 22440Rohtas(Sasaram) 8 2 0 2 20872 1 20885Saharsa 0 0 0 0 11784 0 11784Samastipur 0 0 0 0 31427 3 31430Saran 13 27 0 1 22971 0 23012Source: Minor irrigation Census, 2001, Ministry of Water Resources, Govt. of India

Report Code: 018_GBP_IIT_SEC_ANL_04_Ver 1_Dec 2011
50 | P a g e
Table A.26. Construction of Dugwells in Bihar
Name of DistrictUpto
1993-941994-95 1995-96 1996-97 1997-98 1998-99 1999-00 2000-01 Total
Aurangabad 4797 474 404 175 171 119 44 19 6203Banka 5481 757 504 262 315 224 150 154 7847Bhagalpur 2045 553 749 714 418 236 85 88 4888Bhojpur 2307 135 36 16 28 23 32 20 2597Buxar 569 89 60 23 28 15 5 0 789East Champaran 20 1 1 0 0 0 0 0 22Gaya 12630 1817 1192 785 631 425 233 169 17882Gopaalganj 4494 41 23 18 3 1 0 0 4580Jamui 6013 812 591 398 317 270 195 99 8695Jehanabad 2019 246 135 87 22 16 9 3 2537Kaimur (Bhabua) 6660 845 519 217 153 97 47 58 8596Katihar 15 0 0 0 0 0 0 0 15Lakhisarai 548 163 95 84 110 48 23 64 1135Madhepura 4 0 0 0 0 0 0 0 4Madhubani 121 0 0 0 0 0 0 0 121Munger 2892 253 137 109 42 22 1 4 3460Muzaffarpur 104 0 3 0 1 0 0 0 108Nalanda 12716 2499 1842 1375 934 697 366 301 20730Nawada 2959 1181 1037 122 68 35 40 21 5463Patna 3962 540 243 115 64 29 15 3 4971Rohtas (Sasaram) 5361 283 276 175 225 153 134 32 6639Saran 11246 218 114 328 14 28 32 1 11981Shekhpura 413 70 68 45 12 9 0 2 619Siwan 13788 323 78 29 36 17 0 1 14272Vaishali 865 80 42 19 10 3 4 0 1023Bihar 102029 11380 8149 5096 3602 2467 1415 1039 135177
Source: Minor irrigation Census, 2001, Ministry of Water Resources, Govt. of India

Report Code: 018_GBP_IIT_SEC_ANL_04_Ver 1_Dec 2011
51 | P a g e
Table A.27. Distribution of Dugwells According to Farmers’ Holding Size in Bihar
Name of DistrictMarginal( 0 - 1 ha )
Small( 1 - 2 ha)
Medium( 2 - 10 ha)
Big ( > 10 ha)
Total
Aurangabad 2211 2020 1596 191 6018Banka 4250 2187 809 55 7301Bhagalpur 3288 1056 461 60 4865Bhojpur 802 1156 562 28 2548Buxar 230 296 207 11 744East Champaran 2 14 6 0 22Gaya 8342 5642 3225 194 17403Gopaalganj 2148 1688 532 39 4407Jamui 4469 2468 668 32 7637Jehanabad 937 954 478 35 2404Kaimur (Bhabua) 2109 2823 3061 550 8543Katihar 0 3 10 2 15Lakhisarai 859 193 79 3 1134Madhepura 0 3 0 0 3Madhubani 45 56 15 1 117Munger 2358 712 138 32 3240Muzaffarpur 18 72 8 0 98Nalanda 8798 7781 3652 318 20549Nawada 3362 1138 448 51 4999Patna 1946 1788 905 111 4750Rohtas (Sasaram) 1713 2105 2526 200 6544Saran 8090 3088 665 47 11890Shekhpura 208 248 115 21 592Siwan 7615 4847 1357 88 13907Vaishali 507 368 136 7 1018Bihar 64307 42706 21659 2076 13074Source: Minor irrigation Census, 2001, Ministry of Water Resources, Govt. of India
Table A.28. Fertilizer Consumption in Bihar (in 000' tonnes)
Year Nitrogenous Phosphate Potash Total1971 65.36 (79.3%) 12.45 (15.1%) 4.65 (5.6%) 82.461976 98.53 (81.6%) 14.91 (12.4%) 7.26 (6.0%) 120.71981 148.51 (79.4%) 25.74 (13.8%) 12.8 (6.8%) 187.051986 326.45 (70.3%) 96.31 (20.7%) 41.89 (9.0%) 464.651996 506.64 (78.3%) 99.79 (15.4%) 40.72 (6.3%) 647.152001 607.57 (75.1%) 163.68 (20.2%) 37.6 (4.6%) 808.852006 708.25 (75.4%) 131.98 (14.1%) 98.7 (10.5%) 938.932007 807.84 (75.7%) 176.1 (16.5%) 82.78 (7.8%) 1066.722008 892.8 (77.3%) 183.95 (15.9%) 77.95 (6.8%) 1154.72009 885.06 (67.9%) 252.99 (19.4%) 165.53 (12.7%) 1303.582010 843.69 (67.0%) 247.45 (19.7%) 168.02 (13.3%) 1259.16
Note: Figures in parentheses are the percentage share of the total.Source: Indian Harvest Database, CMIE

Report Code: 018_GBP_IIT_SEC_ANL_04_Ver 1_Dec 2011
52 | P a g e
Table A.29. District-wise Consumption of Nitrogen Fertilizer (in ’000 Tonnes)
DistrictDec71
Dec76
Dec81
Dec86
Dec96
Dec01
Dec06
Dec07
Dec08
Dec09
Dec10
Patna 10.96 7.76 11.12 23.17 34.38 30.44 39.87 42.88 45.45 46.31 40.38Baxur 11.15 12.38 17.53 23.26 19.89 22.03Saran 11.7 4.43 6.58 11.09 18.36 18.65 17.66 21.71 31.66 25.1 24.69Vaishali 2.17 2.78 6.6 12.79 21.36 27.04 29.56 1.59 35.26 39.68Begusarai 3.29 4.71 9.31 17.97 24.25 24.49 25.74 33.21 29.06 28.04Munger 6.29 4.84 7.1 10.53 16.13 6.38 3.34 5.56 31.66 5.97 5.9Sheikhpura 4.23 7.68 6.49 6.51 7.88 5.96Lakhisarai 5.65 3.9 6.53 4.78 6.86 6.9Khagaria 4.71 13.77 21.35 28.15 27.44 26.19 32.48 32.39Bhagalpur 1.46 3.54 7.83 11.44 36.3 25.32 23.25 29.67 12.14 39.53 34.46Purnea 1.86 2.54 4.22 18.17 21.15 22.96 31.84 35.52 16.45 45.74 44.62Katihar 1.03 1.15 6.17 11.98 14.66 21.96 21.29 12.26 29.37 28.03Average for Bank Districts 6.45 3.7 5.69 11.24 20.31 17.2 20.13 22.49 20.43 26.95 26.09Nalanda 5.84 8.48 19.9 34.63 27.05 26.49 33.58 36.34 35.6 31.97Bhojpur 14.4 8.57 13.99 26.71 31.89 30.05 33.7 42.37 51.79 45.35 42.83Rohtas 10.21 15.66 38.33 37.9 36.44 33.94 40.61 48.91 45.11 40.11Kaimur 11.4 11.38 18.11 19.13 17.94Gaya 3.12 5.3 13.71 21.76 21.11 27.59 29.68 33.5 41.82 38.91 30.33Jehanabad 10.96 12.63 10.96 16.23 11.58 12.73 10.24Arwal 5.61 5.02Nawada 2.08 8.41 16.85 16.51 10.89 13.35 4.23 14.22 12.57Aurangabad 2.35 3 13.93 25.47 22.03 24.98 15.13 28.71 27.99Siwan 3.19 4.04 8.37 8.87 9.12 15.44 19.32 22.42 21.64 20.96Gopalganj 2.67 7.6 13.33 8.53 6.43 7.64 12.23 22.11 16.33 15.2Muzaffarpur 4.89 5.77 8.44 10.87 20.24 29.25 39.8 42.45 13.2 51.03 46.76E. Champaran 2.77 6.59 8.13 14.36 34.01 50.64 53.39 50.8W. Champaran 3.11 4.81 10.67 22.3 37.73 46.53 46.23 55.69 48.57 47.26Sitamarh 2.11 3.42 6.9 9.9 18.69 10.74 18.03 46.42 22.15 24.28Seohar 0.72 0.52 2.16 20.12 2.57 2.39Darbhanga 5.64 1.93 1.96 4.62 12.35 20.55 21.06 17.18 31.28 22.68 19.74Madhubani 1.28 1.71 3.89 4.14 9.19 7.61 11.13 20.37 13.17 13.54Samastipur 3.38 4.79 10.01 16.14 26.42 32.12 32.79 10.25 35.33 36.69Jamui 3.23 10.79 10.84 7.43 14.6 13.13Banka 7.19 4.15 10.28 37.35 11.62 12.03Saharsa 2.27 1.75 3.28 5.9 13.93 10.58 8.23 12.86 8.19 13.1 16.39Supaul 5.66 3.08 6.92 12.94 6.52 7.69Madhepura 2.8 7.3 9.07 14.48 12.26 15.26 5.56 14.94 15.19Kisanganj 4.47 4.21 4.6 7.19 50.23 6.59 4.97Araria 6.52 10.58 12.41 15.04 5.37 15.4 15.39Average for Non-bank Districts 3.96 2.21 3.03 6.44 9.57 10.96 10.63 13.31 21.29 14.89 15.12
Source: Indian Harvest Database, CMIE
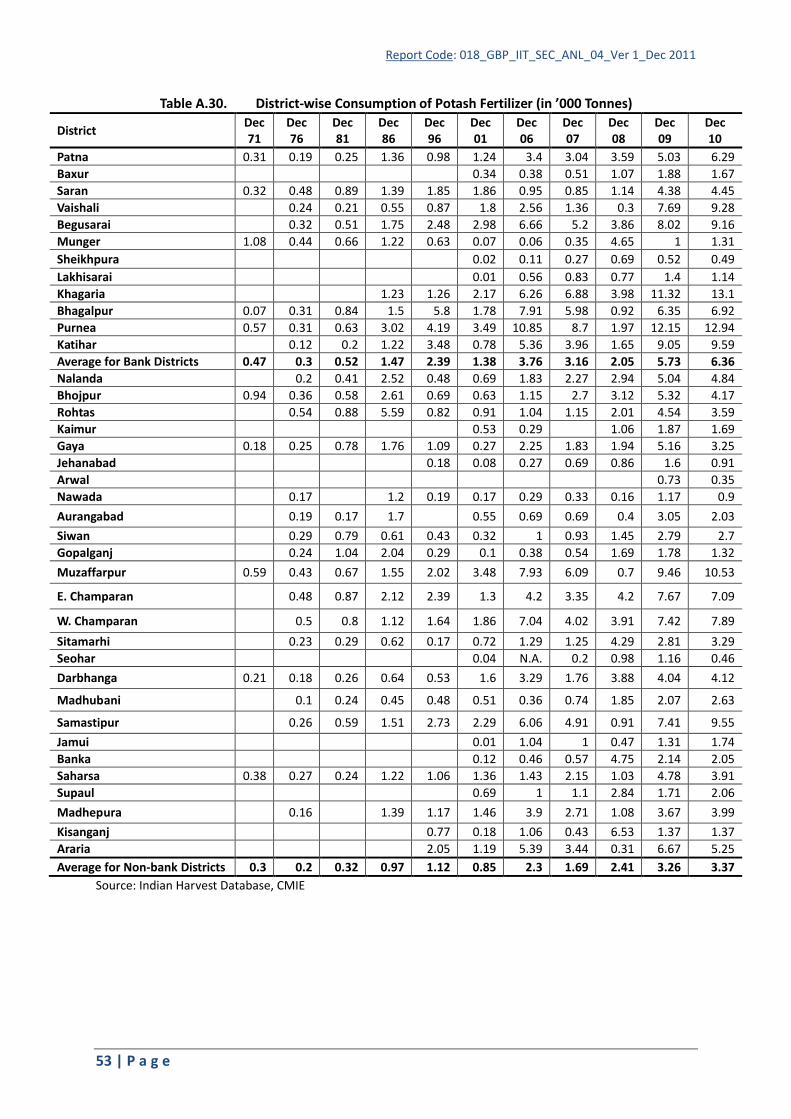
Report Code: 018_GBP_IIT_SEC_ANL_04_Ver 1_Dec 2011
53 | P a g e
Table A.30. District-wise Consumption of Potash Fertilizer (in ’000 Tonnes)
DistrictDec71
Dec76
Dec81
Dec86
Dec96
Dec01
Dec06
Dec07
Dec08
Dec09
Dec10
Patna 0.31 0.19 0.25 1.36 0.98 1.24 3.4 3.04 3.59 5.03 6.29Baxur 0.34 0.38 0.51 1.07 1.88 1.67Saran 0.32 0.48 0.89 1.39 1.85 1.86 0.95 0.85 1.14 4.38 4.45Vaishali 0.24 0.21 0.55 0.87 1.8 2.56 1.36 0.3 7.69 9.28Begusarai 0.32 0.51 1.75 2.48 2.98 6.66 5.2 3.86 8.02 9.16Munger 1.08 0.44 0.66 1.22 0.63 0.07 0.06 0.35 4.65 1 1.31Sheikhpura 0.02 0.11 0.27 0.69 0.52 0.49Lakhisarai 0.01 0.56 0.83 0.77 1.4 1.14Khagaria 1.23 1.26 2.17 6.26 6.88 3.98 11.32 13.1Bhagalpur 0.07 0.31 0.84 1.5 5.8 1.78 7.91 5.98 0.92 6.35 6.92Purnea 0.57 0.31 0.63 3.02 4.19 3.49 10.85 8.7 1.97 12.15 12.94Katihar 0.12 0.2 1.22 3.48 0.78 5.36 3.96 1.65 9.05 9.59Average for Bank Districts 0.47 0.3 0.52 1.47 2.39 1.38 3.76 3.16 2.05 5.73 6.36Nalanda 0.2 0.41 2.52 0.48 0.69 1.83 2.27 2.94 5.04 4.84Bhojpur 0.94 0.36 0.58 2.61 0.69 0.63 1.15 2.7 3.12 5.32 4.17Rohtas 0.54 0.88 5.59 0.82 0.91 1.04 1.15 2.01 4.54 3.59Kaimur 0.53 0.29 1.06 1.87 1.69Gaya 0.18 0.25 0.78 1.76 1.09 0.27 2.25 1.83 1.94 5.16 3.25Jehanabad 0.18 0.08 0.27 0.69 0.86 1.6 0.91Arwal 0.73 0.35Nawada 0.17 1.2 0.19 0.17 0.29 0.33 0.16 1.17 0.9Aurangabad 0.19 0.17 1.7 0.55 0.69 0.69 0.4 3.05 2.03Siwan 0.29 0.79 0.61 0.43 0.32 1 0.93 1.45 2.79 2.7Gopalganj 0.24 1.04 2.04 0.29 0.1 0.38 0.54 1.69 1.78 1.32Muzaffarpur 0.59 0.43 0.67 1.55 2.02 3.48 7.93 6.09 0.7 9.46 10.53
E. Champaran 0.48 0.87 2.12 2.39 1.3 4.2 3.35 4.2 7.67 7.09
W. Champaran 0.5 0.8 1.12 1.64 1.86 7.04 4.02 3.91 7.42 7.89
Sitamarhi 0.23 0.29 0.62 0.17 0.72 1.29 1.25 4.29 2.81 3.29Seohar 0.04 N.A. 0.2 0.98 1.16 0.46Darbhanga 0.21 0.18 0.26 0.64 0.53 1.6 3.29 1.76 3.88 4.04 4.12
Madhubani 0.1 0.24 0.45 0.48 0.51 0.36 0.74 1.85 2.07 2.63
Samastipur 0.26 0.59 1.51 2.73 2.29 6.06 4.91 0.91 7.41 9.55Jamui 0.01 1.04 1 0.47 1.31 1.74Banka 0.12 0.46 0.57 4.75 2.14 2.05Saharsa 0.38 0.27 0.24 1.22 1.06 1.36 1.43 2.15 1.03 4.78 3.91Supaul 0.69 1 1.1 2.84 1.71 2.06Madhepura 0.16 1.39 1.17 1.46 3.9 2.71 1.08 3.67 3.99Kisanganj 0.77 0.18 1.06 0.43 6.53 1.37 1.37Araria 2.05 1.19 5.39 3.44 0.31 6.67 5.25Average for Non-bank Districts 0.3 0.2 0.32 0.97 1.12 0.85 2.3 1.69 2.41 3.26 3.37
Source: Indian Harvest Database, CMIE

Report Code: 018_GBP_IIT_SEC_ANL_04_Ver 1_Dec 2011
54 | P a g e
Table A.31. District-wise Consumption of Phosphate Fertilizer (in ’000 Tonnes)
DistrictDec71
Dec76
Dec81
Dec86
Dec96
Dec01
Dec06
Dec07
Dec08
Dec 09
Dec10
Patna 1.36 0.6 0.8 3.32 5.08 10.26 11.3 10.06 9.69 12.56 12.47Baxur 1.15 1.13 3.15 3.84 4.51 5.07Saran 0.06 0.88 1.6 2.51 6.44 7.11 2.74 3.68 5.93 8.33 7.26Vaishali 0.41 0.66 2.26 3.84 5.13 3.69 5.45 0.55 15.01 13.47Begusarai 0.44 0.96 3.43 4.52 10.19 7.04 9.06 7.88 11.66 10.33Munger 2.44 0.72 1.1 3.08 1.59 0.55 0.16 1.01 8.92 1.78 2.33Sheikhpura 0.59 0.43 1.34 2.29 1.21 1.33Lakhisarai 0.69 0.82 1.36 1.42 3.02 2.5Khagaria 1.53 3.45 5.92 3.33 6.88 6.24 10.4 10.31Bhagalpur 0.15 0.39 1.47 2.5 8.12 10.42 6.39 6.76 2.9 6.89 8.24Purnea 1.32 0.86 1.08 6.95 5.87 5.59 9.22 9.85 3.99 10.22 9.62Katihar 0.24 0.25 3.02 2.08 7.52 5.78 5.58 4.21 8.99 8.93Average for Bank Districts 1.07 0.57 0.99 3.18 4.55 5.43 4.34 5.35 4.82 7.88 7.66Nalanda 0.45 0.78 4.83 3.02 5.73 4.35 6.99 7.09 9 9.07Bhojpur 5.18 1.15 1.71 6.04 3.18 4.69 4.8 7.79 10.3 9.47 10.24Rohtas 1.48 2.58 12.76 6.38 10.21 3.53 6.8 8.85 9.54 9.6Kaimur 2.48 0.99 3.49 4.68 4.94Gaya 0.47 0.6 1.57 4.62 6.72 5.18 6.91 6.14 7.74 8.91 8.28Jehanabad 0.94 1.82 1.13 2.28 2.63 3.26 3.75Arwal 2.5 2.25Nawada 0.34 2.53 3.09 2.17 1.16 1.75 0.92 3.1 2.48Aurangabad 0.35 0.48 4.03 4.08 2.54 4.43 1.54 6.5 6.83Siwan 0.74 1.1 2.68 1.53 2.05 2.27 3.85 5.22 7.37 6.95Gopalganj 0.82 1.7 4.78 0.74 0.81 0.64 2.21 5.53 4.58 4.73Muzaffarpur 0.16 0.73 1.3 4.39 6.45 8.3 8.17 8.92 3.2 13.97 12.68E. Champaran 0.65 1.52 4.31 5.46 7.43 6.33 9.3 9.01 11.28 11.97W. Champaran 0.78 1.43 3.22 2.71 9.16 8.73 11.39 8.09 12.08 11.15Sitamarhi 0.27 0.45 1.32 0.44 2.71 1.92 2.99 10.56 5.6 6.05Seohar 0.06 N.A. 0.37 3.97 1.05 0.89Darbhanga 0.29 0.29 0.41 1.38 4.52 6.92 4.75 5.04 9.1 8.25 6.79
Madhubani 0.32 0.47 1.78 0.59 2.62 0.92 2.36 5.15 5.3 4.47
Samastipur 0.39 1.6 3.66 6.02 9.44 6.29 7.67 2.55 10.54 10.79Jamui 0.47 2.81 2.96 1.01 2.69 2.88Banka 0.98 0.92 1.61 4.79 1.89 2.34Saharsa 1.02 0.42 0.72 2.27 2.06 2.47 1.35 3.1 1.83 3.81 4.42Supaul 2.11 1.07 2.05 2.76 2.14 2.32Madhepura 0.59 3.11 2.48 3.73 2.42 4.72 1.42 3.81 3.87Kisanganj 0.39 0.13 1.23 1.23 8.4 1.53 1.21Araria 2.08 2.81 4.72 5.97 0.94 5.56 4.64Average for Non-bank Districts
0.66 0.38 0.73 2.25 2.32 2.87 2.58 3.34 4.37 4.35 4.22
Source: Indian Harvest Database, CMIE
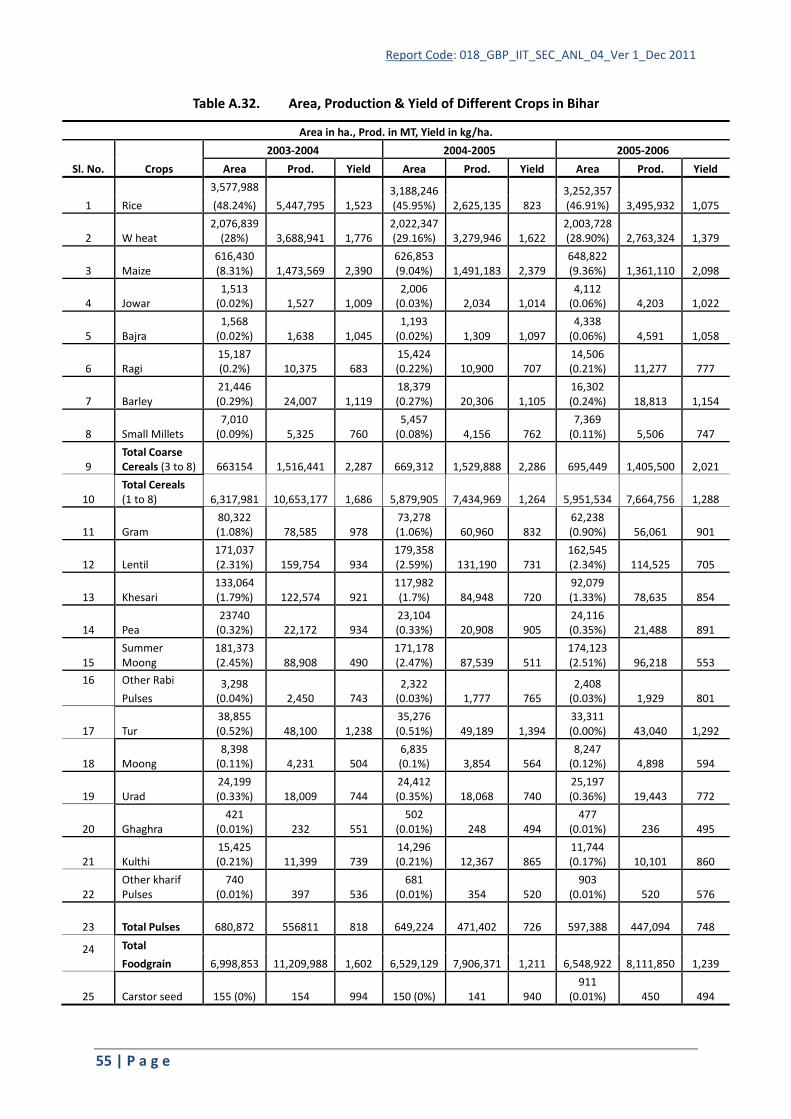
Report Code: 018_GBP_IIT_SEC_ANL_04_Ver 1_Dec 2011
55 | P a g e
Table A.32. Area, Production & Yield of Different Crops in Bihar
Area in ha., Prod. in MT, Yield in kg/ha.
Sl. No. Crops
2003-2004 2004-2005 2005-2006
Area Prod. Yield Area Prod. Yield Area Prod. Yield
1 Rice
3,577,988
5,447,795 1,523 3,188,246 (45.95%) 2,625,135 823
3,252,357 (46.91%) 3,495,932 1,075 (48.24%)
2 W heat2,076,839
(28%) 3,688,941 1,776 2,022,347 (29.16%) 3,279,946 1,622
2,003,728 (28.90%) 2,763,324 1,379
3 Maize616,430 (8.31%) 1,473,569 2,390
626,853 (9.04%) 1,491,183 2,379
648,822 (9.36%) 1,361,110 2,098
4 Jowar1,513
(0.02%) 1,527 1,009 2,006
(0.03%) 2,034 1,014 4,112
(0.06%) 4,203 1,022
5 Bajra1,568
(0.02%) 1,638 1,045 1,193
(0.02%) 1,309 1,097 4,338
(0.06%) 4,591 1,058
6 Ragi15,187 (0.2%) 10,375 683
15,424 (0.22%) 10,900 707
14,506 (0.21%) 11,277 777
7 Barley21,446 (0.29%) 24,007 1,119
18,379 (0.27%) 20,306 1,105
16,302 (0.24%) 18,813 1,154
8 Small Millets7,010
(0.09%) 5,325 760 5,457
(0.08%) 4,156 762 7,369
(0.11%) 5,506 747
9Total Coarse Cereals (3 to 8) 663154 1,516,441 2,287 669,312 1,529,888 2,286 695,449 1,405,500 2,021
10Total Cereals (1 to 8) 6,317,981 10,653,177 1,686 5,879,905 7,434,969 1,264 5,951,534 7,664,756 1,288
11 Gram80,322 (1.08%) 78,585 978
73,278 (1.06%) 60,960 832
62,238 (0.90%) 56,061 901
12 Lentil171,037 (2.31%) 159,754 934
179,358 (2.59%) 131,190 731
162,545 (2.34%) 114,525 705
13 Khesari133,064 (1.79%) 122,574 921
117,982 (1.7%) 84,948 720
92,079 (1.33%) 78,635 854
14 Pea23740
(0.32%) 22,172 934 23,104 (0.33%) 20,908 905
24,116 (0.35%) 21,488 891
15Summer Moong
181,373 (2.45%) 88,908 490
171,178 (2.47%) 87,539 511
174,123 (2.51%) 96,218 553
16 Other Rabi 3,298 (0.04%) 2,450 743
2,322 (0.03%) 1,777 765
2,408 (0.03%) 1,929 801 Pulses
17 Tur38,855 (0.52%) 48,100 1,238
35,276 (0.51%) 49,189 1,394
33,311 (0.00%) 43,040 1,292
18 Moong8,398
(0.11%) 4,231 504 6,835 (0.1%) 3,854 564
8,247 (0.12%) 4,898 594
19 Urad24,199 (0.33%) 18,009 744
24,412 (0.35%) 18,068 740
25,197 (0.36%) 19,443 772
20 Ghaghra421
(0.01%) 232 551 502
(0.01%) 248 494 477
(0.01%) 236 495
21 Kulthi15,425 (0.21%) 11,399 739
14,296 (0.21%) 12,367 865
11,744 (0.17%) 10,101 860
22Other kharif Pulses
740(0.01%) 397 536
681 (0.01%) 354 520
903 (0.01%) 520 576
23 Total Pulses 680,872 556811 818 649,224 471,402 726 597,388 447,094 748
24 Total
6,998,853 11,209,988 1,602 6,529,129 7,906,371 1,211 6,548,922 8,111,850 1,239Foodgrain
25 Carstor seed 155 (0%) 154 994 150 (0%) 141 940 911
(0.01%) 450 494
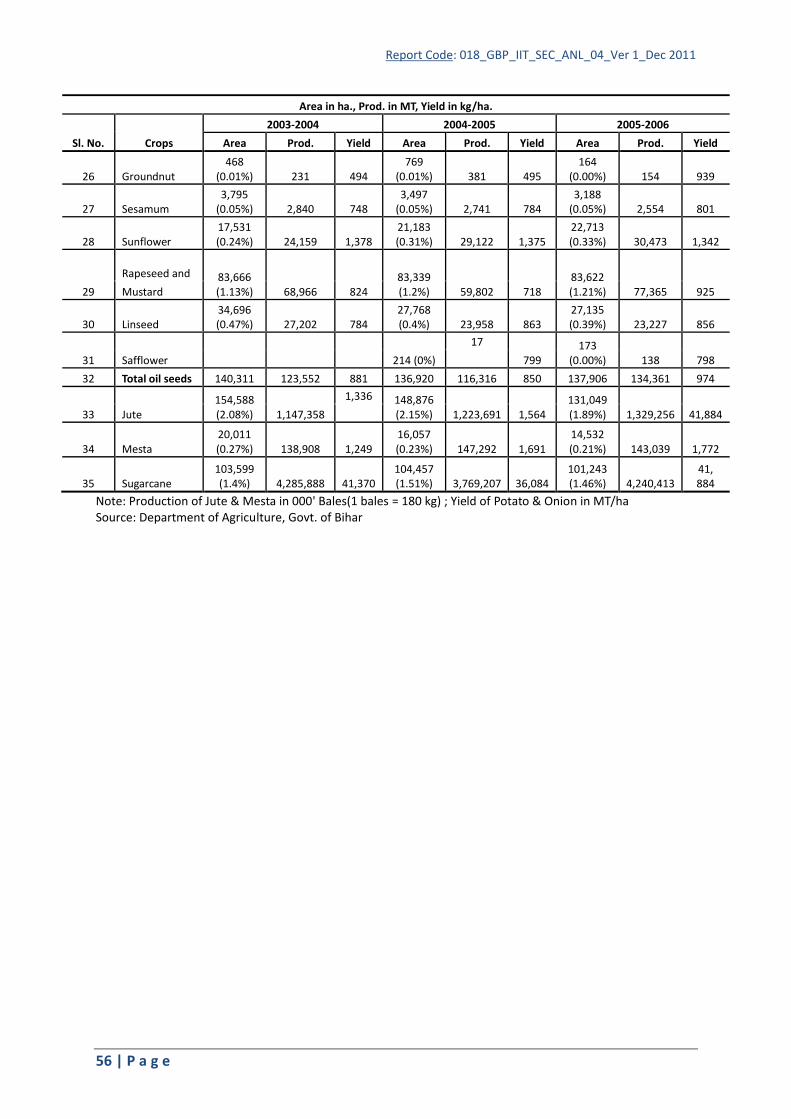
Report Code: 018_GBP_IIT_SEC_ANL_04_Ver 1_Dec 2011
56 | P a g e
Area in ha., Prod. in MT, Yield in kg/ha.
Sl. No. Crops
2003-2004 2004-2005 2005-2006
Area Prod. Yield Area Prod. Yield Area Prod. Yield
26 Groundnut468
(0.01%) 231 494 769
(0.01%) 381 495 164
(0.00%) 154 939
27 Sesamum3,795
(0.05%) 2,840 748 3,497
(0.05%) 2,741 784 3,188
(0.05%) 2,554 801
28 Sunflower17,531 (0.24%) 24,159 1,378
21,183 (0.31%) 29,122 1,375
22,713 (0.33%) 30,473 1,342
29
Rapeseed and 83,666 (1.13%) 68,966 824
83,339 (1.2%) 59,802 718
83,622 (1.21%) 77,365 925 Mustard
30 Linseed34,696 (0.47%) 27,202 784
27,768 (0.4%) 23,958 863
27,135 (0.39%) 23,227 856
31 Safflower 214 (0%)
17
799 173
(0.00%) 138 798
32 Total oil seeds 140,311 123,552 881 136,920 116,316 850 137,906 134,361 974
33 Jute154,588 (2.08%) 1,147,358
1,336 148,876 (2.15%) 1,223,691 1,564
131,049 (1.89%) 1,329,256 41,884
34 Mesta20,011 (0.27%) 138,908 1,249
16,057 (0.23%) 147,292 1,691
14,532 (0.21%) 143,039 1,772
35 Sugarcane103,599 (1.4%) 4,285,888 41,370
104,457 (1.51%) 3,769,207 36,084
101,243 (1.46%) 4,240,413
41, 884
Note: Production of Jute & Mesta in 000' Bales(1 bales = 180 kg) ; Yield of Potato & Onion in MT/haSource: Department of Agriculture, Govt. of Bihar

Report Code: 018_GBP_IIT_SEC_ANL_04_Ver 1_Dec 2011
57 | P a g e
Table A.33. Area, Production & Yield of Different Crops in Bihar
Area in ha., Prod. In MT, Yield in kg/ha.
Sl. No. Crops2006-2007 2007-2008
Area Prod. Yield Area Prod. Yield
1 Rice3,463,463
(48%)5,131,179 1,482
3,473,015 (48%)
4,472,679 1,288
2 W heat2,069,444
(29%)4,149,019 2,005
2,131,232 (29%)
4,974,663 2,334
3 Maize646,703
(9%) 1,754,410 2,713657,884
(9%) 1,857,009 2,823
4 Jowar3,688(0%)
3,804 1,0313,426 (0%)
3,762 1,098
5 Bajra4,708 (0%)
5,005 1,0633,497 (0%)
3,858 1,103
6 Ragi14,142
(0%)13,335 943
13,222 (0%)
7,998 605
7 Barley16,961
(0%)18,708 1,103
15,402 (0%)
18,513 1,202
8 Small Millets4,526 (0%) 3,391 749
7,000 (0%) 5,169 738
9Total CoarseCereals (3 to 8)
690,728 1,798,653 2,604 700,431 1,896,309 2,707
Total Cereals (1 to 8) 6,223,635 11,078,851 1,780 6,304,678 11,343,651 1,799
13 Gram 70,397 (1%)
59,609 847 64,105(1%)
63,473 990
14 Lentil166,785
(2%)121,098 726
158,487(2%)
126,134 796
15 Khesari102,872
(1%) 81,156 789 98,114
(1%) 82,348 839
16 Pea23,934
(0%)22,255 930
23,288 (0%)
25,083 1,077
17 Summer Moong155,887
(2%)79,888 512
156,044 (2%)
93,579 600
18 Other RabiPulses
3,287 (0%)
2,386 726 3,052 (0%)
2,261 0
19 Tur37,508
(1%)46,504 1,240
30,860 (0%)
42,667 1,383
20 Moong9,184 (0%)
6,023 656 8,834 (0%)
5,358 607
21 Urad24,891
(0%)19,348 777
22,366 (0%)
17,497 782
22 Ghaghra883 (0%)
637 721 994 (0%)
(0%)885 890
23 Kulthi13,926
(0%) 12,016 863 13,711
(0%) 12,739 929
24 Other kharifPuls868 (0%)
503 579 1,403(0%)
917 654
26 Total Pulses 610,422 451,423 740 581,258 472,941 81427 Total Foodgrain 6,834,057 11,530,274 1,687 6,885,936 11,816,592 1,716
28 Carstor seed115 (0%) 109 948
203(0%) 194 956
29 Groundnut1,006 (0%)
497 494 1,207(0%)
868 719
30 Sesamum 3,227 2,497 774 2,832 2,245 793

Report Code: 018_GBP_IIT_SEC_ANL_04_Ver 1_Dec 2011
58 | P a g e
Area in ha., Prod. In MT, Yield in kg/ha.
Sl. No. Crops2006-2007 2007-2008
Area Prod. Yield Area Prod. Yield(0%) (0%)
31 Sunflower21,513
(0%)28,590 1,329
22,052(0%)
30,646 1,390
32Rapeseed andMustard
86,101 (1%)
83,856 974 88,126
(1%)87,464 992
33 Linseed 29,638 (0%)
25,162 849 27,507(0%)
22,691(0%)
825
34 Safflower80
(0%)64 800
115(0%)
92 800
35 Total oil seeds 141,680 140,775 994 142,042 144,200 1,015
37 Jute132,644
(2%) 1,353,967 1,837131,627
(2%) 1,242,822 1,700
38 Mesta17,646
(0%)151,245 1,543
22,626 (0%)
209,564 1,667
40 Sugarcane117,494
(2%)5,416,400 46,092
107,039(1%)
4,027,229 37,624
Source: Department of Agriculture, Govt. of Bihar

Report Code: 018_GBP_IIT_SEC_ANL_04_Ver 1_Dec 2011
59 | P a g e
Table A.34. Area, Production & Yield of Different Crops in Bihar
Sl. No. Crops
Area in ha, Prod. In MT, Yield in kg/ha.
2008-2009 (Last Est.) 2009-2010 (Forth Adv. Est.)
Area Prod. Yield Area Prod. Yield
1 Rice3,495,734 (47.76%) 5,590,352 1,599
3,180,280 (44.77%) 3,620,690 1,138
2 W heat2,158,327 (29.49%)
4,410,017 2,0432,226,680 (31.34%)
4,623,000 2,076
3 Maize640,455 (8.75%)
1,714,001 2,676652,170 (9.18%)
1,713,930 2,628
4 Jowar2,399
(0.03%)2,540 1,059
3,930(0.06%)
4,310 1,097
5 Bajra2,969
(0.04%)3,599 1,212
4,170(0.06%)
4,990 1,197
6 Ragi11,435 (0.16%)
9,296 81310,680 (0.15%)
8,760 820
7 Barley14,592 (0.20%) 15,898 1,090
12,730 (0.18%) 14,140 1,111
8 Small Millets7,832
(0.11%)5,993 765
5,080(0.07%)
3,930 774
9Total CoarseCereals (3 to 8)
679,682 1,751,327 2,577 688,760 1,750,060 2,541
Total Cereals (1 to 8)
6,333,743 11,751,696 1,855 6,095,720 9,993,750 1,639
13 Gram61,214 (0.84%)
56,637 92560,330 (0.85%)
60,660 1,005
14 Lentil163,773 (2.24%)
128,599 785171,730 (2.42%)
147,800 861
15 Khesari97,195 (1.33%) 79,791 821
92,960 (1.31%) 94,790 1,020
16 Pea23,768 (0.32%)
22,865 96223,290 (0.33%)
22,850 981
17Summer Moong
162,666 (2.22%)
108,935 670160,690 (2.26%)
94,650 589
18Other RabiPulses
4,159(0.06%)
3,082 7413,670
(0.05%)2,700 736
19 Tur28,139 (0.38%)
33,119 1,17735,980 (0.51%)
49,910 1,387
20 Moong8,587
(0.12%)5,609 653
8,980(0.13%)
5,880 655
21 Urad21,444 (0.29%) 17,980 838
26,370 (0.37%) 22,460 852
22 Ghaghra2,060
(0.03%)1,360 660
23 Kulthi11,308 (0.15%)
10,404 92012,840 (0.18%)
10,750 837
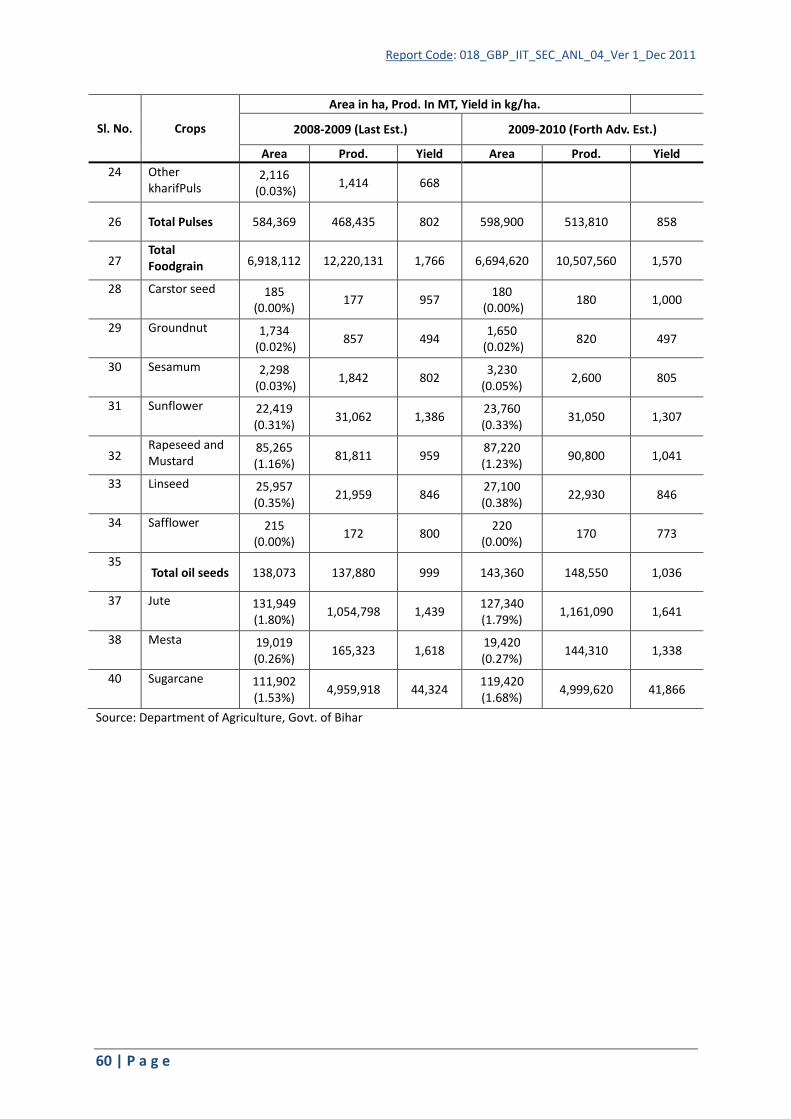
Report Code: 018_GBP_IIT_SEC_ANL_04_Ver 1_Dec 2011
60 | P a g e
Sl. No. Crops
Area in ha, Prod. In MT, Yield in kg/ha.
2008-2009 (Last Est.) 2009-2010 (Forth Adv. Est.)
Area Prod. Yield Area Prod. Yield24 Other
kharifPuls2,116
(0.03%)1,414 668
26 Total Pulses 584,369 468,435 802 598,900 513,810 858
27TotalFoodgrain 6,918,112 12,220,131 1,766 6,694,620 10,507,560 1,570
28 Carstor seed 185 (0.00%)
177 957 180(0.00%)
180 1,000
29 Groundnut 1,734(0.02%) 857 494
1,650(0.02%) 820 497
30 Sesamum 2,298(0.03%)
1,842 802 3,230
(0.05%)2,600 805
31 Sunflower 22,419 (0.31%)
31,062 1,386 23,760 (0.33%)
31,050 1,307
32Rapeseed andMustard
85,265 (1.16%)
81,811 959 87,220 (1.23%)
90,800 1,041
33 Linseed 25,957 (0.35%)
21,959 846 27,100 (0.38%)
22,930 846
34 Safflower 215 (0.00%)
172 800 220 (0.00%)
170 773
35Total oil seeds 138,073 137,880 999 143,360 148,550 1,036
37 Jute 131,949 (1.80%)
1,054,798 1,439 127,340 (1.79%)
1,161,090 1,641
38 Mesta 19,019 (0.26%)
165,323 1,618 19,420 (0.27%)
144,310 1,338
40 Sugarcane 111,902 (1.53%)
4,959,918 44,324 119,420 (1.68%)
4,999,620 41,866
Source: Department of Agriculture, Govt. of Bihar

Report Code: 018_GBP_IIT_SEC_ANL_04_Ver 1_Dec 2011
61 | P a g e
Table A.35. Area used for Production of Rice in the Districts of Bihar (in hectares)
District 2000-01 2001-02 2002-03 2003-04 2004-05 2006-07
Baghalpur 46448 46041 45960 45055 41693 48200Begusarai 23103 28367 29297 26902 24898 24451Buxar 84153 73347 67949 67878 58545 82536Katihar 125197 125811 130849 126839 116604 106491Khagaria 24885 28290 26283 23568 20276 22217Lakhisaria 31295 29093 33473 30314 28204 24520Patna 99926 104738 108394 100978 76258 88480Purnia 114767 120395 127367 120397 113594 123851Saran 92523 80174 87310 78924 81437 86752Sheikhpura 23987 13046 30373 29386 27218.8 39302Vaishali 62874 61511 62183 62188 60592 59596Monghyr 46774 38525 27926 38981 38474 59693Average For Bank Districts 64661 62445 64780 62618 57316.57 63841Araria 138639Arwal 31856 24656Aurangabad 131316 164109 176397 173050 105259 171133Banka 103299 100564 71841 99429Kaimur 99500 108673 94093 109947 95307 133136Bhojpur 108849 111618 111685 106433 96763 85454Champaran (East) 192009 201290 189667 170981 187580 212875Champaran (West) 186268 158125 160977 157932 169039 168920Darbhanga 92701 72738 94065 100718 93695 74855Gaya 143648 152985 147435 160989 72404 54595Gopalganj 92265 94283 94197 91125 89838 75801Jahanabad 86295 84043 61340 44571 34334 84720Kishanganj 112975 95883 87376 102693 102598 82768Madhubani 191082 179854 182561 176482 169632 158929Madhepura 85070 89465 86669 79125 76801 78281Muzaffarpur 130230 134716 146674 154116 151329 139377Nalanda 123926 87819 93295 99066 94061 95385Nawadha 82483 80834 81106 78474 37552 73308Rohtas 213648 197725 193291 195726 178297 166681Saharsa 102816 94029 94686 88143 79329 87740
Samastipur 87852 84598 84977 83803 63697 70238Sheohar 16141 26960 23524 25310 24164 23671Sitamarhi 91557 123360 106844 103388 71973 92512Siwan 105977 109711 105913 105036 113061 106790Supaul 116838 124978 116429 102061Jamui 47597 37981 53386 52784 48284Average For Non-Bank Districts 114737 113218 112096 108692 94717 107387Source: Bihar through Figures, 2007, Directorate of Economics and Statistics, Govt. of Bihar

Report Code: 018_GBP_IIT_SEC_ANL_04_Ver 1_Dec 2011
62 | P a g e
Table A.36. Production of Rice in the Districts of Bihar (in tonnes)
District 2000-01 2001-02 2002-03 2003-04 2004-05 2006-07Baghalpur 51776 57017 51558 57045 20412 114228Begusarai 23521 32663 28473 36330 12592 33919Buxar 225068 183073 170384 154420 22366 187071Katihar 160312 176206 168475 155497 105673 138899Khagaria 14715 14819 5977 22168 5156 19132Lakhisaria 47188 41233 48097 42299 15913 56289Monghyr 46774 38525 27926 38981 38474 59693Patna 202790 203542 218176 230566 43374 145350Purnia 165399 145730 145758 188409 90812 118237Saran 131329 97972 99238 141486 58822 97669Sheikhpura 31950 20193 57047 38431 2844 94300Vaishali 97965 88866 80475 44254 18675 46071Average (Bank Districts) 99899 91653 91799 95824 36259 92572Araria 142541Arwal 54084 19357Aurangabad 257326 345060 334134 312702 120193 444650Banka 145882 150537 97758 258065Kaimur 193229 271478 246883 341878 137845 310928Bhojpur 252862 243841 207493 224770 31775 226802Champaran (East) 237240 275936 264547 242179 117723 166100Champaran (West) 388842 270832 296371 227115 127864 167909Darbhanga 89287 65161 70097 102002 41056 65429Gaya 229902 257723 244069 246468 13502 80617Gopalganj 112602 124793 110118 134432 122631 89959Jahanabad 134133 163476 100679 80925 13230 156043Kishanganj 130584 98342 93800 146778 71253 75595Madhubani 216912 173059 141280 176318 46846 141393Madhepura 110802 95687 115228 117017 86041 89689Muzaffarpur 164967 144543 158660 165258 43067 95559Nalanda 116419 132648 83225 96891 17099 227246Nawadha 91166 131561 123596 127430 13022 147689Rohtas 544066 492175 465583 517411 465646 468067Saharsa 153859 92994 94089 107515 70393 86432Samastipur 94341 90791 66881 67996 12112 41689Sheohar 21644 32885 29540 12071 10866 12351Sitamarhi 102317 146387 111241 130879 33271 64415Siwan 133368 131447 130564 122387 109707 148459Supaul 142709 164591 119930 120735Jamui 50893 27598 70195 60080 20970 88727
Average (Non-Bank Districts) 173944 173110 160286 165189 78526 156684Source: Bihar through Figures, 2007, Directorate of Economics and Statistics, Govt. of Bihar

Report Code: 018_GBP_IIT_SEC_ANL_04_Ver 1_Dec 2011
63 | P a g e
Table A.37. Yield of Rice in the Districts of Bihar (in tonnes/hectare)
District 2000-01 2001-02 2002-03 2003-04 2004-05 2006-07Baghalpur 1.11 1.24 1.12 1.27 0.49 2.37
Begusarai 1.02 1.15 0.97 1.35 0.51 1.39
Buxar 2.67 2.5 2.51 2.27 0.38 2.27
Katihar 1.28 1.4 1.29 1.23 0.91 1.3
Khagaria 0.59 0.52 0.23 0.94 0.25 0.86
Lakhisaria 1.51 1.42 1.44 1.4 0.56 2.3
Monghyr 1.5 1.44 1.19 1.5 1.5 1.99
Patna 2.03 1.94 2.01 2.28 0.57 1.64
Purnia 1.44 1.21 1.14 1.56 0.8 0.95
Saran 1.42 1.22 1.14 1.79 0.72 1.13
Sheikhpura 1.33 1.55 1.88 1.31 0.33 2.4
Vaishali 1.56 1.44 1.29 0.71 0.31 0.77
Average (Bank Districts) 1.46 1.42 1.35 1.47 0.61 1.61
Araria 1.03Arwal 1.7 0.79Aurangabad 1.96 2.1 1.89 1.81 1.14 2.6
Banka 1.41 1.5 1.36 2.6
Kaimur 1.94 2.5 2.62 3.11 1.45 2.34
Bhojpur 2.32 2.18 1.86 2.11 0.33 2.65
Champaran(East) 1.24 1.37 1.39 1.42 0.63 0.78
Champaran(West) 2.09 1.71 1.84 1.44 0.76 0.99
Darbhanga 0.96 0.9 0.75 1.01 0.44 0.87
Gaya 1.6 1.68 1.66 1.53 0.19 1.48Gopalganj 1.22 1.32 1.17 1.48 1.37 1.19Jahanabad 1.55 1.95 1.64 1.82 0.39 1.84
KISHANGANJ 1.16 1.03 1.07 1.43 0.69 0.91
MADHUBANI 1.14 0.96 0.77 1 0.28 0.89
MADHEPURA 1.3 1.07 1.33 1.48 1.12 1.15
MUZAFFARPUR 1.27 1.07 1.08 1.07 0.28 0.69
NALANDA 0.94 1.51 0.89 0.98 0.18 2.38
NAWADHA 1.11 1.63 1.52 1.62 0.35 2.01
ROHTAS 2.55 2.49 2.41 2.64 2.61 2.81
SAHARSA 1.5 0.99 0.99 1.22 0.89 0.99
SAMASTIPUR 1.07 1.07 0.79 0.81 0.19 0.59
SHEOHAR 1.34 1.22 1.26 0.48 0.45 0.52
SITAMARHI 1.12 1.19 1.04 1.27 0.46 0.7SIWAN 1.26 1.2 1.23 1.17 0.97 1.39SUPAUL 1.22 1.32 1.03 1.18JAMUI 1.07 0.73 1.31 1.14 0.43 1.76Average (Non-Bank Districts) 1.44 1.45 1.38 1.46 0.75 1.45
Source: Bihar through Figures, 2007, Directorate of Economics and Statistics, Govt. of Bihar

Report Code: 018_GBP_IIT_SEC_ANL_04_Ver 1_Dec 2011
64 | P a g e
Table A.38. Area Used for the Production of Wheat in the Districts of Bihar (in hectares)
District 2000-01 2001-02 2002-03 2003-04 2004-05 2006-07Baghalpur 42251 42781 42187 43502 56392 44159Begusarai 60737 56277 56065 55379 52639 52751Buxar 45742 46633 46647 45684 65969 60699Katihar 43144 47809 43461 46803 36216 35316Khagaria 35783 41772 41069 40787 41286 32229Patna 61360 61484 63403 61820 59857 57643Purnia 52485 58812 57017 58778 51855 46296Lakhisaria 23133 20020 25035 23938 21137 30061Saran 91452 90027 98192 94593 94074 88112Sheikhpura 20234 19323 17486 22287 15893 20530Vaishali 47880Monghyr 22802 21320 19350 22780 18418 18205Average (Bank Districts) 45375 46023 46356 46941 46703 44490Araria 57551Arwal 14770 11622Aurangabad 55516 55528 57409 53655 52479 61320Banka 26260 21538 28781Kaimur 66012 69409 60977 63927 64511 61071Bhojpur 67312 82212 82037 76500 49786 75252Champaran (East) 113956 114857 81431 91390 98001 98681Champaran (West) 83236 84041 80092 79151 80131 83627Darbhanga 60446 59395 66303 73492 69647 67181Gaya 51685 51878 71524 63367 48810 73663Gopalganj 78256 86361 87218 85212 84361 83202Jahanabad 34230 19220 22710 32803Kishanganj 25552 28459 29190 27750 28121 21676Madhubani 69182 72068 87324 82822 92281 82150Madhepura 51512 51601 50082 38948 38450 36629Muzaffarpur 85586 85827 86840 90699 92891 85448Nalanda 88154 101255 83416 83849 81480 82238Nawadha 45237 45680 49407 49812 43423 45191Rohtas 119690 150461 132763 128102 119130 135644Saharsa 54469 49963 50013 43708 44093 42621Samastipur 55149 54766 52095 52112 52126 51367Sheohar 11962 10936 10944 10838 10942 14075Sitamarhi 52744 70696 70712 52930 49806 68215Siwan 97531 93941 98714 84459 85638 91888Supaul 43299 47414 43369 39075 44743 50795Jamui 20851 20490 17278 16972 15177 11777Average (Non-bank districts) 63515.32 67601.73 62901.17 59281.67 56075.88 61713.84Source: Bihar through Figures, 2007, Directorate of Economics and Statistics, Govt. of Bihar,

Report Code: 018_GBP_IIT_SEC_ANL_04_Ver 1_Dec 2011
65 | P a g e
Table 3.39. Production of Wheat in the Districts of Bihar (in tonnes)
District 2000-01 2001-02 2002-03 2003-04 2004-05 2006-07
Baghalpur 87814 69488 63061 76853 72898 73965Begusarai 145269 107892 103343 107492 88559 114505Buxar 131621 113817 127040 126276 123090 123162Katihar 94508 83436 69677 56043 42603 44389Khagaria 63733 60395 52928 61432 70979 47665Patna 162834 145488 163022 158649 111277 123775Purnia 94510 91884 84862 71463 59646 62224Lakhisaria 50877 30104 56500 51182 27249 74091Saran 219828 212755 188654 208739 200718 206367Sheikhpura 38098 30904 31902 39392 23427 41845Vaishali 120298Monghyr 38970 31234 22678 41423 34678 33736Average (Bank Districts) 102551 88854 87606 90813 77739 88835Araria 40153Arwal 40533 21265Aurangabad 113367 110171 121475 111218 74460 124774Banka 36958 27735 53142Kaimur 162507 175141 162476 144491 105395 131927Bhojpur 171824 205799 164475 185606 91356 190165Champaran (East) 255835 233874 143375 143031 208865 199138Champaran (West) 246107 212254 170399 141538 177609 159715Darbhanga 99524 65825 99172 97345 120068 126518Gaya 95283 147132 143891 127641 54608 156981Gopalganj 193138 283784 163081 199739 115719 208168Jahanabad 80656 47494 43974 72142Kishanganj 40741 44737 47913 22669 37283 27904Madhubani 106501 94980 114682 65802 74322 131494Madhepura 120800 98516 81820 40681 70831 53177Muzaffarpur 185053 179819 162133 129362 144180 163884Nalanda 177138 189805 157880 124225 67059 157209Nawadha 75350 82304 99484 95080 40440 97142Rohtas 253865 326907 322003 322248 245078 330444Saharsa 149817 94601 93821 79240 71703 82012Samastipur 122104 122758 87958 59571 96491 143248Sheohar 22211 25480 19140 18893 16571 19128Sitamarhi 91912 152426 119007 84738 80475 118146Siwan 201281 208778 193517 181132 179321 191136Supaul 109076 108088 91786 34720 96752 94125Jamui 23128 27920 19868 22120 17409 17647Average For Non BankDistricts
137116.5 145050 120707.1 104963.2 91158.76 123580.76
Source: Bihar through Figures, 2007, Directorate of Economics and Statistics, Bihar, Patna
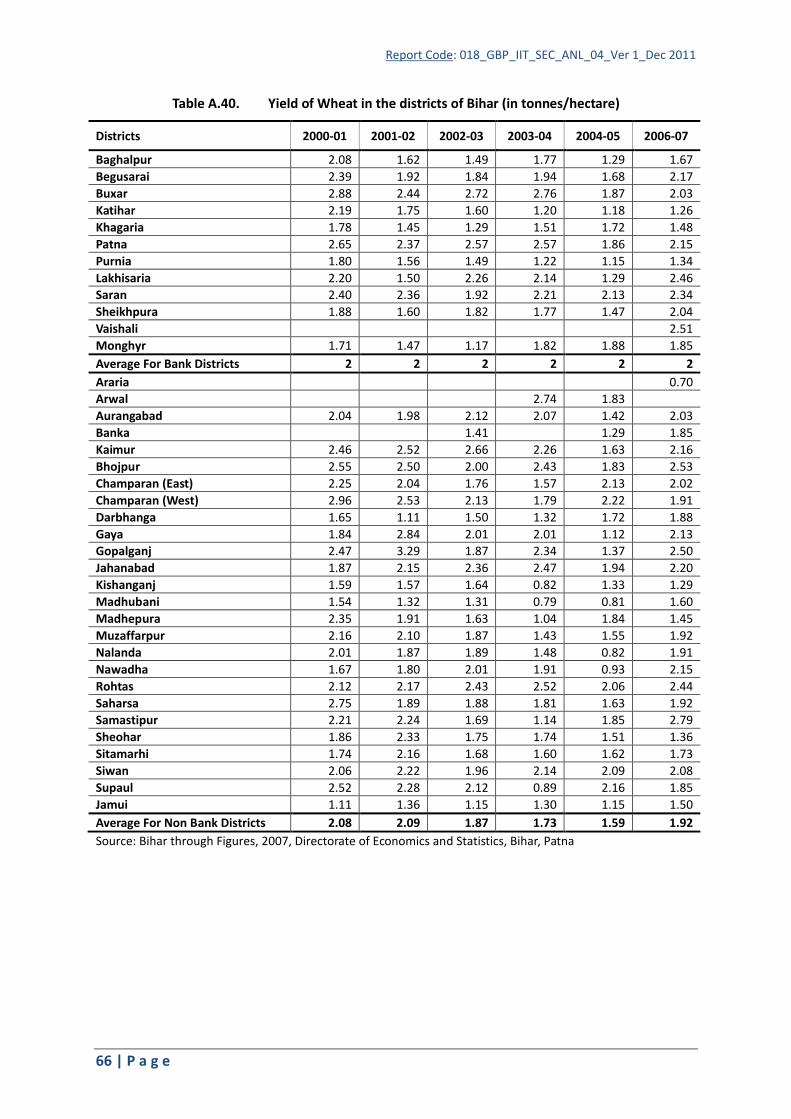
Report Code: 018_GBP_IIT_SEC_ANL_04_Ver 1_Dec 2011
66 | P a g e
Table A.40. Yield of Wheat in the districts of Bihar (in tonnes/hectare)
Districts 2000-01 2001-02 2002-03 2003-04 2004-05 2006-07
Baghalpur 2.08 1.62 1.49 1.77 1.29 1.67Begusarai 2.39 1.92 1.84 1.94 1.68 2.17Buxar 2.88 2.44 2.72 2.76 1.87 2.03Katihar 2.19 1.75 1.60 1.20 1.18 1.26Khagaria 1.78 1.45 1.29 1.51 1.72 1.48Patna 2.65 2.37 2.57 2.57 1.86 2.15Purnia 1.80 1.56 1.49 1.22 1.15 1.34Lakhisaria 2.20 1.50 2.26 2.14 1.29 2.46Saran 2.40 2.36 1.92 2.21 2.13 2.34Sheikhpura 1.88 1.60 1.82 1.77 1.47 2.04Vaishali 2.51Monghyr 1.71 1.47 1.17 1.82 1.88 1.85Average For Bank Districts 2 2 2 2 2 2Araria 0.70Arwal 2.74 1.83Aurangabad 2.04 1.98 2.12 2.07 1.42 2.03Banka 1.41 1.29 1.85Kaimur 2.46 2.52 2.66 2.26 1.63 2.16Bhojpur 2.55 2.50 2.00 2.43 1.83 2.53Champaran (East) 2.25 2.04 1.76 1.57 2.13 2.02Champaran (West) 2.96 2.53 2.13 1.79 2.22 1.91Darbhanga 1.65 1.11 1.50 1.32 1.72 1.88Gaya 1.84 2.84 2.01 2.01 1.12 2.13Gopalganj 2.47 3.29 1.87 2.34 1.37 2.50Jahanabad 1.87 2.15 2.36 2.47 1.94 2.20Kishanganj 1.59 1.57 1.64 0.82 1.33 1.29Madhubani 1.54 1.32 1.31 0.79 0.81 1.60Madhepura 2.35 1.91 1.63 1.04 1.84 1.45Muzaffarpur 2.16 2.10 1.87 1.43 1.55 1.92Nalanda 2.01 1.87 1.89 1.48 0.82 1.91Nawadha 1.67 1.80 2.01 1.91 0.93 2.15Rohtas 2.12 2.17 2.43 2.52 2.06 2.44Saharsa 2.75 1.89 1.88 1.81 1.63 1.92Samastipur 2.21 2.24 1.69 1.14 1.85 2.79Sheohar 1.86 2.33 1.75 1.74 1.51 1.36Sitamarhi 1.74 2.16 1.68 1.60 1.62 1.73Siwan 2.06 2.22 1.96 2.14 2.09 2.08Supaul 2.52 2.28 2.12 0.89 2.16 1.85Jamui 1.11 1.36 1.15 1.30 1.15 1.50Average For Non Bank Districts 2.08 2.09 1.87 1.73 1.59 1.92Source: Bihar through Figures, 2007, Directorate of Economics and Statistics, Bihar, Patna

Report Code: 018_GBP_IIT_SEC_ANL_04_Ver 1_Dec 2011
67 | P a g e
Table A.41. Area and Production of Vegetables in Bihar
Area in '000 ha/Production in '000 tonnesCrops 2005-06 2006-07 2007-08 2008-09
Area Prodn. Area Prodn. Area Prodn. Area Prodn. AreaPotato - - 322.84
(39.17%)5741.29 (42.19%)
315.46 (38.30%)
6019.65 (42.79%)
310.33 (37.53%)
5033.58 (37.60%)
Onion 49.80 (10.04%)
1011.70 (13.93%)
50.47 (6.12%)
962.71 (7.07%)
51.29 (6.23%)
1019.61 (7.25%)
51.61 (6.24%)
946.60 (7.07%)
Tomato 46.00 (9.27%)
727.20 (10.01%)
46.46 (5.64%)
916.77 (6.74%)
46.23 (5.61%)
921.87 (6.55%)
46.39 (5.61%)
1037.19 (7.75%)
Cauliflower 59.80 (12.5%)
938.50 (12.92%)
60.14 (7.30%)
1008.98 (7.41%)
60.66 (7.36%)
1023.89 (7.28%)
60.97 (7.37%)
1043.84 (7.80%)
Cabbage 36.60 (7.38%)
578.30 (7.96%)
37.00 (4.49%)
623.46 (4.58%)
37.45 (4.55%)
638.11 (4.54%)
38.33 (4.64%)
676.98 (5.06%)
Brinjal 53.70 (10.82%)
1031.00 (14.20%)
54.07 (6.56%)
1120.58 (8.23%)
54.55 (6.62%)
1158.16 (8.23%)
55.12 (6.67%)
1186.12 (8.86%)
Chilli 38.13 (7.69%)
442.35 (6.09%)
38.51 (4.67%)
459.73 (3.38%)
38.96 (4.73%)
439.42 (3.12%)
39.42 (4.77%)
450.61 (3.37%)
Bottlegourd 29.21 (5.89%)
566.73 (7.80%)
29.37 (3.56%)
542.46 (3.99%)
29.86 (3.63%)
574.29 (4.08%)
30.62 (3.70%)
625.22 (4.67%)
Spongegourd 33.68 (6.79%)
458.10 (6.31%)
33.88 (4.11%)
455.56 (3.35%)
34.34 (4.17%)
467.68 (3.32%)
36.07 (4.36%)
497.10 (3.71%)
Cucumber 1.25 (0.25%)
14.52 (0.20%)
1.47 (0.18%)
15.68 (0.12%)
1.60 (0.19%)
17.21 (0.12%)
1.72 (0.21%)
18.74 (0.14%)
Ridgegourd 8.10 (1.63%)
46.96 (0.65%)
8.27 (1.00%)
47.80 (0.35%)
8.42 (1.02%)
49.50 (0.35%)
8.49 (1.03%)
50.45 (0.38%)
Bittergourd 8.51(5.89%)
49.35 (0.68%)
8.73 (1.06%)
59.38 (0.44%)
8.93 (1.08%)
61.82 (0.44%)
9.01 (1.09%)
63.44 (0.47%)
Ashgourd 0.30 (0.06%)
7.03 (0.10%)
0.31 (0.04%)
7.06 (0.05%)
0.34 (0.04%)
7.88 (0.06%)
0.37 (0.04%)
8.64 (0.06%)
Water melon 0.89 (0.18%)
19.12 (0.26%)
0.98 (0.12%)
19.93 (0.15%)
1.08 (0.13%)
21.97 (0.16%)
1.11 (0.13%)
23.54 (0.18%)
Muskmelon 0.63 (0.13%)
7.25 (0.10%)
0.71 (0.09%)
8.45 (0.06%)
0.80 (0.10%)
9.77 (0.07%)
0.85 (0.10%)
10.49 (0.08%)
Pointedgourd 4.64 (0.94%)
47.81 (0.66%)
4.86 (0.59%)
46.02 (0.34%)
5.63 (0.68%)
57.80 (0.41%)
5.76 (0.70%)
60.17 (0.45%)
Cowpea 11.64 (2.35%)
86.11 (1.19%)
12.17 (1.48%)
88.25 (0.65%)
12.40 (1.51%)
92.72 (0.66%)
12.72 (1.54%)
97.85 (0.73%)
Pea 8.10 (1.63%)
50.50 (0.70%)
8.74 (1.06%)
53.07 (0.39%)
8.97 (1.09%)
57.58 (0.41%)
9.09 (1.10%)
61.28 (0.46%)
Radish 14.43 (2.91%)
221.02 (3.04%)
14.93 (1.81%)
226.57 (1.66%)
15.15 (1.84%)
230.93 (1.64%)
15.54 (1.88%)
241.12 (1.80%)
Carraot 4.06 (0.82%)
45.32 (0.62%)
4.16 (0.50%)
46.33 (0.34%)
4.23 (0.51%)
48.03 (0.34%)
4.47 (0.54%)
52.21 (0.39%)
Sweet Potato 0.22 (0.04%)
4.24 (0.06%)
0.23 (0.03%)
4.44 (0.03%)
0.26 (0.03%)
5.24 (0.04%)
0.33 (0.04%)
6.62 (0.05%)
Colocasia 0.59 (0.12%)
6.15 (0.08%)
0.60 (0.07%)
6.44 (0.05%)
0.69 (0.08%)
7.56 (0.05%)
0.77 (0.09%)
8.60 (0.06%)
Yam (Oal) 0.33 (0.07%)
14.05 (0.19%)
0.35 (0.04%)
15.38 (0.11%)
0.41 (0.05%)
17.88 (0.13%)
0.47 (0.06%)
21.40 (0.16%)
Others 85.51 (17.24%)
888.70 (12.24%)
84.92 (10.30%)
1132.16 (8.32%)
85.99 (10.44%)
1119.18 (7.96%)
87.29 (10.56%)
1163.95 (8.70%)
Total 496.11 7262.01 824.16 13608.50 823.70 14067.74 826.87 13385.75Source: Economic Survey 2010-11, Govt. of Bihar

Report Code: 018_GBP_IIT_SEC_ANL_04_Ver 1_Dec 2011
68 | P a g e
Table A.42. Area and Production of Fruits in Bihar
Area in '000 ha/Production in '000 tonneFruits 2005-06 2006-07 2007-08 2008-09 Area Prodn. Area Prodn. Area Prodn. Area Prodn. Area
Mango 140.20
(50.72%)1222.70 (39.85%)
140.80 (50.39%)
1306.90 (38.15%)
142.21 (49.68%)
870.35 (26.76%)
144.07 (49.56%)
1329.80 (35.72%)
Guava 27.70
(10.02%)199.00 (6.49%)
28.00 (10.02%)
248.00 (7.24%)
28.67 (10.02%)
255.72 (7.86%)
29.09 (10.01%)
229.19 (6.16%)
Litchi 28.40
(10.27%)200.10 (6.52%)
28.80 (10.31%)
211.90 (6.19%)
29.84 (10.42%)
223.23 (6.86%)
30.47 (10.48%)
216.92 (5.83%)
Lemon 16.80 (6.08%)
112.30 (3.66%)
17.10 (6.12%)
121.20 (3.54%)
17.58 (6.14%)
125.84 (3.87%)
17.74 (6.10%)
128.09 (3.44%)
Banana 28.00
(10.13%)959.30
(31.26%)29.00
(10.38%)1125.10 (32.84%)
30.46 (10.64%)
1329.36 (40.87%)
31.27 (10.76%)
1373.55 (36.90%)
Pineapple 4.20
(1.52%)108.00 (3.52%)
4.50 (1.61%)
121.10 (3.53%)
4.64 (1.62%)
126.77 (3.90%)
4.69 (1.61%)
119.48 (3.21%)
Papaya 1.00
(0.36%)22.50
(0.73%)1.10
(0.39%)25.30
(0.74%)1.27
(0.44%)30.36
(0.93%)1.43
(0.49%)33.61
(0.90%)
Aonla 1.10
(0.40%)8.60
(0.28%)1.20
(0.43%)10.70
(0.31%)1.31
(0.46%)12.09
(0.37%)1.38
(0.47%)12.83
(0.34%)
Others 28.90
(10.46%)235.90 (7.69%)
29.00 (10.38%)
255.90 (7.47%)
30.26 (10.57%)
278.66 (8.57%)
30.56 (10.51%)
279.34 (7.50%)
Bihar 276.40 3068.40 279.40 3426.00 286.24 3252.38 290.71 3722.82 Source: Economic Survey 2010-11, Govt. of Bihar
Table A.43. Cropping Pattern in Bihar
CropsPercentage of Area
2000-01 2001-02 2002-03 2003-04 2004-05 2005-06 2006-07 2007-08 2008-09Foodgrains 94.47 94.34 94.42 94.28 94.37 94.35 94.29 94.47 94.52Cereals* 90 90.15 90.15 90.27 89.91 91.31 91.01 91.56 91.55Pulses* 10 9.85 9.85 9.73 10.09 8.69 8.91 8.44 8.45Oilseeds 2.04 1.98 1.84 1.9 1.91 1.99 1.97 1.95 1.89Fibre Crops 2.25 2.16 2.31 2.41 2.24 2.15 2.12 2.12 2.06Sugarcane 1.24 1.52 1.44 1.4 1.47 1.51 1.61 1.47 1.53Total Area 100 100 100 100 100 100 100 100 100* Share (%) in total area under foodgrainsSource: Economic Survey 2010-11, Govt. of Bihar

Report Code: 018_GBP_IIT_SEC_ANL_04_Ver 1_Dec 2011
69 | P a g e
Table A.44. Cost and Returns in Major Crops in Bihar (Rs./ha)
Total Value of
Production (VOP)
Cost of Cultivation
(CC)
Net Income
Ratio of VOP to
CC
yield qntl. per
ha
Fertilizer Kg per ha
Human labor
Hrs/ha
Animal Labour hrs/ha
Paddy
1990-91 5819.69 5501.61 318.08 1.06 20.95 49.3 893.3 177.54
1996-97 10313.51 9395.03 918.48 1.1 21.43 72.37 885.08 107.43
1997-98 10918.55 9827.74 1090.81 1.11 22.61 80.07 845.13 99.62
1998-99 12310.7 10461.54 1849.16 1.18 23.79 76.57 870.14 103.49
1999-00 12964.07 12251.94 712.13 1.06 23.52 76.56 888.25 76.25
2000-01 10846.29 12796.84 -1950.55 0.85 23.38 75.36 900.6 63.55
2001-02 11427.77 12304.27 -876.5 0.93 24.56 67.62 808.46 60.86
2002-03 11906.13 13292.84 -1386.71 0.9 22.91 82.06 873.85 56.16
2003-04 12293.84 13557.33 -1263.49 0.91 24.84 75.68 840.23 55.82
CAGR 8.66 10.54 -216.56 1.91 4.88 -0.68 -12.06
Wheat
2001-02 14804.97 14525.2 279.77 1.02 23.52 129.86 536.66 51.11
2002-03 15033.67 15310.28 -276.61 0.98 22.53 130.24 485.68 45.45
2003-04 15368.95 15460.31 -91.36 0.99 21.9 118.01 454.78 44.76
2004-05 16441.16 15456.25 984.91 1.06 22.7 116.74 404.06 36.83
2005-06 16982.02 15642.09 1339.93 1.09 18.78 121.16 399.93 29.98
2006-07 21306.57 16104.6 5201.97 1.32 20.5 122.31 384.73 32.3
CAGR 6.26 1.74 62.77 -2.26 -0.99 -5.4 -7.36
Maize
1996-97 11308.2 8790.11 2518.09 1.29 22.61 92.65 782.96 77.91
1997-98 10395.82 8711.07 1684.75 1.19 18.4 98.27 750.2 77.4
1998-99 11949.28 10187.71 1761.57 1.17 20.76 126.28 755.14 80.1
1999-00 10582.93 13031.85 -2448.92 0.81 22.22 142.39 785.64 37.5
2000-01 12864.58 14419.19 -1554.61 0.89 24.88 157.07 776.36 83.49
2001-02 10904.7 13850.29 -2945.59 0.79 21.7 120.98 823.15 60.17
2002-03 17099.66 13200.49 3899.17 1.3 31.91 106.31 758.24 38.45
2003-04 17029.71 15872.44 1157.27 1.07 34.94 115.45 799.2 39.11
CAGR 5.25 7.67 -9.26 5.59 2.79 0.26 -8.25
Masur
2001-02 11253.95 8809.59 2444.36 1.28 7.8 35.85 308.59 34.61
2002-03 15338.48 10374.5 4963.98 1.48 10.39 29.04 300.04 28.83
2003-04 17099.1 10512.76 6586.34 1.63 10.64 22.36 315.3 38.23
2004-05 15658.27 9931.47 5726.8 1.58 10.42 28.62 302.89 48.61
2005-06 16502.42 11218.16 5284.26 1.47 8.98 38.33 321.13 34.56
2006-07 19757.99 11432.6 8325.39 1.73 9.39 25.78 297.22 36.7
CAGR 9.83 4.44 22.66 3.14 -5.35 -0.62 0.98
Gram
2001-02 14409.95 9216.35 5193.6 1.56 8.59 32.69 244.94 19.38
2002-03 17367.25 11494.93 5872.32 1.51 10.14 13.54 279.81 7.67
2003-04 16367.01 10430.55 5936.46 1.57 9.21 18.73 267.53 9.5
2004-05 14765.54 9974.3 4791.24 1.48 8.71 44.31 213.74 12.99
2005-06 19387.53 11860.32 7527.21 1.63 8.75 47.48 286.42 7.01

Report Code: 018_GBP_IIT_SEC_ANL_04_Ver 1_Dec 2011
70 | P a g e
Total Value of
Production (VOP)
Cost of Cultivation
(CC)
Net Income
Ratio of VOP to
CC
yield qntl. per
ha
Fertilizer Kg per ha
Human labor
Hrs/ha
Animal Labour hrs/ha
2006-07 21747.37 12552.23 9195.14 1.73 7.75 58.27 273.24 6.87
CAGR 7.1 5.28 9.99 -1.7 10.11 1.84 -15.87
Potato
2005-06 59922.77 39765.17 20157.6 1.51 183.92 215.99 1198.3 58.67
2006-07 70796.29 45305.61 25490.68 1.56 180.14 210.68 1111.84 84.8
Sugarcane
1990-91 18229.41 9026.91 9202.5 2.02 436.3 35.57 652.8 1.55
1991-92 19503.52 8299.04 11204.48 2.35 425.05 38.54 569.39 6.07
Jute
1997-98 9208.16 6995.69 2212.47 1.32 16.87 50.92 560.61 37.13
1998-99 9233.98 7145.05 2088.93 1.29 16.69 49.35 481.95 37.07Source: Based on data from www.indiastat.com