Trendlines & Excel. Same Log In Press: Control-Alt-Delete Username: physics Password: success.
15
Trendlines & Excel
-
Upload
jonathan-archibald-hicks -
Category
Documents
-
view
220 -
download
0
Transcript of Trendlines & Excel. Same Log In Press: Control-Alt-Delete Username: physics Password: success.

Trendlines & Excel

Same Log In
• Press: Control-Alt-Delete
• Username: physics
• Password: success

Same Example Experiment
How big will your goldfish be if you fed it 7.5 pellets per day?
?

Use Your Old Data
food (pellets/day) mass (g)
1 6
2 8
3 13
4 15
5 25
6 34
7 52
8 78
9 94
10 121
After 6 months…

Do Over: Enter Your Data
• Row 1: Names
• Row 2: Date
• Row 3: Blank
• Row 4: Headings
• Row… : Data

Graph It Again
Goldfish Growth
0
20
40
60
80
100
120
140
0 2 4 6 8 10 12
Food (pellets/day)
Mas
s (g
)
Ingredients:
• Meaningful Title
• Labeled Axis
• Units in Parentheses
• White Background
• No Gridlines

Mathematical Relationships(Trend Lines)
Have Excel draw lines through your data.
Pick the “best fit” line.
Excel gives you the equation.
Use the equation to make a prediction.
Ex: Calculate the goldfish’s mass if it is fed 7.5 food pellets per day.
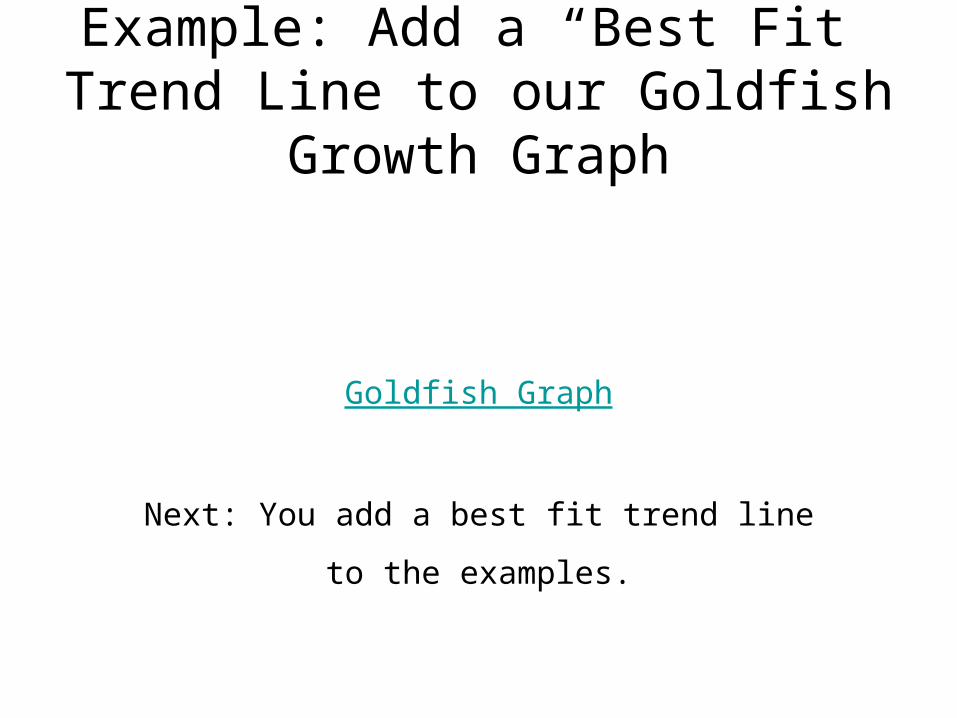
Example: Add a “Best Fit” Trend Line to our Goldfish Growth Graph
Goldfish Graph
Next: You add a best fit trend line
to the examples.

Linear Relationship
• Use a straight line.
• Mathematically:
• The dependent variable (y) does the same thing as your independent variable (x).
bmxy

Inverse Relationship
• Excel calls this a Power function
• Mathematically:
• exponent = -1 ← makes this an inverse
• Your dependent variable (y) does the opposite of your independent variable (x)
1axx
ay

Quadratic Relationship
• Excel calls this a Polynomial function• Order = 2 ← this makes it a quadratic
• Mathematically: cbxaxy 2

Notes:

Your Turn
Enter your data for the heights and stopping distances you measured yesterday.

Your Turn
Find the best fit trend line. Use the equation to predict how far it would take your cart to stop if released from 65 cm.

Print & Save
Save on your floppy diskor it will be lost forever.