TREES PROJECT Bagua-Peru - CGIARciat-library.ciat.cgiar.org/Articulos_Ciat/2015/Trees_Project... ·...
32
Centro Internacional de Agricultura Tropical lnternational Center for Tropical Agricultura TREES PROJECT Bagua- Peru (Path 009, Row 064, Full Scene) Joint Research Centre (JRC) and CIAT Technical Report Javier Puig, Grégoire Leclerc, carlos Nagles, Alexander Cuero, Rafael D. Hoyos December 1999
Transcript of TREES PROJECT Bagua-Peru - CGIARciat-library.ciat.cgiar.org/Articulos_Ciat/2015/Trees_Project... ·...
Centro Internacional de Agricultura Tropical lnternational Center for Tropical Agricultura
TREES PROJECT
Bagua- Peru
(Path 009, Row 064, Full Scene)
Joint Research Centre (JRC)
and
CIAT
Technical Report
Javier Puig, Grégoire Leclerc,
carlos Nagles, Alexander Cuero, Rafael D. Hoyos
December 1999

TABLE OF CONTENTS
INTRODUCTION
D EFORESTA TION PA TIERNS IN SOUTH AMERICA
THEANDES
HJGHLANDS IN P ERU
PRODUCflON
STUDY AREA
LOCATION
CLIMA TE ANO V EGETATION
PRODUCTlON
METHODOLOGY
MATERIALS
GEOCODING
LAND-USE ANO LAND-COVER DIGITISING
B UILDING POLYGONS
INTERPRETATION OF CHANGES
CONCLUSIONS
ANNEX 1
GEOREFERENCE MAPS
GEOCODED IMAGE INFORMA TION
GEOCODED IMAGE INFORMATION
ANNEX2
FIGURE 1 F ALSE COLOUR COMPOSITE
FIGURE 2 F ALSE COLOUR COMPOSITE
ANNEX3
LAND USE 1 LAND COVER PRESENT IN 1989 IMAGE
LAND USE 1 L AND COVER PRESENT IN 1997 IM AGE
STATISTICS FOR 1989 IMAGE
STA TlSTlCS FOR 1997 IMAGE
LAND USE CHANGE AREA FOR 1989 ANO 1997 IMAGES
LAND USE CHANGE MATRJX
ANNEX4
L AND USE INTERPRETATION KEY
TABLE 1: SPANISH VERSION OFTREES CLASSIFICATlON KEY USED BY C lAT
ANNEX S
FOREST COVER CHANGE IN SOUTH AMERICA
REFERENCES
1 3 3 3
S
5 5 5
6
6 6 6 7 7
8
9
JO JI 12
13
14 15
16
17 18 19 20 21 22
23
23 25
26
26
28
TREES PROJECT
Joint Research Centre GRC)
Intemational Center for Tropical Agriculture (CIAT)
TECHNICAL REPORT
Bagua-Peru
FULL SCENE LANDSAT TM I MAGE PATH 009, ROW 064 AND SPOT I MAGES PATH 642 R OW 362 AND PATH 643 ROW 362
I MAGE DATE 111189, 190997 AND 151097
December, 1999
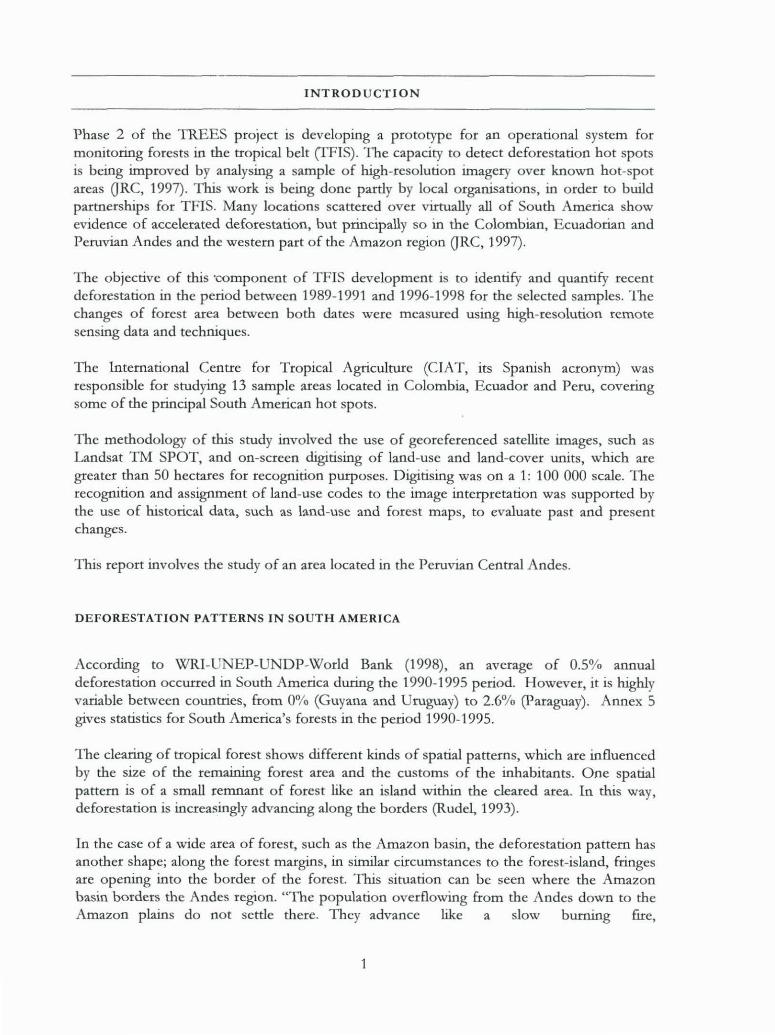
INTRODUCTION
Phase 2 of the TREES project is developing a prototype for an operacional system for monitoring forests in the tropical belt (TFIS). The capacity to detect deforestation hot spots is being improved by analysing a sample of high-resolution imagery over known hot-spot areas Q"RC, 1997). This work is being done pardy by local organisations, in arder to build partnerships for TFIS. Many locations scattered over virtually all of South America show evidence of accelerated deforestation, but principally so in the Colombian, Ecuadorian and Peruvian Andes and tbe westem part of the Amazon region Q"RC, 1997).
The objective of this ·component of TFIS development is to identify and quantify recent deforestation in the period between 1989-1991 and 1996-1998 for tbe selected samples. The changes of forest arca between botb dates were measured using high-resolution remate sensing data and techniques.
The Internacional Centre for Tropical Agriculture (CIA T, its Spanish acronym) was responsible for studying 13 sample areas located in Colombia, Ecuador and Peru, covering some of tbe principal Soutb American hot spots.
The methodology of this study involved tbe use of georeferenced satellite images, such as Landsat TM SPOT, and on-screen digitising of land-use and land-cover units, which are greater tban 50 hectares for recognition purposes. Digitising was on a 1: 100 000 scale. The recognition and assignment of land-use codes to tbe irnage interpretation was supported by tbe use of historical data, such as land-use and forest maps, to evaluate past and present changes.
This report involves the study of an area located in the Peruvian Central Andes.
D EFORESTATION PATTERNS IN SOUTH AMERICA
According to WRI-UNEP-UNDP-World Bank (1998), an average of 0.5% annual deforestation occurred in Soutb America during tbe 1990-1995 period. However, it is highly variable between countries, from 0% (Guyana and Uruguay) to 2.6% (Paraguay). Annex 5 gives statistics for Soutb America's forests in the period 1990-1995.
The clearing of tropical forest shows different kinds of spatial pattems, which are influenced by tbe size of tbe remaining forest area and tbe customs of tbe inhabitants. One spatial pattem is of a small rernnant of forest like an island within tbe cleared area. In this way, deforestation is increasingly advancing along tbe borders (Rudel, 1993).
In tbe case of a wide area of forest, such as tbe Amazon basin, the deforestation pattem has another shape; along the forest margins, in similar circurnstances to the forest-island, Eringes are opening into the border of tbe forest. This situation can be seen where the Amazon basin borders the Andes region. "The population overflowing from tbe Andes clown to the Amazon plains do not setde there. They advance like a slow burning fire,
1
concentrating along a narrow margin between the land they are destroying and are about to leave behind, and the forests lying ahead of them" (Myers, 1984). The land is used until yields begin to decline, then it is ceded or sold to cattle ranchers and the settlers move farther into the forest to restart the cycle of forest clearing and abandonment (Stearrnan, 1985). In sorne cases, the deforested area is abandoned for S to 10 years before secondary forest growth is established (Navas, 1982).
Deforestation may also occur along defined corridors, such as roads and rivers. One of the first situations revealing this pattem is in the upper reaches of the Amazon basin; the frrst spots of cleared land emerge in a linear pattem along mule trails from the Andes to the Amazon. Farther east, navigable rivers provide access to markets, so the frrst clearings occur in corridors of land along rivers (Rudel, 1993).
The govemments sponsor colonisation zones into the forest, often resulting in grids with cleared land along the roads and islands of forest in the centre of the squares created by the roads. Both sides of the roads have a uniform width of farm clearings. These clearings form an additional corridor of cleared land that parallels the roadside corridor several kilometres into the forest (Hiroaka and Yarnarnoto, 1980). Other road-building agents are the "highly capitalised organisations like timber companies that begin the deforestation process by building a penetration road, and colonists quickly clear a corridor of land along the road. The subsequent construction of feeder roads induces further deforestation and swaths of cleared land appear in the zone, reducing the forests to island remnants away from the roads" (Rudel, 1993).
The building of a new road into the forest sometimes does not generate a corridor of cleared land. In Colombia, the penetration road into the state of Cagueta generated considerable land clearing, while the construction of a similar road into the state of Guaviare did not (Ortiz, 1984). Areas such as Guaviare and Amazonas in Colombia, even after roads had been completed, remained far from major markets and have had little economic or population growth.
In Frohn's (1998) study of the causes of landscape change in Rondonia, Brazil, he observed that the arnount of deforested area is negatively correlated with the distance to the inhabited centres. The farmers closer to urban centres have difficult access to the forest because of lack of transport and services.
Many factors may have helped produce deforestation hot spots: political decisions, migration, marketplaces, fuelwood gathering, livestock farming, increase of population, climatic and compounded-impact, infrastructure, fires, illegal plantation, logging, appropriateness of land uses, darns, mining (Utting, 1993; Adger and Brown, 1994). But the causes of deforestation can be abridged into three principal ones, (1) land use conversion, (2) overexploitation of forest and (3) natural and environmental changes (Adger and Brown, 1994).
Deforestation has global consequences with respect to the carbon cycle. It has local impacts of increased rates of soil erosion, capacity of soils to retain water, other pollutants emitted from biomass buming, loss of biological diversity, loss of cultural diversity (when the
2
indigenous people are displaced) and loss of indigenous knowledge (Adger and Brown, 1994).
T H EANDES
The Andes is the longest of all mountain ranges. It is over 4500 miles long, stretching along the entire westem coast of South America. In several places, this mountain range rises to over 6000 m, the highest mountain being Aconcagua in Argentina at 6960 m. The tropical regions of the Andes reach heights of 5007 m in Venezuela, 5775 m in Colombia, 6310 m in Ecuador and 6768 m in Peru. These high mountains form a barrier of great importance to circulation of air masses, resulting in extreme changes in climate conditions over short distances. Two characteristics of the Andes are:
1) Abrupt changes in altitude giving ecozones ranging from rainy forest to desert at the lowest to snow and ice at the highest extreme (Gastó, 1993).
2) Compensation of the latitudinal increment by the altitudinal increment generated continuous ecozones of simultaneous latitudinal - altitudinal gradients (Czaijka, 1968).
Clouds are observed frequently and constantly in the Andes and are an important factor in determining the distribution of several types of vegetation. In the tropical regions on both sides of the Andes, associated with the mantles of clouds, forest has developed with 1500-2500 m as its lower limit and 2400-3300 m as its upper limit (Stadmüller, 1987).
"The arboreal vegetation often forms the superior limit of the tropical montane forest or it covers the summits and hills of isolated mountains. The trees of this vegetation are characterised generally by their low stature, their trunks twisted with profuse rarnifications, and by a great quantity of epiphytes, especially mosses that could cover trunks, branches and the surface of the floor completely" (Stadtmüller, 1987).
H IGHLANDS IN PERU
Productioo
"The highlands (Andes) in Peru are generally considered to consist of two parallel ranges, the Cordillera Occidental and the Cordillera Oriental, extending in a north-west to southeast direction" (Brawer, 1991). Both ranges have peaks rising to over 6000 metres and are not continuous. Between the ranges are basins and valleys forming the inter-mount highlevel surface where historically most of Peru's population has been concentrated (Brawer, 1991; Torres, 1993).
"Only the lower basins and valleys of the high level surface are climatically within the zone suitable for agriculture. The altitude of most of this surface is outside the limit of cultivation
3
or is marginal for sorne crops" (Brawer, 1991) even so, 78% of the agriculture ts concentrated here (forres, 1993).
The marked changes in altitude in the Andes establish strong gradients of temperature and humidity that permit different crops to be grown depending on the soil type and weather conditions (Tapia, 1986; Altieri, 1996). Below 3000 m, in the river canyons, the climatic conditions are arid; abo ve this height, the rains in crease from 300 mm to 1000 mm and up to 4500 m. This zone holds most of the cultivated land (Altieri, 1996).
Several agroclimatic zones can be distinguished in the Central Andes such as those used for:
• Grassland above 3800 m, • Tuber and root crops between 3000 and 4200 m, • Cereals between 1500 and 3000 m, and • Tropical fruits between 500 and 1500 m.
In sorne Andeart comrnunities, cereals may be cultivated above 3000 m, reaching altitudes as great as 4200 m, such as in rotation with root crops and fallow (Altieri, 1996).
Cattle are a major source of income in the mountains, and goats are bred principally on the Pacific Coast. More than 80% of the cattle, 98% of the sheep and 100% of the South American camels are in the mountain ranges (Brawer, 1991; Torres, 1993). Al! these depend almost exclusively on the consumption of endemic grasses growing above 3800 m (Tapia, 1993; Altieri, 1996).
In Peru, 91% of farms are under 1 O ha in size; in the mountain ranges, many are under 2 ha for crop growing and 20 ha for cattle (Tapia, 1993). According to the National Agricultural census in 1972, in the Peruvian mountain ranges, 45.1% of farms were under 2 ha and 31.5% were from 2 toS ha in size (forres, 1993).
In the high mountains, sorne of the farm holdings are managed by communal village landholdings as single units, which have an average size of 1985 ha. This is divided among the entire village population of sorne 100 to 1000 farnilies (Handelman, 1975) .
In 1993, the population in the mountain ranges was calculated as 30% of the national total. In contrast, the population along the Pacific Coast has continued to increase, rising from 39% in 1961 to perhaps over 60% in 1993, keeping in mind the forced migrations that occurred because of the terrorism in the 1980s (forres, 1993).
4
STUDY AREA
LOCA TI ON
The study site is located in the Amazona and Cajamarca Departments in the northern part of Peru. This area has elevations from about 1 SO in the Amazon basin to abo ve 4000 m in the Chachapoyas paramo. Its limits are to the south, the Cutervo Nacional Park in Cajamarca State of Peru, to the north is the Utcubamba River and Pamacocha Lake in the Chachapoyas paramo, to the west are the Chotano and Chamaya Rivers in Cajamarca and to the east the Chachapoyas paramo. The Marañón River crosses the study area from south east to north. The total area covered is 643 836 ha.
CLIMATE AND VEGETATION
Precipitation is over 3000 mm annually in the very humid subtropical forest, about 2000 mm in the humid tropical forest and nearly 1200 mm in the dry tropical forest areas. The dry season occurs in June, July and August (Gazzo, 1982). Formations of humid and subhumid scrub are ftrSt encountered in the higher areas of the Andean cordillera between 2500 and 3400 m, with precipitation between 500 and 2000 mm. The subhumid scrub is found in the inter-Andean valleys between 2000 and 3700 m with precipitation from 220 to 1000 mm.
The paramo occurs in the higher areas of the mountains from 3200 m up to a line between 4500 to 4700 m (Cuatrecasas, 1989). The paramo is made up of bushy vegetation, grasses and low cushion- or mattress-like vegetation (Rangel Ch. et al., 1995).
PRODUCTION
The area shows intense agricultura! actlVlty, concentrating in the open countryside of Cajarmaca, with important dairy cattle production (Lajo L., 1983).
The government has three main rural settlement projects located within the study area and surrounding areas, in different places in the jungle. Al! three were begun in the late 1970s. The objective was to consolidate farmers and native communities on the agricultura! frontier. The settlement of Jaén-San Ignacio Agricultura! and Livestock Development involved 17 000 new farm families, while the Alto Marañón Rural Settlement had 3000 new families and the Alto Mayo Rural Settlement 7000 families (Gazzo, 1982).
5
METHODOLOGY
MATERIALS
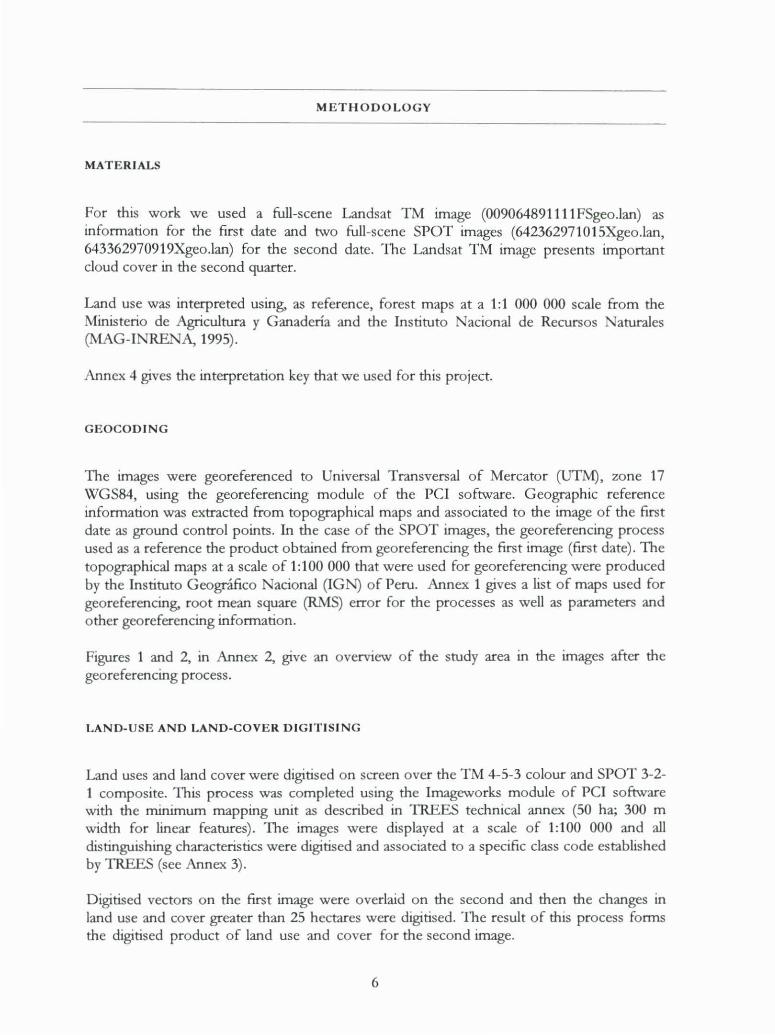
For this work we used a full-scene Landsat TM image (009064891111FSgeo.lan) as information for the first date and two full-scene SPOT images (642362971015Xgeo.lan, 643362970919Xgeo.lan) for the second date. 'Ibe Landsat TM image presents important cloud cover in the second quarter.
Land use was interpreted using, as reference, forest maps at a 1:1 000 000 scale from the Ministerio de Agricultura y Ganadería and the Instituto Nacional de Recursos Naturales (MAG-INRENA, 1995).
Annex 4 gives the interpretation key that we used for this project.
GEOCOD ING
The images were georeferenced to Universal Transversal of Mercator (UTM), zone 17 WGS84, using the georeferencing module of the PCI software. Geographic reference information was extracted from topographical maps and associated to the image of the first date as ground control points. In the case of the SPOT images, the georeferencing process used as a reference the product obtained from georeferencing the first image (first date). The topographical maps ata scale of 1:100 000 that were used for georeferencing were produced by the Instituto Geográfico Nacional (IGN) of Peru. Annex 1 gives a list of maps used for georeferencing, root mean square (RMS) error for the processes as well as parameters and other georeferencing information.
Figures 1 and 2, in Annex 2, give an overview of the study area in the images after the georeferencing process.
LAND-USE AND LAND-COVER D IG ITISING
Land uses and land cover were digitised on screen over the TM 4-5-3 colour and SPOT 3-2-1 composite. This process was completed using the Imageworks module of PCI software with the mínimum mapping unit as described in TREES technical annex (SO ha; 300 m width for linear features). The images were displayed at a scale of 1:100 000 and all distinguishing characteristics were digitised and associated to a specific class code established by TREES (see Annex 3).
Digitised vectors on the first image were overlaid on the second and then the changes in land use and cover greater than 25 hectares were digitised. The result of this process forms the digitised product of land use and cover for the second image.
6
BUILDING POLYGONS
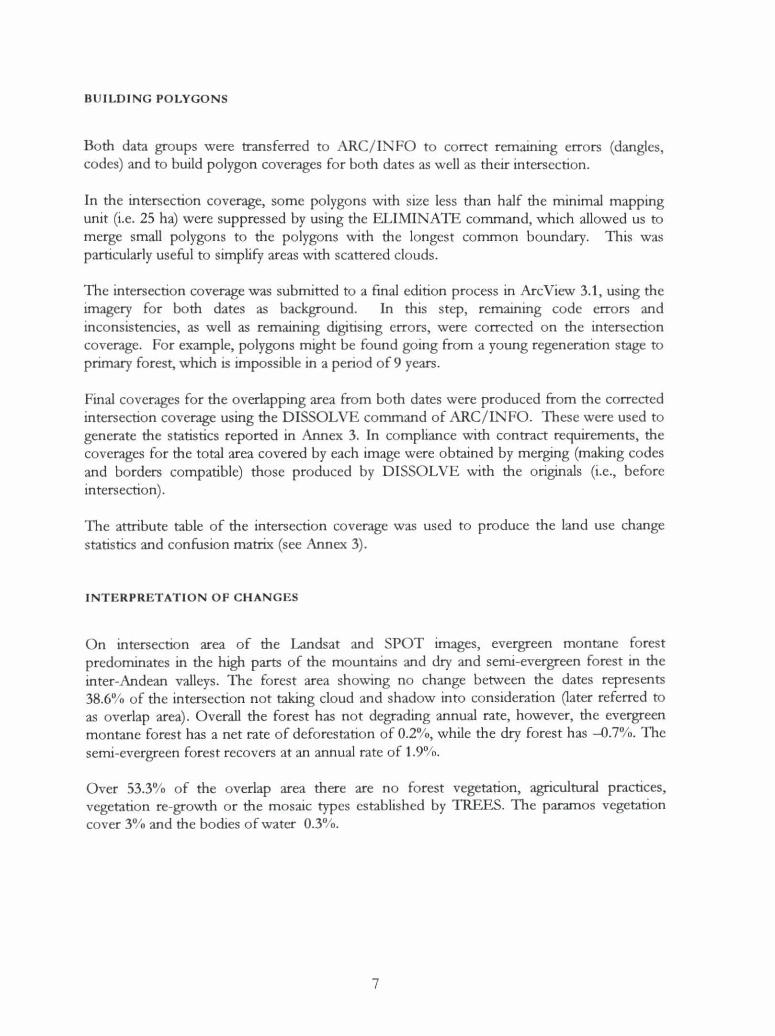
Both data groups were transferred to ARC/INFO to correct remammg errors (dangles, codes) and to build polygon coverages for both dates as weU as their intersection.
In the intersection coverage, sorne polygons with size less than half the minimal mapping unit (i.e. 25 ha) were suppressed by using the ELIMINA 1E command, which allowed us to merge smaU polygons to the polygons with the longest common boundary. This was particularly useful to simplify areas with scattered clouds.
The intersection coverage was submitted toa final eclition process in ArcView 3.1, using the imagery for both dates as background. In this step, remaining code errors and inconsistencies, as weU as remaining digitising errors, were corrected on the intersection coverage. For example, polygons might be found going from a young regeneration stage to
primary forest, which is impossible in a period of 9 years.
Final coverages for the overlapping area from both dates were produced from the corrected intersection coverage using the DISSOLVE command of ARC/ INFO. These were used to generate the statistics reported in Annex 3. In compliance with contract requirements, the coverages for the total area covered by each image were obtained by merging (making codes and borders compatible) those produced by DISSOLVE with the originals (i.e., before intersection).
The attribute table of the intersection coverage was used to produce the land use change statistics and confusion matrix (see Annex 3).
INTER PRETATION OF CHANGES
On intersection area of the Landsat and SPOT images, evergreen montane forest predominates in the high parts of the mountains and dry and semi-evergreen forest in the inter-Andean valleys. The forest area showing no change between the dates represents 38.6% of the intersection not taking cloud and shadow into consideration Oater referred to as overlap area). OveraU the forest has not degrading annual rate, however, the evergreen montane forest has a net rate of deforestation of 0.2%, while the dry forest has -0.7%. The semi-evergreen forest recovers atan annual rate of 1.9%.
Over 53.3% of the overlap area there are no forest vegetation, agricultura! practices, vegetation re-growth or the mosaic types established by TREES. The pararnos vegetation cover 3% and the boclies of water 0.3%.
7
CONCLUS I ONS
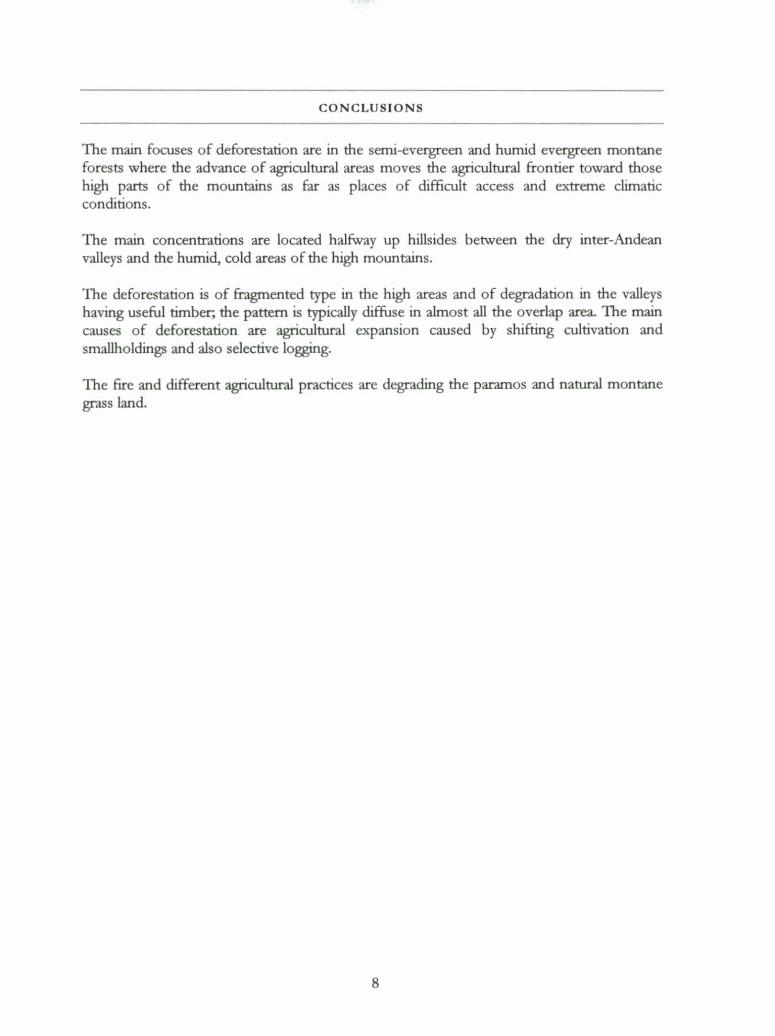
The main focuses of deforestation are in the semi-evergreen and humid evergreen montane forests where the advance of agricultura! areas moves the agricultura! frontier toward those high parts of the mountains as far as places of difficult access and eA1reme climatic conditions.
The main concentrations are located halfway up hillsides between the dry inter-Andean valleys and the humid, cold areas of the high mountains.
The deforestation is of fragmented type in the high areas and of degradation in the valJeys having useful timber; the pattern is typically diffuse in almost all the overlap area. The main causes of deforestation are agricultura! expansion caused by shifting cultivation and smallholdings and also selective logging.
The fire and djfferent agricultura! practices are degrading the paramos and natural montane grass land.
8

Annex 1
Geocoded image information
Bagua (Path 009, Row 064, FuO Scene)
9
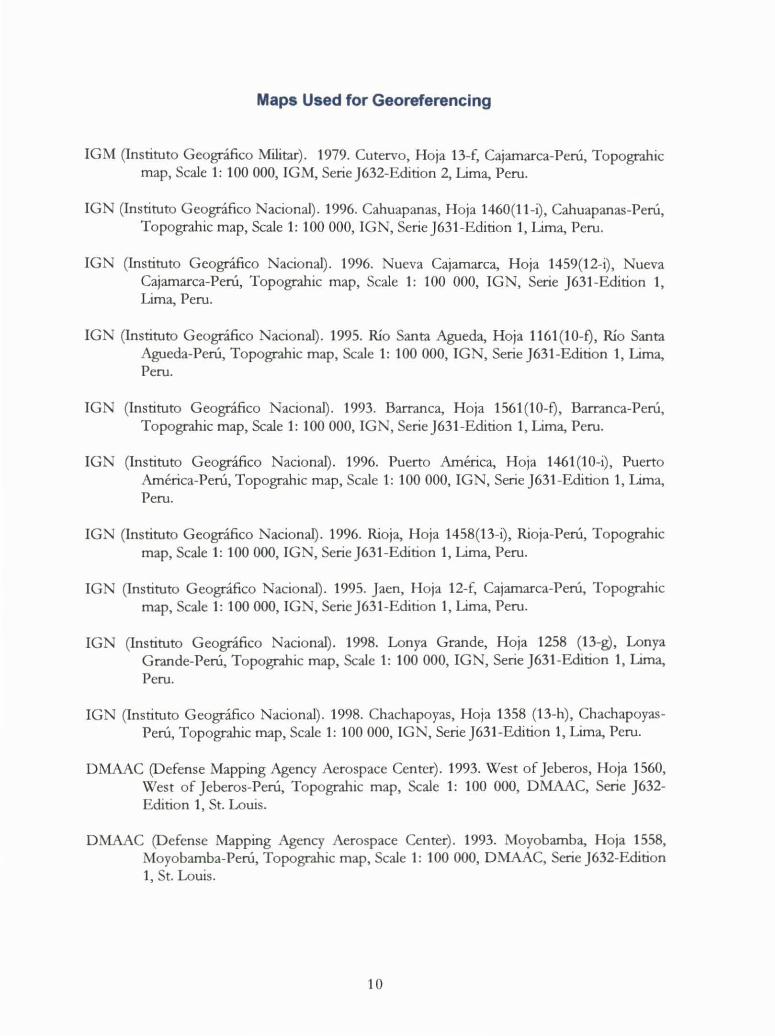
Maps Used for Georeferencing
IGM (Instituto Geográfico Militar). 1979. Cutervo, Hoja 13-f, Cajamarca-Perú, Topograhic map, Scale 1: 100 000, IGM, SerieJ632-Edition 2,Lima, Peru.
IGN (Instituto Geográfico Nacional) . 1996. Cahuapanas, Hoja 1460(11-i), Cahuapanas-Perú, Topograhic map, Scale 1: 100 000, IGN, Serie )631-Edition 1, Lima, Peru.
IGN (Instituto Geográfico Nacional). 1996. Nueva Cajamarca, Hoja 1459(12-i), Nueva Cajamarca-Perú, Topograhic map, Scale 1: 100 000, IGN, Serie )631-Edition 1, Lima, Peru.
IGN (Instituto Geográfico Nacional). 1995. Río Santa Agueda, Hoja 1161(10-f), Río Santa Agueda-Perú, Topograhic map, Scale 1: 100 000, IGN, Serie )631-Edition 1, Lima, Peru.
IGN (Instituto Geográfico Nacional). 1993. Barranca, Hoja 1561 (10-f), Barranca-Perú, Topograhic map, Scale 1: 100 000, IGN, Serie )631 -Edition 1, Lima, Peru.
IGN (Instituto Geográfico Nacional). 1996. Puerto América, Hoja 1461(10-i), Puerto América-Perú, Topograhic map, Scale 1: 100 000, IGN, Serie )631-Edition 1, Lima, Peru.
IGN (Instituto Geográfico Nacional). 1996. Rioja, Hoja 1458(13-i), Rioja-Perú, Topograhic map, Scale 1: 100 000, IGN, Serie )631-Ectition 1, Lima, Peru.
IGN (Instituto Geográfico Nacional). 1995. Jaen, Hoja 12-f, Cajamarca-Perú, Topograhic map, Scale 1: 100 000, IGN, Serie J631-Ectition 1, Lima, Peru.
IGN (Instituto Geográfico Nacional). 1998. Lonya Grande, Hoja 1258 (13-g), Lonya Grande-Perú, Topograhic map, Scale 1: 100 000, IGN, Serie )631-Edition 1, Lima, Peru.
IGN (Instituto Geográfico Nacional). 1998. Chachapoyas, Hoja 1358 (13-h), ChachapoyasPerú, Topograhic map, Scale 1:100 000, IGN, SerieJ631-Edition 1, Lima, Peru.
DMAAC (Defense Mapping Agency Aerospace Center). 1993. West of Jeberos, Hoja 1560, West of Jeberos-Perú, Topograhic map, Scale 1: 100 000, DMAAC, Serie )632-Edition 1, S t. Louis.
DMAAC (Defense Mapping Agency Aerospace Center). 1993. Moyobamba, Hoja 1558, Moyobamba-Perú, Topograhic map, Scale 1: 100 000, DMAAC, Serie J632-Ectition 1, S t. Louis.
10
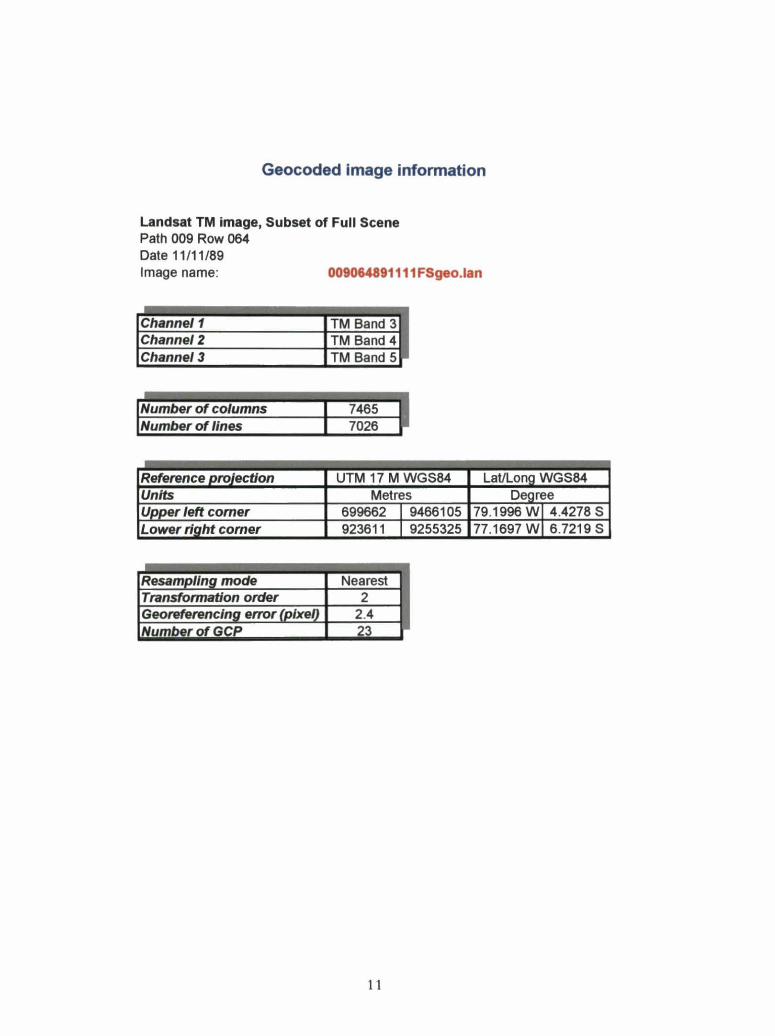
Geocoded image information
Landsat TM image, Subset of Full Scene Path 009 Row 064 Date 11/11/89 lmage name: 009064891111FSgeo.lan
Channe/1 TM Band 3 Channe/2 TM Band 4 Channe/3 TM Band 5
lNumber of co/umns 7465 1 lNumber of llnes 7026 11
Reference pro]ectlon UTM 17 M WGS84 LaVLong WGS84 Unlts Metres Degree Upper left comer 699662 l 94661 05 79.1996 Wl 4.4278 S Lower rlght comer 923611 1 9255325 77.1697 Wl 6.7219 S
Resampllng mode Nearest Transformation order 2 Georeferenclng error (pixel) 2.4 Number of GCP 23
11

Geocoded image information
SPOT Mosaic images Path 642 Row 362 Path 643 Row 362 Date 19/09/97 Date 15/10/97 lmage name:
Channe/1 Channe/2 Channe/3
LNumber of columns lNumber of 1/nes
Reference projection Unlts Upi!_er /eft comer Lower rlaht comer
Resampllng mode Transformation order (1st date) Transformatlon order (2nd date) Georeferenclng error (pixel) (1st date) Georeferenclng error (pixel) (2nd date) Number of GCP (1st date) Number of GCP (2nd date)
12
spotmosaic97geo.lan
Band 1 Band 2 Band 3
6786 1 3500 ~
UTM 17 M WGS84 Metres
730137 1 9370001 865857 1 9300001
Nearest 1 1
1.8 1.5 18 14
Lat/Long WGS84 Degree
78.9220 Wl 5 .6958 S 77.6939 Wl6.3223 S
Annex 2
False colour composites
Bagua (Path 009, Row 064, Full Scene)
13
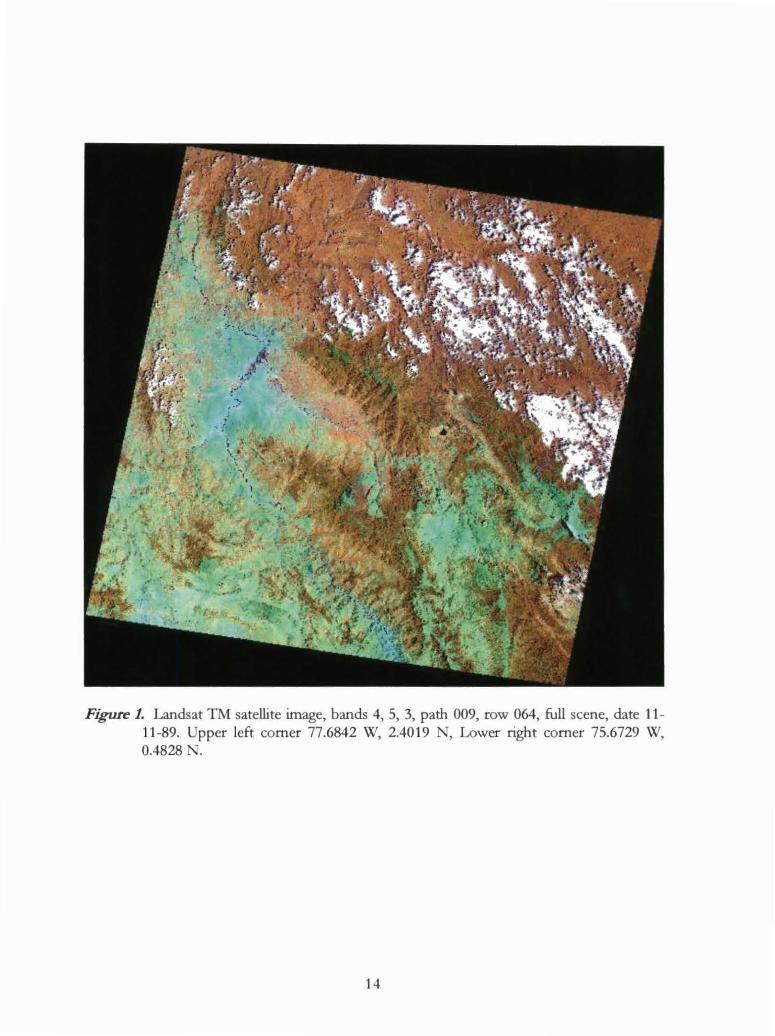
Figure 1. Landsat TM satellite image, bands 4, S, 3, path 009, row 064, full scene, date 11-11-89. Upper left comer 77.6842 W, 2.4019 N, Lower right comer 75.6729 W, 0.4828 N.
14

Figure 2. SPOT mosaic satellite image, bands 3, 2, 1, path 642, 643 row 362, full scene, date 15-10-97 and 19-09-97. Upper left comer 79.9220 W, 5.6962 S, Lower right comer 77.7838 W, 6.3229 S
15
Annex3
Land use / Land cover change (Overlap area)
Bagua (Path 009, Row 064, Full Scene)
16
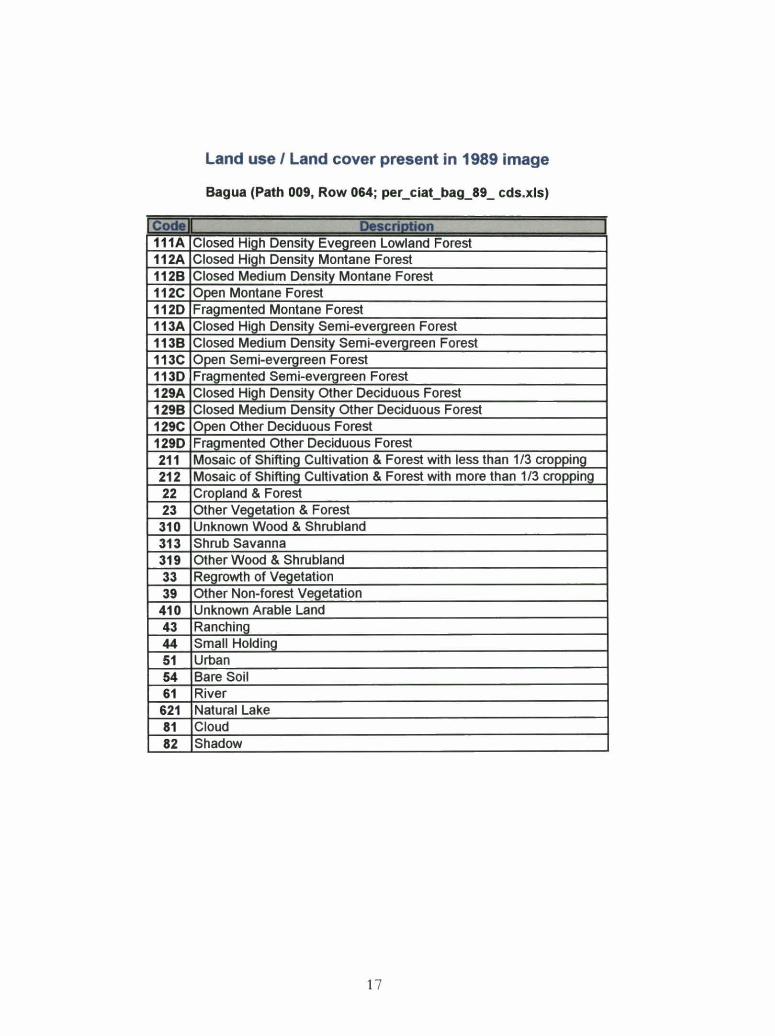
Land use 1 Land cover present in 1989 image
8agua (Path 009, Row 064; per_ciat_bag_89_ cds.xls)
ICode Descriotion 111A Closed High Density Evegreen Lowland Forest 112A Closed High Density Montane Forest 1128 Closed Medium Density Montane Forest 112C Open Montane Forest 1120 Fragmentad Montane Forest 113A Closed High Density Semi-evergreen Forest 1138 Closed Medium Density Semi-evergreen Forest 113C Open Semi-evergreen Forest 1130 Fragmentad Semi-evergreen Forest 129A Closed High Density Other Deciduous Forest 1298 Closed Medium Density other Deciduous Forest 129C Open other Deciduous Forest 1290 Fragmentad Other Deciduous Forest 211 Mosaic of Shifting Cultivation & Forest with less than 1/3 cropping 212 Mosaic of Shifting Cultivation & Forest with more than 1/3 cropping 22 Cropland & Forest 23 Other Vegetation & Forest 310 Unknown Wood & Shrubland 313 Shrub Savanna 319 Other Wood & Shrubland 33 Regrowth of Vegetation 39 Other Non-forest Vegetation 410 Unknown Arable Land 43 Ranching 44 Small Holding 51 Urban 54 Bare Soil 61 River 621 Natural Lake 81 Cloud 82 Shadow
17
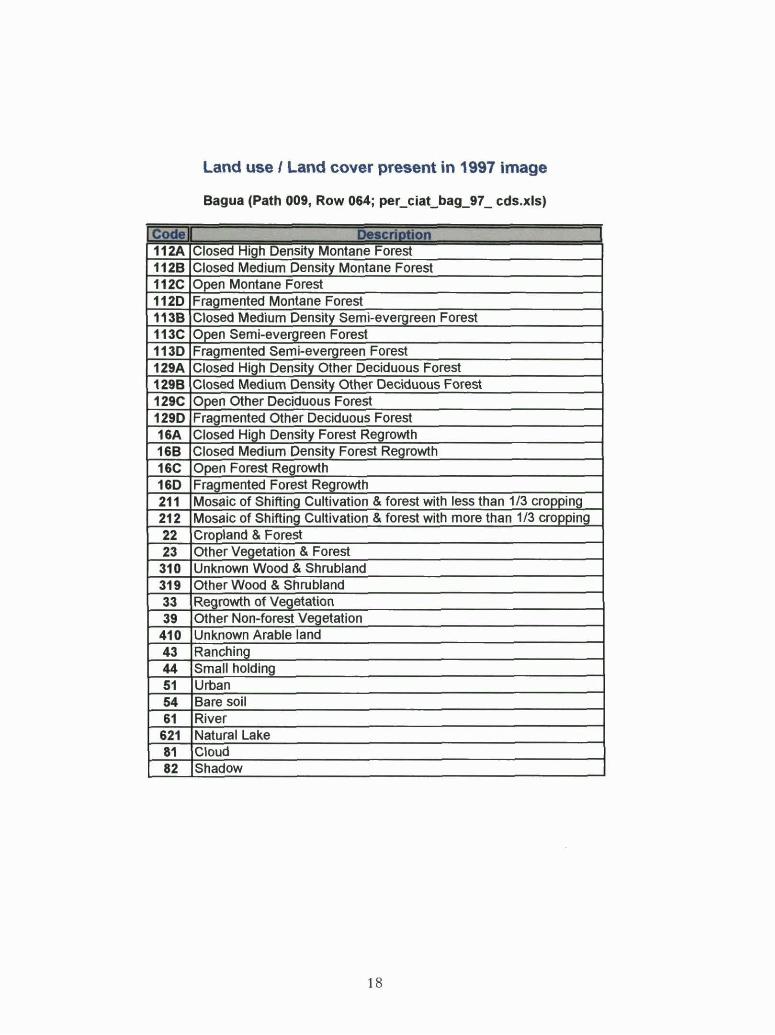
Land use 1 Land cover present in 1997 image
8agua (Path 009, Row 064; per_ciat_bag_97 _ cds.xls)
.Code Desc:rioaon 112A Closed High Density Montane Forest 1128 Closed Medium Density Montane Forest 112C Open Montane Forest 1120 Fragmentad Montane Forest 1138 Closed Madium Density Semi-evergreen Forest 113C Open Semi-evergreen Forest 1130 Fragmentad Semi-evergreen Forest 129A Closad High Density Other Deciduous Forest 1298 Closed Medium Oensity Other Deciduous Forest 129C Open Other Oeciduous Forest 1290 Fragmented Other Deciduous Forest 16A Closed High Oensity Forest Regrowth 168 Closad Madium Oensity Forest Regrowth 16C Open Forest Regrowth 160 Fragmentad Forest Regrowth 211 Mosaic of Shifting Cultivation & forest with less than 1/3 cropping 212 Mosaic of Shifting_ Cultivation & forest with more than 1/3 cropping 22 Cropland & Forest 23 other Vegetation & Forest
310 Unknown Wood & Shrubland 319 Other Wood & Shrubland 33 Regrowth of Vegetation 39 Other Non-forest Vegetation 410 Unknown Arable land 43 Ranching 44 Small holding 51 Urban 54 Bare soil 61 River
621 Natural Lake 81 Cloud 82 Shadow
18
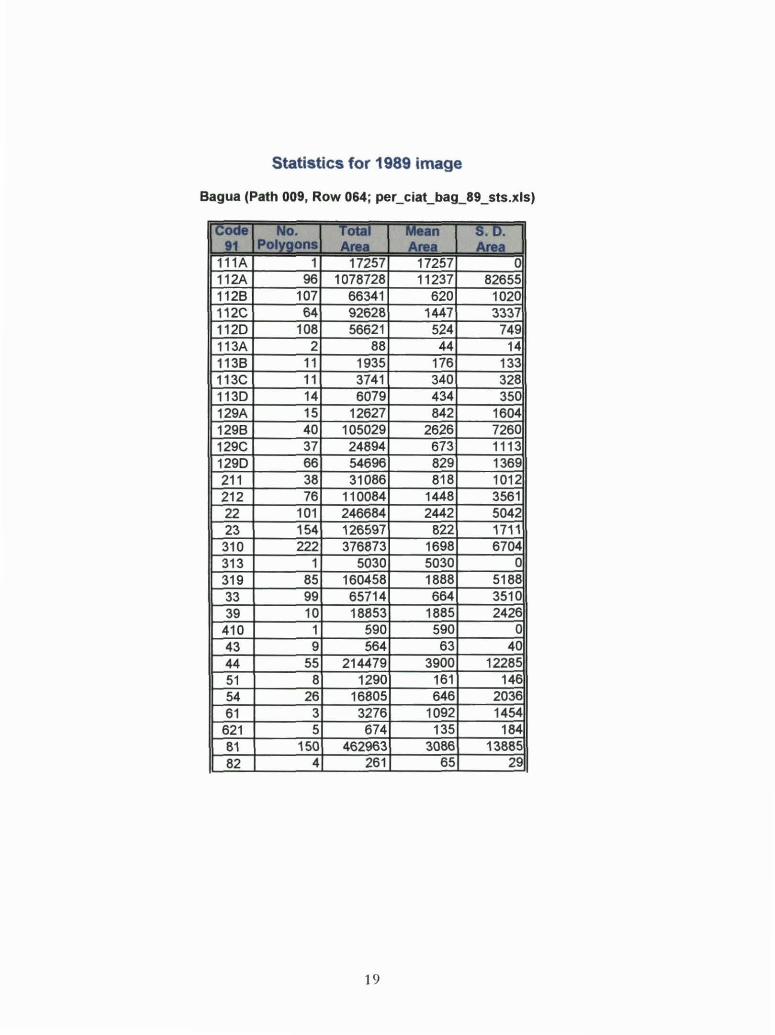
Statistics for 1989 image
Bagua (Path 009, Row 064; per_ciat_bag_89_sts.xls)
¡e;:- No. Total Mean S. D. Potygons Aru Area Alea
111A 1 17257 17257 o 112A 96 1078728 11237 82655 1128 107 66341 620 1020 112C 64 92628 1447 3337 1120 108 56621 524 749 113A 2 88 44 14 1138 11 1935 176 133 113C 11 3741 340 328 1130 14 6079 434 350 129A 15 12627 842 1604 1298 40 105029 2626 7260 129C 37 24894 673 1113 1290 66 54696 829 1369 211 38 31086 818 1012 212 76 110084 1448 3561 22 101 246684 2442 5042 23 154 126597 822 1711 310 222 376873 1698 6704 313 1 5030 5030 o 319 85 160458 1888 5188 33 99 65714 664 3510 39 10 18853 1885 2426 410 1 590 590 o 43 9 564 63 40 44 55 214479 3900 12285 51 8 1290 161 146 54 26 16805 646 2036 61 3 3276 1092 1454
621 5 674 135 184 81 150 462963 3086 13885 82 4 261 65 29
19

Statistics for 1997 image
Bagua (Path 009, Row 064; per_ciat_bag_97_sts.xls)
¡e:-- No. Total Mean S. D. Potvaons Area Area Araa
112A 16 100694 6293 17790 1128 48 22755 474 860 112C 40 12884 322 527 1120 87 30271 348 477 1138 9 1393 155 84 113C 10 4063 406 421 1130 17 4784 281 251 129A 13 8714 670 1072 1298 31 11212 362 501 129C 31 13677 441 443 1290 55 33762 614 877 16A 1 68 68 o 168 S 485 97 87 16C 2 248 124 50 160 S 776 155 102 211 39 14412 370 402 212 56 36933 660 1126 22 71 77650 1094 2274 23 98 39276 401 662 310 156 149189 956 5032 319 25 9887 395 487 33 49 11773 240 693 39 10 9644 964 1759
410 1 555 555 o 43 6 276 46 14 44 38 35069 923 2809 51 6 395 66 50 54 10 3258 326 543 61 2 1544 772 309 621 1 463 463 o 81 46 6007 131 220 82 35 1726 49 21
20
1
~·· P...,._l 11 18 112A 10 112A 7 112A
20 112A .. 112A 3 112A
12 112A 11 112A 3 112A
31 112A 29 112A 2 1128
28 1128 1 1128 6 1128 1 1128 .. 1128 3 1128 2 1128 3 112C 7 112C
20 112C 4 112C 2 112C 1 112C 1 112C 2 1120
12 1120 62 1120 5 1120 9 1120 6 1120
16 1120 1 1120 6 1120 1 1120 1 113A 1 113A 8 1138 3 1136 1 1136
10 113C 1 113C 1 113C 1 1130 2 1130
12 1130 1 1130 1 1130 1 1130 1 1130
11 129A 1 129A 1 129A 1 129A 1 129A 3 1296
24 1298 2 1296 .. 1298 2 1298 2 1296 3 1296 2 1296 2 129C
19 129C
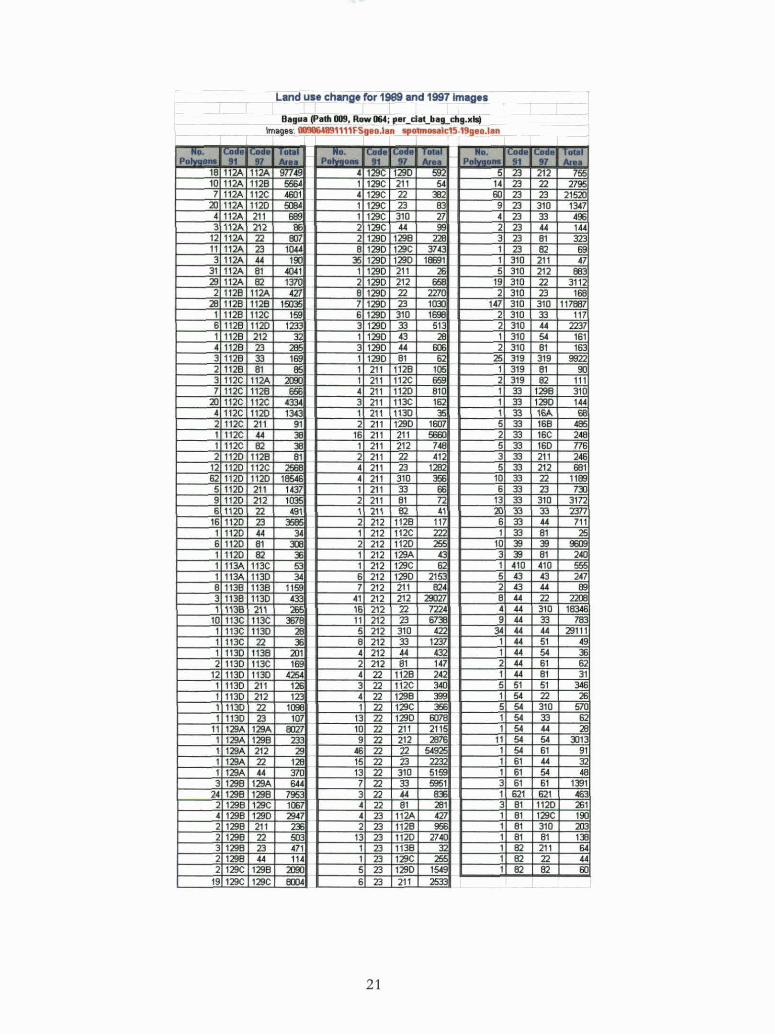
Land use change for 1989 and 1997 lmages
Bag11a (Path 009, Row 1164; par_d.t_bag_c:hg.xllj lmages:~ 009ll64891111FSJI•o.lan spotmosalé15-19geo.l•ll
W1 = ~·· 11 , = p .... .... le:-
112A 9n.49 .4 129C 1290 592 5 23 1128 ~ 1 129C 211 54 14 23 112C 4601 4 129C 22 382 60 23 1120 5004 1 129C 23 83 9 23 211 689 1 129C 310 27 4 23 212 lli 2 129C 44 99 2 23 22 rm 2 1290 1298 228 3 23 23 10U 8 1290 129C 3743 1 23 .... 190 35 1290 1290 18691 1 310 81 .40.41 1 1290 211 26 5 310 B2 1370 2 1290 212 658 19 310
112A 427 8 1290 22 2270 2 310 1128 15035 7 1290 23 11m 147 310 112C 159 6 1290 310 1698 2 310 1120 1233 3 1290 33 513 2 310 212 32 1 1290 43 28 1 310 23 285 3 1290 44 600 2 310 33 169 1 1290 81 62 25 319 81 85 1 211 1128 105 1 319
112A 2090 1 211 112C 659 2 319 1128 656 4 211 1120 810 1 33 112C .433.4 3 211 113C 162 1 33 1120 1343 1 211 1130 35 1 33 211 91 2 211 1290 1607 5 33 « 38 16 211 211 5660 2 33 B2 38 1 211 212 748 5 33
1128 81 2 211 22 412 3 33 112C 2568 4 211 23 1282 5 33 1120 185.46 4 211 310 356 10 33 211 1437 1 211 33 66 6 33 212 1035 2 211 81 72 13 33 22 491 1 211 B2 41 20 33 23 3585 2 212 1126 117 6 33 « 3.4 1 212 112C 222 1 33 81 DI 2 212 1120 255 10 39 B2 :E 1 212 129A 43 3 39
113C 53 1 212 129C 62 1 410 1130 3.4 6 212 1290 2153 5 43 1138 1159 7 212 211 824 2 43 1130 433 41 212 212 29027 8 44 2'1 266 16 212 22 7224 4 « 113C 3;78 11 212 23 6738 9 44 1130 28 5 212 310 422 3.4 44 22 :E 8 212 33 1237 1 «
1138 201 4 212 44 432 1 « 113C 169 2 212 81 1.47 2 44 1130 4254 4 22 1128 242 1 44 211 126 3 22 112C 3.40 5 51 212 123 4 22 1298 399 1 54 22 1098 1 22 129C 356 5 54 23 107 13 22 1290 6078 1 54
129A 8027 10 22 211 2115 1 54 1298 233 9 22 212 2876 11 54 212 29 46 22 22 54925 1 54 22 128 15 22 23 2232 1 61 « 370 13 22 310 5159 1 61
129A 6« 7 22 33 5951 3 61 1298 7953 3 22 44 B3i 1 621 129C 1067 4 22 81 281 3 81 1290 29.47 4 23 112A 427 1 81 211 23; 2 23 1128 956 1 81 22 503 13 23 1120 2740 1 81 23 471 1 23 1136 32 1 B2 .44 1U 1 23 129C 255 1 82
1298 2090 5 23 1290 1549 1 82 129C 8004 6 23 211 2533
21
IC:• ToCal ...... 212 755 22 2795 23 21520 310 1347 33 496 44 144 81 323 B2 69 211 47 212 883 22 31 12 23 168 310 117887 33 117 « 2237 54 161 81 163 319 9922 81 90 B2 111
1298 310 1290 144 16A 68 168 485 16C 248 160 ns 211 246 212 681 22 1189 23 730 310 3172 33 23n 44 711 81 25 39 9609 81 240 410 555 43 247 « 89 22 2208 310 18346 33 783 « 29111 51 49 54 36 61 62 81 31 51 346 22 26 310 570 33 62 44 28 54 3)13 61 91 « 32 54 48 61 1391
621 463 1120 261 129C 190 310 203 81 138 211 64 22 44 82 60

íii"
l i ! ~ )( al
:S .! "' -r.' E -u Cll ·-' Cl !. e
~ ~ ('¡ ('¡
~ ¡ (,) ~ Cll o ., 111! ~ -
~ ' 'C §
j l !!1
l
t 66
Annex4
Land use interpretation key
23
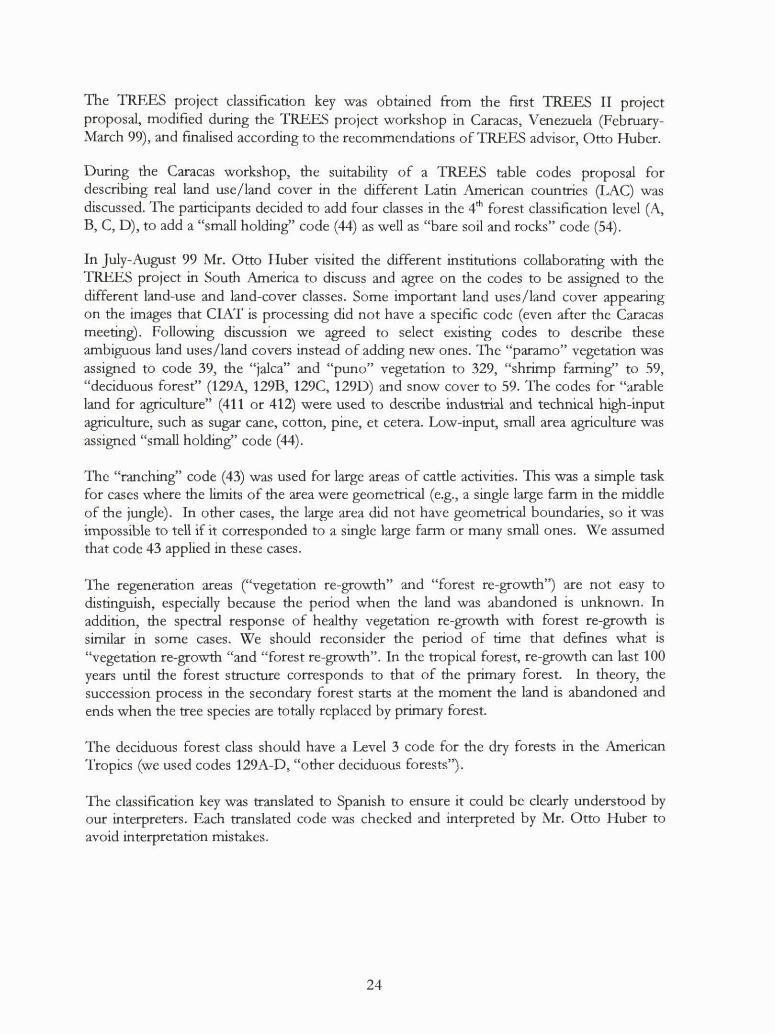
The TREES project classification key was obtained from the first TREES II project proposal, modified during the TREES project workshop in Caracas, Venezuela (FebruaryMarch 99), and finalised according to the recommendations ofTREES advisor, Otto Huber.
During the Caracas workshop, the suitability of a TREES table codes proposal for describing real land use/land cover in the different Latin American countries (LAC) was discussed. The participants decided to add four classes in the 4th forest classification level (A, B, C, D), to add a "small holding" code (44) as well as "bare soil and rocks" code (54).
In July-August 99 Mr. Otto Huber visited the different institutions collaborating with the TREES project in South America to discuss and agree on the codes to be assigned to the different land-use and land-cover classes. Sorne important land uses/land cover appearing on the images that CIA T is processing did not ha ve a specific code ( even after the Caracas meeting). Following discussion we agreed to select existing codes to describe these ambiguous land uses/land covers instead of adding new ones. The ' 'paramo" vegetation was assigned to code 39, the "jalea" and "puno" vegetation to 329, "shrimp farming" to 59, "deciduous forest" (129A, 129B, 129C, 129D) and snow cover to 59. The codes for "arable land for agriculture" (411 or 412) were used to describe industrial and technical high-input agriculture, such as sugar cane, cotton, pine, et cetera. Low-input, small area agriculture was assigned "small holding" code (44).
The "ranching" code ( 43) was used for large areas of cattle activities. This was a simple task for cases where the limits of the area were geometrical ( e.g., a single large farm in the middle of the jungle). In other cases, the large area did not have geometrical boundaries, so it was impossible to tell if it corresponded toa single large farm or many small ones. We assumed that code 43 applied in these cases.
The regeneration areas ("vegetation re-growth" and "forest re-growth'') are not easy to distinguish, especially because the period when the land was abandoned is unknown. In addition, the spectral response of healthy vegetation re-growth with forest re-growth is similar in sorne cases. We should reconsider the period of time that defines what is "vegetation re-growth "and "forest re-growth". In the tropical forest, re-growth can last 100 years until the forest structure corresponds to that of the primary forest. In theory, the succession process in the secondary forest starts at the moment the land is abandoned and ends when the tree species are totally replaced by primary forest.
The deciduous forest class should have a Level 3 code for the dry forests in the American Tropics (we used codes 129A-D, "other deciduous forests") .
The classification key was translated to Spanish to ensure it could be clearly understood by our interpreters. Each translated code was checked and interpreted by Mr. Otto Huber to avoid interpretation mistakes.
24

Table 1 . Spanlsh ve.-slon of TREES Classmcatlon key used by CIAT
Nivel 1 Nlvel2 Ntv.l3 Ntv.l• 1 Baaaue mayo~ a 10% de cobertu~• de copea y m- del •o % de cobertu~• fa..-al
1 Bosque siempre verde y O Indefinido A Cerrado aha densidad aemi a1emprv verda 1 Bosque siempre wrda da t iarraa
ba'as cSalva Tropical) mas del 90% cobertura foreatal
2 Bosque siempre verda da monta/la B Cerrado media densidad lceosoue montano o nublado) 70-90% cobertura forestal 3 Boaque semi etem~everde -4, Bosque de turba amazon1ca e Abierto lccatlnoal 60- 70% cobertura foreetal 5 Bosauas de oinoa 6 Bambú o Fragmentado 9 Otro 40-60% cobertura forestal
2 Bosque declduo O Indefinido 1 Bosaua saco denso (Africa 2 Mlombo GAfrica 3 Bosque tu1co de eapeciea mixt&a ICAsia} .4 Bosque seco da D lpterocarpaceaa ICAsia) 9 Otro
3 Bosque inundado O Indefinido 1 Periodlcamente Inundado 2 Pe·rmanentemftnte inund•do, im9otqua de pantano) 3 Bos que de pantano c on palma ICAoua'ales) 4 TurbaiBosoua (bosaua da altura 9 Otro
4 Boaqua da galarra (bordea los rioe y esta ro deado de loa ato) 5 Plantaciones O Indefinido
1 Teca 2 Pino 3 Eucalipto 9 Otro
6 Regeneracl6n de bosques fmés de 10 alloa) 7 Manolo 9 Otro
2 . Moaelca en- un 10 y 40 % de cobertu~ fa~a.tal 1 Cult!Yos migratorios O Indefinido
1 Hasta 113 del area cultivede 2 Mas de 113 del araa cultivada
2 Tierraa agñcolaa y bosques ICpastos+cult!Yoa+bosaues} 3 Otra vag_atecl6n y bosque lrraaaneraclón v bosaua) 9 Otro
3. No baaaue m enaa del 10 % da cobertura da .,.,.,_ v menaa del 10 '!1. da cobartu~ fora-l 1 Atboles y matorrales O lndsfinldo
1 Sabana con matona\•• 2 Sabana arbolada 3 Sabana arbustiY& 4 Bambu S Sabana Inundada 6 sabana húmeda aiamprewrda (AIIlia 7 Sabana saca (AI>ia 9 Otro
2 Pradera O Indefinido 1 Pradera aaca 2 Pradera inundadas Pantanal} 9 Otro (Jalea Puno
3 Regeneración de vegatacion menos a 10 allos}
9 Ot<a (Páramos) 4_ Agrlcultu~ manoa del 10 '!1. da cabanura da COlO- v man.,. del 10 '!1. da cobarture ta....-1
1 Tierras arable• (cuhivos • O Indefinido g~n escala) 1 Con riego artificial
2 Con ria¡¡o natural OILNia 2 Plantaciones comercial•• O Indefinido
2 Caucho 3 Palma africana (p¡~lma aceitara 3 Café cacao coca 9 Otro
3 Grandes fincas aanadaraa 4 Peauallas fincas 9 Otro
5. No veaetadón 1 Urbano !oueblo ciudad) 2 Carreteras y camir1os 3 Infraestructura 1 Mlneña
2 Hidrolalec1rica 9 Otro camaronera• etc.
4 Suelo descubierto y rocas 9 Otro
6._Agua 1 Rioa 2 Lago, Laguna 1 Natural
2 Artificial 7_ Mar 8 _ Na vlalble e n la lrnaaen
1 Nubes 2 Sombras
9_ Sin lnfa~aclón
25
Annex 5
Forest cover change in South America
26
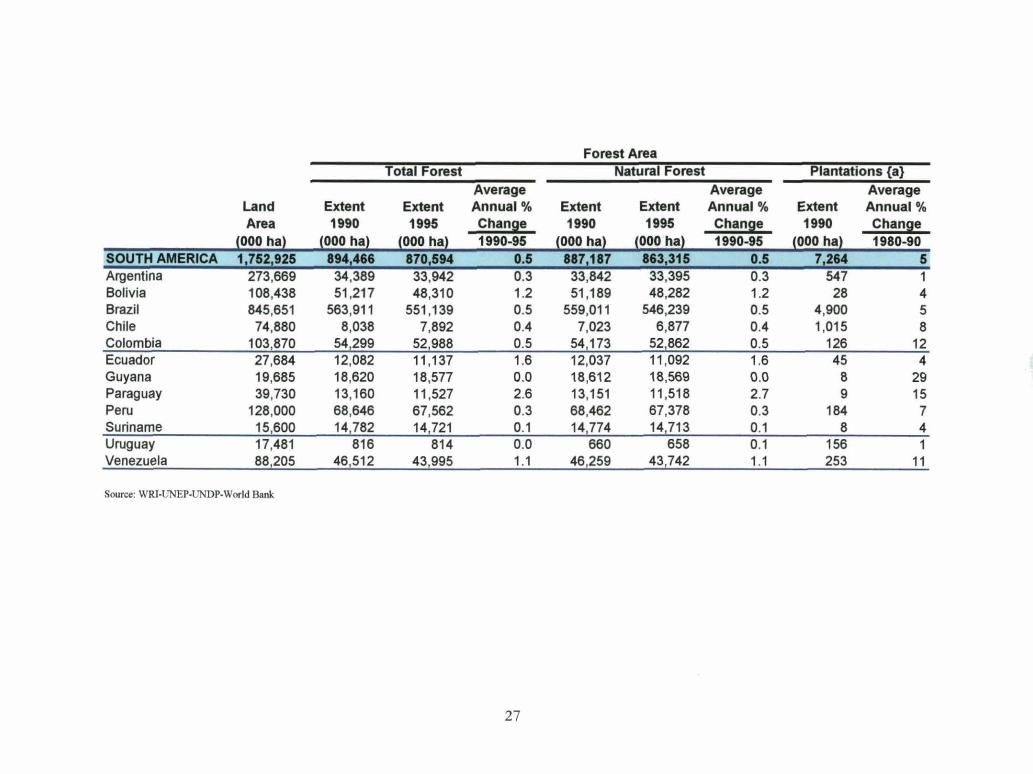
Forest Area Total Forest Natural Forest Plantations {a}
SOUTH AMERICA Argentina Bolivia Brazil Chile Colombia Ecuador Guyana Paraguay Peru Suriname Uruguay Venezuela
Average Average Land Extent Extent Annual % Extent Extent Annual % Extent Area 1990 1995 Change 1990 1995 Change 1990
(000 ha) (000 ha) (000 ha) 1990-95 (000 ha) (000 ha) 1990-95 (000 ha) 1,752,925 894,466 870,594 0.5 887,187 863,315 0.5 7,264
273,669 34,389 33,942 0.3 33,842 33,395 0.3 547 108,438 51 ,217 48,310 1.2 51 ,189 48 ,282 1.2 28 845,651 563,911 551 ,139 0.5 559,01 1 546,239 0.5 4,900
74,880 8,038 7 ,892 0.4 7,023 6,877 0.4 1,015 103,870 54,299 52,988 0.5 54,173 52,862 0.5 126 27,684 12,082 11,137 1.6 12,037 11 ,092 1.6 45 19,685 18,620 18,577 0.0 18,612 18,569 0 .0 8 39,730 13,160 11 ,527 2.6 13,151 11 ,518 2.7 9
128,000 68,646 67 ,562 0.3 68,462 67,378 0 .3 184 15,600 14,782 14,721 0.1 14,774 14,713 0.1 8 17,481 816 814 0.0 660 658 0.1 156 88,205 46,512 43,995 1.1 46,259 43,742 1.1 253
Source: WRl·UNEP-UNDP-World Bank
27
Average Annual% Change 1980-90
5 1 4 5 8
12 4
29 15
7 4 1
11
REF E R E NCES
Adger, W.N. and Brown K. 1994. Land use and the causes of global warming. John Wiley, UK. 271 p.
Altieri, M. 1996. Enfoque agroecológico para el desarrolllo de sistemas de producción sostenibles en Los Andes. Universidad de California, Berkeley/Clades. Centro de Investigación, Educación y Desarrollo (CIED ), Lima, Perú. 92 p.
Brawer, M. 1991. In: Atlas o f South America. Simon and Schuster, NY. p . 58-62.
Cuatrecasas, J . 1989. Frailejón típico de la vegetación en los páramos Andinos. En: PerezArbelaezia. Vol. 2, no . 8. Bogotá, Colombia.
Czaijka, W. 1968. Los perftles vegetales de la cordillera entre Alaska y Tierra del Fuego. In: Troll, C. (ed). G eoecology of the mountain regions o f the Tropical Americas. Fend, Dummlers Verlag, Bonn. p. 117-121.
Frohn, R.C. 1998. Remote sensing for landscape ecology. New metric indicators for monitoring. Modeling and assessment of ecosystems. CRC Press, Boca Raton, FL. 99 p.
Gastó, J . 1993. Aproximación agroecosistemica. E l agroecosistema Andino, problemas, limitaciones y perspectivas. En: Anales del Taller Internacional sobre el Agroecosistema Andino, 30 Mar-2 Abr, 1992, Centro Internacional de La Papa (CIP). CIP, Lima, Peru. p. 31-49.
Gazzo, J. 1982. D evelopment policies and plans for Peru's Amazon region. In: Amazonia, agriculture and land use research. Centro Internacional de Agricultura Tropical (CIA1), Cali, Colombia. p . 85-105.
Handelman, H . 1975. Struggle in the Andes: peasant political mobilization in Peru. Institute ofLatin American Studies, University ofTexas Press, Austin, TX. p. 23.
Hiroaka, M. and Yamamoto S. 1980. Agricultura! development in the upper Amazon of Ecuador. G eog. Rev. p. 431.
JRC Qoint Research Centre). 1997. Identification of deforestation hot spot areas in the humid tropics. Tropical Ecosystem E nvironment Observations by Satellites (fREES), European Commission. Synthesis of expert consultation meeting, 24-25 Nov 1997, Ispra, Italy. TREES Publications Series B. Research Report no. 4. 99 p.
Lajo L., M. 1983. Alternativa agraria y alimentaria: diagnóstico y propuesta para el Perú. Centro de Investigacion y Promoción del Campesino, Piura, Peru. 415 p.
28
MAG-INRENA (Ministerio de Agricultura-Instituto Nacional de Recursos Naturales). 1995. Mapa forestal del Perú. Dirección General de Bosques, MAG-INRENA, Lima, Peru.
Myers, N. 1984. The primary source: tropical forests and our future. Norton, NY. 150 p.
Navas, A. J. 1982. Considerations on the Colombian Amazon Region. In: Amazonia, agriculture and land use research. Centro Internacional de Agricultura Tropical (CIAT), Cali, Colombia. p. 41-59.
Ortiz, S. 1984. Colonization in the Colombian Amazon. In: Schmink M. and Wood C. (eds.) Frontier expansion in Amazonia. University Presses of Florida, FL. 206 p.
Rangel Ch.]; Lowy C.; Petter; and Cleef A.M. 1995. El páramo: ecosistema de alta montaña. ,Serie Montañas Tropoandinas. Vol l. 168 p.
Rudel, T.K. 1993. Tropical deforestation. Small farmers and land clearing in the Ecuadorian Amazon. Columbia University Press, NY.
Stadtrnüller, T. 1987. Los bosques nublados en los trópicos húmedos. Universidad de Las Naciones Unidas y Centro Agronómico Tropical de Investigación y Enseñanza (CATIE), Costa Rica. 85 p.
Stearman, A.M. 1985. Camba and kolla: migration and development in Santa Cruz, Bolivia. University of Central Florida Press, Orlando, FL. 158 p.
Tapia, M.E. 1986. Alternativas para el desarrollo agropecuario del trapecio Andino. En: Anales V Congreso Internacional de Sistemas Agropecuarios Andinos, 10-14 Marzo, 1986, Puno, Peru. Proyecto de Investigación de Sistemas Agropecuarios Andinos (PISA), Lima, Peru. p. 44-52.
Tapia, M.E. 1993. Vision general y características del agroecosistema Andino. En: Anales del Taller Internacional sobre el Agroecosistema Andino, 30 Mar-2 Abr, 1992, Centro Internacional de La Papa (CIP). CIP, Lima, Peru. p. 51-61.
Torres G ., J. 1993. Los agroecosistemas Andinos del Peru: La oferta ambiental de los Andes y algunas sugerencias para optimizar su utilizacion. In: El Agroescosistema Andino, Anales del Taller Internacional sobre Agroecosistemas Andino, 30 Marzo-2 Abril, 1992, Centro Internacional de la Papa (CIP). Lima, Peru. p. 97-108.
Utting, P. 1993. Trees, people and power. Social dímensions of deforestation and forest protection in Central America. Earthscan Publ., London. p. 14.
WRI-UNEP-UNDP-World Bank (World Resources Institute- United Nations Environment Programme-United Nations Development Programme-World Bank). 1998. In: World Resources, 1998-99. WRI-UNEP-UNDP-World Bank, NY. p. 291-302.
29