Treatment of Primary and Secondary Osteoarthritis of the ...€¦ · Evidence Report/Technology...
270
Evidence Report/Technology Assessment Number 157 Treatment of Primary and Secondary Osteoarthritis of the Knee Prepared for: Agency for Healthcare Research and Quality U.S. Department of Health and Human Services 540 Gaither Road Rockville, MD 20850 www.ahrq.gov Contract No. 290-02-0026 Prepared by: Blue Cross and Blue Shield Association Technology Evaluation Center Evidence-based Practice Center Chicago, Illinois Investigators David J. Samson, M.S. Mark D. Grant, M.D., M.P.H. Thomas A. Ratko, Ph.D. Claudia J. Bonnell, B.S.N., M.L.S. Kathleen M. Ziegler, Pharm.D. Naomi Aronson, Ph.D. AHRQ Publication No. 07-E012 September 2007
Transcript of Treatment of Primary and Secondary Osteoarthritis of the ...€¦ · Evidence Report/Technology...

Evidence Report/Technology Assessment Number 157
Treatment of Primary and Secondary Osteoarthritis of the Knee Prepared for: Agency for Healthcare Research and Quality U.S. Department of Health and Human Services 540 Gaither Road Rockville, MD 20850 www.ahrq.gov Contract No. 290-02-0026 Prepared by: Blue Cross and Blue Shield Association Technology Evaluation Center Evidence-based Practice Center Chicago, Illinois
Investigators David J. Samson, M.S. Mark D. Grant, M.D., M.P.H. Thomas A. Ratko, Ph.D. Claudia J. Bonnell, B.S.N., M.L.S. Kathleen M. Ziegler, Pharm.D. Naomi Aronson, Ph.D. AHRQ Publication No. 07-E012 September 2007

This report is based on research conducted by the Blue Cross and Blue Shield Association Technology Evaluation Center Evidence-based Practice Center (EPC) under contract to the Agency for Healthcare Research and Quality (AHRQ), Rockville, MD (Contract No. 290-02-0026). The findings and conclusions in this document are those of the author(s), who are responsible for its content, and do not necessarily represent the views of AHRQ. No statement in this report should be construed as an official position of AHRQ or of the U.S. Department of Health and Human Services. The information in this report is intended to help clinicians, employers, policymakers, and others make informed decisions about the provision of health care services. This report is intended as a reference and not as a substitute for clinical judgment. This report may be used, in whole or in part, as the basis for the development of clinical practice guidelines and other quality enhancement tools, or as a basis for reimbursement and coverage policies. AHRQ or U.S. Department of Health and Human Services endorsement of such derivative products may not be stated or implied.

ii
This document is in the public domain and may be used and reprinted without permission except those copyrighted materials noted for which further reproduction is prohibited without the specific permission of copyright holders. Suggested Citation: Samson DJ, Grant MD, Ratko TA, Bonnell CJ, Ziegler KM, Aronson N. Treatment of Primary and Secondary Osteoarthritis of the Knee. Evidence Report/Technology Assessment No. 157 (Prepared by Blue Cross and Blue Shield Association Technology Evaluation Center Evidence-based Practice Center under Contract No. 290-02-0026). AHRQ Publication No. 07-E012. Rockville, MD: Agency for Healthcare Research and Quality. September 2007.
None of the investigators has any affiliations or financial involvement that conflicts with the material presented in this report.

iii
Preface
The Agency for Healthcare Research and Quality (AHRQ), through its Evidence-Based Practice Centers (EPCs), sponsors the development of evidence reports and technology assessments to assist public- and private-sector organizations in their efforts to improve the quality of health care in the United States. The reports and assessments provide organizations with comprehensive, science-based information on common, costly medical conditions and new health care technologies. The EPCs systematically review the relevant scientific literature on topics assigned to them by AHRQ and conduct additional analyses when appropriate prior to developing their reports and assessments. To bring the broadest range of experts into the development of evidence reports and health technology assessments, AHRQ encourages the EPCs to form partnerships and enter into collaborations with other medical and research organizations. The EPCs work with these partner organizations to ensure that the evidence reports and technology assessments they produce will become building blocks for health care quality improvement projects throughout the Nation. The reports undergo peer review prior to their release. AHRQ expects that the EPC evidence reports and technology assessments will inform individual health plans, providers, and purchasers as well as the health care system as a whole by providing important information to help improve health care quality. We welcome comments on this evidence report. They may be sent by mail to the Task Order Officer named below at: Agency for Healthcare Research and Quality, 540 Gaither Road, Rockville, MD 20850, or by e-mail to [email protected]. Carolyn M. Clancy, M.D. Jean Slutsky, P.A., M.S.P.H. Director Director, Center for Outcomes and Evidence Agency for Healthcare Research and Quality Agency for Healthcare Research and Quality Beth A. Collins Sharp, Ph.D., R.N. Capt. Ernestine Murray, R.N., M.A.S. Director, EPC Program EPC Program Task Order Officer Agency for Healthcare Research and Quality Agency for Healthcare Research and Quality


v
Acknowledgments The research team would like to acknowledge the efforts of Maxine A. Gere, M.S., for general editorial assistance and program support; Carol Gold-Boyd for administrative support; and Tina Murray, R.N., M.A.S., Senior Health Policy Analyst, Agency for Healthcare Research and Quality Center for Outcomes and Evidence, for advice as our Task Order Officer.


vii
Structured Abstract Objectives: Systematic review of outcomes of three treatments for osteoarthritis (OA) of the knee: intra-articular viscosupplementation; oral glucosamine, chondroitin or the combination; and arthroscopic lavage or debridement. Data Sources: We abstracted data from: 42 randomized, controlled trials (RCTs) of viscosupplementation, all but one synthesized among six meta-analyses; 21 RCTs of glucosamine/chondroitin, 16 synthesized among 6 meta-analyses; and 23 articles on arthroscopy. The search included foreign-language studies and relevant conference proceedings. Review Methods: The review methods were defined prospectively in a written protocol. We sought systematic reviews, meta-analyses, and RCTs published in full or in abstract. Where randomized trials were few, we sought other study designs. We independently assessed the quality of all primary studies. Results: Viscosupplementation trials generally report positive effects on pain and function scores compared to placebo, but the evidence on clinical benefit is uncertain, due to variable trial quality, potential publication bias, and unclear clinical significance of the changes reported. The Glucosamine/Chondroitin Arthritis Intervention Trial (GAIT), a large (n=1,583), high-quality, National Institutes of Health-funded, multicenter RCT showed no significant difference compared to placebo. Glucosamine sulfate has been reported to be more effective than glucosamine hydrochloride, which was used in GAIT, but the evidence is not sufficient to draw conclusions. Clinical studies of glucosamine effect on glucose metabolism are short term, or if longer (e.g., 3 years), excluded patients with metabolic disorders. The best available evidence for arthroscopy, a single sham-controlled RCT (n=180), showed that arthroscopic lavage with or without debridement was equivalent to placebo. The main limitations of this trial are the use of a single surgeon and enrollment of patients at a single Veterans Affairs Medical Center. No studies reported separately on patients with secondary OA of the knee. The only comparative study was an underpowered, poor-quality trial comparing viscosupplementation to arthroscopy with debridement. Conclusions: Osteoarthritis of the knee is a common condition. The three interventions reviewed in this report are widely used in the treatment of OA of the knee, yet the best available evidence does not clearly demonstrate clinical benefit. Uncertainty regarding clinical benefit can be resolved only by rigorous, multicenter RCTs. In addition, given the public health impact of OA of the knee, research on new approaches to prevention and treatment should be given high priority.


ix
Contents Executive Summary .........................................................................................................................1 Evidence Report .............................................................................................................................7 Chapter 1. Introduction ...................................................................................................................9 Burden of Illness ........................................................................................................................9 Clinical Management .................................................................................................................9 Pathophysiology...................................................................................................................9 Classification......................................................................................................................10 Diagnosis............................................................................................................................10 Treatment ...........................................................................................................................11 Interventions Addressed in This Report ............................................................................11 Key Questions for This Systematic Review ............................................................................15
Chapter 2. Methods.......................................................................................................................17 Peer Review .............................................................................................................................17 Study Selection Criteria ...........................................................................................................17 Types of Studies.................................................................................................................19 Types of Participants..........................................................................................................19 Types of Interventions .......................................................................................................19 Types of Outcomes ............................................................................................................20 Pain and Function Measurement Issues.............................................................................21 Search Strategy and Review ....................................................................................................23 Search Strategy ..................................................................................................................23 Search Screen.....................................................................................................................23 Data Extraction and Analysis...................................................................................................24 Data Elements ....................................................................................................................24 Evidence Tables .................................................................................................................26 Assessment of Study Quality ...................................................................................................26 Definition of Ratings Based on Criteria.............................................................................26 Primary RCTs and Quasi-Experimental Studies................................................................26 Systematic Reviews and Meta-Analyses ...........................................................................27 Case Series .........................................................................................................................30 Chapter 3. Results and Conclusions..............................................................................................33 Part I: Intra-Articular Hyaluronan Effectiveness and Harms .................................................33 Literature Overview...........................................................................................................33 Results, Part I: Key Questions 1 and 2 .............................................................................33 Adverse Events ..................................................................................................................54 Supplementary Analyses Performed by the Evidence-Based Practice Center ..................55 Summary and Appraisal.....................................................................................................58 Results, Part I: Key Question 3 (Subgroup Analyses)......................................................63 Results, Part I: Key Question 4 (Comparative Outcomes) ...............................................64
Conclusions: Part I............................................................................................................64

x
Part II: Glucosamine/Chondroitin Effectiveness and Harms..................................................65 Literature Overview...........................................................................................................66 Results, Part II: Key Questions 1 and 2 ............................................................................67 Results, Part II: Key Question 3 (Subgroup Analyses)...................................................104 Results, Part II: Key Question 4 (Comparative Outcomes)............................................105 Conclusions: Part II.........................................................................................................106
Part III: Arthroscopy Effectiveness and Harms ....................................................................108 Literature Overview.........................................................................................................108 Results, Part III: Key Questions 1 and 2.........................................................................108 Results, Part III: Key Question 3 (Subgroup Analyses) .................................................135 Results, Part III: Key Question 4 (Comparative Outcomes)...........................................137 Conclusions: Part III .......................................................................................................139
Chapter 4. Discussion and Future Research ...............................................................................141
Minimal Clinically Important Improvement in Pain and Function Should be the Measure of Success for all Trials.....................................................................................142
Unpublished Studies Should be Made Available as Full-Text Publications .........................142 The Pitfalls of Meta-Analysis Should be More Widely Recognized and Acknowledged.....142 Specific Research Recommendations ....................................................................................143 References....................................................................................................................................147 List of Acronyms/Abbreviations..................................................................................................157 Figures Figure 1. Systematic review process ...........................................................................................18 Figure 2. QUOROM flow diagram .............................................................................................24 Figure 3. Oxman and Guyatt rating.............................................................................................28 Figure 4. Forest plot of hylan G-F 20 studies reporting VAS pain at 5 to 13
weeks—weight-bearing or WOMAC (95% confidence intervals)..............................59 Tables Table 1. U.S. FDA-approved hyaluronan products and product information statements..........12 Table 2. Carey and Boden case series quality assessment tool..................................................31 Table 3. Radiographic classification and grade in included viscosupplement RCTs ................34 Table 4. Number of participants randomized and reported in abstracts, unpublished
and published RCTs of hyaluronan-based products ....................................................36 Table 5. Outcome measures pooled in viscosupplementation meta-analyses relevant
to Key Questions 1 & 2................................................................................................36 Table 6. Viscosupplementation RCTs addressing Key Questions.............................................37 Table 7. Overview quality assessment questionnaire ratings of viscosupplementation
meta-analyses...............................................................................................................39 Table 8. Characteristics of study-level viscosupplementation meta-analyses ...........................41 Table 9. Overall result for pain from Lo, LaValley, McAlindon, et al. (2003) .........................43

xi
Table 10. Overall results for pain with activity and function for non-G-F 20 hyaluronans (non-cross-linked) from Wang, Chen, Huang, et al. (2004)....................45
Table 11. Subgroup results for non-cross-linked hyaluronans ....................................................45 Table 12. Pooled visual analog scale results for rest and activity pain from Arrich,
Piribauer, Mad, et al. (2005) ........................................................................................46 Table 13. Pooled results joint function from Arrich, Piribauer, Mad, et al. (2005).....................47 Table 14. Pooled visual analog scale pain change from Modawal, Ferrer, Choi,
et al. (2005) ..................................................................................................................47 Table 15. Pooled visual analog scale pain change for high-quality RCTs from Modawal,
Ferrer, Choi, et al. (2005).............................................................................................48 Table 16. Pooled visual analog scale results for rest and weight-bearing pain from
Bellamy, Campbell, Robinson, et al. (2006)................................................................49 Table 17. Pooled Western Ontario and McMaster Osteoarthritis Index pain results from
Bellamy, Campbell, Robinson, et al. (2006)................................................................49 Table 18. Pooled Western Ontario and McMaster Osteoarthritis Index function results
from Bellamy, Campbell, Robinson, et al. (2006).......................................................49 Table 19. Pooled Lequesne Index results from Bellamy, Campbell, Robinson, et al. (2006).....49 Table 20. Pooled global assessment results from Bellamy, Campbell,
Robinson, et al. (2006).................................................................................................50 Table 21. Numbers needed to treat for various outcomes from Bellamy, Campbell,
Robinson, et al. (2006).................................................................................................51 Table 22. Results of sensitivity analyses for Bellamy, Campbell, Robinson, et al.
(2006) 5–13 week pain.................................................................................................56 Table 23. Summary pain result closest to 8–12 weeks and key characteristics
of study-level viscosupplementation meta-analyses....................................................60 Table 24. Results by subgroups from Altman and Moskowitz (1998) ........................................63 Table 25. Summary description of meta-analyses of glucosamine and chondroitin
in knee osteoarthritis ....................................................................................................67 Table 26. Additional RCTs not included in glucosamine and chondroitin meta-analyses ..........67 Table 27. Oxman and Guyatt method quality evaluation of glucosamine and
chondroitin meta-analyses ........................................................................................69 Table 28. Methodologic characteristics of glucosamine and chondroitin meta-analyses............71 Table 29. Primary randomized trials included in glucosamine meta-analyses ............................73 Table 30. Primary randomized trials included in chondroitin meta-analyses..............................74 Table 31. Clinical outcomes in RCTs of glucosamine that meet protocol selection criteria.......76 Table 32. Clinical outcomes in RCTs of chondroitin that meet protocol selection criteria.........76 Table 33. Clinical outcomes in RCTs of glucosamine plus chondroitin that
meet protocol selection criteria.................................................................................77 Table 34. Baseline characteristics of randomized trials of glucosamine that meet
protocol selection criteria.............................................................................................78 Table 35. Baseline characteristics of randomized trials of chondroitin treatment
that meet protocol selection criteria.............................................................................81 Table 36. Baseline characteristics of randomized trials of glucosamine plus chondroitin
treatment that meet protocol selection criteria.............................................................83 Table 37. Quality ratings of randomized trials of glucosamine that meet protocol
selection criteria ...........................................................................................................84

xii
Table 38. Quality ratings of randomized trials of chondroitin that meet protocol selection criteria ...........................................................................................................85
Table 39. Bjordal, Klovning, Ljunggren, et al. (2006) meta-analysis clinical outcomes ............86 Table 40. Towheed, Maxwell, Anastassiades, et al. (2006) meta-analysis outcomes .................87 Table 41. Towheed, Maxwell, Anastassiades, et al. (2006) sensitivity and subgroup
analyses for pooled composite pain measurement.......................................................88 Table 42. Poolsup, Suthisisang, Channark, et al. (2005) meta-analysis clinical outcomes .........89 Table 43. Richy, Bruyere, Ethgen, et al. (2003) meta-analysis clinical outcomes ......................90 Table 44. Leeb, Schweitzer, Montag, et al. (2000) meta-analysis clinical outcomes..................91 Table 45. McAlindon, LaValley, Gulin, et al. (2000) meta-analysis clinical outcomes..............92 Table 46. McAlindon, LaValley, Gulin, et al. (2000) sensitivity analyses for pooled
composite pain measurement.......................................................................................92 Table 47. Key health outcomes of all randomized patients in GAIT ..........................................94 Table 48. GAIT patients with mild pain (WOMAC pain score 125–300) ..................................95 Table 49. Outcomes from Michel, Stucki, Frey, et al. (2005) .....................................................96 Table 50. Outcomes from Uebelhart, Malaise, Marcolongo, et al. (2004) ..................................97 Table 51. Outcomes from Das and Hammad (2000) ...................................................................98 Table 52. Outcomes from Herrero-Beaumont, Roman, Trabado, et al. (2007; GUIDE) ............99 Table 53. Results of Rotta-related studies meeting protocol selection criteria .........................101 Table 54. Adverse events associated with glucosamine treatment in placebo-controlled
RCTs that meet protocol selection criteria.................................................................102 Table 55. Adverse events associated with chondroitin treatment in placebo-controlled
RCTs that meet protocol selection criteria.................................................................103 Table 56. GAIT Patients with moderate-to-severe pain (WOMAC pain score 301–400).........105 Table 57. Arthroscopy placebo-controlled RCT, sample selection ...........................................109 Table 58. Arthroscopy placebo-controlled RCT, interventions.................................................109 Table 59. Arthroscopy placebo-controlled RCT, patient characteristics ...................................110 Table 60. Arthroscopy placebo-controlled RCT, outcome assessment .....................................110 Table 61. Arthroscopy placebo-controlled RCT, study quality assessment ..............................111 Table 62. Arthroscopy placebo-controlled RCT, results ...........................................................112 Table 63. Arthroscopy non-placebo RCTs, sample selection....................................................114 Table 64. Arthroscopy non-placebo RCTs, patient characteristics............................................114 Table 65. Arthroscopy non-placebo RCTs, interventions..........................................................115 Table 66. Arthroscopy non-placebo RCTs, study quality..........................................................115 Table 67. Arthroscopy non-placebo RCTs, results ....................................................................116 Table 68. Arthroscopy quasi-experimental study, sample selection..........................................117 Table 69. Arthroscopy quasi-experimental study, patient characteristics .................................117 Table 70. Arthroscopy quasi-experimental study, interventions ...............................................117 Table 71. Arthroscopy quasi-experimental study, study quality ...............................................118 Table 72. Arthroscopy quasi-experimental study, results..........................................................118 Table 73. Arthroscopy administrative database, further surgery results....................................120 Table 74. Arthroscopy administrative database, adverse event results......................................120 Table 75. Arthroscopy case series, sample selection .................................................................122 Table 76. Arthroscopy case series, patient characteristics.........................................................124 Table 77. Arthroscopy case series, treatments...........................................................................126 Table 78. Arthroscopy case series, study quality.......................................................................127

xiii
Table 79. Arthroscopy case series, validated outcome scales ...................................................129 Table 80. Arthroscopy case series, Hospital for Special Surgery rating....................................129 Table 81. Arthroscopy case series, patient global change assessment.......................................130 Table 82. Arthroscopy case series, patient global result assessment .........................................131 Table 83. Arthroscopy case series, symptom/function improvement........................................132 Table 84. Arthroscopy case series, further surgery....................................................................133 Table 85. Arthroscopy case series, adverse events ....................................................................134 Table 86. Arthroscopy non-placebo RCTs, sample selection....................................................137 Table 87. Arthroscopy non-placebo RCTs, patient characteristics............................................137 Table 88. Arthroscopy non-placebo RCTs, interventions..........................................................138 Table 89. Arthroscopy non-placebo RCTs, study quality..........................................................138 Table 90. Arthroscopy non-placebo RCTs, results ....................................................................138 Table 91. Future Research Recommendations for Osteoarthritis of the
Knee---EPICOT Framework......................................................................................144 Appendixes Appendix A: Exact Search Strings Appendix B: List of Excluded Studies Appendix C: Evidence Tables Appendix D: Technical Expert Panel and Peer Reviewers Appendixes and Evidence Tables for this report are provided electronically at http://www.ahrq.gov/downloads/pub/evidence/pdf/oaknee/oaknee.pdf.


1
Executive Summary
Osteoarthritis (OA) affects about 21 million people in the United States. By age 65, the majority of the population has radiographic evidence of osteoarthritis and 11 percent have symptomatic OA of the knee. This is a systematic review of three treatments for OA of the knee: intra-articular injections of viscosupplements; oral glucosamine, chondroitin, or the combination; and, arthroscopic lavage and debridement. The key questions are: (1) effectiveness and harms in primary OA of the knee, (2) in secondary OA of the knee, (3) in subpopulations, and (4) comparison of the three interventions.
Methods
The review methods were defined prospectively in a written protocol. A technical expert panel provided consultation. The draft report was also reviewed by other experts and stakeholders.
We sought systematic reviews, meta-analyses, and RCTs published in full or in abstract that reported on one or more of the interventions among patients with primary or secondary osteoarthritis of the knee; and reported at least one outcome of interest. Primary outcomes were pain, function, quality of life and adverse effects.
Our search had no language restrictions and used these electronic databases:
• MEDLINE® (through March 29, 2007) • EMBASE (through March 16, 2006) • Cochrane Controlled Trials Register (through November 27, 2006).
EMBASE was updated with abbreviated searches through November 27, 2006. Additional sources were 2004–2006 conference proceedings of the American Association of Orthopedic Surgeons (AAOS), American College of Rheumatology (ACR) and the Osteoarthritis Research Society International (OARSI). Product inserts of U.S.-marketed viscosupplements were consulted.
There were few RCTs on arthroscopy or comparative outcomes, so we also sought nonrandomized comparative trials and, for arthroscopy, administrative database analyses and case series (n>50). Because several comprehensive systematic reviews with meta-analyses on viscosupplementation and glucosamine/chondroitin had been published, we focused on detailed review of existing meta-analyses, supplemented by primary studies where necessary.
Of 1,842 citations, 451 articles were retrieved and 98 selected for inclusion:
• Six meta-analyses (N=41 trials) and one additional trial of viscosupplementation • Six meta-analyses (N=16 trials) and five additional trials of glucosamine/chondroitin • 23 articles on arthroscopy.

2
A single reviewer screened citations for article retrieval; citations judged as uncertain were reviewed by a second reviewer. The same procedure was used to select articles for inclusion in the review. A single reviewer performed data abstraction and a second reviewed the evidence tables for accuracy. However, study quality was appraised by dual independent review. All disagreements were resolved by consensus.
The quality of RCTs and quasi-experimental studies were assessed using the general approach developed by the U.S. Preventive Services Task Force (Harris, Helfand, Woolf, et al. 2001). Assessment of the quality of systematic reviews and meta-analyses were guided by a quality rating method reported by Oxman and Guyatt (1991). The framework proposed by Carey and Boden (2003) was used to assess the quality of case series.
Results
Viscosupplementation
Effectiveness and Harms in Primary OA of the Knee. Results from 42 trials (N=5,843), all but one synthesized in various combinations in six meta-analyses, generally show positive effects of viscosupplementation on pain and function scores compared to placebo. However, the evidence on viscosupplementation is accompanied by considerable uncertainty due to variable trial quality, potential publication bias, and unclear clinical significance of the changes reported.
The pooled effects from poor quality trials were as much as twice those obtained from higher quality ones. Pooled results from small trials (<100 patients) showed effects up to twice those of larger trials, a finding consistent with selective publication of underpowered positive trials. Among trials of viscosupplementation, those that have not been published in full text comprise approximately 25 percent of the total patient population.
Most RCTs reported results as mean changes in pain and function. Interpreting the clinical significance of pooled mean effects from the meta-analyses is difficult; mean changes do not quantify proportions responding. Numbers needed to treat cannot be calculated from mean changes. It would be more informative to report response rate, i.e., comparison of the proportion of patients achieving a clinically important improvement.
Trials of hylan G-F 20, the highest molecular weight cross-linked product, generally reported larger effects than other trials.
Minor adverse events accompanying intra-articular injections are common, but the relative risk accompanying hyaluronan injections over placebo appears to be small. Pseudoseptic reactions associated with hyaluronans appear relatively uncommon, but can be severe.
Differences in Outcomes Among Subpopulations. Four RCTs were identified examining any of the specified subgroups. None examined race/ethnicity, disease duration, or prior treatment. In one trial, randomization was stratified by disease severity; all other subgroup results were obtained in post-hoc analyses. There was no evidence for differential effects according to subgroups defined by age, sex, primary/disease, body mass index/weight, or disease severity. One positive post-hoc subgroup analysis found greater efficacy among older individuals with more severe disease, but was not confirmed in a subsequent trial.

3
Glucosamine, Chondroitin, Alone or in Combination Effectiveness and Harms in Primary OA of the Knee. The best evidence comes from the
Glucosamine/Chondroitin Arthritis Intervention Trial (GAIT; Clegg, Reda, Harris, et al., 2006), a large (n=1,583), good quality, NIH-funded, multicenter RCT. GAIT compared glucosamine hydrochloride, chondroitin sulfate, or the combination of these agents, with placebo or celecoxib in patients with primary osteoarthritis of the knee. After 24 weeks of treatment, intention-to-treat analysis showed no significant difference in symptomatic relief between glucosamine hydrochloride, chondroitin sulfate, or glucosamine hydrochloride plus chondroitin sulfate compared to placebo. Substantiating this result was that celecoxib, the active control, was effective.
Six study-level meta-analyses (MAs) assessed glucosamine or chondroitin in OA of the knee. All but one of the MAs reported statistically significant differences between treatment and placebo. However, these MAs had limitations in the quality of the primary studies that were pooled. Limitations of the primary literature included small study size, inclusion of studies that assessed joints other than knee, and failure to report intent to treat analysis. In general, the MAs did not perform adequate quality appraisal of the primary studies.
Glucosamine sulfate has been reported to be more effective than glucosamine hydrochloride, however, the evidence is not sufficient to draw conclusions. A subgroup analysis in the largest MA (Towheed, Maxwell, Anastassiades, et al., 2006) significantly favored glucosamine sulfate. The results of GUIDE (Herrero-Beaumont, Roman, Trabado, et al., 2007), a European placebo-controlled RCT (n=318), sponsored by Rotta, a glucosamine sulfate manufacturer, report favorable results for glucosamine sulfate. While the overall results of GAIT show no benefit, in the subgroup of knee OA patients with moderate-to-severe pain at baseline, the combination of glucosamine hydrochloride and chondroitin sulfate significantly improved pain. Together, this evidence suggests an independent trial of glucosamine sulfate would be useful to definitively establish whether there is benefit.
In general, adverse events with glucosamine or chondroitin treatment were no greater than placebo. There has been some concern from in vitro and preclinical studies that glucosamine supplementation could have a deleterious effect on glucose metabolism and glycemic control. However, available clinical studies are short-term, or if longer (e.g., 3 years), excluded patients with metabolic disorders.
Differences in Outcomes Among Subpopulations. GAIT found that glucosamine plus chondroitin produced a statistically and clinically significant improvement of pain in patients with moderate-to-severe OA of the knee. Although the effect of celecoxib treatment in a similar group of patients was not statistically significant, the magnitude and direction of the response were consistent with clinical benefit. The nonsignificant statistical result in the celecoxib arm may be a function of insufficient power due to the small number of patients. Although this subgroup analysis was not explicitly prespecified in the GAIT protocol, the stratified randomization by disease severity yields statistically valid comparisons. A trial of glucosamine sulfate would be useful to definitively establish whether there is benefit.
Arthroscopic Lavage and Debridement
Effectiveness and Harms in Patients With Primary OA. The best available evidence, a single placebo-controlled RCT, found arthroscopic lavage with or without debridement was not

4
superior to placebo. The evidence base does not definitively show that arthroscopy is no more effective than placebo. However, additional high-quality RCTs would be necessary to refute the existing trial, which suggests equivalence between placebo and arthroscopy.
No other study besides Moseley, O’Malley, Petersen, et al. (2002) addressed the potential contribution of placebo effects to apparent improvement in outcome after arthroscopy. The primary limitations of the Moseley, O’Malley, Petersen, et al. (2002) trial are lack of details describing the patient sample, the use of a single surgeon, and enrollment of patients at a single Veterans Affairs Medical Center. These concerns call into question the generalizability of this trial’s findings. Since OA of the knee affects a large population, uncertainty about arthroscopy’s effectiveness should be resolved with further well-conducted and well-reported RCTs.
Major methodologic shortcomings in non-placebo RCTs, an administrative database analysis and case series preclude resolution of uncertainties raised by the trial of Moseley, O’Malley, Petersen, et al. (2002).
Evidence on the harms after arthroscopic lavage and debridement comes primarily from an administrative database analysis and case series reports. Potential harms include infection, prolonged drainage from arthroscopic portals, effusion, hemarthrosis and deep vein thrombosis. To determine whether the risk of such harms is acceptable, it is important to establish whether the effectiveness of arthroscopic lavage and debridement surpasses placebo.
Differences in Outcome Among Subpopulations. Subgroup analyses for mechanical symptoms, alignment and OA stage were performed in the Moseley placebo-controlled RCT. No differences in results were observed within subgroups. Subgroup analyses were also performed in a quasi-experimental study, an administrative database and several case series. In these studies, different outcomes were observed according to age, presence of mechanical symptoms, and severity of OA. However, since these studies did not include placebo controls, it cannot be concluded that arthroscopy has greater effectiveness in specific patient subgroups.
All Interventions
Effectiveness and Harms in Secondary OA of the Knee. We identified no studies that enrolled patients with only secondary OA of the knee, or that reported separately on secondary OA of the knee.
Comparison of Interventions. We did not find any direct comparative studies in which glucosamine, chondroitin, or glucosamine plus chondroitin were compared with arthroscopy or viscosupplementation to treat OA of the knee. A single, small, underpowered, poor quality trial found no difference in outcome measures comparing intra-articular hyaluronan to arthroscopy and debridement over a 1-year followup. Discussion and Future Research
OA of the knee is a common condition and the three interventions reviewed in this report are widely used in the treatment of OA of the knee. Yet the best available evidence reports that glucosamine/chondroitin and arthroscopic surgery are no more effective than placebo. The Glucosamine/Chondroitin Arthritis Intervention Trial (GAIT) (n=1,583) found that neither glucosamine hydrochloride, chondroitin sulfate nor the combination was superior to placebo and that all were inferior to celecoxib. The double blind randomized controlled trial by Moseley, O’Malley, Petersen, et al. (2002, n=180) found that arthroscopic lavage with or without

5
debridement was not superior to sham arthroscopy. Results from 42 RCTs, all but one of which were synthesized in various combinations in six meta-analyses, generally show positive effects of viscosupplementation on pain and function scores compared to placebo. However, the evidence on viscosupplementation is accompanied by considerable uncertainty due to variable trial quality, potential publication bias, and unclear clinical significance of the changes reported.
For viscosupplementation, higher-quality trials are in the minority and show smaller effects; there are numerous patients lost to follow-up, and a substantial portion of studies (25 percent of total patients) have not been published as full articles. The clinical significance of reported changes in pain and function scores is uncertain, as almost all studies compare only mean difference between arms. Although the overall pooled estimate suggests that hylan G-F 20 may have a larger effect than other hyaluronans, whether this represents a meaningful clinical effect or limitations in the quality and completeness of study reporting is unknown. A rigorous RCT that showed strong evidence of improvement in pain and function would be necessary to conclude that viscosupplementation is beneficial.
While the overall results of GAIT show no benefit, a subgroup analysis found that the combination of glucosamine hydrochloride and chondroitin sulfate significantly improved pain in patients with moderate-to-severe OA of the knee. Although this subgroup analysis was not explicitly prespecified in the GAIT protocol, the stratified randomization by disease severity yields statistically valid comparisons. The nonsignificant statistical result in the celecoxib arm in the same patient subgroup may be a function of insufficient power. Given the small number of patients in the moderate-to-severe subgroup, and the large number of such patients in the general population, a further trial can be justified. However, these subgroup results do not override the overall results of GAIT, which must stand unless confirmed in a rigorous RCT.
The existing evidence does not definitively show that arthroscopic lavage with or without debridement is no more effective than placebo. However, additional placebo-controlled RCTs showing clinically significant advantage for arthroscopy would be necessary to refute the Moseley results, which show equivalence between placebo and arthroscopy. The recently published Spine Patient Outcomes Research Trial (SPORT) offers an alternative study design that could be informative, a rigorous RCT comparing surgery to conservative management, rather than sham (Weinstein, Tosteson, Lurie, et al., 2006).
Overall, our recommendations for future research reach beyond the specific treatments addressed in this report, and are intended broadly to improve the quality of research and reporting on interventions for osteoarthritis of the knee. However, our population is aging, there is increasing prevalence of obesity, and increasing burden of knee osteoarthritis, together with inconsistent evidence regarding disease treatments. Given the public health impact, research on new approaches to prevention and treatment should be given high priority.
Minimally Clinically Important Improvement in Pain and Function Should be the Measure of Success for All Trials. Clinically meaningful results require outcome measures establishing that patients experience improvement that is important to them—meaningful clinically important improvement. The range of magnitude of improvement clinically important to patients has been estimated for VAS pain and WOMAC measures, while to a lesser degree for the Lequesne Index (see Methods). Common measures and intervals for measurement will produce a more robust body of cumulative evidence and improve the ability to compare and pool results among trials.
Unpublished Studies Should be Made Available as Full Text Publications. Among RCTs of viscosupplementation, those that have not been published in full text comprise approximately

6
25 percent of the total patient population. Several meta-analyses of glucosamine report that trials of the Rotta product, glucosamine sulfate, show outcomes superior to trials of glucosamine hydrochloride; yet key trials have not been published as full-text studies. Existing studies should be published in full. And all trials should be registered at inception at ClinicalTrials.gov along with anticipated date for full release of results.
The Pitfalls of Meta-Analysis Should be More Widely Recognized and Acknowledged. Our evidence report draws heavily on six study-level meta-analyses of glucosamine/chondroitin and five of viscosupplementation. While we used a validated instrument to appraise the quality of the systematic reviews, the instrument does not address the question of when meta-analysis is appropriate to a systematic review. Meta-analysis is a technique with underlying assumptions that may or may not hold when a particular collection of results are pooled. Furthermore, meta-analyses may fail to convey the real uncertainty and potential bias accompanying pooled estimates.
Uncertainty in the magnitude of effects pooled is influenced by factors intrinsic to the underlying trials. Among these are variable patient characteristics, trial characteristics, and the indication that a few trial results were outliers and influential on pooled estimates. The meta-analyses frequently reported high inter-trial heterogeneity. Random effects models were used in the face of high heterogeneity, but a consequence is to increase the influence of smaller trials on the pooled results. The meta-analyses did not address a threshold question, one that has not been clearly resolved by practitioners of meta-analysis: when is heterogeneity too high to justify pooling trial results. A related concern is the practice of reporting on multiple outcome measures and time intervals, which may be represented by a small portion of studies, thus potentially introducing bias.
Conclusions
Osteoarthritis of the knee is a common condition. The three interventions reviewed in this report are widely used in the treatment of OA of the knee, yet the best available evidence does not clearly demonstrate clinical benefit. Uncertainty over clinical benefit can be resolved only by rigorous, multicenter RCTs. In addition, given the public health impact of OA of the knee, research on new approaches to prevention and treatment should be given high priority.

Evidence Report


9
Chapter 1. Introduction
This is a systematic review of three treatments for osteoarthritis (OA) of the knee: intra-articular injections of viscosupplements; oral glucosamine, chondroitin or the combination; and, arthroscopic lavage and debridement. The key questions are: (1) effectiveness and harms in primary OA of the knee, (2) in secondary OA of the knee, (3) in subpopulations, and (4) comparison of the three interventions. This section outlines the burden of illness and clinical management of osteoarthritis of the knee, the interventions of interest and uncertainties, and overviews key questions to be addressed.
Burden of Illness
According to the U.S. Centers for Disease Control and Prevention (CDC), an estimated 22
percent of adults (46 million) in the United States have doctor-diagnosed arthritis (Centers for Disease Control and Prevention, 2006). Earlier figures suggest approximately 11 percent of the population 64 years and older has symptomatic OA of the knee (Manek and Lane, 2000). Symptoms of OA typically begin after age 40 and progress slowly, with radiographic evidence of the disease present in the majority of the population by 65 years of age and in approximately 80 percent of the population age 75 years and older. OA of the knee is more common in women than in men, with risk factors that include obesity, previous knee injury or surgery, and occupational bending and lifting (Felson, 2006; Centers for Disease Control and Prevention, 2005).
Loss of joint function as a result of OA overall is a major cause of work disability and reduced quality of life. The CDC estimates that osteoarthritis and related arthritic conditions cost the U.S. economy nearly $81 billion per year in direct medical care, with indirect expenses of about $47 billion that include lost wages and production (Centers for Disease Control and Prevention, 2004). CDC figures further estimate the total annual direct cost of OA and related conditions per person is approximately $1,752.
Clinical Management
Pathophysiology
The term “osteoarthritis” refers to a heterogeneous group of joint disorders, usually signaled by symptoms of pain and stiffness. It involves both destructive and reparative metabolic processes, with a variety of biochemical triggers in addition to mechanical injury of the joint (Mandelbaum and Waddell, 2005). It is thought that inflammation does not play a primary role in osteoarthritis, although it may be present. When inflammation occurs, it is generally mild (Hochberg, Altman, Brandt, et al., 1995b). The pathogenesis of OA is not fully understood, although multiple contributing factors are recognized including genetic, environmental, metabolic, and biomechanical factors (Kraus, 1997).
Although OA eventually involves all joint structures, it begins with damage and progressive degradation of articular hyaline cartilage structure and function (chondropenia), typically in a

10
nonuniform, focal manner (Felson, 2006). As chondropenia progresses in localized areas, stress increases across the entire joint, further damaging and eroding cartilage. In areas with full-thickness cartilage loss, abnormal remodeling and attrition of subarticular bone commences, typically accompanied by growth of osteophytes. Synovitis, ligamentous laxity, and periarticular muscle weakness may also occur, eventually leading to joint tilting and malalignment. Malalignment is a risk factor for joint failure, hastening structural deterioration of the joint by increasing local loading forces.
The symptoms of OA result from abnormal stresses on the weight-bearing joints or normal stresses on weakened joints, becoming progressively worse and more frequent with age. The typical joints involved with osteoarthritis include the large, weight-bearing joints such as the hip and knee, as well as selected smaller joints in the hands, feet, and spine. Classification
Osteoarthritis may be broadly categorized as primary (idiopathic) or secondary. According to the American Academy of Orthopaedic Surgeons, primary OA of the knee can be defined as a process in which articular degeneration occurs in the absence of an obvious underlying abnormality (American Academy of Orthopaedic Surgeons, 2004). Secondary OA of the knee is often the result of injury (trauma) or repetitive motion such as found in certain occupations. It can also result from congenital conditions and underlying diseases, including include systemic metabolic diseases, endocrine diseases, bone dysplasias, and calcium crystal deposition diseases. Secondary OA is more likely to manifest itself at an earlier age than primary OA, and may be an initial clue to the presence of a potentially dangerous and treatable systemic disease. While there is rationale for identifying two separate categories of OA, making a distinction between them does not alter clinical practice and therapeutic choices. Diagnosis
The diagnosis of osteoarthritis is established using a combination of clinical information derived from history, physical examination, radiologic, and laboratory evaluation. An algorithm of diagnostic criteria for osteoarthritis of the knee has been proposed by the American College of Rheumatology (ACR) (Altman, Asch, Bloch, et al., 1986). A diagnosis of OA of the knee is defined as presenting with pain, and meeting at least five of the following criteria:
• Patient older than 50 years of age • Less than 30 minutes of morning stiffness • Crepitus (noisy, grating sound) on active motion • Bony tenderness • Bony enlargement • No palpable warmth of synovium

11
• Erythrocyte sedimentation rate (ESR) <40 mm/hr • Rheumatoid factor <1:40 • Noninflammatory synovial fluid.
The presence of clinical symptoms of OA does not always correlate well with the degree of abnormality seen on radiographs. It has been noted that approximately 40 percent of patients who have severe X-ray findings report no symptoms, and conversely, patients with clinical symptoms may show no significant radiological changes (Balint and Szebenyi, 1996; Davis, Ettinger, Neuhaus, et al., 1992; Claessens, Schouten, van den Ouweland, et al., 1990). Treatment
Treatment for OA of the knee aims to alleviate pain and improve function in order to mitigate reduction in activity (American College of Rheumatology, 2000; Felson, 2006). However, most treatments do not modify the natural history or progression of OA, and thus are not considered curative. Nonsurgical modalities include education, exercise, weight loss, and various supportive devices; acetaminophen or nonsteroidal anti-inflammatory drugs (NSAIDs) such as ibuprofen; nutritional supplements (glucosamine and chondroitin); and, intra-articular viscosupplements.
Guidelines for the medical management of osteoarthritis emphasize the role of both nonpharmacologic and pharmacologic therapies (American College of Rheumatology, 2000; Jordan, Arden, Doherty, et al., 2003). Initial management involves nonpharmacologic therapies, including education, exercise, various appliances and braces, and weight reduction. Acetaminophen is recommended as first-line pharmacologic therapy. If pain relief is inadequate with acetaminophen, analgesic-dose NSAIDs may be used (e.g., ibuprofen, naproxen). If symptom response to a lower NSAID dosage is inadequate, higher, anti-inflammatory, doses may be used. Intra-articular corticosteroid injection may be considered when relief from NSAIDs is insufficient or the patient is at risk from gastrointestinal adverse effects. Injection of corticosteroids is frequently limited to three to four times per year per joint because of concern about the possibility of progressive cartilage damage through repeated injection in the weight-bearing joints (Neustadt, 1992).
If symptom relief is inadequate with conservative measures, invasive treatments may be considered. Operative treatments for symptomatic OA of the knee include arthroscopic lavage and cartilage debridement, osteotomy, and, ultimately, total joint arthroplasty (Day, 2005). Surgical procedures intended to repair or restore articular cartilage in the knee, including abrasion arthroplasty, microfracture techniques, autologous chondrocyte implantation, and others, are appropriate only for younger patients with focal cartilage defects secondary to injury (Clarke and Scott, 2003). Interventions Addressed in This Report Intra-Articular Injections of Hyaluronic Acid Preparations. As shown in Table 1, five hyaluronan-based products are approved, all as class 3 devices, via U.S. Food and Drug

Table 1. U.S. FDA-approved hyaluronan products and product information statements Product Regarding Treatment
Course Regarding Minimum # of
Injections Regarding Other Joints Regarding Repeat Treatments
Hyalgan® (sodium hyaluronate); Fidia Pharmaceutical Original PMA date: 5/28/97 MW: 0.5–0.73 million Da
“A treatment cycle consists of five injections given at weekly intervals. Some patients may experience benefit with three injections given at weekly intervals.”
“The effectiveness of a single treatment cycle of less than 3 injections has not been established.”
“The safety and effectiveness of the use of Hyalgan® in joints other than the knee have not been established.”
“Adverse experience data from the literature contain no evidence of increased risk relating to retreatment with Hyalgan®. The frequency and severity of adverse events occurring during repeat treatment cycles did not increase over that reported for a single treatment cycle.…” Hyalgan® is the only hyaluronan with demonstrated safety in a 30-month, repeat use, open-label trial in which 75 patients received a cycle of 5 weekly injections of Hyalgan® every 6 months.
Synvisc® (hylan G-F 20); Genzyme Corporation Original PMA date: 8/08/97 MW: 6 million Da (hylan A)
“Synvisc® is administered by intraarticular injection once a week (one week apart) for a total of three injections.”
“The effectiveness of a single treatment cycle of less than three injections of Synvisc® has not been established.”
“The safety and effectiveness of Synvisc® in locations other than the knee and for conditions other than osteoarthritis have not been established.”
“The reactions seemed to occur more often when Synvisc® was injected into the knee as a repeat set of injections than when Synvisc® was injected as a first set of injections.”
Supartz® (sodium hyaluronate); Seikagaku Corporation Original PMA date: 1/24/01 MW: 0.62–1.17 million Da
“Supartz® is administered by intraarticular injection once a week (one week apart) for a total of 5 injections.”
“The effectiveness of a single treatment cycle of less than 5 injections has not been established.”
“The safety and effectiveness of the use of Supartz® in joints other than the knee have not been established.”
“The safety and effectiveness of repeat treatment cycles of Supartz® have not been established.”
12

Table 1. U.S. FDA-approved hyaluronan products and product information statements (continued) Product Regarding Treatment
Course Regarding Minimum # of
Injections Regarding Other Joints Regarding Repeat Treatments
Orthovisc® (sodium hyaluronate), Anika Therapeutics, Inc. Original PMA date: 2/04/04 MW: 1–2.9 million Da
“Orthovisc® is injected into the knee joint in a series of intraarticular injections one week apart for a total of three or four injections.”
The effectiveness of a single treatment cycle of less than 3 injections has not been established. Pain relief may not be seen until after the third injection.
“The safety and effectiveness of the use of Orthovisc® in joints other than the knee have not been established.”
“The effectiveness has not been established for more than one course of treatment.”
Euflexxa® (sodium hyaluronate), Ferring Pharmaceuticals Original PMA date: (approved under the name Nuflexxa) MW: 2.4–3.6 million Da
“A dose of 2 ml is injected intraarticularly into the affected knee at weekly intervals for three weeks, for a total of three injections.”
N/R “Safety and effectiveness of injection in conjunction with other intraarticular injectables, or into joints other than the knee has not been studied.”
“The safety and effectiveness of repeated treatment cycles of EUFLEXXA™ have not been established.”
Da: Daltons; MW: molecular weight; PMA: premarket approval
13

14
Administration (FDA) premarketing application (PMA) approval. These products vary by molecular weight, with Hyalgan®, Supartz®, and Orthovisc® on the lower to mid-range end (0.5–0.73 mDa, 0.6–1.2 mDa, and 1–2.9 mDa, respectively) and Synvisc® on the upper end with a much greater molecular weight related to its cross-linked nature. Synvisc® actually comprises two components (thus, the name “hylan gel-fluid 20”): (1) hylan A, which is a viscoelastic fluid with an average molecular weight of 6 mDa, and (2) hylan B, a hydrated gel, for which a molecular weight cannot be measured. For comparison, the molecular weight of hyaluronan in normal synovial fluid is about 0.2–0.5 mDa (Peyron, 1993). Glucosamine and Chondroitin. Glucosamine is an aminomonosaccharide which is the principal component of O-linked and N-linked glycosaminoglycans, which comprise the matrix of all connective tissues, including cartilage (Biggee and McAlindon, 2004; Matheson and Perry, 2003; Hauselmann, 2001; Deal and Moskowitz, 1999). This compound historically has been derived by extraction of chitin, a component of crustacean shells, although is also is produced through fermentation of a vegetarian source. Chondroitin sulfate is a glycosaminoglycan with a polymerized disaccharide base linked to a sulfate moiety, and is a component of proteoglycans of articular cartilage. It is usually derived from bovine trachea, although other sources such as ovine or porcine trachea and shark cartilage are used. The mechanisms of action of these compounds are unknown, but it is speculated they may promote maintenance and repair of cartilage.
In the United States, glucosamine hydrochloride or sulfate and chondroitin sulfate are considered dietary supplements available in over-the-counter (OTC) products, which may vary substantially in content and purity from what is stated on the label (McAlindon, 2003). In European Union countries, glucosamine sulfate and chondroitin sulfate are regulated as prescription drugs. A number of clinical trials with positive outcomes either used glucosamine sulfate manufactured by an Italian firm, Rotta Research Laboratorium, or were financially supported by Rotta. It has been hypothesized that Rotta glucosamine sulfate has greater efficacy than the hydrochloride salt, and that the formulation is a key factor in trial outcome (Altman, Abramson, Bruyere, et al., 2006; Hochberg, 2006; McAlindon, 2003). Oral administration of glucosamine sulfate can increase serum and synovial fluid sulfate levels, whereas sodium sulfate does not. Absorbed sulfate is then used in the synthesis of proteoglycans and metabolic intermediates like coenzyme A and glutathione that are important for chondrocyte metabolism. Arthroscopy. The term “arthroscopy” is often used collectively in reference to individual minimally invasive surgical procedures, joint lavage and articular debridement, which are performed using fine needles and an arthroscope (Gidwani and Fairbank, 2004; Gunther, 2001). Arthroscopic lavage is a palliative measure in which intra-articular fluid is aspirated and the joint is washed out, removing inflammatory mediators, debris, or small loose bodies from the osteoarthritic knee. Articular debridement involves removal of cartilage or meniscal fragments, but also can include cartilage abrasion, excision of osteophytes and synovectomy. Debridement is intended to improve symptoms and joint function in patients with mechanical symptoms such as locking or catching of the knee. Because lavage and debridement are often performed at the same time, it is difficult to attribute the success or failure of arthroscopy to a specific procedure.

15
Key Questions for This Systematic Review
This systematic review of the literature will address the following questions regarding managing patients with OA of the knee with three interventions: intra-articular injections of viscosupplements; oral glucosamine and chondroitin; and, arthroscopic lavage and debridement. 1. What are the clinical effectiveness and harms of each intervention in patients with
primary OA of the knee? 2. What are the clinical effectiveness and harms of each intervention in patients with secondary
OA of the knee? 3. How do the short-term and long-term outcomes of each intervention differ by the following
subpopulations: age, race/ethnicity, gender, primary or secondary OA, disease severity and duration, weight (body mass index), and prior treatments?
4. How do the short-term and long-term outcomes of each intervention compare for the
treatment of primary OA of the knee; and secondary OA of the knee?


17
Chapter 2. Methods
This report is a systematic review of the effectiveness of three technologies to treat osteoarthritis (OA) of the knee: intra-articular hyaluronan injections (viscosupplements), enteral glucosamine and chondroitin given alone or in combination, and arthroscopic lavage and debridement. This chapter describes the search strategies used to identify literature; criteria and methods used for selecting eligible articles; methods for data abstraction; methods for quality assessment; and, finally, the process for technical expert advice and peer review.
The methods of this review are generally applicable to all Key Questions. However, as noted, there were variations in specific aspects of the methods as necessary to satisfy requirements of each question.
Peer Review
A technical expert panel provided consultation for the systematic review and reviewed the draft report. The draft report was also reviewed by 12 external reviewers, including invited clinical experts and stakeholders (Appendix D*). Revisions were made to the draft report based on reviewers’ comments.
Study Selection Criteria
This Evidence Report takes a tiered approach to evidence of the effectiveness of the three key interventions. The primary focus is on whether interventions have beneficial effects exceeding those of a comparative placebo. We first determined whether existing systematic reviews and meta-analyses adequately addressed the Key Questions and whether they identified all relevant primary studies. If additional primary studies are found, this Evidence Report integrates their findings with systematic reviews and meta-analyses. If evidence from randomized, placebo-controlled trials (RCTs) clearly shows benefits beyond placebo, then comparisons between these interventions and other active interventions would be relevant. The diagram in Figure 1 describes how reviewers proceeded through this systematic review, beginning with applying study selection criteria to literature search results. Further steps included data extraction and summary (see Data Extraction and Analysis), quality assessment (see Assessment of Study Quality), and finally evidence synthesis and interpretation. Assessment of the quality of RCTs and meta-analyses is an important part of how we conducted this review; however, interpretation of the body of evidence for a particular class of interventions entailed more than that. Quality assessment informed the critical appraisal of the results and conclusions of meta-analyses, but rating classes did not give a complete picture of the strength of the body of evidence. Beyond quality ratings, we explored the methodologic strengths and weaknesses of RCTs and meta-analyses, inquired whether meta-analyses addressed the clinical importance of treatment effects, and assessed how well meta-analyses attempted to explain hetereogeneity of effects. All of these activities contributed to interpreting the overall strength of the evidence and determining whether conclusions could be drawn with respect to key questions.
* Appendixes cited in this report are available electronically at http://www.ahrq.gov/clinic/tp/oakneetp.htm

Figure 1. Systematic review process
Extraction and summary descriptionof RCTs
Quality assessment of MAs
Quality assessment of RCTs
Crtical appraisal of MA results/conclusions, focusing ono methodologic strengths and
weaknesses of RCTS and MAs
o whether MAs addressed clinical importance of treatment effects and
o whether MAs attempted to explain heterogeneity of effects by • study quality• sample sizes• sample characteristics• intervention subtype• industry involvement
Interpretation:o evaluating the
strength of the body of evidence and
o determining what conclusions can be drawn in response to key questions
Extraction and summary descriptionof MAs
Identification of meta-analyses (MAs) meeting study selection criteria
Identification of randomized controlled trials (RCTs) meeting study selection criteria
Literaturesearch18

19
Types of Studies We sought systematic reviews, meta-analyses, RCTs, including abstracts of unpublished
placebo-controlled RCTs, examining the clinical effectiveness of one or more of the interventions of interest among patients with primary or secondary OA of the knee; and reporting at least one outcome of interest.
RCTs had to be published either as articles in any language or English-language abstracts (if the study was only presented as an abstract). No minimum number of patients per study arm was required for RCTs. Because there were few RCTs available to address arthroscopy and Key Question 4 (comparative outcomes), we sought additional study designs. For arthroscopy, we also sought English-language articles of nonrandomized comparative trials (i.e., quasi-experimental studies), administrative database analyses, and case series with samples of 50 or more. For Key Question 4, we sought randomized and nonrandomized comparative studies.
Studies were excluded if no outcome of interest to this review was reported. Studies were also excluded if the patient population of interest was fewer than 80 percent of included patients, or, alternatively, results for the patient population of interest were not separately reported. When multiple reports were available for the same study, it was counted as a single trial and outcome data from the report with the longest followup were used. Types of Participants The populations of interest are patients with primary or secondary OA of the knee, as defined by the American Academy of Orthopaedic Surgeons (American Academy of Orthopaedic Surgeons, 2004): • Primary osteoarthritis of the knee is a process in which articular degeneration occurs in the
absence of any obvious underlying abnormality (unknown cause); and • Secondary OA is often the result of injury (trauma) or repetitive motion in certain
occupations, but it can also result from congenital conditions and systemic metabolic diseases, endocrine diseases, bone dysplasias, and calcium crystal deposition diseases.
Subpopulations of interest include: age, race or ethnicity, sex, disease severity and duration, weight (body mass index), and prior treatments Types of Interventions Glucosamine or Chondroitin.
• Enteral (i.e., orally administered) glucosamine (sulfate or hydrochloride) given alone • Enteral chondroitin given alone • Enteral glucosamine and chondroitin given in combination.

20
Glucosamine is given orally at 1,500 mg daily, usually as a single dose, or divided into two or three doses. Chondroitin is administered orally, usually a total of 800 to 1,200 mg daily, or in divided doses. At minimum, treatment duration is 1 to 3 months, and may be continued indefinitely if the patient experiences improvement. Intra-Articular Injections Hyaluronan Preparations. The first group of products, derived from sodium hyaluronate, is the most commonly used viscosupplement in RCTs and is followed by hylan G-F 20 as the next most common class. Additionally, unapproved non-animal stabilized hyaluronic acid (NASHA) derived from streptococci has been used in two RCTs (Altman, Akermark, Beaulieu, et al., 2004; Pham, Le Henanff, Ravaud, et al., 2004). One trial (Petrella, DiSilvestro, Hildebrand, et al., 2002) administered a hyaluronan that is not approved by the U.S. Food and Drug Administration (FDA). Intra-articular injections performed in RCT protocols were most often weekly for 3 to 5 weeks, although different schedules also were used. Arthroscopy. Studies were selected if arthroscopic treatment of OA involved lavage with or without debridement, and debridement was not specifically required to include procedures beyond nonabrasion chondroplasty and removal of loose bodies. Thus, studies were excluded if they focused only on arthroscopic meniscectomy or abrasion chondroplasty, for example. Types of Outcomes Primary Outcomes. The primary outcomes of interest are: • Pain severity or intensity • Self-reported physical function • Patient global assessment • Quality of life.
Secondary Outcomes. Secondary outcomes of interest include: • Need for or time to total knee replacement or other surgeries. • Concomitant analgesic use. Harms or Adverse Effects. Any adverse events reported, including: • Hyaluron Preparations. Local: injection site redness, edema, pain, joint swelling, joint
stiffness, worsened osteoarthritis, infection, pseudoseptic reactions. Systemic: severe acute inflammatory reaction or pseudosepsis, anaphylaxis, arthralgias, rash, urticaria, back pain, headache.
• Glucosamine and Chondroitin. Alterations in blood glucose, hypersensitivity reactions, and local gastrointestinal toxicities.

21
• Arthroscopy. Infection, prolonged drainage from arthroscopic portals, effusion, hemarthrosis and deep vein thrombosis.
Pain and Function Measurement Issues Instruments. Pain and function should be measured by instruments with established validity and reliability. Although results are frequently reported as mean change in the intervention compared to control arms, this is not the preferred method of measuring outcomes. More informative, is a comparison of response, that is the proportion of patients achieving an improvement that is established representing a minimum clinically important improvement. (Tubach, Wells, Ravaud, et al., 2005). Among established instruments, pain severity may be assessed by a visual analog scale (VAS) or a numeric rating scale (NRS) or from a subscale included in a knee-specific validated OA instrument. The horizontal 100-mm VAS has a left-hand or 0-mm endpoint labeled “no pain” and a right-hand or 100-mm endpoint usually labeled with a statement such as “extreme pain” or “pain as bad as it could possibly be.” While the amount of improvement required may not be definitively established (Tubach, Ravaud, Baron et al. 2005; Pham, van der Heijde, Altman, et al. 2004), the best available estimates for OA of the knee are between 20 and 40 percent improvements have been used in hyaluronan and glucosamine/chondroitin trials (Nuestadt et al. 2005, Altman et al. 2004, Clegg et al). A clinically significant change in VAS score depends on the baseline pain (Campbell and Patterson, 1998). For example, in knee OA an absolute 20 mm or 40 percent relative reduction in VAS pain score could be considered a minimal clinically important improvement (MCII) (Tubach, Wells, Ravaud, et al., 2005) and define clinically meaningful response. Accordingly, a decrease of 10–12 mm may be clinically significant from a baseline of 25 mm, while a reduction of 20–31 mm may be necessary to achieve a clinically significant reduction for patients with high baseline pain (e.g., VAS 75–100 mm). Among 2 widely used OA instruments, the Western Ontario and McMaster University Osteoarthritis Index (WOMAC, McConnell, Kolopack, and Davis, 2001; Bellamy, Buchanan, Goldsmith, et al., 1988) evaluates 3 dimensions, pain, stiffness, and physical function with 5, 2, and 17 questions, respectively. WOMAC assesses pain using either the sum of scores from 5 items or the VAS. WOMAC outcomes can be based on the total, or a subset score. A 20- to 40-percent reduction in the WOMAC pain subscore is a positive response criterion for pain used in knee OA studies and represents achieving a MCII (Tubach, Wells, Ravaud, et al., 2005). Another commonly used OA instrument is the Lequesne Index, a validated numerical scale in which points are assessed for various levels of pain, distance walking, and ability to perform activities of daily living (Lequesne, Mery, Samson, et al., 1987). It sums scores from 5 adjectival items, producing scores ranging from 1 to 24 points. The severity of handicap related to the knee can be categorized by point score: mild (1–4 points); moderate (5–7 points); severe (8–10 points); very severe (11–13 points); and extremely severe (>14 points) (Bellamy, 1993). What constitutes a MCII is likely approximately 20 percent (Bellamy, 1993). Physical function may be appraised through reported difficulty performing specific daily activities affected by knee OA (Bellamy, Buchanan, Goldsmith, et al., 1988; Lequesne, Mery, Samson, et al., 1987). Patient global assessment (generally defined as the “patient's assessment of overall disease activity or improvement”) can be assessed by VAS, NRS, or other specific instruments (Pham, van der Heijde, Altman, et al. 2004). The MCII for patient global

22
assessment on a 100 mm VAS has been suggested to be 18 mm, or a relative improvement of 40 percent. Both generic measures and disease-specific quality of life (QOL) measures may be relevant (Salaffi, Carotti, and Grassi, 2005) assessing disease impact. The SF-36 and Arthritis Impact Measurement Scales (Meenan, 1986) are acceptable scales to assess the impact of osteoarthritis on QOL. Pooled Outcome Measures. Meta-analyses may pool outcome measures using the metric of the original scale, or a metric related to it.
The “weighted mean difference” (WMD) combines (pools) differences between treatment and control from multiple trials on the scale of the original instrument. It can be reported as either a difference between treatment and control at some followup time or a difference in change scores. While intuitive to interpret as a difference or difference in change for some outcome measure, the WMD has doe not define proportions achieving a MCII or response (Senn 1997, page 226; Tubach, Ravaud, Giraudeau 2005).
“Relative risks” (or the approximately equal odds ratio) can be pooled for dichotomous outcome measures (e.g., patient global assessment and adverse events). It is a ratio comparing the outcome probability among treated compared placebo groups. The relative risk clearly conveys increased risk, but does not directly reflect clinical benefit in terms of response unless a comparison of meaningful clinical response rates.
“Sums of differences” in outcome measures between treatment and placebo groups (e.g., pain and function) over the course of a study can also be pooled. The measure is expressed as a percentage reflecting how much greater relief is provided by treatment compared to placebo. Although commonly used in pain research, the measure does not have direct clinical meaning with respect to response.
“Standardized effect sizes” expressed as differences or differences in change, standardized by their variability (divided by the standard deviation) can also be pooled. Standardized effect sizes are typically used when scales pooled have different metrics (e.g., a 0- to 100-mm VAS and a 25-point WOMAC scale). The clinical meaning of standardized effect sizes when different scales are pooled and variability differs across studies is difficult to intuit. While small, medium, and large referents corresponding to 0.3, 0.5 and 0.8, respectively, were suggested by Cohen (1988), they pertain to sample size calculations not clinical meaning, and were qualified substantially.* Others have pointed out problematic aspects of standardized effect sizes including: incomparability across studies (Rothman and Greenland, 1998) and that studies with identical results may appear to differ (Greenland, Schlesselman, Criqui, 1986). Most importantly, one cannot infer individual response Senn (1997).†
* “For each statistical test’s ES [effect size], the author proposes, as a convention, ES values to serve as operational definitions the qualitative adjectives ‘small,’ ‘medium,’ and ‘large.’ This is an operation fraught with many dangers: The definitions are arbitrary, such qualitative concepts as “large” are sometimes understood as absolute, sometimes as relative; and thus they run a risk of being misunderstood…” (Cohen, 1988, page 12.) † “The probability associated with an effect size calculates the probability of observing such a superiority [of treatment A over B]. However, to know whether a given patient will be better off treated with A or B, or even to know what proportion of patients will be better off is quite another matter. No simple comparison of means whether scaled by the standard deviation or not can answer this question.” (Senn 1997, page 226.)

23
Search Strategy and Review Search Strategy
Electronic Databases. The following databases were searched for citations. The full search strategy is displayed in Appendix A*. The search was not limited to English-language references; however, foreign-language references without abstracts were disregarded. • MEDLINE® (through March 29, 2007) • EMBASE (through March 16, 2006) • Cochrane Controlled Trials Register (through November 27, 2006). EMBASE was updated with abbreviated searches through November 27, 2006.
Additional Sources of Evidence. The Technical Expert Panel and individuals and organizations providing peer review were asked to inform the project team of any studies relevant to the key questions that were not included in the draft list of selected studies. We examined the bibliographies of all retrieved articles for citations to any RCT that was missed in the database searches. In addition, we sought RCTs published in conference proceedings and abstracts from the American Association of Orthopaedic Surgeons (AAOS), American College of Rheumatology (ACR) and the Osteoarthritis Research Society International (OARSI) over the past 2 years. We also consulted product inserts of U.S.-marketed viscosupplement products. Search Screen
Search results were stored in a ProCite® database. Using the study selection criteria for screening titles and abstracts, a single reviewer marked each citation as either: (1) eligible for review as full-text articles, (2) ineligible for full-text review, or (3) uncertain. Citations marked as uncertain were reviewed by a second reviewer and resolved by consensus opinion, with a third reviewer to be consulted if necessary. Using the final study selection criteria, review of full-text articles was conducted in the same fashion to determine inclusion in the systematic review. Of 1,842 citations, 451 articles were retrieved and 98 selected for inclusion (Figure 2). Records of the reason for exclusion for each paper retrieved in full-text, but excluded from the review, were kept in the ProCite® database (see Appendix B*, Excluded Studies).
* Appendixes cited in this report are available electronically at http://www.ahrq.gov/clinic/tp/oakneetp.htm

24
Figure 2. QUOROM flow diagram
Data Extraction and Analysis Data Elements
The data elements below were abstracted, or recorded as not reported, from intervention studies. Data elements to be abstracted were defined in consultation with the Technical Expert Panel.
1,842 articlesidentified onliterature searches
1,391 articlesexcluded on reviewof titles and abstracts
451 full-text articles retrieved
98 articles met studyselection criteria
353 articles excludedafter full review
hyaluranon:106 articles
glucosamine/chondroitin:57 articles
arthroscopy:190 articles
hyaluranon:48 articles
glucosamine/chondroitin:27 articles
arthroscopy:23 primary study articles
6 meta-analysisarticles
in meta-analyses:41 primary study articles
not in meta-analyses:1 primarystudy article
6 meta-analysisarticles
in meta-analyses:16 primarystudy articles
not in meta-analyses:5 primarystudyarticles

25
Data elements from intervention studies (RCTs and quasi-experimental studies) include: • Critical features of the study design (for example, patient inclusion/exclusion criteria,
number of participants, allocation method (including concealment), use of blinding) • Patient characteristics (age, gender, race/ethnicity, body weight, primary or secondary
disease. disease duration) • Measures of disease severity • Treatment protocols (for example, dose, frequency, duration, extent of arthroscopic surgery,
other prior and concurrent treatments) • Patient monitoring procedures (for example, followup duration and frequency, outcome
assessment methods) and • The specified key outcomes and data analysis methods • Results • Funding source.
Data elements from systematic reviews and meta-analyses include:
• Use of a protocol • The study question (patients, interventions/comparisons, outcomes) • Literature search strategy • Study inclusion/exclusion criteria • Data extraction methods • Assessment of study quality • Methods of data synthesis/analysis • Funding source. Data elements from case series include: • Clinical question • Enrollment of patients (consecutive or otherwise)

26
• Whether a single-center or multicenter study • Patient selection criteria and sample characteristics • Intervention • Length of followup • Validated outcome measures and independence or blinding of outcome assessment • Statistical analyses • Results. Evidence Tables
Templates for evidence tables were created in Microsoft Excel® and Microsoft Word®. One reviewer performed primary data abstraction of all data elements into the evidence tables, and a second reviewer reviewed articles and evidence tables for accuracy. Disagreements were resolved by discussion, and if necessary, by consultation with a third reviewer. When small differences occurred in quantitative estimates of data from published figures, the values obtained by the two reviewers were averaged.
Assessment of Study Quality Definition of Ratings Based on Criteria In consultation with the AHRQ Task Order Officer and Technical Expert Panel, the general approach to grading evidence developed by the U.S. Preventive Services Task Force (Harris, Helfand, Woolf, et al. 2001) were applied to primary studies. The quality of the abstracted studies was assessed by two independent reviewers. Discordant quality assessments were resolved with input from a third reviewer, if necessary. Primary RCTs and Quasi-Experimental Studies The quality of RCTs and quasi-experimental studies were assessed on the basis of the following criteria: • Initial assembly of comparable groups: adequate randomization, including concealment and
whether potential confounders (e.g., other concomitant care) were distributed equally among groups
• Maintenance of comparable groups (includes attrition, crossovers, adherence, contamination)

27
• Important differential loss to followup or overall high loss to followup • Measurements: equal, reliable, and valid (includes masking of outcome assessment) • Clear definition of interventions • All important outcomes considered • Analysis: adjustment for potential confounders, intention-to-treat analysis. Definition of Ratings Based on Above Criteria. The rating of intervention studies encompasses the three quality categories described here: • Good: Meets all criteria: Comparable groups are assembled initially and maintained
throughout the study (followup at least 80 percent); reliable and valid measurement instruments are used and applied equally to the groups; interventions are spelled out clearly; all important outcomes are considered; and appropriate attention is given to confounders in analysis. In addition, for RCTs, intention-to-treat analysis is used.
• Fair: Studies were graded “fair” if any or all of the following problems occur, without the
fatal flaws noted in the “poor” category below: In general, comparable groups are assembled initially but some question remains whether some (although not major) differences occurred with followup; measurement instruments are acceptable (although not the best) and generally applied equally; some but not all important outcomes are considered; and some but not all potential confounders are accounted for. Intention-to-treat analysis is done for RCTs.
• Poor: Studies were graded “poor” if any of the following fatal flaws exists: Groups
assembled initially are not close to being comparable or maintained throughout the study; unreliable or invalid measurement instruments are used or not applied at all equally among groups (including not masking outcome assessment); and key confounders are given little or no attention. For RCTs, intention-to-treat analysis is lacking.
Systematic Reviews and Meta-Analyses Assessment of the quality of systematic reviews and meta-analyses were guided by a quality rating method reported by Oxman and Guyatt (1991; Overview Quality Assessment Questionnaire).* Oxman and Guyatt tool results in a quality score, based on the answers to ten questions that provide information on the content of a review in terms of how it was conducted, as follows:
* Our original protocol included analysis of the quality of meta-analysis reporting according to the QUOROM (Moher, Cook, Eastwood, et al., 1999). However, we have not included this analysis because QUOROM was not generally available or in widespread use when the earlier meta-analyses were published.

28
1. Were the search methods used to find evidence on the primary question(s) stated? 2. Was the search for evidence reasonably comprehensive? 3. Were the criteria used for deciding which studies to include in the overview reported? 4. Was bias in the selection of studies avoided? 5. Were the criteria used for assessing the validity of the included studies reported? 6. Was the validity of all the studies referred to in the text assessed using appropriate criteria? 7. Were the methods used to combine the findings of the relevant (to reach a conclusion)
reported?*
8. Were the findings of the relevant studies combined appropriately relative to the primary question of the overview?
9. Were the conclusions made by the author(s) supported by the data and/or analysis reported in
the overview? 10. What was the overall scientific quality of the overview? Use the following scoring scale: Figure 3. Oxman and Guyatt Rating
Flaws Extensive Minor
Major Minimal 1 2 3 4 5 6 7
The following guidelines are used to apply the Oxman and Guyatt rating: Question 1: Literal interpretation. Question 2: For a search to be considered comprehensive the methods used to perform the
search should include searching for unpublished material as well as multiple medical databases (at least EMBASE and MEDLINE®). If only published material was searched for, the search should be marked “partially.” A look through bibliographies, conference proceedings, or trial registries is deemed adequate as a search for unpublished literature. The search must not be limited to the English language.
* Our original protocol included analysis of the quality of meta-analysis reporting according to the QUOROM (Moher, Cook, Eastwood, et al., 1999). However, we have not included this analysis because QUOROM was not generally available or in widespread use when the earlier meta-analyses were published.

29
Question 3: Should specify defining population, intervention, principal outcomes, and study design to be “yes;” if only 2 or 3 of these are noted, it should be scored “partially” here.
Question 4: Must be “yes” on 2 and 3 and dual review to be “yes” here; if “no” on 2 or 3 must
be “no” here; if “partially” or “can’t tell” on 2 and 3 then must be the same here. Question 5: Must use some cited validity tool for “yes” here. Question 6: Scales used must be appropriately applied to study type for “yes” here. Question 7: An appropriate pooling method and test for heterogeneity must be described for
“yes” here; were “partially” if a pooling method but no heterogeneity testing method is specified.
Question 8: If no attempt has been made to combine findings, and no statement is made
regarding the inappropriateness of combining findings, check “no.” If a summary (general) estimate is given anywhere in the abstract, the discussion, or the summary section of the paper, and it is not reported how that estimate was derived, mark “no,” even if there is a statement regarding the limitations of combining the findings of the studies reviewed. If in doubt, mark “can’t tell.” To determine whether it is appropriate to use random or fixed effects model, the study should address the question of how much heterogeneity would be considered (addressing clinical and statistical aspects of heterogeneity).
Question 9: If 8 is “no,” 9 must be “no.” If 8 is “can’t tell,” 9 must be “can’t tell.” For an
overview to be scored as “yes” on Question 9, data (not just citations) must be reported that support the main conclusions regarding the primary question(s) that the overview addresses.
Question 10: The overall scientific quality should be based on the answers to the first 9 questions. The following guidelines can be used to assist with deriving a summary score: if the “can’t tell” option is used one or more times on the preceding questions, a review is likely to have minor flaws at best, and it is difficult to rule out major flows (i.e., a score ≤4). If the “no” option is used on Questions 2, 4, 6, or 8, the review is likely to have major flaws (i.e., a score of ≤3, depending on the number and degree of the flaws).
It should be noted that a new quality assessment tool for systematic reviews and meta-
analyses was recently developed (Shea, Grimshaw, Wells, et al., 2007). It was based, in part, on the work of Oxman and Guyatt, but differs in significant ways. In particular, the Oxman and Guyatt tool does not adequately address whether quality concerns of the underlying literature were incorporated into conclusions. The tool by Shea, Grimshaw, Wells, et al. (2007) more clearly assesses whether conclusions took appropriate account of the quality of included studies and the potential for publication bias. The recently developed tool was unavailable during the time when ratings of meta-analyses were performed for this evidence report.

30
Case Series The quality of included case series was assessed based on a set of study characteristics proposed by Carey and Boden (2003, Table 2), as follows: • Clearly defined question • Well-described study population • Well-described intervention • Use of validated outcome measures • Appropriate statistical analyses • Well-described results • Discussion and conclusion supported by data • Funding source acknowledged.

Table 2. Carey and Boden case series quality assessment tool
Clearly Defined Question
Well-Described Study
Population* Well-Described
Intervention
Use of Validated Outcome Measures
Appropriate Statistical Analysis
Well-Described Results
Discussion/ Conclusions Supported by
Data
Funding/ Sponsorship
Source Acknowledged
Question should be appropriate to study design; should not be stated in terms of effectiveness; best when focused;
Case definition (diagnostic criteria); type of criteria (clinical, radiographic); whether criteria used before (reference); explicit inclusion/ exclusion criteria; includes standard information (age; sex; socioeconomic status; stage and duration of disease; comorbidities; n; time to accrual; exclusions and reasons; loss to followup; refusal)
Sufficiently clear that another center could replicate study; if not identified in detail, should provide references; cointerventions should be described in reasonable detail
Reference to previous validation; ideally individual assessing patient’s outcome should be masked to specific intervention; alternatively, assessor who is not in direct employ of clinical office; standardized length and intervals of observation and of sufficient duration to be clinically meaningful; justification for the duration of followup
Statistical tests and power calculations aimed at improvement over time; prepost analysis should take into account paired nature of data; comparisons with historical controls should take into account differences in cointerventions between time periods; attention to nonspecific effects and inability to distinguish procedure’s effect from spontaneous improvement; avoids over-reliance on those variables showing improvement; analysis should address multiple comparisons
Utilize only validated outcome measures; description of adequacy of followup (number lost to followup, number who switch to another provider or pursue other treatments, number who die from other causes); [adaptation: inclusion of both potentially beneficial outcomes (symptom/ function/ quality of life) and adverse events]
Conclusion should be supported by the data in the article where other information is used to buttress conclusions, should be explicitly stated and referenced; limitations should be made explicit; description of specific next research steps (e.g., need for RCT, details of RCT) [adaptation: this element disregarded]
Funding source should be disclosed in addition to consulting or board relationship with manufacturer
*OA criteria noted; minimum set of characteristics: age, sex, disease duration and preop severity described.
31


33
Chapter 3. Results and Conclusions
Part I: Intra-Articular Hyaluronan Effectiveness and Harms
Literature Overview Five study-level meta-analyses comparing intra-articular hyaluronans with placebo (e.g., arthrocentesis and saline injection) for osteoarthritis (OA) of the knee have been published. One patient-level meta-analysis of a single product was also identified.* The quality of the meta-analyses was appraised with a validated tool (Oxman and Guyatt, 1991; Oxman, Guyatt, Singer, et al., 1991)—the Overview Quality Assessment Questionnaire. These meta-analyses included outcome measures from 41 relevant randomized, controlled trials (RCTs). One additional placebo-controlled trial (Rolf, Engstrom, Ohrvik, et al., 2005) identified by our literature search† was not included in any meta-analysis (42 trials, therefore, included in this review). RCTs pooled by the meta-analyses overlap considerably; their quantitative results and limitations also overlapped. Owing to the broad scope of the meta-analyses, they were judged to effectively capture existing evidence and formed the primary basis for evaluating hyaluronans’ effectiveness. Important details relevant to the evidence, or inconsistently reported in the meta-analyses, were abstracted from the primary literature (e.g., sample size and power calculations, use of intention-to-treat or per protocol analyses, industry involvement, quality appraised according to our protocol). Results, Part I: Key Questions 1 and 2 Outline. Because this chapter reports results from different perspectives, its organizational structure is outlined to guide the reader: • Study populations included in RCTs comprising the meta-analyses described • Application of the Overview Quality Assessment Questionnaire to the five study-level meta-
analyses • Relevant detailed results from the meta-analyses • Trials not pooled or included in the meta-analyses • Adverse events
* The patient-level meta-analysis combines individual patient data while the study-level meta-analyses combine results from individual trials. † A recent trial, Petrella and Petrella (2006) comparing two hyaluronan dosing regimens, was excluded because there was no comparison group only given placebo.

34
• Supplementary analyses performed by the Evidence-based Practice Center – Sensitivity analyses – Publication bias – Hylan G-F 20
• Summary and appraisal.
Study Populations. Characteristics of participants included in the 42 RCTs varied (Appendix C*, Tables IA, IB). Mean ages ranged from 45 to 72 years. Females represented between 28 and 100 percent of participants. In 24 RCTs, 60 percent or more were female. Only two RCTs (Dahlberg, Lohmander, Ryd, et al., 1994; Rolf, Engstrom, Ohrvik, et al., 2005) specified including individuals with secondary OA of the knee (both due to trauma). Fifteen RCTs stated that only individuals with primary OA of the knee were included, while in 25 either no distinction was reported or information was unavailable (e.g., unpublished studies and abstracts). No trial reported including individuals with OA of the knee secondary to systemic or congenital conditions.
Radiological disease grade of knees studied varied. The most common classification applied was Kellgren and Lawrence (1957) (in 18 RCTs). Schemes developed by Altman, Asch, Bloch, et al. (1986), Larsen, Dale, and Eek (1977), and Ahlback (1968) were also used. Table 3 displays the range of radiographic grades included (not unspecified in 18 RCTs or 45 percent). Table 3. Radiographic classification and grade in included viscosupplement RCTs
Classification and Grade RCTs Kellgren-Lawrence 0-4 1 Kellgren-Lawrence 1–2 1 Kellgren-Lawrence 1–3 1 Kellgren-Lawrence 1–4 3 Kellgren-Lawrence 2–3 5 Kellgren-Lawrence 2–4 7 Ahlback 0–3 1 Ahlback 1–2 2 Altman 1–3 1 Larsen 1–4 1 Larsen 2–4 1 Unreported or Unavailable 18
Total 42
Mean baseline pain measured by visual analog scale (VAS) with movement was reported 19 RCTs ranging from 44 to 79 mm in hyaluronan study arms and 42 to 80 mm among placebo study arms. The variability of the baseline pain measurements in trials spanned standard deviations from 5.5 to 31. When reported, mean disease duration varied from 1.2 to 22 years.
Patient samples included in RCTs were therefore heterogeneous with respect to age, sex, knee radiographic grade, and baseline pain, reflecting varied patient selection among RCTs. Randomized Controlled Trials. The conduct and quality of the 42 RCTs varied in a number of aspects including (see also Appendix C*, Tables IB–IF):
* Appendixes cited in this report are available electronically at http://www.ahrq.gov/clinic/tp/oakneetp.htm

35
• Quality ratings according to our protocol for 37 evaluable RCTs were “good” for nine, “fair” for 16, and 12 rated “poor” (five were not evaluable).
• Sample sizes ranged from 12 to 408 with a mean of 141 and median 102. • Power calculations were reported in 19 RCTs. Mean sample size in these RCTs was 204
compared to 60 for the 16 RCTs without those calculations in published manuscripts. • Trial duration ranged from 4 to 52 weeks with a mean of 23 and median 20 weeks; 11 were
fewer than 10 weeks in duration. • Intention-to-treat results were the primary analytical results reported in 17 RCTs (40
percent); 16 (38 percent) reported per protocol analyses; the analytical approach was either unclear or not reported in 9 (21 percent)—e.g., some unpublished studies.
• Losses to follow-up or drop-outs ranged from 0 to 50 percent with nine RCTs reporting 20
percent or greater loss to follow-up. • Blinding was reportedly double in 35 RCTs. • Reported industry involvement included funding of 23 RCTs, providing statistical analyses
for eight, and in eight, an industry member was a co-author.
The RCTs in this review consist of 41 trials included in the meta-analyses and one RCT (Rolf, Engstrom, Ohrvik, et al., 2005) identified in our literature search. Of the RCTs included in meta-analyses, 33 have been published as articles, five as abstracts (Russell, Michalek, Lawrence, et al., 1992; Moreland, Arnold, Saway, et al., 1993; Cohen, Shiroky, Ballachey, et al., 1994; Guler, Kuran, Parlar, et al., 1996; Tsai, Chang, Chen, et al., 2003), and three were unpublished (Table 4). In addition, an unpublished and unreported trial was identified in the Orthovisc® package insert as OAK 9801.* Trials not published in full text comprise approximately 25 percent of the total patient population.
In summary, there is variability in trial characteristics including study quality, sample size and power calculations, duration, use of intention-to-treat analysis, losses to follow-up, funding, and industry involvement. The known extent of unpublished data includes a large number of individuals. Results from at least one trial (OAK 9801) appear unreported in any form.
*http://www.orthovisc.com/content/xhtml_backgrounders/orthovisc.us_tld/orthovisc.us_eng/Orthovisc_Package_Insert.pdf (last accessed 10/29/06). “The effectiveness of ORTHOVISC® for the treatment of osteoarthritis of the knee was evaluated in three main studies; two randomized, controlled, double-blind multicenter studies (OAK9501 and OAK2001) that involved unilateral treatment, and one study (OAK9801) that involved bilateral treatment. Because bilateral treatment confounded the assessment of effectiveness of the OAK9801 study, the effectiveness data are summarized for the OAK9501 and OAK2001 studies. Safety data for all three studies are reported…”

36
Table 4. Number of participants randomized and reported in abstracts, unpublished and published RCTs of hyaluronan-based products Trial Sample Size* Result (+/–)
Russel et al., 1992 210 – Moreland et al., 1993 94 – Cohen et al., 1994 39 ?‡ Guler et al., 1996 30 + Tsai et al., 2003† 200 +
Abstract only
Subtotal (% of Total) 573 (9.8) France, 1995 254 – U.K., 1996 231 ? Hizmetli et al., 1999 50 + OAK 9801 382 ?§
Unpublished
Subtotal (% of Total) 917 (15.7) Published All Participants (% of Total) 4,353 (74.5)
Total 5,843 (100) * Sample size reported here are patients (not knees) randomized. † Bellamy, Campbell, Robinson, et al. (2006) refer to as Lin 2004, “in-house publication” ‡ As reported in Lo, LaValley, McAlindon, et al. (2003) 95% CI included unity; Wang, Chen, Huang, et al. (2004) suggested benefit; abstract notes no statistically significant difference at any time points for pain, WOMAC, or global assessment. § Results presumably negative given language in package insert (see footnote). Not mentioned by Bellamy, Campbell, Robinson, et al. (2006) who obtained a number of results from manufacturers.
Overview of the Meta-Analyses. The six meta-analyses were published between 2003 and 2006—five study- and one patient-level (Strand, Conaghan, Lohmander, et al., 2006). Each pooled different outcomes measures relevant to Key Questions 1 and 2 as outlined in Table 5. Table 5. Outcome measures pooled in viscosupplementation meta-analyses relevant to Key Questions 1 & 2
Lo
et al., 2003
Wang et al., 2004
Arrich et al., 2005
Modawal et al., 2005
Bellamy et al., 2006
Strand et al., 2006
Pain X X X X X Physical Function X X X Patient Global Assessment X WOMAC (Composite) X Lequesne Index (Composite) X X
There was considerable overlap of RCTs included in the meta-analyses (Table 6). Some
differences can be attributed to publication chronology. Of the study-level meta-analyses Modawal, Ferrer, Choi, et al. (2005) pooled results from the fewest RCTs while Bellamy, Campbell, Robinson, et al. (2006) the most. Strand, Conaghan, Lohmander, et al. (2006) being a patient-level meta-analysis of a single product pooled results from five RCTs.
Quality Assessment of the Study-Level Meta-Analyses. Methodologic quality is an important consideration in synthesizing evidence pooled by the meta-analyses. As outlined in the Methods chapter, the Overview Quality Assessment Questionnaire (Oxman and Guyatt, 1991; Oxman,

37
Table 6. Viscosupplementation RCTs addressing Key Questions
Trial Lo et al.,
2003 Wang et al.,
2004 Arrich et al., 2005
Modawal et al., 2005
Bellamy et al., 2006
Strand et al., 2006
Shichikawa et al. 1983a Shichikawa et al. 1983b
Bragantini et al. 1987 Grecomoro et al. 1987
Dixon et al. 1988 * Russell et al. 1992
Dougados et al. 1993 Moreland et al, 1993
Puhl et al. 1993 Cohen et al. 1994
Creamer et al. 1994 Dahlberg et al. 1994
Henderson et al. 1994 Scale et al. 1994 **
Carrabba et al. 1995 Corrado et al. 1995
Formiguera & Esteve * France 1995
Guler et al. 1996 Lohmander et al. 1996 **
U.K. 1996 Wu et al. 1997 *
Altman & Moskowitz 1998 Dickson & Hosie 1998† †
Wobig et al. 1998 * Hizmetli et al. 1999
Huskisson & Donnelly Brandt et al. 2001 ***
Bunyaratavej et al. 2001 *** Dickson et al. 2001† †
Tamir et al. 2001 * Karlsson et al. 2002 Petrella et al. 2002
Jubb et al. 2003 Pham et al. 2003‡ ‡
Tsai et al. 2003 Altman et al. 2004 ***
Cubukcu et al. 2004 Day et al. 2004
Pham et al. 2004‡ ‡ Neustadt et. al. 2005 ***
Sezgin et al. 2005 Rolf et al. 2005
Kotevoglu et al. 2006 (42 trials; 41 included
in meta-analyses) 22 20 17 9 32 5
Shaded boxes indicate included in a meta-analysis, bolded RCTs are unpublished, italicized RCTs are abstracts not subsequently published; † or ‡ represent abstract and subsequent publications; although listed twice for to reflect what was included in meta-analysis, they are the same studies and therefore included only once in the total.
* Included for adverse events, but not in any pooled efficacy result. ** Identified in search, but data "could not be used" for any outcome other than adverse events. *** Included in systematic review, but data not used in a pooled by-class result.

38
Guyatt, Singer, et al., 1991) was used to appraise meta-analysis quality.* Descriptions of the ratings provide insight into their basis and potential implications. Although summaries are presented, they should not be interpreted reflecting the potential validity of conclusions from any meta-analysis. Rather, the quality ratings are but one element of the overall evidence evaluation and synthesis.
Application of the Overview Quality Assessment Questionnaire found one meta-analysis to have minimal flaws, one minor, and three major flaws (Table 7). The primary flaws identified included not searching EMBASE and language restrictions. Only one meta-analysis (Bellamy, Campbell, Robinson, et al., 2006) included any RCTs (n=2) published in a non English language. However, the two studies (Shichikawa, Igarashi, Sugawara, et al., 1983 Shichikawa, Maeda, and Ogawa, 1983) were both 5 weeks in duration and assessed pain using a 4-point scale (no symptom, mild, moderate, severe). Therefore, while language limitation affected numerical ratings, implications for results of any meta-analysis results are minimal. Conclusions were judged supported by the data in one meta-analysis, partially in three, and unsupported in one (summarized in Appendix C†, Table IJ).
In summary, based on the methodologic appraisal and quality, these meta-analyses form a substantive body of evidence and basis from which to evaluate the efficacy of hyaluronans for OA of the knee.
Characteristics of the Study-Level Meta-Analyses. Comparative characteristics of the study-level meta-analyses are detailed in Table 8. Study inclusion criteria differed among them as did pain and function effect measures combined. Bellamy, Campbell, Robinson, et al. (2006)‡ and Arrich, Piribauer, Mad, et al. (2005) pooled the mean difference at follow-up (weighted mean difference); assuming equal baseline pain measurements this measure reflects difference in change. Modawal, Ferrer, Choi, et al. (2005) pooled the calculated difference in change directly (reporting a weighted mean difference). Lo, LaValley, McAlindon, et al. (2003) pooled the difference in change standardized by standard deviation. Wang, Chen, Huang, et al. (2004) pooled effects as a percentage reduction compared to placebo. The treatment of time relative to the potential longitudinal nature of effects also differed among the study-level meta-analyses. Lo, LaValley, McAlindon, et al. (2003) examined effect at the time of likely maximum benefit (2 to 3 months post-injection) (Kirwan, 2001); Wang, Chen, Huang, et al. (2004) possible benefit over entire studies (discussed in detail later); Arrich, Piribauer, Mad, et al. (2005), Modawal, Ferrer, Choi, et al. (2005), and Bellamy, Campbell, Robinson, et al., (2006) pooled effects for various periods following administration. Pooling of functional differences, when reported, differed similarly.
Model selection was dictated by the degree of heterogeneity—random-effects models were generally used. Meta-regressions were performed in three meta-analyses (Wang, Chen, Huang, et al., 2004; Arrich, Piribauer, Mad, et al., 2005; Modawal, Ferrer, Choi, et al., 2005) exploring a variety of factors with study quality examined in each. Two of the five study-level meta-analyses reported funnel plot asymmetry (Lo, LaValley, McAlindon, et al., 2003; Modawal, Ferrer, Choi, et al., 2005), two did not (Wang, Chen, Huang, et al.; 2004; Arrich, Piribauer, Mad,
* Strand, Conaghan, Lohmander, et al. (2006) was not rated because the questionnaire is not validated for patient-level meta-analyses. † Appendixes cited in this report are available electronically at http://www.ahrq.gov/clinic/tp/oakneetp.htm ‡ Bellamy, Campbell, Robinson, et al. (2006) also pooled outcome measures in other manners, but for pain primarily as a post-test weighted mean difference.

Table 7. Overview quality assessment questionnaire ratings of viscosupplementation meta-analyses
Item Rating Lo et al., 2003 Wang et al., 2004 Arrich et al., 2005 Modawal et al., 2005 Bellamy et al., 2006
1. Were the search methods used to find evidence (original research) on the primary question(s) stated?
Clearly stated Clearly stated Clearly stated Clearly stated Clearly stated
2. Was the search for evidence reasonably comprehensive?
Did not include EMBASE, but did search Cochrane Registry
English language only; did search Cochrane Registry
Searched 4 electronic databases; Cochrane Registry; limited to English and German
Restricted to English, did not include EMBASE, but did search Cochrane Registry
Comprehensive, no language restrictions; included multiple databases; hand searching
3. Were the criteria used for deciding which studies to include in the overview reported?
Clearly stated Clearly stated Defining
populations not explicitly defined
Defining populations, intervention, principal outcomes, and trial design specified
Defining population, intervention, principal outcomes, and trial design specified
4. Was bias in the selection of studies avoided?
Due to lack of EMBASE search--i.e. no on Q2
Language and lack of unpublished literature—no on Q2.
Because partial Q3; language restriction; no test for publication bias
English language restriction Clearly stated
5. Were the criteria used for assessing the validity of the included studies reported?
Applied stated criteria although minimal
Used 28-point validated check list
Employed stated criteria: reporting treatment allocation; blinding; intention-to-treat analysis
Chalmers Jadad
6. Was the validity of all studies referred to in the text assessed using appropriate criteria (either in selecting studies for inclusion or in analyzing the studies that are cited)?
Each trial rated Each trial rated Each trial rated Each trial rated Each trial rated
7. Were the methods used to combine the findings of the relevant studies (used to reach a conclusion) reported?
Yes Partially
or can't tell - No
Random-effects models
Random-effects models when heterogeneity present
Random-effects models
Random-effects models
When combined used fixed- and random-effects models
39

Table 7. Overview quality assessment questionnaire ratings of viscosupplementation meta-analyses (continued)
Item Rating Lo et al., 2003 Wang et al., 2004 Arrich et al., 2005 Modawal et al., 2005 Bellamy et al., 2006
8. Were the findings of the relevant studies combined appropriately relative to the primary question the overview addresses?
Random effects models accounting for heterogeneity
Random effects models accounting for heterogeneity
Random effects models accounting for heterogeneity
Random effects models accounting for heterogeneity
Random effects models accounting for heterogeneity
9. Were the conclusions made by the author(s) supported by the data and/or analysis reported in the overview?
Yes Partially
or can't tell - No
Due to Q2
Did not define a clinical meaning for SPID (sum of pain intensity difference) etc; English only
Generally cogent synthesis of results; well conducted meta-analysis
Due to no on Q2; incorrect Egger test interpretation
No assessment of publication bias; primarily reported individual trial results.
10. How would you rate the scientific quality of the overview?
“Flaws”: 1 extensive 2 3 major 4 5 minor 6 7 minimal
3
Due to Q2
3
Due to Q2
5
Due to Q3 and Q4
3
Due to Q2, Q9
6
Due to Q9
40

Table 8. Characteristics of study-level viscosupplementation meta-analyses
Lo et al., 2003 Wang et al., 2004 Arrich et al., 2005 Modawal et al., 2005 Bellamy et al., 2006
General inclusion criteria
Single- or double-blind IA placebo-controlled
RCTs, at least 3 injections, <50%
dropout, >2 months f/u
Single or double blind placebo controlled
RCTs
Single or double blind placebo controlled
RCTs
Double blind placebo controlled RCTs
Single or double blind placebo (also other
comparator controlled RCTs not considered
here)
Pain and function outcome(s) compared to placebo
Pain: Global knee or walking or WOMAC pain or Lequesne or during non-walking activities
Pain with and without activities
Joint function
Pain at rest Pain during or after
exercise Joint function
Knee pain (VAS) during activity or rest
VAS pain rest, weight bearing; WOMAC pain, function Patient global
assessment Lequesne Index‡
Pain effect measure SMD Pain Change
Sum of Pain Intensity Differences
WMD Pain Difference at Follow-up
WMD Pain Change
WMD Pain Difference at Follow-up
Other pooled effect measures Sum of Functional
Intensity Differences SMD Joint Function Difference at follow-up
in WMD, SMD; RR Multiple outcomes
Time "8 to 12 weeks"
All time points/area under the curve
2–6, 10–14, 22–30 weeks
1, 5–7, 8–12, 15–22 weeks
1–4, 5–13, 14–26, 45–52 weeks
Model selection random effects random & fixed effects random effects random effects random & fixed effects
Trial quality assessment Intention-to-treat analysis/dropout rate
28-point checklist (Downs and Black 1998)
Allocation concealment; intention-to-treat analysis; Binding
Chalmers Jadad
Comment on trial quality
7/22 intention-to-treat data available
Mean dropout 12.4% (0-40.3)
Mean score 17 (9–25) (maximum possible 28)
Trial quality considered “unsatisfactory” Mean .70/1 (.44–.80) Mean 3.8/5 (2–5)
Heterogeneity
Test used Cochran's Q Cochran's Q (only non-cross linked)
Cochran's Q I2
Cochran's Q Galbraith Plot I2
Result(s) p<.001 Multiple values reported, all significant except for
ASFID%
Pain at rest I2 94% Pain after or during exercise I2 81%
Joint function I2 66%
Heterogeneity evident in plot;
Q (p<.001) at time points examined
I2 varied according to outcome; for pain and
function generally 70–80%
41

Table 8. Characteristics of study-level viscosupplementation meta-analyses (continued)
Lo et al., 2003 Wang et al., 2004 Arrich et al., 2005 Modawal et al., 2005 Bellamy et al., 2006
Meta-regression
Factors explored —
Only for non-cross-linked: quality,
publication year, molecular weight, mean
age, trial duration, sample size
Allocation concealmentBlinded outcome
assessment intention-to-treat
analysis
Pain type, medication (HA vs. hyaluronan G-F20), trial quality, week
—
Sensitivity analysis Yes Yes Yes Yes No
Funnel plot/bias Funnel Plot
(asymmetric) Egger Test
(p=.07)
Funnel Plots (symmetric)
Regression methods Egger Test; "could not
detect”
Egger Test (p=.096) Not Performed
Included studies 22 RCTs 20 RCTs 22 RCTs 9 RCTs 32/76 RCTs§ Industry sponsored 77% 65% not reported 73% 30%§ † I2 A measure of overall variability ranging from 0% to 100% ‡ Bellamy examined other outcomes not a part of this report's protocol § Based on notes reported for RCTs ASFID: adjusted sum of function index differences; f/u: followup; HA: hyaluronic acid; IA: intra-articular; RR: relative risk; SMD: standardized mean difference (standardized effect size); VAS: visual analog scale; WMD: weighted mean difference; WOMAC: Western Ontario and McMaster Osteoarthritis Index
42

43
et al., 2005), and Bellamy, Campbell, Robinson, et al. (2006) did not report those results (funnel plot asymmetry is later examined in supplementary analyses).
Summary. The approaches and characteristics of the five study-level meta-analyses provide different perspectives of the evidence. Supplementing results by relevant elements of included RCTs, the meta-analyses permit broad synthesis of the evidence. Individual Meta-Analyses. Lo, LaValley, McAlindon, et al., 2003. Only pain outcome measures were pooled in this meta-analysis. MEDLINE® and Cochrane Controlled Trials Registry were searched from 1966 through February 2003, supplemented by hand searches of trial bibliographies and abstracts relevant scientific meetings. Randomized single- or double-blinded, placebo-controlled trials published in English and non-English languages were eligible for inclusion. RCTs were included if at least 3 intra-articular hyaluronan injections were administered, an intra-articular placebo was used, drop-out rate was less than 50 percent, and pain was reported using at least one of following instruments (in order of decreasing precedence): 1. Global knee pain score (VAS or Likert scale) 2. Knee pain on walking (VAS or Likert scale) 3. WOMAC Index 4. Lequesne Index 5. Knee pain during activities other than walking (VAS or Likert scale).
From 57 RCTs identified results from 22 were pooled. Because different outcome measures
were combined, standardized mean differences in change* were pooled—the mean difference in pain change from baseline between treated and placebo groups divided by the pooled standard deviation. If pain was reported between 2 and 3 months following initial treatment that measure was included. Otherwise, pain measures were obtained from assessments occurring between 1 to 2 and 3 to 4 months.
Trial quality was characterized by reporting of an intention-to-treat analysis and drop-out rates. An intention-to-treat analysis was defined as “(1) it was characterized by its investigators as such and there was an attempt to analyze data from all randomized participants, or (2) there was no dropout (even if the analysis was not specifically described as intent-to-treat).” When intention-to-treat data were not published the authors attempted to obtain it.
The overall pooled standardized mean difference in change (Table 9) was -0.32 and accompanied by significant heterogeneity.
Table 9. Overall result for pain from Lo, LaValley, McAlindon, et al. (2003)
Time Week "8–12" Standardized Mean Difference (Change) -0.32
95% CI -0.47 to -0.17 Heterogeneity (Cochran Q) p<.001
Trials Included 22 CI: confidence interval
* A standardized effect size for difference in change from baseline.

44
When the three RCTs of hylan G-F 20 were excluded, the pooled standardized mean difference diminished to -0.19 (95 percent confidence interval (CI): -0.27 to -0.10) with no evidence of heterogeneity (Cochran Q p=.58). The authors judged two of these three RCTs outliers (Scale, Wobig, and Wolpert, 1994; Wobig, Dickhut, Maier, et al., 1998). With the possible exception of hylan G-F 20, there was no indication of an association between product molecular weight and effect magnitude.
The pooled effect estimate from unpublished RCTs (-0.07; 95 percent CI: -0.28 to 0.15) and significant the Egger Test (p=.07) were interpreted as supporting publication bias. Nine of the RCTs were judged to have attempted an intention-to-treat analysis and three other analyses viewed as intention-to-treat owing to complete follow-up. Dropout rates in the pooled studies ranged from 0 to 40.3 percent.
Wang, Chen, Huang, et al., 2004. Pain (with or without activities) and functional outcome measures reported by VAS, WOMAC scores, Lequesne Index, or MODEMS (Musculoskeletal Outcomes Data Evaluation and Management Scale), and adverse events were pooled. MEDLINE®, EMBASE, Cochrane Controlled Trials Registry, and EMBASE were searched from 1966 to December 2001 for randomized single- or double-blinded, placebo-controlled trials. Hand searching was performed of relevant publications and bibliographies reviewed. Unpublished literature was not searched. Only English-language RCTs were considered. Reported outcome measures for pain or function were required. From 665 identified articles, results from 20 were pooled. Trial quality was appraised using a 28-point checklist developed by Downs and Black (1998).
A single outcome estimated over each trial’s duration was pooled. The measure was intended to assess efficacy with respect to pain and functional outcomes—“efficacy scores.” The scores were obtained for pain and functional scales by:
1. Calculating the average difference between each consecutive time point 2. Dividing the average difference by the time between the those time points 3. Repeating the calculation for all consecutive time points and summing results. The method estimates the area under the “pain intensity difference-versus-time curve.” Finally, the estimate is divided by the maximum scale of pain intensity multiplied by the trial duration and expressed as percentage—the SPID% or SFID% (sum of pain or functional intensity differences as a percentage). Two related estimates were also calculated and pooled as: 1. Averages: ASPID% and AFID% (sum of pain or functional intensity differences divided by
the baseline intensity multiplied by trial duration) 2. Peak differences: Peak PID% and Peak FID% (maximum pain or functional intensity
differences divided the maximum of the scale).
Table 10 displays pooled results for activity pain and function. Functional measures were pooled separately for hylan G-F 20 and other hyaluronans.

45
Table 10. Overall results for pain with activity and function for non-G-F 20 hyaluronans (non-cross-linked) from Wang, Chen, Huang, et al. (2004)
Pain with Activities Function (Non-Cross-Linked) Pooled Measure* SPID% ASPID% Peak PID% SFID% ASFID% Peak FID%
Estimate 7.9% 13.4% 9.9% 5.3% 11.7% 8.2% 95% CI 4.1 to 11.7 5.5 to 21.3 4.8 to 15.0 2.1 to 8.5 6.3 to 16.2 3.8 to 12.6
Heterogeneity† 84% (I2) 83% (I2) 91% (I2) p=.33 (Q) p=.23 (Q) p<.001 (Q) Trials included 17 15 16 NR NR NR
* See text for definitions of Pooled Measures † Q reported only for functional measures. I2 calculated from data presented when possible. (A)SFID: (adjusted) sum of function index differences; (A)SPID: (adjusted) sum of pain index differences; CI: confidence interval; FID; function index differences; PID: pain index differences;
Pooled estimates were higher for the 3 RCTs of hylan G-F 20 (Dickson and Hosie, 1998
[later published as Dickson, Hosie, and English, 2001]; Scale, Wobig, and Wolpert, 1994; Wobig, Dickhut, Maier, et al., 1998): SPID%, 23.6 percent; ASPID%, 34.8 percent; peak PID%, 27.1 percent; SFID% 21.9 percent; ASFID%, 38.3 percent; PEAK FID%, 26.8 percent (no confidence intervals accompanied estimates).
Subgroup analyses and meta-regressions were reported for the non-G-F 20 hyaluronans. However, results were not always consistent for the three endpoints. Table 11 displays subgroup findings reporting a suggested difference only when results were consistent for all three outcome measures examined (SPID%, ASPID%, Peak PID%). Qualitative results are displayed because these analyses must be considered hypothesis generating. Table 11. Subgroup results for non-cross-linked hyaluronans
Subgroup Result Blinding Single > Double* Centers Single Center* > Multicenter Intention-to-treat analyses ITT Analyses* ? Per Protocol Age Mean Age <65* > Mean Age >65* Disease stage Less Advanced > Advanced Effusion as inclusion criteria Effusion ? No Effusion Sample size <100* > >100 Escape analgesics allowed Not Allowed > Allowed Funding Non Industry* > Industry * Indicates significant Cochran Q for at least 2 of the 3 outcome measures—i.e., heterogeneity in pooled result. > indicates effect larger in subgroup; ? inconsistent for the 3 outcome measures
Significant associations with trial results were found in meta-regressions for: (1) mean
patient age for ASPID% without activities only; (2) publication year for SPID% functioning; and (3) trial quality, mean patient age, and sample size for ASFID% functioning. No association between molecular weight and outcome measures was found. Of the 54 regression coefficients tested, five were statistically significant.
Funnel plots using sample size for the ordinate (vertical axis) were not consistent with publication bias. The authors commented indirectly on the overall methodologic quality of the primary literature stating that allocation concealment was unclear in all RCTs and more high quality trials are needed. The mean quality score on the rating system used was 19 points (maximum 28) (Downs and Black, 1998, Pendleton, Arden, Dougados, et al., 2000).

46
Major adverse events were documented in three of 1002 knees treated with non G-F 20 hyaluronans (severe swelling, vasculitis, and a hypersensitivity reaction); one patient from 139 knees treated with hylan G-F 20 experienced an acute painful local reaction. The pooled relative risk of minor adverse events for all hyaluronan products was 1.2 (95 percent CI: 1.01 to 1.41).
Arrich, Piribauer, Mad, et al. (2005). Outcomes examined in this meta-analysis included pain at rest and during or after activities (VAS), joint function (WOMAC, Lequesne Index, subjective VAS rating, time for 40-meter walk), and adverse events. MEDLINE®, EMBASE, CINAHL, BIOSIS, and the Cochrane Controlled Trials Registry were searched from inception through April, 2004 for randomized single- or double-blinded, placebo-controlled trials published with English or German abstracts. Either pain at rest, during or after movement, joint function, or adverse event reporting was required. From 1,159 articles identified 22 were included—data from 17 trials reporting pain and/or joint function outcome measures were pooled; for adverse events outcomes from the 5 additional trials were included.
Outcome measures were pooled separately for four time periods: weeks 2 to 6, 10 to 14, 22 to 30, and 44 to 60. VAS pain was pooled as a weighted mean difference for each period. Different functional outcome measurement scales reported required pooling standardized effect sizes. Comparative adverse event risk was pooled as a relative risk. Trial quality was characterized by adequacy of allocation concealment, use of intention-to-treat analyses, and blinding.
Table 12 displays pooled pain results.
Table 12. Pooled visual analog scale results for rest and activity pain from Arrich, Piribauer, Mad, et al. (2005)
Rest During/After Exercise Weeks 2–6 2–6 10–14 22–30
Weighted mean difference VAS (100mm) -8.7 mm -3.8 mm -4.3 mm -7.3 mm 95% CI -17.2 to -0.2 -9.1 to 1.4 -7.6 to -0.9 -11.8 to -2.4
Heterogeneity (I2) 94% 81% 0% 0% Trials included 9 9 5 4
When rest pain measures were pooled from trials not using intention-to-treat analyses or
when allocation concealment absent or unclear, the weighted mean difference was 15.6 mm lower (i.e., greater effect magnitude favoring hyaluronans); in unblinded trials the weighted mean difference was 13.6 mm lower (favoring hyaluronans). The large value of I2 for activity pain at 2 to 6 weeks was attributed to Henderson, Smith, Pegley, et al. (1994) in which pain increased among those with more advanced disease receiving hyaluronans. Excluding the trial diminished I2 to 20 percent while yielding a similar pooled weighted mean difference (-4.2 mm, 95 percent CI: -7.5 to -0.8). The authors noted that trial quality did not influence the pooled estimates for pain during or after exercise, but only a single trial was judged high quality.
Pooled results for joint function are displayed in Table 13. Similar to the rest pain results, unclear or absent allocation was accompanied by larger effect sizes during the first two time periods.

47
Table 13. Pooled results joint function from Arrich, Piribauer, Mad, et al. (2005) Joint Function
Weeks 2–6 10–14 22–30 Standardized mean difference 0.0 -0.11 -0.16
95% CI -0.23 to 0.23 -0.31 to 0.09 -0.16 to 0.13 Heterogeneity (I2) 66% 59% 62%
Trials included 9 7 5
Sensitivity analyses were performed for all pooled outcomes at weeks 2 to 6 and 10 to 14 were including only RCTs reporting adequate allocation concealment, blinded outcome assessment, and intention-to-treat analyses. According to the report, “[N]o significant effect in favour of the intervention” was found. There was no association between molecular weight and effect size in meta-regressions. Adverse events, typically minor, were more common with hyaluronans than with placebo (pooled relative risk 1.08; 95 percent CI; 1.01 to 1.15). No evidence of publication bias was reported using regression methods, except possibly for the studies reporting adverse events (publication of trials reporting adverse events was more frequent).
Modawal, Ferrer, Choi, et al., 2005. The meta-analysis pooled only pain outcome measures reported on a VAS scale. MEDLINE®, and the Cochrane Controlled Trials Registry were searched from 1965 to August, 2004 for randomized double-blind, placebo-controlled English-language RCTs. Reference lists of included articles and reviews were also searched. From 1,872 articles identified 9 were included. Studies reporting pain as part of the WOMAC were excluded. Pain measures during activity or at rest were extracted and pooled (although which studies and at what time periods contributed activity or rest pain measures was not specified).
The mean difference between treatment and placebo in change from baseline pain was pooled for four time periods: weeks 1, 5 to 7, 8 to 12, and 15 to 22. Adverse event rates were not summarized. Trial quality was assessed using the method of Chalmers, Smith, Blackburn, et al. (1981) (maximum score of 1.0)—those scoring 0.75 or lower were considered low quality.
Table 14 displays the pooled results. Table 14. Pooled visual analog scale pain change from Modawal, Ferrer, Choi, et al. (2005)
Pain with activity or rest Weeks 1 5–7 8–12 15–22
Weighted mean difference VAS change (100mm) -4.4 mm -17.6 mm -18.1 mm -4.4 mm 95% CI -7.2 to -1.1 -28.0 to -7.5 -29.9 to -6.3 -24.1 to 15.3
Heterogeneity (I2*) 92% 92% 95% 94% Trials Included 9 6 6 3
* I2 calculated from Q and accompanying df (degrees of freedom).
Heterogeneity examined with Galbraith plots was consistent with the I2 values calculated.
Excluding the four low-quality trials diminished the pooled effect magnitudes considerably (Table 15).

48
Table 15. Pooled visual analog scale pain change for high-quality RCTs from Modawal, Ferrer, Choi, et al. (2005)
Pain with activity or rest Weeks 1 5–7 8–12 15–22
Weighted Mean Difference VAS Change (100mm) 1.0 mm -7.2 mm -7.1 mm -4.4 mm 95% CI -1.2 to 3.2 -12.0 to -2.4 -11.3 to -3.0 -24.1 to 15.3
Heterogeneity (I2*) 83% 0 9% 94% Trials Included 7 2 6 3
* I2 calculated from Q and accompanying df (degrees of freedom).
In meta-regressions, trial quality and hylan G-F 20 were associated with significantly better
outcomes at 5 to 7 and 8 to 12 weeks; poor trial quality was associated better outcomes at other time periods although statistically significant only at week 1. Potential publication bias was assessed using Egger test (p=.096) (time period not specified) which the authors stated was “not statistically significant…suggesting that there is no publication bias.”
Bellamy, Campbell, Robinson, et al., 2006.* Outcomes examined relevant to our protocol included pain at rest and with activity, WOMAC function, Lequesne Index, patient global assessment, and adverse events. The literature search included MEDLINE® (to the first week of January 2006); EMBASE, PREMEDLINE, and Current Contents to July 2003; the Cochrane Central Register of Controlled Trials; specialized journals and reference lists of identified randomized controlled trials; and pertinent review articles to December 2005. Single- or double-blinded randomized controlled trials with placebo or other comparators were eligible; no language restrictions were imposed. From 76 trials identified, 32 in the meta-analysis were placebo-controlled comparisons. Outcome measures from 30 RCTs were pooled in some manner. Trial quality was assessed using the Jadad scale (Jadad, 1996).
Outcome measures were pooled separately for four time periods: weeks 1 to 4, 5 to 13, 14 to 26, and 45 to 52. Unadjusted post-test scores were pooled (Bellamy, Campbell, Robinson, et al., 2006; page 5)—the difference between treatment and placebo at follow-up. VAS pain and Lequesne Index scores were pooled as weighted mean differences; WOMAC pain and function as standardized mean differences; patient global assessment and adverse events as relative risks.
Both by-product and by-class results were reported. While Bellamy, Campbell, Robinson, et al. (2006) emphasize the by-product results, we focus on by-class results for both clinical and methodologic reasons. Rationale for by-product results is based on the premise that “…these products differ in their MW [molecular weight], concentration, treatment schedules, and mode of production…” However, with the exception of hylan G-F 20, none of the preceding meta-analyses found outcomes differing by molecular weight. Thus, there is potential for spurious subgroup findings with multiple individual product analyses. Of the more than 850 forest plots presented, only 38 combine results from more than 3 trials. Accordingly, we focus on by-class results.
Table 16 displays pooled results for VAS pain at rest and with weight-bearing comparing hyaluronans to placebo.†
* As of this writing, this review has been re-issued as a 627-page version, Bellamy, Campbell, Robinson, et al., (2007) without an updated literature review. The date of the most recent substantive amendment is the same in both documents—February 21, 2006. † One trial included in these pooled results (Wobig, Bach, Beks, et al., 1999) was not strictly a placebo comparison. However, removing it did not alter any result materially when results were replicated.

49
Table 16. Pooled visual analog scale results for rest and weight-bearing pain from Bellamy, Campbell, Robinson, et al. (2006)
Rest Weight-Bearing Weeks 1–4 1–4 5–13 14–26 45–52 Weighted mean difference VAS (100mm) -3.5 mm -7.7 mm -13.0 mm -9.0 mm -2.6 mm
95% CI -9.2 to 2.1 -11.3 to -4.1 -17.8 to -8.2 -14.8 to -3.2 -7.4 to 2.2 Heterogeneity (I2) 80% 80% 82% 77% 0%
Trials included 9 20 16 8 3
The magnitude of pooled effect estimate was greatest at 5 to 13 weeks and lower thereafter—the critical caveat being that trials and outcome measures from different patients were pooled at different periods. The degree of heterogeneity among trials was large at all periods except weeks 45 to 52 where only 3 trials were included.
WOMAC pain was pooled as a standardized mean difference because different pain scale metrics were used as allowed in the instrument (Table 17). Table 17. Pooled Western Ontario and McMaster Osteoarthritis Index pain results from Bellamy, Campbell, Robinson, et al. (2006)
WOMAC Pain Weeks 1–4 5–13 14–26
Standardized mean difference -1.2 -1.0 -1.0 95% CI -1.9 to -0.5 -1.6 to -0.5 -1.8 to -0.3
Heterogeneity (I2) 88% 88% 80% Trials included 6 6 3
Pooled standardized mean differences were lower than -1.0 during each period and
magnitudes appeared similar over time. Heterogeneity among trials was large (I2 values 80 to 88 percent).
Pooled WOMAC function standardized mean differences (Table 18) were similar to the WOMAC pain results. Table 18. Pooled Western Ontario and McMaster Osteoarthritis Index function results from Bellamy, Campbell, Robinson, et al. (2006)
WOMAC Physical Function Weeks 1–4 5–13 14–26
Standardized mean difference -1.0 -0.9 -0.8 95% CI -1.6 to -0.4 -1.3 to -0.4 -1.4 to -0.2
Heterogeneity (I2) 85% 84% 70% Trials included 6 6 3
Lequesne Index (pain and function composite ranging 0 to 24) scores were pooled from up to
five trials for the four time periods (Table 19). Table 19. Pooled Lequesne Index results from Bellamy, Campbell, Robinson, et al. (2006)
Lequesne Index Weeks 1–4 5–13 14–26 45–52
Weighted Mean Difference -0.8 -1.4 -0.1 -1.1 95% CI -1.5 to -0.2 -2.0 to -0.7 -0.8 to 0.9 -2.7 to 0.5
Heterogeneity (I2) 44% 16% 6% NA Trials Included 5 4 3 1

50
There was less heterogeneity than for the WOMAC results. However, estimates at 1 to 4 and 5 to 13 weeks included results from 40 patients twice in the trial finding the largest benefit (Carrabba, Paresce, Angelini et al., 1995).
Patient global assessment was pooled as the relative risk of improvement (Table 20). Table 20. Pooled global assessment results from Bellamy, Campbell, Robinson, et al. (2006)
Patient Global Assessment Weeks 1–4 5–13 14–26 45–52
Relative risk of improvement 1.1 1.1 1.0 1.0 95% CI 0.9 to 1.4 0.9 to 1.4 0.7 to 1.5 0.8 to 1.2
Heterogeneity (I2) 58% 60% 70% 30% Trials included 5 6 4 2
Although lower than in previous results, heterogeneity was still generally high. There was no evidence that patient-reported global improvement differed with treatment during any time period—all relative risks were indistinguishable from unity
While few studies reported responder rates from intention-to-treat analyses, Bellamy, Campbell, Robinson, et al. (2006) reported number needed to treat (NNT) for some outcomes (Table 21). They varied in both magnitude and direction (negative indicates placebo better). Only NNTs derived from Altman, Akermark, Beaulieu, et al. (2004), and possibly Brandt, Block, Michalski, et al. (2001) are well anchored to response defined by attaining some minimal clinically important improvement.
The systematic review did not directly examine any potential relationship between product molecular weight and efficacy. However, results from studies of hylan G-F 20 were separately analyzed. At 5 to 13 weeks, the pooled weighted mean difference in VAS measured pain from four trials was -22.5 mm (95 percent CI: -35.2 to -9.7; I2 = 82.9%). One trial included in the estimate was not strictly a placebo comparison (Wobig, Dickhut, Maier, et al., 1998).
Potential publication bias was not analyzed although discussed: “In an attempt to address potential publication bias, we have searched abstract books, as well as published manuscripts, corresponded with manufacturers, and contacted investigators in the search for additional information or unpublished studies” (Bellamy, Campbell, Robinson, et al., 2006; page 46). Sensitivity analyses or meta-regressions exploring heterogeneity of pooled estimates were not reported. Mean trial quality on the Jadad scale was 3.7 (range 2 to 5).
The pooled relative risk of local reactions for hylan G-F 20 (5 trials) was 1.9 (95 percent CI: 0.51 to 7.3, 5 trials) and other hyaluronans 1.6 (95% CI: 0.54 to 5.6, 5 trials). Adverse events were otherwise reported primarily as relative risks from individual trials.
Strand, Conaghan, Lohmander, et al., 2006. Strand, Conaghan, Lohmander, et al. (2006) conducted a patient-level meta-analysis for a single outcome—the Lequesne Index. Patient data (N=1,155) were obtained from five double-blind placebo-controlled randomized controlled trials included in a premarketing approval application for Supartz® (18 trials were included in the application). The five trials were conducted in Germany, Sweden, U.K., France, and Australia. Three have been published (Day, Brooks, Conaghan, et al., 2004; Puhl, Bernau, Greiling, et al., 1993; Lohmander, Dalen, Englund, et al., 1996).

51
Table 21. Numbers needed to treat for various outcomes from Bellamy, Campbell, Robinson, et al. (2006) Trial Weeks NNT
Number of Patients Improved 1–4 100
5–13 Infinity Lohmander et al., 1996 14–26 7.1
Shichikawa et al., 1983a (5-week trial) 1–4 5 Shichikawa et al., 1983b (5-week trial) 1–4 11 Puhl et al., 1993 5–13 10 Brandt et al., 2001 14–26 20
Number of Patient Clinical Failures 14–26 11 Karlsson et al., 2002 45–52 6.7
WOMAC Pain 40% Relative; 5-point Absolute (20-point scale) 1–4 14
5–13 -33* Altman et al., 2004 14–26 -33*
WOMAC Pain >5-point Improvement (20-point scale) Brandt et al., 2001 >5-Point 14–26 5.9
Patient Global Assessment (Number Improved) Corrado et al., 1995 1–4 -2.3 Creamer et al., 1994 1–4 11.1 Sala et al., 1995 1–4 -6.7 Corrado et al., 1995 5–13 -10 Sala et al., 1995 5–13 -2.9 Henderson et al., 1994 14–26 25 Huskisson et al., 1999 14–26 -3.1 * Sign incorrectly reported in Bellamy, Campbell, Robinson, et al. (2006, page 194; 2007, page 194)
Participants received three to five weekly intra-articular hyaluronan or placebo injections and were followed at least 3 months. They were assessed at weeks 5 and 13 in all trials, week 9 in four, and weeks 17, 20, and/or 25 in three trials. Four trials included individuals aged 40 years and older; the other aged 50 years and older (Lohmander, Dalen, Englund, et al., 1996). Lequesne Index score was the primary outcome in three RCTs. Intention-to-treat analyses were used and missing data imputed by carrying the last observation forward. Both fixed- and random-effects models were examined. Trial quality was assessed by Jadad scale.
Analyses included 1,155 participants (619 treated, 536 placebo). Dropout rates were 10.2 and 14.6 percent in treated and placebo arms respectively. The highest drop out rates occurred in the unpublished U.K. trial—28.3 and 40.9 percent in hyaluronan and placebo groups. No significant baseline differences were noted within the overall sample.
Longitudinal mixed-effects models (random effects) were fitted to the data with some differences between the fixed- and random-effects models. In both, a significant treatment effect was seen; the treatment by time interaction was not significant in the fixed-effects model and reached p=.06 in the random effects one.
In a fixed-effects model the mean improvement in Lequesne Index was -2.74 and -2.16 in the placebo group (difference of -0.58, 95 percent CI: -0.95 to -0.20); in a random-effects model -2.68 and -2.00 (difference of -0.68, 95 percent CI: -0.79 to -0.56). When analyses were

52
conducted for individual trials, treatment effects were statistically significant in two. Results were sensitive to model specification in two trials. For one, (Puhl, Bernau, Greiling, et al., 1993) the fitted mixed-effects model showed no treatment difference (p=.55), while the original publication reported a statistically significant difference in Lequesne Index scores at the end of follow-up (p=.005 at 14 weeks). No participant-level random-effects models were examined.
Adverse events were noted in 1.8 and 3.2 percent of the hyaluronan and placebo groups. Trials Not Pooled or Included in Meta-Analyses. Two RCTs identified by Bellamy,
Campbell, Robinson, et al. (2006) were not pooled—one trial of a non-animal stabilized hyaluronan (NASHA) (Altman, Akermark, Beaulieu, et al., 2004) and the other Neustadt, Caldwell, Burnette, et al. (2005) (see Appendix C*, Tables IB–IG). These RCTs were not included in other meta-analyses owing to recent publication dates.
Altman, Akermark, Beaulieu, et al., 2004. The trial randomized 347 participants in a placebo-controlled double-blind 26-week multicenter trial across 18 sites in the United States, Canada, and Sweden. Treatment and placebo groups were comparable at baseline. Mean participant age was approximately 63 years; 55 percent were female; and 35 percent had prior knee surgery; knees with Kellgren-Lawrence radiographic grades 2 to 4 were enrolled. A single NASHA (60 mg) or saline placebo injection was administered to 172 or 174 participants, respectively. The primary outcome was response defined as a reduction in WOMAC pain score (20-point scale) >40 percent with an absolute 5-point improvement. Following the baseline exam, participants were assessed at weeks 2, 6, 13, and 26.
Trial quality was rated “good.” There were no differences in response rates between treatment and placebo arms at any of the time points examined in either intention-to-treat or per protocol analyses. In a post-hoc analysis of the subgroup with only knee OA (62 percent), a significant difference was found at week 6 (42.1 versus 27.5 percent) but at no other time point.
This trial used clearly defined responder criteria (Dougados, Nguyen, Listrat, et al., 2000) and found no evidence for a beneficial effect of NASHA. The post-hoc subgroup finding of a single difference was inconsistent with the overall result.
Neustadt, Caldwell, Burnette, et al., 2005. At 24 sites in the United States and Canada, 372 participants were randomized in a placebo-controlled, double-blind, 22-week trial. Treatment and placebo groups were comparable at baseline. The mean age of participants was 60 years; 52 percent were female; those with Kellgren-Lawrence radiographic grades 2 to 3 were enrolled. The trial had three arms with four weekly intra-articular injections: (1) four hyaluronan injections, (2) three hyaluronan injections followed by arthrocentesis, and (3) four arthrocenteses. The primary outcome was response defined as a 20 percent relative and a 50-mm absolute improvement on WOMAC pain at weeks 8, 12, 16, and 22. Baseline characteristics of the intention-to-treat sample were not reported, only those of the “evaluable population.” This subgroup was defined as participants receiving all four injections, attending at least one follow-up visit, and without protocol deviation (n=336 or 90 percent of those randomized). Intention-to-treat analyses were not reported.
Trial quality was rated “fair.” In the “evaluable population,” there were no statistically significant differences in WOMAC pain at any time point. Greater improvement in patient global assessment was evident at weeks 8 through 16 in the four hyaluronan injection group compared to the other two groups. No difference was evident between the arthrocentesis and three hyaluronan injection arms. The primary responder outcome was not reported for the “evaluable population.” * Appendixes cited in this report are available electronically at http://www.ahrq.gov/clinic/tp/oakneetp.htm

53
An “evaluable subgroup” with Kellgren-Lawrence grade 2 or 3 and contralateral knee WOMAC pain <150 mm (500 mm scale) was next analyzed (n=294, 79 percent of those randomized). When response was defined as a 20 percent improvement alone (not the primary specified outcome measure) the 4 hyaluronan injection group was superior to placebo at week 8 (76 versus 62 percent, p=0.035), but at no other time point. The three hyaluronan injection group was not superior to placebo. Further post-hoc subgroup analyses examined 40 and 50 percent improvement response criteria finding higher response 40 percent response rates with four hyaluronan injections compared to placebo at all time points.
The trial did not demonstrate benefit for the primary efficacy outcome and intention-to-treat analyses were not reported. A single statistically significant responder result was found examining two subgroups. Subgroups were apparently defined post-hoc and not analyzed according to the primary efficacy outcome.*
Trials Not Included in Any Meta-Analyses. Rolf, Engstrom, Ohrvik, et al., 2005. This double-blind placebo-controlled trial conducted at two centers in Sweden randomized 272 participants aged 35 years and older (Appendix C†, Tables IA-IG) with:
1. Primarily unilateral OA of the knee 2. Outerbridge grades I through III by arthroscopy performed more than 6 months before entry 3. Pain >40 mm with walking, climbing or descending stairs, or weight bearing.
Mean participant age was approximately 54 years; 40 percent were female; 39 percent had prior partial meniscectomies and 7 prior knee surgery; 43 percent of knees were classified Ahlback grade 0 and 64 percent grade 0 or 1. The trial included three arms: hylan G-F 20, 25 mg hyaluronan, or placebo (buffered saline) each administered once weekly for three weeks. Baseline characteristics in the three arms were comparable; two participants were non-Caucasian. Following the initial examination, participants were assessed at weeks 6, 12, 18, 26, 38, and 52. The primary efficacy outcome was VAS pain during walking, stair climbing, or weight-bearing with the previous assessment provided to the subject. Response was defined being symptom free (VAS <20 mm) at week 26. Among secondary outcomes were Lequesne Index and patient assessment of overall response. Intention-to-treat analyses were performed without adjustments for multiple comparisons.
Trial quality was rated “good.” At 26 weeks, 44 percent of the hylan G-F 20 arm were classified as responders compared to 30 percent in the placebo arm (p=.048) and 43 percent of the hyaluronan arm.‡ Response rates were generally higher with active treatment at all time points, but other comparisons not statistically significant. There were no differences between arms in patient assessed overall treatment response (proportions reporting very good or good in the hylan G-F 20, hyaluronan, and placebo arms being 58, 62, and 52 percent respectively). At 26 weeks the decrease in stiffness score was greater in hyaluronan compared to hylan G-F 20 arm (-18.1 versus -10.5 mm, p=.015) and -13.7 mm in the placebo arm. No differences were * The potentially problematic nature of subgroups analyses is illustrated nicely in the subgroup analyses by Lohmander, Dalen, Englund, et al. (1996), followed by Karlsson, Sjogren and Lohmander (2002), as discussed in Results, Part I, Key Question 3 (Subgroup Analyses). † Appendixes cited in this report are available electronically at http://www.ahrq.gov/clinic/tp/oakneetp.htm ‡ P-values not reported were not calculable from data provided because a logistic regression model was employed including a parameter for center and possible center by treatment interaction.

54
found for “the majority of other efficacy parameters…” including Lequesne Index. Adverse events were reported in 59 percent of the hylan G-F 20 arm, 60 percent of the hyaluronan arm and placebo arms (Appendix C*, Table IH). Arthropathy was more frequent with the hyaluronan preparation (10 percent) compared to either hylan G-F 20 or placebo (3 percent each).
This trial enrolled a young predominantly male sample with a goal to “halt the progression of early-stage chondral pathology to end-stage OA disease.” At 26 weeks, response to hylan G-F 20 was significantly better than placebo, but there were few significant results among the many examined and no adjustment for multiple comparisons. Adverse Events
Adverse event profiles reported in individual trials are shown in Appendix C*, Table IH, but were not consistent across trials. The most frequently reported events were local in nature including injection site pain or infection and local joint pain and swelling. When reported, adverse events appeared generally similar in frequency with either intra-articular hyaluronan or placebo.
The meta-analyses examining adverse events described small relative increased risk. Wang, Chen, Huang, et al. (2004) reported a pooled relative risk for minor events of 1.2 (95 percent CI: 1.01 to 1.41) and Arrich, Piribauer, Mad, et al. (2005) 1.08 (95 percent CI; 1.01 to 1.15). Bellamy, Campbell, Robinson, et al. (2006) estimated a pooled relative risk for local reactions accompanying hylan G-F 20 (five RCTs) of 1.9 (95 percent CI: 0.51 to 7.3, five RCTs) and other hyaluronans (5 RCTs) of 1.6 (95 percent CI: 0.54 to 5.6).
Six articles or abstracts were identified addressing adverse event occurrence. Hamburger, Lakhanpal, Mooar, et al. (2003) reviewed hyaluronan product safety profiles from a MEDLINE® search through July 2002 and the FDA Manufacturer and Device Experience Database (MAUDE).† The review noted rare occurrence of serious reactions to both Hyalgan® and hylan G-F 20.
Waddell (2003) described adverse event rate accompanying hylan G-F 20 from a retrospective review in a single clinical practice. He reported a local adverse event rate of 2.1 percent (82/3,931) per injection—1 percent (34/3,367) for those receiving a single course and 8.5 percent (48/564) accompanying a second course.
Maheu and Bonvarlet (2003) surveyed French rheumatologists to explore the occurrence of acute pseudoseptic arthritis post-hyaluronan injection—a severe hyaluronan-related adverse event reportedly uncommon. A questionnaire was sent to 81 rheumatologists of whom 26 responded. Sixteen reported 33 cases or pseudoseptic arthritis, possibly more frequently associated hylan G-F 20. The authors concluded acute pseudoseptic arthritis is “not so rare.” Limitations of the survey included the absence of a denominator to quantify risk and the low survey response rate.‡
Kemper, Gebhardt, Meng, et al. (2005) reported a 5.3 percent adverse event rate accompanying hylan G-F 20 injections in 4,253 patients. Arthropathy was most common occurring in 3.1 percent of patients. The most severe event reported was a large effusion and synovitis in one patient. Those with previous hyaluronan treatments had a two-fold increased risk of adverse events. Lussier, Cividino, McFarlane, et al. (1996) reported adverse events * Appendixes cited in this report are available electronically at http://www.ahrq.gov/clinic/tp/oakneetp.htm † Dr. Hamburger was a paid consultant to Sanofi-Synthelabo, manufacturer of Hyalgan®. ‡ The survey, funded by Forest Pharmaceuticals, was not subsequently published.

55
among 336 patients receiving 1,537 injections of hylan G-F 20. Local adverse events occurred at a rate of 2.7 percent per injection and in 1 of 12 patients.
Finally, a search of MAUDE for hyaluronan products (code MOZ) from January 1, 2005 through January 1, 2007 identified 236 records reporting adverse events following knee injection. Nine reports mentioned pseudosepsis or pseudoseptic reaction—four associated with Synvisc® (hylan G-F 20), one with Euflexxa©, and four with Hyalgan®. In 85 adverse events patients were hospitalized.
Generally, severe adverse events associated with hyaluronan-based products have been reported as uncommon in trials. In contrast, local minor adverse events appear common, although the risk appears not substantially different compared to placebo injection. The true risk of pseudoseptic reactions may be small, but one study suggests they could be more common than generally thought. Supplementary Analyses Performed by the Evidence-Based Practice Center
We performed supplementary analyses to address three key issues:
1. Heterogeneity—clinical and statistical 2. Publication bias 3. Hylan G-F 20.
The majority of these analyses rely upon data abstracted by Bellamy, Campbell, Robinson, et al. (2006) which included the largest number of trials. However, trial quality ratings we performed and cited throughout this reported were used for all analyses.
Clinical and Statistical Heterogeneity/Sensitivity Analyses. All study-level meta-analyses found high heterogeneity and appropriately employed random effects models. Four of the five identified hylan G-F 20 and trial quality issues as factors affecting pooled estimates. Using post-test VAS pain as the outcome at 5-13 weeks (Bellamy, Campbell, Robinson et al. 2006, Comparison 50, 16 pooled studies), we performed sensitivity analyses exploring factors suggested by the meta-analyses and our own review of evidence:
• Trial quality (good/fair versus poor)* • Hylan G-F 20 versus other hyaluronans • Sample size (<100 or >100) or reported power calculations (these attributes were correlated;
differences according to sample size was found to explain more heterogeneity) • Industry involvement
* Note, these were our trial quality ratings, not those performed by Bellamy, Campbell, Robinson, et al. (2006)

56
• Use of rescue analgesia • Primary intention-to-treat analyses.*
The sensitivity of results to the trial characteristics was examined by fitting random effects
models to subgroups and in meta-regressions. From subgroup analyses, Table 22 shows estimated effects were highly sensitive to study quality, use of hylan G-F 20, sample size, power calculations, and use of rescue analgesics but not industry involvement or primary intention-to-treat analyses. However, heterogeneity remained high in almost all subgroups. Table 22. Results of sensitivity analyses for Bellamy, Campbell, Robinson, et al. (2006) 5–13 week pain
Random-Effects Model*
Study or Sample Characteristic
WMD VAS 100 mm
95% CI
I2
Good/Fair -8.8 -12.4 to -5.2 61.0% Study Quality Poor -23.2 -37.2 to -9.3 89.7%
G-F 20 -20.8 -31.3 to -10.4 83.8% Hylan Others -9.3 -13.4 to -5.1 68.3% < 100 -17.0 -20.8 to -13.2 26.3% Sample
Size > 100 -7.3 -14.6 to 0.4 89.2% Yes -12.8 -18.8 to -6.8 84.6% ITT No -13.5 -22.1 to -4.9 80.2%
Yes -9.1 -16.5 to -1.8 86.5% Power Calculation No -16.2 -22.7 to -9.8 78.5%
Yes -11.4 -16.3 to -6.6 82.5% Rescue Analgesia No -24.2 -34.6 to -13.7 38.1%
Yes -12.9 -18.5 to -7.3 85.4% Industry Involvement No -13.7 -18.4 to -9.0 0.0%* *A fixed-effects model. Add P-values
Characteristics found to influence results next examined in a hierarchical Bayes linear model (DuMouchel, 1994) with a vague prior for τ2† specified. Study quality and hylan G-F 20 were retained in the model based on these findings and conclusions from the meta-analyses. Of the remaining attributes, only sample size was found independent and statistically significant.‡ In the model including study quality, use of hylan G-F 20, and sample size all were statistically significant (respective probabilities of .006, .049, and .01) and between-study variability in the model (τ2) was reduced by 38 percent. In the model pooled weighted mean differences in VAS pain varied from -3.0 mm (good/fair study quality, non G-F 20 hyaluronan, sample size >100) to -29.6 mm (poor study quality, hylan G-F 20, sample size <100). Although analyses must be considered exploratory, in subgroup analyses and meta-regressions results were sensitive to study characteristics and use of hylan G-F 20. Industry involvement had no effect on pooled estimates. While the use of rescue analgesia in subgroup analyses influenced results, it was not independent of study quality and use of hylan G-F 20 and * Is not independent of study quality ratings. † τ2 is a measure of between-trial heterogeneity. ‡ Metaregressions were replicated using STATA Version 9 metareg with consistent results—nearly identical point estimates, but not unexpectedly somewhat different confidence intervals and p-values.

57
only three trials did not allow rescue analgesia. Study quality, hylan G-F 20, and sample size were independently associated with the trial effects explaining a sizeable proportion of between-study variability.
Publication Bias. Three findings suggest the presence of publication bias:
1. Funnel plot asymmetry 2. Small trial bias 3. Unpublished trials.
Funnel Plot Asymmetry. Two meta-analyses found funnel plot asymmetry (Lo, LaValley, McAlindon, et al., 2003; Modawal, Ferrer, Choi, et al., 2005); using sample size as the ordinate Wang, Chen, Huang, et al., (2004) suggested no evidence of asymmetry. Arrich, Piribauer, Mad, et al. (2005) found no evidence of publication bias while Bellamy, Campbell, Robinson et al. (2006) did not report examining potential publication bias. Funnel plots constructed with precision as the ordinate using data from Wang, Chen, Huang, et al. (2004) showed asymmetry for SPID% (p=0.038) and peak PID% (p=.015) although not for ASPID% (p=.56) which as an average measure could be anticipated.* In Bellamy, Campbell, Robinson et al. (2006), Egger tests calculated for pooled VAS pain at rest, 1 to 4 weeks, 5 to 13 weeks, and 14 to 26 weeks yielded p-values of .9, <.001, .017, and .086, respectively.† While other factors could explain these test results (Lau, Ioannidis, Terrin, et al., 2006) those reported in the meta-analyses and those we performed are consistent with publication bias. Small Trial Bias. An apparent small trial bias was noted by Wang, Chen, Huang, et al. (2004) and shown in our sensitivity analyses. The average size of trials reporting sample size calculations was 204 compared to 60 for those without. The effect magnitude in clearly adequately powered trials was 44 percent lower than in those not reporting sample size calculations—consistent with concluding positive underpowered studies were more often published than negative ones. Unpublished Trials. A substantive body of unpublished literature including large trials exists (OAK9801, France 1995, UK 1996, Hizmetli, Kocagil, Kaptanoglu, et al.)—15.5 percent of all participants were included in studies unreported in either manuscript or abstract form; 9.7 percent included in abstracts not subsequently published (Table 4). This size of this body of evidence is consistent with potential publication bias. Hylan G-F 20. The five study-level meta-analysis suggested hylan G-F 20 has greater effects than other hyaluronans. To extend results from the meta-analyses and explore how the potential effect of hylan G-F 20 might differ, we examined pooled trial results further.
Pooling. Eight trials of hylan G-F 20 assessed outcome measures at different time points using different instruments (Cubukcu, Ardic, Karabulut, et al., 2004; Dickson, Hosie, and English, 2001; Karlsson, Sjogren, and Lohmander, 2002; Kotevoglu, Iyibozkurt, Hiz, et al., 2006; Moreland, Arnold, Saway, et al., 1993; Rolf, Engstrom, Ohrvik, et al., 2005; Scale, Wobig, and Wolpert, 1994; Wobig, Dickhut, Maier, et al., 1998). For consistency and to allow
* Funnel plots for pooled functional outcome measures could not be replicated as trial-level data were not provided in the meta-analysis. † Only three studies were pooled at 45 to 52 weeks and a result was not calculated.

58
comparison with other meta-analyses, we adopted the general approach taken by Bellamy, Campbell, Robinson, et al. (2006) pooling weighted mean differences between treatment and placebo arms at follow-up. Data extracted by Bellamy, Campbell, Robinson, et al. (2006) at 5 to 13 weeks post-injection (near the time of maximum anticipated benefit) were used.
Results from two trials could not be included in the pooled result. Follow-up in the Moreland, Arnold, Saway, et al. (1993) trial was limited to four weeks. Rolf, Engstrom, Ohrvik, et al. (2005) did not report a pain outcome measure amenable to pooling with the other trials. Five of the remaining six RCTs reported pain on a VAS scale (Dickson, Hosie, and English, [2001] as part of WOMAC 100-mm VAS). Cubukcu et al. (2006) assessed WOMAC pain on a 20 point scale (which we rescaled to 100 for pooling). From Karlsson, Sjogren, and Lohmander (2002) only the hylan G-F 20 and placebo arms were included. Random-effects models were fitted in all but one instance due to heterogeneity.
Results. Trial quality was rated as either “poor” (n=3) or “fair” (n=3). Intention-to-treat analyses were conducted three trials. Two trials reported no dropouts (Appendix C* Table IC), three between 24 and 29 percent, the dropout rate was not reported in one (Scale, Wobig, and Wolpert, 1994). Five trials were double blinded and one unblinded.
Figure 4 displays the forest plot including six trials for pain at 5 to 13 weeks (WMD: -20.2 mm, 95% CI: -29.5 to -10.9; random effects model, I2 = 82 percent, Egger test p=0.76). Because of the notably larger effect magnitudes of the Scale, Wobig, and Wolpert, (1994) and Wobig, Dickhut, Maier, et al. (1998) trials, results were also pooled separately for the two trials and the remaining four. There was no evidence of heterogeneity in these two subgroups (I2 = 0, and 16 percent respectively) and fixed effects models were fitted. The disparity between these subgroups is substantial. The Scale, Wobig, and Wolpert, (1994) and Wobig, Dickhut, Maier, et al., (1998) were pooled in four of the study-level meta-analyses and both rated of “poor” quality due to baseline imbalances and not accounting for covariate imbalances. These results can be summarized as follows: 1. The pooled effect magnitude from the available hylan G-F 20 RCTs appears larger than for
other hyaluronans. 2. Due to trial quality, drop-out rates, heterogeneity, considerably larger effects in the Wobig,
Dickhut, Maier, et al. (1998) and Scale, Wobig, and Wolpert (1994), and between-trial variability, the pooled effect estimate must be considered accompanied by greater uncertainty than reflected in the confidence interval.
Summary and Appraisal Table 23 displays results from the five study-level analyses for pain reduction compared to placebo nearest 8 to 12 weeks (the time of anticipated maximum effect). Although pooled results across meta-analyses are not directly comparable due to differing effect measures and trials pooled, each found a positive statistically significant overall effect. Pooled results from better quality trials were lower in magnitude (the result of Arrich, Piribauer, Mad, et al. (2005) was based on a single trial). Trials of hylan G-F 20 reported larger effects as did small size trials.
* Appendixes cited in this report are available electronically at http://www.ahrq.gov/clinic/tp/oakneetp.htm

59
Figure 4. Forest plot of hylan G-F 20 studies reporting VAS pain at 5 to 13 weeks—weight-bearing or WOMAC (95% confidence intervals)
Weighted Mean Difference (VAS Pain)-50 -40 -30 -20 -10 0 10
Pooled (Random Effects Model)
Kotevoglu 2005
Cubukcu 2004
Karlsson 2002
Dickson 2001
Wobig 1998
Scale 1994 (3 inj)
Scale 1994 (2 inj)
Kotevoglu 2005, Dickson 2001, Karlsson 2002, Cubucko 2004; Fixed Effects Model
Scale 1994, Wobig 1998;Fixed Effects Model
*
* Pain in Cubukcu et al. (2004), reported on a 20 point scale was rescaled to 100 for these analyses.
Drawing conclusions requires considering the clinical meaning of pooled results, strengths and limitations of the meta-analysis and trial evidence, heterogeneity in pooled results, potential publication bias, and the uncertainty contributed by each. Clinical Meaning. Important effects, regardless of statistical considerations, must be accompanied by a minimal clinically important improvement patients can identify. While the amount of improvement required may not be definitively established (Tubach, Ravaud, Baron et al., 2005; Pham, van der Heijde, Altman, et al., 2004), between 20 and 40 percent improvements have been used in recent hyaluronan trials (Nuestadt, Caldwell, Burnette, et al., 2005, Altman, Akermark, Beaulieu, et al., 2004). In this respect, pooled results from the meta-analyses are limited due to a primary literature not generally reporting results quantifying proportions responding or achieving likely minimal clinically important improvements for the various outcome measures. Few trials reported response rates and an insufficient number from which to draw conclusions or to combine.

Table 23. Summary pain result closest to 8–12 weeks and key characteristics of study-level viscosupplementation meta-analyses
Lo et al., 2003
Wang et al., 2004
Arrich et al., 2005
Modawal et al., 2005
Bellamy et al., 2006
Trials pooled at 8-12 weeks 22 20 5 6 16 Sample size: mean (range)* 134 (24-108) 117 (12-347) 250 (49-408) 181 (80-347) 131 (24-407)
Total patients 2,927 2,345 1,251 1086 2,090 Pooled pain outcome cited†
Hierarchy‡ With/without Activities During or After Exercise During Activity or Rest Weight Bearing
Comparison/Effect Measure
Difference in Change (standardized) (effect size)
Differences (in pain intensity summed) (0-100%)
Difference (at follow-up)
(mm VAS pain)
Difference in Change (unstandardized)
(mm VAS pain change)
Difference (at follow-up)
(mm VAS pain) Overall pooled effect -0.32 7.9% -4.3 mm -18.1 mm change -13.0 mm
95% CI (-0.47 to -0.17) (4.1% to 11.7%) (-7.6 to -0.9) (-29.9 to -6.3) (-18.0 to -7.9) p Value <.001 NR .013 NR <.001
Sensitivity Analyses Trial quality
Good (+ Fair) NR -6.2 mm (-15.9 to 3.5)**
-7.1 mm (-11.3 to 3.0) -8.8 mm (-12.4 to -5.2 )††
Poor NR
Reported NS in meta-regression§
NR NR -23.2 mm (-37.2 to -9.3)†† Trial size
Large NR 3.6% (0.9 to 6.3) NR NR -7.3 mm (-14.6 to -7.7) †† Small NR 6.0% (2.1 to 10.1) NR NR -17.0 mm (-20.8 to -13.2) ††
Molecular weight
G-F 20 NR 23.6% (CI not reported) -33.0 mm ( -50.5 to -
17.5)‡‡ -20.8 mm (-31.3 to -10.4) †† Non G-F 20 -0.19 (-0.27 to -0.10) 5.4% (2.6 to 19.9)
Did not include any G-F 20 trials
-19.2 mm (-30.5 to -7.9) -9.3 mm (-13.4 to -5.1) ††
* If not reported in the meta-analysis, figures calculated from original trial publications using patients randomized (not knees). † While Arrich et al. (2005) and Bellamy et al. (2006) pooled a similar effect measure, the other meta-analyses chose different approaches detailed in the Methods chapter. ‡ Pain reported from one of the following instruments in order of decreasing preference: global knee pain score; knee pain on walking; WOMAC index; Lequesne Index; knee pain during activities other than walking. § Also reported that elements characterizing studies of lower methodologic quality were associated with higher effect estimates. ** Result from a single high quality trial. †† From supplementary EPC analyses; not reported in Bellamy et al. (2006). ‡‡ Calculated from meta-regression model also including study quality and pain with activity or at rest, not presented in publication.
60

Table 23. Summary pain result closest to 8–12 weeks and key characteristics of study-level viscosupplementation meta-analyses (continued)
Lo et al., 2003
Wang et al., 2004
Arrich et al., 2005
Modawal et al., 2005
Bellamy et al., 2006
Heterogeneity I2 NR NR 0% 95% 83%
Other Cochran Q: P<.001 Cochran Q: p<.001* Cochran Q: p<.001 Explored/Explained Yes/Yes† Yes/No NA/NA‡ Yes/Partially§ No/No
Results consistent with publication bias Yes No** No Yes Yes††
(EPC analysis) CI: confidence interval; NA: not applicable; NR: not reported; NS: not significant (p<.05); VAS: Visual Analog Scale.
* For non-G-F 20 trials. † No significant heterogeneity restricting analyses to non G-F 20 trials. ‡ Found high heterogeneity for the 2-6 week result (I2 = 81%) explained by excluding Henderson, Smith, Pegley et al., 1994. § No statistical heterogeneity restricting to good quality studies. ** Result varies for vertical axis used as noted later. †† Egger test on published data p=.017
61

62
Strengths of the Meta-Analyses. Lo, LaValley, McAlindon, et al. (2003) attempted to acquire intention-to-treat data even if not reported, conducted sensitivity analyses supporting their conclusions, and were able to explain between-trial variability by excluding two outlier results. Wang, Chen, Huang, et al., (2004) reported extensive subgroup results and meta-regressions. Arrich, Piribauer, Mad, et al. (2005) examined effects at different time periods and carefully explored between-trial variability. Bellamy, Campbell, Robinson et al. (2006) examined the greatest breadth of literature. Strand, Conaghan, Lohmander, et al. (2006) was able to examine patient-level data. Key Limitations of Meta-Analyses. Lo, LaValley, McAlindon, et al. (2003) reported a pooled standardized mean difference change in pain derived from 5 different types of pain measures (and scales) posing challenges for clinical interpretation—a referent minimal clinically important improvement for the pooled effect is not clear. The pooled effects reported by Wang, Chen, Huang, et al., (2004) reflect cumulative response (McQuay and Moore, 1988) but what constitute minimal clinically important improvement in the metrics is undefined. Arrich, Piribauer, Mad, et al. (2005) excluded some trials included in other meta-analyses (Table 8) stating data “could not be used” without clear explanation. For example, some trials reporting large effects with respect to pain (e.g., Scale, Wobig, and Wolpert, 1994; Wobig, Dickhut, Maier, et al., 1998) were not pooled. Modawal, Ferrer, Choi, et al. (2005) included few studies relative to the body of literature. Justification for excluding studies assessing VAS pain as part of WOMAC was not stated—although WOMAC pain is a composite of pain experienced during times and activities. Bellamy, Campbell, Robinson et al. (2006) did not explore between-trial variability, report sensitivity analyses, or and examine potential publication bias. The meta-analysis includes more than 850 forest plots, yet only 38 pool results from more than 3 trials. Strand, Conaghan, Lohmander, et al. (2006) reported a statistically significant difference but of small magnitude (-0.68 on the 24-point Lequesne Index). There was also inconsistency between mixed effects models reported from Puhl, Bernau, Greiling, et al. (1993) and the France (1995) trial, where the changes reported did not correspond with those in the package insert.* Key Limitations of Primary Literature. Trial quality was the fundamental limitation of the primary literature—noted in four of five study-level meta-analyses. The second key limitation was the lack of reported response rates from intention-to-treat samples. This limits applying results to individual patients.
Heterogeneity among trials results was high for pooled outcome measures in all study-level meta-analyses; use of hylan G-F 20 and trial quality were found to influencing pooled effect magnitude and heterogeneity. Supplementary analyses suggested trial size also to account for some heterogeneity.
Potential Publication bias was consistent with Egger test results in three of the meta-analyses (Lo, LaValley, McAlindon, et al., 2003; Modawal, Ferrer, Choi, et al., 2005; Bellamy, Campbell, Robinson et al., 2006), and in Wang, Chen, Huang, et al., (2004), dependent on the choice of ordinate. Lo, LaValley, McAlindon, et al. (2003) also reported larger effect sizes in unpublished trials. Small trial size was associated with larger effects and less often accompanied by sample size calculations; a substantial number of patients were participants in unpublished trials. This evidence supports the presence of publication bias.
Uncertainty in reported estimates is therefore likely substantially greater than reflected in reported p-values and confidence intervals. Authors’ conclusions from the meta-analyses
* The control group improved by -3.1 points but in meta-analysis mixed-model by -2.6.

63
(Appendix C*, Table IJ) together with the Overview Quality Assessment Questionnaire finding four of the five study-level meta-analyses conclusions incompletely supported by the data and analyses presented highlight this uncertainty. Overall pooled estimates fail to incorporate potential publication bias, trial quality and size, and heterogeneity† apparent in the evidence. Results, Part I: Key Question 3 (Subgroup Analyses)
Four RCTs examined subgroups specified by our protocol including age, sex, primary/secondary OA of the knee, body mass index (BMI)/weight, and disease severity. None examined ethnicity, disease duration, or prior treatment. In one trial a subgroup comparison was preceded by stratified randomization. No other subgroup comparisons were prespecified—results obtained in post-hoc analyses.
Lohmander, Dalen, Englund, et al. (1996) noted the subgroup aged 60 to 75 years with Lequesne Index scores over 10 (worse disease severity) experienced greater reduction in VAS pain compared to placebo (-23 mm versus -7 mm respectively at 13 weeks). However, in a confirmatory trial (Karlsson, Sjogren, and Lohmander, 2002) no benefit was found for that subgroup. This was the only subgroup result tested in a confirmatory study.
In a per-protocol analysis of mean reduction in VAS pain (100-mm scale) Altman and Moskowitz (1998) reported on age, sex, BMI, and disease severity subgroups (Table 24). Randomization was stratified by disease severity. Of note, the overall intention-to-treat result found mean pain reductions at 12 weeks of -23 and -24 mm in hyaluronan and placebo arms respectively (at 26 weeks, -18 mm and -24 mm, respectively). Although statistical testing of subgroup effects was not conducted, the considerable overlap of all subgroup confidence intervals indicates no significant differences by subgroups.‡ Table 24. Results by subgroups from Altman and Moskowitz (1998) Mean Reduction Walking VAS
Pain (mm) Compared to Placebo (and 95% CI; from
figure) Age <65 -12.0 (-20 to -4) >65 -5.5 (-16 to 6) Sex Women -17.0 (-17to 0) Men -16.0 (-22 to -2) BMI < 30.5 -6.0 (-13 to 2) > 30.5 -16.0 (-25 to -7) Disease Severity "Moderate" -6.0 (-12.5 to 1.5) "Severe" -10.5 (-25 to 2.0) KL2 -9.0 (-17 to -1) KL3 -7.0 (-13 to 1)
Dahlberg, Lohmander, Ryd, et al. (1994) reported no beneficial effect of hyaluronan in the presence of previous trauma (secondary disease). Henderson, Smith, Pegley, et al. (1994)
* Appendixes cited in this report are available electronically at http://www.ahrq.gov/clinic/tp/oakneetp.htm † For example, taking into account the potential variability in heterogeneity present in the 5 to 13 week overall VAS pain estimate in Bellamy, Campbell, Robinson et al. (2006) would increase the width of the estimated 95 percent confidence interval from (-17.8 to -8.2) to (-19.8 to -6.2) or 42 percent (see Viechtbauer, 2006 for analytical details). ‡ Recognizing that confidence intervals can overlap as much as 29 percent and still be potentially significant (van Belle, 2002).

64
concluded that “hyaluronan offers no significant benefit over placebo during a five week treatment period…” but also reported effects among those classified as Kellgren-Lawrence grade 2 and grades 3–4—each with separate control groups. At 5 weeks, the VAS pain score in the Kellgren-Lawrence grade 2 hyaluronan arm improved -15.6 mm compared to -14.2 mm for placebo arm; in the Kellgren-Lawrence grade 3-4 hyaluronan arm -8.7 mm, compared to -18.0 mm for placebo. Finally, Petrella, DiSilvestro, and Hildebrand (2002) reported no significant differences within subgroups defined by age, sex, and BMI but estimates were not stated. Comment. There is no evidence of differential effect of intra-articular hyaluronan according to subgroups defined by age, sex, primary/secondary OA of the knee, BMI/weight, or disease severity. However, the subgroup evidence is limited. The single positive subgroup finding subsequently examined in a confirmatory RCT was not substantiated. Results, Part I: Key Question 4 (Comparative Outcomes)
The single study comparing the interventions of interest to this Evidence Report was conducted by Forster and Straw (2003). Forster and Straw (2003) randomized patients to arthroscopic lavage and debridement or intra-articular Hyalgan®. It should be noted that the Forster and Straw trial is the only study meeting selection criteria for this Evidence Report’s Key Question 4, concerning the comparative short-term and long-term outcomes of viscosupplements, glucosamine and chondroitin, or arthroscopic lavage and debridement. The trial by Forster and Straw will be discussed separately, in Results, Part III, Key Question 4.
Conclusions: Part I 1. What are the Clinical Effectiveness and Harms of Intra-Articular Hyaluronic Acid/Hyaluron Preparations Injections in Patients With Primary OA of the Knee?
• Results from 42 trials (N=5,843), all but one synthesized in various combinations in six
meta-analyses, generally show positive effects of viscosupplementation on pain and function scores compared to placebo. However, the evidence on viscosupplementation is accompanied by considerable uncertainty due to variable trial quality, potential publication bias, and unclear clinical significance of the changes reported. – The pooled effects from poor-quality trials were as much as twice those obtained from
higher-quality ones. – There is evidence consistent with potential publication bias. Pooled results from small
trials (<100 patients) showed effects up to twice those of larger trials consistent with selective publication of underpowered positive trials. Among trials of viscosupplementation, those that have not been published in full text comprise approximately 25 percent of the total patient population.
– Interpreting the clinical significance of pooled mean effects from the meta-analyses is difficult; mean changes do not quantify proportions responding. Numbers needed to treat cannot be calculated from mean changes.
• Trials of hylan G-F 20, the highest molecular weight cross-linked product, generally reported
better results than other trials.

65
• Minor adverse events accompanying intra-articular injections are common, but the relative
risk accompanying hyaluronan injections over placebo appears to be small. Pseudoseptic reactions associated with hyaluronans appear relatively uncommon but can be severe.
2. What are the Clinical Effectiveness and Harms of the Interventions of Interest in Patients With Secondary OA of the Knee? • We identified no studies enrolling patients with only secondary disease, or that stratified
randomization by primary and secondary disease. There is insufficient evidence to draw conclusions about treatment outcomes in patients with secondary disease.
3. How do the Short-Term and Long-Term Outcomes of the Interventions of Interest Differ by the Following Subpopulations: Age, Race/Ethnicity, Gender, Primary or Secondary OA, Disease Severity and Duration, Weight (Body Mass Index), and Prior Treatments?
• Four RCTs were identified examining any of the specified subgroups. None examined
race/ethnicity, disease duration, or prior treatment. In one trial, randomization was stratified by disease severity; all other subgroup results were obtained in post-hoc analyses. There was no evidence for differential effects according to subgroups defined by age, sex, primary/disease, BMI/weight, or disease severity. One positive post-hoc subgroup analysis found greater efficacy among older individuals with more severe disease, but was not confirmed in a subsequent trial.
4. How do the Short-Term and Long-Term Outcomes of the Interventions of Interest Compare for the Treatment of: Primary OA of the Knee; and Secondary OA of the Knee? • No trials were identified comparing intra-articular hyaluronan to glucosamine and/or
chondroitin. A single, small, underpowered, poor quality trial found no difference in outcome measures comparing intra-articular hyaluronan to arthroscopy and debridement over a 1-year followup. There is insufficient evidence to draw conclusions regarding comparative efficacy of the interventions.
Part II: Glucosamine/Chondroitin Effectiveness and Harms
We used the results of study-level meta-analyses (MAs) and additional randomized controlled trials (RCTs) that were not included in the MAs to address the Key Questions of this Evidence Report on osteoarthritis (OA) of the knee.

66
Literature Overview This section of the Evidence Report includes six MAs* and five RCTs not included in the MAs.† In this section, we provide a brief descriptive overview of the MAs and identify the additional RCTs. Our systematic review of the literature did not identify any patient-level MAs on these interventions. Summary Description of Meta-Analyses. Six MAs comprising a total of 21 individual RCTs of glucosamine (total N=2,495) and 12 RCTs of chondroitin (total N=548) were published between 2000 and 2006 (Table 25). Four reported on glucosamine administered alone and three evaluated chondroitin administered alone. In one MA, the authors pooled data from primary studies of glucosamine and chondroitin (Richy, Bruyere, Ethgen, et al., 2003). Four of the MAs included RCTs with active controls; the balance utilized placebo controls. Two of the MAs used a pain measure as the primary clinical outcome (Bjordal, Klovning, Ljunggren, et al., 2006; McAlindon, LaValley, Gulin, et al., 2000). The other four MAs examined additional efficacy parameters such as function, radiographic effects on cartilage structure, and adverse events. The individual study composition of the MAs and RCT characteristics are presented in detail in the following section of this Evidence Report. Additional Randomized Trials. Five randomized, double-blind, placebo-controlled trials that were not included in any of the MAs met our study selection criteria (Table 26). Most notable among these is a large (n=1,583) multicenter, five-arm, National Institutes of Health- (NIH-) sponsored study that evaluated the efficacy and safety of orally administered glucosamine, chondroitin, or both together versus an oral placebo or an active control (celecoxib) in patients with OA of the knee (Clegg, Reda, Harris, et al., 2006). Two RCTs compared the clinical efficacy and tolerability of orally administered chondroitin sulfate versus placebo (Michel, Stucki, Frey, et al., 2005; Uebelhart, Malaise, Marcolongo, et al., 2004). One study examined the efficacy of combination treatment with glucosamine and chondroitin versus placebo (Das and Hammad, 2000). These will be considered in detail in the following Results section.
* As the final Evidence Report was in press, we found a new meta-analysis on chondroitin (Bana, Jamard, Verrouil, et al., 2006). Published in a European annual journal, it found modest effects favoring chondroitin on VAS pain and Lequesne Index; however, it excluded many papers and provided very few details on how meta-analysis was performed. In particular, no information was offered on pooling methods, whether heterogeneity was assessed, whether publication bias was assessed, and whether heterogeneity was explored by subgroup/sensitivity analysis or meta-regression. The findings of this poor-quality meta-analysis do not conflict with the other meta-analyses included in this section and do not alter the conclusions of this Evidence Report. † As the final Evidence Report was in press, an additional RCT of chondroitin sulfate was identified (Mazieres, Hucher, Zaim, et al., 2007). For one of two primary outcomes, VAS pain on activity, there was significantly greater change in the chondroitin group (mean -26.2.sd 24.9) compared with the placebo group (mean -19.9, sd 23.5, p=.029). There was no significant difference in the other primary outcome, function on the Lequesne Index (p=.109). Three secondary outcomes significantly favored chondroitin and seven secondary outcomes did not differ between groups. This study does not change the conclusions of this Evidence Report.

67
Table 25. Summary description of meta-analyses of glucosamine and chondroitin in knee osteoarthritis Key
Question(s) Addressed
Included RCT Design
No. of RCTs Included (total pts) Outcomes Reported MA Author,
Year
Industry Funding
of MA 1 2 3 4 DB SB PC AC C G Pain Func Struc AEs Bjordal et al., 2006 NR X X X X X
6 (362)
7 (401) X
Towheed et al., 2006 NR X X X X X NA
20 (2,596) X X X
Poolsup et al., 2005 NR X X X NA
2 (414) X X X X
Richy et al., 2003 NR X X X X
8 (855)
7 (1,203) X X X X
Leeb et al., 2000 NR X X X X X
7 (703) NA X X X
McAlindon et al., 2000 NR X X X X X
9 (799)
6 (1,118) X
No. RCTs Pooled (Total in Literature) 12 21 AC: active-controlled; AEs: adverse events; C: chondroitin; DB: double-blind; G: glucosamine; Func: function; NR: not reported; PC: placebo-controlled; pts: patients; SB: single-blind; Struc: structural; RCT: randomized controlled trial; Table 26. Additional RCTs not included in glucosamine and chondroitin meta-analyses
No. Pts per Study Arm Outcomes Reported Study G C G/C Pl Act
Duration (wks) Pain Func Struc AEs
Herrero-Beaumont et al., 2007 106 104 108 24 X X X
Clegg et al., 2006 317 318 317 313 318 24 X X X Michel et al., 2005 150 150 104 X X X X Uebelhart et al., 2004 54 56 52 X X X X Das and Hammad, 2000 46 47 24 X X X X Act: active; AEs: adverse events; C: chondroitin; G: glucosamine; G/C: glucosamine plus chondroitin; Pl: placebo; Func: function; Struc: structural; wks: weeks
Results, Part II: Key Questions 1 and 2 Detailed Description of the Meta-Analyses. Appendix C*, Table IIA presents a detailed summary of the meta-analyses. Primary literature for each MA was compiled through searches of electronic databases (e.g., MEDLINE®, EMBASE, Cochrane Controlled Trials Register, BIOSIS, HealthSTAR) using prespecified protocols. Searches generally started from the inception of each database, with a cutoff just prior to publication of the MA. Manual searches of meeting abstracts; scrutiny of reference lists of primary articles and other systematic reviews; and hand searches of selected journals were conducted to identify studies that eluded the systematic electronic searches. Meta-Analysis Quality Evaluation. We used a validated method developed by Oxman and Guyatt to assess the quality of the MAs based on nine questions related to aspects of their composition, execution, and analysis. As shown in Table 27, quality scores ranged from 3 to 7. The quality ratings of three MAs appear limited primarily by flaws in the scope and methods of the literature search (Poolsup, Suthisisang, Channark, et al., 2005; Leeb, Schweitzer, Montag, et al., 2000; McAlindon, LaValley, Gulin, et al., 2000). In addition, as described in the Methods section, we performed quality ratings of the primary studies included in the MAs.
* Appendixes cited in this report are available electronically at http://www.ahrq.gov/clinic/tp/oakneetp.htm

68
Meta-Analysis Methodologic Characteristics. As shown in Table 28, all MA authors tested for heterogeneity across studies. Heterogeneity was a factor in interpretation of results from 3 MAs (Towheed, Maxwell, Anastassiades, et al., 2006; Richy, Bruyere, Ethgen, et al., 2003; McAlindon, LaValley, Gulin, et al., 2000). Meta-regression analysis revealed influences of drug type, patient selection criteria, and missing data in two MAs (Bjordal, Klovning, Ljunggren, et al., 2006; Towheed, Maxwell, Anastassiades, et al., 2006). Sensitivity analyses performed by four groups examined the impact of factors such as allocation concealment and trial heterogeneity on results (Bjordal, Klovning, Ljunggren, et al., 2006; Towheed, Maxwell, Anastassiades, et al., 2006; Richy, Bruyere, Ethgen, et al., 2003; McAlindon, LaValley, Gulin, et al., 2000). Publication bias possibly influenced the results of three MAs (Richy, Bruyere, Ethgen, et al., 2003; Leeb, Schweitzer, Montag, et al., 2000; McAlindon, LaValley, Gulin, et al., 2000). Primary Study Composition of Meta-Analyses. Glucosamine. Table 29 shows the primary RCTs that composed the glucosamine MAs. The number of trials included in each MA ranged from two to 20. Some MAs overlap, but no two contain the same body of evidence. No single primary study was represented in all five of the MAs. Nineteen of 21 references were full articles and two were abstracts (Houpt, McMillan, Paget-Dellio, et al., 1998; Rovati, 1997). One MA included primary studies that used a reference control, pooling them with studies that used placebo controls (Towheed, Maxwell, Anastassiades, et al., 2006). Glucosamine was administered orally in 17 RCTs and parenterally in four. Two MAs combined data from studies in which glucosamine was administered parenterally with those in which it was given orally (Towheed, Maxwell, Anastassiades, et al., 2006; McAlindon, LaValley, Gulin, et al., 2000). Seventeen studies reported at least 80 percent of patients had knee OA. Four RCTs did not specify the knee as the primary affected joint (Zenk, Helmer, Kuskowski, et al., 2002; D’Ambrosio et al. 1981; Crolle and D’Este, 1980; Drovanti, Bignamini, and Rovati, 1980). To assess the MAs as a means to address the Key Questions of this Evidence Report, we applied study selection criteria outlined in the Methods chapter to the primary studies in each MA. Two MAs contained RCTs that do not match the criteria specified in our Evidence Report (Towheed, Maxwell, Anastassiades, et al., 2006; McAlindon, LaValley, Gulin, et al., 2000). Ten of 20 RCTs included by the MA by Towheed and colleagues (2006) are not relevant to the aims of this Report, as will be outlined in the Results section for each MA. However, Towheed, Maxwell, Anastassiades, et al. (2006) includes all 10 trials that we have determined are applicable to our Report, whereas Bjordal, Klovning, Ljunggren, et al. (2006) and Richy, Bruyere, Ethgen, et al. (2003) excluded 3 of the 10.

Table 27. Oxman and Guyatt method quality evaluation of glucosamine and chondroitin meta-analyses Evaluation Criteria Bjordal et al., 2006 Towheed et al.,
2006 Poolsup et al.,
2005 Richy et al., 2003 Leeb et al., 2000 McAlindon et
al., 2000 Were the search methods used to find evidence (primary research) on the primary question(s) stated?
Y - clearly stated Y - clearly stated Y - clearly stated Y - clearly stated Y - clearly stated Y - clearly stated
Was the search for evidence reasonably comprehensive?
Y - clearly stated, comprehensive, but
language restricted to English, German,
Scandinavian
Y - clearly stated, comprehensive, no
language restrictions
N - did not specify language
restrictions, did not seek
unpublished data
Y - clearly stated, comprehensive, no
language restrictions
P - search strategy not specified, language
restrictions unclear, scope
unclear
P - electronic search did not
include EMBASE but did include
Cochrane database
Were the criteria used for deciding which studies to include in the overview reported?
Y - clearly stated Y - clearly stated Y - clearly stated Y - clearly stated Y - clearly stated Y - clearly stated
Was bias in the selection of studies avoided?
Y - comprehensive search, published and
unpublished data sought
Y - comprehensive search, published and unpublished
data sought
N - Unpublished data not sought or
included, language
restrictions not specified
Y - comprehensive search, published and unpublished
data sought
N - Unpublished data not sought or
included, language
restrictions not specified
P - electronic search did not
include EMBASE
Were the criteria used for assessing the validity of the included studies reported?
Y - numerical score provided according to
Jadad et al.
Y - quality scores provided according
to Gotzsche and Jadad et al.
Y - numerical score provided
according to Jadad et al.
Y - numerical score provided according
to Jadad et al.
Y – unclear, no method cited
Y - clearly stated
Was the validity of all studies referred to in the text assessed using appropriate criteria (either in selecting studies for inclusion or in analyzing the studies that are cited)?
Y - validated methods clearly stated
Y - validated methods clearly
stated
Y - validated methods clearly
stated
Y - clearly stated in tables
Y – clearly stated in tables
Y - validated methods clearly
stated
69

Table 27. Oxman and Guyatt method quality evaluation of glucosamine and chondroitin meta-analyses (continued) Evaluation Criteria Bjordal et al., 2006 Towheed et al.,
2006 Poolsup et
al., 2005 Richy et al., 2003 Leeb et al., 2000 McAlindon et al.,
2000 Were the methods used to combine the findings of the relevant studies (used to reach a conclusion) reported?
Y - clearly stated Y - handling of dichotomous and
continuous outcomes clearly
stated
Y - clearly stated
Y - handling of dichotomous and
continuous outcomes clearly stated
Y – clearly stated Y - clearly stated
Were the findings of the relevant studies combined appropriately relative to the primary question the overview addresses?
Y - clearly stated Y - clearly stated Y - only used 2 studies
because of very strict inclusion criteria
P - combined data from studies of both
compounds based on the absence of efficacy differences, also mixed
in some data from hip pts
Y - clearly stated Y - clearly stated
Were the conclusions made by the author(s) supported by the data and/or analysis reported in the overview?
Y - analysis within parameters was
adequate, but went further in putting
results into a "clinical" context for pain
perception
Y - thorough analyses broken
down according to outcomes scored
and adverse events
Y - but limited number of
studies reduces the impact of the
MA
P - combined data from studies of both
compounds based on the absence of efficacy differences, yet stated they were individually
efficacious
Y - authors stated MA only "suggests that CS may be useful in
OA".
P - combined enteral and parenteral
administration data, made reference to "safety" even
though adverse events weren't
compiled or analyzed
How would you rate the scientific quality of the overview?*
7 7 3 5 3 4
Y: Yes; P: Partially or can't tell; N: No * 1&2: extensive flaws; 3&4: major flaws; 5&6: minor flaws; 7 minimal flaws
70

Table 28. Methodologic characteristics of glucosamine and chondroitin meta-analyses Study Bjordal et al., 2006 Towheed et al., 2006 Poolsup et al., 2005 Richy et al., 2003 Leeb et al.,
2000 McAlindon et al.,
2000 Heterogeneity Assessed Yes Yes Yes Yes Yes Yes Test used Cochran Q Chi-square Cochran Q Cochran Q 95% CIs of
Glass scores p value reported, but test used not stated
Result Outcome measures during first 4 weeks of treatment were not heterogeneous GS Q = 1.3 CS Q = 1.8 (p>.05 for either) I2 = 0 for both comparisons (due to critically low Q)
For GS or GH vs. placebo: reduction in pain and LI scores were heterogeneous Pain: I2 = 88.5% LI: I2 = 89.4%
Disease progression: Q=0.35 (p>.1) Pain: Q=0.003 (p>.1) WOMAC function: Q=0.0009 (p>.1) I2 = 0 for all comparisons (due to critically low Q)
Outcome measures including JSN (p=.95), LI (p=.68), WOMAC (p=.83), mobility (p=.73) showed no heterogeneity VAS pain likely heterogeneous as RE model was used to combine data (p value not provided)
NR Heterogeneity (p<.001) among chondroitin trials but attributable to a single study (Rovetta 1991)
Meta-Regression Conducted Yes Yes NR NR NR NR Factors explored
Drug types within the same class Patient selection criteria Missing data in ITT analyses
Pain and function in studies that used Rotta Research Laboratorium preparation of glucosamine versus those that used non-Rotta preparation(s)
NR NR NR NR
71

Table 28. Methodologic characteristics of glucosamine and chondroitin meta-analyses (continued) Study Bjordal et al., 2006 Towheed et al., 2006 Poolsup et al.,
2005 Richy et al., 2003 Leeb et al.
(2000) McAlindon et al.
(2000) Sensitivity analysis**
Yes – planned using same subgroups if Q values indicated heterogeneity was present, not necessary for GH/Gs or CS
Yes - Pain, function, radiologic measures in studies with adequate allocation concealment
NR Yes NR Yes for trial size, quality
Funnel plot/publication bias
NR NR NR Funnel Plot (asymmetric) Egger Test
(p=.08)
Yes Non-central t-distribution revealed a relative error of about 30%
Funnel plot (asymmetric, p<.01)
Included studies and compounds assessed
CS = 6 single- or double-blind placebo-controlled RCTs GS = 7 single- or double-blind placebo-controlled RCTs
20 double-blind RCTs, GS/GH
2 double-blind placebo-controlled RCTs of GS
15 double-blind placebo-controlled RCTs of GS and CS
7 double-blind placebo-controlled RCTs of CS
CS=6 double-blind placebo-controlled RCTs GS/GH = 9 double-blind placebo-controlled RCTs
Industry sponsored
5 of 6 CS trials industry funded
15/20 connected to Rotta to some degree
NR in meta-analysis, but both studies were funded by Rotta
NR in meta-analysis
NR in meta-analysis
13/15 trials had some connection with a product manufacturer
CS: chondroitin sulfate; GS: glucosamine sulfate; GH: glucosamine hydrochloride; ITT: intent to treat; NR: not reported; RCT: randomized controlled trial * If study subgroups examined eliminating those likely to influence or bias results
72

Table 29. Primary randomized trials included in glucosamine meta-analyses Route of
AdministrationType of Control
Used Publication
Type Meta-Analysis*
(Year) Primary Study
Study Design O P Pl Act
>80% Knees Art Abs
Bjordal (2006)
Towheed (2006)
Poolsup (2005)
Richy (2003)
McAlindon 2000)
Cibere et al., 2004 DB X X X X X McAlindon et al., 2004 DB X X X X X X Usha and Naidu, 2004 DB X X X X X X Hughes and Carr, 2002 DB X X X X X X X
Pavelka et al., 2002 DB X X X X X X X Zenk et al., 2002 DB X X NR X X Reginster et al., 2001 DB X X X X X X X Rindone et al., 2000 DB X X X X X X X Houpt et al., 1999 DB X X X X X X Houpt et al., 1998 DB X X X X X Qiu et al., 1998 DB X X X X X Rovati, 1997 DB X X X X X X X Muller-Fassbender et al., 1994 DB X X X X X
Noack et al., 1994 DB X X X X X X X X Reichelt et al., 1994 DB X
(IM) X X X X X
Lopes Vaz, 1982 DB X X X X X D'Ambrosio et al., 1981 DB X
(IV/IM) X NR X X
Vajaradul, 1981 DB X (IA) X X X X X
Crolle and D'Este, 1980 DB X
(IM/IA) X NR X X
Drovanti et al., 1980 DB X X NR X X Pujalte et al., 1980 DB X X X X X X X X No. RCTs Pooled (Total 21 in Literature) 7 20 2 7 6 Abs: abstract; Act: active; Art: article; DB: double-blind; IA: intra-articular; IM: intramuscular; IV: intravenous; NR: not reported; O: oral; P: parenteral; Pl: placebo; * Bold face type and shading indicates study that meets Evidence Report selection criteria (see Methods section)
73

74
The MA by Poolsup, Suthisisang, Channark, et al. (2005) examined the effect of glucosamine on structural progression of OA of the knee. Only two RCTs report such data (Pavelka, Gatterova, Olejarova, et al., 2002; Reginster, Deroisy, Rovati, et al., 2001). The earliest MA includes only 3 RCTs that meet our selection criteria, but publication chronology may be the key factor in that situation (McAlindon, LaValley, Gulin, et al., 2000). The primary literature on glucosamine comprising the other three MAs is consistent with our selection criteria (Bjordal, Klovning, Ljunggren, et al., 2006; Poolsup, Suthisisang, Channark, et al., 2005; Richy, Bruyere, Ethgen, et al., 2003). Chondroitin. Table 30 shows primary RCTs used in the MAs of chondroitin. The number of trials included in each MA ranged from six to nine. While there is overlap between the chondroitin MAs, the body of studies that composed each differs. Four RCTs were common to all of the MAs (Uebelhart, Thonar, Delmas, et al., 1998; Bucsi and Poor, 1998; Bourgeois, Table 30. Primary randomized trials included in chondroitin meta-analyses
Route of Administration
Type of Control
Used Publication
Type Meta-Analysis*
(Year) Primary Study
Study
Design O P Pl Act >80% Knees Art Abs
Bjordal (2006)
Richy (2003)
Leeb (2000)
McAlindon (2000)
Mazieres et al., 2001
DB X X X X X X
Bourgeois et al., 1998
DB X X X X X X X X
Bucsi and Poor, 1998
DB X X X X X X X X
Conrozier, 1998 DB X X X X X X
Pavelka et al., 1998 DB X X X X X X
Uebelhart et al., 1998
DB X X X X X X X X
Morreale et al., 1996
DB X X X X X X
Conrozier and Vignon, 1992
DB X X X X
L'Hirondel, 1992 DB X X X X X X X
Mazieres et al., 1992
DB X X X X X X X
Rovetta, 1991 DB X
(IM) X X X X
Kerzberg et al., 1987
DB/CO X (IM) X X X X
No. RCTs Pooled (Total 12 in Literature) 6 8 7 9 Abs: abstract; Act: active; Art: article; DB: double-blind; CO: crossover; IM: intramuscular; O: oral; P: parenteral; Pl: placebo; * Bold face type and shading indicates study that meets Evidence Report selection criteria (see Methods section)

75
Chales, Dehais, et al., 1998; Mazieres, Loyau, Menkes, et al., 1992). Eleven of 12 primary studies were full articles; one was an abstract (Pavelka, Bucsi, Manopulo, et al., 1998). Three MAs included RCTs that used reference controls (Bjordal, Klovning, Ljunggren, et al., 2006; Leeb, Schweitzer, Montag, et al., 2000; McAlindon, LaValley, Gulin, et al., 2000). Chondroitin was administered orally in ten trials and parenterally in two. One MA pooled data from RCTs that used either route (McAlindon, LaValley, Gulin, et al., 2000). Ten studies included only patients with OA of the knee. Two included patients with OA of the knee and of the hip (Conrozier and Vignon, 1992; Mazieres, Loyau, Menkes, et al., 1992). The latter 2 RCTs were pooled with OA of the knee patient data in one MA (Leeb, Schweitzer, Montag, et al., 2000). Our study selection criteria excluded primary studies from each of the four MAs. This is particularly evident with one MA of nine primary studies, five of which would be allowed by our criteria (McAlindon, LaValley, Gulin, et al., 2000). Outcomes Measured in Randomized Trials That Meet Protocol Selection Criteria. A number of health outcomes reported in primary RCTs provide relevant information to address Key Questions 1 and 2. To facilitate this presentation, where appropriate we have included the studies from the MAs with the additional studies in the summary tables. Glucosamine. As shown in Table 31, seven of 12 glucosamine studies used a component of the Western Ontario and McMaster (WOMAC) pain, function, stiffness, or total index. Four primary RCTs reported pain intensity measured using a visual analog scale (VAS). Lequesne Index was reported in four studies. Walking time was not used as a scoring criterion in any of the glucosamine RCTs. Chondroitin. As shown in Table 32, health outcomes for patients treated with chondroitin were scored using the same measures as used for glucosamine trials. Lequesne Index or a VAS for pain was used in six of nine RCTs. The WOMAC index or a global assessment was scored in two studies. Walking time was reported in two RCTs. Two of the RCTs shown were not included in the MAs (Michel, Stucki, Frey, et al., 2005; Uebelhart, Malaise, Marcolongo, et al., 2004). Glucosamine Plus Chondroitin. Neither RCT shown in Table 33 was included in the MAs. In the most recent RCT (GAIT; Clegg, Reda, Harris, et al., 2006), the investigators used the WOMAC scale to score clinical response to therapy. However, the primary outcome measure was reported as a threshold, a positive response being defined as a 20 percent decrease in the summed score for the WOMAC pain subscale at 24 weeks of therapy. Key secondary outcomes reported in GAIT were the OMERACT-OARSI response rate and the proportion of patients who achieved a 50 percent decrease in the WOMAC pain score. The second RCT utilized the total WOMAC scale as the primary outcome, scoring as respondents subjects who demonstrated a 25 percent decrease in that parameter. Both studies also scored other outcomes, as shown in Table 33. Baseline Characteristics of Randomized Trials That Meet Protocol Selection Criteria. Glucosamine. As shown in Table 34, all of the glucosamine RCTs considered in this report were double-blinded. Glucosamine was administered at 1,500 mg/day as the sulfate salt in eight trials. The same dose of the hydrochloride salt was used in only one study (Houpt, McMillan, Wein, et al., 1999). The formulation was unclear in two studies that used a dose of 1500 mg/day (Usha and Naidu, 2004; Rindone, Hiller, Collacott, et al., 2000).

76
Table 31. Clinical outcomes in RCTs of glucosamine that meet protocol selection criteria
VAS Pain WOMAC Global
Assessment Study Motion Rest Overall Pain Function Stiffness Total Phys Pat LI
Walking Time
Studies Included in Meta-Analyses McAlindon et al, 2004 X X X X
Usha and Naidu, 2004 X X
Hughes and Carr, 2002 X X X X X X
Pavelka et al., 2002 X X X X
Reginster et al., 2001 X X X X
Rindone et al., 2000 X X
Houpt et al., 1999 X X X X
Rovati, 1997 X Noack et al., 1994 X
Pujalte et al. 1980 X X
Additional Studies not Included in Meta-Analyses Herrero-Beaumont et al., 2007
X X X X X X
Clegg et al. , 2006 X X X X X X
LI: Lequesne Index; VAS: visual analog scale; WOMAC: Western Ontario and McMaster index;
Table 32. Clinical outcomes in RCTs of chondroitin that meet protocol selection criteria
VAS Pain WOMAC Global
Assessment Study Motion Rest Overall Pain Function Stiffness Total Phys Pt LI
Walking Time
Studies Included in Meta-Analyses Mazieres et al., 2001 X X X X X
Bourgeois et al., 1998 X X
Bucsi and Poor, 1998 X X X
Conrozier, 1998 X Uebelhart et al., 1998 X
L’Hirondel, 1992 X X Additional Studies not Included in Meta-Analyses
Clegg et al. (2006) X X X X X X
Michel et al. (2005) X X X X
Uebelhart et al. (2004) X X X
LI: Lequesne Index; pt: patient; VAS: visual analog scale; WOMAC: Western Ontario and McMaster index;

77
Table 33. Clinical outcomes in RCTs of glucosamine plus chondroitin that meet protocol selection criteria
VAS Pain WOMAC Global
Assessment Study Motion Rest Overall Pain Function Stiffness Total Phys Pt LI
Walking Time
Clegg et al., 2006 X X X X X X
Das and Hammad, 2000 X X X
LI: Lequesne Index; pt: patient; VAS: visual analog scale; WOMAC: Western Ontario and McMaster index;

Table 34. Baseline characteristics of randomized trials of glucosamine that meet protocol selection criteria*
Study
Dose (Type)
N Tx/Pl
Mn Age Tx/Pl (yrs)
Female Pts (%) Tx/Pl
BMI (kg/m2) Tx/Pl
OA Diag†
OA Stage (%Tx/ %Pl)
Mn Dis Duration
Tx/Pl (yrs)
Mn VAS Movement (mm) Tx/Pl
Mn VAS Rest (mm) Tx/Pl
Mn WOMAC
Pain Tx/P
Mn WOMAC Function
Tx/Pl
Mn WOMAC Stiffness
Tx/Pl
Mn WOMAC
Total Tx/Pl
Studies Included in Meta-Analyses McAlindon et al., 2004
1,500 mg/day
(GS)
101/104 Rng <54-95 /
<54-84
57/71 p=.04
31.0 ± 7.6/34.1 ± 9.0 p=.01
? NR NR Likert 8.8/9.1
Likert 4.2/4.1
Likert 30.2/ 31.6
Likert 43.2/ 44.8
Usha and Naidu, 2004
1,500 mg/day (inferred
GS)
30/28 52/50 60/57 26.6/25.4 (calculated)
? K-L 1-3
most
3.2/2.9 58/NR
Hughes and Carr , 2002
1,500 mg/day
(GS)
40/40
All: 62
All: 68 NR ?
K-L 1 (all,
9) 2 (all 31)
3 (all 37)
4 (all 23)
All: 7.6 All: 60.7 All: 35.0
Likert All: 9.2
Likert All: 32.9
Likert All: 4.4
Pavelka et al., 2002
1,500 mg/day
(GS)
101/101
61/64 79/76 25.7 ± 2.1/25.7 ± 1.8
1° K-L 2
(54/53) 3
(46/47)
10.1/11.0 Likert 6.6/6.3
Likert 21.8/ 22.0
Likert 2.2/2.2
Likert 30.7/ 30.5
Reginster et al., 2001
1,500 mg/day
(GS)
106/106 66/66 75/78 27.3 ± 2.6/27.4 ± 2.7
1° K-L 2
(71/70) 3
(29/30)
8.0/7.6 194.1/ 172.2
740.1/670.8 96.0/ 96.7
1030/ 940
78

Table 34. Baseline characteristics of randomized trials of glucosamine that meet protocol selection criteria* (continued)
Study
Dose (Type)
N Tx/Pl
Mn Age Tx/Pl (yrs)
Female Pts (%) Tx/Pl
BMI (kg/m2) Tx/Pl
OA Diag†
OA Stage (%Tx/ %Pl)
Mn Dis Duration
Tx/Pl (yrs)
Mn VAS Movement (mm) Tx/Pl
Mn VAS Rest (mm) Tx/Pl
Mn WOMAC
Pain Tx/Pl
Mn WOMAC Function
Tx/Pl
Mn WOMAC Stiffness
Tx/Pl
Mn WOMAC
Total Tx/Pl
Studies Included in Meta-Analyses (continued) Rindone et al., 2000
1,500 mg/day
(unclear)
49/49
63/64 4/6 NR ? K-L 1 (40/30) K-L 2
(18/19) K-L 3
(35/35) K-L 4 (7/16)
12/14 (0-10) 6.4/6.4
(0-10) 3.9/3.6
Houpt et al., 1999
1,500 mg/day (GH)
58/60
64/65
64/60 NR 1° NR 8.3/8.3 Likert 8.8/8.4
Likert 33.4/ 30.1
Likert 4.1/4.0
Likert 46.4/ 42.4
Rovati (1997)
1,500 mg/day
(GS)
NR NR NR NR ? NR NR NR (used LI)‡
NR NR NR NR NR
Noack et al., 1994
1,500 mg/day
(GS)
126/126
55/55 59/62 26.6/26.2 (calculated)
1° NR All: rng <6 mo to
>10 yr
Pujalte et al., 1980
1,500 mg/day
(GS)
10/10 59/65 80/90 NR ? NR NR
Additional Studies not Included in Meta-Analyses Herrero-Beaumont et al., 2007 [GUIDE]
1,500 mg/day
(GS)
106/108/104 GS: 63.4 ± 6.9 Acet: 63.8 ± 6.9 Pl: 64.5 ± 7.2
91/93/89 GS: 27.7 ± 2.3 Acet: 27.9 ± 2.3 Pl: 27.6 ± 2.4
1o K-L 2: 50/56/50 K-L 3: 41/31/39 K-L 2/3: 9/12/11
GS: 7.4 ± 6.0 Acet: 6.5 ± 5.3 Pl: 7.2 ± 5.8
GS: 7.8 ± 3.0 Acet: 8.0 ± 2.9 Pl: 7.9 ± 3.0
GS: 27.8 ± 11.4 Acet: 29.4 ± 11.0 Pl: 27.2 ± 10.9
GS: 38.3 ± 15.2 Acet: 40.4 ± 14.8 Pl: 37.9 ± 14.3
* All values are mean ± SD unless otherwise noted; † ACR criteria; ‡ Outcomes are generally those that are denoted in the paper as being the primary study outcomes; Acet: acetaminophen; ACR: American College of Rheumatology; BMI: body-mass index; Dis: disease; GS: glucosamine sulfate; GH: glucosamine hydrochloride; K-L: Kellgren-Lawrence criteria; LI: Lequesne Index; mn: mean; NR: not reported; Pl: placebo; rng: range; Tx: treatment; VAS: visual analog scale; WOMAC: Western Ontario and McMaster Universities Osteoarthritis Index;
79

80
The mean age of patients ranged between 50 and 66 years, with females comprising 4–90 percent of the study samples. In nine of 11 trials, females made up 60 percent or more of the enrolled patients. Five RCTs of glucosamine reported on patients with primary OA according to ACR criteria. None of the glucosamine studies reported patients specifically with secondary OA. Six reports did not specify whether patients had primary or secondary OA. The mean duration of OA of the knee ranged from 6 months or less to more than 10 years. Most patients in the RCTs had Kellgren-Lawrence grade 2–3 OA of the knee. One study included subjects who had Kellgren-Lawrence grade 4 disease (Hughes and Carr, 2002). No significant differences were reported between the composition of the treatment and placebo groups or their baseline characteristics, with the exception of a slight variation in sex distribution and BMI reported in one study (McAlindon, Formica, LaValley, et al., 2004). Chondroitin. All of the chondroitin studies considered in this report used a double-blind design. Table 35 shows that in single-agent RCTs, chondroitin was given as the sulfate salt at doses that varied from 200 mg daily to 1,200 mg/day. The mean age of patients ranged between 57 and 67 years, with females comprising 33–84 percent of the study samples. Females made up 60 percent or more of enrolled patients in 4 of 8 trials. Four RCTs of chondroitin reported on patients with primary OA according to ACR criteria. None of the studies reported patients specifically with secondary OA. In contrast, two included a mix of primary and secondary disease (Bucsi and Poor, 1998; Uebelhart, Thonar, Delmas, et al., 1998). Two reports did not specify whether patients had primary or secondary OA (Conrozier, 1998; L’Hirondel, 1992). The mean duration of OA of the knee ranged from 4 years to more than 10 years. Most patients in the RCTs had Kellgren-Lawrence grade 2–3 knee OA. Glucosamine Plus Chondroitin. As shown in Table 36, in two RCTs, glucosamine was given as the hydrochloride salt in combination with chondroitin (Clegg, Reda, Harris, et al., 2006; Das and Hammad, 2000). One trial included patients with primary OA of the knee (Clegg, Reda, Harris, et al., 2006). The other RCT included a mix of primary and secondary disease (Das and Hammad, 2000). One trial included subjects who had Kellgren-Lawrence grade 4 disease. Other characteristics of these RCTs are comparable to those of the other trials that meet our selection criteria. Quality of Randomized Trials That Meet Protocol Selection Criteria. The study quality of primary RCTs that met our protocol selection criteria was evaluated using a grading tool described in the Methods chapter of this Evidence Report. Glucosamine. Table 37 shows that four glucosamine trials were judged as “good” quality, four were “fair,” and four were rated “poor.” The quality of one was not evaluable due to missing information (Rovati, 1997). Poor quality ratings were ascribed to a lack of allocation concealment and failure to use ITT analysis. The combination therapy trials that were not part of the MAs are included in this Table (Clegg, Reda, Harris, et al., 2006; Das and Hammad, 2000).

Table 35. Baseline characteristics of randomized trials of chondroitin treatment that meet protocol selection criteria*
Study Dose (Type) N Tx/Pl
Mn Age Tx/Pl (yrs)
Female Pts (%) Tx/Pl
BMI (kg/m2) Tx/Pl OA
Diag†
OA Stage (%Tx/ %Pl)
Mn Dis Duration Tx/Pl (yrs)
Mn VAS Move-ment (mm) Tx/Pl
Mn VAS Rest (mm) Tx/Pl
Mn WOMAC Pain Tx/P
Mn WOMAC Function Tx/Pl
Mn WOMAC Stiffness Tx/Pl
Mn WOMAC Total Tx/Pl
Mn LI Tx/Pl
Studies Included in Meta-Analyses Mazieres et al., 2001
1,000 mg/day (CS)
63/67 67/67 71/78 29.2 ± 5.1/28.9 ± 4.8
1o K-L 2 (59/54) 3 (41/46)
NR 54.4/ 53.0
29.9/ 27.7
8.8/8.9
Bourgeois et al., 1998
Daily 1,200 mg/day (CS 4&6) 3X daily 400 mg/day (CS 4&6)
Daily/3X daily//Pl 40/43/44
63/63/64 65/79/84 NR 1o ACR All: 1-3 (100)
By L,R 6,5/4,5/ 6,6
58/54/56 11/10/10
Bucsi and Poor, 1998
800 mg/day (CS)
39/46 61/59 56/63 29.2/29.1 (estimated)
1o/2o K-L All: 1-3 (100)
NR 56/56 R,L 12.8, 12.0/ 11.8, 11.5
Conrozier, 1998
800 mg/day (CS 4&6)
All: 104 NR NR ? NR NR ~9.0/ ~9.1
81

Table 35. Baseline characteristics of randomized trials of chondroitin treatment that meet protocol selection criteria* (continued)
Study Dose (Type)
N Tx/Pl
Mn Age Tx/Pl (yrs)
Female Pts (%) Tx/Pl
BMI (kg/m2) Tx/Pl OA
Diag†
OA Stage (%Tx/ %Pl)
Mn Dis Duration Tx/Pl (yrs)
Mn VAS Move-ment (mm) Tx/Pl
Mn VAS Rest (mm) Tx/Pl
Mn WOMAC Pain Tx/Pl
Mn WOMAC Function Tx/Pl
Mn WOMAC Stiffness Tx/Pl
Mn WOMAC Total Tx/Pl
Mn LI Tx/Pl
Studies Included in Meta-Analyses (continued) Uebelhart et al., 1998
800 mg/day (CS 4&6)
23/23 60/57 48/56 25.5/27.2 (estimated)
1o/2o K-L 1 (44/48) 2 (48/44) 3 (9/9)
NR 56/64
L’Hirondel, 1992
1200 mg/day (CS)
63/62 All: 63 32.6 NR ? NR NR (0-5) 4.03/3.90
10.73/11.02
Additional Studies not Included in Meta-Analyses Michel et al., 2005
800 mg/day (CS 4&6)
150/150
62/63 51/52 27.7 ± 5.2/28.1 ± 5.5
1o K-L All: 1-3 (100)
NR (0-10) 2.5/2.7
(0-10) 2.1/2.5
(0-10) 3.0/3.5
(0-10) 2.3/2.6
Uebelhart et al., 2004
800 mg/day (CS 4&6)
54/56 63/64 80/82 NR 1o K-L 1 (7/6) 2 (32/33) 3 (15/17)
4.2/4.4 58.8/61.1 9.0/9.1
*All values are mean ± SD unless otherwise noted; †ACR criteria; ACR: American College of Rheumatology; BMI: body-mass index; CS: chondroitin sulfate; Dis: disease; K-L: Kellgren-Lawrence criteria; LI: Lequesne Index; mn: mean; NR: not reported; Pl: placebo; rng: range; Tx: treatment; VAS: visual analog scale; WOMAC: Western Ontario and McMaster Universities Osteoarthritis Index;
82

Table 36. Baseline characteristics of randomized trials of glucosamine plus chondroitin treatment that meet protocol selection criteria*
Study Dose (Type) N Tx/Pl
Mn Age Tx/Pl (yrs)
Female Pts (%) Tx/Pl
BMI (kg/m2) Tx/Pl OA
Diag†
OA Stage (%Tx/ %Pl)
Mn Dis Duration Tx/Pl (yrs)
Mn VAS Move-ment (mm) Tx/Pl
Mn VAS Rest (mm) Tx/Pl
Mn WOMAC Pain Tx/Pl
Mn WOMAC Function Tx/Pl
Mn WOMAC Stiffness Tx/Pl
Mn WOMAC Total Tx/Pl
Mn LI Tx/Pl
Clegg et al., 2006 [GAIT]
1,200 mg/day (CS)
318/313 58/58 64/64 32.0 ± 7.6/31.9 ± 7.3
1o K-L 2 (59/57)
9.7/9.5 (0-500) 235.3/ 237.1
(0-1700) 778.9/ 765.8
(0-200) 106.6/ 106.6
(0-300) 146.0/ 145.8
Das and Hammad, 2000
1,600 mg/day
(CS)
46/47 64/66 72/78 30.5 ± 1.0/30.2 ± 0.9 (SEM)
1o/2o K-L 2/3 (72/83) K-L 4 (28/17)
5.6/7.4 (0-2,400) K-L 2/3: 908/944 K-L 4: 1,187/1,089
K-L 2/3: 10.2/10.4 K-L 4: 11.1/10.7
* All values are mean ± SD unless otherwise noted; † ACR criteria;
ACR: American College of Rheumatology; BMI: body-mass index; CS: chondroitin sulfate; Dis: disease; K-L: Kellgren-Lawrence criteria; LI: Lequesne Index; mn: mean; NR: not reported; Pl: placebo; rng: range; SEM: standard error of the mean; Tx: treatment; VAS: visual analog scale; WOMAC: Western Ontario and McMaster Universities Osteoarthritis Index;
83

84
Table 37. Quality ratings of randomized trials of glucosamine that meet protocol selection criteria
Study
Initial Assembly
of Comparable Groups
Low Loss to Followup,
Maintenance of Comparable
Groups
Measurements Reliable, Valid,
Equal
Interventions Comparable/
Clearly Defined
Appropriate Analysis of
Results Overall Rating
Studies Included in Meta-Analyses
McAlindon et al., 2004 N* Y Y Y Y Fair
Usha and Naidu,, 2004 N† N Y Y Y Poor
Hughes and Carr, 2002 Y Y Y Y Y Good
Pavelka et al., 2002 Y N Y Y Y Fair
Reginster et al., 2001 Y N Y Y Y Fair
Rindone et al., 2000 Y Y Y Y N‡ Poor
Houpt et al., 1999 Y§ Y Y Y Y Good
Rovati et al., 1997 NR** NR NR NR NR ?
Noack et al., 1994 ? Y N Y N†† Poor
Pujalte et al., 1980 N‡ N N Y N Poor
Additional Studies not Included in Meta-Analyses
Herrero-Beaumont et al., 2007 Y N Y Y Y Fair
Clegg et al., 2006 Y Y Y Y Y Good
Das and Hammad, 2000§§ Y Y Y Y Y Good * Did not report allocation concealment specifically, but Internet-based protocol should have sufficed; statistically significant (p<.05) differences in sex (71% female in placebo group versus 57% in glucosamine group); NSAID use (87% versus 74% in placebo versus glucosamine group); BMI (34.1 versus 31.0 in placebo versus glucosamine group) † Group characteristics not reported extensively, in particular OA grade; no mention of allocation concealment, although ITT analysis was specified ‡ No ITT analysis or description of allocation concealment; specifically analyzed data on completers only § Patients recruited to study via newspaper advertisement, self-reporting at least “moderate” knee pain, so may not be comparable to typical OA population ** Abstract that does not present sufficient data to determine a quality rating †† Described as double-blind design, but did not mention allocation concealment, used “responders” rate derived from drop in Lequesne index scores as primary beneficial outcome §§ Combination glucosamine plus chondroitin study

85
Chondroitin. As shown in Table 38, two single-agent trials were judged as “good” quality; two were “fair,” and, 4 were “poor.” The failure to use allocation concealment and ITT analysis was a factor in all 4 poor-quality studies. Table 38. Quality ratings of randomized trials of chondroitin that meet protocol selection criteria
Study
Initial Assembly
of Comparable Groups
Low Loss to Followup,
Maintenance of Comparable
Groups
Measurements Reliable, Valid,
Equal
Interventions Comparable/
Clearly Defined
Appropriate Analysis of
Results Overall Rating
Studies Included in Meta-Analyses Mazieres et al., 2001 Y Y Y Y Y Good
Bourgeois et al., 1998 ?* Y Y Y Y Fair
Bucsi and Poor, 1998 ?† Y Y Y N† Poor
Conrozier, 1998 ?c ? Y Y ? c Poor
Uebelhart et al., 1998 ?† Y Y Y N† Poor
L’Hirondel, 1992 N‡ ?‡ Y Y N‡ Poor
Additional Studies Michel et al., 2005 Y N§ Y Y Y Fair
Uebelhart et al., 2004 Y Y Y Y Y Good *Did not report allocation concealment, reported ITT analysis, but presented data on loss to percent due only to adverse events (8 total across all 3 groups) with no mention of effect on composition of treatment groups †Did not report allocation concealment or specify ITT analysis ‡No demographic details shown, statistical measures of dispersion not provided, allocation concealment not specified, ITT analysis unclear §Although 27% of pts dropped out, the completers did not differ statistically from the ITT in any parameter
Summary of Meta-Analyses. Information on the results of the MAs is summarized below. Study details are summarized in Appendix C*, Table IIA. Bjordal, Klovning, Ljunggren, et al. (2006). Bjordal, Klovning, Ljunggren, et al. (2006) focused on placebo-controlled RCTs that reported on pain intensity (VAS global or walking pain, WOMAC pain subscale) within 4–12 weeks of treatment start. It was rated a 7 on the Oxman and Guyatt instrument (Table 27). Seven primary studies of glucosamine and 6 of chondroitin were pooled separately, as shown in Table 39. Because no evidence of heterogeneity was found, Bjordal, Klovning, Ljunggren, et al. (2006) used a fixed-effects model to pool WMDs and did not perform sensitivity analyses. The WMD for glucosamine ranged from 0.1 to 7.5 mm among individual studies, with a pooled WMD of -4.7 mm (95 percent CI: -0.3, -9.1). The WMD from 6 studies of chondroitin ranged from -0.4 (favoring placebo) to -6.5, with a pooled WMD of -3.7 mm (95 percent CI: -0.3, -7.0) at a best time point of 3.6 weeks.
* Appendixes cited in this report are available electronically at http://www.ahrq.gov/clinic/tp/oakneetp.htm

86
Table 39. Bjordal, Klovning, Ljunggren, et al. (2006) meta-analysis clinical outcomes
Compound No.
RCTs
No. Treated
Subjects
Mean Study
Quality* I2
(%)
Pooling Metric
(model)
Pooled Result† (mm)
95% CI p value
GH/GS 7 401 3.6 0 WMD (FE)
-4.7 -0.3, -9.1 NR
CS 6 362 3.5 0 WMD (FE)
-3.7 -0.3, -7.0 NR
*Study quality rated according to 5-point Jadad scale †100 mm VAS, negative pooled result indicates improvement CI: confidence interval; CS: chondroitin sulfate; FE: fixed effects; GH: glucosamine hydrochloride; GS: glucosamine sulfate; NR: not reported; WMD: weighted mean difference;
The investigators assessed the methodologic quality of the trials using the Jadad method, with scores that ranged from 3 to 5. Studies were flawed by failure in concealment of allocation, handling of withdrawals and use of intention-to-treat analyses (Tables 37 and 38). Four of the chondroitin trials were funded by pharmaceutical companies (Bourgeois, Chales, Dehais, et al., 1998; Bucsi and Poor, 1998; Uebelhart, Thonar, Delmas, et al., 1998; Morreale, Manopulo, Galati, et al., 1996). Bjordal, Klovning, Ljunggren, et al. (2006) did not test for publication bias. This MA included two studies that do not fit selection criteria for this Report. In one trial, 38 percent of patients had hip OA (Mazieres, Loyau, Menkes, et al., 1992); in the second, an active NSAID control (diclofenac) was used (Morreale, Manopulo, Galati, et al., 1996). The Mazieres trial yielded a negative WMD, whereas the Morreale trial produced a positive WMD. Thus, we performed a sensitivity analysis, which confirmed that exclusion of both trials would not significantly affect the overall result or direction of this MA.* Bjordal, Klovning, Ljunggren, et al. (2006) excluded five studies that meet our study selection criteria, but the effect is unknown.† Comment. Bjordal and colleagues (2006) reported the results of separate meta-analyses of glucosamine or chondroitin on pain due to knee OA. Overall, in terms of the treatment parameters, disease, patient characteristics, and outcomes, their focus was compatible with the aims of this Evidence Report. The Oxman and Guyatt quality rating for this MA (7) suggests it was not biased by design or analytic methods. However, Bjordal did not perform subgroup or sensitivity analyses of individual study quality parameters, such as the adequacy of allocation concealment or use of ITT analysis. Subgroup and sensitivity analyses are necessary in a MA to formally explore the influence of bias secondary to poor study quality, even in the documented absence of significant heterogeneity. In contrast to the other MAs in which results were unitless SMDs, or effect sizes, Bjordal and colleagues (2006) used a WMD based on a 100-mm VAS for pain. Because a WMD uses the same scale as the original outcome data, the results have direct clinical meaning. The authors further interpreted their MAs in the context of a clinically meaningful benefit, defined as a minimal perceptible improvement threshold of 10 mm and a minimal clinically important improvement threshold of 20 mm. Thus, even though the pooled results were statistically significant, the WMDs and 95 percent CIs were below either clinically meaningful threshold. It may be concluded that treatment with glucosamine or chondroitin does not reach a level of
* WMD = -3.94 (95 % CI = -0.03, -7.8) p=.048 † Pavelka, Gatterova, Olejarova, et al., 2002; Reginster, Deroisy, Rovati, et al., 2001; Rovati, 1997; Conrozier, 1998; L’Hirondel, 1992

87
clinical importance in relieving pain associated with mild-to-moderate knee OA over the 4- to 12-week treatment period studied. Towheed, Maxwell, Anastassiades, et al. (2006). This is the largest MA available on glucosamine as sole therapy for OA of the knee. A total of 20 double-blinded, placebo- or active-controlled RCTs were included that reported on glucosamine sulfate or glucosamine hydrochloride administered orally or parenterally to patients with primary or secondary OA at any site except temporomandibular joint (TMJ). We rated it a 7 on the Oxman and Guyatt scale, the highest quality level. Table 40 shows SMDs for glucosamine versus placebo. The mean Jadad quality scores ranged from 3.9 to 4.8. A random effects model was used for two comparisons (pain, LI) because significant interstudy heterogeneity was detected, and a fixed effects model was used for Table 40. Towheed, Maxwell, Anastassiades, et al. (2006) meta-analysis outcomes
Outcome Measure No.
RCTs No.
Subjects
Mean Study
Quality* I2
(%)
Pooling Metric
(model) Pooled Result† 95%CI p value
Pain‡ 15 1,481 3.9 88.5 SMD (RE)
-0.61 -0.95, -0.28 .0003
Lequesne index 4 741 4.8 89.4 SMD (RE)
-0.51 -0.96, -0.05 .03
WOMAC pain 7 955 4.4 0.0 SMD (FE)
-0.04 -0.17, 0.09 .5
WOMAC stiffness 5 538 4.4 14.3 SMD (FE)
-0.07 -0.21, 0.08 .4
WOMAC function 6 750 4.3 0.0 SMD (FE)
-0.07 -0.21, 0.08 .4
WOMAC total 5 672 4.4 0.0 SMD (FE)
-0.15 -0.30, 0.00 .06
Adverse events (AEs) 14 1,685 3.9 0.0 RR (FE)
0.97 0.88, 1.08 .6
Withdrawals due to AEs 17 1,908 4.0 0.0 RR (FE)
0.82 0.56, 1.21 .3
*Study quality rated according to 5-point Jadad scale †negative pooled result indicates improvement ‡Composite including WOMAC pain (n=6 trials), scalar pain otherwise not defined (n=6), VAS pain (n=3) CI: confidence interval; FE: fixed effects; RE: random effects; RR: relative risk; SMD: standardized mean difference;
the other comparisons. Statistically significant results were reported for two analyses, a composite measurement of pain (SMD: -0.61; 95 percent CI: -0.95, -0.28), and Lequesne Index (SMD: -0.51; 95 percent CI: -0.96, -0.05). None of the pooled results for other outcomes were statistically significant, including the relative risk for adverse events and for study withdrawals due to adverse events. Subgroup analysis showed statistically favorable results for the composite pain outcome in placebo-controlled trials that used Rotta glucosamine sulfate or were otherwise associated with Rotta Research Laboratorium (SMD: -1.31; 95 percent CI: -1.99, -0.64). A second subgroup analysis of non-Rotta related studies was not significant (SMD: -0.15; 95 percent CI: -0.35, 0.05). Sensitivity analysis of pooled results from studies that reported adequate allocation concealment (Table 41) suggested no difference between glucosamine and placebo in relieving pain (SMD: -0.19; 95 percent CI: -0.50, 0.11).

88
Table 41. Towheed, Maxwell, Anastassiades, et al. (2006) sensitivity and subgroup analyses for pooled composite pain measurement
Variable No.
RCTs No.
Subjects
Mean Study
Quality* I2
(%) Pooling Metric
Pooled Result† 95% CI p value
Rotta product 7 730 3.8 93.3 SMD (RE)
-1.31 -1.99, -0.64
.0001
Non-Rotta product 8 751 4.0 43.6 SMD (RE)
-0.15 -0.35, 0.05 .1
Adequate allocation concealment
8 1,111 4.5 83.4 SMD (RE)
-0.19 -0.50, 0.11 .2
*Study quality rated according to 5-point Jadad scale †negative pooled result indicates improvement CI: confidence interval; FE: fixed effects; SMD: standardized mean difference; RE: random effects;
None of the analyses that used other outcome measures (WOMAC subscales or Lequesne Index) showed statistically significant results in sensitivity analyses. Comment. The analysis by Towheed, Maxwell, Anastassiades, et al. (2006) consists of 38 separate meta-analyses based on different groupings of 20 RCTs. In the key analysis of pain, the pooled SMD from 15 RCTs was equated with a difference in the change from baseline of 28 percent, suggesting a moderate effect. However, the authors did not test for publication bias, which could skew results. Broader study inclusion and substantial interstudy heterogeneity associated with the SMDs for pain (I2 = 88.5 percent) and Lequesne Index (I2 = 89.4 percent) reflect differences in disease site, route of administration, study duration, and the use of reference and placebo controls. In a subgroup analysis of the potential effect of Rotta glucosamine sulfate, or indirectly Rotta sponsorship, Towheed and colleagues pooled studies that involved parenteral routes of administration, disease sites other than the knee, and had wide variation in size and duration. Substantial heterogeneity (I2 = 93.3 percent) and lower mean study quality score causes uncertainty in the results of this analysis. The authors explored a few potential sources of heterogeneity, but did not specifically assess the impact of ITT analysis and whether trials were industry-funded. A second sensitivity analysis showed a nonsignificant effect of glucosamine on pain in studies with adequate allocation concealment, suggesting bias secondary to study quality. However, interpretation of these results also is influenced by substantial interstudy heterogeneity (I2 = 83.4 percent). The authors conclude that there is a statistically significant effect in favor of glucosamine versus placebo in patients with OA. We believe this conclusion is compromised by interstudy heterogeneity and variability with respect to disease site, route of administration, study duration, and the use of active controls and placebo controls. The pooled results were reported as SMDs, which can be difficult to interpret. Finally, concern exists over the thoroughness of exploration of heterogeneity in this meta-analysis, particularly the influence of ITT analysis and industry-funding. While this meta-analysis had some strong methodologic characteristics, concerns noted here call its conclusions into question. Poolsup, Suthisisang, Channark, et al. (2005). The main efficacy outcome of this glucosamine MA was joint space narrowing (JSN) in the signal joint, reported in terms of relative risk of disease progression, and defined as the proportion of patients with JSN >0.5 mm. Its Oxman and Guyatt score of 3 (major flaws) was primarily due to limitations in study selection criteria (Table 27). As shown in the Table 42, pooled SMDs for WOMAC pain (- 0.41, 95 percent CI: -0.21, -0.60) and function (0.46, 95 percent CI: -0.27, -0.66) were statistically significant versus

89
placebo at 3 years (p<.0001). No significant differences were noted (RR = 1.02; 95 percent CI: 0.93, 1.11) in the risk of adverse events including abdominal pain, dyspepsia, diarrhea, increased blood pressure, fatigue, and rash. Mean Jadad study quality scores of 4.5 were reported. Table 42. Poolsup, Suthisisang, Channark, et al. (2005) meta-analysis clinical outcomes
Outcome Measure No.
RCTs No.
Subjects
Mean Study
Quality* I2
(%)
Pooling Metric
(model) Pooled Result †
95% CI p value c
WOMAC pain 2 414 4.5 0 SMD (RE)
-0.41 -0.21, -0.60 <.0001
WOMAC function 2 414 4.5 0 SMD (RE)
-0.46 -0.27, -0.66 <.0001
Adverse events (AEs)
2 414 4.5 0 RR (RE)
-1.02 -0.93, -1.11 NSD
*Study quality rated according to 5-point Jadad scale †negative pooled result indicates improvement CI: confidence interval; NSD: no significant difference; RR: relative risk; RE: random effects; SMD: standardized mean difference;
Comment. Poolsup, Suthisisang, Channark, et al., (2005) focused on long-term structural progression of knee OA, rather than symptomatic outcomes that are the focus of this Evidence Report. They reported statistically significant pooled SMDs for two secondary outcomes, WOMAC pain and function, based on data from two RCTs (Pavelka, Gatterova, Olejarova, et al., 2002; Reginster, Deroisy, Rovati, et al., 2001). Fourteen studies were excluded because they did not report structural outcome data.* While this MA was rated low in quality, the 2 trials included were fair quality, with no interstudy heterogeneity reported. Both were sponsored by Rotta. The conclusion that glucosamine sulfate possesses moderate efficacy in improving symptoms of OA of the knee is limited by the small number of trials and subjects included. Given the structural focus of this MA and narrow inclusion criteria, we conclude that it does not provide relevant information to address the Key Questions of this Evidence Report. Richy, Bruyere, Ethgen, et al. (2003). This MA included a total of 15 double-blind, placebo-controlled RCTs of glucosamine or chondroitin that lasted at least 4 weeks. It is unique in that the authors pooled studies of glucosamine with those of chondroitin, which was justified on absence of efficacy differences (Table 27). Despite this design limitation, the fundamental methodological characteristics were sound (Table 28), with an Oxman and Guyatt score of 5. As shown in Table 43, twelve studies for the main outcome of VAS pain showed a pooled SMD (random effects model) of -0.45 (95 percent CI: -0.33, -0.57), with a range among individual studies between -0.06 and -1.02. Pooled data from 2 to 11 trials yielded statistically significant results that favored glucosamine and chondroitin treatment for the WOMAC total score, Lequesne Index, mobility, joint space narrowing, and being a responder. The absolute risk difference for being a responder was 20 percent (95 percent CI: 15 percent to 26 percent), which translates to a NNT of about 5. There was no significant difference in adverse events. The investigators used the Jadad method to determine mean scores of the pooled RCTs that ranged from 3.8 to 4.5. In the presence of interstudy heterogeneity (I2 not reported), a random effects model was used to pool data. Tests for publication bias with funnel plots and Egger’s
* Cohen, Wolfe, and Mai, 2003; Das and Hammad, 2000; Houpt, McMillan, Wein, et al., 1999; Hughes and Carr, 2002; Leffler, Philippi, Leffler, et al., 1999; Muller-Fassbender, Bach, Haase, et al., 1994; Noack, Fischer, Forster, et al., 1994; Pujalte, Llavore, Ylescupidez 1980; Qiu, Gao, Giacovelli, et al., 1998; Reichelt, Forster, Fischer, et al., 1994; Rindone, Hiller, Collacott, et al., 2000; Vajanetra, 1984; Vajaradul, 1981; Lopes Vaz, 1982

90
linear regression test revealed a light asymmetry to the right side, suggesting that more studies of small sample size were associated with high effect sizes than with small effects. Table 43. Richy, Bruyere, Ethgen, et al. (2003) meta-analysis clinical outcomes
Outcome Measure
No. RCTs
No. Subjects
Mean Study
Quality* I2
(%)
Pooling Metric
(model) Pooled Result †
95% CI p value
VAS pain 12 1267 3.8 NR SMD (RE) -0.45 -0.33, -0.57 <.001
WOMAC pain 2 414 4.5 NR
SMD (FE) -0.30 -0.11, -0.49 <.001
Lequesne index 10 1582 3.8 NR
SMD (FE) -0.43 -0.32, -0.54 <.001
Mobility (not defined) 3 150 4.0 NR
SMD (FE) -0.59 -0.25, -0.92 <.001
Responder 9 1159 3.9 NR RR (FE) -1.59 -1.39, -1.83 <.001
Adverse events 11 1770 4.1 NR
RR (RE) -0.80 -0.59, -1.08 .15
*Study quality rated according to 5-point Jadad scale †negative pooled result indicates improvement CI: confidence interval; FE: fixed effects; NR: not reported; RE: random effects; RR: relative risk; SMD: standardized mean difference;
Comment. Richy, Bruyere, Ethgen, et al. (2003) pooled glucosamine and chondroitin studies. They assert that the robustness of their findings, the conservative approach used to pool data, and the use of unpublished data constitute definitive evidence that glucosamine and chondroitin are beneficial. However, the pooled results from this MA are not useful for our purposes as they do not individually report the efficacy of these agents as sole therapy. Leeb, Schweitzer, Montag, et al. (2000). Leeb, Schweitzer, Montag, et al. (2000) included 7 double-blind, placebo-controlled RCTs of oral chondroitin that lasted 120 days or more. Their selection criteria specified that trials contain data on at least half of the efficacy variables proposed by EULAR (Lequesne Index, investigator’s global assessment, VAS for pain, patient’s global assessment) or SADOA guidelines (VAS for pain, functional index, Doyle index, loss of mobility, NSAID or analgesic consumption, number of flares over time, investigator’s global assessment, quality of life scale, walking or stair climbing time) in patients with knee or hip OA. Its low Oxman and Guyatt score (3) was primarily due to limited details on language restrictions and failure to seek unpublished data (Table 27). The methodologic aspects were poorly reported (Table 28). Pooled results from all 7 included studies (Table 44) yielded a statistically significant SMD that favored chondroitin for VAS pain (mean SMD -0.9, 42 percent of baseline). Data pooled from 6 studies showed a statistically significant reduction in the Lequesne index amounting to 51 percent of baseline at 180 days. Because neither SMD was accompanied by an explicit 95 percent CI, those were estimated from the Forest plots shown in the MA. Adverse effects were mild and infrequent in all studies, with no significant difference between chondroitin and placebo groups.

91
Table 44. Leeb, Schweitzer, Montag, et al. (2000) meta-analysis clinical outcomes
Outcome Measure No.
RCTs No.
Subjects
Mean Study
Quality I2
(%)
Pooling Metric
(model) Pooled Result*
95% CI† p value
VAS pain 7 699 NR NR SMD (NR) -0.90 -0.80, -1.0 <.05
Lequesne index 6 653 NR NR SMD (NR) -0.74 -0.62, -0.80 <.01
*negative pooled result indicates improvement †estimated from figures in report CI: confidence interval; NR: not reported; SMD: standardized mean difference;
Based on qualitative review of the RCTs, Leeb and co-workers (2000) asserted that there was little interstudy heterogeneity. Furthermore, the authors did not use a validated method such as the Jadad score to formally assess study quality. One primary RCT reported on patients with OA of the hip (Conrozier and Vignon, 1992), one included patients with OA of the hip and knee (Mazieres, Loyau, Menkes, et al., 1992), and one study used a reference intervention (diclofenac) in the control group (Morreale, Manopulo, Galati, et al., 1996). All three of these RCTs would be excluded by the selection criteria we defined to address the Key Questions of this Report. Comment. Leeb and colleagues (2000) conclude that their results provide evidence for significant efficacy of chondroitin sulfate on pain and function in treatment of OA compared to placebo in patients followed for 4 months or more. However, these results have little utility for our purposes. Most notably, they did not assess the effect of heterogeneity, study quality, industry-funding or publication bias on the pooled results. The statistical techniques used to pool and analyze extracted data were poorly described. Finally, the selection criteria we defined to address the Key Questions in this Report would exclude three of 7 trials included in their MA. Given the significant methodological shortcomings, we believe this MA does not support a conclusion that chondroitin sulfate is more effective than placebo in therapy of knee OA. McAlindon, LaValley, Gulin, et al. (2000). McAlindon and colleagues (2000) included 15 double-blind, placebo-controlled RCTs of at least 4 weeks’ duration that compared the efficacy of glucosamine or chondroitin in patients with symptomatic OA. Its Oxman and Guyatt quality score was 4 (major flaws), due to limitations in the scope of the literature search and possible study selection bias (Table 27). The methodologic characteristics are summarized in Table 28. The authors used a random effects model to calculate pooled effect sizes based on a hierarchy of data for different outcome scales, including VAS pain, WOMAC pain, Lequesne Index, mobility, and NSAID use. Table 45 shows pooled data generally for pain outcomes extracted from six RCTs of glucosamine, yielding a SMD of -0.44 (95 percent CI: -0.24, -0.64), based on individual SMDs that ranged from -0.23 to -1.28. Data from nine individual chondroitin sulfate trials yielded a pooled SMD for pain of -0.96 (95 percent CI: -0.63, -1.3), with individual SMDs that ranged between -0.53 and -4.56. The authors did not report the statistical significance of any SMD.

92
Table 45. McAlindon, LaValley, Gulin, et al. (2000) meta-analysis clinical outcomes
Compound No.
RCTs No.
Subjects
Mean Study
Quality*
(range) Heterogeneity
(p value) Pooling Metric†
Pooled Result‡
95% CI p value
GH/GS 6 911 38 (12–52)
NSD SMD -0.44 -0.24, -0.64 NR
CS 9 799 34 (14–55)
<.001 SMD -0.96 -0.63, -1.3 NR
*Study quality score based on reported compliance with 14 aspects of clinical trial conduct, ranging from 0 to 68 for negative and from 0 to 65 for positive studies, expressed as a percentage of the maximum possible score for each trial †All results were pooled using a random-effects model; ‡negative pooled result indicates improvement CI: confidence interval; NR: not reported; NSD: no significant difference; SMD: standardized mean difference;
Tests for publication bias (funnel plots) showed statistical evidence of significant bias that reflected an absence of trials with both small numbers of participants and small or null treatment effects. Assessment of primary study quality showed allocation concealment was frequently inadequate and intention-to-treat analysis was rarely performed. Several sensitivity analyses were performed, as shown in Table 46. Pooled effect sizes for both compounds were substantially higher with lower-quality trials compared with higher-quality trials. Trial size did not significantly influence the SMD calculated for glucosamine, whereas this parameter had a substantial influence on the effect size for chondroitin. Adverse events were not reported. Table 46. McAlindon, LaValley, Gulin, et al. (2000) sensitivity analyses for pooled composite pain measurement
Variable No.
RCTs No.
Subjects Study
Quality*
Hetero-geneity
(p value) Pooling Metric†
Pooled Result‡
95% CI p value
Low-quality GS/GH trials
3 403 < 40 NR SMD -0.7 -0.4, -1.0 NR
High-quality GS/GH trials
3 508 ≥ 40 NR SMD -0.3 0.1, -0.5 NR
Low-quality CS trials
4 324 < 35 NR SMD -1.7 -0.7, -2.7 NR
High-quality CS trials
5 475 ≥ 35 NR SMD -0.8 -0.6, -1.0 NR
Small GS/GH trials
3 175 39 NR SMD -0.5 -0.1, -0.9 NR
Large GS/GH trials
3 736 36 NR SMD -0.4 -0.1, -0.7 NR
Small CS trials
4 183 34 NR SMD -1.7 -0.5, -2.8 NR
Large CS trials
5 616 34 NR SMD -0.8 -0.6, -1.0 NR
*Study quality score based on reported compliance with 14 aspects of clinical trial conduct, ranging from 0 to 68 for negative and from 0 to 65 for positive studies, expressed as a percentage of the maximum possible score for each trial †All results were pooled using a random effects model; ‡negative pooled result indicates improvement
CI: confidence interval; NR: not reported; SMD: standardized mean difference;
One of six glucosamine RCTs involved parenteral administration (Vajaradul, 1981). Two chondroitin trials used intramuscular injection (Rovetta, 1991; Kerzberg, Roldan, Castelli, et al., 1987) and one combined patients with OA of the knee or hip (Mazieres, Loyau, Menkes, et al.,

93
1992). None of the primary studies reported receiving independent funding from a governmental or not-for-profit source. Thirteen of 15 RCTs reported some connection with the drug manufacturer. A number of studies relevant to our Report have been subsequently published for glucosamine sulfate/glucosamine hydrochloride (Houpt, McMillan, Wein, et al., 1999; Rindone, Hiller, Collacott, et al., 2000; Reginster, Deroisy, Rovati, et al., 2001; Pavelka, Gatterova, Olejarova, et al., 2002; Hughes and Carr, 2002; Usha and Naidu, 2004; and McAlindon, Formica, LaValley, et al., 2004). For chondroitin sulfate, one study was published later (Mazieres, Combe, Phan Van, et al., 2001). Comment. The focus of the MA by McAlindon, LaValley, Gulin, et al. (2000) was generally comparable to that of our Evidence Report. However, it is limited for our purposes in several respects. First, the Oxman and Guyatt score (4) reflects major flaws in its design and conduct, primarily ascribed to study selection bias. McAlindon and colleagues included several trials that do not meet our selection criteria with respect to the route of drug administration and disease site. Second, sensitivity analyses suggested that heterogeneity due to differences in the quality and size of the primary studies differentially and substantially influenced the size of pooled SMDs depending on the intervention. Third, the presence of statistical evidence of bias in a funnel plot suggests caution is warranted in interpreting the results of this MA. The genesis of bias in this MA is unclear but could be a function of selective publication of positive trials, post hoc selection of study outcome measures, and premature trial termination once a positive outcome is achieved. Finally, the use of SMDs complicates interpretation and direct clinical application of the results. The MA authors conclude that glucosamine and chondroitin may have efficacy in treating OA symptoms and are safe, although they conceded the necessity for additional high-quality, independent studies to determine the actual clinical effectiveness of these preparations as therapy for symptomatic OA. Given the uncertainties outlined, we conclude that this MA does not provide sufficient evidence to show a clinical benefit for glucosamine or chondroitin treatment of OA. Summary of Additional Randomized Studies. We identified 5 placebo-controlled RCTs that were not pooled in the published MAs (Clegg, Reda, Harris, et al., 2006; Michel, Stucki, Frey, et al., 2005; Uebelhart, Malaise, Marcolongo, et al., 2004; Das and Hammad, 2000; Herrero-Beaumont, Roman, Trabado, et al., 2007). It should be noted that one of these studies (Das and Hammad, 2000) was excluded from the MA published by Poolsup and colleagues (2005). Descriptors of these studies can be found in Tables 31–33 (outcome measures), 34–36 (baseline characteristics), and 37 and 38 (study quality). Study details are summarized in Appendix C*, Tables IIB and IIC. Clegg, Reda, Harris, et al. (2006; GAIT). The “Glucosamine/chondroitin Arthritis Intervention Trial” or “GAIT” (Clegg, Reda, Harris, et al., 2006) was a double-dummy, double-blinded, placebo- and active-controlled NIH-funded RCT designed to evaluate the efficacy and safety of glucosamine, chondroitin, and the combination of the two versus placebo and celecoxib. Its design characteristics are detailed in Appendix C*, Table IIB, Part 1. Patients had primary OA of the knee ranging from mild to severe as per the Kellgren-Lawrence radiological scale and American Rheumatism Association (ARA) criteria. Our quality criteria suggest it was of “good” quality (Table 37). An absolute increase in the response rate of 15 percent, as compared with the rate in the placebo group, was considered indicative of a clinically meaningful treatment effect. Pair-wise comparisons between study arms used the Bonferroni * Appendixes cited in this report are available electronically at http://www.ahrq.gov/clinic/tp/oakneetp.htm

94
convention to correct for multiple comparisons. Statistical significance was defined as an α value of 0.017 for each comparison with placebo, based on an overall α value of 0.05 using a two-sided chi-square test. The authors also performed a stratified subgroup comparison between treatment and control arms of patients with moderate-to-severe WOMAC pain. These results are considered in Key Question 3 in this Report. Treatments included glucosamine hydrochloride 1,500 mg/day, chondroitin sulfate 1,200 mg/day, both agents together at same doses, or a single daily dose of celecoxib 200 mg. The celecoxib arm serves to internally validate the results. The study was conducted under an Investigational New Drug (IND) application, subject to pharmaceutical regulation by the U.S. FDA. Patient enrollment and disposition are summarized in Appendix C*, Table IIB, Part 2, and outcomes measures are summarized in Appendix C*, Table IIB, Part 3. A shown in Table 47, when considering all randomized patients, the rate of response to glucosamine and chondroitin, either alone or in combination, was not significantly higher than the rate of response to placebo for the primary outcome. A statistically significant effect (p=.008) on the primary outcome was observed in the celecoxib control group compared to placebo. The OMERACT-OARSI response rates exhibited a similar pattern, with differences between the placebo group and the three intervention groups not reaching statistical significance. The rate of response to celecoxib did reach statistical significance (p=.007) compared with placebo for the OMERACT-OARSI response rate. Table 47. Key health outcomes of all randomized patients in GAIT
Primary Outcome Secondary Outcomes Intervention 20% decrease in
WOMAC pain score, % (n)
p value OMERACT-OARSI response, % (n)
p value 50% decrease in WOMAC pain score, % (n)
p value
Placebo 60.1% (188/313) 56.9% (178/313) 42.2% (132/313)
Glucosamine 64% (203/317) p=.30 60.6% (192/317) p=.35 46.4% (147/317)
p=.29
Chondroitin 65.4% (208/318) p=.17 63.5% (202/318) p=.09 42.1% (134/318)
p=.99
Glucosamine plus Chondroitin
66.6% (211/317) p=.09 65.6% (208/317) p=.02* 46.4% (147/317)
p=.29
Celecoxib 70.1% (223/318) p=.008† 67.3% (214/318) p=0.007† 50% (159/318) p=0.05* *p <0.05 for the comparison with placebo †p <0.017 for the comparison with placebo OMERACT-OARSI: Outcomes Measures in Rheumatology Clinical Trials-Osteoarthritis Research Society; WOMAC: Western Ontario and McMaster Universities; As shown in Table 48, analysis of the primary outcome in the patients with mild pain (78% of the total patient sample) showed smaller treatment effects, none of which were of a clinically beneficial magnitude or statistically significant.
* Appendixes cited in this report are available electronically at http://www.ahrq.gov/clinic/tp/oakneetp.htm

95
Table 48. GAIT patients with mild pain (WOMAC pain score 125–300) Primary Outcome Secondary Outcomes
Intervention 20% decrease in WOMAC pain score, % (n)
p value OMERACT-OARSI
response, % (n)
p value 50% decrease in WOMAC
pain score, % (n)
p value
Placebo 61.7% (150/243) 59.3% (144/243)
44.9% (109/243)
Glucosamine 63.6% (157/247) p=.67 59.1% (146/247)
p=.97 47.8% (118/247) p=.52
Chondroitin 66.5% (165/248) p=.27 64.9% (161/248)
p=.20 44.5% (109/248) p=.84
Glucosamine plus Chondroitin
62.9% (154/245) p=.80 62.9% (154/245)
p=.42 44.5% (109/245) p=.94
Celecoxib 70.3% (173/246) p=.04* 67.5% (166/246)
p=.06 51.2% (126/246) p=.16
*p<.05 for the comparison with placebo OMERACT-OARSI: Outcomes Measures in Rheumatology Clinical Trials-Osteoarthritis Research Society; WOMAC: Western Ontario and McMaster Universities; Comment. This is the largest (n=1,583) independently funded RCT of glucosamine and chondroitin that has been reported. It is a good-quality study, with a well-defined, clinically relevant subject sample. The 24-week treatment period is adequate to assess long-term benefit from the supplements. The lack of a significant response to either supplement alone, or the combination, in the context of the significant effect in the celecoxib-treated group, provides compelling evidence that neither glucosamine nor chondroitin provide clinically meaningful pain relief compared to placebo in patients with OA of the knee. A similar pattern of response to glucosamine plus chondroitin was observed for secondary outcomes, in particular the OMERACT-OARSI response rate and the 50 percent decrease in WOMAC pain among all randomized patients. None of the interventions had a significant effect among patients with mild pain. It has been suggested that failure to demonstrate a statistically significant improvement in the main outcome in GAIT is related to use of glucosamine hydrochloride rather than glucosamine sulfate manufactured by Rotta Research Laboratorium (Hochberg, 2006). It also has been speculated that the positive result with combined therapy in GAIT could be related to co-delivery of sulfate from chondroitin sulfate and glucosamine, but it is unclear if the doses used would be clinically meaningful (Altman, Abramson, Bruyere, et al., 2006). GAIT provides no evidence to address either of those hypotheses. Michel, Stucki, Frey, et al. (2005). This was a 24-month, independently funded, double-blind, placebo-controlled RCT of chondroitin 4/6 sulfate. Patients ranged in age from 40 to 85 years, with clinically symptomatic, primary knee OA of Kellgren-Lawrence grades 1–3 diagnosed according to the ACR clinical and radiographic criteria. Patients with Kellgren-Lawrence grade 4 OA were excluded. Among 341 patients screened, 300 entered the study (150 given chondroitin sulfate (Condrosulf, IBSA, Lugano, Switzerland) and 150 given placebo) and were included in the ITT analysis. A total of 27 percent of the patients dropped out, which was reported to have no significant impact on the composition of the groups. The clinical outcomes scored in this trial are shown in Table 32, its baseline characteristics are shown in Table 35, and its quality rating (fair) is outlined in Table 38. As shown in Table 49, over the 2-year study period, there were no significant differences from baseline between the components of the WOMAC score or the total WOMAC score in the

96
treatment and placebo groups. No statistically significant differences were observed between the groups in the frequency of adverse events, such as abdominal pain, nausea, or headache. Table 49. Outcomes from Michel, Stucki, Frey, et al. (2005)
Change from Baseline (%)* Outcome Placebo Group Treatment Group
WOMAC pain -6.2 -11.0 WOMAC stiffness -4.6 -7.8 WOMAC function 5.9 -0.8 WOMAC total 2.1 -3.9 Adverse events 67 total, none serious 58 total, none serious * No significant differences between groups for any score
Comment. This RCT showed no significant difference in WOMAC pain, stiffness, function, or total scores with chondroitin therapy for 24 months versus placebo. It was of adequate design and execution to address the clinical efficacy of the intervention. Patients were generally representative of a typical OAK population. However, the relatively low mean pain score of patients at entry may have limited the ability to detect meaningful improvements. Uebelhart, Malaise, Marcolongo, et al. (2004). This multicenter, double-blind placebo-controlled randomized trial involved two 3-month intermittent treatment periods with chondroitin sulfate (Condrosulf, IBSA, Lugano, Switzerland) to test the symptomatic efficacy of the study drug versus placebo. The clinical outcomes scored in this trial are shown in Table 32, its baseline characteristics are shown in Table 35, and its quality rating (good) is outlined in Table 38. A total of 120 patients age 40 or over with clinically symptomatic, idiopathic OA of the knee according to ACR criteria were enrolled. Patients with Kellgren-Lawrence grade 1-3 disease and a minimum 25 percent remaining medial femoro-tibial joint space at entry were eligible. Treatment was administered for two periods, the first from entry to month 3 and the second between months 6 and 9; no treatment of any kind was given between months 3-6 and 9-12. A total of 110 patients (54 chondroitin, 56 placebo) were included in the ITT analysis. Ten patients who did not take any dose of drug or report any data were lost to followup and excluded from the ITT analysis. A total of 43 in the chondroitin and 41 in the placebo group completed the study. As shown in Table 50, the mean decrease in the primary outcome, Lequesne’s algofunctional index, was statistically significant after 12 months of chondroitin compared to placebo. This represented a 36 percent decline from baseline for treatment compared with 23 percent for placebo. A secondary outcome, Huskisson’s VAS for pain, fell 42 percent in the chondroitin group versus 25 percent in the placebo group, representing statistically significant differences from baseline and between groups (p<.05). Minor adverse events occurred, with a frequency of 4 in the chondroitin group and 6 in the placebo recipients. The global assessment of tolerance expressed by patients and physicians was very similar, with no difference observed between the two groups.

97
Table 50. Outcomes from Uebelhart, Malaise, Marcolongo, et al. (2004) Mean (± SD) Outcome
Baseline 3 mos 6 mos 9 mos 12 mos Outcome
Pl CS Pl CS Pl CS Pl CS Pl CS Lequesne Index
9.1 ± 3.2
9.0 ± 2.8
7.4 ± 4.2
6.8 ± 3.6
7.5 ± 4.0
6.7 ± 3.5
7.0 ± 3.9
6.0 ± 3.8 *
7.0 ± 3.9
5.8 ± 3.6**
VAS (mm) 61.1 ± 19.0
58.8 ± 15.5
49.1 ± 24.5
42.9 ± 23.2
47.6 ± 26.9
40.5 ± 23.9
46.1 ± 27.2
34.0 ± 26.4 *
45.8 ± 27.6
34.3 ± 27.4*
* p<.05 vs. placebo; ** p<.01 (ANOVA between groups) Comment. These results suggest 9 to 12 months of therapy with chondroitin may reduce pain and improve function in symptomatic OA of the knee. Chondroitin treatment was associated with few minor adverse events and an overall tolerable global assessment. The results are suggestive, but the small size of this trial limits its conclusions and generalizability. Das and Hammad (2000). Patients in this 6-month, industry-funded (Nutramax Laboratories, Inc., Baltimore, MD), double-blind, placebo-controlled RCT of glucosamine hydrochloride and chondroitin sulfate were recruited from the principal investigator’s orthopedic practice through newspaper advertisement. The clinical outcomes scored in this trial are shown in Table 33, its baseline characteristics are shown in Table 36, and its quality rating (good) is outlined in Table 37. Ninety-three patients (46 G/C, 47 placebo) age 45 to 75 years were enrolled. All had primary OA of the knee with a minimal Lequesne Index score of 7, Kellgren-Lawrence radiographic grade 2 or more, and symptoms of more than 6 months duration. Randomization was stratified by disease severity according to the Kellgren-Lawrence grade. Analysis was planned a priori to be stratified by the Kellgren-Lawrence radiographic grade of OA, with the mild/moderate (2-3) group as the primary study population. Thus, of the 46 patients randomized to the intervention, 33 had Kellgren-Lawrence grade 2-3 OA and 13 had Kellgren-Lawrence grade 4 OA. The placebo group had 39 patients with Kellgren-Lawrence grade 2-3 OA and 8 with Kellgren-Lawrence grade 4 OA. The primary outcome measure was defined as a 25 percent improvement in the Lequesne Index, with the total WOMAC score as a secondary outcome. The patient’s global assessment of improvement also was recorded. As shown in Table 51, 52 percent of patients with mild/moderate OA of the knee achieved the primary outcome versus 28 percent in the placebo recipients (p=.04). There was no significant difference among those with severe OA of the knee in this outcome. No statistically significant differences were observed between the total WOMAC scores reported for the intervention and placebo groups. Seventy percent of treatment recipients with mild-to-moderate OA of the knee reported more than 25 percent improvement in their global assessment compared with 46 percent of those given placebo (p=.04). In those with severe OA of the knee, the intervention had no impact on the global assessment response rate compared to placebo (31 percent versus 38 percent). There was a 17 percent incidence of adverse events in treatment recipients, primarily attributed to the GI tract, compared with 19 percent in the placebo group (NSD). Four patients dropped out, but all who had a baseline visit and received their medications were included in the ITT analysis.

98
Table 51. Outcomes from Das and Hammad (2000) Mild/moderate cases
Mn (± SEM) Severe cases Mn (± SEM)
Outcome Time (mos)
Pl (n=39) GH/CS (n=33) Pl (n=8) GH/CS (n=13) Lequesne Index Baseline
2 4 6 ≥ 25% improvement
10.4 (0.4) 9.6 (0.5) 9.2 (0.6) 9.0 (0.6) 11 (28%)
10.2 (0.4) 8.9 (0.5) 7.2 (0.6) * 7.4 (0.6)† 15 (52%)†
10.7 (1.2) 10.1 (1.4) 9.6 (1.5) 9.9 (1.6) 2 (25)
11.1 (0.80 10.2 (0.8) 9.4 (0.9) 9.6 (1.0)
3 (23) WOMAC total Baseline
2 4 6 ≥ 25% improvement
944 (55) 831 (64) 774 (79) 724 (87) 16 (41%)
908 (71) 768 (71) 655 (72) 626 (77) 19 (58%)
1089 (158) 984 (166) 900 (174) 882 (183) 2 (25%)
1187 (119) 1134 (121) 1041 (126) 1033 (126)
4 (31%) *p=.003;†p=.04 vs. placebo Comment. This study was generally well-designed and -conducted. However, its conclusions are limited by the small number of patients. The study sample may be self-selected due to recruitment through newspaper advertisements, and perhaps not typical of a generalized OA of the knee population. The small numbers involved in patients with severe knee OA are insufficient to conclude that glucosamine and chondroitin treatment has a differential response in mild-to-moderate versus severe disease. Herrero-Beaumont, Roman, Trabado, et al., 2007 (GUIDE). The “Glucosamine Unum in Die Efficacy” (GUIDE) trial is a multicenter, placebo-controlled RCT performed in Europe using Rotta glucosamine sulfate. A total of 318 patients (88 percent female) with OA of the knee (ACR criteria) were randomly allocated to glucosamine 1,500 mg daily, acetaminophen 1000 mg three times daily, or a placebo using a double-dummy design. Rescue medication consisted of ibuprofen as needed. The primary efficacy measure was the 6-month change in the Lequesne Index in the ITT population, using the “last observation carried forward” approach for patients who did not complete the study (34 on placebo, 28 each in the glucosamine sulfate and acetaminophen groups). Secondary measures included the total WOMAC score and OARSI-A responder criteria. The groups were comparable at baseline. Statistically significant results were observed in the glucosamine group versus placebo in all outcome measures (Table 52). Although the OARSI-A response was higher with acetaminophen than placebo, it did not reach the level of statistical significance for the other two outcomes. More patients in the placebo group used rescue medication than in the other two groups (p=.027 and .045 versus glucosamine sulfate and acetaminophen, respectively). No differences in adverse effects were observed. There was a substantial withdrawal rate on the order of 25% to 33% among the groups, a factor in the “fair” quality rating given this study.

99
Table 52. Outcomes from Herrero-Beaumont, Roman, Trabado, et al. (2007; GUIDE) Placebo (n=104)
Acetaminophen (n=108)
GS (n=106)
Outcome
Baseline 6 mos Baseline 6 mos Baseline 6 mos Lequesne Index (points)*
10.8 (2.6)
-1.9 (-2.6, -1.2)
11.1 (2.7)
-2.7 (-3.3, -2.1)
11.0 (3.1)
-3.1† (-3.8, -2.3)
WOMAC (points)*
37.9 (14.3)
-8.2 (-11.3, -5.1)
40.4 (14.8)
-12.3 (-14.9, -9.7)
38.3 (15.2)
-12.9‡ (-15.6, -10.1)
OARSI-A responders (%) 21.2 33.3§ 39.6** *Mean absolute (SD) at baseline and change (95% CI) at 6 mos †p=.032 vs. placebo [difference = -1.2 (-2.3, -0.8); ‡p=.039 vs. placebo [difference = -4.7 (-9.1, -0.2); §p=.047 vs. placebo; **p=.007 vs. placebo Comment. This RCT suggests glucosamine is efficacious in relieving mild-to-moderate pain of knee OA. However, it is not directly comparable to GAIT for several reasons. First, it uses a more sensitive, less rigorous primary outcome measures (OARSI-A) than the 20 percent reduction in WOMAC pain used in GAIT. Second, NSAIDs are considered modestly superior to acetaminophen for general or rest pain. For pain on motion and overall assessment of clinical response, NSAIDs also appear modestly superior, though differences are not always statistically significant. Only comparisons to placebo are reported, with no comparisons between the active arm and glucosamine. Finally, the use of glucosamine sulfate available only in Europe, and sponsorship by the manufacturer (Rotta) limit generalizability. Thus, while GUIDE provides evidence for glucosamine efficacy, its results are insufficient to establish this or to override the results of GAIT. It does provide a rationale for further independent study of glucosamine sulfate. Rotta Glucosamine Sulfate. A subgroup analysis in the Towheed, Maxwell, Anastassiades, et al. (2006) meta-analysis, and results of GUIDE (Herrero-Beaumont, Roman, Trabado, et al., 2007) suggest that glucosamine sulfate produced by Rotta Research Laboratorium has clinical efficacy in OA of the knee whereas glucosamine hydrochloride does not. We further assessed the RCTs included by the Towheed analysis, as well as GUIDE. As shown in Table 53, 5 of 8 RCTs with Rotta involvement compared oral glucosamine sulfate to placebo. Three RCTs were excluded because they used parenteral glucosamine or did not specifically evaluate OA of the knee (D’Ambrosio, Casa, Bompani, et al., 1981; Crolle and D’Este, 1980: Drovanti, Bignamini, and Rovati, 1980). Substantial differences exist among theses RCTs in duration, primary outcomes, and data analysis and presentation. The data as a whole do not support or refute differential efficacy of glucosamine sulfate. However, the results are consistent in direction of change favoring glucosamine over placebo, justifying independent evaluation of Rotta glucosamine sulfate. Adverse Events. Publications of RCTs of glucosamine and chondroitin provide information relating to the safety of these compounds. Tables 54 and 55 provide information on adverse events reported in primary studies. A low incidence of adverse events referable to the GI tract, musculoskeletal system, CNS, and other sites was reported, with no significant differences between treatment and placebo groups in any trial. Particular emphasis can be given to two RCTs (total N=414) of 3 years’ duration that compared glucosamine 1,500 mg daily to placebo, showing no significant differences in adverse events (Pavelka, Gatterova, Olejarova, et al., 2002; Reginster, Deroisy, Rovati, et al., 2001). No severe adverse events were reported in any study, and it is difficult to correlate adverse effects with either supplement.

100
Glucose Metabolism. There has been speculation that because glucosamine is taken up by cells and metabolized through the same pathways as glucose, it could have an effect on glycemic control in humans (Hathcock and Shao, 2006; Matheson and Perry, 2003). Data from 11 in vitro studies showed that increasing concentrations of glucosamine altered glucose transport, glycogen synthesis, and insulin response to glucose (Institute of Medicine and National Research Council, 2004; Anderson, Nicolosi, Borzelleca, et al., 2005). However, the clinical relevance these findings is unclear because they were obtained in isolated and cultured cell models using glucosamine concentrations 200 to 500 times the serum concentration expected with normal oral doses in humans.
Glucosamine increases flux through the hexosamine pathway, which leads to deterioration of pancreatic beta cell function, thus possibly enhancing the risk of diabetes (Kaneto, Xu, Song, et al., 2001; Yoshikawa, Tajiri, Sako, et al., 2002). However, in two acute metabolic ward studies, large amounts of glucosamine (7.2 g or 9.7 g of free base) were infused over 5 hours with no change in insulin activity or glucose metabolism (Monauni, Zenti, Cretti, et al., 2000; Pouwels, Jacobs, Span, et al., 2001). Specific effects of glucosamine on glycemic control have been studied. One double-blind, randomized, placebo-controlled trial compared the effect of oral glucosamine sulfate 1,500 mg daily with placebo (dextrose) for 12 weeks on serum insulin levels and glucose tolerance in healthy adults (Tannis, Barban, and Conquer, 2004). No baseline differences were observed in fasted levels of serum insulin or blood glucose in glucosamine sulfate recipients compared with those given placebo. Three-hour oral glucose tolerance tests showed glucosamine did not alter those parameters, with no significant differences within or between treatments, ages, or gender. Negative results in this study were limited by the small number of subjects (n=19), short duration, and large variability in the data. Moreover, blood levels of insulin and glucose represent surrogate markers for insulin sensitivity, not a gold standard for measuring it. A second randomized, double-blind, placebo-controlled trial (n=38) examined the effect of daily administration of glucosamine 1,500 mg plus chondroitin sulfate 1,200 mg for 90 days on glycemic control in patients with well-controlled, type 2 diabetes mellitus (Scroggie, Albright, Harris, et al., 2003). As reflected by hemoglobin A1c concentrations, glycemic control was equivalent in the intervention and placebo arms, with no difference from baseline in either group. These results suggest glucosamine has no effect on glycemic control in patients with type 2 diabetes. Because the trial lasted only 90 days, it is not possible to extrapolate its results beyond that time or to less well-controlled patients. A third double-blind, placebo-controlled trial examined the effect of oral glucosamine 500 mg thrice daily on insulin sensitivity or endothelial dysfunction in lean (n=20) and obese (n=20) subjects aged 22 to 65 years (Muniyappa, Karne, Hall, et al., 2006). Glucosamine or placebo treatment for 6 weeks was followed by a 1-week washout and crossover to the other study arm. The subjects in this study had expected clinical and biochemical characteristics. The lean subjects had normal metabolic and hemodynamic parameters while obese subjects exhibited typical insulin resistance and impaired insulin-stimulated brachial artery blood flow. Neither glucosamine nor placebo caused insulin resistance in healthy lean subjects or worsened this parameter in obese subjects. No significant changes were observed in either lean or obese subjects in any other measured parameters related to insulin sensitivity including lipid profiles, blood pressure, or hemoglobin A1c levels. Neither glucosamine nor placebo had an effect on endothelial dysfunction in either subject group. Thus, 6 weeks of oral glucosamine treatment at usual dose appears to have no deleterious effect on glucose metabolism or vascular function.

101
Table 53. Results of Rotta-related studies meeting protocol selection criteria Study
N Tx/Pl
Duration (wks)
Outcome Baseline Tx/Pl** (rng or 95% CI)
End Tx/Pl** (rng or 95%CI)
∆ Mean (95% CI, p value)
% Responders
Tx/Pl (p value)
USPSTF Quality
Comment
Herrero-Beaumont et al., 2007 (GUIDE)
106/104 24 Lequesne Index WOMAC index
11.0 ± 3.1 10.8 ± 2.6 38.3 ± 15.2 37.9 ± 14.3
7.9 (calc) 8.9 (calc) 25.4 (calc) 29.7 (calc)
-1.2 (calc) (.032) -4.7 (-9.1, -0.2) (0.39)
39.6 vs. 21.2 OARSI-A (.007)
Fair Used acetaminophen as active control, NSD between active and GS group
Pavelka et al., 2002
101/101 156 Lequesne Index WOMAC pain
8.9 ± 2.3 8.9 ± 2.3 6.6 ± 3.4 6.3 ± 3.1
7.2 (NR) 8.1 (NR) NR
-0.91 (-0.34, 1.5) (.002) -0.7 (-0.06, -1.3) (.03)
NR NR
Good Primarily examined structural changes in mild-to-moderate OAK; WOMAC pain change -10.6%
Reginster et al., 2001
106/106 156 WOMAC pain
194 ± 102 172 ± 104
156 (NR) 164 (NR)
-30 (estimated)
NR Good Structural changes in mild-to-moderate OAK. WOMAC pain change -19.5% in GS pts, -5% in placebo (net -15%)
Rovati et al., 1997
329 total
12 Lequesne Index
10.5 (estimated) 10.1
5.6 (estimated) 8.8 (estimated)
-3.6 (estimated)
NR Unrated (abstract)
Patients with mild-to-moderate OAK showed -35% change in LI
Noack et al., 1994
126/126 4 Lequesne Index
10.6 ± 0.4 (4-22) 10.6 ± 0.4 (4-20)
7.4 ± 0.5 (0-21) 8.4 ± 0.4 (0-24)
-1.0 (.05)
52/37 (.016)
Fair Moderate-to-severe OAK*; net difference about -9% with treatment
Pujalte et al., 1980
10/10 8 Composite measure of pain, tenderness, swelling, stiffness on 1-4 point scale in order of increasing severity
2.3 ± 0.15 2.6 ± 0.31
1.2 ± 0.08 2.3 ± 0.25
-0.81 80 vs. 20 (pain) (.0004)
Poor Patients with mild-to-moderate OA of the knee; used unvalidated composite measure of efficacy
* ITT analysis, based on minimum 3-pt drop in Lequesne Index in the presence of an overall judgment of efficacy by the investigator rated “good” or “moderate” ** Mn ± SD or SEM; NSD: non-significant difference; USPSTF: U.S. Preventive Services Task Force

Table 54. Adverse events associated with glucosamine treatment in placebo-controlled RCTs that meet protocol selection criteria Study
Summary
Tx/Pl (p-value)
CV No.
Tx/Pl
Local Skin No.
Tx/Pl
Headache No.
Tx/Pl
MS No.
Tx/Pl
GI Tract No.
Tx/Pl
Nervous System
No. Tx/Pl
Respiratory Tract No.
Tx/Pl
Urinary Tract No.
Tx/Pl
General Body No.
Tx/Pl
Misc No. Tx/Pl
Herrero-Beaumont et al., 2007
Number of adverse events in each group were similar: 89 with Pl, 96 with acetaminophen, 95 with GS, most of minor clinical significance
0/1 NR 2/4 10/5 11/16 3/5 9/9 NR NR 4/2 (gastroenteritis)
Clegg et al., 2006
77 total in 66 pts none serious, not separated by agent, described as generally mild (NSD)
NR NR NR NR NR NR NR NR NR NR
McAlindon et al., 2004
18/14 (NSD) NR NR NR 7/2 4/6 2/2 NR NR 1/1 4/3
Usha and Naidu, 2004
Totals NR, none serious enough to discontinue therapy, described as well tolerated (NSD)
NR NR NR NR > 5% pts reported
diarrhea, grp not specified
NR NR NR NR NR
Hughes and Carr, 2004
No serious events reported (NSD) NR 0/1 4/6 9/9 4/4 1/0 NR 1/0 NR 4/8 (cold/flu)
Pavelka et al., 2002
138/123 total in 202 pts, 8/10 withdrew (NSD)
23/20 10/15 NR 30/22 25/28 NR 17/7 12/11 7/6 14/14
Reginster et al., 2001
83/101 total in 212 pts, 21/18 withdrew (NSD)
21/30 4/7 6/4 NR 27/37 11/20 NR NR 10/7 NR
Das and Hammad, 2000
9/8 pts reported at least one adverse event, none judged serious (NSD)
NR NR NR 0/1 7/10 NR NR NR 1/0 3/4
Rindone et al., 2000
No serious adverse events reported, 17/11 pts reported at least one event, 2/4 pts withdrew (NSD)
X (no. NR)
X (no. NR)
X (no. NR)
NR X (no. NR)
X (no. NR)
NR NR X (no. NR)
NR
Houpt et al., 1999
12% of pts in both grps reported mild adverse events (NSD)
NR NR NR NR X (no. NR) NR NR NR NR NR
Rovati, 1997 14.8%/23.7% of pts reported an adverse event (NSD)
NR NR NR NR NR NR NR NR NR NR
Noack et al., 1994
No serious adverse events reported, 8/13 pts reported at least one event, 10/16 pts withdrew (NSD)
0/2 1/3 2/2 NR 5/6 NR NR NR NR NR
Pujalte et al., 1980
No serious adverse events reported, none withdrew, described as well tolerated
NR NR NR NR NR 0/1 NR NR NR NR
CV = cardiovascular; MS = musculoskeletal; NSD = no significant difference; NR = not reported; Pl = placebo; Tx = treatment;
102

Table 55. Adverse events associated with chondroitin treatment in placebo-controlled RCTs that meet protocol selection criteria Study
Summary
Tx/Pl (p value)
CV No.
Tx/Pl
Local Skin No.
Tx/Pl
Headache No.
Tx/Pl
MS No.
Tx/Pl
GI Tract No.
Tx/Pl
Nervous System
No. Tx/Pl
Respiratory Tract No.
Tx/Pl
Urinary Tract No.
Tx/Pl
General Body No.
Tx/Pl
Misc No.
Tx/Pl
Clegg et al., 2006
77 total in 66 pts none serious, not separated by agent, described as generally mild (NSD)
NR NR NR NR NR NR NR NR NR NR
Michel et al., 2005
87/101 pts reported an adverse event, 9/9 withdrew, but only 2 events judged related to Tx (NSD)
9/8 9/9 11/14 NR 6/17 NR 44/46 8/7 NR NR
Uebelhart et al., 2004
Minor adverse events only, 1/1 withdrew (NSD) NR NR NR NR 4/6 NR NR NR NR NR
Mazieres et al., 2001
28/21 pts reported at least one adverse event, 4/3 withdrew, none were judged related to Tx (NSD)
NR NR NR NR Tx > Pl (p=.04)
NR Tx > Pl (p=.05)
NR NR NR
Das and Hammad, 2000
9/8 pts reported at least one adverse event, none judged serious (NSD)
NR NR NR 0/1 7/10 NR NR NR 1/0 3/4
Bourgeois et al., 1998
16/12 adverse events reported, none serious, 3/3 withdrew, Tx described as well tolerated (NSD)
1/0 2/2 NR NR 11/10 NR NR NR NR 2/0
Bucsi and Poor, 1998
No serious adverse events reported, tolerance of Tx reported as excellent (NSD)
NR NR NR NR 0/1 NR NR NR NR NR
Conrozier, 1998 Tolerance reported as excellent in 90% of Tx pts, 2 (not specified) withdrew (NSD)
NR NR NR NR NR NR NR NR NR NR
Uebelhart et al., 1998
Tolerance reported as good in both grps (NSD) NR NR NR NR NR NR NR NR NR NR
L’Hirondel, 1992 No serious adverse events reported (NSD) NR NR NR NR 7/13 NR NR NR NR NR CV = cardiovascular; MS = musculoskeletal; NSD = no significant difference; NR = not reported; Pl = placebo; Tx = treatment;
103

104
Two long-term placebo-controlled RCTs of glucosamine sulfate 1,500 mg daily for 3 years in OA of the knee reported findings on glucose metabolism. During one trial (total n=202) in which diabetic patients were excluded, four developed diabetes mellitus, 3 in the placebo group and one in the glucosamine group (Pavelka, Gatterova, Olejarova, et al., 2002). Although no quantitative data were provided, the authors reported routine safety laboratory test results did not show significant differences between groups. The second RCT (n =212) excluded individuals with substantial abnormalities in hematological, hepatic, renal, or metabolic functions, which could include diabetes (Reginster, Deroisy, Rovati, et al., 2001). No change was reported in glycemic homeostasis, with fasting plasma glucose concentrations slightly lower in the glucosamine group compared to placebo. Taken together, these results show long-term ingestion of glucosamine sulfate at a dose commonly used in OA of the knee has no impact on glucose metabolism in healthy patients. They do not, however, provide information relevant to diabetic patients. A systematic review of 16 clinical studies, including 854 patients treated with glucosamine for a weighted average of 37 weeks (range 3–156 weeks), found no evidence that glucosamine ingestion is associated with significant changes in blood glucose levels (Anderson, Nicolosi, Borzelleca, et al., 2005). A second systematic review including virtually the same studies came to the same conclusion (Stumpf and Lin, 2006). The authors of that review suggest that because data on glucosamine use in patients with diabetes mellitus are limited, such patients should be closely monitored for possible changes in glucose control. In sum, available laboratory studies are short-term, whereas longer (3 years) OA efficacy trials excluded patients with metabolic disorders. Many OA RCTs presented incomplete information about adverse events, and most did not evaluate blood chemistries systematically. Therefore, no conclusions concerning metabolic effects of chronic glucosamine use in the general population can be drawn.
Results, Part II: Key Question 3 (Subgroup Analyses) Our systematic review identified two RCTs that stratified patients according to OA severity (Clegg, Reda, Harris, et al., 2006; Das and Hammad, 2000). Given the small number of cases (n=8 treatment, 13 placebo) in the severe disease category presented by Das and Hammad, we do not consider their results further. We did not identify any studies that performed subgroup analyses by age, sex, race, weight, OA diagnosis, or symptom duration. Table 56 shows subgroup results from GAIT that stratified patients according to severity of baseline WOMAC pain. GAIT used ITT analysis and the last observation carried forward method to impute missing data as needed, and defined primary outcomes as threshold response rates using the WOMAC and OMERACT-OARSI scales (Clegg, Reda, Harris, et al., 2006). An absolute increase in the response rate of 15 percent, as compared with the rate in the placebo group, was considered indicative of a clinically meaningful treatment effect. Statistical significance was defined as an α value of 0.017 for each comparison with placebo, based on an overall α value of 0.05 using a two-sided chi-square test. A clinically meaningful, statistically significant effect was observed in the primary outcome and one secondary measure (OMERACT-OARSI response rate) in patients who received glucosamine plus chondroitin compared to placebo. In the celecoxib arm the response rate for the primary outcome was not statistically different from that in the placebo arm. It did show a clinically meaningful treatment effect, defined by the investigators as an absolute increase in the

105
response rate of 15 percent. A similar pattern occurred using the OMERACT-OARSI outcome criteria. No statistically significant differences were seen when outcomes were assessed as a 50 percent decrease in WOMAC pain. Comment. The benefit of combined treatment in patients with moderate-to-severe OA of the knee requires reconciling effect magnitudes and their consistency with statistical results in the glucosamine chondroitin and celecoxib arms. Results reported for combined therapy were consistent in direction, and of sufficient magnitude to reach statistical significance, based on the primary outcome (20 percent decrease in WOMAC pain score) or the secondary outcome (OMERACT-OARSI response rate). The direction and magnitude of effect in the celecoxib controls are consistent with clinical benefit, whether scored according to the primary outcome or the OMERACT-OARSI response criteria. The failure of the primary outcome to reach statistical significance in this arm may be explained by insufficient study power due to the relatively small numbers of patients. Overall, the GAIT subgroup data suggest, but do not prove, combination glucosamine chondroitin therapy provides clinically meaningful improvement in patients with moderate-to-severe pain of OA of the knee. Table 56. GAIT Patients with moderate-to-severe pain (WOMAC pain score 301–400)
Primary Outcome Secondary Outcomes Intervention 20% decrease in
WOMAC pain score, % (n)
p value OMERACT-OARSI response, % (n)
p value 50% decrease in WOMAC pain score, % (n)
p value
Placebo 54.3% (38/70) 48.6% (34/70) 32.9% (23/70) Glucosamine 65.7% (46/70) p=.17 65.7% (46/70) p=.04 41.4% (29/70) p=.29 Chondroitin 61.4% (43/70) p=.39 58.6% (41/70) p=.24 35.7% (25/70) p=.72 Glucosamine plus Chondroitin
79.2% (57/72) p=.002** 75% (54/72) p=.001† 52.8% (38/72) p=.02*
Celecoxib 69.4% (50/72) p=.06 66.7% (48/72) p=.03* 45.8% (33/72) p=.11 *p<.05 for the comparison with placebo †p<.017 for the comparison with placebo WOMAC = Western Ontario and McMaster Universities; OMERACT-OARSI = Outcomes Measures in Rheumatology Clinical Trials-Osteoarthritis Research Society
In summary, we sought prospective subgroup analyses from RCTs. No analyses, other than described above, were found.
Results, Part II: Key Question 4 (Comparative Outcomes) In our systematic review, we did not find any direct comparative studies in which glucosamine, chondroitin, or glucosamine plus chondroitin were compared with arthroscopy or viscosupplementation to treat OA of the knee. Therefore, no conclusions can be drawn concerning comparative efficacy.

106
Conclusions: Part II
1. What are the Clinical Effectiveness and Harms of Enteral Glucosamine and Chondroitin Given Alone or in Combination, in Patients With Primary OA of the Knee?
• The best available evidence found that glucosamine hydrochloride, chondroitin sulfate,
or their combination provide no clinical benefit in patients with primary OA of the knee.
The best evidence comes from the Glucosamine/Chondroitin Arthritis Intervention Trial (GAIT; Clegg, Reda, Harris, et al., 2006), a large (n=1,583), good quality, NIH-funded, multicenter RCT. GAIT compared glucosamine hydrochloride, chondroitin sulfate, or the combination of these agents, with placebo or celecoxib in patients with primary osteoarthritis of the knee. After 24 weeks of treatment, ITT analysis showed no significant difference in symptomatic relief between glucosamine hydrochloride, chondroitin sulfate, or glucosamine hydrochloride plus chondroitin sulfate compared to placebo. Substantiating this result was that celecoxib, the active control, was effective. • Five of six MAs concluded that glucosamine or chondroitin were superior to placebo.
However, the MA results do not outweigh the GAIT results due to lower quality of the primary literature and small differences reported.
Six study-level MAs assessed glucosamine or chondroitin in OA of the knee. All but one of the MAs reported statistically significant differences between treatment and placebo. However, these MAs had limitations in the quality of the primary studies that were pooled. Limitations of the primary literature included small study size, inclusion of studies that assessed joints other than knee, and failure to report intent to treat analysis. In general, the MAs did not perform adequate quality appraisal of the primary studies. • Glucosamine sulfate has been reported to be more effective than glucosamine
hydrochloride, but the evidence is insufficient to draw conclusions. A subgroup analysis in the largest MA (Towheed, Maxwell, Anastassiades, et al., 2006) showed a statistically significant pooled effect from 7 RCTs favoring glucosamine sulfate in studies that involved Rotta Research Laboratorium, in contrast to no effect for 8 non-Rotta RCTs. Because the pooled estimate for the Rotta studies was accompanied by substantial heterogeneity secondary to elements of study design and analysis, patient samples, and routes of administration, there is a considerable degree of uncertainty in that result. The results of GUIDE (Herrero-Beaumont, Roman, Trabado, et al., 2007), a European placebo-controlled RCT (n=318), also sponsored by Rotta, seemingly support the effectiveness of glucosamine sulfate. To date, no independent studies of the Rotta glucosamine sulfate formulation have been conducted. While the overall results of GAIT show no benefit, in the subgroup of knee OA patients with moderate-to-severe pain at baseline, the combination of glucosamine hydrochloride and chondroitin sulfate significantly improved pain. Together, this evidence suggests an independent trial of glucosamine sulfate would be useful to definitively establish whether there is benefit.

107
• In general, adverse events with glucosamine or chondroitin treatment were no greater than placebo. No conclusions concerning metabolic effects of chronic glucosamine use in the general population can be drawn.
Adverse events reported in the literature included nausea, diarrhea, headache, musculoskeletal complaints, and others. There were no significant differences between placebo and treatment. There has been some concern from in vitro and preclinical studies that glucosamine supplementation could have a deleterious effect on glucose metabolism and glycemic control. However, available clinical studies are short-term, or if longer (3 years) excluded patients with metabolic disorders.
2. What are the Clinical Effectiveness and Harms of the Interventions of Interest in Patients With Secondary OA of the Knee? We identified no studies that enrolled patients with only secondary OA of the knee, or that reported separately on secondary OA of the knee. Therefore, no conclusions can be drawn about treatment outcomes in patients with secondary OA of the knee. 3. How do the Short-Term and Long-Term Outcomes of the Interventions of Interest Differ by the Following Subpopulations: Age, Race/Ethnicity, Gender, Primary or Secondary OA, Disease Severity and Duration, Weight (Body Mass Index), and Prior Treatments? GAIT found that glucosamine plus chondroitin produced a statistically and clinically significant improvement of pain in patients with moderate-to-severe pain from OA of the knee at baseline. Although the effect of celecoxib treatment in a similar group of patients was not statistically significant, the magnitude and direction of the response were consistent with clinical benefit. The nonsignificant statistical result in the celecoxib arm may be a function of insufficient power due to the small number of patients. Although this subgroup analysis was not explicitly prespecified in the GAIT protocol, the stratified randomization by disease severity yields statistically valid comparisons. A trial of glucosamine sulfate would be useful to definitively establish whether there is benefit 4. How do the Short-Term and Long-Term Outcomes of the Interventions of Interest Compare for the Treatment of Primary OA of the Knee; and Secondary OA of the Knee? We did not find any direct comparative studies in which glucosamine, chondroitin, or glucosamine plus chondroitin were compared with arthroscopy or viscosupplementation to treat OA of the knee. Therefore, no conclusions can be drawn concerning comparative efficacy.

108
Part III: Arthroscopy Effectiveness and Harms Literature Overview
The effectiveness of arthroscopic lavage and debridement can be evaluated using several study designs. Placebo-controlled randomized, controlled trials (RCTs) could address whether arthroscopic lavage and debridement achieve results surpassing placebo. Placebo-controlled RCTs for surgical procedures can be especially difficult to execute because investigators may have ethical concerns about sham procedures and patients may be reluctant to participate. RCTs comparing an intervention with an active control treatment may receive greater acceptance by clinicians and patients. The key strength of RCTs generally concerns control for confounding and several sources of bias. Well-conducted subgroup analyses from RCTs can reveal whether the effects of an intervention differ according to particular patient characteristics. Quasi-experimental designs are controlled studies that do not assign patients randomly and are more susceptible to confounding.
Uncontrolled studies, such as administrative database analyses and case series provide weaker evidence. Administrative databases can give a broader view of outcomes of interventions in everyday practice, compared to the tightly controlled conditions of an RCT. However, administrative database analyses can be flawed by poor data quality and unmeasured variables. Case series are a weak design for evaluating effectiveness due to lack of comparison groups and failure to control for placebo effects. Despite weaknesses, evidence from uncontrolled studies can support inferences about effectiveness, particularly when studies use high quality methods and the effects are large enough to exceed potential biases and nonspecific effects. Studies of different designs were sought to examine whether outcomes differed by subgroups, particularly primary versus secondary osteoarthritis (OA) of the knee and those with mechanical versus loading symptoms. This review of arthroscopic lavage and debridement will address evidence from different study designs in turn. Results, Part III: Key Questions 1 and 2 Placebo-Controlled RCT Evidence. Study Characteristics. The key study in this review is the blinded placebo-controlled randomized trial (Tables 57–62) conducted by Moseley, O’Malley, Petersen, et al. (2002). This trial randomized 180 patients to three groups (Table 57): (1) placebo (P, n=61), or sham arthroscopy; (2) arthroscopic lavage (L, n=59); and (3) arthroscopic debridement (D, n=60). It should be noted that debridement was accompanied by lavage, so the intervention groups consisted of lavage with or without debridement. All procedures were conducted by a single highly experienced surgeon at the Houston Veterans Affairs Medical Center (Table 58). Randomization was stratified within three OA disease severity groups: mild, moderate, and severe. The primary hypothesis was that patients in the intervention groups would report the same amount of knee pain at 2 years as patients in the placebo group.
Patients appear comparable at baseline on age, sex, race, preoperative disease severity, pain, function, Knee Society Clinical Rating Scale symptoms and function; psychological attributes and type of analgesic use (Table 59). The sample seems somewhat younger (means in the three

109
groups between 51 and 54 years) and more male (93 percent) than the overall population of OA patients. Table 57. Arthroscopy placebo-controlled RCT, sample selection
Study Inclusion Exclusion n, Enrolled n, Withdrawn n, Outcome Evaluated
Moseley et al., 2002 Hypothesis: pts in the L and D groups would have same amount of knee pain at 2 yrs as P pts
10/95 – 9/98; pts recruited from Houston VAMC; < 75 yo; OA of knee by ACR definition; at least moderate pain (VAS > 4) despite maximal medical treatment for > 6 mo; no arthroscopy in previous 2 yrs; study knee was that with greatest pain-induced limitation of function; randomization to 1 of 3 groups (debridement-D, lavage-L, placebo-P) stratified by 3 levels of severity of OA; used sealed, sequentially numbered envelopes handed to surgeon in operating suite, treatment assignment not revealed to patient; randomization stratified within 3 OA severity grades (1-3, 4-6, 7-8)
Severity grade >9/12; severe deformity; serious medical problems
Of 324 consecutive pts who met inclusion criteria, 144 (44%) declined to participate (participants were significantly younger, more likely to be white and had more severe OA). n=180 L: 61 D: 59 P: 60 Trial designed to have 90% power to detect 0.55 effect size between P and L+D on SF-36-P at 2 yrs, n=180 and < 16 pts lost to F/U
2 yrs: L: 6 D: 6 P: 5
2 yrs: L: 55 D: 53 P: 55
Table 58. Arthroscopy placebo-controlled RCT, interventions
Study Intervention Prior Treatments Concurrent Treatments
Moseley et al., 2002
One surgeon performed all procedures; D and L pts received general anesthesia; P pts received IV tranquilizer and opioid and spontaneously breathed oxygen-enriched air; L pts were irrigated with 10 L of fluid, anything that could be flushed through cannulas was removed, debridement among L pts only performed to resect portion of mechanically important unstable tears of the meniscus; D pts received lavage, rough articular cartilage was shaved, loose debris removed, all torn or degenerated meniscal fragments trimmed, remaining meniscus smoothed to a firm and stable rim, no abrasion arthroplasty or microfracture, bone spurs typically not removed except spurs from tibial spine area; P pts received 3 1-cm incisions in the skin, surgeon asked for all instruments and manipulated the knee as if arthroscopy was being performed; saline was splashed to simulate sound of lavage, no instruments entered portals, P pts kept in operating room for amount of time required for debridement, P pts spent night in hospital cared for by nurses unaware of group assignment
Maximal medical treatment for >6 mo
Postop all pts received the same walking aids, graduated exercise program, and analgesics

110
Table 59. Arthroscopy placebo-controlled RCT, patient characteristics
Study Age Percent Female Race (%)
Preoperative Disease
Severity (%) Pain Function Other
Characteristics Moseley et al., 2002
L: mn 51.2, sd 10.5 D: mn 53.6, sd 12.2 P: mn 52.0, sd 11.1
L: 12 D: 3 P: 7
W/B/O L: 59/31/10 D: 61/22/17 P: 60/32/8
Mild/mod/sev L: 28/46/26 D: 31/46/24 P: 28/47/25
Mn KSPS pain L: 50.2 D: 51.4 P: 49.4
Mn KSPS function L: 62.4 D: 57.6 P: 62.2
Analgesic use (OTC/Rx) L: 67/21 D: 64/15 P: 70/22
KSPS: Knee-Specific Pain Scale; mn: mean; OTC: over the counter; sd: standard deviation The report provides no information on the proportions of primary versus secondary OA in this sample. Blinding of patients to treatment was effective (similar percentages in placebo and intervention groups guessed they received placebo). Outcome was assessed by study personnel unaware of group assignment; the operating surgeon did not participate in any way.
The primary outcome (Table 60) was 24-month Knee-Specific Pain Scale (KSPS), created for the study (0–100), and subsequently validated (O’Malley, Suarez-Almazor, Aniol et al., 2003). Secondary outcomes included the pain subscale of the Arthritis Impact Measurement Scales (AIMS2-P); the pain subscale of SF-36(-P); the walking-bending subscale of AIMS2-P (-WB); the physical subscale of SF-36(-PF); and an investigator-devised Physical Functioning Scale (PFS, time to walk 30 m and ascend and descend a flight of stairs). All measures were scored on or transformed to a 0-100 scale, with higher scores being worse. Followup points were 2 weeks, 6 weeks, 3 months, 6 months, 12 months, 18 months and 24 months. Table 60. Arthroscopy placebo-controlled RCT, outcome assessment
Study Outcomes Assessed Response Criteria Observer F/U Moseley et al., 2002
Primary: 24 mo Knee-Specific Pain Scale (KSPS) created for the study (0-100); Secondary: pain subscale of Arthritis Impact Measurement Scales (AIMS2-P); pain subscale of SF-36(-P); walking-bending subscale of AIMS2-P(-WB); physical subscale of SF-36(-PF); investigator-devised Physical Functioning Scale (PFS, time to walk 30 m and climb up and down flight of stairs as quickly as possible); all measures transformed to 0-100 scale; guess which procedure was performed
Results viewed with respect to minimal important difference (MID) using stratified central tendency approach against change rating external criterion level described as somewhat better (or worse) and much better (or worse), and standard error of measurement-based method.
Study personnel unaware of group assignment, operating surgeon did not participate in any way
2 wk, 6 wk, 3 mo, 6 mo, 12 mo, 24 mo
The primary statistical analyses were based on followup scores although change scores were
also analyzed and the results did not differ. Two-sided p values were used, which were not adjusted for multiple comparisons. If evidence of superiority of interventions over placebo was lacking, equivalence analyses were to be performed using the minimal important difference, calculated by both the standard error of measurement and the mean change score among patients rated as somewhat or much better or worse on an external criterion global change scale.
On the U.S. Preventive Services Task Force quality rating system (Table 61), the Moseley, O’Malley, Petersen, et al. (2002) study rated favorably on the all of the following dimensions: initial assembly of comparable groups; low loss to followup (about 12 percent at 1 year and 2 years), maintenance of comparable groups; measurements reliable, valid, equal; interventions comparable/clearly defined; and appropriate analysis of results.

111
Table 61. Arthroscopy placebo-controlled RCT, study quality assessment
Study
Initial Assembly of Comparable
Groups
Low Loss to Followup,
Maintenance of Comparable
Groups
Measurements Reliable, Valid,
Equal*
Interventions Comparable/
Clearly Defined
Appropriate Analysis of
Results Overall Rating
Moseley et al., 2002 Y Y Y Y Y Good Results. On superiority analyses conducted by Moseley and co-workers (Table 62), at no followup time did either the lavage or debridement groups achieve significantly better mean outcomes than placebo on any of the 6 efficacy outcomes. Only 1 comparison after 2 weeks achieved statistical significance: at 1 year, the placebo group had significantly better time to walk 30 meters and scale a flight of stairs than the debridement group. The mean number of seconds on the 1 year Physical Function Scale (± standard deviation [SD]) was 45.6 (± 10.2) in the placebo group and 52.5 (± 20.3) in the debridement group (p=0.04). Of the 84 comparisons for equivalence, the minimal important difference was excluded from confidence intervals in 72.
Moseley and colleagues (2002) presented limited adverse events data, stating that there were only two minor complications: incisional erythema in one patient and in another, calf swelling with venography negative for thrombosis. The authors of this RCT concluded it “provides strong evidence that arthroscopic lavage with or without debridement is not better than and appears to be equivalent to a placebo procedure in improving knee pain and self-reported function.” Comment. The RCT by Moseley, O’Malley, Petersen, et al. (2002) provides the most important evidence on the outcomes of arthroscopic lavage and debridement for OA of the knee. The trial was rated as being good in quality, but was limited by uncertainty about generalizability due to inclusion of a single surgeon and a single clinical center. However, placebo-controlled, well-designed and well-conducted RCTs of surgical procedures are rarities that offer valuable information. These authors found no differences between placebo and arthroscopic interventions past 2 weeks of followup. Absent other placebo-controlled RCTs, evidence is lacking to show that arthroscopic lavage with or without debridement have effects above those of placebo.
Numerous critiques of the Moseley trial have been published (Laskin and Ohnsorge, 2005; Blacher, 2002; Chambers and Schulzer, 2002; Chambers, Schulzer, Sobolev et al., 2002; Ewing and Ewing, 2002; Felson and Buckwalter, 2002; Johnson, 2002; Lubowitz, 2002; Poehling, 2002). The trial authors responded to some of these comments (Wray, Moseley, O’Malley, 2002). Critical comments fall into three main areas: insufficient description of the patient sample; a patient sample that is unrepresentative of the population with OA of the knee; and problems with outcome assessment and data analysis.
Several authors noted that the RCT patient sample was not well characterized. Information was lacking on the following variables: proportions of primary and secondary OA; knee range of motion; body weight; effusion; disability and worker’s compensation status; presence of mechanical symptoms; classification of preoperative radiographs and arthroscopic OA stage and pathologic details. Chambers, Schulzer, and Sobolev (2002) stated that inclusion and exclusion criteria were not well defined. Regarding the representativeness of the patient sample, the subjects in the RCT were clearly all veterans, fairly young, and a higher proportion of males compared to the general population with OA of the knee. The low participation rate (56 percent) led Lubowitz (2002) to speculate that

Table 62. Arthroscopy placebo-controlled RCT, results
Study Outcome F/U Group n mn (sd) p value (vs.
placebo) Outcome F/U Group n mn (sd) p value (vs.
placebo) Moseley et al., 2002
KSPS-Pain 6 mo L 59 53.2 (22.6) 0.17 D 56 50.0 (21.0) 0.55 P 57 47.6 (20.7) 1 yr L 57 54.8 (19.8) 0.14 D 50 51.7 (22.4) 0.51 P 53 48.9 (21.9) 18 mo L 56 51.1 (22.7) 0.78 D 51 50.7 (25.3) 0.73 P 52 52.4 (22.4) 2 yr L 55 53.7 (23.7) 0.64 D 53 51.4 (23.2) 0.96 P 55 51.6 (23.7) AIMS2-WB 6 mo L 59 48.7 (31.6) 0.94 D 55 52.5 (28.7) 0.51 P 57 49.1 (25.8) 1 yr L 57 49.6 (29.1) 0.98 D 51 56.4 (28.4) 0.19 P 54 49.4 (25.5) 18 mo L 57 50.5 (28.5) 0.34 D 51 53.1 (29.3) 0.66 P 52 55.6 (26.6) 2 yr L 56 51.1 (28.3) 0.61 D 53 56.4 (29.4) 0.64 P 55 53.8 (27.5) AIMS2-P 6 mo L 59 54.8 (21.6) 0.23 D 55 52.2 (20.8) 0.60 P 57 50.0 (20.7) 1 yr L 57 57.8 (23.5) 0.34 D 51 53.3 (25.4) 0.95 P 54 53.6 (22.1) 18 mo L 57 55.4 (24.6) 0.95 D 51 50.7 (24.4) 0.30 P 52 55.6 (23.6) 2 yr L 56 56.7 (24.1) 0.37 D 53 54.0 (23.3) 0.75 P 55 52.5 (25.1)
PFS 6 mo L 52 49.4 (20.4) 0.47 D 54 49.8 (17.4) 0.34 P 54 47.0 (13.0) 1 yr L 54 50.4 (17.6) 0.09 D 47 52.5 (20.3) 0.04* P 49 45.6 (10.2) 18 mo L 49 51.2 (18.8) 0.41 D 44 52.8 (20.9) 0.23 P 46 48.5 (12.4) 2 yr L 50 53.2 (21.6) 0.13 D 44 52.6 (16.4) 0.11 P 44 47.7 (12.0) SF-36-P 6 mo L 59 46.0 (22.0) 0.95 D 55 45.1 (20.6) 0.80 P 57 46.3 (26.4) 1 yr L 57 42.8 (21.2) 0.86 D 51 44.5 (24.3) 0.84 P 54 43.6 (24.8) 18 mo L 57 44.4 (24.9) 0.45 D 51 46.8 (22.8) 0.20 P 52 40.8 (24.9) 2 yr L 57 44.4 (22.4) 0.63 D 52 45.0 (23.0) 0.56 P 55 42.3 (24.2) SF-36-PF 6 mo L 59 53.4 (27.6) 0.32 D 55 51.0 (25.9) 0.60 P 57 48.4 (25.9) 1 yr L 57 50.0 (28.0) 0.90 D 50 47.3 (27.1) 0.69 P 54 49.3 (24.5) 18 mo L 57 47.0 (28.8) 0.68 D 51 50.9 (26.1) 0.73 P 52 49.1 (25.0) 2 yr L 57 50.9 (27.3) 0.71 D 52 47.9 (26.6) 0.83 P 54 49.0 (27.2)
AIMS2-P: pain subscale of the Arthritis Impact Measurement Scales; AIMS2-WB: walking-bending subscale of AIMS2 scale; KSPS: Knee-Specific Pain Scale; PFS: Physical Functioning Scale (time to walk 30 m and ascend and descend a flight of stairs; SF-36-P: pain subscale of the SF-36 health-related quality of life scale; SF-36-PF: physical function subscale of the SF-36 health-related quality of life scale
112

113
Moseley’s patients may have had a different prognosis than the general population with OA of the knee and they may have been more susceptible to the placebo effect. Ewing and Ewing (2002) mentioned that patient selection should have been based on plain-film radiography during posterior-anterior flexion in a position of weight bearing. Johnson (2002) noted that the Moseley RCT included patients who were contraindicated for arthroscopy, including patients presenting only because of pain, as well as those with nonreactive joint, multiple compartment involvement, angulatory deformity, and noncompliance with non-weight-bearing for at least 1 month.
Several comments focused on outcome assessment and data analysis. It was noted that the primary outcome, the Knee Specific Pain Scale, had not been validated. However, a subsequently published study demonstrated that it has good psychometric qualities (O’Malley, Suarez-Almazor, Aniol et al., 2003). Estimation of sample size was based on the SF-36 pain subscale at 90 percent power to detect a moderate effect size, but that was not the primary outcome, so the trial does not have the stated level of power for the primary outcome. Chambers, Schulzer, and Sobolev (2002) observed that the trial was designed to test the superiority of interventions over placebo, but it was converted to an equivalence trial and that equivalence trials tend to require larger samples to achieve comparable power. They calculated power levels across outcomes and comparisons, finding that it ranged from 14 percent to 70 percent. They also argued that the minimal important difference should have been determined a priori and not based on trial data.
The trialists responded to critics by clarifying that 172 of 180 patients had one or more mechanical symptoms and that alignment was assessed preoperatively with plain-film radiography during posterior-anterior flexion in a position of weight bearing. The authors performed subgroup analyses on OA stage, alignment and mechanical symptoms, finding no differences in results by subgroup. Regarding the preponderance of men in the sample, the trialists cite the comment by Felson and Buckwalter (2002) that there is no basis in data to suspect that the effect of intervention depends on sex. The trialists argued that the selected patients were highly representative of those receiving arthroscopy. In response to speculation that subgroups may benefit from arthroscopic intervention, they challenge investigators to collect evidence from placebo-controlled trials among specific subpopulations.
With regard to equivalence comparisons, Moseley and colleagues found that the minimal important difference was excluded from confidence intervals in nearly all instances, suggesting equivalence between arthroscopy and placebo in this trial. In response to whether they provided an unbiased estimate of the minimal important difference, the trialists noted the lack of sufficient previously published studies quantifying it, and that the quantity used in equivalence analyses was the midpoint of literature-based and trial data-based estimates. Complaints about low power to find equivalence are misplaced because the Moseley trial found equivalence in the vast majority of comparisons. Moreover, findings of equivalence have more than statistical relevance, they suggest that arthroscopic lavage and debridement are no better than a placebo intervention involving merely incisions. Evidence of superiority over placebo should be the standard to judge arthroscopy. Non-Placebo RCT Evidence. Study Characteristics. Appendix C*, Table IIIA shows 8 RCTs that included either arthroscopic lavage or debridement among interventions being compared, but they made comparisons that are not of interest to this Evidence Report. Three RCTs make relevant comparisons. Merchan and Galindo (1993) compared groups treated with arthroscopic debridement plus physical therapy and nonoperative conservative treatment, * Appendixes cited in this report are available electronically at http://www.ahrq.gov/clinic/tp/oakneetp.htm

114
consisting of NSAIDs along with a decrease in the intensity of activities of daily living (ADLs) plus physical therapy. Chang, Falconer, Stulberg, et al. (1993) compared arthroscopic lavage and debridement with closed needle lavage. This study used closed needle lavage as a control intervention to offset placebo effects and to control for the lavage component of arthroscopic treatment. Forster and Straw (2003) randomized patients to arthroscopic lavage and debridement or intra-articular Hyalgan®. It should be noted that the Forster and Straw trial is the only study meeting selection criteria for this Evidence Report’s Key Question 4, concerning the comparative short-term and long-term outcomes of viscosupplements, glucosamine and chondroitin, or arthroscopic lavage and debridement. The trial by Forster and Straw will be discussed separately, following discussion of Key Questions 1–3. Summary information is presented for Merchan and Galindo (1993) and Chang, Falconer, Stulberg et al. (1993) below on sample selection (Table 63), patient characteristics (Table 64), interventions (Table 65) and study quality (Table 66). Table 63. Arthroscopy non-placebo RCTs, sample selection
Study Inclusion Exclusion n, Enrolled n,
Withdrawn n, Outcome Evaluated
Merchan and Galindo, 1993 AD+PT vs. Conservative treatment (Cons): NSAID+↓ADLs+PT
Sedentary patients >50 yrs of age with painful limited degenerative OA of the femorotibial (FT) joint, as assessed by preoperative radiographs showing minimal joint space narrowing
Duration of pain >6 mos, weight >85 kg in men and >70 kg in women, history of previous knee surgery, appreciable joint instability or angular deformity (varus/valgus) >15 degrees, femoropatellar joint involvement
AD+PT:40 Cons: 40
AD+PT: 5 (died) Cons: 2 (died)
AD+PT:35 Cons: 38
Chang et al., 1993 ALD vs. needle lavage (NL)
Persistent knee pain >3 mo, despite conservative medical/ rehabilitation manage-ment, unacceptable restrictions in work/ athletic/self-care activities; `Kellgren- Lawrence grade 1-3; age >20 yrs; will to attend 3 mo/12 mo followup
Knee surgery <6 mo; total knee replacement; concurrent illness that would influence functional assessment of knee/ preclude arthroscopic surgery; Kellgren-Lawrence grade 4
ALD: 19 NL: 15
ALD: 1 NL: 1 (both inter-current medical problems)
ALD: 18 NL: 15
Table 64. Arthroscopy non-placebo RCTs, patient characteristics
Study Age %
Female OA Duration
(months) Preoperative OA Severity
Pain
Function
Merchan and Galindo, 1993 AD+PT vs.Cons
AD+PT: mn 57.1 Cons: mn 56.9
AD+PT: 80 Cons: 66
HSS Knee Rating Score AD+PT: mn 26.85 Cons: mn 29.86
Chang et al., 1993 ALD vs. NL
ALD: mn 61, sd 11 NL: mn 65, sd 13
ALD: 72 NL: 71
ALD: mn 51, sd 51 NL: mn 53, sd 57
Kellgren-Lawrence %I/II/III ALD: 22/28/50 NL: 14/36/50
AIMS (0-1) ALD: mn 6.5, sd 2.0 NL: mn 6.1, sd 2.1
AIMS Physical Function (0-10) ALD: mn 2.3, sd 1.6 NL: mn 1.7, sd 1.0

115
Table 65. Arthroscopy non-placebo RCTs, interventions Study Interventions Prior
Treatments Concurrent Treatments
Merchan and Galindo, 1993 AD+PT vs. Cons
AD+PT: debridement of synovial tissue, partial meniscectomy, osteophytectomy, removal of loose bodies, limited chondroplasty, no abrasion; physical therapy (PT) 4 wks postop Cons: conservative (nonoperative) treatment with NSAIDs, ↓ in ADLs, PT as in AD+PT group
AD+PT: compression bandage, early exercises, motion, weight bearing as tolerated
Chang et al., 1993 ALD vs. NL
ALD: general anesthesia, continuous saline lavage, debridement of torn meniscus, removal of meniscal, anterior cruciate ligament fragments, removal of proliferative synovium, excision of loose articular cartilage fragments, no drilling NL: closed needle tidal lavage, 1 liter saline, local anesthesia
Conservative medical and rehabilitation management
Non-narcotic analgesics, physical therapy
Table 66. Arthroscopy non-placebo RCTs, study quality
Study
Initial Assembly of Comparable
Groups
Low Loss to Followup,
Maintenance of Comparable
Groups
Measurements Reliable, Valid,
Equal*
Interventions Comparable/
Clearly Defined
Appropriate Analysis of
Results Overall Rating
Merchan and Galindo, 1993 AD+PT vs. Cons
? Y N Y Y Poor
Chang et al., 1993 ALD vs. NL ? Y Y Y Y Fair
Merchan and Galindo (1993) randomized 40 patients each to arthroscopic debridement plus
physical therapy and nonoperative conservative therapy. Seven patients died and were excluded from data analysis, five in the arthroscopy group and two in the conservative treatment group. Arthroscopic debridement included excision of synovial tissue, partial meniscectomy, osteophytectomy, removal of loose bodies, limited chondroplasty and no abrasion. Patients over 50 years of age were included for painful limited OA and minimal joint space narrowing on preoperative radiography. Groups were comparable at baseline on age, percent female and Hospital for Special Surgery (HSS) knee score; however, information is lacking on duration of disease, and body weight. Mean followup was 25 months in the arthroscopy group and 23 months in the conservative treatment group. Outcome measures were the followup HSS score, change in HSS and patient global change assessment. This trial was rated as poor in quality due to incomplete information about comparability of groups at baseline, use of an outcome of uncertain validity and lack of a blinded outcome assessor.
Chang, Falconer, Stulberg et al. (1993) randomized 34 patients to either arthroscopic lavage and debridement or closed needle lavage. One patient in each group dropped out for intercurrent medical problems so the analysis was based on 32 patients. Arthroscopic procedures entailed removal of loose tissue fragments, partial meniscectomy, synovectomy, excision of loose articular cartilage and no drilling. Closed-needle lavage employed one liter of saline injected into the knee and aspirated. Patients were selected for persistent knee pain of more than three months despite conservative medical and rehabilitation management. All patients had Kellgren-Lawrence grade 1–3 osteoarthritis. Groups were well-balanced at baseline on age, percent female, duration of knee pain, osteoarthritis grade and several pain and function scales. Outcome scales measured at 3 months and 12 months included the AIMS subscales, 50-foot

116
walk time, patient global assessment and physician percent improvement. Patients were not blinded to group assignment but outcome assessors were. The quality of the trial was rated as fair because of uncertainty about whether allocation to groups at randomization was concealed. Results. Table 67 summarizes results from Merchan and Galindo (1993) and Chang, Falconer, Stulberg, et al. (1993). In the former trial, the group receiving arthroscopic debridement plus physical therapy had significantly better results than the conservative treatment group on followup HSS score (p=.022), change in HSS (p=.001) and patient global change assessment (p<.001). The latter trial reported no significant differences at either 3 month or 12 month followup between arthroscopic lavage and debridement and closed needle lavage on 5 AIMS subscales, 50-foot walk time, patient global assessment and physician percent improved. However, this small trial lacks sufficient statistical power to detect small or modest treatment effects. Table 67. Arthroscopy non-placebo RCTs, results
Study Outcomes Merchan and Galindo, 1993 AD+PT vs. Cons
F/U (mo) Group n mn (rng) Outcome mn p value AD+PT 35 25 (12-36) F/U HSS 37.00 0.022 Cons 38 23 (12-36) (higher=better) 32.76 AD+PT ∆ HSS 10.14 0.001 Cons (higher=better) 2.89 F/U % Improved % Unchanged % Worse p value AD+PT last 75 14 11 <0.001 Cons 16 13 53
Chang et al., 1993 ALD vs. NL
3 mo 12 mo ALD NL ALD NL Outcome mn mn Difference (95% CI) mn mn Difference (95% CI)AIMS Pain Scale 5.0 5.4 -0.4 (-1.6, 0.9) 5.3 5.0 0.3 (-1.1, 1.8) AIMS Physical Activity 5.0 6.3 -1.3 (-3.0, 0.4) 4.8 6.2 -1.4 (-3.3, 0.4) AIMS Physical Function 1.5 2.0 -0.5 (-1.2, 0.3) 1.7 2.0 -0.3 (-1.1, 0.5) AIMS Social Activity 4.3 4.7 -0.4 (-1.4, 0.7) 4.6 4.3 0.3 (-1.1, 1.5) AIMS Depression 2.7 2.5 0.2 (-0.8, 1.1) 1.8 2.6 -0.8 (-1.6, 0.1) AIMS Anxiety 3.8 3.9 -0.1 (-1.3, 1.0) 3.2 3.5 -0.3 (-1.3, 0.6) 50-ft walk time, secs 14.2 15.0 -0.8 (-2.8, 1.2) 13.9 14.1 -0.2 (-2.8, 2.3) Patient global assessment 3.4 3.6 -0.2 (-10.6, 13.8) 4.1 3.3 0.8 (-5.3, 21.2) Physician global % improved 47 46 1 (-34, 36) 41 23 18 (-15, 51)
Comment. The small, poor-quality, unblinded RCT by Merchan and Galindo (1993) does not provide strong evidence of an advantage favoring arthroscopy over nonoperative therapy. These authors found significantly better results for arthroscopic debridement plus physical therapy relative to conservative treatment comprised of NSAIDs with a decrease in ADLs plus physical therapy. However, Merchan and Galindo did not report whether groups were comparable at baseline on duration of osteoarthritis or body weight, the outcome scale is of uncertain validity and a blinded outcome assessor was not used. The small trial by Chang, Falconer, Stulberg, et al. (1993) found no differences between arthroscopic lavage and debridement and closed needle lavage on pain, function and global assessment scales. This trial does not offer support for improved outcomes when arthroscopic debridement is added to lavage of the knee.
The results of the good quality placebo-controlled Moseley, O’Malley, Petersen, et al. (2002) create uncertainty about whether arthroscopic lavage and debridement achieve results surpassing placebo. The results from Merchan and Galindo are insufficient to establish the superiority of

117
arthroscopic debridement over an active nonsurgical control therapy. The trial by Chang, Falconer, Stulberg et al. (1993) does not resolve uncertainty over the effects of arthroscopic intervention relative to placebo or active controls. Overall, the RCT evidence does not definitively show arthroscopy to be ineffective, nor does it establish effectiveness. Quasi-Experimental Evidence. Study Characteristics. A single nonrandomized comparative (quasi-experimental) study met selection criteria for this Evidence Report (Tables 68–72). It compared arthroscopic lavage plus physical therapy with physical therapy alone (Livesley, Doherty, Needoff, et al., 1991). Enrollment included 69 patients with OA of the knee and no obvious mechanical derangement of the joint. Patients were excluded if they had hematologic abnormalities, urate crystals in the joint aspirate, atypical radiologic signs and treatable lesions seen on arthroscopy (apparently referring to lesions treatable by arthroscopic debridement or partial meniscectomy). Patients were allocated to groups according to which of two surgeons they were initially referred; 41 were assigned to lavage plus physical therapy and 28 to physical therapy alone. Four patients were withdrawn from the arthroscopy group (two were lost, two underwent meniscectomy) and four patients in the physical therapy alone group were lost to followup. Arthroscopic lavage was performed with a tourniquet, two standard portals and 2 liters of normal saline. No details were provided about physical therapy. Table 68. Arthroscopy quasi-experimental study, sample selection
Study Inclusion Exclusion n, Enrolled n,
Withdrawn n, Outcome Evaluated
Livesley et al., 1991; AL+PT vs. PT pts allocated to groups according to which of 2 surgeons they were initially referred
OA of knee and pain with no obvious mechanical derangement of joint
Hematologic abnormalities; urate crystals in the joint aspirate; atypical radiologic signs; treatable lesions seen on arthroscopy
AL+PT: 41 PT: 28
AL+PT: 4 (2 lost, 2 men-iscectomy) PT: 4 (lost)
AL+PT: 37 PT: 24
Table 69. Arthroscopy quasi-experimental study, patient characteristics
Study Age %
Female
Preoperative OA Severity Other
Characteristics Livesley et al., 1991; AL+PT vs. PT
AL+PT: mn 61, sd 7.8 PT: mn 60.7, sd 7.9
AL+PT: 32 PT: 46
Thomas radiography score AL+PT: mn 5.3, sd 2.6 PT: mn 5.29, sd 2.7
Stress pain and morning stiffness worse in PT group; swelling and effusions more common in AL+PT group
Table 70. Arthroscopy quasi-experimental study, interventions
Study Interventions Prior
Treatments Concurrent Treatments
Livesley et al., 1991; AL+PT vs. PT
AL: 2 standard portals; tourniquet; Key Med Olympus arthroscope and a hook; lavage with 2 L normal saline at room temperature; PT: same regimen for both groups, no details on PT provided

118
Table 71. Arthroscopy quasi-experimental study, study quality
Study
Initial Assembly of Comparable
Groups
Low Loss to Followup,
Maintenance of Comparable
Groups
Measurements Reliable, Valid,
Equal*
Interventions Comparable/
Clearly Defined
Appropriate Analysis of
Results Overall Rating
Livesley et al., 1991; AL+PT vs. PT N N N N N Poor
Table 72. Arthroscopy quasi-experimental study, results Study Outcomes Livesley et al., 1991 AL+PT vs. PT
Investigator-devised outcome measures, 16 dimensions; -1 to +1, 3 point scale (patient global change assessment); 0-4 point scale (pain at rest, pain on activity, pain at night, joint tenderness, periarticular tenderness); 0-3 point scale (effusions); scale in minutes (duration of stiffness after rest, in the morning); scale in degrees (knee range of motion); dichotomous scale, present/absent (warmth, stress pain, wasting crepitus, sleep deprivation, swelling) F/U at 3, 6, 12 mo; 48 possible between-group comparisons of improvement in outcome (data provided for 32 comparisons) N=61 (37 AL+PT, 24 PT) Significant differences in degree of improvement, AL+PT vs. PT Outcome F/U p value pain on activity 3 mo 0.003 6 mo 0.05 pain at night 3 mo 0.01 joint tenderness 6 mo 0.02 swelling 3 mo 0.03 Subgroup analyses provided on pain at rest and pain on activity for 3 preoperative radiographic OA classes (slight, moderate, severe): significant between-group difference favoring AL+PT at 3 mo for moderate subgroup.
Patients were assessed on a large number of knee measures at baseline and followup. Pain
was of primary interest and it was rated at rest, on activity and at night. The authors assessed nine signs of inflammation, including joint tenderness, peri-articular tenderness, duration of stiffness at rest and in the morning, effusions, warmth, stress pain, sleep disturbance and swelling. Other measures included knee range of motion, the presence of wasting and crepitus and patient global change assessment at followup. Patients were comparable at baseline on age, percent female and preoperative radiographic OA severity. Information was lacking on baseline duration of osteoarthritis and body weight. There were differences between groups in baseline stress pain, morning stiffness, swelling and effusions. Using the U.S. Preventive Services Task Force rating system, the Livesley, Doherty, Needoff et al. (1991) trial was rated unfavorably on all 6 dimensions. Results. Followup was conducted at 3, 6 and 12 months. Of the 48 possible between-group comparisons, the article provides data for 32. Five comparisons revealed statistically significant results favoring arthroscopic lavage plus physical therapy: pain on activity at 3 and 6 months, pain at night at 3 months, joint tenderness at 6 months, and swelling at 3 months. Subgroup analyses were provided on pain at rest and pain on activity for three classes of preoperative radiographic OA severity (slight, moderate, and severe). The article reports a significant advantage at 3 months among moderate class patients in the lavage plus physical therapy group. In addition, presence or absence of effusion was not found to be correlated with results.

119
Comment. Livesley, Doherty, Needoff et al. (1991) conclude that their results confirm the effectiveness of arthroscopic lavage as a treatment for symptomatic OA of the knee. However, critical review of this study contradicts this view. This small study reported no significant advantage for lavage in 43 of 48 comparisons. Furthermore, it was flawed by lack of blinding, lack of data on some baseline characteristics, imbalances on baseline characteristics without corresponding adjustment in the analysis, and absence of details about physical therapy. In addition, the study does not address the possible contribution of placebo effects to the observed results. This poor-quality quasi-experimental study does not support conclusions about the relative effectiveness of arthroscopic lavage plus physical therapy and physical therapy alone. Administrative Database Evidence. Study Characteristics. The largest single source of evidence came from an administrative database, with 14,391 patients (Wai, Kreder, and Williams, 2002). This analysis was conducted within the Ontario Health Insurance Plan physician claims system between 1992 and 1996. The focus of the study was to evaluate outcome (further surgery, adverse events) and patterns of utilization across 16 intraprovincial geographic units. Claims were linked with discharge abstracts to collect outcome data. The maximum followup was 3 years. An algorithm was created to capture patients with a primary diagnosis of OA of the knee. Patients were excluded for having a primary diagnosis of rheumatoid arthritis and those with bilateral knee procedures on the same day. Data were analyzed with a Cox proportional hazards regression model. The Charlton-Deyo comorbidity index was used for adjustment purposes. Minimum age for inclusion was 50 years, the mean was 62.4 and the oldest age was 92. The proportion of females was 49.9 percent. No other patient baseline characteristics were mentioned. Details were unavailable about the arthroscopic debridement procedure. With the exception of the lack of more details describing the patients, the intervention and whether data quality was audited, this study was generally well-reported and well-conducted. No funds were received to support the study and the authors received no benefits from commercial parties. Results. Table 73 shows that the probability of repeat arthroscopy was 2.8 percent within 1 year and 7.7 percent within 3 years. Wai and co-workers also found that total knee arthroplasty was performed in 9.2 percent within 1 year and 18.4 percent within 3 years. High tibial osteotomy was performed in 1.2 percent within 1 year and 2.9 percent within 3 years. Wai, Kreder, and Williams (2002) found that all 3 types of further surgery increased significantly in frequency with age. The risk of all complications (Table 74) was 1.9 percent. Surgical complications were noted in 0.5 percent. The risk of stroke or myocardial infarction was 0.3 percent. Infections occurred in 0.5 percent and deep vein thrombosis was found in 0.6 percent. The probability of death within 3 months was 0.1 percent.
Regarding utilization, on average there were 1.4 arthroscopic debridements per 1000 individuals in Ontario between 1992 and 1996. Across this time period, there were significant increases in the age and sex-adjusted population rates, at an average rate of 10.1 percent per year. Across intraprovincial geographic units, population rates ranged between 0.7 to 2.3 persons per 1,000. Geographic units with higher rates of arthroscopic debridement were associated with higher rates of total knee arthroplasty within 1 year for patients aged 60 or older.

120
Table 73. Arthroscopy administrative database, further surgery results Study
% % % Repeat Total High Tibial Group n F/U Arthroscopy Arthroplasty Osteotomy
Wai et al., 2002; AD All pts 14391 < 1 yr 2.8 9.2 1.2 6212 < 3 yr 7.7 18.4 2.9 50-59 yo 6487 < 1 yr 3.3 4.0 1.6 2918 < 3 yr 8.9 9.7 4.2 60-69 yo 5435 < 1 yr 2.4 11.1 1.0 2354 < 3 yr 6.8 23.7 2.0 70-79 yo 2223 < 1 yr 2.2 19.0 0.4 854 < 3 yr 6.2 32.7 0.8 > 80 yo 246 < 1 yr 1.6 17.5 0.0 86 < 3 yr 8.1 31.4 0.0 Rate of total knee arthroplasties increased with age at 1 yr and 3 yrs (p=.0001); Cox's proportional hazards model adjusted analysis – age still associated (p=.02). No other significant relationships in unadjusted or adjusted analyses.
Table 74. Arthroscopy administrative database, adverse event results Study
% % % % All/Any Surgical Stroke/ Deep % Adverse Compli- Myocardial % Vein Death Events cations Infarction Infections Thrombosis <3 mo
Wai et al., 2002; AD (n=14,391)
1.9 0.5 0.3 0.5 0.6 0.1
Comment. The study by Wai, Kreder, and Williams (2002) provides estimates of the probabilities of further surgery and adverse events for the most populous Canadian province from 1992 to 1996. These data may be representative of outcomes in everyday practice, but administrative databases are also susceptible to biases of underreporting and problems in the quality of available data. Thus, it is unclear how accurately this study reflects the frequency of adverse events after arthroscopic surgery. Furthermore, this study did not report on pain or function outcomes. The report only presented significant differences in further surgery with increasing age. It included no comparison with placebo or other interventions. This administrative database analysis offers evidence of limited value to this evidence report. While it shows different rates of further surgery across age subgroups, it leaves unanswered the question of whether there are different effects in terms of other outcomes of arthroscopy versus placebo or other treatments. Case Series Evidence. Study Characteristics. The literature search revealed 17 case series (Tables 75–86; Appendix C*, Tables IIIB–IIIH) with samples of 50 or more patients, reporting outcomes after arthroscopic lavage and debridement for OA of the knee. These studies collectively included a total of 2,398 patients, with individual sample sizes ranging between 54 and 441.
Patients were selected in various ways (Table 75). Only two studies mentioned using the ACR diagnostic criteria or similar case definition criteria (Aaron, Skolnick, Reinert et al., 2006; Jackson and Dieterichs, 2003). Four studies selected patients based on intraoperative findings of arthroscopy (Bernard, Lemon, and Patterson, 2004; Linschoten and Johnson, 1997; McLaren,
* Appendixes cited in this report are available electronically at http://www.ahrq.gov/clinic/tp/oakneetp.htm

121
Blokker, Fowler, et al., 1991; Sprague, 1981). Failed response to conservative management was noted in nine studies (Aaron, Skolnick, Reinert et al., 2006; Bernard, Lemon, and Patterson, 2004; Dervin, Stiell, Rody, et al., 2003; Shannon, Devitt, Poynton, et al., 2001; Harwin, 1999; Yang and Nisonson, 1995; McLaren, Blokker, Fowler, et al., 1991; Ogilvie-Harris and Fitsialos, 1991; Bert and Maschka, 1989).
Beyond age and proportion of female patients, these patient samples were not well described (Table 76). One study reported that the mean age was 49 (Aichroth, Patel, and Moyes, 1991), while average age was in the 50s and 60s for all other studies. The proportion of women in study samples ranged from 19 percent to 67 percent; it was 50 percent or higher in six of 17 studies. Only four studies gave data on baseline body weight (Aaron, Skolnick, Reinert et al., 2006; Dervin, Stiell, Rody, et al., 2003; Shannon, Devitt, Poynton, et al., 2001; Bert and Maschka, 1989). Two studies specified whether patients had primary versus secondary OA, with both studies selecting more than 80 percent primary OA (Krystallis, Kirkos, Papavasiliou, et al., 2004; McLaren, Blokker, Fowler, et al., 1991). Four articles provided information about disease duration (Shannon, Devitt, Poynton, et al., 2001; Yang and Nisonson, 1995; Ogilvie-Harris and Fitsialos, 1991; Timoney, Kneisl, Barrack, et al., 1990). Three studies mentioned preoperative disease severity classification (Jackson and Dieterichs, 2003; Yang and Nisonson, 1995; Timoney, Kneisl, Barrack, et al., 1990), 3 studies described only arthroscopic disease severity ratings (Dervin, Stiell, Rody, et al., 2003; McGinley, Cushner, and Scott, 1999; Ogilvie-Harris and Fitsialos, 1991), and four studies provided both pre- and intra-operative information (Aaron, Skolnick, Reinert et al., 2006; Krystallis, Kirkos, Papavasiliou, et al., 2004; Bohnsack, Lipka, Ruhmann, et al., 2002; Bert and Maschka, 1989). Four articles stated that some patients had mechanical symptoms (Aaron, Skolnick, Reinert et al., 2006; Krystallis, Kirkos, Papavasiliou, et al., 2004; Dervin, Stiell, Rody, et al., 2003; Aichroth, Patel, and Moyes, 1991).
Details about arthroscopic treatment are shown in Table 77. Of the 17 studies, 13 stated that lavage with debridement were performed. Four studies described debridement procedures, but failed to mention whether lavage was also performed, although debridement without lavage is unlikely. Sixteen studies noted that trimming or shaving of loose articular cartilage (chondroplasty) was part of the treatment. Partial or total meniscectomy was performed in subsets of patient samples in all 17 studies. Partial synovectomy was an element of treatment in 11 studies and osteophytes were removed in five studies. Three studies included abrasion arthroplasty and drilling of bone occurred in two.
We applied the case series quality assessment tool developed by Carey and Boden (2003; see Methods chapter) to this group of studies (Table 78). It comprises the following 8 items: These items are relevant to external validity: a well-described study population and a well-described intervention. A well-described study population, particularly details on numbers of individuals included, excluded and lost could also reflect on bias. Other items related to bias include use of validated outcome measures (independently assessed), appropriate statistical analysis and well-described results.

Table 75. Arthroscopy case series, sample selection Study Inclusion Exclusion n, Knees n, Patients
Aaron et al., 2006, ALD Consecutive pts; met ACR OA of tibiofemoral joint; failed oral anti-inflammatory treatment; age 18-70 yo; Kellgren-Lawrence grade >2
Previous infection; OA of patello-femoral joint; other/confounding diagnoses;
110 110
Bernard et al., 2004; ALD 01/91 – 12/93; consecutive pts; knee OA (Outerbridge 3 or 4); pain uncontrolled by non-operative treatment; radiographic OA changes
100 99
Krystallis et al., 2004; ALD 02/97 – 06/01; OA of the knee; standard conservative non-operative treatment had failed; local (L), general (G) or peridual anesthesia (P)
201 197
Dervin et al., 2003; AD 03/95 – 11/97; OA of knee; 40-75 yo; remained symptomatic despite supervised PT and comprehensive medical management
Inflammatory/traumatic forms of OA;
126
Jackson and Dieterichs, 2003; ALD
01/95 – 06/97; ACR criteria diagnosis of OA of knee; Jackson and Dieterichs stage III/IV; consecutive series
Stage I and IV; marrow stimulation techniques, laser or radio-frequency chondroplasty
121
Bohnsack et al., 2002; AD 05/89 – 11/96; history of knee pain, swelling, radiological signs of severe OA (grade I-IV)
104
Shannon et al., 2001; ALD Retrospective consecutive series; mild-moderate OA over 4-yr period; symptoms not severe enough for joint replacement; conservative treatment alone had failed or non-specific mechanical symptoms out of proportion to clinical and radiologic findings
Preop clinical/radiologic diagnosis of meniscal tear or loose body
55 54
Harwin, 1999; ALD 1980 -1993; areas of fibrillated articular cartilage with exposed bone; unresponsive to all modalities of nonoperative treatment
204 190
McGinley et al., 1999; AD 1981-87; pts > 55 yo OA symptoms including pain limiting function and Albach radiographic JSN grade 2-3; > 10 yr F/U
91 77
Linschoten and Johnson, 1997; ALD
07/85 – 01/88; age > 40 yo; arthroscopically confirmed degenerative changes in > 2 of 3 compartments or single compartment Outerbridge III/IV
Arthroscopies for diagnosis or treatment of acute injuries, preliminary diagnosis of degenerative joint disease not confirmed intraoperatively
56 55
Yang and Nisonson, 1995; ALD
07/89 – 07/93; did not respond to conservative nonoperative treatment; persistent evidence of internal derangement of knee; did not show severe signs and symptoms to merit total knee arthroplasty
History of rheumatoid arthritis; gout; ochronosis; ankylosing spondylitis; hemophilia; osteonecrosis; posttraumatic or postinfectious osteoarthritis
105 103
Aichroth et al., 1991; ALD 1977 – 1988; degenerative knee joint 276 254 McLaren et al., 1991; ALD 07/82 – 07/86; OA confirmed at arthroscopy; nonoperative
treatments either did not control symptoms sufficiently to allow normal daily activities or control rest pain
Inflammatory joint disease, malunited fractures and ligamentous instability
170
122

Table 75. Arthroscopy case series, sample selection (continued) Study Inclusion Exclusion n, Knees n, Patients
Ogilvie-Harris and Fitsialos, 1991; ALD
1979 – 1987; degenerative arthritis of the knee; persistent symptoms despite adequate medical management
441
Timoney et al., 1990; ALD 07/81 – 02/86; age > 40 yo; intraoperative diagnosis of OA rheumatoid arthritis, acute infection arthritis, acute injury
111 108
Bert and Maschka, 1989; AD
09/81 – 12/82; conservative methods of treatment had failed; available for 5 yr followup
126
Sprague, 1981; ALD 08/78 – 11/79; pre- and postop moderate to extreme degenerative arthritis of 2-3 compartments; initial conservative treatment
69 63
123

Table 76. Arthroscopy case series, patient characteristics
Study Age %
Female Obesity (%)
Disease Category
(%) Disease Duration
Preoperative Disease
Severity (%)
Arthroscopic Disease
Severity (%)
Mechanical Symptoms
(%) Aaron et al., 2006; ALD
Mn 61.7 67 Mn BMI: 31.8
Kellgren-Lawrence (2/3/4) 53/29/18
Noyes-Stabler mn total 21.6
Locking or buckling: 56
Bernard et al., 2004; ALD
Mn 55, sd 13 39
Krystallis et al., 2004; ALD
L: mn 60.8, rng 31-71 G: mn 59.9, rng 30-67 P: mn 62.2, rng 35-75
49 1o: 94 2o: 6
Fairbank (0/I/II/III) 12/36/40/12
Outerbridge (I-II/III/IV) 12/28/60
Mechanical: 33
Dervin et al., 2003; AD
Mn 61.7, sd 8.6 53 BMI > 27: 67 BMI > 33: 25
Dougados Medial III/IV: 62 Lateral III/IV: 13
Giving way: 39; Locking: 22
Jackson and Dieterichs, 2003; ALD
I: mn 35.5, rng 22-60 II: mn 54, rng 26-85 III: mn 56, rng 24-78 IV: mn 64, rng 41-83
Jackson and Dieterichs (I/II/III/IV) 7/26/32/35
Bohnsack et al., 2002; AD
Mn 60, rng 50-83 52 Jaeger and Wirth III/IV
Outerbridge III/IV: 50-80%
Shannon et al., 2001; ALD
Mn 60.9, rng 48-83 56 Mn wt: 76.6 kg, rng 54-100
# mo: % < 3: 20 3-12: 43 > 12: 39
Harwin, 1999; ALD Mn 62.1, rng 32-88 57 McGinley et al., 1999; AD
Mn 62.6, rng 55-82 Outerbridge: IV: 100
Linschoten and Johnson, 1997; ALD
Mn 62.5, rng 41-79 51
Yang and Nisonson, 1995; ALD
Mn 64.2, sd 4.3 19 # mo: % < 1: 17 1-12: 62 > 12: 15
Fairbank (0/I/II/III) 15/50/24/7
Aichroth et al., 1991; ALD
Mn 49, rng 28-82 28 Instability: 54, locking: 36
McLaren et al., 1991; ALD
Mn 54, rng 23-82 30 1o: 81 2o: 19
Ogilvie-Harris and Fitsialos, 1991; ALD
Mn 58, rng 28-92 > 2 yrs in most pts
Outerbridge I-II/III/IV) 32/36/32
124

Table 76. Arthroscopy case series, patient characteristics (continued)
Study Age %
Female Obesity (%)
Disease Category
(%) Disease Duration
Preoperative Disease
Severity (%)
Arthroscopic Disease
Severity (%)
Mechanical Symptoms
(%) Timoney et al., 1990; ALD
Mn 58.1, rng 40-81 31 mn 48.9 mo, rng 2-144
0-III scale
Bert and Maschka, 1989; AD
DA mn 66, rng 46-84 D mn 61, rng 39-82
DA 46 D 42
% obese: DA 26 D 22
Ahlback II-100
Outerbridge IV: 100
Sprague, 1981; ALD Mn 56, rng 24-78 38
125
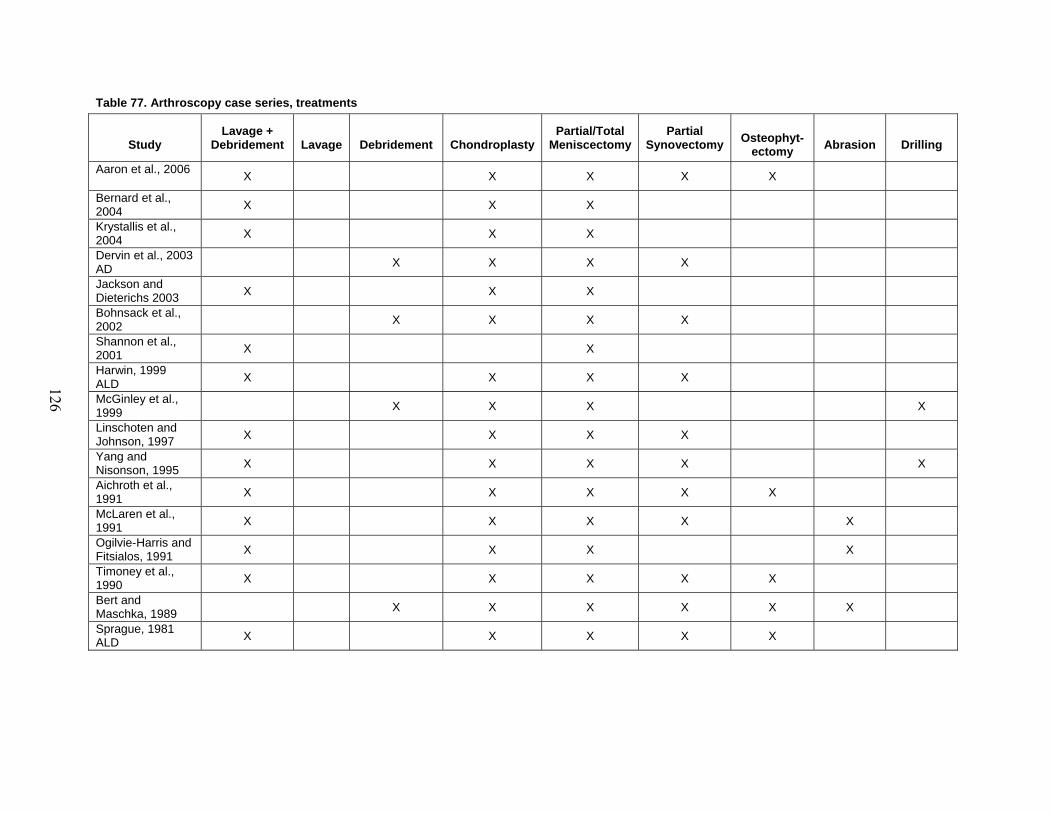
Table 77. Arthroscopy case series, treatments
Study
Lavage + Debridement
Lavage
Debridement
Chondroplasty
Partial/Total Meniscectomy
Partial Synovectomy
Osteophyt-
ectomy
Abrasion
Drilling
Aaron et al., 2006 X X X X X
Bernard et al., 2004 X X X
Krystallis et al., 2004 X X X
Dervin et al., 2003 AD X X X X
Jackson and Dieterichs 2003 X X X
Bohnsack et al., 2002 X X X X
Shannon et al., 2001 X X
Harwin, 1999 ALD X X X X
McGinley et al., 1999 X X X X
Linschoten and Johnson, 1997 X X X X
Yang and Nisonson, 1995 X X X X X
Aichroth et al., 1991 X X X X X
McLaren et al., 1991 X X X X X
Ogilvie-Harris and Fitsialos, 1991 X X X X
Timoney et al., 1990 X X X X X
Bert and Maschka, 1989 X X X X X X
Sprague, 1981 ALD X X X X X
126

Table 78. Arthroscopy case series, study quality
Study
Clearly Defined Question
Well-Described Study Population
Well-Described Intervention
Use of Validated Outcome Measures (Indepen-dently Assessed)
Appropriate Statistical Analysis
Well-Described Results
Discussion/ Conclusions Supported by Data
Funding/ Sponsorship Source Acknow-ledged
Aaron et al., 2006 + - + + (+) + - + + Bernard et al., 2004 ALD + - - + (?) + - + ?
Krystallis et al., 2004 ALD - - + ? (?) + - - ?
Dervin et al., 2003 AD + - - + (?) + - + +
Jackson and Dieterichs, 2003 ALD + - - - (?) - - + ?
Bohnsack et al., 2002 AD - - - + (?) + - - ?
Shannon et al., 2001 ALD + - + +(?) - - + ?
Harwin, 1999 ALD + - + + (?) - + - ?
McGinley et al.,1999 AD - - - -(?) - - - ?
Linschoten and Johnson, 1997 ALD - - + - (?) - - - ?
Yang and Nisonson, 1995 ALD + - + - (?) - - - ?
Aichroth et al., 1991 ALD - - + - (?) - - - +
McLaren et al., 1991 ALD + - + +(?) - - - ?
Ogilvie-Harris and Fitsialos, 1991 ALD - - - - (?) - - - ?
Timoney et al., 1990 ALD + - - ? (?) + - - +
Bert and Maschka, 1989 AD - - + ? (?) - - - ?
Sprague, 1981 ALD - - + - (?) - - - ?
127

128
1. Clearly Defined Question: Of the 17 studies, nine put forward a clearly defined question. The remainder either did not state a clear question or stated one that was beyond the reach of the case series as a study design. 2. Well-Described Study Population: None of the case series were satisfactory on this element. None clearly stated the preoperative case definition criteria for OA of the knee, although Aaron, Skolnick, Reinert et al. (2006) and Jackson and Dieterichs (2003) cited the ACR diagnostic criteria. Only two studies (Yang and Nisonson, 1995; Timoney, Kneisl, Barrack, et al., 1990) reported on all items of the minimal set of baseline patient characteristics: age, sex, preoperative disease severity and duration of disease. This element primarily influences external validity in that it is easier to generalize from a well-described study population than a poorly described population. It also reflects on internal validity to the extent that investigators provide complete accounting of participants included, excluded and lost to followup. Only six of 17 studies provided a full accounting of participant flow. 3. Well-Described Intervention: Ten studies gave sufficient descriptions of interventions. Other reports either failed to note cointerventions or did not mention whether lavage accompanied debridement. 4. Use of Validated Outcome Measures (Independently Assessed): Only one study mentioned using an independent outcome assessor (Aaron, Skolnick, Reinert et al., 2006). Thus, outcome measures could be influenced by bias due to participants and investigators. Only seven studies used validated outcome measures, including the Knee Society pain domain scale (Aaron, Skolnick, Reinert et al., 2006), Lysholm and Gillquist rating scale (Bohnsack, Lipka, Ruhmann, et al., 2002); the WOMAC and SF-36 scales (Dervin, Stiell, Rody, et al., 2003). Bernard, Lemon, and Patterson (2004) assessed Kaplan-Meier time to further major surgery. Three studies measured global patient change assessment, for which no external criterion validation is necessary (Shannon, Devitt, Poynton, et al., 2001; Harwin, 1999; McLaren, Blokker, Fowler, et al., 1991). It is unclear whether several scales have been validated, including the Duke Arthroscopy score (Shannon, Devitt, Poynton, et al., 2001), the Baumgaetner scale (Krystallis, Kirkos, Papavasiliou, et al., 2004) and the Hospital for Special Surgery rating score (Timoney, Kneisl, Barrack, et al., 1990). All other rating instruments appear to be scales devised by the study investigators having uncertain pyschometric properties. Average followup ranged from about 1 year to 13.2 years. 5. Appropriate Statistical Analysis: Six studies used appropriate statistical analyses, for example, performing prepost tests on paired data. The remaining 11 studies either reported no statistical test results or inappropriate ones. Absent statistical tests or inappropriate analyses could give a biased view of study outcomes. 6. Well-Described Results: Only one of the 17 studies (Harwin, 1999) gave well-described results, consisting of validated measures, with adequate accounting of followup; and inclusion of both potentially beneficial outcomes and adverse events. Incomplete reporting of results could lead to a biased representation of a study’s findings.

129
7. Discussion/Conclusions Supported by Data: Five articles stated conclusions that were supported by data. The other 12 articles either failed to note limitations of the data or stated conclusions that went beyond the data and design of the study. 8. Funding/Sponsorship Source Acknowledged: Only four articles mentioned whether the study was funded or if the authors had financial relationships with manufacturers.
Overall, this body of case series evidence is of poor quality. The best-rated studies (Aaron,
Skolnick, Reinert et al., 2006; Dervin, Stiell, Rody, et al., 2003) were favorable on 6 of 8 items. Only three studies (Bernard, Lemon, and Patterson, 2004; Shannon, Devitt, Poynton, et al., 2001; Harwin, 1999) were rated favorably on four out of the eight items in the Carey and Boden scale. Two studies (Yang and Nisonson, 1995; McLaren, Blokker, Fowler, et al., 1991) rated well on three of eight items. Ten other case series were rated favorably on two or fewer items. Bias is a particular concern in that only six studies give a full accounting of participant flow, no study used an independent outcome assessor, and only one study presented well-described results. Lack of an independent assessor, in all but one study, is perhaps the most important factor given that the outcomes generally assessed, pain, function and global result, are subjective and susceptible to bias and placebo effects. Results. Only two studies used validated multidimensional outcome scales (Table 79). Bohnsack, Lipka, Ruhmann, et al. (2002) used the Lysholm and Gillquist scale in 104 patients, finding significant improvement in scores after an average of 5.4 years. Dervin, Stiell, Rody, et al. (2003) reported that 44 percent of 126 patients achieved a minimal clinically important improvement on the WOMAC scale at 2 years. It is unclear whether the Hospital for Special Surgery rating scale has been validated (Table 80), but Timoney, Kneisl, Barrack, et al. (1990) found significant improvement on it among 108 patients after an average of 50.6 months. Table 79. Arthroscopy case series, validated outcome scales
Study Outcomes Aaron et al., 2006 ALD
N=110, 12 lost to F/U; mn F/U 34 mo (24-74 mo) Knee Society pain Pre F/U p Mn 11.9 30.8 <0.001 Success=Knee Society pain > 30 in 72 (65%), failure in 38 (35%) Significant predictors of percent success: Kellgren-Lawrence grade, abnormal limb alignment, medial/lateral joint space width; intraoperative lesion severity; mechanical symptoms did not predict success,
Bohnsack et al., 2002 AD
N=104; mn F/U 5.4 r Lysholm & Gillquist Pre F/U p Mn 40 69 <0.01 Higher gain in Lysholm & Gillquist score in pts < 60 yo, monolateral OA; no influence of meniscectomy.
Dervin et al., 2003 AD
N=126; mn F/U 2 yr MCII WOMAC pain: 44% MCII predicted by tenderness at medial joint line, positive Steinman, unstable meniscal tear (logistic regression)
Table 80. Arthroscopy case series, Hospital for Special Surgery rating Study Outcomes Timoney et al., 1990 ALD
N=108; mn F/U 50.6 mo Pre F/U p Mn HSS score (sd) 24.7 (9.2) 36.1 (16.3) <0.001

130
A validated pain scale, the Knee Society pain domain was assessed in the study by Aaron, Skolnick, Reinert et al. (2006). Mean scores improved from 11.9 to 30.8 at an average of 34 months’ followup (p<0.001). The authors selected a gain of 30 points on as successful outcome, finding that 65 percent met this definition, while 35 percent were failures.
Three studies reported on a patient global change scale, sorting patients into three outcome classes: better/improved, the same/unchanged or worse (Table 81). Shannon, Devitt, Poynton, et al. (2001, n=54, mean followup 29.6 months) found that 67 percent were improved and 33 percent were unchanged. Harwin (1999, n=190, mean followup 7.4 years) observed that 63 percent were better, 21 percent were unchanged and 16 percent were worse. McLaren, Blokker, Fowler, et al. (1991, n=170, mean followup 25 months) reported that 65 percent were improved, 28 percent were the same and 7 percent were worse.
Table 81. Arthroscopy case series, patient global change assessment Study
% % Mean Better/ Same/ % Group n F/U Improved Unchanged Worse
Shannon et al., 2001 ALD
All pts 54 29.6 mo 67 33 0 Mn duration of symptom relief 25.5 mo, rng 1-51 No influence on results of sex, age, weight, preop Duke score, duration of symptoms
Harwin, 1999 ALD
All pts 190 7.4 yr 63 21 16 Normal alignment 57 84 12 4 Mod malalignment 102 68 24 9 Sev malalignment 45 27 27 47
McLaren et al., 1991 ALD
All pts 170 25 mo 65 28 7
Nine studies used a patient global result scale, using classes such as excellent, good, fair and poor (Table 82). These studies collectively included 1,472 patients. Among three studies that provided specific data on the percentage with excellent results, Krystallis, Kirkos, Papavasiliou, et al. (2004, n=201, mean followup 32 months) observed that 43 percent of all patients achieved this. Yang and Nisonson (1995, n=103, mean followup 11.7 months) reported excellent results in 20 percent and good results in 45 percent. Aichroth, Patel, and Moyes (1991, n=254, mean followup 44 months) found excellent results in 18 percent and good results in 57 percent.
Jackson and Dieterichs (n=121) had at least 4 years of followup, reporting excellent or good results in 50 percent. Excellent or good results were achieved in 51 percent of 59 patients who underwent debridement plus abrasion and 66 percent of 67 patients receiving debridement alone in the series by Bert and Maschka (1989, 5 year followup).
Ogilive-Harris and Fitsialos (1991, n=441, minimum 2 year followup) reported good results in 68 percent and Sprague (1981, n=63, mean followup 13.6 months) found good results in 74 percent. Linschoten and Johnson (1997, n=55, mean followup 49 months) found good results in 68 percent. Timoney, Kneisl, Barrack, et al. (1990, n=108, mean followup 50.6 months) found good results in 50 percent and significantly worse results for those with symptoms over 48 months and those with severe chondromalacia on arthroscopy.

131
Table 82. Arthroscopy case series, patient global result assessment Study
% Mean % Excel/ % % % Group n F/U Excel Good Good Fair Poor
Krystallis et al., 2004 ALD
All pts 201 32 mo 43 Mechanical sx 67 66 Loading sx 134 31 No difference between local, general and peridural anesthesia groups (ANOVA, p=0.71)
Jackson and Dieterichs, 2003 ALD
All pts 121 > 4 yr 50 27 22 Stage I 8 100 0 0 Stage II 32 91 0 9 Stage III 39 49 28 23 Stage IV 42 12 52 36
Linschoten and Johnson, 1997 ALD
All pts 55 49 mo 68 32 6 mo 82 18 12 mo 77 23 24 mo 70 30 36 mo 68 32 48 mo 68 32 Significantly poorer results for Outerbridge class IV on arthroscopy in both medial and lateral compartments
Yang and Nisonson, 1995 ALD
All pts 103` 11.7 mo 20 45 32 3 Sx < 1 mo 78 Sx > 12 mo 52 Mechanical sx 96 No mechanical 42 Fairbank 0/I 69 Fairbank II/III 36 Mild degeneration 74 Severe degeneration 39 Outcome significantly better for mechanical symptoms, mild degeneration. Outcome not correlated with age, sex, side or duration of followup
Aichroth et al., 1991 ALD
All pts 254 44 mo 18 57 15 10 All pts 75 < 60 yo 78 > 60 yo 55 Satisfactory result correlated with age (p<0.008), Ahlback preop radiographic severity (p<0.001) and with Outerbridge operative severity (p<0.001); no correlation with type or location of meniscal tear or performance of previous surgery
Ogilvie-Harris and Fitsialos, 1991 ALD
All pts 441 > 2 yr 68 1 compartment 103 82 2 compartments 135 58 Abrasion 32 56 Meniscectomy 149 68 Lavage only 4 25
Timoney et al., 1990 ALD
All pts 108 50.6 mo 5049 20 41 Subjective results deteriorated over time. Subjective results significantly worse for those with symptoms > 48 mo, those with severe chondromalacia; not correlated with meniscal pathology, condition of ACL, those undergoing limited lavage and debridement
Bert and Maschka, 1989 AD
Debridement Abrasion 59 5 yr 51 16 33 Debridement 67 66 13 21
Sprague, 1981 ALD
All pts 63 13.6 mo 74 10 16

132
Table 83 shows results from 2 studies that report whether pain and/or function improved on unvalidated outcome scales. McLaren, Blokker, Fowler, et al. (n=170, mean followup 25 months) provided pre- and post-treatment proportions with various classes of disability, but provided no statistical test results. Ogilive-Harris and Fitsialos (1991, n=441, about 4 years mean followup) reported on pain, activity, analgesic use and satisfaction, without appropriate statistical comparisons of baseline and followup status. Table 83. Arthroscopy case series, symptom/function improvement
Study Outcomes McLaren et al., 1991 ALD
n=170; mean followup 25 mo Disability (%) Pre Post No restriction 10 32 Limited recreation & sports 48 45 Unable to work 25 12 Restricted daily activities 17 11
Ogilvie-Harris and Fitsialos, 1991 ALD
n=441; mean followup ~4 yr Domain % Pain, no/occasional 53 Pain improved 86 Activity limitation, no/occasional 59 Activity improved 83 Analgesic, no/occasional 79 Analgesic, improved 32 Satisfaction 90 Results related to disease severity
Data on further surgery after arthroscopy were given in 14 case series (Table 84). Bernard,
Lemon, and Patterson (2004, n=100) reported that the 5-year probability of freedom from major surgery was about 84 percent. Across three studies, the probability of further surgery was between 13 percent and 20 percent (Bohnsack, Lipka, Ruhmann, et al., 2002, n=104; Linschoten and Johnson, 1997, n=55; Aichroth, Patel, and Moyes, 1991, n=254). In eight studies, the proportion undergoing repeat arthroscopy ranged between 2 percent and 13 percent at varying lengths of followup. Eleven studies report that the percentage of patients who underwent total knee arthroplasty ranged from 2 percent to 33 percent. In 3 case series, high tibial osteotomy was done between 2 percent and 4 percent.
Seven studies report on adverse events (Table 85). Two studies reported proportions of prolonged drainage of 1.2 percent and 13 percent (McLaren, Blokker, Fowler, et al., 1991, n=170; Linschoten and Johnson, 1997, n=55). Hemarthrosis occurred in 2 percent in the series by Harwin (1999, n=190) and 24.9 percent by Krystallis, Kirkos, Papavasiliou, et al. (2004, n=197). Effusions were noted in 6.5 percent by Timoney, Kneisl, Barrack, et al. (1990, n=108) and 1.9 percent by Linschoten and Johnson (1997). Timoney, Kneisl, Barrack, et al. (1990) found infections in 0 percent. Among 4 studies, deep vein thromboses occurred between 0.6 percent and 1 percent. Comment. Authors of case series commonly conclude from their results that arthroscopic lavage and debridement are effective, paying inadequate attention to their studies’ limitations. The case series is a weak design that can demonstrate effectiveness under certain circumstances. The methodologic quality of case series must be high, with use of validated outcome scales assessed independently, full accounting of selected and excluded patients and appropriate analysis of both beneficial outcomes and adverse events. In addition, the observed effect in case series must be large enough to exceed potential biases and nonspecific effects. This set of studies is of particularly low quality. Only one study clearly used an independent outcome

Table 84. Arthroscopy case series, further surgery Study
% % % % % % Repeat Unicondylar Total High Tibial Group n F/U Any Major Arthroscopy Arthroplasty Arthroplasty Osteotomy
Aaron et al., 2006; ALD All pts 110 34 mo 15 Total knee arthroplasty was related to baseline Kellgren-Lawrence grade.
Bernard et al., 2004; ALD All pts 100 18 3 11 4 5-yr major surgery-free survival: all: ~85%; < 60 yo: 89%; > 60 yo: 68% (X2, p=0.02); prior meniscectomy did not affect outcome
Jackson and Dieterichs, 2003; ALD All pts 121 > 4 yr 10 12 Stage I 8 0 0 Stage II 32 9 0 Stage III 39 15 8 Stage IV 42 7 29
Bohnsack et al., 2002; AD All pts 104 33.1 mo 20 4 4 8 2 unspecified procedure (4%)
Shannon et al., 2001; ALD All pts 54 29.6 mo 7 19 Harwin, 1999; ALD All pts 190 7.4 yr 15 13 McGinley et al., 1999; AD All pts 77 13.2 yr 33 Linschoten and Johnson, 1997; ALD All pts 55 13
Further surgery was significantly associated with presence of Outerbridge class IV on arthroscopy and presence of chondromalacia in lateral compartment.
Yang and Nisonson, 1995; ALD All pts 103 11.7 mo 3 2 Aichroth et al., 1991; ALD All pts 254 46 mo 14 McLaren et al., 1991; ALD All pts 170 25 mo 5 4 4 Timoney et al., 1990; ALD All pts 108 50.6 mo 6 21 Bert and Maschka, 1989; AD All pts 126 5 yr 20 Sprague, 1981; ALD All pts 63 13.6 mo 3 2
133

Table 85. Arthroscopy case series, adverse events Study
% % Mean All/ Prolonged % % % % % Group n F/U Any Drainage Hemarthrosis Effusion Infections DVTs Other
Krystallis et al., 2004; ALD
All pts 197 32 mo 24.9 minor intraop complications:6.1
Shannon et al., 2001; ALD
All pts 54 29.6 mo 0
Harwin, 1999; ALD
All pts 190 7.4 yr 2 0.5
Linschoten and Johnson, 1997; ALD
All pts 55 49 mo 13 1.9 spinal headache: 1.9 postop nausea: 1.95
Yang and Nisonson, 1995; ALD
All pts 103 11.7 mo 1 superficial cellulites: 2
McLaren et al., 1991; ALD
All pts 170 25 mo 1.2 0.6
Timoney et al., 1990; ALD
All pts 108 50.6 mo 6.5 0 0.9
134

135
assessor and most used outcome scales that are unvalidated or of uncertain validity. Patient samples were poorly described, appropriate statistical analyses were rare and only one of these articles gave well-described results. This low-quality body of case series evidence contrasts with the high-quality placebo-controlled RCT evidence from Moseley, O’Malley, Petersen, et al. (2002), which did not find that arthoscopic lavage and debridement are superior to placebo. Thus, the case series evidence reviewed here is inadequate to resolve uncertainty raised by the Moseley trial. Results, Part III: Key Question 3 (Subgroup Analyses)
On the question of whether arthroscopy outcomes differ across subgroups, it is fundamental to first establish whether the effects of arthroscopic exceed those of placebo. If a placebo-controlled RCT shows that treatment effects of arthroscopy are significantly greater in certain subgroups, this would be strong evidence to support use of arthroscopic in particular patient subsets. However, lacking this type of evidence, subgroup analyses from other types of studies would be of very limited value. Placebo-Controlled RCT Evidence. The publication by Moseley, O’Malley, Petersen, et al. (2002) describing the only placebo-controlled RCT did not present any subgroup analyses. In response to letters to the editor about subgroups, the authors replied (Wray, Moseley, O’Malley, 2002) that they performed subgroup analyses on OA stage, alignment and mechanical symptoms, finding no differences in results by subgroup. Thus, it has not been established that arthroscopic lavage and debridement produce better results than placebo for any specific group of patients. Quasi-Experimental Evidence. Livesley, Doherty, Needoff, et al. (1991, n=61, followup <12 months) compared arthroscopic debridement plus physical therapy with physical therapy alone. Subgroup analyses were provided on pain at rest and pain on activity for 3 classes of preoperative radiographic OA severity (slight, moderate and severe). The article reports a significant advantage at 3 months among moderate class patients in the lavage plus physical therapy group. In addition, presence or absence of effusion was not found to be correlated with results. This poor quality study was flawed by lack of blinding, imbalances on baseline characteristics without corresponding adjustment in the analysis, and absence of details about physical therapy. The suggestion of better outcomes in the moderate OA subgroup should not be interpreted as evidence that arthroscopic debridement achieves better results than placebo for this subgroup. Administrative Database Evidence. In the article by Wai, Kreder, and Williams (2002), data from the 14,391 patients who underwent arthroscopic debridement for OA of the knee within the Ontario Health Insurance Plan physician claims system were analyzed with a multivariable Cox proportional hazards regression model. The authors estimated the risks of further surgery and adverse events from 1992 to 1996. Subgroup analyses apparently focused on sex, Charlton-Deyo comorbidity and age. The report only presented significant differences in further surgery with increasing age (Table 73). It included no comparison with placebo or other interventions. This administrative database analysis offers evidence of limited value to this evidence report. While it shows different rates of further surgery across age subgroups, it leaves unanswered the question of whether there are different effects in terms of other outcomes of arthroscopy versus placebo based on age or any other variable. Case Series Evidence. Among case series using validated multidimensional outcome scales (Table 75), Aaron, Skolnick, Reinert et al. (2006, n=110, mean followup 34 months) reported on

136
the Knee Society pain domain, finding that successful outcome was predicted by preoperative OA grade, abnormal limb alignment, medial and lateral joint space width, and intraoperative lesion severity. Presence of mechanical symptoms did not predict outcome in this study. Bohnsack, Lipka, Ruhmann, et al. (2002, n=104, mean followup 5.4 years) used the Lysholm and Gillquist scale finding significant improvement among all patients and there was significantly greater improvement in patients under 60 and in those with unilateral OA. Dervin, Stiell, Rody, et al. (2003; n=126, 2-year followup) used multivariable logistic regression analysis to try to find variables predicting a minimal clinically important improvement on the WOMAC scale. The only significant independent predictors were tenderness at the medial joint line, a positive Steinman test sign and unstable meniscal tear.
On a patient global change scale (Table 81), Harwin (1999, n=190, mean followup 7.4 years) found that patients with more severe preoperative malalignment appeared to have worse results. Using a similar scale, Shannon, Devitt, Poynton, et al. (2001, n=54, mean followup 29.6 months) found no influence on results of sex, age, weight, preoperative Duke score and duration of symptoms.
On a patient global result scale, using classes such as excellent, good, fair and poor (Table 82), Krystallis, Kirkos, Papavasiliou, et al. (2004, n=201, mean followup 32 months) observed that the rate was 66 percent for those with mechanical symptoms and 31 percent for those with loading symptoms (no statistical test was done). Yang and Nisonson (1995, n=103, mean followup 11.7 months) reported that results were significantly better for patients with mechanical symptoms (96 percent good) versus no mechanical symptoms (42 percent) as well as those with mild rather than severe degeneration seen on arthroscopy. Aichroth, Patel, and Moyes (1991, n=254, mean followup 44 months) found that poorer results were significantly correlated with age over 60, greater preoperative radiographic OA rating and worse arthroscopic OA stage. Jackson and Dieterichs (n=121) had at least 4 years of followup, reported that excellent or good results appeared to be related to clinical and arthroscopic OA stage, the authors did not provide statistical test results. Linschoten and Johnson (1997, n=55, mean followup 49 months) observed that worse results were significantly more likely in patients with the most severe arthroscopic OA status in both the medial and lateral compartments. Timoney, Kneisl, Barrack, et al. (1990, n=108, mean followup 50.6 months) reported significantly worse results for those with symptoms over 48 months and those with severe chondromalacia on arthroscopy.
Data on further surgery after arthroscopy were given in 14 case series (Table 84). Aaron, Skolnick, Reinert et al. (2006, n=110) found that the probability of total knee arthroplasty was significantly related to preoperative OA grade. Bernard, Lemon, and Patterson (2004, n=100) reported that the 5-year probability of freedom from major surgery was significantly worse for those aged 60 or older. Linschoten and Johnson reported that further surgery was significantly associated with presence of Outerbridge class IV on arthroscopy and presence of chondromalacia in the lateral compartment. In the Jackson and Dieterichs series (2003, n=121), the risk of total knee arthroplasty appears higher in those with the most severe clinical and arthroscopic stage of OA, but not statistical test results were reported.
To summarize case series evidence, three patient factors were represented by at least two studies showing different outcomes for patient subgroups. Three studies found better outcomes among patients younger than 60 years of age (Bernard, Lemon, and Patterson, 2004; Bohnsack, Lipka, Ruhmann, et al., 2002; Yang and Nisonson, 1995). Two studies found that patients with mechanical symptoms had better results than those without them (Krystallis, Kirkos, Papavasiliou, et al., 2004; Yang and Nisonson, 1995) and one study found no relationship

137
(Aaron, Skolnick, Reinert et al., 2006). Six studies found that increased OA severity was correlated with worse results (Aaron, Skolnick, Reinert et al., 2006; Jackson and Dieterichs, 2003; Linschoten and Johnson, 1997; Yang and Nisonson, 1995; Aichroth, Patel, and Moyes, 1991; Timoney, Kneisl, Barrack, et al., 1990). Among these, OA severity was rated only with arthroscopy in three studies, with arthroscopy combined with preoperative information in one; and with radiography and arthroscopy separately in two. A useful function of case series is to suggest patient populations that may be worthwhile to include in controlled trials. While the Moseley trial found no differences in treatment effect by patient characteristics, case series evidence of different outcomes by age, presence of mechanical symptoms and OA severity should be noted by investigators analyzing future RCTs, but it cannot be viewed as showing that arthroscopy is particularly effective in particular subgroups. Results, Part III: Key Question 4 (Comparative Outcomes) RCT Evidence. The single study comparing the interventions of interest to this Evidence Report was conducted by Forster and Straw (2003). Study methods are summarized in Tables 86–90. Investigators randomized 38 patients with “symptomatic” knee osteoarthritis accompanying radiographic evidence of joint space remaining on weight bearing. Individuals with mechanical symptoms, intra-articular injection in the prior 6 months, or previous arthroscopic surgery were excluded. Participants were allocated (19 per arm) to five weekly 20 mg Hyalgan® injections or arthroscopic lavage (at least 2 liters normal saline) and indicated debridement with excision of large chondral flaps or meniscal tears). Followup took place through 1 year. Four participants were lost to followup (two per group) and two randomized to arthroscopy declined treatment. Outcome measures included 10 cm VAS pain, function score from the Knee Society rating system (0 to 100), and Lequesne index (0 to 24). This trial was rated as poor in quality due to imbalance on Knee Society scores at baseline, lack of blinding and lack of adjustment in data analysis. Table 86. Arthroscopy non-placebo RCTs, sample selection
Study Inclusion Exclusion n, Enrolled n,
Withdrawn n, Outcome Evaluated
Forster and Straw, 2003 ALD vs. IA Hyalgan
On waiting list for arthroscopic washout; symptomatic knee OA; radiographic evidence of some remaining joint space on weight bearing films; fit for regional or general anesthesia
Mechanical symptoms; IA injection < 6 mo; hypersensitivity to avian proteins
ALD: 19 Hyalgan: 19
ALD: 4 (2 lost, 2 refused) Hyalgan: 2 (lost)
ALD: 15 Hyalgan: 17
Table 87. Arthroscopy non-placebo RCTs, patient characteristics
Study Age %
Female
Pain
Function Forster and Straw, 2003 ALD vs. IA Hyalgan
ALD: mn 63 Hyalgan: mn 60
VAS ALD: mn 7.5 Hyalgan: mn 7.6
Knee Society: ALD: mn 45 Hyalgan: mn 65 (p<0.05) LI: ALD: mn 13 Hyalgan: mn 10.5

138
Table 88. Arthroscopy non-placebo RCTs, interventions
Study Interventions Prior
Treatments Concurrent Treatments
Forster and Straw, 2003 ALD vs. IA Hyalgan
ALD: general or spinal anesthesia; saline lavage; debridement of articular surface or menisci as considered necessary at surgeon’s discretion; large chondral or meniscal flaps excised but stable, degenerative menisci left intact IA Hyalgan: any effusion aspirated; 5 injections of 20 mg Hyalgan in affected knee at 1-wk intervals
Table 89. Arthroscopy non-placebo RCTs, study quality
Study
Initial Assembly of Comparable
Groups
Low Loss to Followup,
Maintenance of Comparable
Groups
Measurements Reliable, Valid,
Equal*
Interventions Comparable/
Clearly Defined
Appropriate Analysis of
Results Overall Rating
Forster and Straw, 2003 ALD vs. IA Hyalgan
? Y N Y N Poor
These investigators found that at 1 year, seven participants in the Hyalgan® arm underwent
further intervention including arthroscopy and total knee replacement; one in the arthroscopy and debridement arm underwent total knee replacement, and a replacement was planned for two additional participants. Of the remainder not undergoing further intervention eight in each group reported improvement. There were no significant differences between groups on VAS pain and the Lequesne Index across 4 followup points (Table 90). While the Hyalgan® arm had greater improvement on the Knee Society function measure, none of the between-arm differences were significant at any followup times.
The Forster and Straw trial found no differences between Hyalgan® and arthroscopic lavage and debridement over a 1-year followup. However, the trial was clearly underpowered and had significant baseline differences between arms with no adjustment for such in the data analysis. Forster and Straw represent the only study making direct comparisons among viscosupplements and arthroscopic treatment; no studies compared glucosamine or chondroitin with the former treatments. This trial provides an inadequate evidence base to form conclusions about the comparative effects of viscosupplements and arthroscopy. Table 90. Arthroscopy non-placebo RCTs, results Study Outcomes Forster and Straw, 2003 ALD vs. IA Hyalgan
Group n Outcome 6 wk mn 3 mo mn 6 mo mn 1 yr mn p values ALD 15 VAS 5.4 6.0 6.2 5.7 all NS Hyalgan 17 (higher=worse) 6.6 6.0 5.4 5.7 ALD Knee Society 55 45 45 55 all NS Hyalgan (higher=better) 70 65 80 90 ALD LI 10 13 12 10.5 all NS Hyalgan (higher=worse) 11 11 9 8 Further surgery: arthroscopy (ALD 29%, Hyalgan® 0%); total knee arthroplasty (ALD 12%, Hyalgan® 7%); total knee arthroplasty waiting list (ALD 18%, Hyalgan® 13%)

139
Conclusions: Part III 1. What are the Clinical Effectiveness and Harms of Arthroscopic Lavage and Debridement in Patients With Primary OA of the Knee?
• The best available evidence, a single placebo-controlled RCT, found arthroscopic lavage
with or without debridement was not superior to placebo. The evidence base does not definitively show that arthroscopy is no more effective than placebo. But additional RCTs of high quality and with favorable would be necessary to refute the existing trial, which suggests equivalence between placebo and arthroscopy. – Neither the placebo-controlled RCT, published by Moseley, O’Malley, Petersen, et al., in
2002, nor other studies distinguished between primary and secondary OA. However, due to the age of patients, it is likely most patients had primary OA.
– No other study besides Moseley, O’Malley, Petersen, et al. (2002) addressed the potential contribution of placebo effects to apparent improvement in outcome after arthroscopy.
– The primary limitations of the Moseley, O’Malley, Petersen, et al. (2002) trial are lack of details describing the patient sample, the use of a single surgeon and enrollment of patients at a single Veterans Affairs Medical Center. These concerns call into question the generalizability of this trial’s findings.
– Since OA of the knee affects a large population, uncertainty about arthroscopy’s effectiveness should be resolved with further well-conducted and well-reported RCTs.
– Major methodologic shortcomings in non-placebo RCTs, an administrative database analysis and case series preclude resolution of uncertainties raised by the trial of Moseley, O’Malley, Petersen, et al. (2002).
• Evidence on the harms after arthroscopic lavage and debridement comes primarily from an
administrative database analysis and case series reports. Potential harms include infection, prolonged drainage from arthroscopic portals, effusion, hemarthrosis, and deep vein thrombosis. To determine whether the risk of such harms is acceptable, it is important to establish whether the effectiveness of arthroscopic lavage and debridement surpasses placebo.
2. What are the Clinical Effectiveness and Harms of Arthroscopic Lavage and Debridement in Patients With Secondary OA of the Knee? • We identified no studies that enrolled patients with only secondary OA of the knee, or that
reported separately on secondary OA of the knee. Therefore, no conclusions can be drawn about treatment outcomes in patients with secondary OA of the knee.
3. How do the Short-Term and Long-Term Outcomes of Arthroscopic Lavage and Debridement Differ by the Following Subpopulations: Age, Race/Ethnicity, Sex, Primary or Secondary OA, Disease Severity and Duration, Weight (Body Mass Index), and Prior Treatments?

140
• Subgroup analyses for mechanical symptoms, alignment and OA stage were performed in the placebo-controlled RCT by Moseley and colleagues. No differences in results were observed within subgroups. Thus, it cannot be concluded that arthroscopic lavage with or without debridement has effects greater than placebo for specific subgroups.
• Subgroup analyses were also performed in a quasi-experimental study, an administrative
database and several case series. In these studies, different outcomes were observed according to age, presence of mechanical symptoms and severity of OA. However, since these studies had substantial methodologic flaws so it cannot be concluded that arthroscopy has greater effectiveness in specific patient subgroups.
4. How do the Short-Term and Long-Term Outcomes of Arthroscopic Lavage and Debridement, Viscosupplements and Glucosamine/Chondroitin Compare for the Treatment of: Primary OA of the Knee; and Secondary OA of the Knee? • A single RCT compared use of arthroscopic lavage and debridement with intra-articular
Hyalgan®. This poor quality study analyzed data from only 32 patients, finding no significant differences between groups on 3 scales concerned with pain and function.
• This trial provides an inadequate evidence base to form conclusions about the comparative
effects of viscosupplements and arthroscopy. • No other comparative study, randomized or nonrandomized, addressed the relative effects of
arthroscopic lavage and debridement, viscosupplements, and glucosamine/chondroitin.

141
Chapter 4. Discussion and Future Research
Osteoarthritis (OA) of the knee is a common condition and the three interventions reviewed in this report are widely used in the treatment of OA of the knee. Yet the best available evidence reports that glucosamine/chondroitin and arthroscopic surgery are no more effective than placebo. The Glucosamine/Chondroitin Arthritis Intervention Trial (GAIT) (n=1,583) found that neither glucosamine hydrochloride, chondroitin sulfate, nor the combination was superior to placebo and that all were inferior to celecoxib. The double-blind, randomized, controlled trial by Moseley, O’Malley, Petersen, et al. (2002, n=180) found that arthroscopic lavage with or without debridement was not superior to sham arthroscopy. Results from 42 randomized controlled trials (RCTs), all but one of which were synthesized in various combinations in six meta-analyses, generally show positive effects of viscosupplementation on pain and function scores compared to placebo. However, the evidence on viscosupplementation is accompanied by considerable uncertainty due to variable trial quality, potential publication bias, and unclear clinical significance of the changes reported.
Are we to conclude, then, that all three interventions are ineffective? It is erroneous to conclude that “no evidence of effect” is the same as “evidence of no effect.” The distinction between no evidence and no effect applies somewhat differently to each intervention.
• While the overall results of GAIT show no benefit, in the subgroup of knee OA patients with
moderate-to-severe pain at baseline, the combination of glucosamine hydrochloride and chondroitin sulfate significantly improved pain. Although this subgroup analysis was not explicitly prespecified in the GAIT protocol, the stratified randomization by disease severity yields statistically valid comparisons. The nonsignificant statistical result in the celecoxib arm in the same patient subgroup may be a function of insufficient power. Given the small number of patients in the moderate-to-severe subgroup, and the large number of such patients in the general population, a further trial can be justified. These subgroup results, although suggestive, do not override the overall results of GAIT, which must stand unless equally compelling evidence of benefit to a selected subgroup is produced.
• The existing evidence does not definitively show that arthroscopic lavage with or without
debridement is only as effective as placebo. However, additional placebo-controlled RCTs showing clinically significant advantage for arthroscopy would be necessary to refute the Mosley results, which show equivalence between placebo and arthroscopy. The recently published (Weinstein, Tosteson, Lurie, et al., 2006) Spine Patient Outcomes Research Trial (SPORT) offers an alternative study design that could be informative, a rigorous RCT comparing surgery to conservative management, rather than sham.
• The existing evidence leaves uncertainty whether viscosupplementation achieves minimal
clinically important improvement compared to placebo. Higher-quality trials are in the minority and show smaller effects; there are numerous patients lost to follow-up, and a substantial portion of studies (25 percent of total patients) have not been published as full-text articles. The clinical significance of reported changes in pain and function scores is uncertain, as almost all studies compare only mean difference between arms. Although the overall pooled estimate suggests that hylan G-F 20 may have a larger effect than other

142
hyaluronans, whether this represents a meaningful clinical effect or limitations in the quality and completeness of study reporting is unknown. A rigorous RCT that showed strong evidence of improvement in pain and function would be necessary to conclude that viscosupplementation is beneficial.
Overall, our recommendations for future research reach beyond the specific treatments
addressed in this report, and are intended broadly to improve the quality of research and reporting on interventions for osteoarthritis of the knee.
Minimal Clinically Important Improvement in Pain and Function Should be the Measure of Success for all Trials
Clinically meaningful results require outcome measures establishing that patients experience improvement that is important to them—meaningful clinically important improvement. The range of magnitude of improvement clinically important to patients has been estimated for VAS pain and WOMAC measures, while to a lesser degree for the Lequesne Index (see Methods). Few RCTs reported results in terms of response: the proportion achieving a meaningful clinically important improvement in pain and function. The vast majority of trials compared only mean change between groups. Follow up duration and intervals for measurement, appropriate to each intervention, should be established by expert consensus.
Common measures and intervals will produce a more robust body of cumulative evidence and improve the ability to compare and pool results among trials. As a result of the variety of measures and intervals used in primary studies, meta-analyses available for this type of evidence often report pooled outcomes as the standardized mean difference, a statistical construct that lacks meaning to clinicians and patients.
Unpublished Studies Should be Made Available
as Full-Text Publications Among RCTs of viscosupplementation, those that have not been published in full-text comprise approximately 25 percent of the total patient population. Several meta-analyses of glucosamine report that trials of the Rotta product, glucosamine sulfate, show outcomes superior to trials of glucosamine hydrochloride. Yet key studies that provide some of the data supporting superior efficacy have not been published as full-text studies. Existing studies should be published in full. Finally, all trials should be registered at inception at ClinicalTrials.gov along with anticipated date for full release of results.
The Pitfalls of Meta-Analysis Should be More Widely Recognized and Acknowledged
Our evidence report draws heavily on six study level meta-analyses of glucosamine/chondroitin and five of viscosupplementation. While we used a validated instrument to appraise the quality of the systematic reviews, the instrument does not address the

143
question of when meta-analysis is appropriate to a systematic review. Meta-analysis is a technique with underlying assumptions that may or may not hold when a particular collection of results are pooled. Furthermore, meta-analyses may fail to convey the real uncertainty and potential bias accompanying pooled estimates.
In many respects, the focus on meta-analysis in the systematic reviews available for this evidence report, served to obscure the overall weakness of the primary literature. For example, the Oxman and Guyatt meta-analysis quality assessment tool asked if conclusions made by authors were supported by the data. However, the tool does not adequately address whether quality concerns of the underlying literature were incorporated into conclusions, which was a frequent flaw in the meta-analyses reviewed here. Building on the Oxman and Guyatt tool, Shea, Grimshaw, Wells et al. 2007 have developed a new scale which more clearly assesses whether conclusions took appropriate account of the quality of included studies and the potential for publication bias.
For RCTs of both glucosamine/chondroitin and viscosupplementation, potential sources of bias included lack of reporting intention-to-treat results, high drop-out or loss to follow-up rates, poor quality, and lack of a priori sample size calculations. A number of these characteristics were noted by meta-analysts to influence results.
Uncertainty in the magnitude of effects pooled is influenced by factors intrinsic to the underlying trials. Among these are variable patient characteristics, trial characteristics, and the indication that a few trial results were outliers and influential on pooled estimates. The meta-analyses frequently reported high inter-trial heterogeneity. Random effects models were used in the face of high heterogeneity, but a consequence is to increase the influence of smaller trials on the pooled results. The meta-analyses did not address a threshold question, one that has not been clearly resolved by practitioners of meta-analysis: when is heterogeneity too high to justify pooling trial results. A related concern is the practice of reporting on multiple outcome measures and time intervals, which may be represented by a small portion of studies, thus potentially introducing bias.
Specific Research Recommendations Table 91 summarizes recommendations for future research on interventions addressed in this report, using the “Evidence, Population, Intervention, Comparison, Outcome, Timestamp,” or “EPICOT” framework (Brown, Brunnhuber, Chalkidou, et al., 2006). Note that all the recommendations in Table 91 delineate the evidence that is needed to establish that each of these interventions achieve a clinically meaningful improvement in OA of the knee. However, our population is aging, there is increasing prevalence of obesity, and increasing burden of knee osteoarthritis, together with inconsistent evidence regarding disease treatments. Given the public health impact, research on new approaches to prevention and treatment should be given high priority.

144
Table 91. Future Research Recommendations for Osteoarthritis of the Knee --- EPICOT Framework Viscosupplementation Glucosamine/Chondroitin Arthroscopy Evidence (What is the current state of the evidence?)
Current evidence consists largely of trials with high loss to follow-up and lack rigorous measurement to test whether intra-articular hyaluronans achieve meaningful clinically important improvement in pain and function. The evidence does not clearly demonstrate that intra-articular hyaluronans achieve clinically significant improvement in pain and function compared to placebo. A rigorous multi-center RCT, preferably with independent sponsorship, is needed to either establish or refute whether hylan G-F 20 is beneficial. Adverse events, reportedly uncommon, have not been systematically studied.
Based on GAIT, neither glucosamine, chondroitin or their combination provide meaningful clinically important improvement in pain or function. A subgroup analysis found that the combination of glucosamine hydrochloride and chondroitin sulfate significantly improved pain in patients with moderate-to-severe OA of the knee. Given the small number of patients in the moderate to severe subgroup, and the large number of such patients in the general population, confirmation in a large, rigorous multi-center RCT, preferably with independent sponsorship, is desirable. No conclusions concerning metabolic effects of chronic glucosamine use in the general population can be drawn.
A single placebo-controlled RCT found arthroscopic lavage with or without debridement to be equivalent to placebo. Adverse events have not been systematically studied.
Population (What is the population of interest?)
Individuals with OA of the knee of varying severity. Future trials should be accompanied by stratified randomization according to disease severity and duration.
Individuals with moderate-to-severe OA of the knee. Inclusion of diabetic individuals with metabolic testing and long-term observational follow-up.
The target population consists of patients with clinically diagnosed OA of the knee and who have tried conservative treatments with transient or unsatisfactory results.
Intervention (What are the interventions of interest?)
Pooled estimate suggests effect obtained with hylan G-F 20 may be larger than with other hyaluronans, whether this represents a meaningful clinical effect or study limitations is unknown.
1. glucosamine hydrochloride and chondroitin sulfate
2. glucosamine
sulfate, preferably the Rotta product
Arthroscopic lavage, with or without debridement,

145
Table 91. Future Research Recommendations for Osteoarthritis of the Knee --- EPICOT Framework (continued) Viscosupplementation Glucosamine/Chondroitin Arthroscopy Comparison (What are the comparisons of interest?)
Placebo intra-articular injection is required to establish efficacy.
Comparison paralleling GAIT: intervention(s), placebo, and a reference NSAID
Comparison with sham arthroscopy (as in Moseley). And/or comparison to conservative treatment as in Spine Patient Outcomes Research Trial (SPORT)
Outcome (What are the outcomes of interest?)
Response criteria anchored to a meaningful clinically important improvement in pain and function. The magnitude of improvement clinically important to patients has been reasonably estimated for VAS pain, WOMAC measures, and Lequesne Index. Outcomes measured in the likely window for clinical improvement (5-13 weeks).
Same as viscosupplementation. Sufficient duration (24 weeks or more) to observe effect.
Same as viscosupplementation
Time Stamp (Date of recommendation)
April 2007 April 2007 April 2007


147
References Aaron RK, Skolnick AH, Reinert SE, et al. Arthroscopic debridement for osteoarthritis of the knee. J Bone Joint Surg Am 2006;88(5):936-43. Ahlback S. Osteoarthrosis of the knee. A radiographic investigation. Acta Radiol Diagn (Stockh) 1968;Suppl 277:7-72. Aichroth PM, Patel DV, Moyes ST. A prospective review of arthroscopic debridement for degenerative joint disease of the knee. Int Orthop 1991;15(4):351-5. Altman R, Asch E, Bloch D, et al. Development of criteria for the classification and reporting of osteoarthritis: classification of osteoarthritis of the knee. Arthritis Rheum 1986;29(8):1039-49. Altman RD, Abramson S, Bruyere O, et al. Commentary: osteoarthritis of the knee and glucosamine. Osteoarthritis Cartilage 2006;14(10):963-6. Altman RD, Akermark C, Beaulieu AD, et al. Efficacy and safety of a single intra-articular injection of non-animal stabilized hyaluronic acid (NASHA) in patients with osteoarthritis of the knee. Osteoarthritis Cartilage 2004;12(8):642-9. Altman RD, Moskowitz R. Intraarticular sodium hyaluronate (Hyalgan) in the treatment of patients with osteoarthritis of the knee: a randomized clinical trial. Hyalgan Study Group. J Rheumatol 1998;25(11):2203-12. American Academy of Orthopaedic Surgeons. Osteoarthritis of the knee: state of the condition. 2004. Available at www.aaos.org/Research/documents/OAinfo_knee_state.pdf. Accessed November 2006. American College of Rheumatology (Subcommittee on Osteoarthritis Guidelines). Recommendations for the medical management of osteoarthritis of the hip and knee. Arthritis Rheum 2000;43:1905-1915. Anderson JW, Nicolosi RJ, Borzelleca JF. Glucosamine effects in humans: A review of effects on glucose metabolism, side effects, safety considerations and efficacy. Food Chem Toxicol 2005;43:187-201. Arrich J, Piribauer F, Mad P, et al. Intra-articular hyaluronic acid for the treatment of osteoarthritis of the knee: systematic review and meta-analysis. CMAJ 2005;172(8):1039-43. Balint G, Szebenyi B. Diagnosis of osteoarthritis: guidelines and current pitfalls. Drugs 1996;52 (suppl 3):1-13.
Bana G, Jamard B, Verrouil E, et al. Chondroitin sulfate in the management of hip and knee osteoarthritis: an overview. Adv Pharmacol 2006;53:507-22. Bellamy N. Musculoskeletal clinical metrology. United Kingdom: Kluwer Academic Publishers; 1993. pp. 193-251. Bellamy N, Buchanan WW, Goldsmith CH, et al. Validation study of WOMAC: a health status instrument for measuring clinically important patient relevant outcomes to antirheumatic drug therapy in patients with osteoarthritis of the hip or knee. J Rheumatol 1988;15(12):1833-40. Bellamy N, Campbell J, Robinson V, et al. Viscosupplementation for the treatment of osteoarthritis of the knee. Cochrane Database Syst Rev 2006;(2):CD005321. Bellamy N, Campbell J, Robinson V, et al. Viscosupplementation for the treatment of osteoarthritis of the knee. Cochrane Database Syst Rev 2007;(2):CD005321. Bernard J, Lemon M, Patterson MH. Arthroscopic washout of the knee—a 5-year survival analysis. Knee 2004;11(3):233-5. Bert JM, Maschka K. The arthroscopic treatment of unicompartmental gonarthrosis: a five-year follow-up study of abrasion arthroplasty plus arthroscopic debridement and arthroscopic debridement alone. Arthroscopy 1989;5(1):25-32. Biggee BA, McAlindon T. Glucosamine for osteoarthritis: part I, review of the clinical evidence. Med Health R I 2004 Jun;87(6):176-179. Bjordal JM, Klovning A, Ljunggren AE, et al. Short-term efficacy of pharmacotherapeutic interventions in osteoarthritic knee pain: a meta-analysis of randomised placebo-controlled trials. Eur J Pain 2006 May 6;[Epub ahead of print]. Blacher RS. Arthroscopic surgery for osteoarthritis of the knee. N Engl J Med 2002;347(21):1717-9. Blue Cross and Blue Shield Association. Special report: Intra-articular hyaluronan for osteoarthritis of the knee. TEC Assessments 2005;19(17):1-16. Bohnsack M, Lipka W, Ruhmann O, et al. The value of knee arthroscopy in patients with severe radiological osteoarthritis. Arch Orthop Trauma Surg 2002;122(8):451-3.

148
Bourgeois P, Chales G, Dehais J, et al. Efficacy and tolerability of chondroitin sulfate 1200 mg/day vs chondroitin sulfate 3 x 400 mg/day vs placebo . Osteoarthritis Cartilage 1998;6 Suppl A:25-30. Bragantini A, Cassini MD, Perbellini A. Controlled single-blind trial of intra-articularly injected hyaluronic acid (Hyalgan®) in osteoarthritis of the knee. Clin Trials J 1987;24(4):333-40. Brandt KD, Block JA, Michalski JP, et al. Efficacy and safety of intraarticular sodium hyaluronate in knee osteoarthritis. ORTHOVISC Study Group. Clin Orthop Relat Res 2001;(385):130-43. Brown P, Brunnhuber K, Chalkidou K, et al. How to formulate research recommendations. BMJ 2006;333(7572):804-6. Bucsi L, Poor G. Efficacy and tolerability of oral chondroitin sulfate as a symptomatic slow-acting drug for osteoarthritis (SYSADOA) in the treatment of knee osteoarthritis. Osteoarthritis Cartilage 1998;6 Suppl A:31-6. Bunyaratavej N, Chan KM, Subramanian N. Treatment of painful osteoarthritis of the knee with hyaluronic acid. Results of a multicenter Asian study. J Med Assoc Thai 2001;84 Suppl 2:S576-81. Campbell WJ, Patterson CC. Quantifying meaningful changes in pain. Anesthesia 1998;53:121-125. Carey TS, Boden SD. A critical guide to case series reports. Spine 2003;28(15):1631-1634. Carrabba M., Paresce E, Angelini M, et al. The safety and efficacy of different dose schedules of hyaluronic acid in the treatment of painful osteoarthritis of the knee with joint effusion. Eur J Rheumatol Inflamm 1995;15(1):25-31. Centers for Disease Control and Prevention. Update: direct and indirect costs of arthritis and other rheumatic conditions--United States, 1997. MMWR Morb Mortal Wkly Rep 2004;53: 388-389. Centers for Disease Control and Prevention. Racial/ethnic differences in the prevalence and impact of doctor-diagnosed arthritis--United States, 2002. MMWR Morb Mortal Wkly Rep 2005;54(5):119-23. Available at www.cdc.gov/mmwr/preview/mmwrhtml/mm5601a2.htm?s_cid=mm5601a2_e. Accessed April 2007. Centers for Disease Control and Prevention. Prevalence of doctor-diagnosed arthritis and arthritis-attributable activity limitation--United States, 2003-2005. MMWR Morb Mortal Wkly Rep. 2006;55(40):1089-92. Available at www.cdc.gov/mmwr/preview/mmwrhtml/mm5540a2.htm?s_cid=mm5540a2_e. Last accessed April 2007.
Centers for Disease Control and Prevention. National and state medical expenditures and lost earnings attributable to arthritis and other rheumatic conditions--United States, 2003. MMWR Morb Mortal Wkly Rep. 2007;56(1):4-7. Available at www.cdc.gov/mmwr/preview/mmwrhtml/mm5405a3.htm. Accessed April 2007. Chalmers TC, Smith H Jr, Blackburn, et al. A method for assessing the quality of a randomized control trial. Control Clin Trials 1981;2(1):31-49. Chambers K, Schulzer M, Sobolev B. A controlled trial of arthroscopic surgery for osteoarthritis of the knee. Arthroscopy 2002;18(7):683-7. Chambers KG, Schulzer M. Arthroscopic surgery for osteoarthritis of the knee. N Engl J Med 2002;347(21):1717-9. Cibere J. Do we need radiographs to diagnose osteoarthritis? Best Practice Res Clin Rheumatol 2006;20(1):27-38. Cibere J, Kopec JA, Thorne A, et al. Randomized, double-blind, placebo-controlled glucosamine discontinuation trial in knee osteoarthritis. Arthritis Rheum 2004;51(5):738-45. Claessens AA, Schouten JS, van den Ouweland FA, et al. Do clinical findings associate with radiographic osteoarthritis of the knee? Ann Rheum Dis 1990;49:771-774. Clarke HD, Scott WN. The role of debridement: through small portals. J Arthroplasty 2003 Apr;18(3 Suppl 1):10-13. Clegg DO, Reda DJ, Harris CL, et al. Glucosamine, chondroitin sulfate, and the two in combination for painful knee osteoarthritis. N Engl J Med 2006;354(8):795-808. Cohen J. Statistical power analysis for the behavioral sciences. 2nd ed. Hillsdale, NJ: Erlbaum; 1988. Cohen M, Wolfe R, Mai T. A randomised, double-blind, placebo-controlled trial of topical glucosamine and chondroitin sulfate for osteoarthritis of the knee [abstract]. Int Med J 2003;33(3):A17. Cohen MA, Shiroky JB, Ballachey ML, et al. Double-blind randomized trial of intra-articular (I/A) hyaluronate in the treatment of osteoarthritis of the knee. Arthritis Rheum 1994;37(Suppl 6):R31. Conrozier T, Vignon E. Die wirkung von chondroitinsulfat bei der behandlung der huftgelenksarthrose eine doppelblindstudie gegen placebo. Litera Rheumatologica 1992;14:69-75. Conrozier T. [Anti-arthrosis treatments: efficacy and tolerance of chondroitin sulfates (CS 4&6)]. Presse Med 1998;27 (36):1862-5.

149
Creamer P, Sharif M, George E, et al. Intra-articular hyaluronic acid in osteoarthritis of the knee: an investigation into mechanisms of action. Osteoarthritis Cartilage 1994;2(2):133-40. Crolle G, D'Este E. Glucosamine sulphate for the management of arthrosis: a controlled clinical investigation. Curr Med Res Opin 1980;7(2):104-9. Cubukcu D, Ardic F, Karabulut N, et al. Hylan G-F 20 efficacy on articular cartilage quality in patients with knee osteoarthritis: clinical and MRI assessment. Clin Rheumatol 2005;24(4):336-41. Dahlberg L, Lohmander LS, Ryd L. Intraarticular injections of hyaluronan in patients with cartilage abnormalities and knee pain. A one-year double-blind, placebo-controlled study. Arthritis Rheum 1994;37(4):521-8. D'Ambrosio E, Casa B, Bompani R, et al. Glucosamine sulphate: a controlled clinical investigation in arthrosis. Pharmatherapeutica 1981;2(8):504-8. Das A Jr, Hammad TA. Efficacy of a combination of FCHG49 glucosamine hydrochloride, TRH122 low molecular weight sodium chondroitin sulfate and manganese ascorbate in the management of knee osteoarthritis. Osteoarthritis Cartilage 2000;8(5):343-50. Davis MA, Ettinger WH, Neuhaus JM, et al. Correlates of knee pain among US adults with and without radiographic knee osteoarthritis. J Rheumatol 1992;19:1943-49. Day B. The indications for arthroscopic debridement for osteoarthritis of the knee. Orthop Clin North Am 2005 Oct;36(4):413-417. Day R, Brooks P, Conaghan PG, et al. A double blind, randomized, multicenter, parallel group study of the effectiveness and tolerance of intraarticular hyaluronan in osteoarthritis of the knee. J Rheumatol 2004;31(4):775-82. Deal CL, Moskowitz RW. Nutraceuticals as therapeutic agents in osteoarthritis. The role of glucosamine, chondroitin sulfate, and collagen hydrolysate. Rheum Dis Clin North Am 1999 May;25(2):379-395. Dervin GF, Stiell IG, Rody K, et al. Effect of arthroscopic debridement for osteoarthritis of the knee on health-related quality of life. J Bone Joint Surg Am 2003;85-A(1):10-9. Dickson J, Hosie G. Double-blind, double-control comparison of viscosupplementation with hylan GF 20 (Synvisc®) against diclofenac and control in knee osteoarthritis. Arthritis Rheum 1998;41(Suppl 9):S197. Dickson DJ, Hosie G, English JR. A double-blind, placebo-controlled comparison of hylan G-F 20 against diclofenac in knee osteoarthritis. J Clin Res 2001;4:41-52.
Dixon AS, Jacoby RK, Berry H, et al. Clinical trial of intra-articular injection of sodium hyaluronate in patients with osteoarthritis of the knee. Curr Med Res Opin 1988;11(4):205-13. Dougados M, Nguyen M, Listrat V, et al. High molecular weight sodium hyaluronate (hyalectin) in osteoarthritis of the knee: a 1 year placebo-controlled trial. Osteoarthritis Cartilage 1993;1(2):97-103. Downs SH, Black N. The feasibility of creating a checklist for the assessment of the methodological quality both of randomised and non-randomised studies of health care interventions. J Epidemiol Community Health 1998;52(6):377-84. Drovanti A, Bignamini AA, Rovati AL. Therapeutic activity of oral glucosamine sulfate in osteoarthrosis: a placebo-controlled double-blind investigation. Clin Ther 1980;3(4):260-72. DuMouchel W. 1994. Hierarchical Bayes linear models for meta-analysis. NISS Technical Report Number 27. Research Triangle Park, NC: National Institute of Statistical Sciences; 1994. Available at www.niss.org/technicalreports/tr27.pdf. Accessed April 2007. Espallargues M, Pons JM. Efficacy and safety of viscosupplementation with Hylan G-F 20 for the treatment of knee osteoarthritis: a systematic review. Int J Technol Assess Health Care 2003;19(1):41-56. Ewing W, Ewing JW. Arthroscopic surgery for osteoarthritis of the knee. N Engl J Med 2002;347(21):1717-9. Felson DT, Buckwalter J. Debridement and lavage for osteoarthritis of the knee. N Engl J Med 2002;347(2):132-3. Felson DT. Osteoarthritis of the knee. N Engl J Med 2006;354(8):841-848. Formiguera SS, Esteve de Miguel R. Intra-articular hyaluronic acid in the treatment osteoarthritis of the knee: A short term study. Eur J Rheumatol Inflamm 1995;15(1):33-8. Forster MC, Straw R. A prospective randomised trial comparing intra-articular Hyalgan injection and arthroscopic washout for knee osteoarthritis. Knee 2003;10(3):291-3. Gidwani S, Fairbank A. The orthopaedic approach to managing osteoarthritis of the knee. BMJ 2004;329:1220-1224. Grecomoro G, Martorana U, Di Marco C. Intra-articular treatment with sodium hyaluronate in gonarthrosis: a controlled clinical trial versus placebo. Pharmatherapeutica 1987;5(2):137-41.

150
Greenland S, Schlesselman JJ, Criqui MH. The fallacy of employing standardized regression coefficients and correlations as measures of effect. Am J Epidemiol 1986;123(2):203-8. Guler M, Kuran B, Parlar D, et al. Clinical trial of intra-articular injection of hyaluronic acid in patients with osteoarthritis of the knee. Turkey: X National Rheumatology Congress, October 29-November 3, 1996. Gunther KP. Surgical approaches for osteoarthritis. Best Pract Res Clin Rheumatol 2001;15:627-643. Hamburger MI, Lakhanpal S, Mooar PA, et al. Intra-articular hyaluronans: a review of product-specific safety profiles. Semin Arthritis Rheum 2003;32(5):296-309. Harris RP, Helfand M, Woolf SH, et al. (Methods Work Group, Third US Preventive Services Task Force.) Current methods of the US Preventive Services Task Force: a review of the process. Am J Prev Med 2001 Apr;20(3 Suppl):21-35. Harwin SF. Arthroscopic debridement for osteoarthritis of the knee: predictors of patient satisfaction. Arthroscopy 1999;15(2):142-6. Hathcock JN, Shao A. Risk assessment for glucosamine and chondroitin sulfate. Regul Toxicol Pharmacol 2006. Hauselmann HJ. Nutripharmaceuticals for osteoarthritis. Best Pract Res Clin Rheumatol 2001;15:595-607 Hedeker DR, Gibbons RB. Longitudinal data analysis. New York, NY; John Wiley and Sons: 2006. Henderson EB, Smith EC, Pegley F, et al. Intra-articular injections of 750 kD hyaluronan in the treatment of osteoarthritis: a randomised single centre double-blind placebo-controlled trial of 91 patients demonstrating lack of efficacy. Ann Rheum Dis 1994;53(8):529-34. Herrero-Beaumont G, Roman JA, Trabado MC, et al. Effects of glucosamine sulfate on 6-month control of knee osteoarthritis symptoms vs placebo and acetaminophen: results from the Glucosamine Unum in Die Efficacy (GUIDE) Trial. Arthritis Rheum 2005;52(9 suppl):1203. Abstract. Herrero-Beaumont G, Ivorra JA, et al. Glucosamine sulfate in the treatment of knee osteoarthritis symptoms: a randomized, double-blind, placebo-controlled study using acetaminophen as a side comparator. Arthritis Rheum 2007;56(2):555-67. Hizmetli S, Kocagil S, Kaptanoglu E, et al. The efficacy and safety of intra-articular hyaluronic acid in osteoarthritis of the knee: a prospective, double-blind trial. Unpublished study cited in Bellamy N, Campbell J, Robinson V, et al. Viscosupplementation for the treatment of osteoarthritis of the knee. Cochrane Database Syst Rev 2005;(2):CD005321.
Hochberg MC. Nutritional supplements for knee osteoarthritis – still no resolution. N Engl J Med 2006;354:858-860. Hochberg MC, Altman RD, Brandt KD, et al. Guidelines for the medical management of osteoarthritis. Part I. Osteoarthritis of the hip. Arthritis Rheum 1995a;38(11):1535-40. Hochberg MC, Altman RD, Brandt KD, et al. Guidelines for the medical management of osteoarthritis. Part II. Osteoarthritis of the knee. Arthritis Rheum 1995b;38(11):1541-6. Houpt JB, McMillan R, Paget-Dellio D, et al. Effect of glucosamine hydrochloride (GHcl) in the treatment of pain of osteoarthritis of the knee. J Rheumatol 1998;25(Suppl 52):8 (abstract M22). Houpt JB, McMillan R, Wein C, et al. Effect of glucosamine hydrochloride in the treatment of pain of osteoarthritis of the knee. J Rheumatol 1999;26(11):2423-30. Hughes R, Carr A. A randomized, double-blind, placebo-controlled trial of glucosamine sulphate as an analgesic in osteoarthritis of the knee. Rheumatology (Oxford) 2002;41(3):279-84. Huskisson EC, Donnelly S. Hyaluronic acid in the treatment of osteoarthritis of the knee. Rheumatology (Oxford) 1999;38(7):602-7. Ilahi OA, Reddy J, Ahmad I. Deep venous thrombosis after knee arthroscopy: a meta-analysis. Arthroscopy 2005;21 (6):727-30. Institute of Medicine and National Research Council. Prototype monograph on glucosamine. Prepared as an example for the report: Dietary Supplements – A Framework for Evaluating Safety. Washington, DC: National Academies Press;2004. Available at www.iom.edu/Object.File/Master/19/560/Introduction%20and%20Glucosamine%20Prototype%20Monograph.v2.pdf. Accessed December 2006. Jackson RW, Dieterichs C. The results of arthroscopic lavage and debridement of osteoarthritic knees based on the severity of degeneration: a 4- to 6-year symptomatic follow-up. Arthroscopy 2003;19(1):13-20. Jadad AR, Moore RA, Carroll D, et al. Assessing the quality of reports of randomized clinical trials: is blinding necessary? Control Clin Trials 1996;17(1):1-12. Johnson LL. A controlled trial of arthroscopic surgery for osteoarthritis of the knee. Arthroscopy 2002;18(7):683-7.

151
Jordan KM, Arden NK, Doherty M, et al. EULAR recommendations 2003: an evidence based approach to the management of knee osteoarthritis: report of a task force of the Standing Committee for International Clinical Studies Including Therapeutic Trials (ESCISIT). Ann Rheum Dis 2003;62:1145-1155. Jubb RW, Piva S, Beinat L, et al. A one-year, randomised, placebo (saline) controlled clinical trial of 500-730 kDa sodium hyaluronate (Hyalgan) on the radiological change in osteoarthritis of the knee. Int J Clin Pract 2003;57(6):467-74. Kaneto H, Xu G, Song KH, et al. Activation of the hexosamine pathway leads to deterioration of pancreatic beta-cell function through the induction of oxidative stress. J Biol Chem. 2001;276(33):31099-31104. Karlsson J, Selin-Sjogren L. A comparison of two hyaluronan drugs and placebo in patients with mild to moderate osteoarthritis of the knee—a controlled, randomised, parallel-design multicenter study. Acta Orthop Scand Suppl 1999;70(Suppl 287):62. Karlsson J, Sjogren LS, Lohmander LS. Comparison of two hyaluronan drugs and placebo in patients with knee osteoarthritis. A controlled, randomized, double-blind, parallel-design multicentre study. Rheumatology (Oxford) 2002;41(11):1240-8. Kellgren JH, Lawrence JS. Radiological assessment of osteoarthrosis. Ann Rheum Dis 1957;16:494–502. Kemper F, Gebhardt U, Meng T, et al. Tolerability and short-term effectiveness of hylan G-F 20 in 4253 patients with osteoarthritis of the knee in clinical practice. Curr Med Res Opin 2005;21(8):1261-9. Kerzberg EM, Roldan EJ, Castelli G, et al. Combination of glycosaminoglycans and acetylsalicylic acid in knee osteoarthrosis. Scand J Rheumatol 1987;16 (5):377-80. Kirwan J. Is there a place for intra-articular hyaluronate in osteoarthritis of the knee? Knee 2001;8(2):93-101. Kotevoglu N, Iyibozkurt PC, Hiz O, et al. A prospective randomised controlled clinical trial comparing the efficacy of different molecular weight hyaluronan solutions in the treatment of knee osteoarthritis. Rheumatol Int 2006;26(4):325-30. Kraus VB. Pathogenesis and treatment of osteoarthritis. Med Clin North Am 1997;81(1):85-112. Krystallis CT, Kirkos JM, Papavasiliou KA, et al. Arthroscopic debridement of the osteoarthritic knee under local anaesthesia. Acta Orthop Belg 2004;70(3):260-7. Larsen A, Dale K, Eek M. Radiographic evaluation of rheumatoid arthritis and related conditions by standard reference films. Acta Radiol Diagn (Stockh) 1977;18(4):481-91.
Laskin RS, Ohnsorge JA. The role of arthroscopy: beneficial, placebo, or worse? Orthopedics 2005;28(9):975-6. Lau J, Ioannidis JP, Terrin N, et al. The case of the misleading funnel plot. BMJ 2006;333(7568):597-600. Lawrence RC, Helmick CG, Arnett FC, et al. Estimates of the prevalence of arthritis and selected musculoskeletal disorders in the United States. Arthritis Rheum 1998;41(5):778-799. Leeb BF, Schweitzer H, Montag K, et al. A metaanalysis of chondroitin sulfate in the treatment of osteoarthritis. J Rheumatol 2000;27(1):205-11. Leffler CT, Philippi AF, Leffler SG, et al. Glucosamine, chondroitin, and manganese ascorbate for degenerative joint disease of the knee or low back: a randomized, double-blind, placebo-controlled pilot study. Mil Med 1999;164(2):85-91. Lequesne MG, Mery C, Samson M, et al. Indexes of severity for osteoarthritis of the hip and knee: validation in comparison with other assessment tests. Scand J Rheum 1987;(suppl 65):85-89. L'Hirondel JL. Klinische doppelblind-studie mit oral verabreichtem chondroitinsulfat gegen placebo bei der tibiofemoralen gonarthrose (125 patienten). Litera Rheumatologica 1992;14:77-84. Linschoten NJ, Johnson CA. Arthroscopic debridement of knee joint arthritis: effect of advancing articular degeneration. J South Orthop Assoc 1997;6(1):25-36. Livesley PJ, Doherty M, Needoff M, et al. Arthroscopic lavage of osteoarthritic knees. J Bone Joint Surg Br 1991;73(6):922-6. Lo GH, LaValley M, McAlindon T, et al. Intra-articular hyaluronic acid in treatment of knee osteoarthritis: a meta-analysis. JAMA 2003;290(23):3115-21. Lohmander LS, Dalen N, Englund G, et al. Intra-articular hyaluronan injections in the treatment of osteoarthritis of the knee: a randomised, double blind, placebo controlled multicentre trial. Hyaluronan Multicentre Trial Group. Ann Rheum Dis 1996;55(7):424-31. Lopes Vaz A. Double-blind clinical evaluation of the relative efficacy of ibuprofen and glucosamine sulphate in the management of osteoarthrosis of the knee in out-patients. Curr Med Res Opin 1982;8(3):145-9. Lubowitz JH. A controlled trial of arthroscopic surgery for osteoarthritis of the knee. Arthroscopy 2002;18(8):950-1. Lussier A, Cividino AA, McFarlane CA, et al. Viscosupplementation with hylan for the treatment of osteoarthritis: findings from clinical practice in Canada. J Rheumatol 1996;23(9):1579-85.

152
Maheu E, Bonvarlet J. Acute pseudo-septic arthritis post hyaluronane (HA) intra-articular (IA) injections. Results of a French survey in rheumatology practice. European League Against Rheumatism (EULAR) 2003 Annual Meeting. Lisbon, Portugal. Abstract FRI0240. Available at www.abstracts2view.com/eular/view.php?nu=EULAR03L1_2003FRI0240. Accessed November 2006. Mandelbaum B, Waddell D. Etiology and pathophysiology of osteoarthritis. Orthopedics 2005;28(2):s207-s214. Manek NJ, Lane NE. Osteoarthritis: current concepts in diagnosis and management. Am Fam Physician 2000;61(6):1795-804. Matheson AJ, Perry CM. Glucosamine: a review of its use in the management of osteoarthritis. Drugs Aging 2003;20(14):1041-1060. Mazieres B, Combe B, Phan Van A, et al. Chondroitin sulfate in osteoarthritis of the knee: a prospective, double blind, placebo controlled multicenter clinical study. J Rheumatol 2001;28(1):173-81. Mazieres B, Hucher M, Zaim M, et al. Effect of chondroitin sulfate in symptomatic knee osteoarthritis: a multicenter, randomized, double-blind, placebo-controlled study. Ann Rheum Dis 2007 Jan 4; [Epub ahead of print]. Mazieres B, Loyau G, Menkes CJ, et al. [Chondroitin sulfate in the treatment of gonarthrosis and coxarthrosis. 5-months result of a multicenter double-blind controlled prospective study using placebo]. Rev Rhum Mal Osteoartic 1992;59(7-8):466-72. McAlindon T. Why are clinical trials of glucosamine no longer uniformly positive? Rheum Dis Clin North Am 2003;29(4):789-801. McAlindon T, Formica M, LaValley M, et al. Effectiveness of glucosamine for symptoms of knee osteoarthritis: results from an internet-based randomized double-blind controlled trial. Am J Med 2004;117(9):643-9. McAlindon TE, LaValley MP, Gulin JP, et al. Glucosamine and chondroitin for treatment of osteoarthritis: a systematic quality assessment and meta-analysis. JAMA 2000;283(11):1469-75. McConnell S, Kolopack P, Davis AM. The Western Ontario and McMaster Universities Osteoarthritis Index (WOMAC): a review of its utility and measurement properties. Arthritis Care Res 2001;45:453-461. McGinley BJ, Cushner FD, Scott WN. Debridement arthroscopy. 10-year followup. Clin Orthop Relat Res 1999;(367):190-4. McLaren AC, Blokker CP, Fowler PJ, et al. Arthroscopic debridement of the knee for osteoarthrosis. Can J Surg 1991;34(6):595-8.
McQuay HJ, Moore A. Evidenced-based resource for pain relief. NY: Oxford University Press; 1998. Merchan EC, Galindo E. Arthroscope-guided surgery versus nonoperative treatment for limited degenerative osteoarthritis of the femorotibial joint in patients over 50 years of age: a prospective comparative study. Arthroscopy 1993;9(6):663-7. Michel BA, Stucki G, Frey D, et al. Chondroitins 4 and 6 sulfate in osteoarthritis of the knee: a randomized, controlled trial. Arthritis Rheum 2005;52(3):779-86. Modawal A, Ferrer M, Choi HK, et al. Hyaluronic acid injections relieve knee pain. J Fam Pract 2005;54(9):758-67. Moher D, Cook DJ, Eastwood S, et al. Improving the quality of reports of meta-analyses of randomised controlled trials: the QUOROM statement. Lancet 1999;354:1896-1900. Monauni T, Zenti MG, Cretti A, et al. Effects of glucosamine infusion on insulin secretion and insulin action in humans. Diabetes 2000;49(6):926-35. Moreland LW, Arnold WJ, Saway A, et al. Efficacy and safety of intra-articular hylan G-F 20 (Synvisc), a viscoelastic derivative of hyaluronan, in patients with osteoarthritis of the knee. Arthritis Rheum 1993;36(Suppl 9):165. Morreale P, Manopulo R, Galati M, et al. Comparison of the antiinflammatory efficacy of chondroitin sulfate and diclofenac sodium in patients with knee osteoarthritis. J Rheumatol 1996;23(8):1385-91. Moseley JB, O'Malley K, Petersen NJ, et al. A controlled trial of arthroscopic surgery for osteoarthritis of the knee. N Engl J Med 2002;347(2):81-8. Muller-Fassbender H, Bach GL, Haase W, et al. Glucosamine sulfate compared to ibuprofen in osteoarthritis of the knee. Osteoarthritis Cartilage 1994;2(1):61-9. Muniyappa R, Karne RJ, Hall G, et al. Oral glucosamine for 6 weeks at standard doses does not cause or worsen insulin resistance or endothelial dysfunction in lean or obese subjects. Diabetes 2006;55(11):3142-50. Neustadt D, Wade J, Gimbel J, et al. Clinical effects of intra-articular high molecular weight hyaluronan (Orthovisc®) in osteoarthritis of the knee. Arthritis Rheum 2004;50 (Suppl 9):S144 (Abstract #238). Neustadt DH. Intraarticular steroid therapy. In: Osteoarthritis: diagnosis and medical/surgical management. RW Moskowitz, et al., eds. Philadelphia;WB Sanders, 1992.

153
Neustadt DH, Caldwell JR, Burnette MC, et al. Intra-articular high molecular weight hyaluronan (Orthovisc(R)) is effective in the treatment of pain of knee osteoarthritis. Ann Rheum Dis 2005;64(Suppl III):493 (Abstract #SAT0265). Noack W, Fischer M, Forster KK, et al. Glucosamine sulfate in osteoarthritis of the knee. Osteoarthritis Cartilage 1994;2(1):51-9. Ogilvie-Harris DJ, Fitsialos DP. Arthroscopic management of the degenerative knee. Arthroscopy 1991;7(2):151-7. O'Malley KJ, Suarez-Almazor M, Aniol J, et al. Joint-specific multidimensional assessment of pain (J-MAP): factor structure, reliability, validity, and responsiveness in patients with knee osteoarthritis. J Rheumatol 2003;30(3):534-43. Oxman AD, Guyatt GH. Validation of an index of the quality of review articles. J Clin Epidemiol 1991;44(11):1271-1278. Oxman AD, Guyatt GH, Singer J, et al. Agreement among reviewers of review articles. J Clin Epidemiol 1991;44(1):91-8. Pavelka K, Bucsi L, Manopulo R. Double-blind, dose effect study of oral CS 4 & 6 1200 mg, 800 mg, 200 mg against placebo in the treatment of femorotibial osteoarthritis. EULAR Rheumatol Litera 1998;27 (Suppl 2):63. Pavelka K, Gatterova J, Olejarova M, et al. Glucosamine sulfate use and delay of progression of knee osteoarthritis: a 3-year, randomized, placebo-controlled, double-blind study. Arch Intern Med 2002;162(18):2113-23. Pendleton A, Arden N, Dougados M, et al. EULAR recommendations for the management of knee osteoarthritis: report of a task force of the Standing Committee for International Clinical Studies Including Therapeutic Trials (ESCISIT). Ann Rheum Dis 2000;59:936-44. Petrella RJ, DiSilvestro MD, Hildebrand C. Effects of hyaluronate sodium on pain and physical functioning in osteoarthritis of the knee: a randomized, double-blind, placebo-controlled clinical trial. Arch Intern Med 2002;162(3):292-8. Petrella RJ, Petrella M. A prospective, randomized, double-blind, placebo controlled study to evaluate the efficacy of intraarticular hyaluronic acid for osteoarthritis of the knee. J Rheumatol 2006;33(5):951-6. Peyron JQ. Intraarticular hyaluronan injections in the treatment of osteoarthritis: state-of-the-art review. J Rheumatol 1993;20(suppl 39):10-15.
Pham T, Le Henanff A, Ravaud P, et al. Evaluation of the symptomatic and structural efficacy of a new hyaluronic acid compound, NRD101, in comparison with diacerein and placebo in a 1 year randomised controlled study in symptomatic knee osteoarthritis. Ann Rheum Dis 2004;63(12):1611-7. Pham T, van der Heijde D, Altman RD, et al. OMERACT-OARSI initiative: Osteoarthritis Research Society International set of responder criteria for osteoarthritis clinical trials revisited. Osteoarthritis Cartilage 2004;12(5):389-99. Poehling GG. Degenerative arthritis arthroscopy and research. Arthroscopy 2002;18(7):683-7. Poolsup N, Suthisisang C, Channark P, et al. Glucosamine long-term treatment and the progression of knee osteoarthritis: systematic review of randomized controlled trials. Ann Pharmacother 2005;39(6):1080-7. Pouwels MJ, Jacobs JR, Span PN, et al. Short-term glucosamine infusion does not affect insulin sensitivity in humans. Clin Endocrinol Metab. 2001;86(5):2099-103. Puhl W, Bernau A, Greiling H, et al. Intra-articular sodium hyaluronate in osteoarthritis of the knee: a multicenter, double-blind study. Osteoarthritis Cartilage 1993;1(4):233-41. Pujalte JM, Llavore EP, Ylescupidez FR. Double-blind clinical evaluation of oral glucosamine sulphate in the basic treatment of osteoarthrosis. Curr Med Res Opin 1980;7(2):110-14. Qiu GX, Gao SN, Giacovelli G, et al. Efficacy and safety of glucosamine sulfate versus ibuprofen in patients with knee osteoarthritis. Arzneimittelforschung 1998;48(5):469-74. Reginster JY, Deroisy R, Rovati LC, et al. Long-term effects of glucosamine sulphate on osteoarthritis progression: a randomised, placebo-controlled clinical trial. Lancet 2001;357(9252):251-6. Reichelt A, Forster KK, Fischer M, et al. Efficacy and safety of intramuscular glucosamine sulfate in osteoarthritis of the knee. A randomised, placebo-controlled, double-blind study. Arzneimittelforschung 1994;44(1):75-80. Richy F, Bruyere O, Ethgen O, et al. Structural and symptomatic efficacy of glucosamine and chondroitin in knee osteoarthritis: a comprehensive meta-analysis. Arch Intern Med 2003;163(13):1514-22. Rindone JP, Hiller D, Collacott E, et al. Randomized, controlled trial of glucosamine for treating osteoarthritis of the knee. West J Med 2000;172(2):91-4.

154
Rolf CG, Engstrom B, Ohrvik J, et al. A comparative study of the efficacy and safety of hyaluronan viscosupplements and placebo in patients with symptomatic and arthroscopy-verified cartilage pathology. J Clin Res 2005;8(15-32):15-32. Rothman K, Greenland S. Modern epidemiology, 2nd Ed. Philadelphia: Lippincott-Raven; 1998. Rovati LC. The clinical profile of glucosamine sulfate as a selective symptom modifying drug in osteoarthritis: current data and perspectives. Osteoarthritis Cartilage 1997;5(Suppl A):72. Rovetta G. Galactosaminoglycuronoglycan sulfate (matrix) in therapy of tibiofibular osteoarthritis of the knee. Drugs Exp Clin Res 1991;17(1):53-7. Russell IJ, Michalek JE, Lawrence VA, et al. A randomized, placebo (PL) and no-intervention (NI) controlled trial of intra-articular (IA) 1 percent sodium hyaluronate (HA) in the treatment of knee osteoarthritis (OA). Arthritis Rheum 1992;35(Suppl):S132-9. Sacks HS, Reitman D, Pagano D, et al. Meta-analysis: An update. Mt Sinai J Med 1996;63(3-4):216-24. Salaffi F, Carotti M, Grassi W. Health-related quality of life in patients with hip or knee osteoarthritis: comparison of generic and disease-specific instruments. Clin Rheumatol 2005;24(1):29-37. Scale D, Wobig M, Wolpert W. Viscosupplementation of osteoarthritic knees with hylan: a treatment schedule study. Curr Ther Res Clin Exp 1994;55(3):220-32. Scroggie DA, Albright A, Harris MD. The effect of glucosamine-chondroitin supplementation on glycosylated hemoglobin levels in patients with type 2 diabetes mellitus: a placebo-controlled, double-blinded, randomized clinical trial. Arch Intern Med 2003;163(13):1587-90. Senn S. Statistical issues in drug development. NY: John Wiley and Sons; 1997. Sezgin M, Demirel AC, Karaca C, et al. Does hyaluronan affect inflammatory cytokines in knee osteoarthritis? Rheumatol Int 2005;25(4):264-9. Shannon FJ, Devitt AT, Poynton AR, et al. Short-term benefit of arthroscopic washout in degenerative arthritis of the knee. Int Orthop 2001;25(4):242-5. Shea BJ, Grimshaw JM, Wells GA, et al. Development of AMSTAR: a measurement tool to assess the methodological quality of systematic reviews. BMC Med Res Methodol 2007;7:10.
Shichikawa K, Igarashi M, Sugawara S, et al. Clinical evaluation of high molecular weight sodium hyaluronate (SPH) on osteoarthritis of the knee—a multi-center well controlled comparative study. Jpn J Clin Pharmacol Therapeut 1983a;14(3):545-58. Shichikawa K, Maeda A, Ogawa N. [Clinical evaluation of sodium hyaluronate in the treatment of osteoarthritis of the knee]. Ryumachi 1983b;23(4):280-90. Sprague NF 3rd. Arthroscopic debridement for degenerative knee joint disease. Clin Orthop Relat Res 1981;(160):118-23. Sterne JA, Egger M. Funnel plots for detecting bias in meta-analysis: guidelines on choice of axis. J Clin Epidemiol 2001;54(10):1046-55. Strand V, Conaghan PG, Lohmander LS, et al. An integrated analysis of five double-blind, randomized controlled trials evaluating the safety and efficacy of a hyaluronan product for intra-articular injection in osteoarthritis of the knee. Osteoarthritis Cartilage 2006;14:859. Stumpf JL, Lin SW. Effect of glucosamine on glucose control. Ann Pharmacother 2006;40(4):694-8. Tamir E, Robinson D, Koren R, et al. Intra-articular hyaluronan injections for the treatment of osteoarthritis of the knee: a randomized, double blind, placebo controlled study. Clin Exp Rheumatol 2001;19(3):265-70. Tannis AJ, Barban J, Conquer JA. Effect of glucosamine supplementation on fasting and non-fasting plasma glucose and serum insulin concentrations in healthy individuals. Osteoarthritis Cartilage 2004;12(6):506-11. Timoney JM, Kneisl JS, Barrack RL, et al. Arthroscopy update #6. Arthroscopy in the osteoarthritic knee. Long-term follow-up. Orthop Rev 1990;19(4):371-3, 376-9. Towheed TE, Maxwell L, Anastassiades TP, et al. Glucosamine therapy for treating osteoarthritis. Cochrane Database Syst Rev 2005;(2):CD002946. Tsai CL, Chang CC, Chen SC, et al. Treatment of knee osteoarthritis in Asian population with an intra-articular hyaluronan of MW500-730 KDa. Osteoarthritis Cartilage 2003;11(Suppl A):119. Tubach F, Wells GA, Ravaud P, et al. Minimal clinically important difference, low disease activity state, and patient acceptable symptom state: methodological issues. J Rheumatol 2005;32(10):2025-9. Uebelhart D, Malaise M, Marcolongo R, et al. Intermittent treatment of knee osteoarthritis with oral chondroitin sulfate: a one-year, randomized, double-blind, multicenter study versus placebo. Osteoarthritis Cartilage 2004;12(4):269-76.

155
Uebelhart D, Thonar EJ, Delmas PD, et al. Effects of oral chondroitin sulfate on the progression of knee osteoarthritis: a pilot study. Osteoarthritis Cartilage 1998;6 (Suppl A):39-46. Usha PR, Naidu MUR. Randomised, double-blind, parallel, placebo-controlled study of oral glucosamine, methylsulfonylmethane and their combination in osteoarthritis. Clin Drug Invest 2004;24(6):353-63. Vajaradul Y. Double-blind clinical evaluation of intra-articular glucosamine in outpatients with gonarthrosis. Clin Ther 1981;3(5):336-43. Vajranetra P. Clinical trial of glucosamine compounds for osteoarthrosis of knee joints. J Med Assoc Thai 1984;67(7):409-18. van Belle G. Statistical rules of thumb. NY: Wiley; 2002. Viechtbauer W. Confidence intervals for the amount of heterogeneity in meta-analysis. Stat Med 2007;26(1):37-52. Waddell DD. The tolerability of viscosupplementation: low incidence and clinical management of local adverse events. Curr Med Res Opin 2003;19(7):575-80. Wai EK, Kreder HJ, Williams JI. Arthroscopic debridement of the knee for osteoarthritis in patients fifty years of age or older: utilization and outcomes in the Province of Ontario. J Bone Joint Surg Am 2002;84-A(1):17-22. Wang CJ, Chen HS, Huang TW, et al. Outcome of surgical reconstruction for posterior cruciate and posterolateral instabilities of the knee. Injury 2002;33(9):815-21. Weinstein JN, Tosteson TD, Lurie JD, et al. Surgical vs nonoperative treatment for lumbar disk herniation: the Spine Patient Outcomes Research Trial (SPORT): a randomized trial. JAMA 2006 Nov 22;296(20):2441-50.
West S, King V, Carey TS, et al. Systems to Rate the Strength of Scientific Evidence. Evidence Report/Technology Assessment No. 47 (Prepared by the Research Triangle Institute-University of North Carolina Evidence-based Practice Center under Contract No. 290-97-0011). AHRQ Publication No. 02-E016. Rockville, MD: Agency for Healthcare Research and Quality. April 2002. Wobig M, Dickhut A, Maier R, et al. Viscosupplementation with hylan G-F 20: a 26-week controlled trial of efficacy and safety in the osteoarthritic knee. Clin Ther 1998;20(3):410-23. Wobig M, Bach G, Beks P, et al. The role of elastoviscosity in the efficacy of viscosupplementation for osteoarthritis of the knee: a comparison of hylan G-F 20 and a lower-molecular-weight hyaluronan. Clin Ther 1999;21(9):1549-62. Wray NP, Moseley JB, O'Malley K. Arthroscopic treatment of osteoarthritis of the knee. J Bone Joint Surg Am 2003;85-A(2):381. Wu JJ, Shih LY, Hsu HC, et al. The double-blind test of sodium hyaluronate (ARTZ) on osteoarthritis knee. Zhonghua Yi Xue Za Zhi (Taipei) 1997;59(2):99-106. Yang SS, Nisonson B. Arthroscopic surgery of the knee in the geriatric patient. Clin Orthop Relat Res 1995;(316):50-8. Yoshikawa H, Tajiri Y, Sako Y, et al. Glucosamine-induced beta-cell dysfunction: a possible involvement of glucokinase or glucose-transporter type 2. Pancreas 2002;24(3):228-34. Zenk JL, Helmer TR, Kuskowski MA. The effects of milk protein concentrate on the symptoms of osteoarthritis in adults: an exploratory, randomized, double-blind, placebo-controlled trial. Curr Ther Res 2002;63(7):430-42.


157
List of Acronyms/Abbreviations
? unknown; unclear 1° primary 2° secondary A arthroscopy Acet acetaminophen ACR American College of Rheumatology ADL Activities of Daily Living ADL arthroscopy, lavage, and debridement AE(s) adverse events AL arthroscopy and lavage ARA American Rheumatism Association BMI body mass index CI confidence interval D debridement dis disease FE fixed effects GH glucosamine hydrochloride GS glucosamine sulfate HSS Hospital for Special Surgery IA intra-articular ITT intention-to-treat JSN joint space narrowing K-L Kellgren-Lawrence L lavage LI Lequesne Index MA(s) meta-analysis(es) mn mean mo(s) month(s) N number n number N no NR not reported NS nonsignificant NSAID(s) nonsteroidal anti-inflammatory drug(s) NSD no significant difference OA osteoarthritis OAK osteoarthritis of the knee OMERACT-OARSI Outcomes Measures in Rheumatology Clinical Trials-Osteoarthritis Research Society Pl placebo PT physical therapy pts patients RCT(s) randomized, controlled trial(s) RE random effects rng range RR relative risk sd standard deviation SEM standard error of the mean SMD standardized mean difference Tx treatment USPSTF U.S. Preventive Services Task Force VAS visual analog scale WMD weighted mean difference WOMAC Western Ontario and McMaster Universities Osteoarthritis Index Y yes yr(s) year(s)

APPENDIXES

A-1
Appendix A. Exact Search Strings • MEDLINE® (through March 29, 2007) • EMBASE (through March 16, 2006) • Cochrane Controlled Trials Register (through November 27, 2006) EMBASE was updated with abbreviated searches through November 27, 2006. Database Search Strategies: • "osteoarthritis, knee"[MeSH] OR • "osteoarthritis"[MeSH] AND (knee(tw) OR knees(tw)) OR • osteoarthritis*(tw) AND (knee(tw) OR knees(tw)) OR • "osteoarthritis"[MeSH] AND patellofemoral (tw) AND • human (limit/tag) Results of the above search were limited to citations also identified by the Cochrane Handbook search strategy for controlled trials (Alderson et al. 2004): • randomized controlled trial [pt] OR • controlled clinical trial [pt] OR • randomized controlled trials [mh] OR • random allocation [mh] OR • double-blind method [mh] OR • single-blind method [mh] OR • clinical trial [pt] OR • clinical trials [mh] OR • "clinical trial" [tw] OR • ((singl* [tw] OR doubl* [tw] OR trebl* [tw] OR tripl* [tw]) AND (mask* [tw] OR blind* [tw])) OR • placebos [mh] OR • placebo* [tw] OR • random* [tw] OR • research design [mh:noexp] OR • comparative study [mh] OR • evaluation studies [mh] OR • follow-up studies [mh] OR • prospective studies [mh] OR • control* [tw] OR • prospectiv* [tw] OR • volunteer* [tw])

A-2
For glucosamine and chondroitin, the results of the above search were combined with the results of a search using: • "Glucosamine"[MeSH] OR "Chondroitin"[MeSH] OR • glucosamine(tw) OR • acetylglucosamine(tw) OR • "n-acetylglucosamine"(tw) OR • "n-acetyl-d-glucosamine"(tw) OR • chondroitin(tw) For hyaluronic acid, the results of the first search above were combined with the results of a search using: • "Hyaluronic Acid"[MeSH] OR • "sodium hyaluronate"(tw) OR • hyaluronan(tw) OR • hyaluronic(tw) OR • hylan(tw) OR • hyalgan(tw) OR • synvisc(tw) OR • orthovisc(tw) OR • euflexxa(tw) OR • supartz(tw) OR • nuflexxa(tw) OR • viscosupplement* For arthroscopy, the results of the first search above were combined with the results of a search using: • "Arthroscopy"[MeSH] OR • arthroscopy(tw) OR • arthroscopic(tw) OR • arthroscope(tw)) OR • lavage(tw) OR • debridement(tw)

B-1
Appendix B. Listing of Excluded Studies Exclusion Codes AO arthroscopic procedure other than lavage and debridement CS case series FEW too few subjects (< 50 for arthroscopy case series) FLA foreign language article FNA foreign language, no abstract NDE not correct study design NPD no primary data NRA narrative review article NRD non-relevant disease NRQ non-relevant study question RCT randomized controlled trial Intervention Codes ARTH arthroscopy GC glucosamine/chondroitin VS viscosupplementation 1. Arthroscopic lavage for osteoarthritis of the knee. Evid.-Based Healthc. Public Health 2005; 9(3):192-6.
Notes: ARTH NRA
2. Arthroscopy no benefit for osteoarthritis. OR Manager 2002; 18(9):32. Notes: ARTH NPD
3. Further evidence supports use of glucosamine for knee pain. Pharm. J. 2003; 270 (7234):142. Notes: GC NPD
4. Glucosamine/chondroitin: No clear benefit in knee pain. Pharm. J. 2005; 275 (7377):657. Notes: GC NPD
5. Glucosamine delays progression of osteoarthritis in the knee joint. Pharm. J. 2002; 269(7221):594. Notes: GC NRQ RCT
6. Hyaluronan or hylans for knee osteoarthritis? Drug Ther Bull 1999; 37(9):71-2. Notes: VS NRA
7. Hyaluronic acid minimally effective for knee degenerative joint disease. Cleve Clin J Med 2004; 71(4):272. Notes: VS NPD
8. Adams ME. An analysis of clinical studies of the use of crosslinked hyaluronan, hylan, in the treatment of osteoarthritis. J Rheumatol Suppl 1993; 39:16-8. Notes: VS NRA

B-2
9. Adams ME, Atkinson MH, Lussier AJ et al. The role of viscosupplementation with hylan G-F 20 (Synvisc) in the treatment of osteoarthritis of the knee: a Canadian multicenter trial comparing hylan G-F 20 alone, hylan G-F 20 with non-steroidal anti-inflammatory drugs (NSAIDs) and NSAIDs alone. Osteoarthritis Cartilage 1995; 3(4):213-25. Notes: VS NRQ RCT
10. Adams ME, Li DK, McConkey JP et al. Evaluation of cartilage lesions by magnetic resonance imaging at 0.15 T: comparison with anatomy and concordance with arthroscopy. J Rheumatol 1991; 18(10):1573-80. Notes: ARTH AO
11. Aderinto J, Cobb AG. Lateral release for patellofemoral arthritis. Arthroscopy 2002; 18(4):399-403. Notes: ARTH AO
12. Aggarwal A, Sempowski IP. Hyaluronic acid injections for knee osteoarthritis. Systematic review of the literature. Can Fam Physician 2004; 50:249-56. Notes: VS NRQ
13. Aglietti P, Pisaneschi A, Buzzi R, Gaudenzi A, Allegra M. Arthroscopic lateral release for patellar pain or instability. Arthroscopy 1989; 5(3):176-83. Notes: ARTH AO
14. Aichroth P. Knee surgery--great strides. Trans Med Soc Lond 1990-1991; 107:61-73. Notes: ARTH NRA
15. Akermark C, Berg P, Bjorkman A, Malm P. Non-animal stabilised hyaluronic acid in the treatment of osteoarthritis of the knee: A tolerability study. Clin. Drug Invest. 2002; 22(3):157-66. Notes: VS NDE
16. Akizuki S, Yasukawa Y, Takizawa T. Does arthroscopic abrasion arthroplasty promote cartilage regeneration in osteoarthritic knees with eburnation? A prospective study of high tibial osteotomy with abrasion arthroplasty versus high tibial osteotomy alone. Arthroscopy 1997; 13(1):9-17. Notes: ARTH NA
17. Alekseeva LI, Arkhangel'skaia GS, Davydova AF et al. [Long-term effects of structum administration (according to data from multicenter trial)]. Ter Arkh 2003; 75(9):82-6. Notes: GC NRQ RCT
18. Alekseeva LI, Benevolenskaia LI, Nasonov EL, Chichasova NV, Kariakin AN. [Structum (chondroitin sulfate)--a new agent for the treatment of osteoarthrosis]. Ter Arkh 1999; 71(5):51-3. Notes: GC NRQ RCT
19. Alekseeva LI, Chichasova NV, Benevolenskaia LI, Nasonov EL, Mendel' OI. [Combined medication ARTRA in the treatment of osteoarthrosis]. Ter Arkh 2005; 77(11):69-75. Notes: GC NRQ RCT
20. Alekseeva LI, Mednikov BL, Piiavskii SA, Nasonova VA, Soldatov DG. [Pharmacoeconomic aspects of use of structum in osteoarthrosis]. Ter Arkh 2001; 73(11):90-2. Notes: GC NRQ RCT
21. Allhoff P, Graf von der Schulenburg JM. [Cost-effectiveness of conservative therapy of knee joint osteoarthritis]. Z Orthop Ihre Grenzgeb 1998; 136(4):288-92. Notes: VS NRQ

B-3
22. Alonge TO, Oni OO. An investigation of the frequency of co-existence of osteophytes and circumscribed full thickness articular surface defects in the knee joint. Afr J Med Med Sci 2000; 29(2):151-3. Notes: ARTH NRD
23. Altman RD, Abramson S, Bruyere O et al. Commentary: osteoarthritis of the knee and glucosamine. Osteoarthritis Cartilage 2006; Epub. Notes: GC NPD
24. Altman RD, Moskowitz R. A randomized clinical trial of intra-articular sodium hyaluronate in patients with osteoarthritis of the knee: a summary. Am J Orthop 1999; 28(11 Suppl):3-4. Notes: VS NPD
25. Anderson JW, Nicolosi RJ, Borzelleca JF. Glucosamine effects in humans: A review of effects on glucose metabolism, side effects, safety considerations and efficacy. Food Chem. Toxicol. 2005; 43(2):187-201. Notes: GC NRA
26. Andersson-Molina H, Karlsson H, Rockborn P. Arthroscopic partial and total meniscectomy: A long-term follow-up study with matched controls. Arthroscopy 2002; 18(2):183-9. Notes: ARTH AO
27. Aroen A, Loken S, Heir S et al. Articular cartilage lesions in 993 consecutive knee arthroscopies. Am J Sports Med 2004; 32(1):211-5. Notes: ARTH AO
28. Atamaz F, Kirazli Y, Akkoc Y. A comparative study between intra-articular hylan G-F 20 and Na-hyaluronate and physical therapy in the management of knee osteoarthritis. Annals of Rheumatic Diseases 2004. Notes: VS NRQ RCT
29. Atamaz F, Kirazli Y, Akkoc Y. A comparison of two different intra-articular hyaluronan drugs and physical therapy in the management of knee osteoarthritis.//. Rheumatol Int 2006; Epublication 1-6. Notes: VS NRQ RCT
30. Auerbach B, Melzer C. [Cross-linked hyaluronic acid in the treatment of osteoarthritis of the knee--results of a prospective randomized trial]. Zentralbl Chir 2002; 127(10):895-9. Notes: VS NRQ RCT
31. Auerbach B, Melzer C. Cross-linked hyaluronic acid in the treatment of osteoarthritis of the knee - Results of a prospective randomized trial: DIE BEHANDLUNG DER GONARTHROSE MIT HOCHVERNETZTER HYALURONSAURE - ERGEBNISSE EINER PROSPEKTIVEN RANDOMISIERTEN STUDIE. Zentralbl. Chir. 2002; 127(10):895-9. Notes: VS NRQ RCT
32. Ayral X. Arthroscopy and joint lavage. Best Pract. Res. Clin. Rheumatol. 2005; 19(3 SPEC. ISS.):401-15. Notes: ARTH NRA
33. Ayral X. Arthroscopy and joint lavage. Best Pract Res Clin Rheumatol 2005; 19(3):401-15. Notes: ARTH NRA
34. Ayral X, Gicquere C, Duhalde A, Boucheny D, Dougados M. Effects of video information on preoperative anxiety level and tolerability of joint lavage in knee osteoarthritis. Arthritis Rheum 2002; 47(4):380-2. Notes: ARTH NRQ RCT

B-4
35. Bailey RE. Arthroscopic surgery ineffective for osteoarthritis of the knee. J Fam Pract 2002; 51(10):813. Notes: ARTH NPD
36. Barrett GR, Treacy SH, Ruff CG. The effect of partial lateral meniscectomy in patients > or = 60 years. Orthopedics 1998; 21(3):251-7. Notes: ARTH AO
37. Barrett JP, Siviero P. Retrospective study of outcomes in Hyalgan(registered trademark)-treated patients with osteoarthritis of the knee. Clin. Drug Invest. 2002; 22(2):87-97. Notes: VS NDE
38. Baumgaertner MR, Cannon WD Jr, Vittori JM, Schmidt ES, Maurer RC. Arthroscopic debridement of the arthritic knee. Clin Orthop Relat Res 1990; (253):197-202. Notes: ARTH CS FEW
39. Bayramoglu M, Karatas M, Cetin N, Akman N, Sozay S, Dilek A. Comparison of two different viscosupplements in knee osteoarthritis -- a pilot study. Clin Rheumatol 2003; 22(2):118-22. Notes: VS NRQ RCT
40. Belickas J, Vitkus L, Fiodorovas M, Pocius G. [Efficiency of arthroscopic treatment in the knee osteoarthritis]. Medicina (Kaunas) 2003; 39(11):1082-9. Notes: ARTH FLA CS
41. Bellamy N, Bell MJ, Goldsmith CH et al. The effectiveness of hylan G-F 20 in patients with knee osteoarthritis: an application of two sets of response criteria developed by the OARSI and one set developed by OMERACT-OARSI. Osteoarthritis Cartilage 2005; 13(2):104-10. Notes: VS NRQ RCT
42. Bellamy N, Bell MJ, Goldsmith CH et al. Evaluation of WOMAC 20, 50, 70 response criteria in patients treated with hylan G-F 20 for knee osteoarthritis. Ann Rheum Dis 2005; 64(6):881-5. Notes: VS NRQ RCT
43. Benedetto KP, Rangger C. Arthroscopic partial meniscectomy: 5-year follow-up. Knee Surg Sports Traumatol Arthrosc 1993; 1(3-4):235-8. Notes: ARTH AO
44. Bernstein H. A critical review of 100 cases: arthroscopy of the knee. IMJ Ill Med J 1980; 158(6):385-7. Notes: ARTH CS FEW
45. Bernstein J, Hou S-M, Wang C-T. Therapeutic effects of hyaluronic acid on osteoarthritis of the knee [1] (multiple letters). J. Bone Jt. Surg. Ser. A 2004; 86(11):2567. Notes: VS NPD
46. Bernstein J, Quach T. A perspective on the study of Moseley et al: questioning the value of arthroscopic knee surgery for osteoarthritis. Cleve Clin J Med 2003; 70(5):401, 405-6, 408-10. Notes: ARTH NPD
47. Bert JM, Gasser SI. Approach to the osteoarthritic knee in the aging athlete: debridement to osteotomy. Arthroscopy 2002; 18(9 Suppl 2):107-10. Notes: ARTH NRA
48. Biggee BA, McAlindon T. Glucosamine for osteoarthritis: part I, review of the clinical evidence. Med Health R I 2004; 87(6):176-9. Notes: GC NRA

B-5
49. Bin SI, Kim JM, Shin SJ. Radial tears of the posterior horn of the medial meniscus. Arthroscopy 2004; 20(4):373-8. Notes: ARTH AO
50. Blacher RS. Arthroscopic surgery for osteoarthritis of the knee. N Engl J Med 2002; 347(21):1717-9; author reply 1717-9. Notes: ARTH NPD
51. Blackburn WD Jr, Bernreuter WK, Rominger M, Loose LL. Arthroscopic evaluation of knee articular cartilage: a comparison with plain radiographs and magnetic resonance imaging. J Rheumatol 1994; 21(4):675-9. Notes: ARTH AO
52. Blohm D, Bojsen B, Sorensen SM, Hansen TB. [Complications of transligamental knee arthroscopy. The frequency of pain and ultrasonographic changes in the inferior patellar tendon]. Ugeskr Laeger 2001; 163(49):6896-9. Notes: ARTH FLA CS
53. Bolano LE, Grana WA. Isolated arthroscopic partial meniscectomy. Functional radiographic evaluation at five years. Am J Sports Med 1993; 21(3):432-7. Notes: ARTH AO
54. Bonamo JJ, Kessler KJ, Noah J. Arthroscopic meniscectomy in patients over the age of 40. Am J Sports Med 1992; 20(4):422-8; discussion 428-9. Notes: ARTH AO
55. Bradley JD, Heilman DK, Katz BP, Gsell P, Wallick JE, Brandt KD. Tidal irrigation as treatment for knee osteoarthritis: a sham-controlled, randomized, double-blinded evaluation. Arthritis Rheum 2002; 46(1):100-8. Notes: ARTH NA
56. Braham R, Dawson B, Goodman C. The effect of glucosamine supplementation on people experiencing regular knee pain. Br J Sports Med 2003; 37(1):45-9; discussion 49. Notes: GC NRD
57. Brismar BH, Wredmark T, Movin T, Leandersson J, Svensson O. Observer reliability in the arthroscopic classification of osteoarthritis of the knee. J Bone Joint Surg Br 2002; 84(1):42-7. Notes: ARTH AO
58. Broderick LS, Turner DA, Renfrew DL, Schnitzer TJ, Huff JP, Harris C. Severity of articular cartilage abnormality in patients with osteoarthritis: evaluation with fast spin-echo MR vs arthroscopy. AJR Am J Roentgenol 1994; 162(1):99-103. Notes: ARTH AO
59. Brower RS, Herkowitz HN, Weissman ML. Conus medullaris injury due to herniated disk and intraoperative positioning for arthroscopy. J Spinal Disord 1995; 8(2):163-5. Notes: ARTH AO
60. Brown DJ, Beinat L. Safety and efcacy of an hyaluronan of 500-730 KDa and Hylan G-F 20 in clinical practice. Osteoarthritis Cartilage 2003; 11(Suppl A):118. Notes: VS NRQ RCT
61. Bruun JV. [Placebo effect: arthroscopic lavage and debridement of knee osteoarthritis]. Ugeskr Laeger 2002; 164(50):5957-8. Notes: ARTH NPD

B-6
62. Bruyere O, Honore A, Ethgen O et al. Correlation between radiographic severity of knee osteoarthritis and future disease progression. Results from a 3-year prospective, placebo-controlled study evaluating the effect of glucosamine sulfate. Osteoarthritis Cartilage 2003; 11(1):1-5. Notes: GC NRQ RCT
63. Bruyere O, Honore A, Rovati LC et al. Radiologic features poorly predict clinical outcomes in knee osteoarthritis. Scand J Rheumatol 2002; 31(1):13-6. Notes: GC NRQ RCT
64. Bruyere O, Pavelka K, Rovati LC et al. Glucosamine sulfate reduces osteoarthritis progression in postmenopausal women with knee osteoarthritis: evidence from two 3-year studies. Menopause 2004; 11(2):138-43. Notes: GC NRQ RCT
65. Burks RT, Metcalf MH, Metcalf RW. Fifteen-year follow-up of arthroscopic partial meniscectomy. Arthroscopy 1997; 13(6):673-9. Notes: ARTH AO
66. Caborn D, Rush J, Lanzer W, Parenti D , Murray C. A randomized, single-blind comparison of the efficacy and tolerability of hylan G-F 20 and triamcinolone hexacetonide in patients with osteoarthritis of the knee. J Rheumatol 2004; 31(2):333-43. Notes: VS NRQ RCT
67. Caborn DN. EFFICACY AND TOLERABILITY OF HYLAN G-F 20 COMPARED TO INTRA-ARTICULAR TRIAMCINOLONE HEXACETONIDE IN PATIENTS WITH OSTEOARTHRITIS OF THE KNEE IN A RANDOMIZED, EVALUATOR-BLINDED STUDY. Ann Rheum Dis (EULAR Meeting, Lisbon, Portugal, June 18-21, 2003) 2003. Notes: VS NRQ RCT
68. Campbell DG, Angel KR, Dobson PJ, Lewis PL, Tandon S. Experiences of viscosupplementation for knee osteoarthritis. Aust Fam Physician 2004; 33(10):863-4. Notes: VS NDE
69. Casscells SW. What, if any, are the indications for arthroscopic debridement of the osteoarthritic knee? Arthroscopy 1990; 6(3):169-70. Notes: ARTH NPD
70. Chambers K, Schulzer M, Sobolev B. A controlled trial of arthroscopic surgery for osteoarthritis of the knee. Arthroscopy 2002; 18(7):683-7. Notes: ARTH NPD
71. Chambers KG, Schulzer M. Arthroscopic surgery for osteoarthritis of the knee. N Engl J Med 2002; 347(21):1717-9; author reply 1717-9. Notes: ARTH NPD
72. Chang RW, Falconer J, Stulberg SD, Arnold WJ, Dyer AR. Prerandomization: an alternative to classic randomization. The effects on recruitment in a controlled trial of arthroscopy for osteoarthrosis of the knee. J Bone Joint Surg Am 1990; 72(10):1451-5. Notes: ARTH NPD
73. Chang RW, Falconer J, Stulberg SD, Arnold WJ, Manheim LM, Dyer AR. A randomized, controlled trial of arthroscopic surgery versus closed-needle joint lavage for patients with osteoarthritis of the knee. Arthritis Rheum 1993; 36(3):289-96. Notes: ARTH NRQ RCT

B-7
74. Chapman AB, Feller JA. Therapeutic arthroscopy for knee osteoarthritis: time to reconsider? Med J Aust 2003; 179(4):179-80. Notes: ARTH NPD
75. Chatain F, Adeleine P, Chambat P, Neyret P. A comparative study of medial versus lateral arthroscopic partial meniscectomy on stable knees: 10-year minimum follow-up. Arthroscopy 2003; 19(8):842-9. Notes: ARTH AO
76. Chen J, Du L-R, Lu H-S. Metaphase effect of arthroscopic debridement for improving pain and joint function of patients with osteoarthritis. Chin. J. Clin. Rehab. 2004; 8(29):6282-3. Notes: ARTH FLA CS
77. Chou P-H, Chen S-K, Chou Y-L, Lee S-W, Su F-C, Lin T-S. Biomechanical analysis of knee osteoarthritis patients after the treatment of glucosamine. Biomed. Eng. Appl. Basis Commun. 2003; 15(1):32-7. Notes: GC NRA
78. Christgau S, Henrotin Y, Tanko LB et al. Osteoarthritic patients with high cartilage turnover show increased responsiveness to the cartilage protecting effects of glucosamine sulphate. Clin Exp Rheumatol 2004; 22(1):36-42. Notes: GC NRQ RCT
79. Cibere J, Kopec JA, Thorne A et al. Randomized, double-blind, placebo-controlled glucosamine discontinuation trial in knee osteoarthritis. Arthritis Rheum 2004; 51(5):738-45. Notes: GC NRQ RCT
80. Cibere J, Thorne A, Kopec JA et al. Glucosamine sulfate and cartilage type II collagen degradation in patients with knee osteoarthritis: randomized discontinuation trial results employing biomarkers. J Rheumatol 2005; 32(5):896-902. Notes: GC NRQ RCT
81. Cicuttini FM, Forbes A, Yuanyuan W, Rush G, Stuckey SL. Rate of knee cartilage loss after partial meniscectomy. J Rheumatol 2002; 29(9):1954-6. Notes: ARTH AO
82. Conrozier T, Mathieu P, Schott AM et al. Factors predicting long-term efficacy of Hylan GF-20 viscosupplementation in knee osteoarthritis. Joint Bone Spine 2003; 70(2):128-33. Notes: VS NDE
83. Conrozier T, Vignon E. Die wirkung von chondroitinsulfat bei der behandlung der huftgelenksarthrose eine doppelblindstudie gegen placebo. Litera Rheumatologica 1992; 14:69-75. Notes: GC Q?
84. Covall DJ, Wasilewski SA. Roentgenographic changes after arthroscopic meniscectomy: five-year follow-up in patients more than 45 years old. Arthroscopy 1992; 8 (2):242-6. Notes: ARTH AO
85. Creel AH, Losina E, Mandl LA et al. An assessment of willingness to participate in a randomized trial of arthroscopic knee surgery in patients with osteoarthritis. Contemp Clin Trials 2005; 26(2):169-78. Notes: ARTH AO
86. _Crevoisier X, Munzinger U, Drobny T. Arthroscopic partial meniscectomy in patients over 70 years of age. Arthroscopy 2001; 17(7):732-6. Notes: ARTH AO

B-8
87. Crolle G, D'Este E. Glucosamine sulphate for the management of arthrosis: a controlled clinical investigation. Curr Med Res Opin 1980; 7(2):104-9. Notes: GC NRQ RCT
88. D'Ambrosio E, Casa B, Bompani R, Scali G, Scali M. Glucosamine sulphate: a controlled clinical investigation in arthrosis. Pharmatherapeutica 1981; 2(8):504-8. Notes: GC NRQ RCT
89. Dai GF, Tang JW, Wang SJ, Liu Q, Shi DP. [Efficacy of intra-articular injection of sodium hyaluronate in post-operation treatment of the knee]. Zhongguo Xiu Fu Chong Jian Wai Ke Za Zhi 2002; 16(1):16-8. Notes: VS NDE
90. Dandy DJ. Abrasion chondroplasty. Arthroscopy 1986; 2(1):51-3. Notes: ARTH NRA
91. Dandy DJ. Arthroscopic debridement of the knee for osteoarthritis. J Bone Joint Surg Br 1991; 73(6):877-8. Notes: ARTH NPD
92. Dawes PT, Kirlew C, Haslock I. Saline washout for knee osteoarthritis: results of a controlled study. Clin Rheumatol 1987; 6(1):61-3. Notes: ARTH NA
93. Day B. The indications for arthroscopic debridement for osteoarthritis of the knee. Orthop Clin North Am 2005; 36(4):413-7. Notes: ARTH NRA
94. Deal CL, Moskowitz RW. Nutraceuticals as therapeutic agents in osteoarthritis. The role of glucosamine, chondroitin sulfate, and collagen hydrolysate. Rheum Dis Clin North Am 1999; 25(2):379-95. Notes: GC NPD
95. Deblock N, Mazeau P, Ceroni D, Scotto Di Luzio A, Meyer Zu Reckendorf G, Dimeglio A. [Knee arthroscopy in children]. Rev Chir Orthop Reparatrice Appar Mot 2001; 87(4):355-60. Notes: ARTH NRD
96. Dervin GF, Feibel RJ, Rody K, Grabowski J. 3-Foot standing AP versus 45 degrees PA radiograph for osteoarthritis of the knee. Clin J Sport Med 2001; 11(1):10-6. Notes: ARTH NDE
97. Dervin GF, Stiell IG, Wells GA, Rody K, Grabowski J. Physicians' accuracy and interrator reliability for the diagnosis of unstable meniscal tears in patients having osteoarthritis of the knee. Can J Surg 2001; 44(4):267-74. Notes: ARTH NRQ
98. Dick W, Henche HR, Morscher E. [The cartilage-damage after fracture of the patella]. Arch Orthop Unfallchir 1975; 81(1):65-76. Notes: ARTH AO
99. Distler J, Anguelouch A. Evidence-based practice: Review of clinical evidence on the efficacy of glucosamine and chondroitin in the treatment of osteoarthritis. J Am Acad Nurse Pract 2006; 18(10):487-93. Notes: GC NRA

B-9
100. Drovanti A, Bignamini AA, Rovati AL. Therapeutic activity of oral glucosamine sulfate in osteoarthrosis: a placebo-controlled double-blind investigation. Clin Ther 1980; 3(4):260-72. Notes: GC NRD
101. Eastwood DM. The failures of arthroscopic partial meniscectomy. Injury 1985; 16(9 ):587-90. Notes: ARTH AO
102. Edelson R, Burks RT, Bloebaum RD. Short-term effects of knee washout for osteoarthritis. Am J Sports Med 1995; 23(3):345-9. Notes: ARTH NRQ RCT
103. Espallargues M, Pons JM. Efficacy and safety of viscosupplementation with Hylan G-F 20 for the treatment of knee osteoarthritis: a systematic review. Int J Technol Assess Health Care 2003; 19(1):41-56. Notes: VS NRQ
104. Espallargues M, Pons JMV. Efficacy and safety of viscosupplementation with Hylan G-F 20 for the treatment of knee osteoarthritis: A systematic review. Int. J. Technol. Assess. Health Care 2003; 19(1):41-56. Notes: VS NRQ
105. Ewing W, Ewing JW. Arthroscopic surgery for osteoarthritis of the knee. N Engl J Med 2002; 347(21):1717-9; author reply 1717-9. Notes: ARTH NPD
106. Felson DT, Buckwalter J. Debridement and lavage for osteoarthritis of the knee. N Engl J Med 2002; 347(2):132-3. Notes: ARTH NPD
107. Felson D.T., Glantz L. A surplus of positive trials: Weighing biases and reconsidering equipoise. Arthritis Res. Ther. 2004; 6(3):117-9. Notes: VS NPD
108. Felson DT, Zhang Y, Hannan MT et al. Risk factors for incident radiographic knee osteoarthritis in the elderly: the Framingham Study. Arthritis Rheum 1997; 40(4):728-33. Notes: ARTH NDE
109. Fleiss DJ. Arthroscopic treatment of osteoarthritis of the knee: a prospective randomised, placebo controlled trial . Am J Sports Med 1997; 25(5):724; author reply 724-5. Notes: ARTH NPD
110. Forssblad M, Weidenhielm L. Knee arthroscopy in local versus general anaesthesia. The incidence of rearthroscopy. Knee Surg Sports Traumatol Arthrosc 1999; 7(5):323-6. Notes: ARTH AO
111. Frias G, Caracuel MA, Escudero A et al. Assessment of the efficacy of joint lavage versus joint lavage plus corticoids in patients with osteoarthritis of the knee. Curr Med Res Opin 2004; 20(6):861-7. Notes: ARTH NRQ RCT
112. Friedman MJ, Berasi CC, Fox JM, Del Pizzo W, Snyder SJ, Ferkel RD. Preliminary results with abrasion arthroplasty in the osteoarthritic knee. Clin Orthop Relat Res 1984; ( 182):200-5. Notes: ARTH AO
113. Frizziero L, Govoni E, Bacchini P. Intra-articular hyaluronic acid in the treatment of osteoarthritis of the knee: clinical and morphological study. Clin Exp Rheumatol 1998; 16(4):441-9. Notes: VS NPD

B-10
114. Frizziero L, Pasquali Ronchetti I. Intra-articular treatment of osteoarthritis of the knee: An arthroscopic and clinical comparison between sodium hyaluronate (500-730 kDa) and methylprednisolone acetate. J. Orthop. Traumatol. 2002; 3(2):89-96. Notes: VS NRQ RCT
115. Gentelle-Bonnassies S, Le Claire P, Mezieres M, Ayral X, Dougados M. Comparison of the responsiveness of symptomatic outcome measures in knee osteoarthritis. Arthritis Care Res 2000; 13(5):280-5. Notes: ARTH NRQ
116. George E. Intra-articular hyaluronan treatment for osteoarthritis. Ann Rheum Dis 1998; 57(11):637-40. Notes: VS NPD
117. Gibson JN, White MD, Chapman VM, Strachan RK. Arthroscopic lavage and debridement for osteoarthritis of the knee. J Bone Joint Surg Br 1992; 74(4):534-7. Notes: ARTH NRQ RCT
118. Gidwani S, Fairbank A. The orthopaedic approach to managing osteoarthritis of the knee. BMJ 2004; 329(7476):1220-4. Notes: ARTH NRA
119. Gillespie WJ, O'Connell DL. Arthroscopic lavage of osteoarthritic knees. J Bone Joint Surg Br 1992; 74(5):787-8; author reply 788-9. Notes: ARTH NPD
120. Gillquist J, Oretorp N. Arthroscopic partial meniscectomy. Technique and long-term results. Clin Orthop Relat Res 1982; (167):29-33. Notes: ARTH AO
121. Gluckert K, Blank-Schal A, Hofmann G, Kladny B, Willauschus W, Wirtz P. [Possibilities for early detection of arthroses using imaging procedures]. Orthopade 1990; 19(1):50-7. Notes: ARTH AO
122. Goerres GW, Hauselmann HJ, Seifert B, Michel BA, Uebelhart D. Patients with knee osteoarthritis have lower total hip bone mineral density in the symptomatic leg than in the contralateral hip. J Clin Densitom 2005; 8(4):484-7. Notes: GC NRQ RCT
123. Goldberg VM, Buckwalter JA. Hyaluronans in the treatment of osteoarthritis of the knee: evidence for disease-modifying activity. Osteoarthritis Cartilage 2005; 13(3):216-24. Notes: VS NRA
124. Goldberg VM, Coutts RD. Pseudoseptic reactions to hylan viscosupplementation: diagnosis and treatment. Clin Orthop Relat Res 2004; (419):130-7. Notes: VS NRA
125. Goldman RT, Scuderi GR, Kelly MA. Arthroscopic treatment of the degenerative knee in older athletes. Clin Sports Med 1997; 16(1):51-68. Notes: ARTH NRA
126. Gondring WH. Arthroscopic surgery of the knee: an early end-result study. Mil Med 1982; 147(8):627-31. Notes: ARTH NRD
127. Gotzsche PC. [Placebo surgery: arthroscopic lavage and debridement of knee osteoarthritis]. Ugeskr Laeger 2002; 164(44):5151. Notes: ARTH NPD

B-11
128. Graf J, Neusel E, Schneider E, Niethard FU. Intra-articular treatment with hyaluronic acid in osteoarthritis of the knee joint: a controlled clinical trial versus mucopolysaccharide polysulfuric acid ester. Clin Exp Rheumatol 1993; 11(4):367-72. Notes: VS NRQ RCT
129. Groppa LG, Moshneaga M. Studying of the efficiency of the Synvisk in osteoarthrosis. Ann Rheum Dis 2001; 60(Suppl 1):230. Notes: VS NDE
130. Gross DE, Brenner SL, Esformes I, Gross ML. Arthroscopic treatment of degenerative joint disease of the knee. Orthopedics 1991; 14(12):1317-21. Notes: ARTH CS FEW
131. Guidolin DD, Ronchetti IP, Lini E, Guerra D, Frizziero L. Morphological analysis of articular cartilage biopsies from a randomized, clinical study comparing the effects of 500-730 kDa sodium hyaluronate (Hyalgan) and methylprednisolone acetate on primary osteoarthritis of the knee. Osteoarthritis Cartilage 2001; 9(4):371-81. Notes: VS NRQ RCT
132. Gunther KP. Surgical approaches for osteoarthritis. Best Pract Res Clin Rheumatol 2001; 15(4):627-43. Notes: ARTH NRA
133. Ha'eri GB, Wiley AM. High tibial osteotomy combined with joint debridement: a long-term study of results. Clin Orthop Relat Res 1980; (151):153-9. Notes: ARTH NA
134. Hamburger MI, Lakhanpal S, Mooar PA, Oster D. Intra-articular hyaluronans: a review of product-specific safety profiles. Semin Arthritis Rheum 2003; 32(5):296-309. Notes: VS NRA
135. Hammesfahr JF, Knopf AB, Stitik T. Safety of intra-articular hyaluronates for pain associated with osteoarthritis of the knee. Am J Orthop 2003; 32(6):277-83. Notes: VS NRA
136. Harrison MM, Morrell J, Hopman WM. Influence of obesity on outcome after knee arthroscopy. Arthroscopy 2004; 20(7):691-5. Notes: ARTH NRD
137. Hart R, Janecek M, Siska V, Kucera B, Stipcak V. [Correlation of long-term clinical and radiological results after meniscectomies]. Acta Chir Orthop Traumatol Cech 2005; 72(5):304-7. Notes: ARTH NRD
138. Hartman GP. Arthroscopic treatment of osteoarthritis of the knee: a prospective, randomized, placebo controlled trial. Am J Sports Med 1997; 25(5):724; author reply 724-5. Notes: ARTH NPD
139. Hathcock JN, Shao A. Risk assessment for glucosamine and chondroitin sulfate. Regul Toxicol Pharmacol 2006. Notes: GC NRA
140. Hauselmann HJ. Nutripharmaceuticals for osteoarthritis. Best Pract Res Clin Rheumatol 2001; 15(4):595-607. Notes: GC NRQ

B-12
141. Higuchi H, Kimura M, Shirakura K, Terauchi M, Takagishi K. Factors affecting long-term results after arthroscopic partial meniscectomy. Clin Orthop Relat Res 2000; (377):161-8. Notes: ARTH AO
142. Hilliquin P, Le Devic P, Menkes CJ. Comparison of the efficacy of nonsurgical synovectomy (synoviorthesis) and joint lavage in knee osteoarthritis with effusions. Rev Rhum Engl Ed 1996; 63(2):93-102. Notes: ARTH CS FEW
143. Hjelle K, Solheim E, Strand T, Muri R, Brittberg M. Articular cartilage defects in 1,000 knee arthroscopies. Arthroscopy 2002; 18(7):730-4. Notes: ARTH AO
144. Hochberg MC. Role of intra-articular hyaluronic acid preparations in medical management of osteoarthritis of the knee. Semin Arthritis Rheum 2000; 30(2 Suppl 1):2-10. Notes: VS NRA
145. Hochberg MC, Altman RD, Brandt KD et al. Guidelines for the medical management of osteoarthritis. Part II. Osteoarthritis of the knee.American College of Rheumatology. Arthritis Rheum 1995; 38(11):1541-6. Notes: ARTH NRA
146. Horng S, Miller FG. Is placebo surgery unethical? N Engl J Med 2002; 347(2):137-9. Notes: ARTH NPD
147. Hu D-Y, Xiao P, Fu S-C, Zhong W-J, Feng W, Zhang F-H. Jingusu glucosamine hydrochloride functional food for improving knee joint function in patients with knee osteoarthritis: A human intake trial. Chin. J. Clin. Rehab. 2005; 9(18):8-9. Notes: GC NDE
148. Huang M-H, Yang R-C, Lee C-L, Chen T-W, Wang M-C. Preliminary results of integrated therapy for patients with knee osteoarthritis. Arthritis Care Res. 2005; 53(6):812-20. Notes: VS NRQ RCT
149. Hubbard MJ. Articular debridement versus washout for degeneration of the medial femoral condyle. A five-year study. J Bone Joint Surg Br 1996; 78(2):217-9. Notes: ARTH NRQ RCT
150. Hulet C, Schiltz D, Locker B, Beguin J, Vielpeau C. [Lateral meniscal cyst. Retrospective study of 105 cysts treated with arthroscopy with 5 year follow-up]. Rev Chir Orthop Reparatrice Appar Mot 1998; 84(6):531-8. Notes: ARTH AO
151. Hulet C, Souquet D, Alexandre P, Locker B, Beguin J, Vielpeau C. Arthroscopic treatment of 105 lateral meniscal cysts with 5-year average follow-up. Arthroscopy 2004; 20(8):831-6. Notes: ARTH AO
152. Hulet C, Souquet D, Alexandre P, Locker B, Beguin J, Vielpeau C. Arthroscopic treatment of 105 lateral meniscal cysts with 5-year average follow-up. Arthroscopy J. Arthroscopic Relat. Surg. 2004; 20(8):831-6. Notes: ARTH AO
153. Ike RW, Arnold WJ. Arthroscopic lavage of osteoarthritic knees. J Bone Joint Surg Br 1992; 74(5):788-9. Notes: ARTH NPD

B-13
154. Ike RW, Arnold WJ, Rothschild EW, Shaw HL. Tidal irrigation versus conservative medical management in patients with osteoarthritis of the knee: a prospective randomized study. Tidal Irrigation Cooperating Group. J Rheumatol 1992; 19(5):772-9. Notes: ARTH NA
155. Insall J. The Pridie debridement operation for osteoarthritis of the knee. Clin Orthop Relat Res 1974; (101):61-7. Notes: ARTH NRQ
156. Israeli A, Liebergal M, Friedman JB, Segal D. Osteoarthritis, the hazard of living longer: arthroscopy vs. conservative treatment. Isr J Med Sci 1996; 32(2):121-2. Notes: ARTH NRA
157. Jackson RW. Arthroscopic surgery for osteoarthritis of the knee. N Engl J Med 2002; 347(21):1717-9; author reply 1717-9. Notes: ARTH NPD
158. Jackson RW. Debate on the use of arthroscopic surgery for osteoarthritis of the knee. Proc (Bayl Univ Med Cent) 2003; 16(1):27, discussion 28-9. Notes: ARTH NPD
159. Jackson RW, Gilbert JE, Sharkey PF. Arthroscopic debridement versus arthroplasty in the osteoarthritic knee. J Arthroplasty 1997; 12(4):465-9; discussion 469-70. Notes: ARTH NPD
160. Jackson RW, Rouse DW. The results of partial arthroscopic meniscectomy in patients over 40 years of age. J Bone Joint Surg Br 1982; 64(4):481-5. Notes: ARTH AO
161. Jackson RW, Silver R, Marans H. Arthroscopic treatment of degenerative joint disease.//. Arthroscopy 1986; 2(2):114. Notes: ARTH CS ABSTR
162. Jager A, Starker M, Herresthal J. [Can meniscus refixation prevent early development of arthrosis in the knee joint? Long-term results]. Zentralbl Chir 2000; 125(6):532-5. Notes: ARTH NRD
163. Janecki CJ, Perry MW, Bonati AO, Bendel M. Safe parameters for laser chondroplasty of the knee. Lasers Surg Med 1998; 23(3):141-50. Notes: ARTH AO
164. Jarvela T, Kannus P, Jarvinen M. Anterior cruciate ligament reconstruction in patients with or without accompanying injuries: A re-examination of subjects 5 to 9 years after reconstruction. Arthroscopy 2001; 17(8):818-25. Notes: ARTH NRD
165. Jazrawi L, Sherman O, Hunt S. Arthroscopic management of osteoarthritis of the knee. J Am Acad Orthop Surg 2003; 11(4):290. Notes: ARTH NPD
166. Jennings JE. Arthroscopic debridement as an alternative to total knee replacement.//. Arthroscopy 1986; 2(2):123-4. Notes: ARTH AO

B-14
167. Jerosch J, Castro WH, Lahm A, Assheuer J. [The value of nuclear magnetic resonance tomography in diseases of the knee joint]. Z Orthop Ihre Grenzgeb 1989; 127(6):661-7. Notes: ARTH AO
168. Johnson LL. Arthroscopic abrasion arthroplasty historical and pathologic perspective: present status. Arthroscopy 1986; 2(1):54-69. Notes: ARTH NRA
169. Johnson LL. A controlled trial of arthroscopic surgery for osteoarthritis of the knee. Arthroscopy 2002; 18(7):683-7. Notes: ARTH NPD
170. Jones AC, Pattrick M, Doherty S, Doherty M. Intra-articular hyaluronic acid compared to intra-articular triamcinolone hexacetonide in inflammatory knee osteoarthritis. Osteoarthritis Cartilage 1995; 3(4):269-73. Notes: VS NRQ RCT
171. Jordan KM, Sawyer S, Coakley P, Smith HE, Cooper C, Arden NK. The use of conventional and complementary treatments for knee osteoarthritis in the community. Rheumatology (Oxford) 2004; 43(3):381-4. Notes: GC NDE
172. Judet H, Judet J, Ben Hamida H. [Patelloplasty for extensive lesions of the patellar cartilage]. Chirurgie 1992; 118(9):529-32. Notes: ARTH AO
173. Kahan A, Guemas E, Lieu PL. Patients with knee osteoarthritis treated by hylan G-F 20 versus usual treatments: a medico-economic, prospective, randomised large scale trial in France, efficacy and safety outcomes. Ann Rheum Dis 2001; 60(Suppl I):232. Notes: VS NRQ
174. Kahan A, Lleu P-L, Salin L. Prospective randomised study comparing the medico-economic benets of hylan GF-20 versus conventional treatment in knee osteoarthritis [Etude prospective randomisee comparant le benece medico-economique de Synvisc a celui des traitements usuels chez des patients souffrant de gonarthrose]. Revue Du Rhumatisme 2003; 70:588-94. Notes: VS NRQ RCT
175. Kahan A, Lleu PL, Salin L. Prospective randomized study comparing the medicoeconomic benefits of Hylan GF-20 vs. conventional treatment in knee osteoarthritis. Joint Bone Spine 2003; 70(4):276-81. Notes: VS NRQ RCT
176. Kalunian KC, Moreland LW, Klashman DJ et al. Visually-guided irrigation in patients with early knee osteoarthritis: a multicenter randomized, controlled trial. Osteoarthritis Cartilage 2000; 8(6):412-8. Notes: ARTH NRQ RCT
177. Karatay S, Kiziltunc A, Yildirim K, Karanfil RC, Senel K. Effects of different hyaluronic acid products on synovial fluid levels of intercellular adhesion molecule-1 and vascular cell adhesion molecule-1 in knee osteoarthritis. Ann Clin Lab Sci 2004; 34(3):330-5. Notes: VS NRQ RCT
178. Karatay S, Kiziltunc A, Yildirim K, Karanfil RC, Senel K. Effects of different hyaluronic acid products on synovial fluid NO levels in knee osteoarthritis. Clin Rheumatol 2005; 24(5):497-501. Notes: VS NRQ RCT

B-15
179. Karatay S, Kiziltunc A, Yildirim K, Karanfil RC, Senel K. Effects of different hyaluronic acid products on synovial fluid NO levels in knee osteoarthritis.//. Osteoporosis International 2005; 16(3):S71-2 (Abstract #P279). Notes: VS NRQ RCT
180. Karatay S, Yildirim K, Yildiz L, Karanfil RC, Senel K. The effect of hyaluronic acid on levels of IGF-1 and IGFBP-3 in synovial fluids of patients with knee osteoarthritis.//. Osteoporosis International 2005; 16(3):S72 (Abstract #P281). Notes: VS NRQ RCT
181. Karatosun V, Unver B, Gocen Z, Sen A. Comparison of two hyaluronan drugs in patients with advanced osteoarthritis of the knee. A prospective, randomized, double-blind study with long term follow-up. Clin Exp Rheumatol 2005; 23(2):213-8. Notes: VS NRQ RCT
182. Karatosun V, Unver B, Gocen Z, Sen A, Gunal I. Intra-articular hyaluranic acid compared with progressive knee exercises in osteoarthritis of the knee: A prospective randomized trial with long-term follow-up. Rheumatol. Int. 2006; 26(4):277-84. Notes: VS NRQ RCT
183. Karras D , Basilakos J , Diaourta V , Kedikoglou S , Iliopoulos A. Comparative study of 2 regimens of intraarticular infusion of hyaluronan (Hyalart, Fidia, SPA) in knee osteoarthritis . J Rheumatol Suppl 2001; 28(Suppl 63):6. Notes: VS NRQ RCT
184. Katz JN, Harris TM, Larson MG et al. Predictors of functional outcomes after arthroscopic partial meniscectomy. J Rheumatol 1992; 19(12):1938-42. Notes: ARTH AO
185. Kawabata M , Igarashi M , Mikami R et al. Clinical evaluation of SLM-10 (sodium hyaluronate injection) in patients with osteoarthritis of the knee - a mutli-center comparative trial with Artz as control drug. Japanese Pharmacology & Therapeutics 1993; 21(1):257-83. Notes: VS NRQ RCT
186. Kelly MA. Role of arthroscopic debridement in the arthritic knee. J Arthroplasty 2006; 21(4 Suppl 1):9-10. Notes: ARTH NRA
187. Kelly MA, Kurzweil PR, Moskowitz RW. Intra-articular hyaluronans in knee osteoarthritis: rationale and practical considerations. Am J Orthop 2004; 33(2 Suppl):15-22. Notes: VS NRA
188. Kemper F, Gebhardt U, Meng T, Murray C. Tolerability and short-term effectiveness of hylan G-F 20 in 4253 patients with osteoarthritis of the knee in clinical practice. Curr Med Res Opin 2005; 21(8):1261-9. Notes: VS NDE
189. Kerzberg EM, Roldan EJ, Castelli G, Huberman ED. Combination of glycosaminoglycans and acetylsalicylic acid in knee osteoarthrosis. Scand J Rheumatol 1987; 16 (5):377-80. Notes: GC NRQ RCT
190. Kesenheimer E, Kolb M, Rosemeyer B. [Late results following meniscectomy]. Sportverletz Sportschaden 1990; 4(2):79-86. Notes: ARTH AO

B-16
191. Kimura M, Shirakura K, Higuchi H, Kobayashi Y, Takagishi K. Eight- to 14-year followup of arthroscopic meniscal repair. Clin Orthop Relat Res 2004; (421):175-80. Notes: ARTH AO
192. Kirchner M, Marshall D. A double-blind randomized controlled trial comparing alternate forms of high molecular weight hyaluronan for the treatment of osteoarthritis of the knee. Osteoarthritis Cartilage 2006; 14(2):154-62. Notes: VS NRQ RCT
193. Kirkley A, Rampersaud R, Griffin S, Amendola A, Litchfield R, Fowler P. Tourniquet versus no tourniquet use in routine knee arthroscopy: a prospective, double-blind, randomized clinical trial. Arthroscopy 2000; 16(2):121-6. Notes: ARTH AO
194. Kirwan J. Is there a place for intra-articular hyaluronate in osteoarthritis of the knee? Knee 2001; 8(2):93-101. Notes: VS NRA
195. Kobayashi K, Matsuzaka S, Yoshida Y, Miyauchi S, Wada Y, Moriya H. The effects of intraarticularly injected sodium hyaluronate on levels of intact aggrecan and nitric oxide in the joint fluid of patients with knee osteoarthritis. Osteoarthritis Cartilage 2004; 12(7):536-42. Notes: VS NDE
196. Kolarz G, Kotz R, Hochmayer I. Long-term benefits and repeated treatment cycles of intra-articular sodium hyaluronate (Hyalgan) in patients with osteoarthritis of the knee. Semin Arthritis Rheum 2003; 32(5):310-9. Notes: VS NDE
197. Kotz R, Kolarz G. Intra-articular hyaluronic acid: duration of effect and results of repeated treatment cycles. Am J Orthop 1999; 28(11 Suppl):5-7. Notes: VS NDE
198. Kruger-Franke M, Kugler A, Trouillier HH, Reischl A, Rosemeyer B. [Clinical and radiological results after arthroscopic partial medial meniscectomy. Are there risk factors?]. Unfallchirurg 1999; 102(6):434-8. Notes: ARTH FLA CS
199. Kruger-Franke M, Siebert CH, Kugler A, Trouillier HH, Rosemeyer B. Late results after arthroscopic partial medial meniscectomy. Knee Surg Sports Traumatol Arthrosc 1999; 7(2):81-4. Notes: ARTH AO
200. Kruger T, Wohlrab D, Reichel H, Hein W. [The effect of arthroscopic joint debridement in advanced arthrosis of the knee joint]. Zentralbl Chir 2000; 125(6):490-3. Notes: ARTH FLA CS
201. Kuzmanova S, Andreev S, Atanassov A, Batalov A, Solakov P. Arthroscopic synovectomy, debridement and tidal lavage of the knee joint in osteoarthritis - long term results. Rheumatology (Bulgaria) 2004; 12(4):42-7. Notes: ARTH FLA CS
202. Kuzmanova SI. Arthroscopic evaluation of chondropathy in knee osteoarthritis. Folia Med (Plovdiv) 2000; 42(4):16-8. Notes: ARTH AO

B-17
203. Kuzmanova SI. Treatment of knee osteoarthritis by arthroscopic synovectomy and debridement of cartilage lesions--late results. Folia Med (Plovdiv) 2003; 45(3):66-72. Notes: ARTH AO
204. Kuzmanova SI, Solakov PT, Atanassov AN, Andreev SA. Relevance between arthroscopic pathology and clinical characteristics in knee osteoarthritis. Folia Med (Plovdiv) 2000; 42(4):19-22. Notes: ARTH AO
205. Laskin RS, Ohnsorge JAK. The role of arthroscopy: Beneficial, placebo, or worse? Orthopedics 2005; 28(9):975-6. Notes: ARTH NPD
206. Leardini G , Franceschini M , Mattara L , Bruno R , Perbellini A. Intra-articular sodium hyaluronate (Hyalgan) in gonarthrosis. A controlled study comparing methylprednisolone acetate. Clin Trials J 1987; 24(4):341-50. Notes: VS NRQ RCT
207. Leardini G, Mattara L, Franceschini M, Perbellini A. Intra-articular treatment of knee osteoarthritis. A comparative study between hyaluronic acid and 6-methyl prednisolone acetate. Clin Exp Rheumatol 1991; 9(4):375-81. Notes: VS NRQ RCT
208. Lee PB, Kim YC, Lim YJ et al. Comparison between high and low molecular weight hyaluronates in knee osteoarthritis patients: open-label, randomized, multicentre clinical trial. J Int Med Res 2006; 34(1 ):77-87. Notes: VS NRQ RCT
209. Lee PB, Kim YC, Lim YJ et al. Comparison between high and low molecular weight hyaluronates in knee osteoarthritis patients: open-label, randomized, multicentre clinical trial. J Int Med Res 2006; 34(1 ):77-87. Notes: VS NRQ RCT
210. Leeb BF, Petera P, Neumann K. [Results of a multicenter study of chondroitin sulfate (Condrosulf) use in arthroses of the finger, knee and hip joints]. Wien Med Wochenschr 1996; 146( 24):609-14. Notes: GC NDE
211. Leffler CT, Philippi AF, Leffler SG, Mosure JC, Kim PD. Glucosamine, chondroitin, and manganese ascorbate for degenerative joint disease of the knee or low back: a randomized, double-blind, placebo-controlled pilot study. Mil Med 1999; 164(2):85-91. Notes: GC NRQ RCT
212. Leopold SS, Redd BB, Warme WJ, Wehrle PA, Pettis PD, Shott S. Corticosteroid compared with hyaluronic acid injections for the treatment of osteoarthritis of the knee. A prospective, randomized trial. J Bone Joint Surg Am 2003; 85-A(7):1197-203. Notes: VS NRQ RCT
213. Leopold SS, Warme WJ, Pettis PD, Shott S. Increased frequency of acute local reaction to intra-articular hylan GF-20 (synvisc) in patients receiving more than one course of treatment. J Bone Joint Surg Am 2002; 84-A(9):1619-23. Notes: VS NDE
214. Lessard LA, Scudds RA, Amendola A, Vaz MD. The efficacy of cryotherapy following arthroscopic knee surgery. J Orthop Sports Phys Ther 1997; 26(1):14-22. Notes: ARTH NRD

B-18
215. Li B-C, Zhang M, Yang Z-X. Arthroscopic surgery and individual rehabilitation training for the treatment of knee injuries in 101 cases. Chin. J. Clin. Rehab. 2004; 8(29):6284-5. Notes: ARTH FLA CS
216. Lindblad S. Arthroscopic and synovial correlates of pain in osteoarthritis. Semin Arthritis Rheum 1989; 18(4 Suppl 2):91-3. Notes: ARTH CS FEW
217. Listrat V, Ayral X, Patarnello F et al. Arthroscopic evaluation of potential structure modifying activity of hyaluronan (Hyalgan) in osteoarthritis of the knee. Osteoarthritis Cartilage 1997; 5(3):153-60. Notes: VS NRQ RCT
218. Livesley PJ. Articular debridement versus washout for degeneration of the medial femoral condyle. J Bone Joint Surg Br 1996; 78(5):854. Notes: ARTH NRA
219. Lohmander LS, Dahlberg L, Ryd L, Heinegard D. Increased levels of proteoglycan fragments in knee joint fluid after injury. Arthritis Rheum 1989; 32(11):1434-42. Notes: ARTH NRQ
220. Longyhore DS, Seaton TL. Glucosamine and chondroitin effective for knee osteoarthritis. J Fam Pract 2003; 52(12):919-20. Notes: GC NPD
221. Lubowitz JH. A controlled trial of arthroscopic surgery for osteoarthritis of the knee. Arthroscopy 2002; 18(8):950-1. Notes: ARTH NPD
222. Lussier A, Cividino AA, McFarlane CA, Olszynski WP, Potashner WJ, De Medicis R. Viscosupplementation with hylan for the treatment of osteoarthritis: findings from clinical practice in Canada. J Rheumatol 1996; 23(9):1579-85. Notes: VS NDE
223. Lyu SR, Hsu CC. Medial plicae and degeneration of the medial femoral condyle. Arthroscopy 2006; 22(1):17-26. Notes: ARTH AO
224. MacIntosh DL, Welsh RP. Joint debridement--a complement to high tibial osteotomy in the treatment of degenerative arthritis of the knee. J Bone Joint Surg Am 1977; 59(8):1094-7. Notes: ARTH NA
225. Magee T, Shapiro M, Rodriguez J, Williams D. MR arthrography of postoperative knee: for which patients is it useful? Radiology 2003; 229(1):159-63. Notes: ARTH AO
226. Magilavy D, Polisson R, Parenti D. Re: Karlsson et al. Comparison of two hyaluronan drugs and placebo in patients with knee osteoarthritis. A controlled, randomized, double-blind, parallel-design multicentre study. Rheumatology (Oxford) 2003; 42(10):1262; author reply 1262-3. Notes: VS NPD
227. Magilavy DB, McPherson JM, Polisson R. Pseudoseptic reactions to Hylan viscosupplementation: diagnosis and treatment. Clin Orthop Relat Res 2004; (429):349-50; author reply 350-1. Notes: VS NPD

B-19
228. Maheu E, Ayral X, Dougados M. A hyaluronan preparation (500-730 kDa) in the treatment of osteoarthritis: a review of clinical trials with Hyalgan. Int J Clin Pract 2002; 56(10):804-13. Notes: VS NRA
229. Maiotti M, Monteleone G, Tarantino U, Fasciglione GF, Marini S, Coletta M. Correlation between osteoarthritic cartilage damage and levels of proteinases and proteinase inhibitors in synovial fluid from the knee joint. Arthroscopy 2000; 16(5):522-6. Notes: ARTH AO
230. Majewski M, Stoll R, Widmer H, Muller W, Friederich NF. Midterm and Long-term Results After Arthroscopic Suture Repair of Isolated, Longitudinal, Vertical Meniscal Tears in Stable Knees . Am J Sports Med 2006. Notes: ARTH AO
231. Maletius W, Messner K. Chondral damage and age depress the long-term prognosis after partial meniscectomy. A 12- to 15-year follow-up study. Knee Surg Sports Traumatol Arthrosc 1996; 3(4):211-4. Notes: ARTH AO
232. Maletius W, Messner K. The effect of partial meniscectomy on the long-term prognosis of knees with localized, severe chondral damage. A twelve- to fifteen-year followup. Am J Sports Med 1996; 24(3):258-62. Notes: ARTH AO
233. Maravic M, Landais P. Arthroscopy for knee osteoarthritis. Jt. Bone Spine 2003; 70(6):404-6. Notes: ARTH NRA
234. Maravic M, Landais P. Arthroscopy for knee osteoarthritis. Joint Bone Spine 2003; 70(6):404-6. Notes: ARTH NPD
235. Matheson AJ, Perry CM. Glucosamine: a review of its use in the management of osteoarthritis. Drugs Aging 2003; 20(14):1041-60. Notes: GC NRA
236. Matsui N, Taneda Y, Ohta H, Itoh T, Tsuboguchi S. Arthroscopic versus open synovectomy in the rheumatoid knee. Int Orthop 1989; 13(1):17-20. Notes: ARTH AO
237. Matsusue Y, Thomson NL. Arthroscopic partial medial meniscectomy in patients over 40 years old: a 5- to 11-year follow-up study. Arthroscopy 1996; 12(1):39-44. Notes: ARTH AO
238. Mazieres B, Loyau G, Menkes CJ et al. [Chondroitin sulfate in the treatment of gonarthrosis and coxarthrosis. 5-months result of a multicenter double-blind controlled prospective study using placebo]. Rev Rhum Mal Osteoartic 1992; 59(7-8):466-72. Notes: GC NRD
239. McAlindon T. Why are clinical trials of glucosamine no longer uniformly positive? Rheum Dis Clin North Am 2003; 29(4):789-801. Notes: GC NRA
240. McBride GG, Constine RM, Hofmann AA, Carson RW. Arthroscopic partial medial meniscectomy in the older patient. J Bone Joint Surg Am 1984; 66(4):547-51. Notes: ARTH AO

B-20
241. McDonald C. , Hantel S. , Strohmeier M. A randomised, controlled study to compare the performance and safety of two sources of sodium hyaluronate given as a viscosupplement by intra-articular injection to patients with osteoarthritis of the knee . Journal of Clinical Research 2000; 3:41-50. Notes: VS NRQ RCT
242. McGinty JB. Arthroscopic removal of loose bodies. Orthop Clin North Am 1982; 13(2):313-28. Notes: ARTH NRA
243. Meredith DS, Losina E, Mahomed NN, Wright J, Katz JN. Factors predicting functional and radiographic outcomes after arthroscopic partial meniscectomy: a review of the literature. Arthroscopy 2005; 21(2):211-23. Notes: ARTH NRA
244. Meredith DS, Losina E, Mahomed NN, Wright J, Katz JN. Factors predicting functional and radiographic outcomes after arthroscopic partial meniscectomy: A review of the literature. Arthroscopy J. Arthroscopic Relat. Surg. 2005; 21(2):211-23. Notes: ARTH NRA
245. Metcalf RW. An arthroscopic method for lateral release of subluxating or dislocating patella. Clin Orthop Relat Res 1982; (167):9-18. Notes: ARTH AO
246. Miller BS, Steadman JR, Briggs KK, Rodrigo JJ, Rodkey WG. Patient satisfaction and outcome after microfracture of the degenerative knee. J Knee Surg 2004; 17(1):13-7. Notes: ARTH AO
247. Miller FG. Sham surgery: an ethical analysis. Sci Eng Ethics 2004; 10(1):157-66. Notes: ARTH NRA
248. Miltner O, Schneider U, Siebert CH, Niedhart C, Niethard FU. Efficacy of intraarticular hyaluronic acid in patients with osteoarthritis--a prospective clinical trial. Osteoarthritis Cartilage 2002; 10(9):680-6. Notes: VS NRQ RCT
249. Mohtadi N. Arthroscopic intervention to reduce pain and improve function in knee osteoarthritis. Clin. J. Sport Med. 2003; 13(5):323-4. Notes: ARTH NPD
250. Mohtadi N. Arthroscopic intervention to reduce pain and improve function in knee osteoarthritis. Clin J Sport Med 2003; 13(5):323-4. Notes: ARTH NPD
251. Moriya H, Sasho T, Sano S, Wada Y. Arthroscopic posteromedial release for osteoarthritic knees with flexion contracture. Arthroscopy 2004; 20(10):1030-9. Notes: ARTH AO
252. Morreale P, Manopulo R, Galati M, Boccanera L, Saponati G, Bocchi L. Comparison of the antiinflammatory efficacy of chondroitin sulfate and diclofenac sodium in patients with knee osteoarthritis. J Rheumatol 1996; 23(8):1385-91. Notes: GC NRQ RCT
253. Morse LJ. Arthroscopic surgery for osteoarthritis of the knee. N Engl J Med 2002; 347(21):1717-9; author reply 1717-9. Notes: ARTH NPD

B-21
254. Nahler G , Metelmann H , Sperber H. Treating osteoarthritis of the knee with a homeopathic preparation. Results of a randomized, controlled, clinical trial in comparison to hyaluronic acid. Biomedical Therapy 1998; XVI(2):186-91. Notes: VS NRQ RCT
255. Nahler G (von) , Metelmann H , Sperber H. Treatment of gonarthrosis with Zeel comp. - Results of a randomised, controlled, comparative clinical trial with hyaluronic acid [Behandlung der Gonarthrose mit Zeel comp. - Ergebnisse einer randomisierten, kontrollierten klinischen Prufung im Vergleich zu Hyaluronsaure]. Orthopadische Praxis 1996; 32(5):354-9. Notes: VS NRQ RCT
256. Neustadt D, Caldwell J, Bell M, Wade J, Gimbel J. Clinical effects of intraarticular injection of high molecular weight hyaluronan (Orthovisc) in osteoarthritis of the knee: a randomized, controlled, multicenter trial. J Rheumatol 2005; 32(10):1928-36. Notes: VS NRQ RCT
257. Neustadt DH. Long-term efficacy and safety of intra-articular sodium hyaluronate (Hyalgan) in patients with osteoarthritis of the knee. Clin Exp Rheumatol 2003; 21(3):307-11. Notes: VS NDE
258. Noble J. Articular debridement versus washout for degeneration of the medial femoral condyle. J Bone Joint Surg Br 1996; 78(5):854. Notes: ARTH NRA
259. Northmore-Ball MD, Dandy DJ. Long-term results of arthroscopic partial meniscectomy. Clin Orthop Relat Res 1982; (167):34-42. Notes: ARTH AO
260. Northmore-Ball MD, Dandy DJ, Jackson RW. Arthroscopic, open partial, and total meniscectomy. A comparative study. J Bone Joint Surg Br 1983; 65(4):400-4. Notes: ARTH AO
261. Novaes AC, Schaiquevich P, Nasswetter G et al. Multicenter study of hyaluronic acid obtained by biotechnology to evaluate clinical efficacy and safety in knee osteoarthritis. Int. J. Clin. Pharmacol. Res. 2005; 25(1):1-7. Notes: VS NDE
262. O'Hanlon D. Acute local reactions after intraarticular hylan for osteoarthritis of the knee. J Rheumatol 1996; 23(5):945-6. Notes: VS NPD
263. Ozturk C, Atamaz F, Hepguler S, Argin M , Arkun R. The safety and efficacy of intraarticular hyaluronan with/without corticosteroid in knee osteoarthritis: 1-Year, single-blind, randomized study. Rheumatol. Int. 2006; 26(4):314-9. Notes: VS NRQ RCT
264. Pagnano M, Westrich G. Successful nonoperative management of chronic osteoarthritis pain of the knee: safety and efficacy of retreatment with intra-articular hyaluronans. Osteoarthritis Cartilage 2005; 13(9):751-61. Notes: VS NRQ
265. Pare DM, Schuppers HA, Tetteroo QF, Bots RA. [Partial meniscectomy via arthroscope in patients over 50 years old]. Ned Tijdschr Geneeskd 1989; 133(38):1890-2. Notes: ARTH AO

B-22
266. Pasquali Ronchetti I, Guerra D, Taparelli F et al. Morphological analysis of knee synovial membrane biopsies from a randomized controlled clinical study comparing the effects of sodium hyaluronate (Hyalgan) and methylprednisolone acetate (Depomedrol) in osteoarthritis. Rheumatology (Oxford) 2001; 40(2):158-69. Notes: VS NRQ RCT
267. Pavelka K, Bruyere O, Rovati LC, Olejarova M, Giacovelli G, Reginster JY. Relief in mild-to-moderate pain is not a confounder in joint space narrowing assessment of full extension knee radiographs in recent osteoarthritis structure-modifying drug trials. Osteoarthritis Cartilage 2003; 11(10):730-7. Notes: GC NRQ RCT
268. Payne MW, Petrella RJ. Viscosupplementation effect on proprioception in the osteoarthritic knee. Arch Phys Med Rehabil 2000; 81(5):598-603. Notes: VS NDE
269. Pearse EO, Craig DM. Partial meniscectomy in the presence of severe osteoarthritis does not hasten the symptomatic progression of osteoarthritis. Arthroscopy 2003; 19(9):963-8. Notes: ARTH AO
270. Peckett WR, Butler-Manuel A. Intra-articular steroids after arthroscopy for osteoarthritis of the knee. J Bone Joint Surg Br 2000; 82(5):775-6. Notes: ARTH NPD
271. Pedersen MS, Moghaddam AZ, Bak K, Koch JS. The effect of bone drilling on pain in gonarthrosis. Int Orthop 1995; 19(1):12-5. Notes: ARTH AO
272. Petersson IF, Sandqvist L, Svensson B, Saxne T. Cartilage markers in synovial fluid in symptomatic knee osteoarthritis. Ann Rheum Dis 1997; 56(1):64-7. Notes: ARTH NA
273. Petrella RJ. Hyaluronic acid for the treatment of knee osteoarthritis: long-term outcomes from a naturalistic primary care experience. Am J Phys Med Rehabil 2005; 84(4):278-83; quiz 284, 293. Notes: VS NDE
274. Petrella RJ, Petrella M. A prospective, randomized, double-blind, placebo controlled study to evaluate the efficacy of intraarticular hyaluronic acid for osteoarthritis of the knee. J Rheumatol 2006; 33(5):951-6. Notes: VS NRQ RCT
275. Pietrogrande V , Melanotte PL , D'Agnolo B et al. Hyaluronic acid versus methylprednisolone intra-articularly injected for treatment of osteoarthritis of the knee. Curr Ther Res Clin Exp 1991; 50(5):691-701. Notes: VS NRQ RCT
276. Poehling GG. Degenerative arthritis arthroscopy and research. Arthroscopy 2002; 18(7):683. Notes: ARTH NPD
277. Puddu G, Cipolla M, Cerullo G, Scala A. Arthroscopic treatment of the flexed arthritic knee in active middle-aged patients. Knee Surg Sports Traumatol Arthrosc 1994; 2(2):73-5. Notes: ARTH AO
278. Puhl W, Scharf P. Intra-articular hyaluronan treatment for osteoarthritis. Ann Rheum Dis 1997; 56(7): 441. Notes: VS NRQ

B-23
279. Puttick MP , Wade JP , Chalmers A , Connell DG , Rangno KK. Acute local reactions after intraarticular hylan for osteoarthritis of the knee. J Rheumatol 1995; 22(7):1311-4. Notes: VS NDE
280. Qiu GX, Gao SN, Giacovelli G, Rovati L, Setnikar I. Efficacy and safety of glucosamine sulfate versus ibuprofen in patients with knee osteoarthritis. Arzneimittelforschung 1998; 48(5):469-74. Notes: GC NRQ RCT
281. Qiu G-X, Weng X-S, Zhang K et al. A multi-central randomized, controlled clinical trial of glucosamine hydrochloride / sulfate in the treatment of knee osteoarthritis. Nat. Med. J. China 2005; 85(43):3067-70. Notes: GC NRQ RCT
282. Rand JA. Role of arthroscopy in osteoarthritis of the knee. Arthroscopy 1991; 7(4):358-63. Notes: ARTH AO
283. Rangger C, Klestil T, Gloetzer W, Kemmler G, Benedetto KP. Osteoarthritis after arthroscopic partial meniscectomy. Am J Sports Med 1995; 23(2):240-4. Notes: ARTH AO
284. Ravaud P, Moulinier L, Giraudeau B et al. Effects of joint lavage and steroid injection in patients with osteoarthritis of the knee: results of a multicenter, randomized, controlled trial. Arthritis Rheum 1999; 42(3):475-82. Notes: ARTH NRQ RCT
285. Raynauld JP, Goldsmith CH, Bellamy N et al. Effectiveness and safety of repeat courses of hylan G-F 20 in patients with knee osteoarthritis. Osteoarthritis Cartilage 2005; 13(2):111-9. Notes: VS NRQ RCT
286. Raynauld JP, Torrance GW, Band PA et al. A prospective, randomized, pragmatic, health outcomes trial evaluating the incorporation of hylan G-F 20 into the treatment paradigm for patients with knee osteoarthritis (Part 1 of 2): clinical results. Osteoarthritis Cartilage 2002; 10(7):506-17. Notes: VS NRQ RCT
287. Reichelt A, Forster KK, Fischer M, Rovati LC, Setnikar I. Efficacy and safety of intramuscular glucosamine sulfate in osteoarthritis of the knee. A randomised, placebo-controlled, double-blind study. Arzneimittelforschung 1994; 44(1):75-80. Notes: GC NRQ RCT
288. Reiter S, Reginster JY, Richy F, Bruyere O. Evidence-based evaluation of study results of symptomatic glucosamine therapy: EVIDENZBASIERTE BEWERTUNG DER SYMPTOMATISCHEN THERAPIE VON GLUCOSAMIN. Z. Rheumatol. 2005; 64(7):456-66. Notes: GC NRA
289. Rejaili WA, Chueire AG, Cordeiro JA, Petean FC, Filho GC. The evaluation of Hilan GF-20 in the postoperative knee arthroscopies for arthrosis. Acta Ortopedica Brasileira 2005; 13(1):20-3. Notes: VS NDE
290. Richards RJ, Lonergan RP. Arthroscopic surgery for relief of pain in the osteoarthritis knee. Orthopedics 1984; 7(11):1705-7. Notes: ARTH AO

B-24
291. Rodrigo JJ, Steadman JR, Silliman JF, Fulstone HA. Improvement of full-thickness chondral defect healing in the human knee after debridement and microfracture using continuous passive motion. American Journal of Knee Surgery 1994; 7(3):109-16. Notes: ARTH AO
292. Roman JA , Chismol J , Morales M , Donderis JL. Intra-articular treatment with hyaluronic acid. Comparative study of Hyalgan and Adant. Clin Rheumatol 2000; 19(3):204-6. Notes: VS NRQ RCT
293. Roos EM, Ostenberg A, Roos H, Ekdahl C, Lohmander LS. Long-term outcome of meniscectomy: symptoms, function, and performance tests in patients with or without radiographic osteoarthritis compared to matched controls. Osteoarthritis Cartilage 2001; 9(4):316-24. Notes: ARTH AO
294. Roos EM, Roos HP, Ryd L, Lohmander LS . Substantial disability 3 months after arthroscopic partial meniscectomy: A prospective study of patient-relevant outcomes. Arthroscopy 2000; 16(6):619-26. Notes: ARTH AO
295. Roos H, Adalberth T, Dahlberg L, Lohmander LS. Osteoarthritis of the knee after injury to the anterior cruciate ligament or meniscus: the influence of time and age. Osteoarthritis Cartilage 1995; 3(4):261-7. Notes: ARTH AO
296. Roposch A, Brunner G, Schatz KD, Kotz R, Wurnig C. [Arthroscopic menisectomy in older patients: assessing health-related quality of life]. Z Orthop Ihre Grenzgeb 2003; 141( 5):563-9. Notes: ARTH FLA CS
297. Rovetta G. Galactosaminoglycuronoglycan sulfate (matrix) in therapy of tibiofibular osteoarthritis of the knee. Drugs Exp Clin Res 1991; 17(1):53-7. Notes: GC NRQ RCT
298. Rozkydal Z, Kura V, Ondrusek S. The arthroscopic debridement in the management of osteoarthritis of the knee joint by high tibial osteotomy. Bratisl Lek Listy 2003; 104(11):362-6. Notes: ARTH AO
299. Ruffin MT 4th, Hunter RE. Arthroscopy in the geriatric patient. Acute injuries and chronic joint diseases. J Am Geriatr Soc 1989; 37(10):977-9. Notes: ARTH AO
300. Ruffin MT 4th, Hunter RE. Arthroscopy in the geriatric patient. Acute injuries and chronic joint diseases. J Am Geriatr Soc 1989; 37(10):977-9. Notes: ARTH AO
301. Rupp S, Seil R, Jochum P, Kohn D. Popliteal cysts in adults. Prevalence, associated intraarticular lesions, and results after arthroscopic treatment. Am J Sports Med 2002; 30(1):112-5. Notes: ARTH AO
302. Salisbury RB, Nottage WM, Gardner V. The effect of alignment on results in arthroscopic debridement of the degenerative knee. Clin Orthop Relat Res 1985; (198):268-72. Notes: ARTH CS FEW
303. Salisbury RB, Nottage WM, Gardner V. The effect of alignment on results in arthroscopic debridement of the degenerative knee. Clin Orthop Relat Res 1985; (198):268-72. Notes: ARTH CS FEW

B-25
304. Santavirta S. Arthroscopy for osteoarthrosis of the knee is seldom necessary. Acta Orthop Scand 2003; 74(1):4-5. Notes: ARTH NPD
305. Schneider U, Miltner O, Graf J, Thomsen M, Niethard FU. [Mechanism of action of hyaluronic acid in gonarthrosis of both knee joints in a right/left comparison. Study with dynamometry, oxygen partial pressure, temperature and Lequesne score]. Z Orthop Ihre Grenzgeb 1997; 135(4):341-7. Notes: VS NRQ RCT
306. Schultz W, Gobel D. Articular cartilage regeneration of the knee joint after proximal tibial valgus osteotomy: a prospective study of different intra- and extra-articular operative techniques. Knee Surg Sports Traumatol Arthrosc 1999; 7(1):29-36. Notes: ARTH NA
307. Scott WN, Clarke HD. Early knee arthritis. The role of arthroscopy: beneficial or placebo? Orthopedics 2003; 26(9):943-4. Notes: ARTH NRA
308. Setnikar I. Glucosamine for osteoarthritis. Sound science might have helped avoid confusion. BMJ 2001; 323(7319):1003-4. Notes: GC NPD
309. Shichikawa K, Maeda A, Ogawa N. [Clinical evaluation of sodium hyaluronate in the treatment of osteoarthritis of the knee]. Ryumachi 1983; 23(4):280-90. Notes: GC FNA
310. Shoor S. Review: Viscosupplementation for knee osteoarthritis reduces pain and improves function. Commentary. Evid.-Based Med. 2006; 11(1): 12. Notes: VS NPD
311. Singh S, Lee CC, Tay BK. Results of arthroscopic abrasion arthroplasty in osteoarthritis of the knee joint. Singapore Med J 1991; 32(1):34-7. Notes: ARTH AO
312. Smith MD, Wetherall M, Darby T et al. A randomized placebo-controlled trial of arthroscopic lavage versus lavage plus intra-articular corticosteroids in the management of symptomatic osteoarthritis of the knee. Rheumatology (Oxford) 2003; 42(12):1477-85. Notes: ARTH AO
313. Soballe K, Hansen AJ. Late results after meniscectomy in children. Injury 1987; 18(3):182-4. Notes: ARTH NRD
314. Sonnino D. Glucosamine for osteoarthritis. Patients' welfare should be primary concern. BMJ 2001; 323(7319):1003; author reply 1004. Notes: GC NPD
315. Spahn G, Wittig R. Short-term effects of different arthroscopic techniques in the treatment of chondral defects (shaving, coblation, and microfracturing). Eur. J. Trauma 2002; 28(6):349-54. Notes: ARTH AO
316. Stuart MJ. Arthroscopic management for degenerative arthritis of the knee. Instr Course Lect 1999; 48:135-41. Notes: ARTH NRA

B-26
317. Su JY, Chang JK, Lu YM, Lin SY. Arthroscopic debridement for osteoarthritis of the knee: a seven years follow-up study. Gaoxiong Yi Xue Ke Xue Za Zhi 1995; 11(12):667-72. Notes: ARTH AO
318. Szachnowski P, Wei N, Arnold WJ, Cohen LM. Complications of office based arthroscopy of the knee. J Rheumatol 1995; 22(9):1722-5. Notes: ARTH AO
319. Tascioglu F, Oner C. Efficacy of intra-articular sodium hyaluronate in the treatment of knee osteoarthritis. Clin Rheumatol 2003; 22(2):112-7. Notes: VS NRQ RCT
320. Tekeoglu I , Adak B , Goksoy T , Tosun N. Effects of intra-articular injections of sodium hyaluronate (Orthovisc) and betamethasone on osteoarthritis of the knee. The Journal of Rheumatology & Medical Rehabilitation 1998; 9(4):220-4. Notes: VS NRQ RCT
321. Thomas RH, Resnick D, Alazraki NP, Daniel D, Greenfield R. Compartmental evaluation of osteoarthritis of the knee. A comparative study of available diagnostic modalities. Radiology 1975; 116(3):585-94. Notes: ARTH AO
322. Thompson JI , Huang YW , Zaibel R. Safety and efcacy of fermentation-derived high molecular weight sodium hyaluronate - a clinical trial in patients with osteoarthritis of the knee. Osteoarthritis Cartilage 2002; 10(Suppl A):70-1. Notes: VS NRQ RCT
323. Tibrewal SB. The pneumatic tourniquet in arthroscopic surgery of the knee. Int Orthop 2001; 24(6):347-9. Notes: ARTH NRD
324. Toda Y. [A comparison of the efficacy of conservative therapies for obese patients with osteoarthritis of the knee]. Ryumachi 2002; 42(5):795-800. Notes: GC NDE
325. Torrance GW, Raynauld JP, Walker V et al. A prospective, randomized, pragmatic, health outcomes trial evaluating the incorporation of hylan G-F 20 into the treatment paradigm for patients with knee osteoarthritis (Part 2 of 2): economic results. Osteoarthritis Cartilage 2002; 10(7):518-27. Notes: VS NRQ RCT
326. Towheed TE, Hochberg MC. A systematic review of randomized controlled trials of pharmacological therapy in osteoarthritis of the knee, with an emphasis on trial methodology. Semin Arthritis Rheum 1997; 26(5):755-70. Notes: VS NRQ
327. Travers V, Norotte G, Roger B, Apoil A. [Treatment of acute pyogenic arthritis of large joints of the limbs. Apropos of 79 cases]. Rev Rhum Mal Osteoartic 1988; 55(9):655-60. Notes: ARTH NRD
328. Tsai L, Wredmark T. Arthroscopic surgery of the knee in local anaesthesia. An analysis of age-related pathology. Arch Orthop Trauma Surg 1993; 112(3):136-8. Notes: ARTH AO
329. Tsukamoto Y , Yamamoto M , Motegi M et al. A double-blind trial of intra-articular higher molecular weight hyaluronic acid (NRD 101) versus lower molecular weight hyaluronic acid (Artz) in knee osteoarthritis. Rheumatology in Europe 1995; 24(Suppl ):333. Notes: VS NRQ RCT

B-27
330. Tsumura H, Ikeda S, Torisu T. Debridement and continuous irrigation for the treatment of pyogenic arthritis caused by the use of intra-articular injection in the osteoarthritic knee: indications and outcomes. J Orthop Surg (Hong Kong) 2005; 13(1):52-7. Notes: ARTH CS FEW
331. Vad VB, Bhat AL, Sculco TP, Wickiewicz TL. Management of knee osteoarthritis: knee lavage combined with hylan versus hylan alone. Arch Phys Med Rehabil 2003; 84(5):634-7. Notes: ARTH AO
332. Vajaradul Y. Double-blind clinical evaluation of intra-articular glucosamine in outpatients with gonarthrosis. Clin Ther 1981; 3(5):336-43. Notes: GC NRQ RCT
333. Vajranetra P. Clinical trial of glucosamine compounds for osteoarthrosis of knee joints. J Med Assoc Thai 1984; 67(7):409-18. Notes: GC NDE
334. Van Der Linden AJ. Debridement in case of gonarthrosis. Acta Orthop Belg 1976; 42(4):367-72. Notes: ARTH NA
335. Vaz AL. Double-blind clinical evaluation of the relative efficacy of ibuprofen and glucosamine sulphate in the management of osteoarthrosis of the knee in out-patients. Current Medical Research and Opinion 1982; 8(3):145-9. Notes: GC NRQ RCT
336. Villani P, Bouvenot G. [Assessment of the placebo effect of symptomatic slow-acting anti-arthritics]. Presse Med 1998; 27(5):211-4. Notes: GC NRA
337. Vojtassak J, Seliga J. High tibial osteotomy and debridement of the knee joint in treatment of varotic gonarthrosis. Bratisl Lek Listy 2001; 102(10):470-2. Notes: ARTH NA
338. Wada M, Baba H, Imura S, Morita A, Kusaka Y. Relationship between radiographic classification and arthroscopic findings of articular cartilage lesions in osteoarthritis of the knee. Clin Exp Rheumatol 1998; 16(1):15-20. Notes: ARTH AO
339. Waddell D, Rein A, Panarites C, Coleman PM, Weiss C. Cost implications of introducing an alternative treatment for patients with osteoarthritis of the knee in a managed care setting. Am J Manag Care 2001; 7(10):981-91. Notes: VS NDE
340. Waddell DD. The tolerability of viscosupplementation: Low incidence and clinical management of local adverse events . Curr. Med. Res. Opin. 2003; 19(7):575-80. Notes: VS NPD
341. Waddell DD, Bricker DC. Clinical experience with the effectiveness and tolerability of hylan G-F 20 in 1047 patients with osteoarthritis of the knee. J Knee Surg 2006; 19(1):19-27. Notes: VS NDE
342. Waddell DD, Bricker DC. Hylan G-F 20 tolerability with repeat treatment in a large orthopedic practice: a retrospective review. J Surg Orthop Adv 2006; 15(1):53-9. Notes: VS NDE

B-28
343. Waddell DD, Cefalu CA, Bricker DC. An open-label study of a second course of hylan G-F 20 for the treatment of pain associated with knee osteoarthritis. Curr Med Res Opin 2003; 19(6):499-507. Notes: VS NDE
344. Waddell DD, Cefalu CA, Bricker DC. A second course of hylan G-F 20 for the treatment of osteoarthritic knee pain: 12-month patient follow-up. J Knee Surg 2005; 18(1):7-15. Notes: VS NDE
345. Waddell JP. Arthroscopic debridement of the knee. Can J Surg 1991; 34(6):532. Notes: ARTH NPD
346. Wallace DA, Carr AJ, Loach AB, Wilson-MacDonald J. Day case arthroscopy under local anaesthesia. Ann R Coll Surg Engl 1994; 76(5):330-1. Notes: ARTH NRD
347. Wallny T, Brackmann HH, Semper H et al. Intra-articular hyaluronic acid in the treatment of haemophilic arthropathy of the knee. Clinical, radiological and sonographical assessment. Haemophilia 2000; 6(5):566-70. Notes: VS NRD
348. Wang DW, Cai X, Liu YJ, Wang ZG, Gao L. [Meniscus injury in osteoarthritis of knee joints: under arthroscopy]. Zhonghua Yi Xue Za Zhi 2005; 85(34):2425-7. Notes: ARTH FLA CS
349. Wei N, Delauter SK, Erlichman MS. The holmium YAG laser in office based arthroscopy of the knee: comparison with standard interventional instruments in patients with arthritis. J Rheumatol 1997; 24(9):1806-8. Notes: ARTH AO
350. Wein CR, Houpt JB, McMillan R, Russell AHK. Open trial of Glucosamine Hydrochloride (Arthroid) in the Treatment of Pain of Osteoarthritis of the Knee . Unpublished 1998. Notes: GC NDE
351. Weiss C , Tillero W , Balazs L. The treatment of osteoarthritis of the knee with hylan G-F20 in orthopedic practice. Proceedings of the 4th Congress of the OsteoArthritis Research Society International (OARSI), September 16-19, 1999, Vienna, Austria 1999. Notes: VS NDE
352. Wouters E, Bassett FH 3rd, Hardaker WT Jr, Garrett WE Jr. An algorithm for arthroscopy in the over-50 age group. Am J Sports Med 1992; 20(2):141-5. Notes: ARTH NRD
353. Wray NP, Moseley JB, O'Malley K. Arthroscopic treatment of osteoarthritis of the knee. J Bone Joint Surg Am 2003; 85-A(2):381. Notes: ARTH NPD
354. Wray NR, Moseley JB, O'Malley K. Arthroscopic treatment of osteoarthritis of the knee [1]. J. Bone Jt. Surg. Ser. A 2003; 85(2):381. Notes: ARTH NPD
355. Zenk JL, Helmer TR, Kuskowski MA. The effects of milk protein concentrate on the symptoms of osteoarthritis in adults: an exploratory, randomized, double-blind, placebo-controlled trial. Current Therapeutic Research 2002; 63(7):430-42. Notes: GC NRD

C-1
Appendix C. Evidence Tables

C-2
Part I: Viscosupplementation Appendix Table IA. Baseline Characteristics of Placebo-Controlled Randomized Trials of Intraarticular Viscosupplements Injections for Knee OA
No. Pts Randomized
OA Diagnosis (criteria)
Mean Baseline Pain Score
Movement (VAS mm)
Rest (VAS mm)
WOMAC Pain Score
Study
HA Derivative
(Trade Name)
Tx Plac
Overall Mean Age
(years)
Female Pts (%)
1° 2° 1° 2°
?
OA Stage
(%)
Mean Disease Duration (years)
Tx Pl Tx Pl Tx Pl Altman and Moskowitz
(1998)
Sodium hyaluronate (Hyalgan)
164 168 64 58 x1 KL
2-3 > 1 yr 54 55 NR NR NR NR
Altman et al (2004)
Non-animal stabilized hyaluronic
acid (Durolane)
173 174 62.9 (Tx) 63.3(Plac) 55 x1
KL 2 (23) 3 (54) 4 (24)
5.0 (0-45.5) (Tx)
6.5 (0-50.5) (Plac)
NR NR NR NR 9.9 (6-15)
10.4 (7-15)
Bragantini et al (1987)
Sodium hyaluronate (Hyalgan)
39 joints 55 pts total
18 joints 57 75 x KL
2-4
<1 (16%) 1-5 (44%)
5-10 (16%) >10 (19%) NR (5%)
NR NR 40 40 NR NR
Brandt et al (2001)
Sodium hyaluronate (Orthovisc)
114 112 66 63 x1 KL
2-3 NR NR NR NR NR 16 (5-25)
16 (5-25)
Bunyaratavej et al
(2001)
Sodium hyaluronate (Hyalgan)
24 25 60 78 x1
KL 1-2 (62) 3-4 (38)
HA 2.5 (3.1) Plac 3 (3.4) 70 70 NR NR NR NR
Carrabba et al (1995)
Sodium hyaluronate (Hyalgan)
60 40 60 63 x1 NR
Plac≈2.4 (1.3) 1inj 2.2 (1.3) 3inj 2.3 (1.8) 5inj 2.9 (1.3)
62(1inj) 64 (3inj) 63 (5inj)
64 41 (1inj) 45 (3inj) 44 (5inj)
44 NR NR
Cohen et al (1994)
Sodium hyaluronate (Hyalgan)
19 20 NR NR x NR NR NR NR NR NR NR NR
Corrado et al (1995)
Sodium hyaluronate (Hyalgan)
21 19 61 78 x2 NR ≥ 0.5 69 62 23 17 NR NR
Creamer et al (1994)
Sodium hyaluronate (Hyalgan)
12 knees
12 knee
s 72 100 x KL
2-44 22 52 (Figure)
54 (Figur
e) NR NR NR NR
Cubukcu et al (2004)
Hylan G-F 20 (Synvisc) 20 10 55 80 x1
Mean KL
1.9, 1.8
HA 2.7 (.81) Plac 1.8 (.63) 71 67 47 51 16 18

C-3
Appendix Table IA. Baseline Characteristics of Placebo-Controlled Randomized Trials of Intraarticular Viscosupplements Injections for Knee OA (cont’d) No. Pts
Randomized OA Diagnosis
(criteria) Mean Baseline Pain Score
Movement (VAS mm)
Rest (VAS mm)
WOMAC Pain Score
Study
HA Derivative
(Trade Name)
Tx Plac
Overall Mean Age
(years)
Female Pts (%)
1° 2° 1° 2°
?
OA Stage
(%)
Mean Disease Duration (years)
Tx Pl Tx Pl Tx Pl
Dahlberg et al (1994)
Sodium hyaluronate (Supartz)
28 24 45 NR x35
NR NR NR NR 46 54 NR NR
Day et al (2004)
Sodium hyaluronate
(Artz) 116 124 62 56 x NR >5
(49%) NR NR NR NR 8 9
Dickson and Hosie
(1998/2001)
Hylan G-F 20 (Synvisc) 53 57 63 53 x NR NR NR NR NR NR 59 58
Dixon et al (1988)
Sodium hyaluronate (Hyalgan)
30 33 69 54 x NR NR NR NR NR NR NR NR
Dougados et al (1993)
Sodium hyaluronate (Hyalgan)
55 55 68 71 x1 NR HA 5
Plac 6.4 68 62 31 28 NR NR
Formiguera and Estevel
(1995)
Sodium hyaluronate (Hyalgan)
20 knees
20 knee
s 62 73 x NR NR NR NR NR NR NR NR
France (1995) Sodium
hyaluronate (Supartz)
87 (3 inj)
87 (5 inj)
80 63.9 (3 inj) 64.7 (5 inj) 65.2 (Plac)
73.6 (3) 60.9 (5)
68.8 (Plac)
x NR NR
57.9 (3 inj) 56.9
(5 inj)
59.8 (pl) NR NR NR NR
Grecomoro et al
(1987)
Sodium hyaluronate (Hyalgan)
20 knees
20 knee
s 65 56 x NR NR
48 Spontaneous
43 Spontaneou
s
NR NR NR NR
Guler et al. (1996)
Sodium hyaluronate (Orthovisc)
15 15 NR NR x NR NR NR NR NR NR 16.9 NR
Henderson et al.
(1994)
Sodium hyaluronate (Hyalgan)
45 46 65 (approx) 69 x KL
1-4 NR
44 (mild OA)
49
(mod OA)
53 (mild OA)
49
(mod OA)
21 (mild OA)
25
(mod OA)
30 (mild OA)
39
(mod OA)
NR NR
Hizmetli (1999)
Sodium hyaluronate (Orthovisc)
25 25 56 68 x KL 1-2 NR NR NR NR
17.8 (5-25 scale)
17.5 (5-25 scale)
Huskisson and Donnelly (1999)
Sodium hyaluronate (Hyalgan)
50 50 65 67 x2
KL 2-3 NR 66 62 NR NR NR NR

C-4
Appendix Table IA. Baseline Characteristics of Placebo-Controlled Randomized Trials of Intraarticular Viscosupplements Injections for Knee OA (cont’d) No. Pts
Randomized OA Diagnosis
(criteria) Mean Baseline Pain Score
Movement (VAS mm)
Rest (VAS mm)
WOMAC Pain Score
Study
HA Derivative
(Trade Name)
Tx Plac
Overall Mean Age
(years)
Female Pts (%)
1° 2° 1° 2°
?
OA Stage
(%)
Mean Disease Duration (years)
Tx Pl Tx Pl Tx Pl
Jubb et al (2003)
Sodium hyaluronate (Hyalgan)
208 200 64 68 x1 KL
2-3 8 57 56 NR NR NR NR
Karlsson et al (2002)
Sodium hyaluronan (Artzal) or
Hylan G-F 20 (Synvisc)
92 (Artzal)
88 (Synvis
c)
66 71 65 x Ahl 1-2 NR
64 (Artzal)
63 (Synvis
c)
65
33 (Artzal)
33 (Synvis
c)
33
10 (Artzal
) 10
(Synvisc)
10
Kotevoglu et al (2006)
Sodium hyaluronate (Orthovisc)
Hylan G-F 20 (Synvisc)
26 26 26
58.6 (Orth) 59.7 (Syn) 60.1(Plac)
85 (Orth)
90 (Syn)
89 (Plac)
x1
KL 2-4
3.9 (4.6) (Ortho)
4.3 (5.2) (Syn) 3.7 (4.0) (Plac)
NR NR NR NR
17 (Ortho
) 18
(Syn)
20
Lohmander et al
(1996)
Sodium hyaluronate
(Artzal/Supartz)
120 120 58 56 x1
Ahl 1-2 NR 44 42 NR NR NR NR
Moreland et al (1993)
Hylan G-F 20 (Synvisc) 46 48 NR 67 x KL
2-4 NR 79
(Walking)
80 (Walki
ng) NR NR NR NR
Neustadt et al (2005)
Sodium hyaluronate (Orthovisc)
128 4 inj
120 3 inj
124
58.4 (8.9) 4inj
58.9 (8.9) 3inj
59.1(8.3) Plac
48 x1
KL 1 (13) 2 (50) 3 (38)
NR NR NR NR 287 3inj 289 4inj
289 3 inj
287 4 inj
294
Petrella et al (2002)
Sodium hyaluronate (Suplasyn)
25 28 66 46 x2
Altman 1-3 NR NR NR NR NR 3.3 3.6
Pham et al (2004)
Sodium hyaluronate (NRD 101)
131 85 65 67 x1
KL 0 (1) 1 (3)
2 (23) 3 (69) 4 (3)
NR 62 59 NR NR NR NR
Puhl et al (1993)
Sodium hyaluronate
(Artz) 102 107 62 64 x4 NR 1-5
(50% of pts) 54 51 NR NR NR NR

C-5
Appendix Table IA. Baseline Characteristics of Placebo-Controlled Randomized Trials of Intraarticular Viscosupplements Injections for Knee OA (cont’d) No. Pts
Randomized OA Diagnosis
(criteria) Mean Baseline Pain Score
Movement (VAS mm)
Rest (VAS mm)
WOMAC Pain Score
Study
HA Derivative
(Trade Name)
Tx Plac
Overall Mean Age
(years)
Female Pts (%)
1° 2° 1° 2°
?
OA Stage
(%)
Mean Disease Duration (years)
Tx Pl Tx Pl Tx Pl
Rolf et al. (2005)
Hylan G-F 20 (Synvisc) Sodium
hyaluronate (Artz)
90 Syn 91 Artz
91 Plac
54.5 (9.2) Syn
53.9 (9.0) Artz
53.1 (10) Plac
44 Syn 38 Artz 38 Plac 40.4 All
x3 ?
Ahl 0-3
7.2 (5.9) Syn 8.3 (7.6) Artz
7.8 (5.9) Plac
NR NR NR NR NR NR
Russell et al (1992)
Sodium hyaluronate (unspecified)
71 71 62 56 x NR NR NR NR NR NR NR NR
Scale et al (1994)
Hylan G-F 20 (Synvisc)
25 (2inj) 15 (3inj) 40 59 51 x5
Larsen 2 (44) 3 (48) 4 (9)
4-6 62 (2inj) 67(3inj)
70 NR NR NR NR
Sezgin et al. (2005)
Sodium hyaluronate (Orthovisc)
22 19 59.7 75.6 x1
KL 2-3
41.7 HA 31.0 Plac NR NR NR NR 18.9 17.2
Shichikawa (1983a)
Sodium hyaluronate
(Artz) 114 114 NR NR x KL
1-4 NR NR NR NR NR NR NR
Shichikawa (1983b)
Sodium hyaluronate
(Artz) 52 55 62 83 x NR NR NR NR NR NR NR NR
Tamir et al (2001)
Sodium hyaluronate
(BioHy/Nuflexxa)
25 24 71 73 x1
KL 2 (22)) 3 (55) 4 (20)
NR NR NR NR NR NR NR
Tsai et al (2003)
Sodium hyaluronate (Hyalgan)
100 100 65 76 x1 KL
2-3 1.2 48 46 NR NR 46 45
UK (1996)
Sodium hyaluronate (Orthovisc)
116 115 60.8 (HA) 61.6(Plac)
60.3(HA)
53.9(Plac)
x NR NR NR NR NR NR NR NR

C-6
Appendix Table IA. Baseline Characteristics of Placebo-Controlled Randomized Trials of Intraarticular Viscosupplements Injections for Knee OA (cont’d) No. Pts
Randomized OA Diagnosis
(criteria) Mean Baseline Pain Score
Movement (VAS mm)
Rest (VAS mm)
WOMAC Pain Score
Study
HA Derivative
(Trade Name)
Tx Plac
Overall Mean Age
(years)
Female Pts (%)
1° 2° 1° 2°
?
OA Stage
(%)
Mean Disease Duration (years)
Tx Pl Tx Pl Tx Pl
Wobig et al (1998)
Hylan G-F 20 (Synvisc)
52 54 4 pts both
62 65 x5
Larsen 1 (11) 2 (46) 3 (36) 4 (7)
6 71 75 42 47 NR NR
Wu et al (1997)
Sodium hyaluronate
(Artz)
90 total; 116 knees Pts per group not reported
69 28 x NR 1.6 NR NR NR NR NR NR
KL – Kellgren and Lawrence criteria; Ahl -- Ahlbäck; Plac – Placebo; HA – hyaluronan; Syn – Synvisc or hylan G-F 20; Ortho — Orthovisc; 1 ACR criteria; 2 Altman criteria; 3 Outerbridge criteria; 4 Lequesne; 5 Larsen; 4 Presumed Kellgren-Lawrence; 5 65% had prior injury; 6 Ahlbäck

C-7
Appendix Table IB. RCTs of Intra-articular Hyaluronan Injections for OAK: Treatments, Trial Duration, Number Randomized (Hyaluronan and Placebo), and Blinding (bolded studies are unpublished trials in any form; highlighted abstracts not subsequently published).
Treatment Arms Injections
Trial Duration (weeks)
Number Randomized Blinding
HA 20mg Altman & Moskowitz 1998 (HA, placebo arms) Placebo
5 26 332 Double
HA (NASHA) 60mg Altman et al. 2004 Placebo
1 26 347 Double
HA 40mg HA 20mg Bragantini et al. 1987 Placebo
3 8.6 55 Single
HA 30mg Brandt et al. 2001 Placebo
3 27 226 Double
HA 20mg Bunyaratavej et al. 2001 Placebo
4 26 49 Double
HA 20mg x 5 HA 20mg x 3 HA 20mg x 1
Arthrocentesis Carrabba et al . 1995
Arthrocentesis/ Placebo
5 (placebo for HA
after 3 or 1 injections)
26 100 Double
HA 20mg Cohen et al. 1994 Placebo
3 8 39 Double
HA 20mg Corrado et al. 1995 Placebo
5 8 40 Double
HA 20mg Creamer et al. 1994 Placebo
5 9 knees from 12 subjects Single
GF 20 Cubukcu et al. 2004 Placebo
3 8 30 subjects 40 knees Unblinded
HA 25mg Dahlberg et al. 1994 Placebo
5 52 52 Double
HA 25mg Day et al. 2004 Placebo
5 18 240 Double

C-8
Appendix Table IB. RCTs of Intra-articular Hyaluronan Injections for OAK: Treatments, Trial Duration, Number Randomized (Hyaluronan and Placebo), and Blinding (bolded studies are unpublished trials in any form; highlighted abstracts not subsequently published) (continued)
Treatment Arms Injections
Trial Duration (weeks)
Number Randomized Blinding
GF 20 Dickson et al. 2001 Placebo*
3 12 110 Double
HA 20mg Dixon et al. 1988 Placebo
up to 11 48 63 Double
HA 20mg Dougados et al. 1993 Placebo
4 52 110 Single
HA 20mg Formiguera & Esteve 1995 Placebo
5 13 36 Double
HA 25mg 5 inj HA 25mg 3 inj France 1995
Placebo 3 or 5 13 254 Double
HA 20mg Grecomoro et al. 1987 Placebo
3 8.6 34 pts 40 knees Double
HA 30mg Guler et al. 1996 Placebo
3 10.0 30 Double
HA 20mg KL 1 Placebo KL 1
HA 20mg KL 3,4 Henderson et al. 1994
Placebo KL 3,4
5 Main 5 wksPartial to 5
months 91 Double
HA 20mg Hizmetli et al. 1999 Placebo
3and at 6 mo 52 50 Double
HA 20mg Huskisson & Donnelly 1999 Placebo
5 24 100 Double
HA 20mg Jubb et al. 2003 Placebo
3 every 4 months 52 408 Double
HA 25mg GF 20 Karlsson et al. 2002
Placebo 3 52 246 Double
HA 20mg GF 20 Kotevoglu et al. 2006
Placebo 3 26 78 Double

C-9
Appendix Table IB. RCTs of Intra-articular Hyaluronan Injections for OAK: Treatments, Trial Duration, Number Randomized (Hyaluronan and Placebo), and Blinding (bolded studies are unpublished trials in any form; highlighted abstracts not subsequently published) (continued)
Treatment Arms Injections
Trial Duration (weeks)
Number Randomized Blinding
HA 25mg Lohmander et al. 1996 Placebo
5 20 240 Double
GF 20 Moreland et al, 1993 Placebo
3 26 104 Double
HA 30mg 4 HA 30mg 3, 1 placebo Neustadt et. al. 2005 Placebo 4
28 372 Double
HA 20mg/Oral Placebo Petrella et al. 2002 4 arm trial with NSAID Placebo/Oral Placebo
3 12 53 Double
HA NRD 101 Pham et al. 2004 3-arm trial; here report only HA, Placebo Placebo
3 52 216 Double
HA 25 mg Puhl et al. 1993 Placebo
5 14 209 Double
GF 20 HA 25mg Rolf et al. 2005 Placebo
3 52 272 Double
HA 20mg Russell et al. 1992 Placebo
3 14 210 Single
GF 20 3 GF 20 2
Placebo 3 Scale et al. 1994
Placebo 2
12 80 Double
HA 30mg Sezgin et al. 2005 Placebo
3 4 41 Single
HA 25mg/Oral Plac Shichikawa et al. 1983a HA 0.25mg/Oral Plac
5 5 228 Double
HA 25 mg/Oral Plac Shichikawa et al. 1983b HA 0.5mg/Oral Plac
5 5 107 Double
HA 20mg Tamir et al. 2001 Placebo
5 20 49 Single

C-10
Appendix Table IB. RCTs of Intra-articular Hyaluronan Injections for OAK: Treatments, Trial Duration, Number Randomized (Hyaluronan and Placebo), and Blinding (bolded studies are unpublished trials in any form; highlighted abstracts not subsequently published) (continued)
Treatment Arms Injections
Trial Duration (weeks)
Number Randomized Blinding
HA 20mg Tsai et al. 2003 Placebo
5 25 200 Double
HA 25mg UK 1996 Placebo
5 25 231 Double
GF 20 Wobig et al. 1998 Placebo
3 26 110 pts 117 knees Double
HA 25mg Wu et al. 1997 Placebo
5 26 90 pts 116 knees Double
Abbreviations: KL—Kellgren-Lawrence radiographic grade HA—Hyaluronan GF—Hylan G-F 20 * Also included a NSAID/arthrocentesis arm; because NSAID given in that arm, the HA and placebo/arthrocentesis arms were given placebo capsules.

C-11
Appendix Table IC. Treatment of Missing Data, Per Patient of Per Knee Analyses, and Multiple Comparison Adjustment in RCTs of Intra-articular Hyaluronan Injections for OA of the Knee (bolded studies are unpublished trials in any form; highlighted abstracts not subsequently published).
Analyses Intention to Treat (ITT) /Per Protocol (PP) Intention to Treat Analyses
Trial ITT Analyses
PP Analyses* Number Randomized
Number PP
Analyses
Primary Analyses (e.g., reported in
abstract)
Performed and
Reported
Performed but not
Detailed WithdrawalsLoss to f/u
Altman & Moskowitz 1998 Yes Yes 332 220 No Yes 33.7% Altman et al. 2004 Yes Yes 347 232 Yes Yes 21.4%
Bragantini et al. 1987 No Yes 55 52 No No 5.4% Brandt et al. 2001 Yes Yes 226 135 No No† 22.6%
Bunyaratavej et al. 2001 Yes — 49 — Yes NR‡ Carrabba et al. 1995 Yes† — 100 — Yes§ Yes 0.0%**
Cohen et al. 1994 No Yes 39 37 No No 5.1% Corrado et al. 1995 No Yes 40 35 No No 12.5%
Creamer et al. 1994 Yes† — 24 knees; 12 subjects — Yes† Yes 0.0% Cubukcu et al. 2004 Yes† — 40 knees; 30 subjects — Yes† Yes 0.0% Dahlberg et al. 1994 Yes — 52 — Yes Yes 7.5%
Day et al. 2004 No Yes 240 223 No No 7.1% Dickson et al. 2001 Yes Yes 110 92 Yes Yes 16.4%
Dixon et al. 1988 Unclear Probable 63 53 Unclear Unclear 15.9% Dougados et al. 1993 Yes Yes 110 95 No No Yes 13.6%
Formiguera & Esteve 1995 Yes — 40 knees; 36 subjects 40 knees Yes Yes 0.0% France 1995 Yes?†† — 254 — NA NA Unknown
Grecomoro et al. 1987 Yes — 40 knees; 34 subjects 40 knees Yes Yes 10.0% Guler et al. 1996 Yes — 30 — Yes Yes NR
Henderson et al. 1994 Yes — 91 — Yes Yes 7.7%
* — indicates no distinction made and considered intention to treat. † Only reported ITT "differences between treatment groups did not reach statistical significance". ‡ NR is not reported § Not specified as ITT, but no lower losses to follow-up when primary efficacy outcome was assessed. ** No losses to follow-up at 2 months when primary efficacy outcome assessed; by 6 months 10% loss to follow-up †† Results reported in Supartz® package insert “ITT” population.

C-12
Appendix Table IC. Treatment of Missing Data, Per Patient of Per Knee Analyses, and Multiple Comparison Adjustment in RCTs of Intra-articular Hyaluronan Injections for OA of the Knee (bolded studies are unpublished trials in any form; highlighted abstracts not subsequently published). (continued)
Analyses Intention to Treat (ITT) /Per Protocol (PP) Intention to Treat Analyses
Trial ITT Analyses
PP Analyses* Number Randomized
Number PP
Analyses
Primary Analyses (e.g., reported in
abstract)
Performed and
Reported
Performed but not
Detailed WithdrawalsLoss to f/u
Hizmetli et al. 1999 No Yes† 50 40 NA NA 20.0% Huskisson & Donnelly 1999 Yes Yes 100 80/81 Yes Yes 19.0%
Jubb et al. 2003 Yes‡ Yes 408 273 No Yes 33.1% Karlsson et al. 2002 No Yes 246 210 No No Yes 23.3%§
Kotevoglu et al. 2006 No Yes 78 59 No No 24.4% Lohmander et al. 1996 Yes Yes 240 189 No Partial Partial 21.3%
Moreland et al, 1993 Unclear Probable 104 94? Unclear NR Neustadt et. al. 2005 No Yes 372 336 No No 9.7%
Petrella et al. 2002 Yes No 120 — Yes 10.0% Pham et al. 2004 Yes Yes 216 202 Yes Yes 6.5%
Puhl et al. 1993 Yes Yes 209 195 No No Yes 6.7% Rolf et al. 2005 Yes Yes 272 268 Yes Yes 8.4%
Russell et al. 1992 NR 142 NR 19.9% Scale et al. 1994 No** 80 Unclear NR
Sezgin et al. 2005 Yes — 41 Yes 0.0% Shichikawa et al. 1983a No Yes 228 219 No 9.2% Shichikawa et al. 1983b No Yes 107 98 No 8.4%
Tamir et al. 2001 Unclear — 49 — No No No 14.3% Tsai et al. 2003 Yes Yes 200 Yes NR
UK 1996 Unknown 131 NR NR Wobig et al. 1998 Yes No 117 knees; 110 subjects Yes Yes 0.0%
Wu et al. 1997 No Yes 116 knees; 90 subjects 58 knees‡‡‡ No No No 50.0%††
* — indicates no distinction made and considered intention to treat. † As reported by Bellamy et al. (2006) ‡ Reported PP values in paper. § Through 26 weeks ** Combined 2 control groups post-hoc so not an intention to treat analysis (see also text). †† At 26 weeks

C-13
Appendix Table ID. Trial Quality for Hyaluronan-Products (bolded studies are unpublished trials in any form; highlighted abstracts not subsequently published)
Trial
Quality
Initial Assembly
Comparable Groups
< 80% loss to follow up, Maintain
Comparable Groups
Measure- ments
Reliable, Valid, Equal
Intervention Comparable/
Clearly Defined
Appropriate Analysis of
Results Allocation
concealment Altman & Moskowitz 1998 Fair Y N Y Y Y B
Altman et al. 2004 Good Y Y Y Y Y A Bragantini et al. 1987 Poor N Y Y Y N B
Brandt et al. 2001 Poor Y N Y Y N A Bunyaratavej et al. 2001 Fair Y Unclear Y Y Y B
Carrabba et al . 1995 Good Y Y Y Y Y B Cohen et al. 1994 Poor Y Y Y Y N B
Corrado et al. 1995 Fair Y Y Y Y N B Creamer et al. 1994 Fair Y Y N Y Y B Cubukcu et al. 2004 Fair Y Y Y Y N B Dahlberg et al. 1994 Good Y Y Y Y Y B
Day et al. 2004 Good Y Y Y Y Unclear B Dickson et al.† 2001 Fair Y Y Y Y No B
Dixon et al. 1988 Poor N Y Y N Unclear B Dougados et al. 1993 Poor N Y Y Y Unclear B
Formiguera & Esteve 1995 Poor Unclear Y Unclear Y Unclear B France 1995 NA NA NA NA NA NA NA
Grecomoro et al. 1987 Poor NR Y Y Y No B Guler et al. 1996 NA NA NA NA NA NA B
Henderson et al. 1994 Good Y Y Y Y Y B Hizmetli et al. 1999 NA NA NA NA NA NA NA
Huskisson & Donnelly 1999 Good Y Y Y Y Y B Jubb et al. 2003 Fair Y N Y Y Y B
Karlsson et al. 2002 Fair Y N Y Y N B Kotevoglu et al. 2006 Poor Y N Y Y N B
Lohmander et al. 1996 Poor Y N Y Y N B Moreland et al, 1993 Poor NR NR NR Y NR B Neustadt et. al. 2005 Fair Y Y Y Y N A

C-14
Appendix Table ID. Trial Quality for Hyaluronan-Products (bolded studies are unpublished trials in any form; highlighted abstracts not subsequently published) (continued)
Petrella et al. 2002 Good Y Y Y Y Y A Pham et al. 2004 Good Y Y Y Y Y A
Puhl et al. 1993 Fair N Y Y Y N A Rolf et al. 2005 Good Y Y Y Y Y B
Russell et al. 1992 NA Scale et al. 1994 Poor Y NR Y Y N A
Sezgin et al. 2005 Fair Y Y Y Y Unclear B Shichikawa et al. 1983a Fair Y Y Y Y N A Shichikawa et al. 1983b Fair Y Y Y Y N A
Tamir et al. 2001 Fair Y Unclear Y Y Y B Tsai et al. 2003 Fair U U Y Y U B
UK 1996 NA Wobig et al. 1998 Poor N Y Y Y N A
Wu et al. 1997 Fair Y N Y Y N B

C-15
Appendix Table IE. Sample Size Calculations Described in RCTs of Hyaluronan-based Products (bolded studies are unpublished trials in any form; highlighted abstracts not subsequently published)
Sample Size Calculation
Trial Performed
Type IError Power Difference Powered to Detect
Altman & Moskowitz 1998 (HA placebo arms) Yes 0.05 0.80 8mm VAS pain 50 foot walk for 50mm baseline Altman et al. 2004 Yes 0.05 0.80 35% HA vs. 20% Placebo
Bragantini et al. 1987 No Brandt et al. 2001 Yes 0.05 0.80 0.5 unit WOMAC pain 1 to 5 (12.5%)
Bunyaratavej et al. 2001 No Carrabba et al . 1995 No
Cohen et al. 1994 No Corrado et al. 1995 No
Creamer et al. 1994 No Cubukcu et al. 2004 No Dahlberg et al. 1994 Yes 0.05 0.80 18 mm VAS improvement HA; 9 mm placebo; baseline 45 mm SD 22
Day et al. 2004 Yes 0.05 0.90 10% reduction in WOMAC pain score Dickson et al. 2001 Yes 0.05 0.80 25% difference in proportion of patients with 25% decrease in WOMAC pain
Dixon et al. 1988 No Dougados et al. 1993 Yes 0.05 0.80 Disappearance of knee effusion at week 7; 20% placebo; 50% active
Formiguera & Esteve 1995 No France 1995 Unknown
Grecomoro et al. 1987 No Guler et al. 1996 Unknown
Henderson et al. 1994 Yes 0.05 0.90 13.1 mm difference on VAS pain Hizmetli et al. 1999 Unknown
Huskisson & Donnelly 1999 Yes 0.05 0.90 15.4 mm difference on VAS pain Jubb et al. 2003 Yes NR NR Standardized difference in JSN of 0.32 with dropout rate of 25%
Karlsson et al. 2002 Yes 0.05 0.80 Detect a 15mm difference in VAS pain decrease Kotevoglu et al. 2006 Yes 0.05 0.80 No outcome difference specified
Lohmander et al. 1996 Yes 0.05 0.90 VAS pain treatment difference of 12 mm Moreland et al. 1993 Unknown Neustadt et. al. 2005 Yes 0.05 0.80 55% placebo and 60% saline response
Petrella et al. 2002 Yes NR 0.80 “20% pain reduction among groups”

C-16
Appendix Table IE. Sample Size Calculations Described in RCTs of Hyaluronan-based Products (bolded studies are unpublished trials in any form; highlighted abstracts not subsequently published) (continued)
Sample Size Calculation
Trial Performed
Type IError Power Difference Powered to Detect
Pham et al. 2004 Yes 0.05 0.90 Difference between baseline and year of 15 mm VAS pain SD 35 Puhl et al. 1993 Yes 0.05 0.90 SMD in Lequesne of 0.5 between hyaluronan and placebo Rolf et al. 2005 Yes 0.05 0.80 40% Synvisc; 20% Artzal would be symptom free; placebo rate not specified
Russell et al. 1992 Unknown Scale et al. 1994 No
Sezgin et al. 2005 No Shichikawa et al. 1983a No Shichikawa et al. 1983b No
Tamir et al. 2001 No Tsai et al. 2003 Unknown
UK 1996 (not all information available) Unknown Wobig et al. 1998 Yes 0.05 0.80 15 mm on VAS with SD of 25
Wu et al. 1997 No

C-17
Appendix Table IF. Industry Involvement in RCTs of Intra-articular Hyaluronan Injections for OAK (bolded studies are unpublished trials in any form; highlighted abstracts not subsequently published). Industry Involvement
Trial Funding Analyses Author
Altman & Moskowitz 1998 Fidia Fidia Altman et al. 2004 Q-Med
Bragantini et al. 1987 NR Yes Brandt et al. 2001 Anika
Bunyaratavej et al. 2001 NR Carrabba et al. 1995 NR Fidia
Cohen et al. 1994 Bioniche Corrado et al. 1995 NR
Creamer et al. 1994 Fidia Cubukcu et al. 2004 NR Dahlberg et al. 1994 KaroBio
Day et al. 2004 Seikagaku Dickson et al. 2001 Syntex/Roche
Dixon et al. 1988 Fidia Dougados et al. 1993 NR Fidia
Formiguera & Esteve 1995 NR France 1995 Seikagaku Seikagaku Unpublished
Grecomoro 1987 NR Guler et al. 1996 NR
Henderson et al. 1994 Fidia/Product Hizmetli et al. 1999 Anika Anika Anika
Huskisson & Donnelly 1999 NR Jubb et al. 2003 Fidia Fidia Fidia
Karlsson et al. 2002 Astra Lakemedel Author Kotevoglu et al. 2006 NR
Lohmander et al. 1996 Multiple inc Industry Moreland et al, 1993 Biomatrix Neustadt et. al. 2005 Anika Therapeutics
Petrella et al. 2002 Bioniche ?Bioniche Bioniche Pham et al. 2004 NR Author
Puhl et al. 1993 Luitpold Pharma Luitpold Rolf et al. 2005 Biomatrix/Roche/Genxyme 2 Authors
Russell et al. 1992 NR Scale et al. 1994 Biomatrix ?*
Sezgin et al. 2005 NR Shichikawa et al. 1983a Seikagaku ? Shichikawa et al. 1983b Seikagaku (drug)
Tamir et al. 2001 NR Affiliation Tsai et al. 2003 Medpharma Fidia
UK 1996 NR Wobig et al. 1998 Biomatrix
Wu et al. 1997 NR * Address for correspondence Arnold Goldman, PhD at Biomatrix who was not listed as author.

C-18
Appendix Table IG. Treatment of Missing Data, Per Patient of Per Knee Analyses, and Multiple Comparison Adjustment in RCTs of Intra-articular Hyaluronan Injections for OAK (bolded studies are unpublished trials in any form; highlighted abstracts not subsequently published). Analyses Per Patient or Per Knee
Analysis Missing Data Multiple Comparison Adjustment Altman & Moskowitz 1998 Patient LOCF No
Altman et al. 2004 Patient LOCF No Bragantini et al. 1987 Knee NR No
Brandt et al. 2001 Patient NR No Bunyaratavej et al. 2001 Patient NR No
Carrabba et al . 1995 Patient NR Yes Cohen et al. 1994 Patient NR NR
Corrado et al. 1995 Patient NR Yes Creamer et al. 1994 Knee NR No Cubukcu et al. 2004 Knee NR Yes Dahlberg et al. 1994 Patient NR No
Day et al. 2004 Patient LOCF Repeated Measures ANCOVA Dickson et al. 2001 Patient NR Repeated Measures ANOVA
Dixon et al. 1988 Patient NR No Dougados et al. 1993 Patient NR No
Formiguera & Esteve 1995 Knee NR MANOVA France 1995 Patient NR Repeated Measures ANCOVA
Grecomoro et al. 1987 Knee NR ANOVA to day 21 Guler et al. 1996 NR NR NR
Henderson et al. 1994 Patient Complete case No Hizmetli et al. 1999 Patient Unknown Unknown
Huskisson & Donnelly 1999 Patient LOCF No Jubb et al. 2003 Patient LOCF No
Karlsson et al. 2002 Patient LOCF No Kotevoglu et al. 2006 Patient NR Yes/Tukey
Lohmander et al. 1996 Patient LOCF No Moreland et al, 1993 Knee NR NR Neustadt et. al. 2005 Patient GEE (MCAR) Yes/Hochberg
Petrella et al. 2002 Patient NR Repeated Measures ANCOVA Pham et al. 2004 Patient LOCF NR
Puhl et al. 1993 Patient ?LOCF/MANOVA Bonferroni-Holm

C-19
Appendix Table IG. Treatment of Missing Data, Per Patient of Per Knee Analyses, and Multiple Comparison Adjustment in RCTs of Intra-articular Hyaluronan Injections for OAK (bolded studies are unpublished trials in any form; highlighted abstracts not subsequently published). (continued) Analyses Per Patient or Per Knee
Analysis Missing Data Multiple Comparison Adjustment Rolf et al. 2005 Patient NR No
Russell et al. 1992 NR NR NR Scale et al. 1994 Patient NR NR
Sezgin et al. 2005 Patient None LSD; Rep meas ANOVA Shichikawa et al. 1983a Patient NR NA Shichikawa et al. 1983b Patient NR NA
Tamir et al. 2001 Patient NR NR Tsai et al. 2003 Patient LOCF NR
UK 1996 NR Unknown Unknown Wobig et al. 1998 Knee Complete Case NR
Wu et al. 1997 Knee NR NR Abbreviations LOCF—Last Observation Carried Forward NR—Not reported NA—Not available GEE—Generalized Estimating Equation regression MCAR—Missing Completely At Random assumption for missing data ANOVA—Analysis of Variance ANCOVA—Analysis of Covariance

C-20
Appendix Table IH. Adverse Events Associated with Hyaluronan Injections for Knee OA in Placebo-Controlled RCTs. Injection Site Pain/Infection
n (%)
Local Joint Pain/Swelling
n (%)
Local Skin n (%)
Headache n (%)
GI Tract n (%)
Nervous System n (%)
Respiratory Tract n (%)
Urinary Tract n (%)
General Body n (%)
Study (year)
HA Derivative (Trade Name)
Tx PL Tx PL Tx PL Tx PL Tx PL Tx PL Tx PL Tx PL Tx PL Altman and Moskowitz
(1998)
Sodium hyaluronate (Hyalgan)
38 (23)
22 (13)
21 (13)
22 (13)
35 (21)
33 (14)
30 (18)
29 (17)
48 (29)
59 (36) NR NR NR NR NR NR NR NR
Altman et al (2004)
Non animal stabilized
hyaluronic acid (Durolane)
NR NR 11 (6)
5 (3) NR NR NR NR NR NR NR NR NR NR NR NR NR NR
Bragantini et al (1987)
Sodium hyaluronate (Hyalgan)
4 (10) NR 4
(10) NR NR NR NR NR NR NR NR NR NR NR NR NR NR NR
Brandt et al (2001)
Sodium hyaluronate (Orthovisc)
1.2% 1.5% 34 (30)
30 (27)
5 (4)
6 (5) NR NR 11
(10) 16
(14) 15
(13) 16
(14) 26
(23) 18
(16) 6
(5) 9
(8) 21
(18) 23
(21)
Bunyaratavej et al (2001)
Sodium hyaluronate (Hyalgan)
NR NR NR NR NR NR NR NR NR NR NR NR NR NR NR NR NR NR
Carrabba et al . (1995)
Sodium hyaluronate (Hyalgan)
NR NR 3 (5)
1 (3) NR NR NR NR NR NR NR NR NR NR NR NR NR NR
Cohen et al. (1994)
Sodium hyaluronate (Hyalgan)
NR NR 3 (16)
6 (30) NR NR NR NR NR NR NR NR NR NR NR NR NR NR
Corrado et al (1995)
Sodium hyaluronate (Hyalgan)
NR NR NR NR NR NR NR NR NR NR NR NR NR NR NR NR NR NR
Creamer et al. (1994)
Sodium hyaluronate (Hyalgan)
NR NR 3 (25)
1 (8) NR NR NR NR NR NR NR NR NR NR NR NR NR NR
Cubukcu et al. (2005)
Hylan G-F 20 (Synvisc) NR NR 1 NR NR NR NR NR NR NR NR NR NR NR NR NR NR
Dahlberg et al (1994)
Sodium hyaluronate
(Supartz)
“a few”
1 (4)
“a few”
“a few”
“a few”
“a few” NR NR NR NR NR NR NR NR NR NR NR NR
Day et al (2004)
Sodium hyaluronate
(Artz)
16 (14)
13 (10) NR NR NR NR NR NR NR NR NR NR NR NR NR NR NR NR
Dickson and Hosie (1998)
Hylan G-F 20 (Synvisc)
1.8% per injection
rate
0.6% per injection
rate NR NR NR NR NR NR 5
(11) 4
(9) NR NR NR NR NR NR NR NR
Dixon et al (1988)
Sodium hyaluronate (Hyalgan)
NR NR 3 (10) NR NR NR NR NR NR NR NR NR NR NR NR NR NR NR

C-21
Appendix Table IH. Adverse Events Associated with Hyaluronan Injections for Knee OA in Placebo-Controlled RCTs (continued). Injection Site Pain/Infection
n (%)
Local Joint Pain/Swelling
n (%)
Local Skin n (%)
Headache n (%)
GI Tract n (%)
Nervous System n (%)
Respiratory Tract n (%)
Urinary Tract n (%)
General Body n (%)
Study (year)
HA Derivative (Trade Name)
Tx PL Tx PL Tx PL Tx PL Tx PL Tx PL Tx PL Tx PL Tx PL
Dougados et al (1993)
Sodium hyaluronate (Hyalgan)
18 (33)
18 (33) NR NR NR NR 1
(2) NR NR NR NR NR NR NR NR NR NR NR
Formiguera Sala et al
(1995)
Sodium hyaluronate (Hyalgan)
3 (15)
3 (15) NR NR NR NR NR NR NR NR NR NR NR NR NR NR NR NR
France (1995)
Sodium hyaluronate
(Supartz) Only reported for 3 injection
arm (not 5 injection)
3 (3.4)
4 (5.0)
11 (12.6) 3 inj 5 not
reported
12 (15) NR NR 3
(3.4) 4
(5.0) NR NR NR NR NR NR NR NR
10 (12) back pain
10 (13) bac
k pain
Grecomoro et al (1987)
Sodium hyaluronate (Hyalgan)
NR NR NR NR NR NR NR NR NR NR NR NR NR NR NR NR NR NR
Guler et al. (1996)
Sodium hyaluronate (Orthovisc)
NR NR NR NR NR NR NR NR NR NR NR NR NR NR NR NR NR NR
Henderson et al (1994)
Sodium hyaluronate (Hyalgan)
NR NR 21 (47)
10 (22) NR NR NR NR NR NR NR NR NR NR NR NR NR NR
Huskisson and Donnelly (1999)
Sodium hyaluronate (Hyalgan)
NR NR 7 (14)
7 (14) NR NR NR NR NR NR NR NR NR NR NR NR 1
(2) NR
Jubb et al (2003)
Sodium hyaluronate (Hyalgan)
25 (12)
Infection
22 (10.6)
20 (10)
Infection
27 (13.5)
75 (36)
45 (23) NR NR 26
(13) 15 (8)
11 (5)
10 (5)
13 (6)
8 (4)
18 (9)
18 (9) NR NR 43
(21) 35
(18)
Karlsson et al (2002)
Sodium hyaluronan (Artzal) or
Hylan G-F 20 (Synvisc)
NR NR NR NR NR NR NR NR NR NR NR NR NR NR NR NR NR NR
Kotevoglu et al. 2006
Sodium hyaluronate (Orthovisc)
Hylan G-F 20 (Synvisc)
NR NR NR NR NR NR NR NR NR NR NR NR NR NR NR NR NR NR

C-22
Appendix Table IH. Adverse Events Associated with Hyaluronan Injections for Knee OA in Placebo-Controlled RCTs (continued). Injection Site Pain/Infection
n (%)
Local Joint Pain/Swelling
n (%)
Local Skin n (%)
Headache n (%)
GI Tract n (%)
Nervous System n (%)
Respiratory Tract n (%)
Urinary Tract n (%)
General Body n (%)
Study (year)
HA Derivative (Trade Name)
Tx PL Tx PL Tx PL Tx PL Tx PL Tx PL Tx PL Tx PL Tx PL
Lohmander et al (1996)
Sodium hyaluronan
(Artzal) NR NR
Significant difference in favor of PL in
maximum severity of
injection site swelling (p =
0.041)
NR NR NR NR NR NR NR NR NR NR NR NR NR NR
Moreland et al (1993)
Hylan G-F 20 (Synvisc) NR NR
1% of 400
injections
NR NR NR NR NR NR NR NR NR NR NR NR NR NR NR
Neustdat (2005)
Sodium hyaluronate (Hyalgan)
49 (20)
7 (3)
20 (14)
2 (2)
4 (3)
4 (3)
A “most frequent AE but not
numbers not stated
21 (9)
10 (8)
38 (15)
26 (21)
9 (4)
5 (4) NR NR 21
(9) 9
(7)
Petrella et al (2002)
Sodium hyaluronate (Suplasyn)
NR NR NR NR NR NR NR NR NR NR NR NR NR NR NR NR NR NR
Pham et al (2004)
Sodium hyaluronate (NRD 101)
NR NR
24 (18) (p =
.0088 vs PL)
19 (22)
9 (7)
1 (1)
Included in nervous system
tally
27 (20)
25 (29)
8 (6)
2 (2)
17 (13)
16 (19) 0 0 3
(5) 5
(6)
Puhl et al (1993)
Sodium hyaluronate
(Supartz)
3 (3)
1 (1) NR NR NR NR NR NR NR NR NR NR NR NR NR NR NR NR
Rolf et al. (2005)
Hylan G-F 20 (Synvisc) Sodium
hyaluronate (Artz)
3 (2)
0 (0) NR NR NR NR 28
(15) 21
(23) 6
(3) 2
(2)
30 (17) inc HA
21 (23) inc HA
9 (5)
6 (7)
3 (2)
0 (0)
35 (19)
20 (22)
Russell et al (1992)
Sodium hyaluronate (not
specified) NR NR NR NR NR NR NR NR NR NR NR NR NR NR NR NR NR NR
Scale et al (1994)
Hylan G-F 20 (Synvisc)
1 (group not
specified)
NR NR NR NR NR NR NR NR NR NR NR NR NR NR NR NR NR

C-23
Appendix Table IH. Adverse Events Associated with Hyaluronan Injections for Knee OA in Placebo-Controlled RCTs (continued). Injection Site Pain/Infection
n (%)
Local Joint Pain/Swelling
n (%)
Local Skin n (%)
Headache n (%)
GI Tract n (%)
Nervous System n (%)
Respiratory Tract n (%)
Urinary Tract n (%)
General Body n (%)
Study (year)
HA Derivative (Trade Name)
Tx PL Tx PL Tx PL Tx PL Tx PL Tx PL Tx PL Tx PL Tx PL
Shichikawa (1983a)
Sodium hyaluronate
(Artz) NR NR 1
(1) 5
(4) NR NR NR NR NR NR NR NR NR NR NR NR NR NR
Shichikawa (1983b)
Sodium hyaluronate
(Artz) NR NR 1
(2) 1
(2) NR NR NR NR NR NR NR NR NR NR NR NR NR 1 (2)
Sezgin (2005)
Sodium hyaluronate (Orthovisc)
NR NR NR NR NR NR NR NR NR NR NR NR NR NR NR NR NR NR
Tamir et al (2001)
Sodium hyaluronate
(BioHy)
18 (72)
11 (46) NR NR NR NR NR NR NR NR NR NR NR NR NR NR NR NR
Wobig et al (1998)
Hylan G-F 20 (Synvisc) NR 2
(3) NR NR 1 (2) NR NR NR 1
(2) NR NR NR NR NR NR NR 1 (2) NR
Wu et al (1997)
Sodium hyaluronate
(Artz) NR NR NR NR NR NR NR NR NR NR NR NR NR NR NR NR NR NR
NR – Not Reported

C-24
Appendix Table IJ. Authors’ conclusions from the five study-level meta-analyses. Meta-Analysis Relevant conclusions Lo (2003) “Intra-articular hyaluronic acid has a small effect when compared with an intra-articular placebo. The presence of
publication bias suggests even this effect may be overestimated. Compared with lower-molecular-weight hyaluronic acid, the highest-molecular-weight hyaluronic acid may be more efficacious in treating knee OA, but heterogeneity of these studies limits definitive conclusions.” “[A]pproximately 80% of the treatment effect of intra-articular hyaluronic acid was accounted for by the placebo effect of an intra-articular injection.”
Wang (2004) “This meta-analysis confirmed the therapeutic efficacy and safety of intra-articular injection of hyaluronic acid for the treatment of osteoarthritis of the knee. Additional well-designed randomized controlled RCTs with high methodologic quality are needed to resolve the continued uncertainty about the therapeutic effects of different types of hyaluronic acid products on osteoarthritis of the knee in various clinical situations and patient populations.”
Arrich (2005) “The methodologic quality of most RCTs was poor” “According to the currently available evidence, intra-articular hyaluronic acid has not been proven clinically effective and may be associated with a greater risk of adverse events.”
Modawal (2005) “Intra-articular viscosupplementation was moderately effective in relieving knee pain in patients with osteoarthritis at 5 to 7 and 8 to 10 weeks after the last injection but not at 15 to 22 weeks.”
Bellamy (2006) “… viscosupplementation is an effective treatment for OA of the knee with beneficial effects: on pain, function and patient global assessment; and at different post injection periods but especially at the 5 to 13 week post injection period…. The clinical effect for some products, against placebo, on some variables at some timepoints is in the moderate to large effect-size range…. Overall, the analyses performed are positive for the HA class and particularly positive for some products with respect to certain variables and timepoints, such as pain on weight bearing at 5 to 13 weeks post injection.”

C-25
Part II: Glucosamine/Chondroitin Appendix Table IIA. General Comparison of Glucosamine and Chondroitin Meta-Analyses in Knee Osteoarthritis
Key Question Addressed
Author (year)
1 2 3 4
Literature Search Study Inclusion Criteria Search Results
Overall Patient Demographics
Intervention(s) Health Outcomes Analyzed
Bjordal et al (2006)
x x MEDLINE, EMBASE, PedRo, CCTR All databases searched from 1966 to November 2005 using a specified protocol to identify RCTs Manual search of reference lists of systematic reviews, conference abstracts, and discussions with clinical experts Papers in English, German, and Scandinavian languages were eligible for inclusion
Blinded, randomized, placebo-controlled trials that lasted at least 4 weeks, included patients with knee OA verified by clinical examination according to ACR or X-ray criteria, with minimum symptom duration of 3 months, and primary outcome measure of pain intensity within 4 weeks of treatment start scored on WOMAC pain subscale or a 100 mm VAS
Initial search: number of hits unclear 7 RCTs on GS and 6 on CS included in MA
401 pts in GS trials 362 pts in CS trials Mn age 58.6 yrs in GS trials Mn age 63.0 yrs in CS trials Sex distribution not provided for individual interventions, overall 63% female
Oral GS 1500 mg daily, duration not specified Oral CS 800 mg daily, duration not specified
1) Pain intensity within 4 weeks of treatment start scored according to WOMAC pain subscale or on a 100 mm VAS for global or walking pain 2) Pain intensity, as measured for the primary outcome measure at 8-12 weeks follow-up

C-26
Towheed et al (2006)
x x MEDLINE, EMBASE, PREMEDLINE, Cochrane Controlled Trials Register (CCTR), Cochrane Database of Systematic Reviews (CDSR), American College of Physicians (ACP) Journal Club, Database of Abstracts of Reviews of Effectiveness (DARE), Allied and Complementary Medicine (AMED) All databases searched from inception to January 2005 using a validated protocol to identify RCTs Manual search of reference lists of primary and review articles No language or age restrictions used in initial searches
Single- or double-blinded, placebo- or active-controlled randomized clinical trials (RCTs) that reported usable quantitative data on the efficacy and toxicity of glucosamine sulfate (GS) or glucosamine hydrochloride (GH) [Rotta in 13 trials, 6 used non-Rotta product] administered by any route on at least one of the outcomes of interest in patients age 18 years or older with primary or secondary OA at any site except temporomandibular joint (TMJ)
Initial search: number of hits unclear 20 RCTs included in MA
2,596 total pts Mn age 61.1 yrs 67% female
17/20 (85%) RCTs compared GS (16 trials) or GH (1 trial) to placebo 4 RCTs compared GS to ibuprofen (3 trials) or piroxicam (1 trial) 16 RCTs used oral glucosamine 1500 mg/day as a single dose (4 trials) or as 500 mg thrice daily (12 trials) 3 RCTs used parenteral (IM, IA, IV) GS 400 mg once daily (2 trials) or twice weekly (1 trial) 16 RCTs evaluated the knee only, 2 RCTs evaluated OA at multiple sites (knee, hip, other), 2 RCTs did not specify the OA site 7 RCTs included primary OA, 13 RCTs did not make a clear distinction between primary and secondary OA
1) Pain measured by any method 2) Functional assessment by a validated method (eg, WOMAC) 3) Patient global assessment 4) Physician global assessment 5) Range of motion of study joint 6) Structural benefits, defined as delay of radiological progression of OA 7) Toxicity of glucosamine measured as adverse events and study subject withdrawals

C-27
Poolsup et al (2005)
x MEDLINE, EMBASE, BIOSIS, EBM review, Cochrane Library All databases searched from inception to August 2004 using MeSH search terms (osteoarthritis, glucosamine, knee, disease progression and clinical trial) followed by a key word search (degenerative joint disease, degenerative arthritis, osteoarthrosis, and gonarthrosis) Manual search of reference lists of primary and review articles Language restriction not noted
Double-blind, randomized, controlled trials that lasted at least one year in patients with primary knee OA
Initial search: number of hits unclear 2/17 RCTs included in MA
414 total pts Mn age 64.1 yrs 77% female
Oral GS 1500 mg once daily for 3 yrs versus oral placebo
1) Main efficacy outcome was JSN in the signal joint, reported in terms of relative risk of disease progression, defined as the proportion of patients with JSN > 0.5 mm in the GS group relative to the placebo group 2) Symptom-modifying effects of GS were assessed by WOMAC pain or physical function subscales 3) Toxicity of GS measured as proportion of patients who experienced an adverse event

C-28
Richy et al (2003)
x MEDLINE, PREMEDLINE, EMBASE, BIOSIS Previews, HealthSTAR, EBM reviews, Cochrane Library, Current Contents All databases searched from January 1980 to March 2002 using a validated protocol to identify RCTs Manual search of reference lists of primary and review articles, abstracts of scientific meetings, contacts of authors for unpublished data No language or age restrictions
Double-blind, randomized, placebo-controlled trials that lasted at least 4 weeks, with sufficient precision in design, methods and results, in patients with knee or hip OA
Initial search: > 500 hits 15/36 RCTs included in MA
1,775 total pts (1,020 given GS, 755 chondroitin sulfate [CS]) Mn age 62.1 yrs Sex distribution not provided in MA, but no significant differences were noted in the report
Oral GS 750 or 1500 mg daily for 1-36 mos Oral CS 200-2000 mg daily for 3-12 mos
1) JSN 2) Lequesne Index (LI) 3) WOMAC index 4) Pain by VAS 5) Joint mobility by VAS 6) Responders to treatment and safety
Leeb et al (2000)
x x MEDLINE, EMBASE, personal searches Time period of search not provided, no keywords or protocol specified Language or age restrictions not noted
Double-blind, randomized, placebo-controlled trials that contained data on at least half of the efficacy variables proposed by EULAR, in patients with knee or hip OA
Initial search: 16 hits 7/16 RCTs included in MA
703 total pts (372 given CS, 331 controls) Sex and age distributions not provided in MA, but no significant differences were noted in the report
Oral CS 800-1200 mg daily for 3-12 mos
1) Pain by VAS 2) Algofunctional LI 3) Patients and physicians global assessment 4) Analgesic or NSAID consumption 4) Toxicity

C-29
McAlindon et al (2000)
x x MEDLINE, Cochrane Controlled Trials Register All databases searched from 1966 to June 1999 using a validated protocol to identify RCTs Manual search of reference lists of primary and review articles, abstracts of scientific meetings, contacts of authors for unpublished or incomplete data No language or age restrictions
Double-blind, randomized, placebo-controlled trials that lasted at least 4 weeks and included at least one of the outcome measures recommended for OA clinical trials in patients with knee or hip OA
Initial search: 37 hits 15/37 RCTs included in MA
1,710 total pts (911 in glucosamine trials, 799 chondroitin) Sex and age distributions not provided in MA
Oral or IA glucosamine, dose regimens not provided Oral or IM chondroitin, dose regimens not provided
1) Global pain score for index joint (VAS or Likert scale) 2) Pain on walking for index joint (VAS or Likert scale) 3) WOMAC pain subscale (VAS or Likert scale) 4) LI 5) Pain in index joint during activities other than walking (VAS or Likert scale)

C-30
Appendix Table IIB, Part 1. Design Characteristics of the Glucosamine/Chondroitin Arthritis Intervention Trial (GAIT)* Purpose Design** Patient Eligibility Criteria*** Patient Exclusion
Criteria Treatment Regimens
To evaluate rigorously the efficacy and safety of glucosamine, chondroitin sulfate, and the two in combination in the treatment of pain due to osteoarthritis of the knee
Double-dummy, double-blind, 5-arm, randomized, placebo- and active-controlled clinical trial, using permuted-block randomization scheme with random block sizes stratified according to the 16 clinical centers and baseline WOMAC pain stratum (miled, defined as a score of 125 to 300, or moderate to severe, defined as a score of 301 to 400) Study conducted under an IND, with agents subjected to pharmaceutical regulation by FDA
Age 40 years or more Knee pain for at least 6 months and on the majority of days during the preceding month Radiographic evidence of primary knee OA, as exemplified by the presence of tibiofemoral osteophytes of at least 1 mm, signifying Kellgren-Lawrence disease grade 2 or 3 Summed pain score of 125 to 400 on the index knee according to the WOMAC OA index ARA functional class I, II, or III
Concurrent arthritic or medical conditions that could confound evaluation of the index knee Predominant patellofemoral disease History of clinically significant trauma or surgery to the index knee Coexisting disease that could preclude successful completion of the trial
Placebo Group: Capsules prepared to match nutriceuticals and celecoxib capsules, administered on same schedule as active agents Glucosamine hydrochloride: 500 mg orally t.i.d. Chondroitin sulfate: 400 mg orally t.i.d. Glucosamine/chondroitin: 500 mg glucosamine orally t.i.d. plus 400 mg chondroitin orally t.i.d. Active Control Group: 200 mg celecoxib (Celebrex, Pfizer) orally once daily
* Clegg DO, Reda DJ, Harris CL, et al. Glucosamine, chondroitin sulfate, and the two in combination for painful knee osteoarthritis. New Engl J Med. 2006;354:795-808. ** IND = investigational new drug; FDA = Food and Drug Administration; WOMAC = Western Ontario and McMaster Universities *** OA = osteoarthritis; ARA = American Rheumatism Association

C-31
Appendix Table IIB, Part 2. Enrollment and Disposition of Patients in the Glucosamine/Chondroitin Arthritis Intervention Trial (GAIT)*
Treatment Group (%) No. of Patients**
Placebo Glucosamine Chondroitin Glucosamine plus Chondroitin
Celecoxib
Assigned 313 317 318 317 318 Completed 248 (79.2) 242 (76.3) 248 (78.0) 254 (80.1) 266 (83.6) Withdrew 65 (20.8)
11 adverse event 22 lack of efficacy 17 lost to follow-up 15 other reasons
75 (23.7) 9 adverse event
27 lack of efficacy 20 lost to follow-up 19 other reasons
70 (22.0) 20 adverse event 25 lack of efficacy 15 lost to follow-up 10 other reasons
63 (19.9) 12 adverse event 17 lack of efficacy 16 lost to follow-up 18 other reasons
52 (16.4) 7 adverse event
11 lack of efficacy 17 lost to follow-up 17 other reasons
* Clegg DO, Reda DJ, Harris CL, et al. Glucosamine, chondroitin sulfate, and the two in combination for painful knee osteoarthritis. New Engl J Med. 2006;354:795-808. ** 3,238 screened, 1,655 (51%) excluded, 1,583 (49%) underwent randomization

C-32
Appendix Table IIB, Part 3. Outcome Measures and Analysis of the Glucosamine/Chondroitin Arthritis Intervention Trial (GAIT)* Outcome Measures Adverse Events Statistical Analysis Study Quality Rating***
Primary Outcome: 20% decrease in the summed score for the WOMAC pain subscale from baseline to week 24 Secondary Outcomes: Scores for the stiffness and function subscale of WOMAC Patient’s global asssessment of disease status and response to therapy, using 100 mm VAS Investigator’s global asssessment of disease status and response to therapy, using 100 mm VAS Presence or absence of soft-tissue swelling, effusion, or both in the index knee Scores on the Medical Outcomes Study 36-item Short-Form General Health Survey Scores on the Health Assesment Questionnaire Acetaminophen use
At each study visit, safety monitoring included: Complete blood counts Serum aspartate and alanine aminotransferase levels, glucose, glycosylated hemoglobin levels (diabetics only) creatinine, and partial thromboplastin time Urinalysis At week 24: Fecal occult blood (Hemoccult, Bedkman Coulter)
Analysis of the primary outcome measure conducted according to the ITT All statistical tests were two-sided An absolute increase in the response rate of 15%, as compared with the rate in the placebo group, was considered to indicate a clinically meaningful treatment effect Pairwise comparisons of the GH, CS and combined-treatment groups with the PL group were made using a two-sided chi-square test at alpha = 0.017 for each comparison (overall alpha = 0.05) Secondary outcomes analyzed according to pairwise comparison scheme outlined above Chi-square test used for categorical data T-test for independent groups used to compare changes between groups in quantitative data from baseline to end of study Used last-observation-carried forward method to analyze all outcomes among patients who made at least one follow-up visit but who did not complete follow-up
Criteria: Initial assembly and maintenance of comparable groups: Yes Important differential loss to follow-up or overall high loss to follow-up: No (average drop-out rate 20.5%, range 16.4% to 23.7%, NS) Use of equal, reliable, and valid measurements, including masking of outcome assessment: Yes (described as double-blind design) Clear definition of interventions: Yes (active and PL regimens clear) All important outcomes considered: Yes (primary and secondary well-described) Adjustment for potential confounders and ITT analysis: Yes (stipulated in text) Overall rating: Good (meets all criteria) Unclear if subgroup analysis by pain stratum was planned or unplanned
* Clegg DO, Reda DJ, Harris CL, et al. Glucosamine, chondroitin sulfate, and the two in combination for painful knee osteoarthritis. New Engl J Med. 2006;354:795-808. ** OA = osteoarthritis; WOMAC = Western Ontario and McMaster Universities; VAS = visual analog scale; GH = glucosamine hydrochloride; CS = chondroitin sulfate; PL = placebo *** U.S. Preventive Services Task Force approach

C-33
Appendix Table IIC, Part 1. Additional RCT Sample Selection
Study Inclusion Exclusion No. Enrolled No. Withdrawn
(%)
No. with Outcome
Evaluated (%) Herrero-Beaumont et al (2007)
May 2000-December 2002 Outpatients (age not specified); clinically symptomatic idiopathic OAK (ACR criteria), with a K-L grade 2-3
Did not meet OARSI criteria* for exclusion from OA clinical trial; enrollment of obese (BMI > 30 kg/m2) patients discouraged
325 GS: 106 Acetaminophen: 108 Pl: 104
6 mos: GS: 28 (26) Acet: 27 (25) Pl: 34 (33)
6 mos: GS: 78 (74) Acet: 80 (74) Pl: 70 (67)
Michel et al (2005)
March 1996-May 2001 Age 40-85 years; clinically symptomatic OAK (pain while standing, walking, and/or in motion for at least 25 of the 30 days prior to entry, with no required minimum level of pain); diagnosed according to ACR criteria of OAK; K-L grades 1,2, or 3
Any causes of secondary OAK (calcium pyrophosphate deposition disease, traumatic knee lesions) severe comorbidity; previous joint surgery; intraarticular medications in the previous month; foreseeable major surgery during the 2-years study period
300 CS: 150 Pl: 150
24 mos: CS: 40 (27) Pl: 41 (27)
24 mos: CS: 110 (73) Pl: 109 (73)
Uebelhart et al (2004)
February 1996-June 1998 Age 40 years and over, clinically symptomatic idiopathic OAK (ACR criteria), with a K-L grade 1-3 and a minimum 25% remaining medial femoro-tibial joint space
Other inflammatory joint diseases or systemic conditions affecting or involving the joints; primary or secondary neoplasias; bone metabolic diseases and/or other metabolic or systemic diseases; other treatments such as intraarticular corticosteroids, NSAIDs, symptom-modifying agents or bone-oriented therapies such as fluorides, bisphosphonates, calcitonin or patients under hormonal substitution within 3 mos before beginning the study
120 CS: 54 Pl: 56
3-12 mos: CS: 11 Pl: 15
12 mos: CS: 54 (90) Pl: 56 (93)
Das and Hammad (2000)
Pts not exhibiting any of the exclusion criteria who had an ISK of at least 7 points; K-L grade ≥ 2; both genders, age 45 – 75 years, ambulatory, willingness to comply with protocol, OA symptom duration ≥ 6 mos; allocated to study groups using randomized block design using computer-based pseudo-random number generator with code concealed to pts and investigators
Pregnancy; severe activity-limiting chronic diseases; non-insulin-dependent diabetes; alcoholism; history of significant hematological disorder, hepatic or renal impairment; active peptic ulcer; associated musculoskeletal disease other than OAK; associated metabolic diseases; injury to or surgery on index knee within 6 mos; intraarticular corticosteroid injection within previous 2 mos; regular use (> 3 times weekly) of NSAID during previous 2 mos
93 GH/CS: 46 Pl: 47 Trial designed to have 80% power to detect difference of 2 points or more between intervention and placebo in the primary outcome (ISK score)
6 mos: GH/CS: 1 (2) Pl: 3 (6)
6 mos: GH/CS: 46 (100) Pl: 47 (100)
* Altman R, Brandt K, Hochberg M, Moskowitz R. Design and conduct of clinical trials of patients with osteoarthritis: recommendations from a task force of the Osteoarthritis Research Society. Osteoarthirtis Cartilage 1996;4:217-43.

C-34
Appendix Table IIC, Part 2. Additional RCT Baseline Patient Characteristicsa
Study (Year)
Intervention (Dose)
No. Pts Tx/Pl
Mn Age (yrs) Tx/Pl
Female Pts (%) Tx/Pl
BMI (kg/m2) Tx/Pl
OA Diagb (%)
OA Stage (%Tx/ %Pl)c
Mn Dis Duration
(yrs) Tx/Pl
Mn VAS Rest (mm) Tx/Pl
Mn WOMAC
Pain Tx/Pl
Mn WOMAC Function
Tx/Pl
Mn WOMAC Stiffness
Tx/Pl
Mn WOMAC
Total Tx/Pl
Mn LI Tx/Pl
Herrero-Beaumont et al (2007)
GS (1500 mg/day)
106/108/104 GS: 63.4 ± 6.9 Acet: 63.8 ± 6.9 Pl: 64.5 ± 7.2
91/93/89 GS: 27.7 ± 2.3 Acet: 27.9 ± 2.3 Pl: 27.6 ± 2.4
1o
(100) KL 2: 50/56/50 KL 3: 41/31/39 Kl 2/3: 9/12/11
GS: 7.4 ± 6.0 Acet: 6.5 ± 5.3 Pl: 7.2 ± 5.8
GS: 7.8 ± 3.0 Acet: 8.0 ± 2.9 Pl: 7.9 ± 3.0
GS: 27.8 ± 11.4 Acet: 29.4 ± 11.0 Pl: 27.2 ± 10.9
NR GS: 38.3 ± 15.2 Acet: 40.4 ± 14.8 Pl: 37.9 ± 14.3
GS: 11.0 ± 3.1 Acet: 11.1 ± 2.7 Pl: 10.8 ± 2.6
Michel et al (2005)
CS 4&6 (800 mg/day)
150/150 T: 62.5 ± 9.1 Pl: 63.1 ± 10.7
51/52 Tx: 27.7 ± 5.2 Pl: 28.1 ± 5.5
1o
(100) KL All: 1-3 (100)
NR (0-10) 2.5/2.7
(0-10) 2.1/2.5
(0-10) 3.0/3.5
(0-10) 2.3/2.6
Uebelhart et al (2004)
CS 4&6 (800 mg/day)
54/56 Tx: 63.2 ± 9.1 Pl: 63.7 ± 8.1
80/82 NR 1o (100)
KL 1 (7/6) 2 (32/33) 3 (15/17)
4.2/4.4 58.8/61.1 9.0/9.1
Das and Hammad (2000)
GH (1500 mg/day) plus CS (1600 mg/day)
46/47 Tx:64.5 ± 9.8 Pl: 66.0 ± 1.5
72/78 Tx: 30.5 ± 1.0 Pl: 30.2 ± 0.9 (SEM)
1o Tx: 85 Pl: 87
KL 2/3 (72/83) KL 4 (28/17)
5.6/7.4 (0-2,400) KL 2/3: 908/944 KL 4: 1187/1089
KL 2/3: 10.2/10.4 KL 4: 11.1/10.7
a All values are mean ± SD unless otherwise noted; CS = chondroitin sulfate; OA = osteoarthritis b ACR = American College of Rheumatology c KL = Kellgren and Lawrence criteria
d Outcomes are generally those that are denoted in the paper as being the primary study outcomes; WOMAC = Western Ontario and McMaster Universities Osteoarthritis Index; VAS = visual analog scale

C-35
Appendix Table IIC, Part 3. Additional RCT Treatments
Study Intervention Dose
(mg/day) Prior Treatments Concurrent Treatments Herrero-Beaumont et al (2007)
GS 1500 None specified Rescue analgesia, ibuprofen 400 mg every 8 hr for maximum of 3 consecutive days
Michel et al (2005)
CS 4&6
800 None specified Rescue analgesia, either acetaminophen maximum 3000 mg/day or NSAID for up to maximum of 5 consecutive days; physical therapy limited to application of warmth and strengthening exercises as needed
Uebelhart et al (2004)
CS 4&6
800 None specified Rescue analgesia, acetaminophen maximum 4000 mg/day
Das and Hammad (2000)
GH plus CS GH: 1500 CS: 1600
Occasional use of NSAID Rescue analgesia, either acetaminophen or NSAID for up to maximum of 3 days per week;
CS = chondroitin sulfate; GH = glucosamine hydrochloride; NSAID = non-steroidal antiinflammatory drug

C-36
Appendix Table IIC, Part 4. Additional RCT Outcome Assessment Study (Year) Outcomes Assessed Response Criteria Observer F/U Herrero-Beaumont et al (2007)
Primary outcome: Lequesne’s index (0-24); secondary outcomes 0-4 point Likert scale WOMAC; OARSI-A and –B; proportion of patients reporting at least minimal clinically important improvement (MCII)
OARSI-A responder criteria that define high degree of improvement in pain as either 55% relative change on WOMAC pain subscale and absolute change of at least 30 on a 0-100 standardized scale or moderate improvement in 2 of 3 domains of pain, function and patients global assessment (35%, 15% and 15% relative changes, with 10, 20 and 15 standardized units of absolute change, respectively
Study personnel unaware of group assignment
After 15 days of therapy, then monthly over 6 mos
Michel et al (2005)
WOMAC score (0-10), total (24 questions), pain (5 questions), function (17 questions), stiffness (2 questions); 50-ft walking time; numerical rating scales ranging from 1 to 10 were used; adverse events
Improvement of WOMAC scores based on percentage change from baseline, separate analysis of individual WOMAC subscales, compared using repeated-measures ANOVA and comparison of the 2-year variations using Wilcoxon test
Study personnel unaware of group assignment
Every 3 mos over 24 mos study period
Uebelhart et al (2004)
Primary outcome: Lequesne’s algofunctional index at the end of the study; secondary outcomes: spontaneous joint pain assessed by Huskisson’s VAS (100 mm); 20-meter walking time on flat track; gobal assessment of efficacy by patient and physician; overall acetaminophen consumption; safety and tolerability
Absolute and percentage change from baseline of mean LI scores, walking time, Huskisson VAS, and AEs compared using repeated-measures ANOVA with Bonferroni’s correction for multiple comparisons
Study personnel unaware of group assignment
Every 3 mos over 12 mos study period
Das and Hammad (2000)
Primary outcome: Lequesne’s index of severity of OAK; secondary outcomes: VAS version of WOMAC, patient’s global assessment, use of pain rescue medication; stratified at randomization by radiographic severity of OAK into mild-to-moderate and severe strata
Positive response defined as improvement of 25% or more in any of the parameters (LI, WOMAC, global assessment)
Study personnel unaware of group assignment
Every 2 mos over 6 mos study period

C-37
Appendix Table IID, Part 1. Subgroup Analysis of RCTs of Glucosamine Meeting Protocol Study Selection Criteria Study (Year)
Relevant Subgroup Results Reported
Subgroup report using ITT sample or per protocol
Method for imputing missing data if present (ie no missing or method)
Herrero-Beaumont et al (2007)
N NA NA
Clegg et al (2006)
Y ITT LOCF method
Usha and Naidu (2004)
N NA NA
Hughes and Carr (2002)
N NA NA
Pavelka et al (2002)
N NA NA
Reginster et al (2001)
N NA NA
Ridone et al (2000)
N NA NA
Houpt et al (1999)
N NA NA
Rovati (1997)
N NA NA
Noack et al (1994)
N NA NA
Pujalte et al (1980)
N NA NA

C-38
Appendix Table IID, Part 2. Subgroup Analysis of RCTs of Glucosamine Meeting Protocol Study Selection Criteria Reporting Description
Subgroup Reported (Y/N) Subgroup Reported; Result; subgroup size; total randomized
Study (Year)
Age
Eth
nici
ty/
Rac
e
Sex
Prim
ary/
S
econ
dary
O
A
Wei
ght/
B
MI
Dis
ease
D
urat
ion
Dis
ease
S
ever
ity
Pre
viou
s Tr
eatm
ent
Age
Eth
nici
ty/
Rac
e
Sex
Prim
ary/
S
econ
dary
O
A
Wei
ght/
B
MI
Dis
ease
D
urat
ion
Disease Severity
Previous Treatment
Herrero-Beaumont et al (2007)
NA NA NA NA NA NA NA NA NA NA NA NA NA NA NA NA
Clegg et al (2006)
N N N N N N Y N N N N N N N WOMAC pain: moderate-to-severe (pain score 301-400) n = 70-72; mild (pain score 125-300) n = 243-248; total randomized = 1,583; NSD for any comparison
Usha and Naidu (2004)
NA NA NA NA NA NA NA NA NA NA NA NA NA NA NA NA
Hughes and Carr (2002)
NA NA NA NA NA NA NA NA NA NA NA NA NA NA NA NA
Pavelka et al (2002)
NA NA NA NA NA NA NA NA NA NA NA NA NA NA NA NA
Reginster et al (2001)
NA NA NA NA NA NA NA NA NA NA NA NA NA NA NA NA
Ridone et al (2000)
NA NA NA NA NA NA NA NA NA NA NA NA NA NA NA NA
Houpt et al (1999)
NA NA NA NA NA NA NA NA NA NA NA NA NA NA NA NA

C-39
Appendix Table IID, Part 2. Subgroup Analysis of RCTs of Glucosamine Meeting Protocol Study Selection Criteria (cont’d) Reporting Description
Subgroup Reported (Y/N) Subgroup Reported; Result; subgroup size; total randomized
Study (Year)
Age
Eth
nici
ty/
Rac
e
Sex
Prim
ary/
S
econ
dary
O
A
Wei
ght/
B
MI
Dis
ease
D
urat
ion
Dis
ease
S
ever
ity
Pre
viou
s Tr
eatm
ent
Age
Eth
nici
ty/
Rac
e
Sex
Prim
ary/
S
econ
dary
O
A
Wei
ght/
B
MI
Dis
ease
D
urat
ion
Disease Severity
Previous Treatment
Rovati (1997)
NA NA NA NA NA NA NA NA NA NA NA NA NA NA NA NA
Noack et al (1994)
NA NA NA NA NA NA NA NA NA NA NA NA NA NA NA NA
Pujalte et al (1980)
NA NA NA NA NA NA NA NA NA NA NA NA NA NA NA NA

C-40
Appendix Table IID, Part 3. Subgroup Analysis of RCTs of Glucosamine Meeting Protocol Study Selection Criteria Specific Subgroup Methods Study
(Year)
Interaction test performed prior to subgroup analyses Y/N
Interaction reported as qualitative or quantitative qual/quan
Stratified analysis (Mantel-Haenszel) or regression term for interaction
Stratified randomization and prespecified subgoups (number planned)
Prespecified subgroups w/o stratified randomization (number planned)
Post hoc subgroups
Adjustment for multiple testing (type I error)
Probable number of statistical tests conducted
Method for multiple testing adjustment (Bonf, Holm, Hocheberg, Hommel)
Herrero-Beaumont et al (2007)
NA NA NA NA NA NA NA NA NA
Clegg et al (2006)
Y quan N Y (3) N N Y 3 Bonf
Usha and Naidu (2004)
NA NA NA NA NA NA NA NA NA
Hughes and Carr (2002)
NA NA NA NA NA NA NA NA NA
Pavelka et al (2002)
NA NA NA NA NA NA NA NA NA
Reginster et al (2001)
NA NA NA NA NA NA NA NA NA
Ridone et al (2000)
NA NA NA NA NA NA NA NA NA
Houpt et al (1999)
NA NA NA NA NA NA NA NA NA
Rovati (1997)
NA NA NA NA NA NA NA NA NA
Noack et al (1994)
NA NA NA NA NA NA NA NA NA
Pujalte et al (1980)
NA NA NA NA NA NA NA NA NA

C-41
Appendix Table IIE, Part 1. Subgroup Analysis of RCTs of Chondroitin Meeting Protocol Study Selection Criteria Study (Year)
Relevant Subgroup Results Reported
Subgroup report using ITT sample or per protocol
Method for imputing missing data if present (ie no missing or method)
Clegg et al (2006)
Y ITT LOCF method
Michel et al (2005)
N NA NA
Uebelhart et al (2004)
N NA NA
Mazieres et al (2001)
N NA NA
Bourgeois et al (1998)
N NA NA
Bucsi and Poor (1998)
N NA NA
Conrozier (1998)
N NA NA
Uebelhart et al (1998)
N NA NA
L’Hirondel (1992)
N NA NA

C-42
Appendix Table IIE, Part 2. Subgroup Analysis of RCTs of Chondroitin Meeting Protocol Study Selection Criteria Reporting Description Subgroup Reported (Y/N) Subgroup Reported; Result; subgroup size; total randomized
Study (Year)
Age
Eth
nici
ty/
Rac
e
Sex
Prim
ary/
S
econ
dary
O
A
Wei
ght/
B
MI
Dis
ease
D
urat
ion
Dis
ease
S
ever
ity
Pre
viou
s Tr
eatm
ent
Age
Eth
nici
ty/
Rac
e
Sex
Prim
ary/
S
econ
dary
O
A
Disease Severity
Previous Treatment
Clegg et al (2006)
N N N N N N Y N N N N N WOMAC pain: moderate-to-severe (pain score 301-400) n = 70-72; mild (pain score 125-300) n = 243-248; total randomized = 1,583; NSD for any comparison
N
Michel et al (2005)
NA NA NA NA NA NA NA NA NA NA NA NA NA NA
Uebelhart et al (2004)
NA NA NA NA NA NA NA NA NA NA NA NA NA NA
Mazieres et al (2001)
NA NA NA NA NA NA NA NA NA NA NA NA NA NA
Bourgeois et al (1998)
NA NA NA NA NA NA NA NA NA NA NA NA NA NA
Bucsi and Poor (1998)
NA NA NA NA NA NA NA NA NA NA NA NA NA NA
Conrozier (1998)
NA NA NA NA NA NA NA NA NA NA NA NA NA NA
Uebelhart et al (1998)
NA NA NA NA NA NA NA NA NA NA NA NA NA NA
L’Hirondel (1992)
NA NA NA NA NA NA NA NA NA NA NA NA NA NA

C-43
Appendix Table IIE, Part 3. Subgroup Analysis of RCTs of Chondroitin Meeting Protocol Study Selection Criteria Specific Subgroup Methods Study
(Year) Interaction test performed prior to subgroup analyses Y/N
Interaction reported as qualitative or quantitative qual/quan
Stratified analysis (Mantel-Haenszel) or regression term for interaction
Stratified randomization & prespecified �ubgroups (number planned)
Prespecified subgroups w/o stratified randomization (number planned)
Post hoc subgroups
Adjustment for multiple testing (type I error)
Probable number of statistical tests conducted
Method for multiple testing adjustment (Bonf, Holm, Hocheberg, Hommel)
Clegg et al (2006)
Y Quant N Y N N Y 3 Bonf
Michel et al (2005)
NA NA NA NA NA NA NA NA NA
Uebelhart et al (2004)
NA NA NA NA NA NA NA NA NA
Mazieres et al (2001)
NA NA NA NA NA NA NA NA NA
Bourgeois et al (1998)
NA NA NA NA NA NA NA NA NA
Bucsi and Poor (1998)
NA NA NA NA NA NA NA NA NA
Conrozier (1998)
NA NA NA NA NA NA NA NA NA
Uebelhart et al (1998)
NA NA NA NA NA NA NA NA NA
L’Hirondel (1992)
NA NA NA NA NA NA NA NA NA

C-44
Appendix Table IIF, Part 1. Subgroup Analysis of RCTs of Glucosamine plus Chondroitin Meeting Protocol Study Selection Criteria Study (Year)
Relevant Subgroup Results Reported
Subgroup report using ITT sample or per protocol
Method for imputing missing data if present (ie no missing or method)
Clegg et al (2006)
Y ITT LOCF method
Das and Hammad (2000)
Y ITT LOCF method

C-45
Appendix Table IIF, Part 2. Subgroup Analysis of RCTs of Glucosamine plus Chondroitin Meeting Protocol Study Selection Criteria Reporting Description
Subgroup Reported (Y/N) Subgroup Reported; Result; subgroup size; total randomized
Study (Year)
Age
Eth
nici
ty/
Rac
e
Sex
Prim
ary/
S
econ
dary
O
A
Wei
ght/
B
MI
Dis
ease
D
urat
ion
Dis
ease
S
ever
ity
Pre
viou
s Tr
eatm
ent
Age
Eth
nici
ty/
Rac
e
Sex
Prim
ary/
S
econ
dary
O
A
Wei
ght/
B
MI
Dis
ease
D
urat
ion
Disease Severity
Previous Treatment
Clegg et al (2006)
N N N N N N Y N N N N N N N WOMAC pain: moderate-to-severe (pain score 301-400) n = 70-72; mild (pain score 125-300) n = 243-248; total randomized = 1,583; P < 0.002 vs Pl for 20% reduction in WOMAC pain in moderate-severe pain; NSD for pts in mild pain
N
Das and Hammad (2000)
N N N N N N Y N N N N N N N LI: mild-moderate: GC = 33/Pl = 39; severe: GC = 13/Pl = 8; total randomized = 93; P = 0.04 vs Pl for pts in mild-moderate pain; NSD vs Pl for pts in severe pain
N

C-46
Appendix Table IIF, Part 3. Subgroup Analysis of RCTs of Glucosamine plus Chondroitin Meeting Protocol Study Selection Criteria Specific Subgroup Methods
Study (Year)
Interaction test performed prior to subgroup analyses Y/N
Interaction reported as qualitative or quantitative qual/quan
Stratified analysis (Mantel-Haenszel) or regression term for interaction
Stratified randomization and prespecified subgroups (number planned)
Prespecified subgroups w/o stratified randomization (number planned)
Post hoc subgroups
Adjustment for multiple testing (type I error)
Probable number of statistical tests conducted
Method for multiple testing adjustment (Bonf, Holm, Hocheberg, Hommel)
Clegg et al (2006)
Y Quant N Y (3) N N Y 3 Bonf
Das and Hammad (2000)
N NR NR Y (2) N N N 1 NR

C-47
Part III. Arthroscopy Tables. Appendix Table IIIA. Randomized Studies of Arthroscopic Lavage/Debridement (cont’d) Author (Year)
Patient Inclusion/Exclusion Criteria Interventions
Gibson et al (1992)
Inclusion: Moderate unilateral osteoarthritis (OA) of the knee Exclusion: Age > 70 yrs, > 20 degree varus or valgus deformity measured on a weight-bearing radiograph
Arthroscopic Lavage: N = 10, 6 M/4 F, mean age 53 ± 10 yrs Arthroscopic Debridement: N = 10, 8 M/2 F, mean age 57 ± 7 yrs
Chang et al (1993)
Inclusion: Persistent knee pain for > 3 mos, despite conservative medical and rehabilitation, which restricted activities, weight-bearing radiographs showing grade 1,2, or 3 changes according to Kellgren and Lawrence (KL), age > 20 yrs, willingness to follow-up at 3 and 12 mos, and give informed consent Exclusion: Knee surgery within 6 mos of study entry, total knee replacement (TKR) concurrent illness that would influence functional assessment of the knee or preclude arthroscopic surgery, KL class 4 changes on radiographs
Closed-Needle Joint Lavage: N = 14, 4 M/10 F, mean age 65 ± 13 yrs Arthroscopic Surgery (debridement/excision of proliferative synovium or loose bodies): N = 18, 5 M/13 F, mean age 61 ± 11 yrs
Edelson et al (1995)
Inclusion: Symptomatic knee OA unresponsive to NSAID therapy, grade I –III radiographic OA according to Holden et al (1988) Exclusion: Clinical signs or symptoms of meniscal tears or obvious mechanical symptoms
23 patients, 20 M/3 F, mean age 58 yrs (rng 39-79) 29 knees were subjected to arthroscopic washout with hypertonic lactated Ringer’s solution Immediately following initial washout, patients were randomly allocated to: Placebo Treatment: 13 knees received a 3 mL intraarticular (IA) injection of placebo (lactated Ringer’s solution) IA Hyaluron Treatment: 16 knees received a single 3 mL IA injection of hyaluronic acid (0.5-1.0 mD)

C-48
Appendix Table IIIA. Randomized Studies of Arthroscopic Lavage/Debridement (cont’d) Author (Year)
Patient Inclusion/Exclusion Criteria Interventions
Hubbard (1996)
Inclusion: Symptoms of knee OA > 1 yr, no prior surgery to index knee, no laxity, no deformity, single medial femoral condyle degenerative lesion grade 3 or 4 (Outerbridge), no other IA pathology, normal plain radiograph, modified Lysholm score < 38/70 Exclusion: All knees that showed radiographic loss of joint space, previous operation, previous steroid injection for any reason
Arthroscopic Lavage: N = 36, 20 M/16 F, mean age classified according to success (46 yrs) or failure (59 yrs) Arthroscopic Debridement: N = 40, 28 M/12 F, mean age classified according to success (51 yrs) or failure (45 yrs)
Ravaud et al (1999)
Inclusion: American College of Rheumatology (ACR) criteria for knee OA, pain scored by patient at 40 or greater on a 100-mm visual analog scale (VAS), radiographic evidence of at least KL grade II tibiofemoral OA (within last 6 mos) with osteophytes and minimal joint space narrowing Exclusion: Serious concomitant illness, secondary OA as defined by the Osteoarthritis Research Society, knee surgery scheduled within the following 12 mos, local or systemic contraindication to the use of IA corticosteroids or to joint lavage, any IA injection during the 3 mos prior to study entry, current treatment with systemic corticosteroids or any slow-acting anti-OA drugs
Placebo Treatment: N = 28, 10 M/18 F, mean age 63 ± 11 yrs IA Corticosteroid Treatment: N = 25, 7 M/18 F, mean age 67 ± 12 yrs Arthroscopic Lavage plus Placebo Treatment: N = 21, 7 M/14F, mean age 65 ± 8 yrs Arthroscopic Lavage plus IA Corticosteroid Treatment: N = 24, 8 M/16F, mean age 67 ± 11 yrs

C-49
Appendix Table IIIA. Randomized Studies of Arthroscopic Lavage/Debridement (cont’d) Author (Year)
Patient Inclusion/Exclusion Criteria Interventions
Kalunian et al (2000)
Inclusion: Age > 40 yrs, knee pain for 10 yrs or less, unsatisfactory pain relief despite 6 wks of supervised physical therapy and two or more different NSAIDs and/or analgesics given for 3 or more wks each, willingness to undergo follow-up and give informed consent, normal or minimally abnormal radiographs (KL grade 0-2), fulfill ACR criteria for classification of knee OA using either clinical and radiographic, traditional clinical or clinical and laboratory methods, or classification tree clinical or clinical and laboratory methods Exclusion: Back/hip or ankle/foot OA of significant severity to confuse the clinical assessment of knee OA, IA corticosteroid injection within 1 mo prior to study, significantly abnormal radiographs (KL grades 3-4), body mass index (BMI) > 35 kg/m2, sensitivity to amide anesthetic agents, serious medical illness that would place patient at risk in the event of surgery, recent history of substance abuse
Control Group - Minimal Arthroscopic Lavage: N = 49, 23 M/26 F, mean age 58 yrs (rng 40-85) Treatment Group – Large Volume Arthroscopic Lavage: N = 41, 19 M/22 F, mean age 61 yrs (rng 41-88)
Smith et al (2003)
Inclusion: Symptomatic OA of the knee, fulfilling ACR criteria for knee OA, already receiving NSAID or other analgesic therapy Exclusion: Mechanical symptoms upon diagnostic arthroscopy, comorbidities preventing arthroscopy, unwillingness to comply with study demands or provide informed consent
Arthroscopic Lavage plus Placebo Injection: N = 33, 18 M/15 F, mean age 66 ± 12 yrs Arthroscopic Lavage plus IA Corticosteroid Treatment: N = 38, 26 M/12F, mean age 67 ± 10 yrs

C-50
Appendix Table IIIA. Randomized Studies of Arthroscopic Lavage/Debridement (cont’d) Author (Year)
Patient Inclusion/Exclusion Criteria Interventions
Frias et al (2004)
Inclusion: Symptomatic OA of the knee for > 3 mos despite conservative medical therapy, fulfilled ACR criteria for knee OA, KL OA radiological grades 2-3, no disability assessment at the time of enrollment, voluntary cooperation and informed consent, age > 18 yrs Exclusion: Ankylosis of the index joint, TKA of the index knee, potentially infected injury near puncture site, current anticoagulant therapy, history of coagulation problems, suspected deep venous thrombosis (DVT) or marked venous insufficiency, history of surface thrombosis or DVT
Overall 299 knees belonging to 205 patients (45 M/160 F), mean age 67 ± 8 yrs were randomly allocated to: Arthroscopic Lavage: N = 62, sex and age not given Arthroscopic Lavage Plus IA Corticosteroid Injection: N = 237, sex and age not given

C-51
Appendix Table IIIB. Arthroscopy Case Series Sample Selection
Study Inclusion Exclusion n, Enrolled n, Withdrawn
n, Outcome Evaluated
Aaron 2006, ALD
Consecutive pts; met ACR OA of tibiofemoral joint; failed oral anti-inflammatory treatment; age 18-70 yo; Kellgren-Lawrence grade > 2
Previous infection; OA of pattelo-femoral joint; other/confounding diabnoses;
122 12 110
Bernard 2004 ALD
01/91 – 12/93; consecutive patients who underwent knee arthroscopy and washout for OA of the knee (Outerbridge grade 3 or 4); pain not controlled by non-operative treatments; radiographic OA changes;
100 knees, 99 pts
100 knees, 99 pts
Krystallis 2004 ALD
02/97 – 06/01; OA of the knee; standard conservative non-operative treatment had failed; local anesthesia (L) in 67 pts (71 operations); general anesthesia (G) in 65 pts; peridual anesthesia (P) in 65 pts; local anesthesia contraindicated for emotionally labile, low tolerance for discomfort
201 knees, 197 pts
201 knees, 197 pts
Dervin 2003 AD
03/95 – 11/97; OA of knee; 40-75 yo; referred to orthopaedic outpatient clinic at Ottawa Hospital General Campus; remained symptomatic despite supervised physical therapy and comprehensive medical management
Inflammatory/traumatic forms of OA;
156 pts 30 pts 126 pts
Jackson and Dieterichs 2003 ALD
01/95 – 06/97; ACR criteria diagnosis of OA of knee; Jackson and Dieterichs stage I-IV; consecutive series
Stage I and IV not suited for arthroscopy; pts treated with marrow stimulation techniques, laser or radio-frequency chondroplasty
121 pts 121 pts
Bohnsack 2002 AD
05/89 – 11/96; history of knee pain, swelling, radiological signs of severe OA (grade III/IV)
104 pts 104 pts
Shannon 2001 ALD
Retrospective consecutive series of all pts with mild-moderate OA who had arthroscopic lavage and/or debridement of knee over 4-yr period; symptoms not severe enough for joint replacement; conservative treatment alone had failed or non-specific mechanical symptoms out of proportion to clinical and radiologic findings
Preop clinical/radiologic diagnosis of meniscal tear or loose body
55 procedures, 54 pts
55 procedures, 54 pts
Harwin 1999 ALD
1980 -1993; of 2,730 knee arthroscopies by author, 248 knees in 220 pts had areas of fibrillated articular cartilage with exposed bone and underwent debridement; Group I - mechanical axis normal at 0o (n=57); Group II – < 5o of varus or valgus (n=102); Group III - > 5o varus or valgus (n=45); unresponsive to all modalities of nonoperative treatment, including lifestyle alterations, NSAIDs, PT, occasional IA steroid injection
248 knees, 220 pts
44 knees, 30 pts
204 knees, 190 pts
McGinley 1999 AD
1981-87; of 191 pts > 55 yo who underwent arthroscopic debridement by 1 surgeon; pts with OA symptoms including pain limiting function and Albach radiographic JSN grade 2-3; > 10 yr F/U
91 knees, 77 pts
91 knees, 77 pts

C-52
Appendix Table IIIB. Arthroscopy Case Series Sample Selection (continued)
Study Inclusion Exclusion n, Enrolled n, Withdrawn
n, Outcome Evaluated
Linschoten and Johnson 1997 ALD
07/85 – 01/88; of 169 pts who had arthroscopy of knee; age > 40 yo; preop diagnosis of OA or RA with arthroscopically confirmed degenerative changes; degenerative changes in > 2 of 3 compartments or single compartment Outerbridge III/IV
Arthroscopies for diagnosis or treatment of acute injuries, preliminary diagnosis of degenerative joint disease not confirmed intraoperatively
68 knees, 67 pts
12 knees, 12 pts
56 knees, 55 pts
Yang and Nisonson 1995 ALD
07/89 – 07/93; did not respond to conservative nonoperative treatment and had persistent evidence of internal derangement of knee; did not show severe signs and symptoms to merit total knee arthroplasty
History of rheumatoid arthritis; gout; ochronosis; ankylosing spondylitis; hemophilia; osteonecrosis; posttraumatic/postinfectious osteoarthritis
105 procedures, 103 pts
105 procedures, 103 pts
Aichroth 1991 ALD
77 – 88; had arthroscopic debridement and irrigation of a degenerative knee joint; under care of single author
280 pts 26 pts 276 knees; 254 pts
McLaren 1991 ALD
07/82 – 07/86; OA confirmed at arthroscopy; nonoperative treatments either did not control symptoms sufficiently to allow normal daily activities or control rest pain
Inflammatory joint disease, malunited fractures and ligamentous instability
171 pts 170 pts
Ogilvie-Harris and Fitsialos 1991 ALD
1979 – 1987; arthroscopic surgery for degenerative arthritis of the knee; persistent symptoms despite adequate medical management
551 pts 110 pts 441 pts
Timoney 1990 ALD
07/81 – 02/86; underwent knee arthroscopy at Naval Hospital, Oakland; age > 40 yo; intraoperative diagnosis of OA
Inflammatory disease (rheumatoid arthritis, acute infection arthritis), acute injury
125 pts 17 pts 111 knees, 108 pts
Bert and Maschka 1989 AD
09/81 – 12/82; all pts offered arthroscopic debridement plus abrasion arthroplasty (DA) for unicompartmental gonarthrosis, those who refused it were offered arthroscopic debridement alone (D); conservative methods of treatment had failed; available for 5 yr follow-up
DA 59 pts; D 67 pts
DA 59 pts; D 67 pts
Sprague 1981 ALD
08/78 – 11/79; of 331 arthroscopies, 78 were pre- and postoperatively diagnosed as degenerative arthritis of the knee; moderate to extreme degeneration of the articular surfaces of 2-3 compartments; all pts had initially undergone a conservative treatment program with anti-inflammatories, exercise program, physical modalities
78 knees, 72 pts
9 knees, 9 pts
69 knees, 63 pts

C-53
Appendix Table IIIC. Arthroscopy Case Series Patient Characteristics
Study Age Percent Female)
Race (%)
Obesity (%)
Disease Category (%)
Disease Duration
Preop Disease Severity (%)
Arthoscopic Disease Severity (%) Pain Function
Other Comorbidities or Prognostic Factors (%)
Aaron 2006 ALD
Mn 61.7 67 Mn BMI: 31.8
Kellgren-Lawrence (2/3/4) 53/29/18
Noyes-Stabler mn total 21.6
Knee Society mn 11.9
Locking or buckling: 56
Bernard 2004 ALD
Mn 55, sd 13
39
Krystallis 2004 ALD
L: mn 60.8, rng 31-71 G: mn 59.9, rng 30-67 P: mn 62.2, rng 35-75
49 1o: 94 2o: 6
Fairbank 0: 12 I: 36 II: 40 III: 12
Outerbridge: I/II: 12 III: 28 IV: 60
Mechl sx: 33 Loading sx: 67 No. damaged compartments 1: 52.2 2: 40.3 3: 7.5 Limited ROM: 45.8
Dervin 2003 AD
Mn 61.7, sd 8.6
53 BMI > 27: 67 BMI > 33: 25
Dougados Medial III/IV: 62 Lateral III/IV: 13
WOMAC M: mn 22, sd 11.2 F: mn 25.5, sd 9.9
WOMAC M: mn 72, sd 34.8 F: mn 87.2, sd 38.9
Giving way: 39 Locking: 22 Unstable meniscal tear: 63
Jackson and Dieterichs 2003 ALD
I: mn 35.5, rng 22-60 II: mn 54, rng 26-85 III: mn 56, rng 24-78 IV: mn 64, rng 41-83
Jackson and Dieterichs I: 7 II: 26 III: 32 IV: 35
Bohnsack 2002 AD
Mn 60, rng 50-83
52 Jaeger and Wirth III/IV in medial or lateral compart-ments
Outerbridge: III/IV: 50-80% by surface
Lysholm and Gillquist Mn 40

C-54
Appendix Table IIIC. Arthroscopy Case Series Patient Characteristics (cont’d)
Study Age Percent Female)
Race (%)
Obesity (%)
Disease Category (%)
Disease Duration
Preop Disease Severity (%)
Arthoscopic Disease Severity (%) Pain Function
Other Comorbidities or Prognostic Factors (%)
Shannon 2001 ALD
Mn 60.9, rng 48-83
56 Mn wt: 76.6 kg, rng 54-100
# mo: % < 3: 20 3-12: 43 > 12: 39
Harwin 1999 ALD
Mn 62.1, rng 32-88
57

C-55
Appendix Table IIIC. Arthroscopy Case Series Patient Characteristics (continued)
Study Age Percent Female)
Race (%)
Obesity (%)
Disease Category (%)
Disease Duration
Preop Disease Severity (%)
Arthoscopic Disease Severity (%) Pain Function
Other Comorbidities or Prognostic Factors (%)
McGinley 1999 AD
Mn 62.6, rng 55-82
Outerbridge: IV: 100
Linschoten and Johnson 1997 ALD
Mn 62.5, rng 41-79
51
Yang and Nisonson 1995 ALD
Mn 64.2, sd 4.3
19 # mo: % < 1: 17 1-12: 62 > 12: 15
Fairbank 0: 15 I: 50 II: 24 III: 7
Aichroth 1991 ALD
Mn 49, rng 28-82
28 Pain (100%), night pain (15%), swelling (76%), instability (54%), locking (36%)
McLaren 1991 ALD
Mn 54, rng 23-82
30 1o: 81 2o: 19
Ogilvie-Harris and Fitsialos 1991 ALD
Mn 58, rng 28-92
> 2 yrs in most pts
Outerbridge I/II: 32 III: 36 IV: 32
Timoney 1990 ALD
Mn 58.1, rng 40-81
31 mn 48.9 mo, rng 2-144
0-III scale HSS Mn 24.7, sd 9.2, rng 8-44
Bert and Maschka 1989 AD
DA mn 66, rng 46-84 D mn 61, rng 39-82
DA 46 D 42
% obese: DA 26 D 22
Ahlback II-100
Outerbridge IV: 100
DA pts all had < 15o varus/ valgus mal-alignment
Sprague 1981 ALD
Mn 56, rng 24-78
38

C-56
Appendix Table IIID. Arthroscopy Case Series Treatments
Study Arthroscopic Procedure Prior Treatments Concurrent Treatments
Aaron 2006 ALD
One surgeon; 3 portals; Dyonics 4 mm arthroscope; limited surgical debridement of damaged cartilage with chromotome; loose flaps resected; crater edges smooted; loose bodies removed; torn meniscal cartilage, hypertrophic synovial tissue resected; no drilling/abrasion; joint irrigated and evacuated
Mn 2 different NSAIDs; intra-articular corticosteroid injections in 20; physical therapy in 12
Knee immobilizer, partial weight-bearing for 2-3 days, then ROM exercises/gait as tolerated
Bernard 2004 ALD
2 portal arthroscopy; 1 surgeon; meniscal tears resected (meniscectomy in 40); debridement of loose bodies, unstable chondral flaps; lavage; no synovectomy; punches, scissors and curettes; Outerbridge grading of all 3 compartments
Krystallis 2004 ALD
2 portal arthroscopy; no tourniquet; 4-mm 30o arthroscope; IM midazolam; local anesthesia with ropivacine, lidocaine, bupivacaine; sterile saline lavage with infusion pump; debris/fragments removed; meniscal lesions given conservative partial meniscectomy without repair; unstable peripheral cartilage flaps removed; mechanical shavers, basket forceps; no abrasion arthroplasty; isolated chondral defects > 1 cm micro-fractured; Outerbridge grading
Crutches, gradual progress to full weight bearing after 2-3 wks
Dervin 2003 AD
2 portal arthroscopy; tourniquet optional; diagnosis first; resection of loose chondral flaps and unstable meniscal tears; synovectomy only when needed for visualization; standard hand and shaver instruments; no abrasion arthroplasty or drilling;
25% had > 1 IA cortisone; 58% regular users of non-narcotic analgesics and/or NSAIDs
Jackson and Dieterichs 2003 ALD
Arthroscopic lavage and debridement; removal of loose bodies; trimming of meniscal fragments; conservative or minimal mechanical removal of any separating or desquamating articular cartilage fragments from the femoral condyles
Bohnsack 2002 AD
Partial, subtotal or total meniscectomy in 73%; one or more loose bodies removed in 11%; shaving of articular surface in 35%; plica mediopatellaris dissected in 1%; diagnostic-only arthroscopy only in 11%
Pain-reducing drugs in 42.3%
Shannon 2001 ALD
General anesthesia; tourniquet; 4-mm 30o arthroscope; 2 portals; IA bupivacaine in 27 knees by surgeon’s preference; diagnostic arthroscopy and lavage; removal of loose bodies, debridement of degenerative meniscus and partial meniscectomy in 19 pts
Unresponsive to conservative non-surgical treatments (PT, NSAIDs, weight loss)
Crutches; PT
Harwin 1999 ALD
Lavage and debridement; partial synovectomy; decompression of the anterior chamber by resection of impinging plicae and removal of hypertrophic adipose tissue; partial meniscectomies removed only loose unstable fragments; chondroplasties – removal of only loose, unstable or irregular flaps; osteophytes removed rarely if only directly impinging; general anesthesia in most cases, others had epidural/spinal or local
Dressing removed in 24-48 hrs; pts encouraged to bear as much weight as tolerable, using cane, crutches, walker; PT as soon as possible; NSAIDs

C-57
Appendix Table IIID. Arthroscopy Case Series Treatments (continued)
Study Arthroscopic Procedure Prior Treatments Concurrent Treatments
McGinley 1999 AD
Debridement included meniscus tear resection and nonaggressive shaving of frayed articular cartilage; 5 pts also had drilling of the medial femoral condyle; 3 pts had removal of loose bodies; 1 pt had lateral release
Linschoten and Johnson 1997 ALD
Diagnostic first; individualized according to findings; meniscal tears excised by partial or total meniscectomy; loose bodies removed; synovium and fat interfering with visualization debrided; partial synovectomy when synovial impingement suspected; unstable articular cartilage flaps or fronds debrided; no drilling or abrasion chondroplasty; normal saline lavage
Robert Jones dressing for 48-72 hrs; weight-bearing with cane/crutches as tolerated
Yang and Nisonson 1995 ALD
2-portal arthroscopy; general or regional anesthesia; tourniquet used for all pts; 4-mm 30o arthroscope; lavage; intraarticular debris and loose bodies were removed; meniscal disease addressed by partial meniscectomy preserving as much stable meniscal tissue as possible; mechanical shavers, basket forceps to remove unstable cartilage flaps at the periphery; osteochondral fragments or articular cartilage lestion that potentially could detach and become loose bodies were removed; some isolated chondral defects > 1.5 cm drilled with multiple holes; synovectomies using mechanical shavers for significant peripatellar hypertrophic reactive synovitis; meniscal lesions found in 96%
5 pts had previous surgery: arthroscopy and drilling, arthroscopy and debridement, repair of quadriceps rupture, excision of patella bursa, Maquet procedure
SC pubivacaine; light compressive dressing; partial weightbearing on crutches 4-7 d; progess to full weightbearing with cane 1-2 wk
Aichroth 1991 ALD
Degenerative meniscal tears excised and trimmed; degenerative articular cartilage shaved and loose bodies removed; small osteotome used to remove impinging osteophytes; overgrown synovium cut away; irrigation
Compression bandage used with early exericies; motion and weight bearing as tolerated
McLaren 1991 ALD
4 surgeons using similar surgical techniques; normal saline medium; tourniquet used; outpatient setting unless otherwise indicated medially; partial anterior synovectomy often required to aid in visualization; lavage; chondrectomy performed with motorized shaver or curette; removed articular cartilage that was separated from subchondral bone or had gross softening, fibrillation, fissuring; full-thickness chondrectomy often followed by curettage of subchondral bone or abrasion using a burr (except for eburnated subchondral bone in end-stage compartments); meniscal tears were treated with partial meniscectomy; free bodies removed;
Activity modification, anti-inflammatory agents; PT;
Local anesthetic; corticosteroids injected in selected patients with end-stage tricompart-mental disease; crutches followed by progression to full weight-bearing; PT; anti-inflamma-tory medications as required
Ogilvie-Harris and Fitsialos 1991 ALD
General anesthetic in most case, some had spinal or epidural anesthesia, ~5% had local; lavage and debridement (removal of loose areas of articular cartilage from degenerative area, preserving as much surrounding articular surface as stable) with manual and power instruments for mild and moderate OA; abrasion when erosions involving up to half femoral condyle; minor meniscal degeneration left alone, substantial unstable meniscal flap tears resected, rim contoured; saline lavage alone for extensive degenerative changes without mechanical lesions
NSAIDs in all, IA cortisone in ~25%; previous operation in 61%

C-58
Appendix Table IIID. Arthroscopy Case Series Treatments (continued)
Study Arthroscopic Procedure Prior Treatments Concurrent Treatments
Timoney 1990 ALD
Lavage, debridement of degenerative meniscal tears and chondral lesions, partial synovectomy with osteophytecomy as indicated
Bert and Maschka 1989 AD
DA abrasion using Dyonics abrasion instrumentation system; only stage IV lesions abraded; subchondral intracortical bone abraded to depth of ~ 1-2 mm until bleeding bone noted; additional debridement and partial meniscectomy; loose bodies and other joint debris removed; loose or impinging osteophytes removed; D performed with partial meniscectomy by manual and electrocautery instrumentation as above; partial synovectomy if necessary
DA pts no weight bearing for 6 wks; D pts weight bearing when tolerable
Sprague 1981 ALD
General anesthesia; many outpatient; hospitalization < 36 hrs; 1 surgeon; tourniquet applied, sometimes used; 4 arthroscopes from 4 mm to 6.5 mm; mechanized shaving instruments; 2-3 portals; meniscal tears excised back to intact, stable meniscal tissue; shaggy degenerative tissue of articular surfaces was shaved and debrided; loose bodies, fragments and debris removed; osteophytes trimmed; localized areas of hypertrophic synovium trimmed or excised; synovectomy in 4 pts; normal saline lavage
Bulky compression dressing for 36 hrs; encouraged to ambulate for limited distances; exercises; anti-inflammatories

C-59
Appendix Table IIIE. Arthroscopy Case Series Outcome Assessment Study Outcomes Assessed Response Criteria Observer F/U Aaron 2006 ALD
Knee Society pain; need for total knee replacement
Post-treatment Knee Society pain success: < 30 Independent assessor
Mn 34 mo, rng 24-74 mo
Bernard 2004 ALD
Time to further major surgery (Kaplan-Meier)
Osteotomy, unicondylar arthroplasty, total knee replacement
Krystallis 2004 ALD
Baumgaertner (pain, function, patient enthusiasm, 0-9) Adverse events
Excellent=9; Good=6-8; Fair=4-5; Failure=0-3 Mn 32 mo, rng 24-72
Dervin 2003 AD
WOMAC pain; WOMAC stiffness; WOMAC function; SF-36
MCIC per item (domain): WOMAC pain – 1.5 cm (7.5 cm); WOMAC stiffness – 1.75 cm (3.5 cm); WOMAC function – 2 cm (34 cm); success also defined as 20% improvement
2 yrs
Jackson and Dieterichs 2003 ALD
Patient global assessment Excellent, good, fair, poor > 4 yrs
Bohnsack 2002 AD
Lysholm and Gillquist score; use of pain-reducing drugs Further surgery
Mn 5.4 yr, rng 2-9.8
Shannon 2001 ALD
Duke arthroscopy score (NRS pain and function); subjective assessment of improvement; further surgery; adverse events
No change=0; fair=1-20, good=21-40; excellent=41-60 Mn 29.6 mo, rng 9-51
Harwin 1999 ALD
Patient global assessment Better, unchanged, worse Mn 7.4, yr rng 2-15
McGinley 1999 AD
Further surgery Mn 13.2 yr
Linschoten and Johnson 1997 ALD
Good/poor outcome; further surgery; adverse events
Good=symptomatic improvement, activity better than preop, satisfaction, would do again for other knee
Mn 49 mo, rng 24-67
Yang and Nisonson 1995 ALD
Investigator-designed pain, function, range of motion (ROM); adverse events, further surgery
All 3 domains rated on 4-point scale, summed Excellent=11-12; good=9-10; fair=6-8; poor=3-5
Mn 11.7 mo, sd 13.14, rng 6-60
Aichroth 1991 ALD
Investigator-devised grade:symptoms, knee movement, ADLs, sports, analgesics; further surgery
Satisfactory (excellent, good); unsatisfactory (fair, poor) Mn 44 mo
McLaren 1991 ALD
Pain, function; satisfaction; further surgery; adverse events
Pain=none, mild, moderate, severe Function=ADLs, sports, work
Mn 25 mo, rng 12-74
Ogilvie-Harris and Fitsialos 1991 ALD
Pain; pain change; activity limitations activity change; analgesics; analgesics change; satisfaction
All outcomes on 4-point scale except satisfaction (3-point) Good result=no or occasional pain and no or occasional limitations of activity
Mn ~ 4 yr, rng 2-9
Timoney 1990 ALD
Modified Hospital for Special Surgery rating score (HSS, pain and function); patient subjective assessment of surgical outcome; adverse events; further surgery
HSS (8-52 points) Patient assessment: good, fair, poor
Mn 50.6 mo, rng 24-96

C-60
Appendix Table IIIE. Arthroscopy Case Series Outcome Assessment (continued) Study Outcomes Assessed Response Criteria Observer F/U Bert and Maschka 1989 AD
Hospital for Special Surgery (HSS) system; further surgery
HSS, Excellent= > 85; good=70-84; fair=60-69; poor= < 60 5 yr
Sprague 1981 ALD
Subjective assessment (4 levels, worse to markedly better); functional level (3 levels, reduced to increased); additional surgery performed or contemplated (Y/N)
Good, fair, poor (article describes algorithm for combining subjective assessment, functional level and additional surgery)
Mn 13.6 mo, rng 6-21

C-61
Appendix Table IIIF. Arthroscopy Case Series Results Study Outcomes Outcomes Aaron et al. 2006 ALD
Knee Society pain Pre F/U p Mn 11.9 30.8 <0.001 Success=Knee Society pain > 30 in 72 (65%), failure in 38 (35%) Significant predictors of percent success: Kellgren-Lawrence grade, abnormal limb alignment, medial/lateral joint space width; intraoperative lesion severity; mechanical symptoms did not predict success,
Further surgery: total knee replacement (15%) - related to baseline Kellgren-Lawrence grade.
Bernard 2004 ALD
18 knees required further major surgery (osteotomy – 4; unicondylar arthroplasty – 3; total knee replacement – 11) 5-yr major surgery-free survival all: ~82% < 60 yo: 89% > 60 yo: 68% (X2, p=0.02) prior meniscectomy did not affect outcome
Krystallis 2004 ALD
Excellent results: All pts: 42.3% Mechanical sx: 65.7% Loading sx: 30.6% No difference between anesthesia groups (ANOVA, p=0.71)
Adverse events (#): minor intraoperative complications (6.1%); hemarthrosis (24.9%, 6.1% had to be drained)
Dervin 2003 AD
MCII WOMAC pain: 44% MCII predicted by tenderness at medial joint line, positive Steinman, unstable meniscal tear (logistic regression)
Jackson and Dieterichs 2003 ALD
Group Excellent/good Fair Poor (%) All 50 27 22 I 100 0 0 II 91 0 9 III 49 28 23 IV 12 52 36
Repeat Arthroscopy (%) Arthroplasty (%) I 0 0 II 9 0 III 15 8 IV 7 29
Bohnsack 2002 AD
Lysholm & Gillquist Pre F/U p Mn 40 69 <0.01 Higher gain in Lysholm & Gillquist score in pts < 60 yo, monolateral OA; no influence of meniscectomy.
Pre F/U p Use of pain-reducing drugs (%) 42 19 0.0003 Between 5 and 98 mo (mn 33.1), 20% required further surgery: total knee arthroplasty (8%), monocondylar knee arthroplasty (4%), high tibial osteotomy (2%), repeat arthroscopy (4%), unspecified procedure (4%)
Shannon 2001 ALD
Assessment (%) Improved Unchanged Worse All pts 67 33 0 Mn duration of symptom relief 25.5 mo, rng 1-51 No influence on results of sex, age, weight, preop Duke score, duration of symptoms
Further surgery: arthroscopy (7.4%); total knee arthroplasty (18.5%) Adverse events: none

C-62
Appendix Table IIIF. Arthroscopy Case Series Results (continued) Study Outcomes Outcomes Harwin 1999 ALD
Assessment (%) Better Unchanged Worse All pts 63 21 16 Group I 84 12 4 Group II 68 24 9 Group III 27 27 47
Further surgery: repeat arthroscopy (13.2%), mean time to procedure 3.2 yr, rng 6 mo – 12 yrs; other surgery (15.3%), mean time to osteotomy 3.5 yrs, rng 2-6 yrs, mean time to joint arthroplasty 4.2 yrs, rng 6 mo – 10 yrs Adverse events: hemarthroses (2%); deep vein thrombosis (0.5%)
McGinley 1999 AD
Total knee replacement in 33% of knees
Linschoten and Johnson 1997 ALD
Assessment (%) Good Poor All pts, last F/U 68 32 6 mo F/U 82 18 12 mo F/U 77 23 24 mo F/U 70 30 36 mo F/U 68 32 48 mo F/U 68 32
Further surgery (12.5%) Adverse events: prolonged drainage (7.3%); spinal headache (1.9%); effusion requiring aspiration (1.9%); postop nausea requiring admission (1.95)
Yang and Nisonson 1995 ALD
Group Rating Excellent Good Fair Poor All pts % 20 45 32 3 Sx < 1 mo 78 Sx > 12 mo 52 Mechanical sx 96 No mechanical 42 Fairbank 0/I 69 Fairbank II/III 36 Mild degeneration 74 Severe degeneration 39 Outcome not correlated with age, gender, side or duration of follow-up
Adverse events: deep vein thrombosis (1%); superficial cellulites (2%); repeat arthroscopy (3%); total knee replacement (2%)
Aichroth 1991 ALD
% Excellent Good Fair Poor All pts 18 57 15 10 Satisfactory Unsatisfactory All pts 75 25 < 60 yo 78 22 p<0.008 > 60 yo 55 45 Satisfactory result correlated with Ahlback preop radiographic severity (p<0.001) and with Outerbridge operative severity (p<0.001); no correlation with type or location of meniscal tear or performance of previous surgery
Further surgery in 14% after mean 46 mo

C-63
Appendix Table IIIF. Arthroscopy Case Series Results (continued) Study Outcomes Outcomes McLaren 1991 ALD
% Improved Same Worse Pain 78 19 2 Disability 22 68 10 Ambulation limitation 49 45 6 Overall assessment 65 28 7 Disability (%) Pre Post No restriction 10 32 Limited recreation & sports 48 45 Unable to work 25 12 Restricted daily activities 17 11
Superficial portal drainage controlled by orally administered antibiotics (1.2%); deep vein thrombosis (0.6%); further surgery: repeat arthroscopy (4.7%), high tibial arthroscopy (4.1%), total knee replacement (3.5%)
Ogilvie-Harris and Fitsialos 1991 ALD
% Good mn % Procedure n > 2 yr F/U Good Debridement 1 compartment 103 82 4.3 66 Debridement 2 compartments 135 58 3.6 41 Abrasion 32 56 4.1 53 Meniscectomy 18 83 4.7 72 Meniscectomy+debridement 149 68 4.3 53 Lavage only 4 25 3.4 25 All pts 441 68 4.1 53
Domain % Pain, no/occasional 53 Pain improved 86 Activity limitation, no/occasional 59 Activity improved 83 Analgesic, no/occasional 79 Analgesic, improved 32 Satisfaction 90 Results related to disease severity
Timoney 1990 ALD
Pre F/U p Mn HSS score (sd) 24.7 (9.2) 36.1 (16.3) <0.001 Subjective Good Fair Poor % 49 20 41 Subjective results deteriorated over time. Subjective results significantly worse for those with symptoms > 48 mo, those with severe chondromalacia; not correlated with meniscal pathology, condition of ACL, those undergoing limited lavage and debridement
Adverse events: postoperative effusions (6.5%); deep vein thrombosis (0.9%); infections (0%) Further Surgery: repeat arthroscopy (5.6%); total knee arthroplasty (21.3%)
Bert and Maschka 1989 AD
Group (%) Good-Excellent Fair Poor DA 51 16 33 D 66 13 21
Further surgery: total knee replacement (DA 25%, D 15%)
Sprague 1981 ALD
Assessment (%) Good Fair Poor All pts 74 10 16
Further surgery: repeat arthroscopy (3.2%); total knee replacement (1.6%)

D-1
Appendix D. Technical Expert Panel (TEP) and Reviewers
Technical Expert Panel (TEP) In designing the study questions and methodology at the outset of this report, the EPC consulted several technical and content experts. Broad expertise and perspectives are sought. Divergent and conflicted opinions are common and perceived as health scientific discourse that results in a thoughtful, relevant systematic review. Therefore, in the end, study questions, design and/or methodologic approaches do not necessarily represent the views of individual technical and content experts. Mathias P.G. Bostrom, M.D. Hospital for Special Surgery New York, NY (Nominated by the American Academy of Orthopaedic Surgeons) Warren Reid Dunn, M.D., M.P.H. Assistant Professor, Orthopaedics and Rehabilitation Assistant Professor, Medicine & Public Health Vanderbilt University Medical Center Nashville, TN David T. Felson, M.D., M.P.H. Chief Boston University Clinical Epidemiology Research Training Unit Boston, MA Marc C. Hochberg, M.D., M.P.H. Professor of Medicine Head, Division of Rheumatology & Clinical Immunology Professor of Epidemiology and Preventive Medicine University of Maryland School of Medicine Baltimore, MD Nancy E. Lane, M.D. Director and Distinguished Professor Aging Center, Medicine and Rheumatology University of California at Davis Medical Center Sacramento, CA

D-2
Technical Expert Panel (TEP) (continued) Capt. Ernestine (Tina) Murray, R.N., M.A.S. Senior Health Policy Analyst Center for Outcomes and Evidence Agency for Healthcare Research and Quality Rockville, MD Neil A. Segal, M.D. Assistant Professor and Staff Physiatrist Department of Orthopaedics & Rehabilitation University of Iowa Iowa City, IA Philip Sloane, M.D., M.P.H. Department of Family Medicine University of North Carolina at Chapel Hill Chapel Hill, NC Charles M. Turkelson, Ph.D. Director, Research and Scientific Affairs Department American Academy of Orthopedic Surgeons Rosemont, IL
Peer Reviewers
Peer reviewer comments on a preliminary draft of this report were considered by the EPC in preparation of this final report. Synthesis of the scientific literature presented here does not necessarily represent the views of individual reviewers. David Atkins, M.D., M.P.H. Chief Medical Officer Center for Outcomes and Evidence Agency for Healthcare Research and Quality Rockville, MD Rowland W. Chang, M.D., M.P.H. Professor of Preventive Medicine Medicine, and Physical Medicine and Rehabilitation Northwestern University Feinberg School of Medicine Chicago, IL

D-3
Peer Reviewers (continued) Gregory J. Dennis, M.D. Director, Clinical Care and Training National Institute of Arthritis and Musculoskeletal and Skin Diseases (NIAMS) National Institutes of Health Bethesda, MD (Nominated by the National Institute of Arthritis and Musculoskeletal and Skin Diseases) Kay Dickersin, Ph.D. Professor Director, Center for Clinical Trials Department of Epidemiology Johns Hopkins Bloomberg School of Public Health Baltimore, MD Peter Juhn, M.D., M.P.H. Executive Medical Director Johnson & Johnson New Brunswick, NJ Jeffrey N. Katz, M.D., M.S. Associate Professor of Medicine and Orthopaedic Surgery Chief, Section of Clinical Sciences Division of Rheumatology, Immunology and Allergy Brigham and Women's Hospital Boston, MA John Kirwan, M.D. Professor of Rheumatic Diseases Bristol Royal Infirmary Bristol UK Kathleen Kolsun, M.D. Assistant Director, Medical Affairs Orthopedics Division Ferring Pharmaceuticals Suffern, NY Jeffrey L. Kraines, M.D. Senior Medical Director Genzyme Corporation Cambridge, MA

D-4
Peer Reviewers (continued)
Stephan Lohmander, M.D., Ph.D. Professor and Senior Consultant Department of Orthopaedics, Clinical Sciences Lund Lund University Lund University Hospital Lund, Sweden Jamal Mikdashi, M.D. Assistant Professor of Medicine (Rheumatology) University of Maryland Medical Center Baltimore, MD Roland W. Moskowitz, M.D. Co-director Arthritis Translational Research Program Beachwood, OH (Nominated by the Arthritis Foundation) Lee S. Simon, M.D., Ph.D. Associate Clinical Professor of Medicine Harvard Medical School and Beth Israel Deaconess Medical Center Cambridge, MA