Treatment Algorithms
43
Treatment algorithms in patients with ongoing disease activity Gavin Giovannoni Blizard Institute, Barts and The London School of Medicine and Dentistry
-
Upload
gavin-giovannoni -
Category
Health & Medicine
-
view
1.593 -
download
1
Transcript of Treatment Algorithms
Treatment algorithms in patients with ongoing disease activity
Gavin Giovannoni
Blizard Institute, Barts and The London School of Medicine and Dentistry

Disclosures
Professor Giovannoni has received personal compensation for participating on Advisory Boards in relation to clinical trial design, trial steering committees and data and safety monitoring committees from: Abbvie, Bayer-Schering Healthcare, Biogen-Idec, Canbex, Eisai, Elan, Fiveprime, Genzyme, Genentech, GSK, GW Pharma, Ironwood, Merck-Serono, Novartis, Pfizer, Roche, Sanofi-Aventis, Synthon BV, Teva, UCB Pharma and Vertex Pharmaceuticals.
Regarding www.ms-res.org survey results in this presentation: please note that no personal identifiers were collected as part of these surveys and that by completing the surveys participants consented for their anonymous data to be analysed and presented by Professor Giovannoni.
Professor Giovannoni would like to acknowledge and thank Biogen-Idec, Genzyme and Novartis for making available data slides on natalizumab, alemtuzumab and fingolimod for this presentation.
Professor Giovannoni’s trip to Frankfurt has been kindly sponsored by Teva, therefore please interpret anything he says about Teva’s products in this context.


Risk of MS

Consequences of increasing EDSS scores: loss of employment1
0
10
20
30
40
50
60
70
80
90
Work Capacity by Disability Level
0.0/1.0 2.0 3.0 4.0 5.0 6.0 6.5 7.0 8.0/9.0
EDSS Score
Pro
po
rtio
n o
f M
Se
rs ≤
65
Ye
ars
Old
Wo
rkin
g (
%)
The proportion of MSers employed or on long-term sick leave is calculated as a percentage of MSers aged 65 or younger.
1. Kobelt G et al. J Neurol Neurosurg Psychiatry. 2006;77:918-926;
2. Pfleger CC et al. Mult Scler. 2010;16:121-126.
Spain
Sweden
Switzerland
United Kingdom
Netherlands
Italy
Germany
Belgium
Austria
~10 yrs2


Prognostic Factors

Number of Risk Factors Predicts Short-term Prognosis in Early MS
Risk Factors Evaluated (N=98)
1. Age at onset (<40 yrs vs >40 yrs)
2. Symptoms at onset (isolated sensory or cranial nerve vs motor or sensory plus motor)
3. MRI status before or at diagnosis (negative or suspicious vs suggestive)
4. Interval between the first and second attack (>2.5 yrs or <2.5 yrs)
5. Attack frequency in the first 2 yrs (≤2 vs >2)
6. Completeness of recovery from initial attacks (good vs poor)
Scott TF et al. Neurology 2000;55:689-93.
0
0.5
1
1.5
2
2.5
3
3.5
4
Low0 to 1
Risk Factors
Medium2 to 3
Risk Factors
High>3
Risk Factors
EDSS
Disability Accumulation by Risk Group
At MS diagnosis
Follow-up (mean 37 mos)

Brain Atrophy Rate (End Organ Damage) Correlated With Disease Course
• Brain atrophy accelerated in MSers with more advanced disease over 4 years of follow-up • Gray matter atrophy was significantly correlated with disability accumulation at 4 years
WMF=white matter fraction; GMF=gray matter fraction; BPF=brain parenchymal fraction
Fisher E et al. Ann Neurol 2008;64:255-65.
-0.45
-0.35
-0.25
-0.15
-0.05
0.05
0.15
Δ BPF Δ WMF Δ GMF
Control
CIS
CIS→MS
RRMS
RRMS→SPMS
SPMS
9

Treatment Target

Relapses
Unreported relapses
Clinical disease progression
Subclinical relapses: focal MRI activity
Focal gray and white matter lesions not detected by MRI
Brain atrophy
Spinal fluid neurofilament levels
Beyond NEDA (no evident disease activity)
Clinical activity
Focal MRI activity
Hidden focal and diffuse MRI activity
Microscopic or biochemical pathology
Biomarkers

*Odds of being in worst vs best quartile.
*EDSS>4.5. Bermel RA et al. Ann Neurol 2013;73: 95-103.
Ongoing Disease Activity During Interferon Treatment is Predictive of Long-Term Disability
Ongoing clinical or MRI disease activity during interferon treatment in a 2-year trial was
predictive of disability progression 15 years later
Activity During 2-Year Trial Odds of Severe Disability*
15 Years Later
>2 Gd lesions 8.96
>2 Relapses 4.44
>3 New T2 lesions 2.90
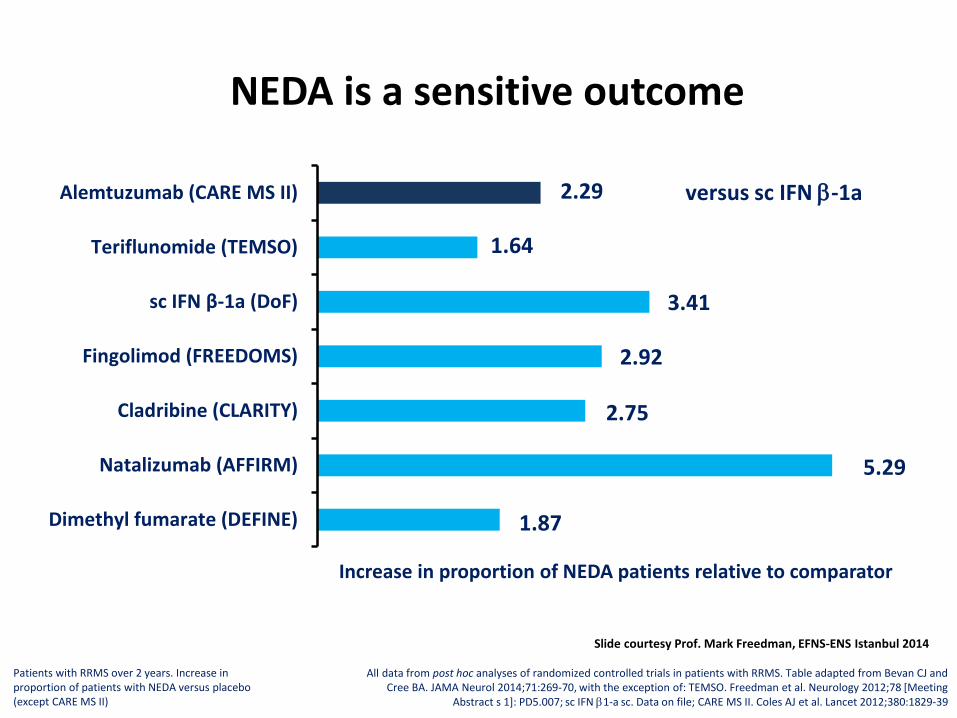
NEDA is a sensitive outcome
1.87
5.29
2.75
2.92
3.41
1.64
2.29
0 1 2 3 4 5 6
Dimethyl fumarate (DEFINE)
Natalizumab (AFFIRM)
Cladribine (CLARITY)
Fingolimod (FREEDOMS)
sc IFN β-1a (DoF)
Teriflunomide (TEMSO)
Alemtuzumab (CARE MS II)
Increase in proportion of NEDA patients relative to comparator
Patients with RRMS over 2 years. Increase in proportion of patients with NEDA versus placebo (except CARE MS II)
All data from post hoc analyses of randomized controlled trials in patients with RRMS. Table adapted from Bevan CJ and Cree BA. JAMA Neurol 2014;71:269-70, with the exception of: TEMSO. Freedman et al. Neurology 2012;78 [Meeting
Abstract s 1]: PD5.007; sc IFN b1-a sc. Data on file; CARE MS II. Coles AJ et al. Lancet 2012;380:1829-39
versus sc IFN b-1a
Slide courtesy Prof. Mark Freedman, EFNS-ENS Istanbul 2014

Treatment Strategy

What is active MS?
2001 Clinical
2009 Clinical and MRI
2014 Clinical or MRI
Inactive MS: no relapses or MRI activity in the last 24 months
Active MS: relapses in the last 12 or 24 months and/or MRI activity in the last 12 months
Highly active MS: relapses in the last 12 months and MRI activity in the last 12 months
Rapidly-evolving severe MS (RES); two disabling attacks in a 12
month period and MRI evidence of activity during this period.
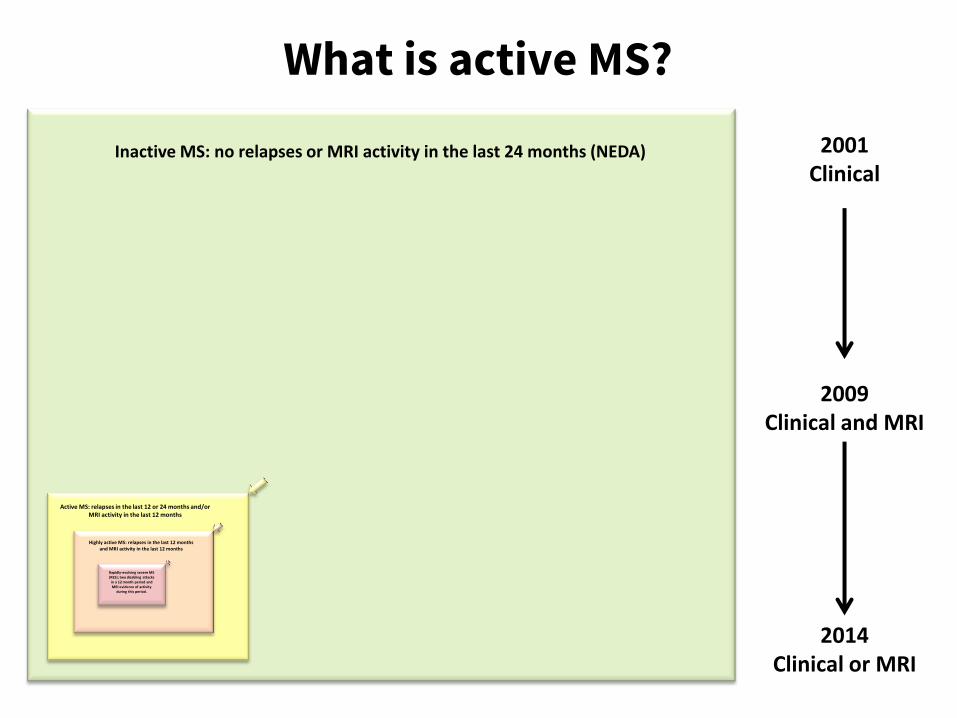
What is active MS?
2001 Clinical
2009 Clinical and MRI
2014 Clinical or MRI
Inactive MS: no relapses or MRI activity in the last 24 months (NEDA)
Active MS: relapses in the last 12 or 24 months and/or MRI activity in the last 12 months
Highly active MS: relapses in the last 12 months and MRI activity in the last 12 months
Rapidly-evolving severe MS (RES); two disabling attacks
in a 12 month period and MRI evidence of activity
during this period.
IFNbeta
GA
Teri
DMF Fingo
Nz
Az
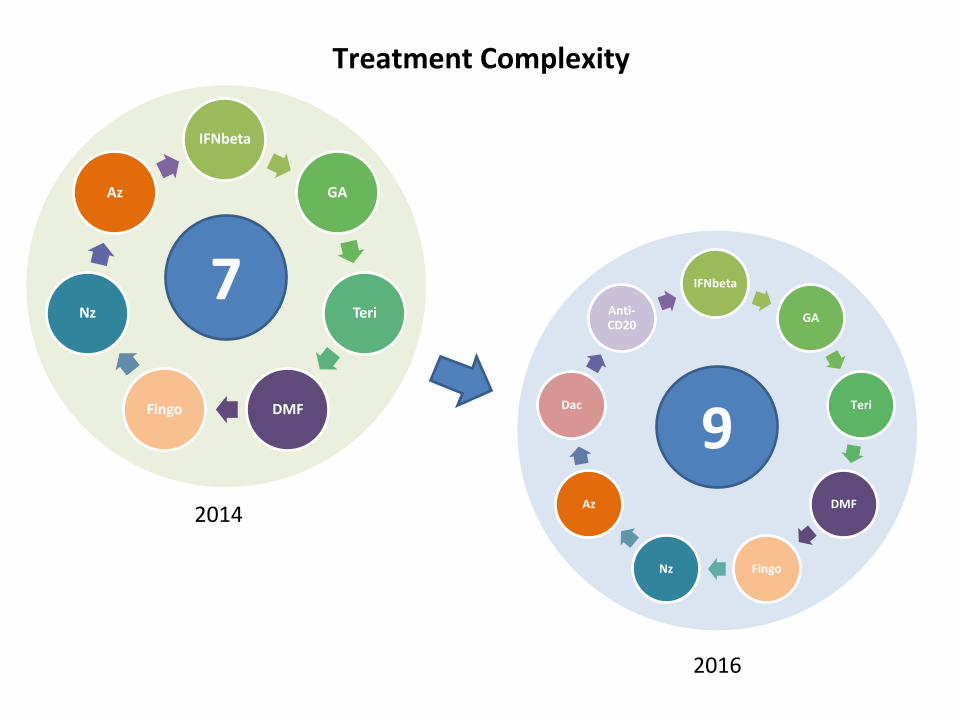
Treatment Complexity
2014
7 IFNbeta
GA
Teri
DMF
Fingo Nz
Az
Dac
Anti-CD20
2016
9

Copaxone-20
Copaxone-40 Synthon
IFNbeta
GA
Teri
DMF Fingo
Nz
Az
Treatment Complexity
2014
7 IFNbeta
GA
Teri
DMF
Fingo Nz
Az
Dac
Anti-CD20
2016
9
Betaferon
Rebif
Avonex Extavia
Plegridy
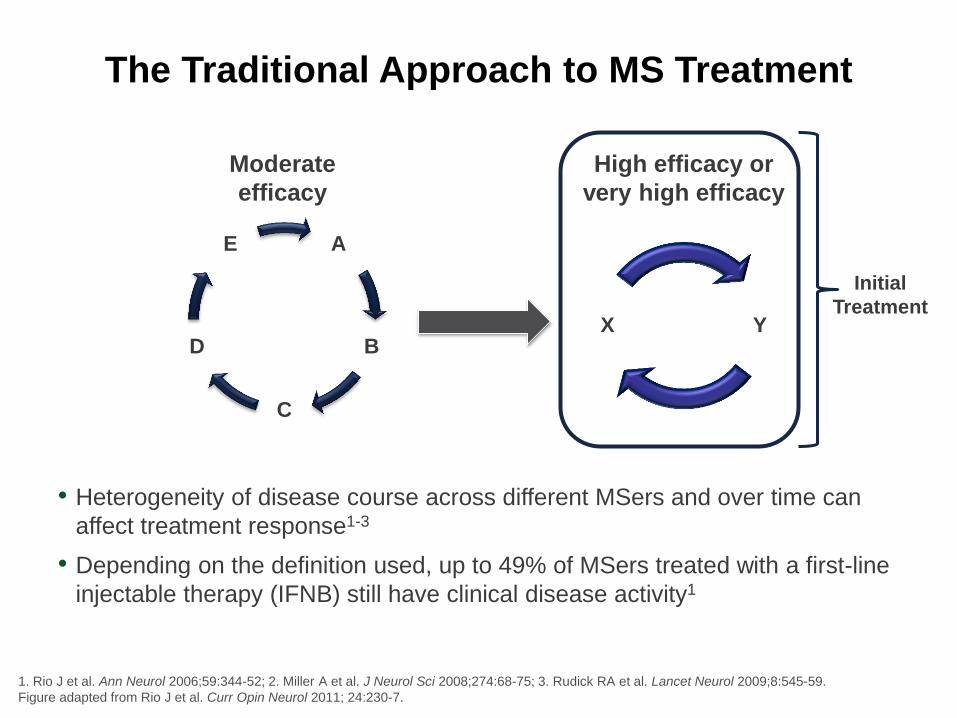
The Traditional Approach to MS Treatment
• Heterogeneity of disease course across different MSers and over time can
affect treatment response1-3
• Depending on the definition used, up to 49% of MSers treated with a first-line
injectable therapy (IFNB) still have clinical disease activity1
1. Rio J et al. Ann Neurol 2006;59:344-52; 2. Miller A et al. J Neurol Sci 2008;274:68-75; 3. Rudick RA et al. Lancet Neurol 2009;8:545-59.
Figure adapted from Rio J et al. Curr Opin Neurol 2011; 24:230-7.
A
B
C
D
E
Y X
Moderate
efficacy
High efficacy or
very high efficacy
Initial
Treatment

IFNbeta
GA
Teri
DMF
Treatment Ladder
DMF
Fingo
Nz Az

Treating beyond symptoms with a view to improving IBDer outcomes in inflammatory bowel diseases
Sandborn et al. Journal of Crohn's and Colitis 2014(8):927–935
Moderate
Severe
TNF antagonist
± IMS
Steroids +IMS
Steroids
TNF antagonist
± IMS
Steroids +IMS
IMS + TNF antagonist
± IMS
Conventional step-care
Accelerated step-care
Early top-down
“FLIPPING THE PYRAMID”

Treatment Algorithm

23
Choose therapy
A B C
Define the individual’s MS
Treatment failure?
• MSer’s preferences? • Your choice?
Individual measures: • Evidence of disease activity? • Tolerability/safety? • Adherence? • Drug or inhibitory markers,
e.g. NABs?
Monitoring
• MS prognosis based on clinical and MRI indices
• Life style and goals • Shared goals for therapy
Rebaseline
Rebaselining: • IFNβ, natalizumab, fingolimod,
teriflunomide, Dimethyl-Fumarate=3-6 months
• Glatiramer acetate=9 months • Alemtuzumab=24 months
Choose a therapeutic strategy
Maintenance-escalation Induction
Choose therapy
X Z
Rebaseline
Monitoring
Initiate or Switch or Escalate Rx Complete course / Re-treat
Breakthrough disease
Y
• MSer’s preferences? • Your choice?
No Yes Yes
• Only one licensed induction therapy at present
Evolving Paradigm: Individualised Treatment Based on Projected Disease Course
Giovannoni et al. MSARD 2015 in press.

Choosing a therapeutic strategy
Maintenance therapies
• Continuous treatment
• Low to very high efficacy
• Reversible
• Perceived to be lower risk
• Examples • Laquinimod, GA, IFN-beta, teriflunomide, BG12,
fingolimod, natalizumab, daclizumab
• Breakthrough disease • Suboptimal or failure to respond
• NEDA reliable metric for efficacy
• Rebound activity • Highly likely
• Can be life threatening
• Pregnancy • Contra-indicated
• No potential for a cure • Rebound
• SPMS & progressive brain atrophy
Induction therapies
• Short-courses or pulsed therapy
• Very high efficacy
• Irreversible
• Perceived to be higher risk
• Examples • Mitoxantrone, cladribine, alemtuzumab, anti-
CD20 (?), BMT
• Breakthrough disease • Marker for retreatment
• NEDA unreliable to assess efficacy
• Rebound activity • Less likely
• Unlikely to be life-threatening
• Pregnancy • Strategy of choice
• Potentially curative • 15-20 year experiment
• BMT, alemtuzumab, cladribine

Sequencing of therapies

Escalation to natalizumab is more effective than switching between IFN/GA
0
25
50
75
100
% P
ati
en
ts
Escalate to Natalizumab, n=106
Switch Between IFN/GA, n=161
Data from a postmarketing, prospective, observational study in 285 RRMS patients for whom treatment with IFNβ or GA therapy failed.
After failure of IFNβ or GA therapy, patients were switched to either natalizumab (n=106) or IFNβ/GA (n=161).
*There were no differences at 12 month between the two groups in proportions of patients free from relapse, disability progression, MRI
activity, and combined activity.
Prosperini L et al. Mult Scler. 2012;18:64-71.
No EDSS
Progression
No MRI
Activity
Disease
Activity Free
P<0.0001 P=0.0003 P<0.0001
51
36
51
21
83
67 77
59
No
Relapses
P<0.0045
Over 24 months*

65.4
87.3
52.9
32.2
46.7
78.9
31.5
13.6 0
25
50
75
100
Relapse-Free SAD-Free (6-month) MRI Activity-Free MS Disease Activity-Free
Alemtuzumab 12 mg
SC IFNβ-1a 44 μg
Escalation to Alemtuzumab Is More Effective Than Switching from IFN/GA to IFNβ-1a 3×/Week
OR=odds ratio; SC=subcutaneous; SAD=sustained accumulation of disability.
Hartung HP et al. Presented at AAN; March 16–23, 2013; San Diego, CA. P07.093.
% o
f P
ati
en
ts
CARE-MS II: Disease-Free Status over 2 Years
OR=3.03
P<0.0001
CO-CZ-0056l

Real-world comparative effectiveness of Fingolimod and Interferon/Glatiramer therapies in a switch population using
propensity-matched data from MSBase
p=0.019
0.00
0.25
0.50
0.75
1.00
Pro
porti
on o
f pat
ient
s N
OT
rela
psed
0 2 4 6 8 10 12Months since baseline
FINGOLIMOD IFN_COP
Time to first relapse on treatment by treatment arm within first 12 months of switch
p=0.000007
0.00
0.25
0.50
0.75
1.00
Prop
ortio
n of
pat
ient
s N
OT
disc
ontin
ued
0 2 4 6 8 10 12Months since baseline
FINGOLIMOD IFN_COP
Time to treatment discontinuation by treatment arm within first 12 months of switch
Mul t ip le Sc le ros is da taBase Spelman et al. ECTRIMS 2013
Conclusions: In general once on 1st-line/lower-tier therapy

TOP: earlier natalizumab treatment favours annualised relapse rate outcomes
P values from a negative binomial regression model adjusted for gender, baseline EDSS score (<3.0 vs ≥3.0l), relapse status in the prior
year (≤1 vs >1), prior DMT use (<3 vs ≥3), disease duration (<8 vs ≥8 years), and treatment duration (≥3 vs <3 years), except for the factor
of interest. Error bars represent 95% CIs.
DMT=disease-modifying therapy; CI=confidence interval.
Wiendl et al. Presented at ENS; June 8–11, 2013; Barcelona, Spain,. P372.

NEDA outcomes with alemtuzumab: 3-year follow-up of the CARE-MS studies
MRI, magnetic resonance image; CI, confidence interval.
Adapted from Havrdova E et al. Presented on ACTRIMS/ECTRIMS, 2014, FC1.4.
38 46 50
67 64
0
20
40
60
80
100
Year 1 Year 2 Year 3
Pro
po
rtio
n o
f
pati
en
ts, %
(9
5%
CI)
↑32.2% P=0.0062
↑45.8% P<0.0001
CARE-MS I: NEDA by year
SC IFNB-1a
ALEM 12 mg
174
369
170
356
—
349
SC IFNB-1a
ALEM 12 mg
187
405
173
434
—
393
27 31
44
56 55
0
20
40
60
80
100
Year 1 Year 2 Year 3
Pro
po
rtio
n o
f
pati
en
ts, %
(9
5%
CI)
↑61.2% P<0.0001
CARE-MS II: NEDA by year
↑84.3% P<0.0001

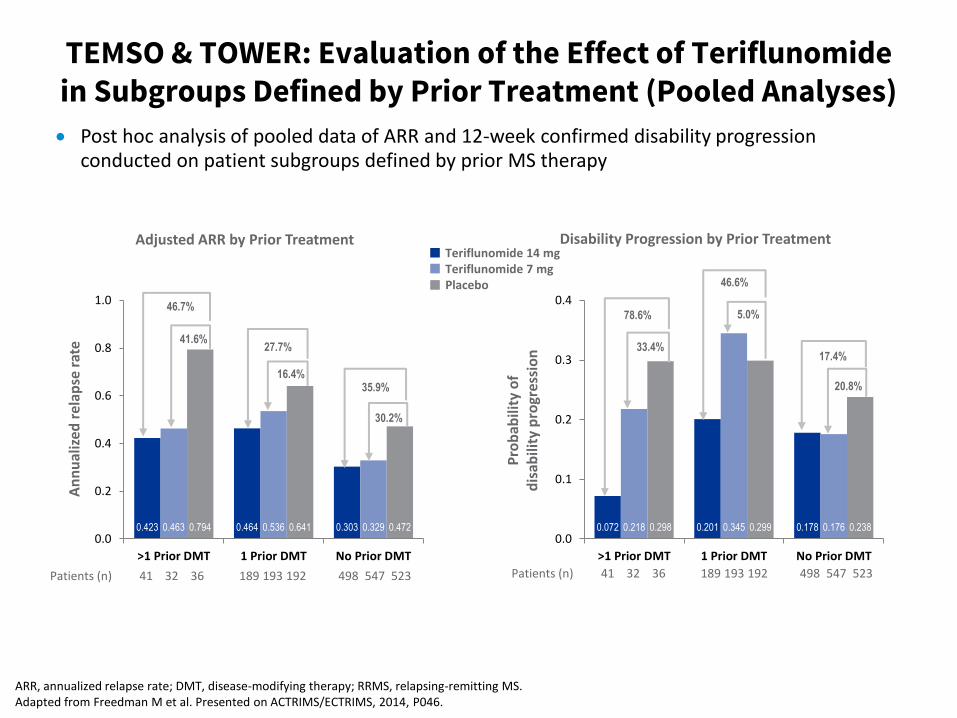
TEMSO & TOWER: Evaluation of the Effect of Teriflunomide in Subgroups Defined by Prior Treatment (Pooled Analyses)
Adjusted ARR by Prior Treatment Disability Progression by Prior Treatment
ARR, annualized relapse rate; DMT, disease-modifying therapy; RRMS, relapsing-remitting MS. Adapted from Freedman M et al. Presented on ACTRIMS/ECTRIMS, 2014, P046.
An
nu
aliz
ed r
elap
se r
ate
Pro
bab
ility
of
d
isab
ility
pro
gres
sio
n
0.423 0.464 0.303 0.463 0.536 0.329 0.794 0.641 0.472 0.0
0.2
0.4
0.6
0.8
1.0
>1 Prior DMT 1 Prior DMT No Prior DMT
0.072 0.201 0.178 0.218 0.345 0.176 0.298 0.299 0.238 0.0
0.1
0.2
0.3
0.4
>1 Prior DMT 1 Prior DMT No Prior DMT
Teriflunomide 14 mg Teriflunomide 7 mg Placebo
46.7%
41.6% 27.7%
16.4% 35.9%
30.2%
78.6%
33.4%
46.6%
5.0%
17.4%
20.8%
Patients (n) 41 32 36 189 193 192 498 547 523 Patients (n) 41 32 36 189 193 192 498 547 523
Post hoc analysis of pooled data of ARR and 12-week confirmed disability progression conducted on patient subgroups defined by prior MS therapy

Derisking Sequencing

Natalizumab Alemtuzumab
Asymptomatic PML? LP-JCV DNA & MRI
Option 1: Immediate switch (high risk if carry-over PML develops)
Natalizumab Alemtuzumab Oral bridging agent (Teriflunomide, DMF or Fingolimod)
Asymptomatic PML? LP-JCV DNA & MRI
Rebaseline MRI
Option 3: Bridging (low risk; mainly related to using a low efficacy bridging agent and using alemtuzumab after the bridging agent)
6-12 MONTHS
Natalizumab Alemtuzumab
Rebaseline MRI **
3-6 MONTH WASHOUT
Asymptomatic PML?* LP-JCV DNA & MRI
Option 2: Washout (intermediate risk; mainly related to rebound of MS disease activity)
* For this option the shorter the washout the more important the screen for asymptomatic PML becomes. ** PML screening and baseline MRI studies are don’t use the same types of scans hence the need for both.
Switching from natalizumab to alemtuzumab
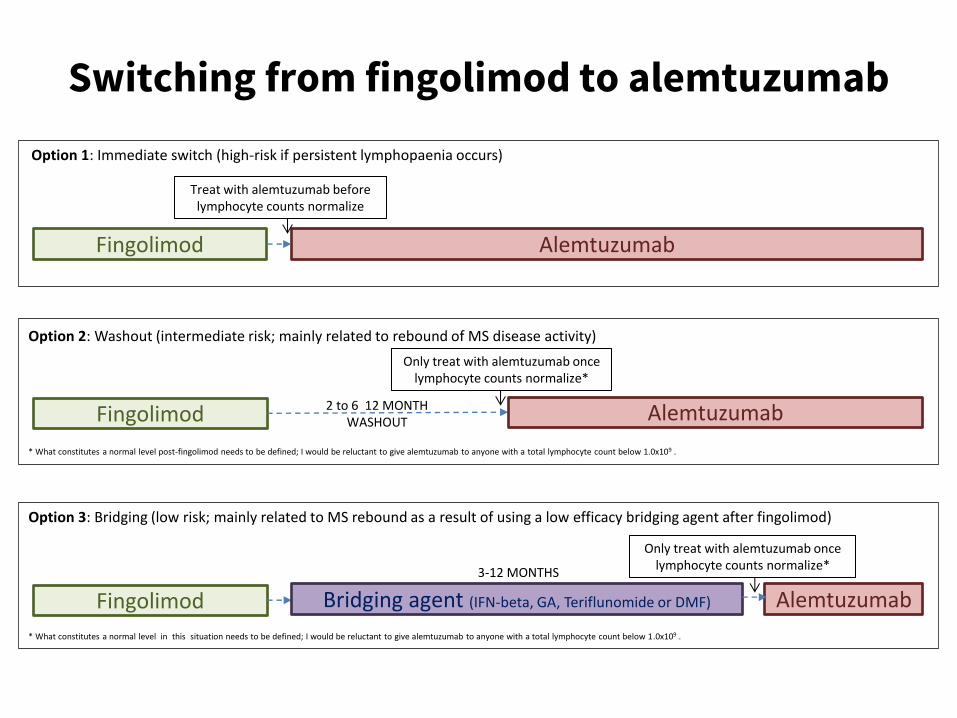
Fingolimod Alemtuzumab
Only treat with alemtuzumab once lymphocyte counts normalize*
2 to 6 12 MONTH WASHOUT
Option 2: Washout (intermediate risk; mainly related to rebound of MS disease activity)
* What constitutes a normal level post-fingolimod needs to be defined; I would be reluctant to give alemtuzumab to anyone with a total lymphocyte count below 1.0x10⁹ .
Fingolimod Alemtuzumab
Option 1: Immediate switch (high-risk if persistent lymphopaenia occurs)
Treat with alemtuzumab before lymphocyte counts normalize
Fingolimod Alemtuzumab Bridging agent (IFN-beta, GA, Teriflunomide or DMF)
Only treat with alemtuzumab once lymphocyte counts normalize*
Option 3: Bridging (low risk; mainly related to MS rebound as a result of using a low efficacy bridging agent after fingolimod)
3-12 MONTHS
* What constitutes a normal level in this situation needs to be defined; I would be reluctant to give alemtuzumab to anyone with a total lymphocyte count below 1.0x10⁹ .
Switching from fingolimod to alemtuzumab

Changing Treatment Target

Treatment effect on disability predicted by effect on T2-lesion load and brain atrophy
Meta-analysis of treatment effect on EDSS worsening (y) vs effects on MRI lesions and brain
atrophy, individually or combined, in 13 placebo-controlled RRMS trials (13,500 MSers)
Sormani MP et al. Ann Neurol. 2014;75:43-49.

Relapses
Unreported relapses
Clinical disease progression
Subclinical relapses: focal MRI activity
Focal gray and white matter lesions not detected by MRI
Brain atrophy
Spinal fluid neurofilament levels
Beyond NEDA (no evident disease activity)
Clinical activity
Focal MRI activity
Hidden focal and diffuse MRI activity
Microscopic or biochemical pathology
Biomarkers

Residual deficits: • Walking distance >500m
• Unable to run
• Exercise induces intermittent
sensory symptoms in L arm
• Mild urinary frequency
17-yr girl, myelitis
Jun-2000
1st-yr University
L-optic neuritis
Feb-2001
clumsy
left hand
Jan -2002
pins & needles
in legs
Oct-2003
R optic neuritis
Mar-2004
Brainstem
syndrome;
diplopia and
ataxia
Dec 2007
Cervical cord
relapse
weak L arm
with pain
Jan 2008
Bladder
dysfunction
depression,
anxiety and
fatigue
Reduced
mobility
Mild urinary frequency
No depression ,anxiety
or fatigue
Fully mobile
NEDA (no evident disease activity)
Feb-2008 to May-2014
IFN-beta
Feb-2001
Natalizumab
Jan-2008
ED
SS
IFN-beta Natalizumab Jun-2000 May-2014
6.0
3.5 3.5

MRI – progressive brain atrophy
Dec 2007 Jul 2010 Jul 2013
Is this patient in long-term remission?


Conclusion
• DMT landscape is becoming increasingly complex – Changing role of clinical-nurse specialist and MSologist
• New tools are required to engage MSers in treatment decisions – Has the time arrived for treatment algorithms?
• Treat-2-target of NEDA current paradigm – NEDA (zero-tolerance) vs. MEDA
– Expand to include end-organ damage metrics, e.g. BVL (NEDA-4)
• Most sequencing decisions are not evidence-based – scientific rationale
– registries and real-life data
– Head-2-head studies are needed
• Efficacy is not everything don’t forget safety , i.e. the risks and the benefits, tolerability, adherence, monitoring, pregnancy, etc…..
• Evidence-based stopping criteria

Rheumatoid arthritis End-stage joint disease