Treasury Strategies' Quarterly Technology Briefing Cyber Security Risks to Treasury
TREASURY QUARTERLY BULLETIN:
January - March 2015
Ministry of Finance & Economic Development
1
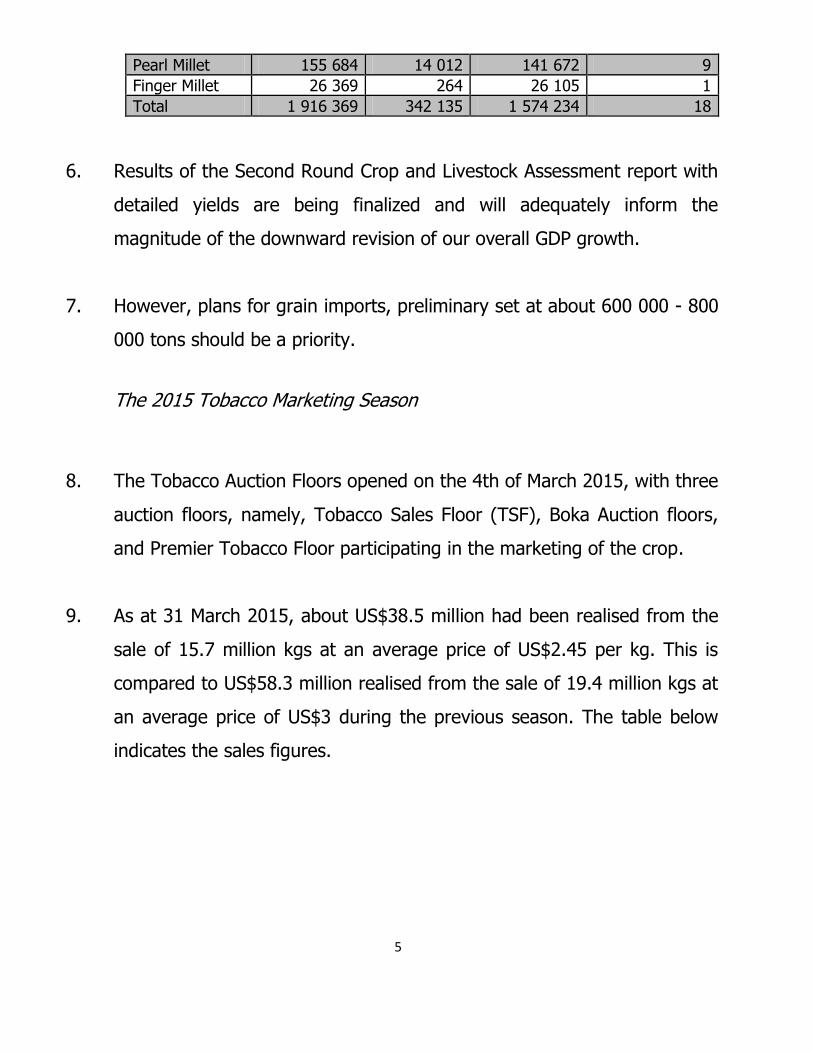
TABLE OF CONTENTS
INTRODUCTION .................................................................................................................................................. 3
The 2015 Tobacco Marketing Season ........................................................................................................ 5
The 2014/15 Tobacco Growers Registration ............................................................................................. 6
Domestic Agriculture Commodity Prices ................................................................................................... 6
Agricultural Marketing Authority (Minimum Grain Producer Prices) (Repeal) Regulations, 2015 ........... 7
Mining ................................................................................................................................................................ 8
Gold Production ......................................................................................................................................... 8
International Mineral Prices ...................................................................................................................... 9
Manufacturing ................................................................................................................................................. 12
PRICES .............................................................................................................................................................. 13
BUDGET PERFORMANCE .................................................................................................................................. 14
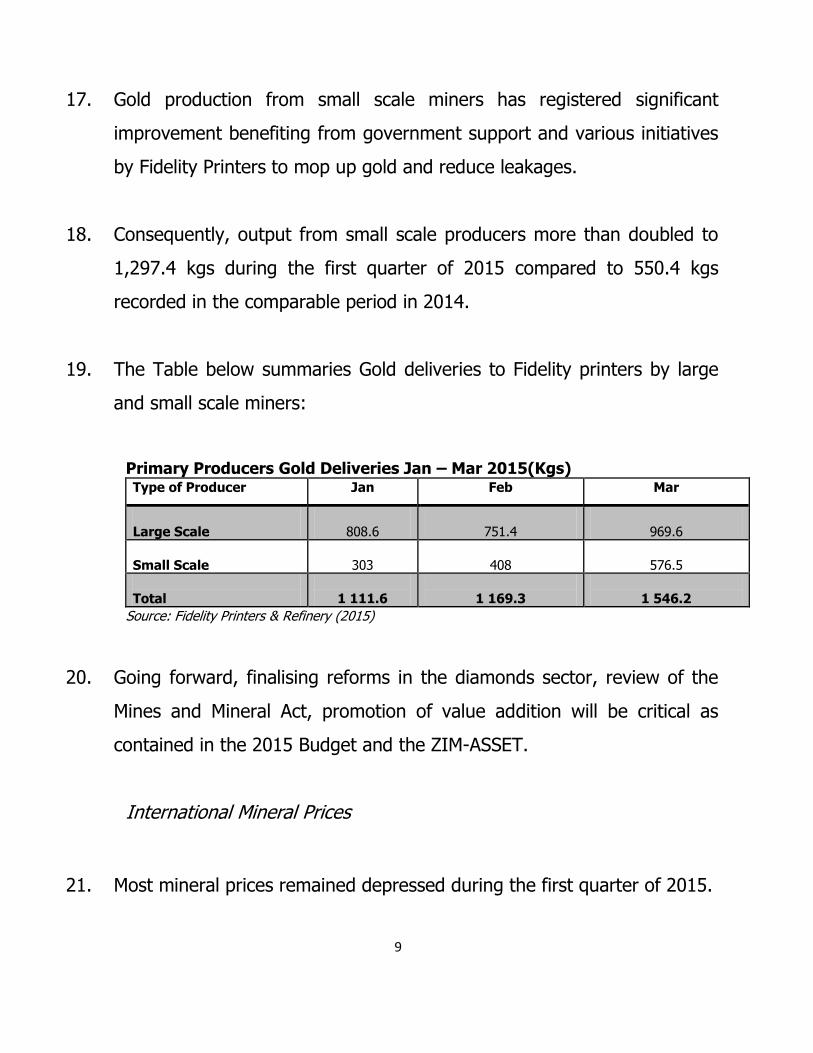
Revenue Performance ................................................................................................................................. 14
Expenditures ................................................................................................................................................ 16
FINANCIAL SECTOR .......................................................................................................................................... 18
Money Supply .............................................................................................................................................. 18
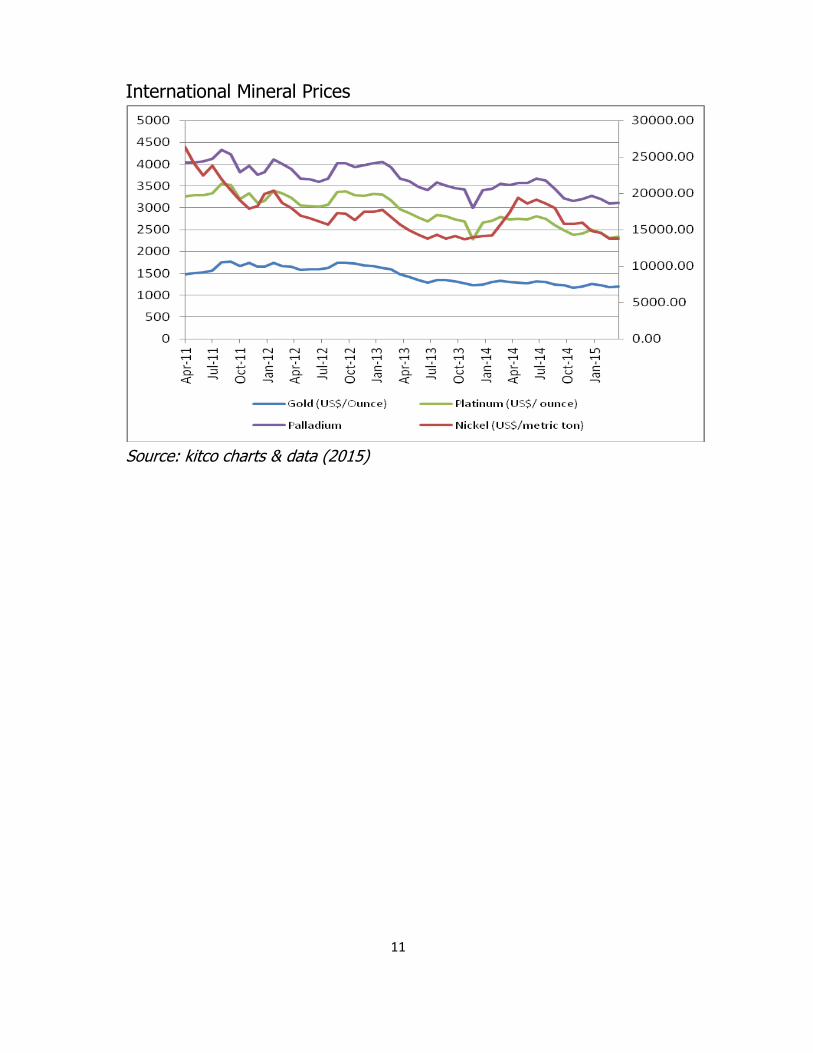
Deposits ................................................................................................................................................... 18
Domestic Credit ....................................................................................................................................... 19
Zimbabwe Stock Exchange........................................................................................................................... 20
EXTERNAL SECTOR ........................................................................................................................................... 22
Exports ......................................................................................................................................................... 22
Imports ......................................................................................................................................................... 24
Trade Gap ..................................................................................................................................................... 25
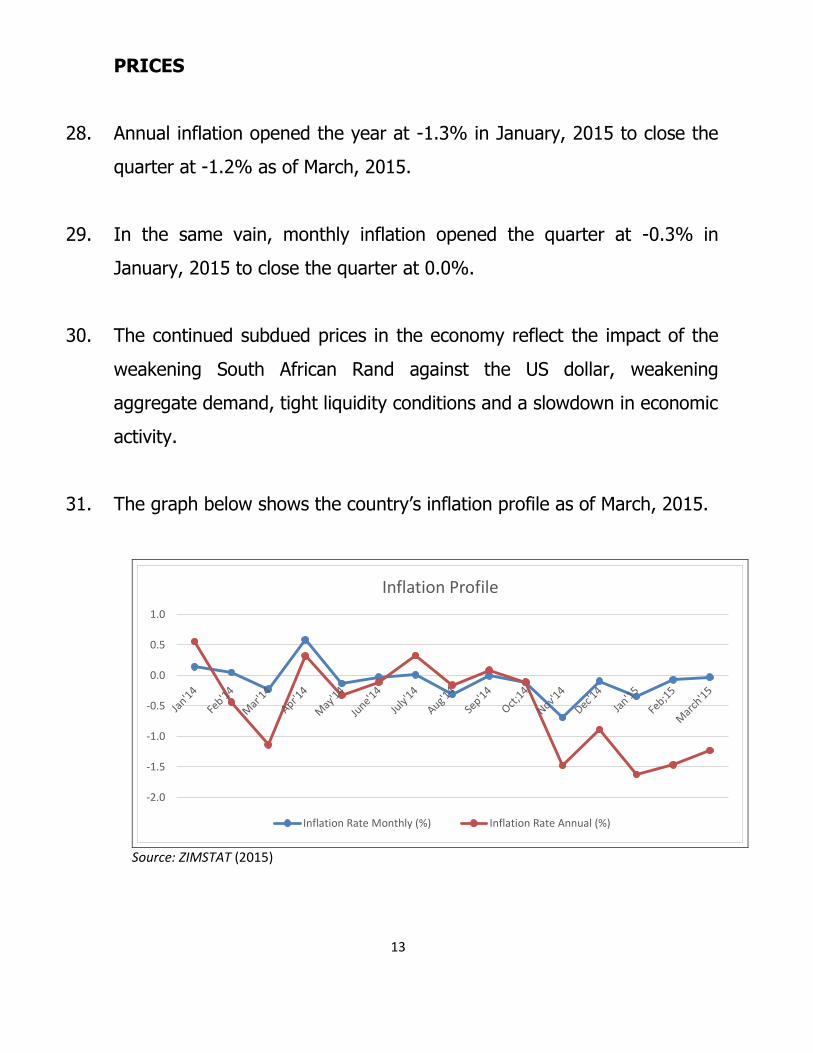
CONCLUSION .................................................................................................................................................... 25

2
STATISTICAL TABLES ......................................................................................................................................... 26
3
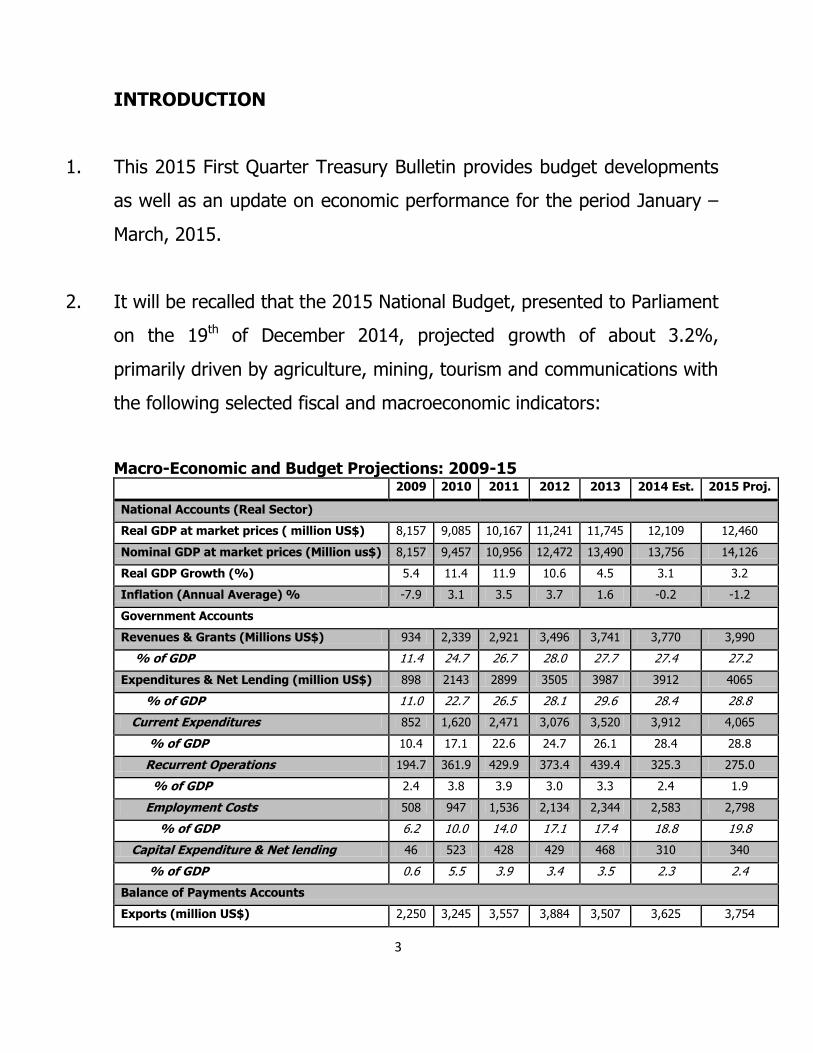
INTRODUCTION
1. This 2015 First Quarter Treasury Bulletin provides budget developments
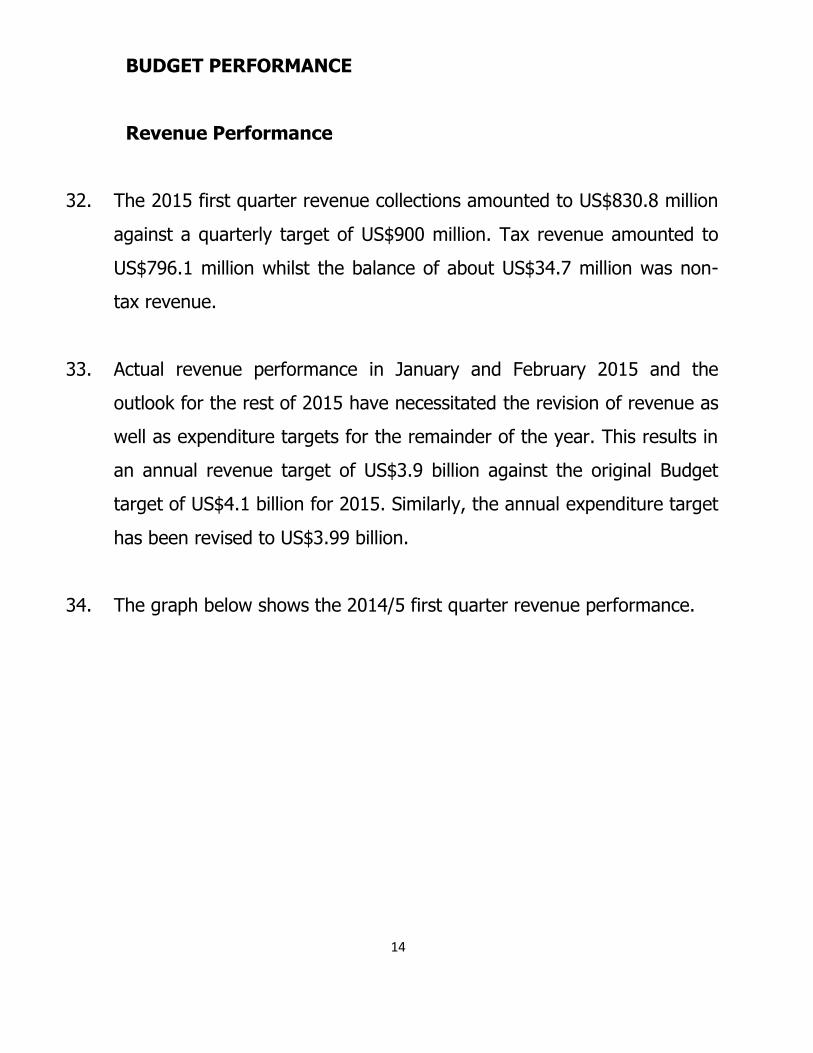
as well as an update on economic performance for the period January –
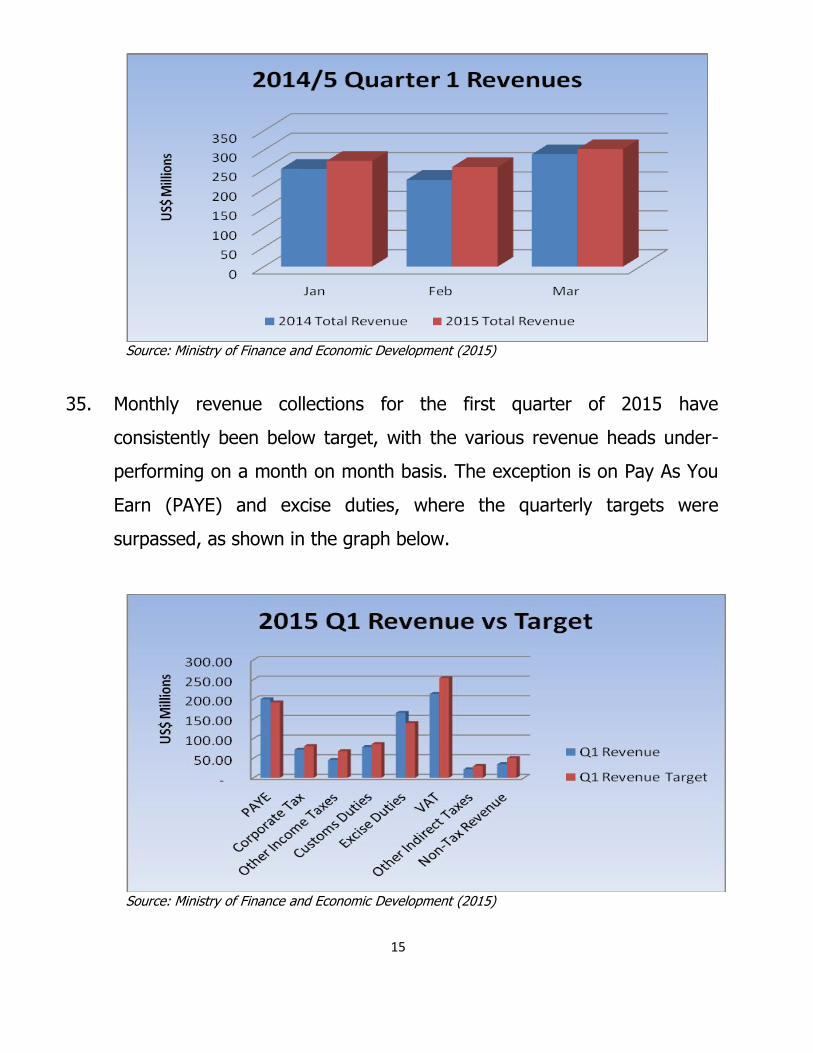
March, 2015.
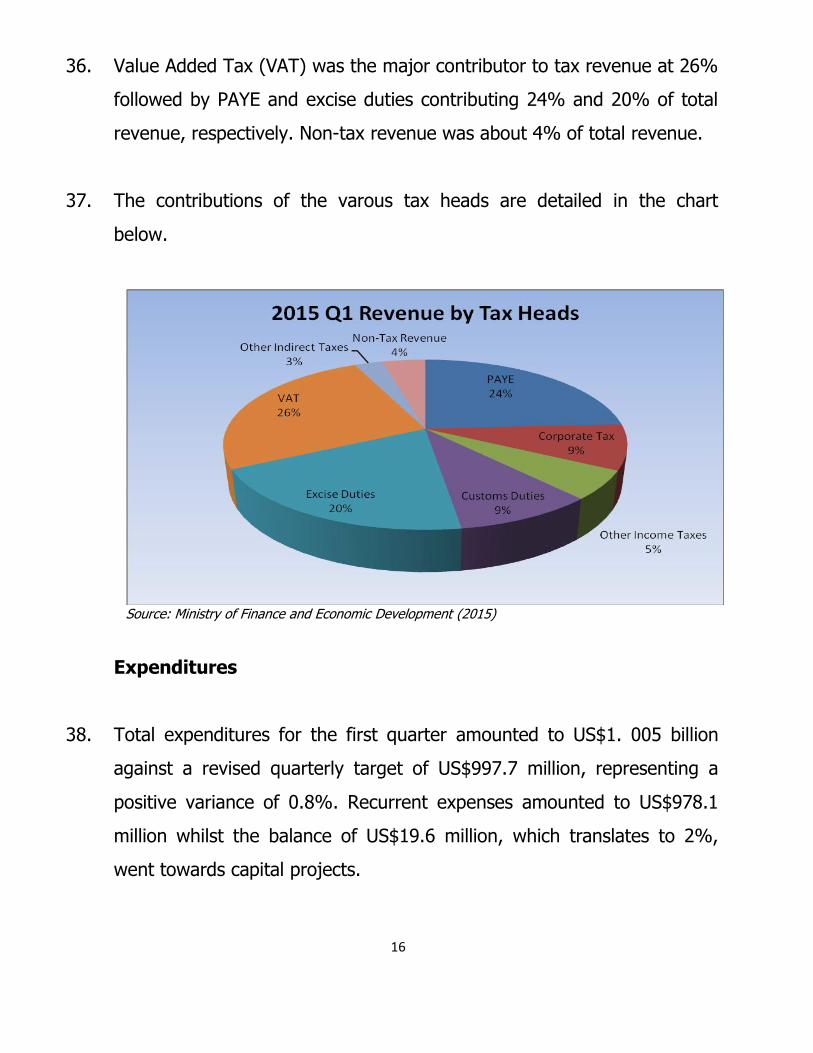
2. It will be recalled that the 2015 National Budget, presented to Parliament
on the 19th of December 2014, projected growth of about 3.2%,
primarily driven by agriculture, mining, tourism and communications with
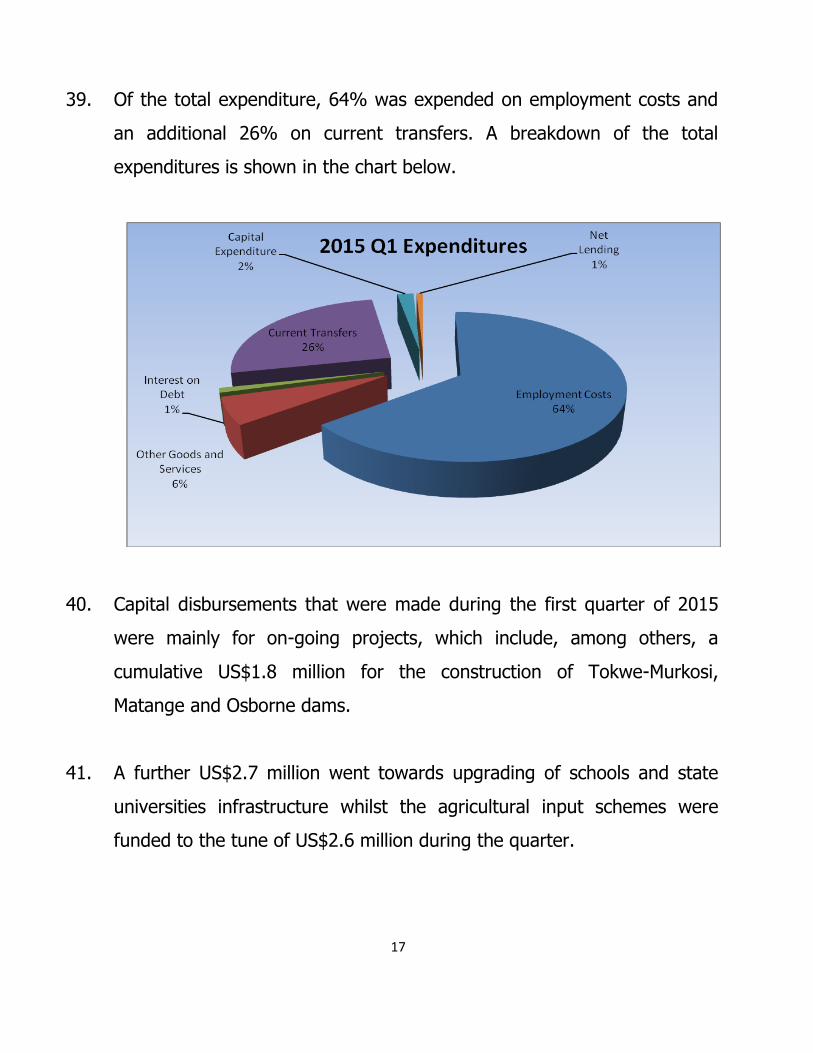
the following selected fiscal and macroeconomic indicators:
Macro-Economic and Budget Projections: 2009-15 2009 2010 2011 2012 2013 2014 Est. 2015 Proj.
National Accounts (Real Sector)
Real GDP at market prices ( million US$) 8,157 9,085 10,167 11,241 11,745 12,109 12,460
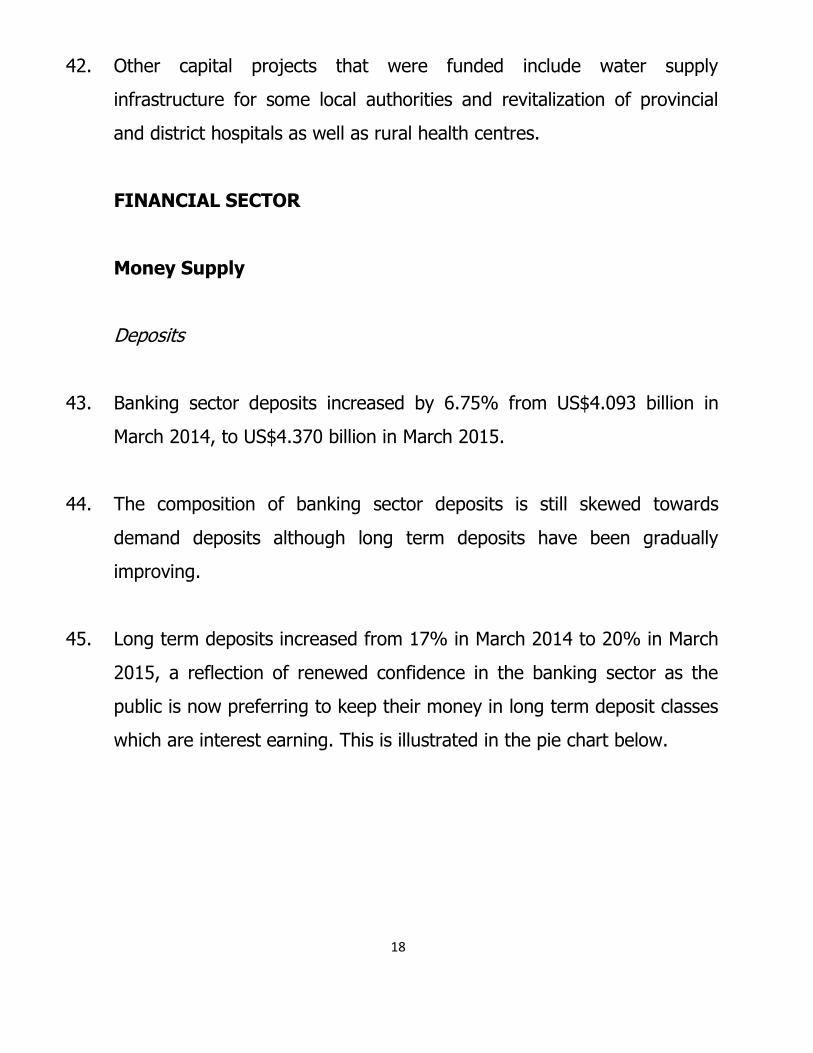
Nominal GDP at market prices (Million us$) 8,157 9,457 10,956 12,472 13,490 13,756 14,126
Real GDP Growth (%) 5.4 11.4 11.9 10.6 4.5 3.1 3.2
Inflation (Annual Average) % -7.9 3.1 3.5 3.7 1.6 -0.2 -1.2
Government Accounts
Revenues & Grants (Millions US$) 934 2,339 2,921 3,496 3,741 3,770 3,990
% of GDP 11.4 24.7 26.7 28.0 27.7 27.4 27.2
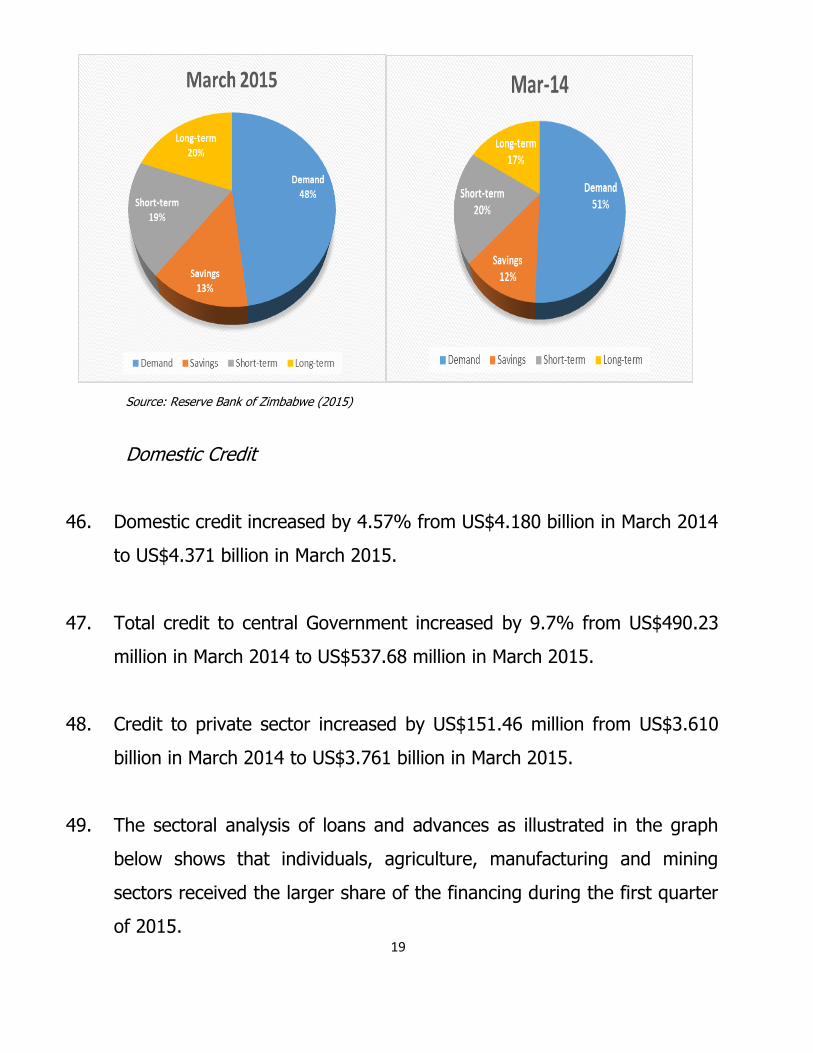
Expenditures & Net Lending (million US$) 898 2143 2899 3505 3987 3912 4065
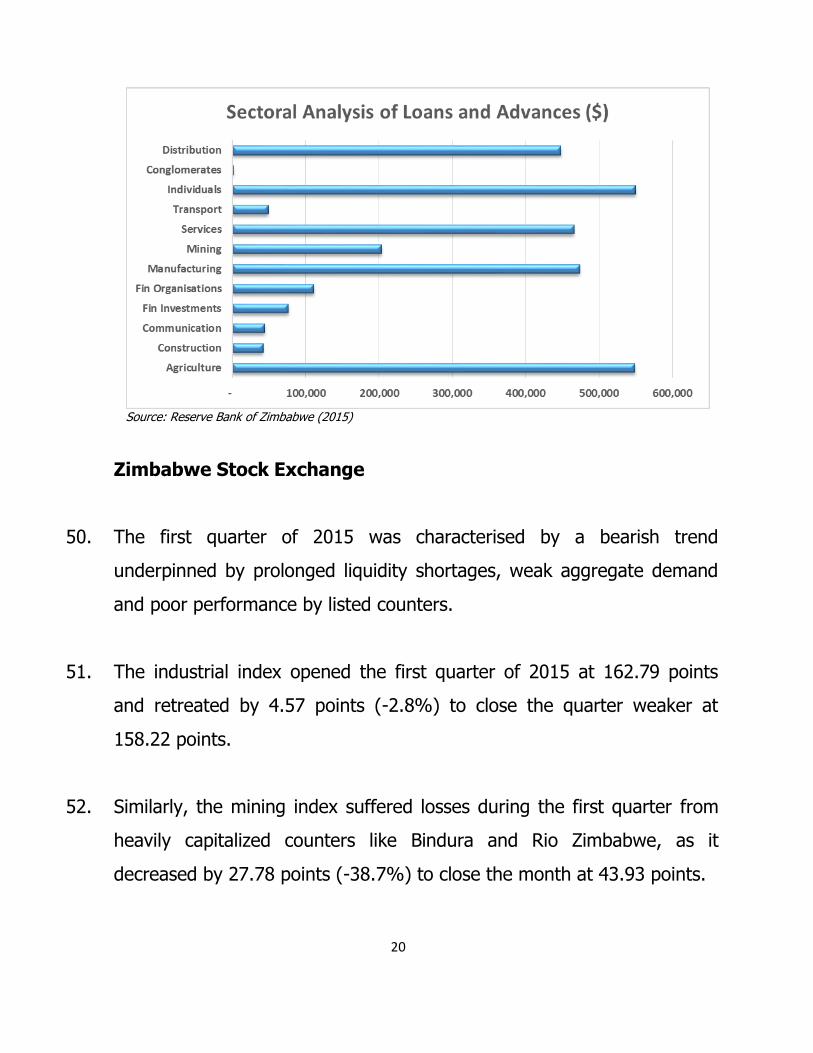
% of GDP 11.0 22.7 26.5 28.1 29.6 28.4 28.8
Current Expenditures 852 1,620 2,471 3,076 3,520 3,912 4,065
% of GDP 10.4 17.1 22.6 24.7 26.1 28.4 28.8
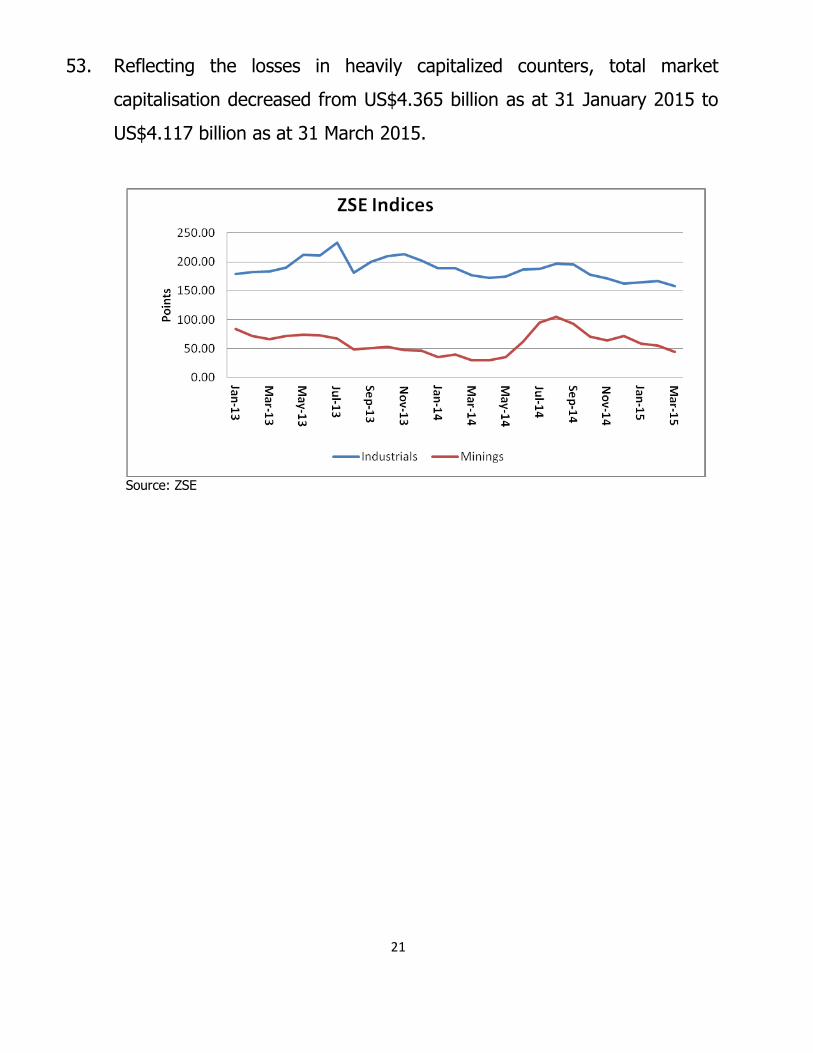
Recurrent Operations 194.7 361.9 429.9 373.4 439.4 325.3 275.0
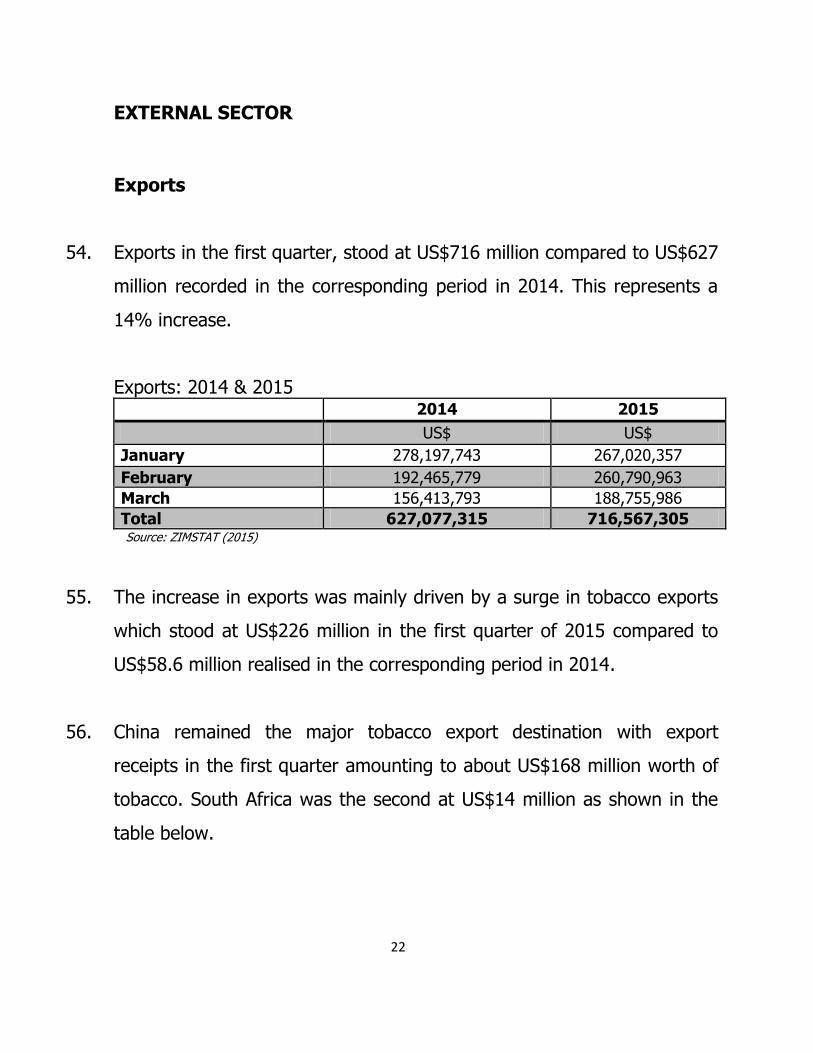
% of GDP 2.4 3.8 3.9 3.0 3.3 2.4 1.9
Employment Costs 508 947 1,536 2,134 2,344 2,583 2,798
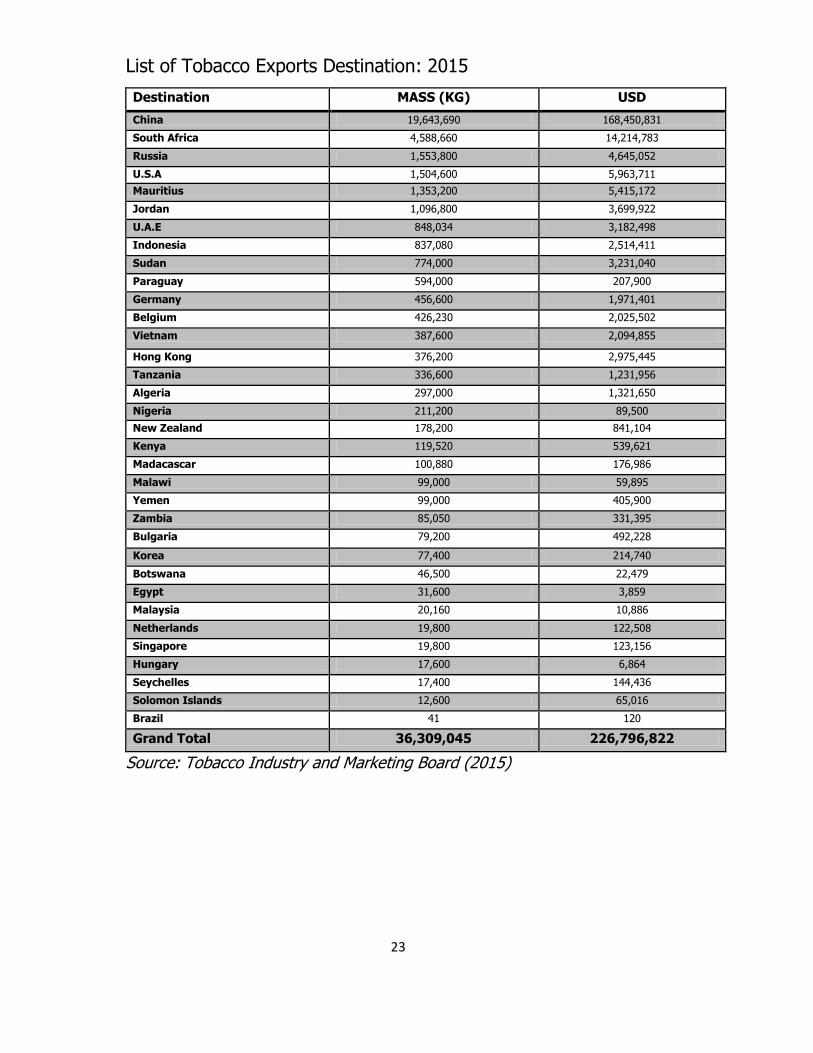
% of GDP 6.2 10.0 14.0 17.1 17.4 18.8 19.8
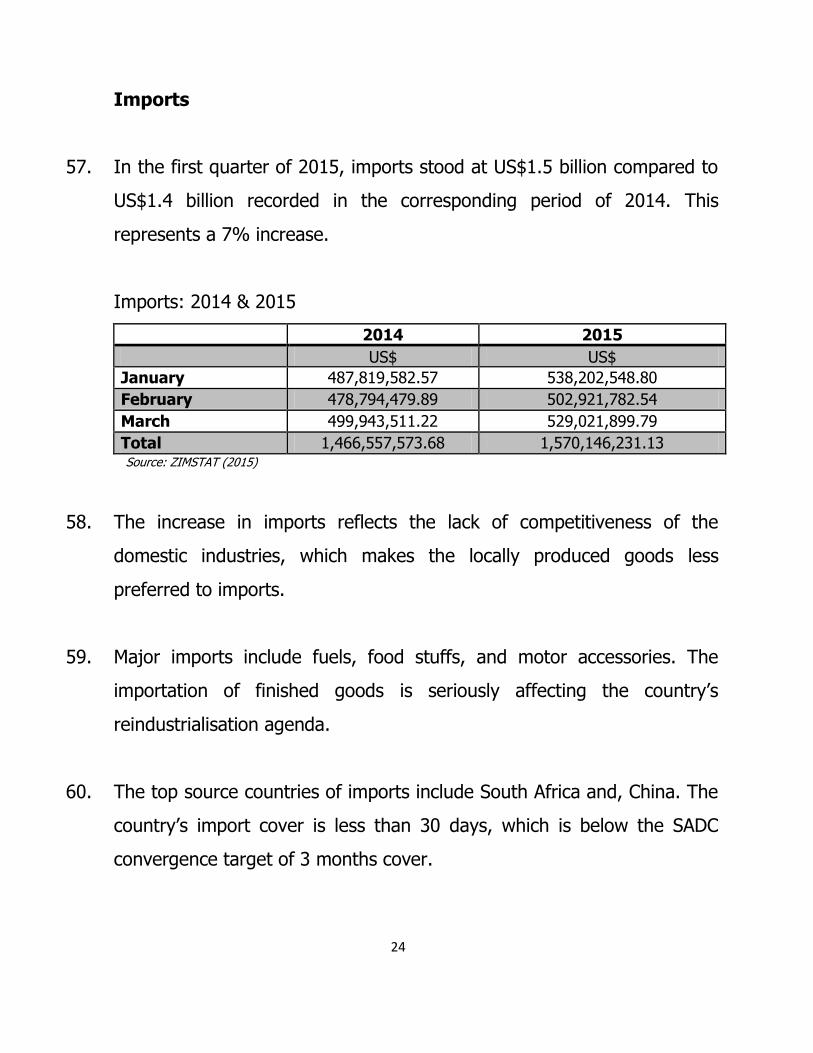
Capital Expenditure & Net lending 46 523 428 429 468 310 340
% of GDP 0.6 5.5 3.9 3.4 3.5 2.3 2.4
Balance of Payments Accounts
Exports (million US$) 2,250 3,245 3,557 3,884 3,507 3,625 3,754
4
2009 2010 2011 2012 2013 2014 Est. 2015 Proj.
Imports (million US$) 6,207 5,865 8,596 7,484 7,704 7,579 7,640
Current Account Balance (million US$) -1878 -3386 -3042 -3432 -3065 -2749 -2830
Source: Ministry of Finance and Economic Development (2015)
3. However, three months down, indications point to subdued economic
outlook. Developments in agriculture, particularly on maize, should see
growth slowing down to below 2.8% in 2015.
4. Other than drought, major challenges constraining economic activity in
other sectors remain attributable to the tight liquidity conditions and
hence severe underfunding of productive sectors, depressed aggregate
demand and infrastructure bottlenecks, among other factors.
REAL SECTOR DEVELOPMENTS
Agriculture
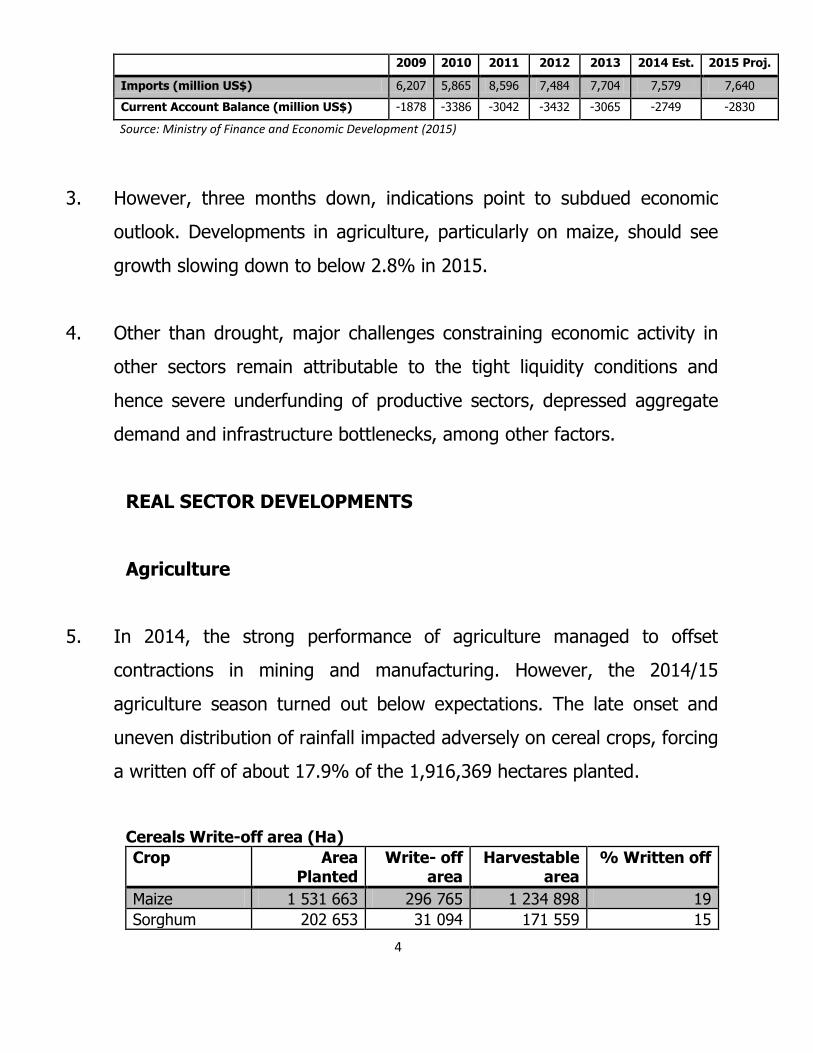
5. In 2014, the strong performance of agriculture managed to offset
contractions in mining and manufacturing. However, the 2014/15
agriculture season turned out below expectations. The late onset and
uneven distribution of rainfall impacted adversely on cereal crops, forcing
a written off of about 17.9% of the 1,916,369 hectares planted.
Cereals Write-off area (Ha)
Crop Area Planted
Write- off area
Harvestable area
% Written off
Maize 1 531 663 296 765 1 234 898 19
Sorghum 202 653 31 094 171 559 15
5
Pearl Millet 155 684 14 012 141 672 9
Finger Millet 26 369 264 26 105 1
Total 1 916 369 342 135 1 574 234 18
6. Results of the Second Round Crop and Livestock Assessment report with
detailed yields are being finalized and will adequately inform the
magnitude of the downward revision of our overall GDP growth.
7. However, plans for grain imports, preliminary set at about 600 000 - 800
000 tons should be a priority.
The 2015 Tobacco Marketing Season
8. The Tobacco Auction Floors opened on the 4th of March 2015, with three
auction floors, namely, Tobacco Sales Floor (TSF), Boka Auction floors,
and Premier Tobacco Floor participating in the marketing of the crop.
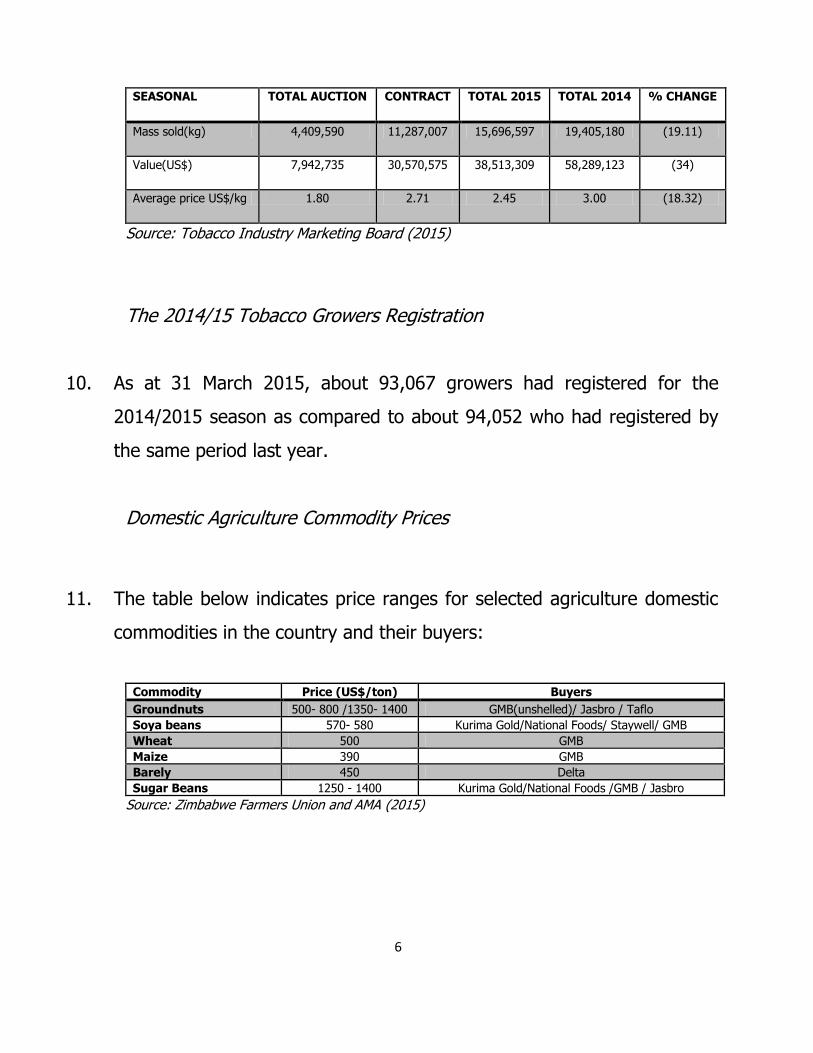
9. As at 31 March 2015, about US$38.5 million had been realised from the
sale of 15.7 million kgs at an average price of US$2.45 per kg. This is
compared to US$58.3 million realised from the sale of 19.4 million kgs at
an average price of US$3 during the previous season. The table below
indicates the sales figures.
6
SEASONAL TOTAL AUCTION CONTRACT TOTAL 2015 TOTAL 2014 % CHANGE
Mass sold(kg) 4,409,590 11,287,007 15,696,597 19,405,180 (19.11)
Value(US$) 7,942,735 30,570,575 38,513,309 58,289,123 (34)
Average price US$/kg 1.80 2.71 2.45 3.00 (18.32)
Source: Tobacco Industry Marketing Board (2015)
The 2014/15 Tobacco Growers Registration
10. As at 31 March 2015, about 93,067 growers had registered for the
2014/2015 season as compared to about 94,052 who had registered by
the same period last year.
Domestic Agriculture Commodity Prices
11. The table below indicates price ranges for selected agriculture domestic
commodities in the country and their buyers:
Commodity Price (US$/ton) Buyers
Groundnuts 500- 800 /1350- 1400 GMB(unshelled)/ Jasbro / Taflo
Soya beans 570- 580 Kurima Gold/National Foods/ Staywell/ GMB
Wheat 500 GMB
Maize 390 GMB
Barely 450 Delta
Sugar Beans 1250 - 1400 Kurima Gold/National Foods /GMB / Jasbro
Source: Zimbabwe Farmers Union and AMA (2015)
7
Agricultural Marketing Authority (Minimum Grain Producer Prices)
(Repeal) Regulations, 2015
12. The Government through the Ministry of Agriculture Mechanisation and
Irrigation Development has through Statutory Instrument 38 of 2015
repealed the Statutory Instrument 122 of 2014 on minimum grain
producer prices.
13. This therefore means that the marketing of maize has now been
liberalised. Whilst all other players will be buying and selling maize at
market determined rates, GMB will continue to buy the crop at US$390.
8
Mining
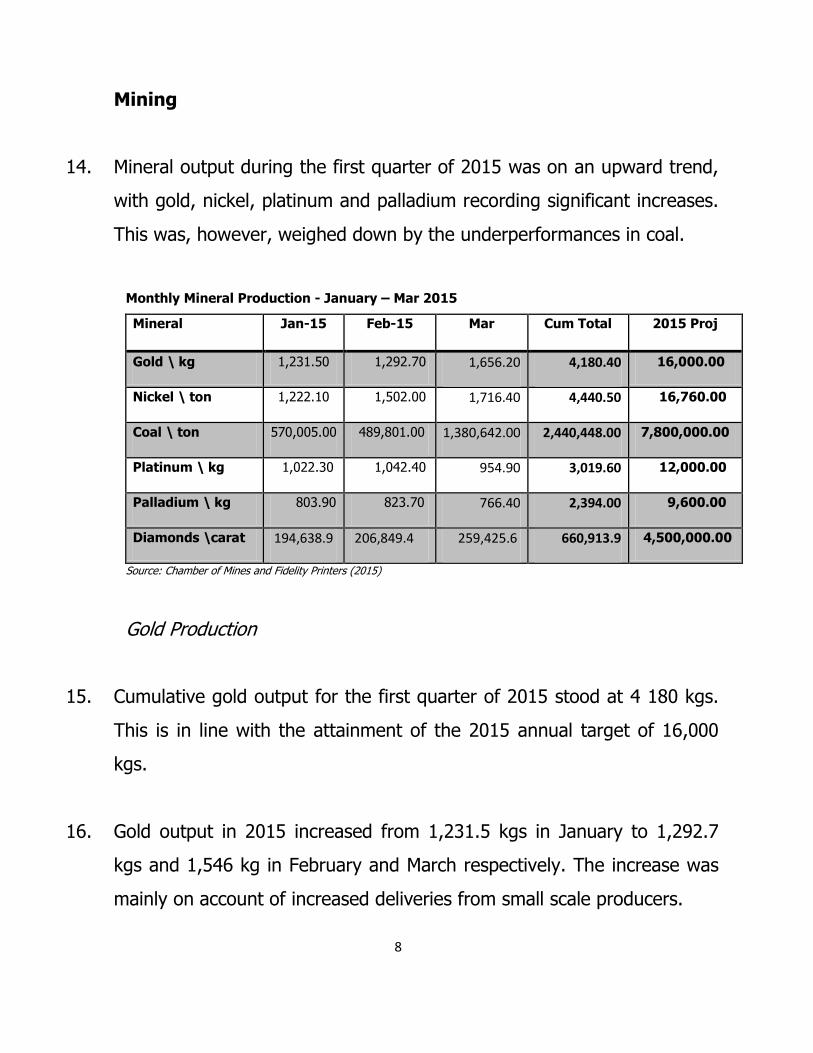
14. Mineral output during the first quarter of 2015 was on an upward trend,
with gold, nickel, platinum and palladium recording significant increases.
This was, however, weighed down by the underperformances in coal.
Monthly Mineral Production - January – Mar 2015
Mineral Jan-15 Feb-15 Mar Cum Total 2015 Proj
Gold \ kg 1,231.50 1,292.70 1,656.20 4,180.40 16,000.00
Nickel \ ton 1,222.10 1,502.00 1,716.40 4,440.50 16,760.00
Coal \ ton 570,005.00 489,801.00 1,380,642.00 2,440,448.00 7,800,000.00
Platinum \ kg 1,022.30 1,042.40 954.90 3,019.60 12,000.00
Palladium \ kg 803.90 823.70 766.40 2,394.00 9,600.00
Diamonds \carat 194,638.9 206,849.4 259,425.6 660,913.9 4,500,000.00
Source: Chamber of Mines and Fidelity Printers (2015)
Gold Production
15. Cumulative gold output for the first quarter of 2015 stood at 4 180 kgs.
This is in line with the attainment of the 2015 annual target of 16,000
kgs.
16. Gold output in 2015 increased from 1,231.5 kgs in January to 1,292.7
kgs and 1,546 kg in February and March respectively. The increase was
mainly on account of increased deliveries from small scale producers.
9
17. Gold production from small scale miners has registered significant
improvement benefiting from government support and various initiatives
by Fidelity Printers to mop up gold and reduce leakages.
18. Consequently, output from small scale producers more than doubled to
1,297.4 kgs during the first quarter of 2015 compared to 550.4 kgs
recorded in the comparable period in 2014.
19. The Table below summaries Gold deliveries to Fidelity printers by large
and small scale miners:
Primary Producers Gold Deliveries Jan – Mar 2015(Kgs) Type of Producer Jan Feb Mar
Large Scale
808.6
751.4
969.6
Small Scale
303
408
576.5
Total
1 111.6
1 169.3
1 546.2
Source: Fidelity Printers & Refinery (2015)
20. Going forward, finalising reforms in the diamonds sector, review of the
Mines and Mineral Act, promotion of value addition will be critical as
contained in the 2015 Budget and the ZIM-ASSET.
International Mineral Prices
21. Most mineral prices remained depressed during the first quarter of 2015.

10
22. This has threatened viability resulting in companies embarking on some
cost cutting measures in the form of rationalization and retrenchments.
11
International Mineral Prices
Source: kitco charts & data (2015)
12
Manufacturing
23. The manufacturing sector remains depressed, with companies operating
amid infrastructure constraints, rigid labour laws, and lack of financing.
24. However, specific sector interventions that were put in place through the
2014 Mid Term Fiscal Policy Review and the 2015 National Budgets,
relating to reviews of tariffs and import licenses, have started to yield
positive results for some sub-sectors.
25. Supported sectors include, oil expressers, poultry, dairy, clothing and
tanneries.
26. The Cotton to Clothing Strategy (2014-2019), which was launched in
September 2014, has started to show some positive results in the
clothing and textiles sub-sector. David Whitehead and Archer Clothing
have resumed operations and are operating at about 40% and 70%
capacity utilisation respectively.
27. Strides also being made on resolving issues around indigenisation, labour
laws, enhancement of competitiveness and doing business reforms and
these should see some improvements in capacity utilisation rising above
the current levels of 36%.
13
PRICES
28. Annual inflation opened the year at -1.3% in January, 2015 to close the
quarter at -1.2% as of March, 2015.
29. In the same vain, monthly inflation opened the quarter at -0.3% in
January, 2015 to close the quarter at 0.0%.
30. The continued subdued prices in the economy reflect the impact of the
weakening South African Rand against the US dollar, weakening
aggregate demand, tight liquidity conditions and a slowdown in economic
activity.
31. The graph below shows the country’s inflation profile as of March, 2015.
-2.0
-1.5
-1.0
-0.5
0.0
0.5
1.0
Inflation Profile
Inflation Rate Monthly (%) Inflation Rate Annual (%)
Source: ZIMSTAT (2015)
14
BUDGET PERFORMANCE
Revenue Performance
32. The 2015 first quarter revenue collections amounted to US$830.8 million
against a quarterly target of US$900 million. Tax revenue amounted to
US$796.1 million whilst the balance of about US$34.7 million was non-
tax revenue.
33. Actual revenue performance in January and February 2015 and the
outlook for the rest of 2015 have necessitated the revision of revenue as
well as expenditure targets for the remainder of the year. This results in
an annual revenue target of US$3.9 billion against the original Budget
target of US$4.1 billion for 2015. Similarly, the annual expenditure target
has been revised to US$3.99 billion.
34. The graph below shows the 2014/5 first quarter revenue performance.
15
Source: Ministry of Finance and Economic Development (2015)
35. Monthly revenue collections for the first quarter of 2015 have
consistently been below target, with the various revenue heads under-
performing on a month on month basis. The exception is on Pay As You
Earn (PAYE) and excise duties, where the quarterly targets were
surpassed, as shown in the graph below.
Source: Ministry of Finance and Economic Development (2015)
16
36. Value Added Tax (VAT) was the major contributor to tax revenue at 26%
followed by PAYE and excise duties contributing 24% and 20% of total
revenue, respectively. Non-tax revenue was about 4% of total revenue.
37. The contributions of the varous tax heads are detailed in the chart
below.
Source: Ministry of Finance and Economic Development (2015)
Expenditures
38. Total expenditures for the first quarter amounted to US$1. 005 billion
against a revised quarterly target of US$997.7 million, representing a
positive variance of 0.8%. Recurrent expenses amounted to US$978.1
million whilst the balance of US$19.6 million, which translates to 2%,
went towards capital projects.
17
39. Of the total expenditure, 64% was expended on employment costs and
an additional 26% on current transfers. A breakdown of the total
expenditures is shown in the chart below.
40. Capital disbursements that were made during the first quarter of 2015
were mainly for on-going projects, which include, among others, a
cumulative US$1.8 million for the construction of Tokwe-Murkosi,
Matange and Osborne dams.
41. A further US$2.7 million went towards upgrading of schools and state
universities infrastructure whilst the agricultural input schemes were
funded to the tune of US$2.6 million during the quarter.
18
42. Other capital projects that were funded include water supply
infrastructure for some local authorities and revitalization of provincial
and district hospitals as well as rural health centres.
FINANCIAL SECTOR
Money Supply
Deposits
43. Banking sector deposits increased by 6.75% from US$4.093 billion in
March 2014, to US$4.370 billion in March 2015.
44. The composition of banking sector deposits is still skewed towards
demand deposits although long term deposits have been gradually
improving.
45. Long term deposits increased from 17% in March 2014 to 20% in March
2015, a reflection of renewed confidence in the banking sector as the
public is now preferring to keep their money in long term deposit classes
which are interest earning. This is illustrated in the pie chart below.
19
Source: Reserve Bank of Zimbabwe (2015)
Domestic Credit
46. Domestic credit increased by 4.57% from US$4.180 billion in March 2014
to US$4.371 billion in March 2015.
47. Total credit to central Government increased by 9.7% from US$490.23
million in March 2014 to US$537.68 million in March 2015.
48. Credit to private sector increased by US$151.46 million from US$3.610
billion in March 2014 to US$3.761 billion in March 2015.
49. The sectoral analysis of loans and advances as illustrated in the graph
below shows that individuals, agriculture, manufacturing and mining
sectors received the larger share of the financing during the first quarter
of 2015.
20
Source: Reserve Bank of Zimbabwe (2015)
Zimbabwe Stock Exchange
50. The first quarter of 2015 was characterised by a bearish trend
underpinned by prolonged liquidity shortages, weak aggregate demand
and poor performance by listed counters.
51. The industrial index opened the first quarter of 2015 at 162.79 points
and retreated by 4.57 points (-2.8%) to close the quarter weaker at
158.22 points.
52. Similarly, the mining index suffered losses during the first quarter from
heavily capitalized counters like Bindura and Rio Zimbabwe, as it
decreased by 27.78 points (-38.7%) to close the month at 43.93 points.
21
53. Reflecting the losses in heavily capitalized counters, total market
capitalisation decreased from US$4.365 billion as at 31 January 2015 to
US$4.117 billion as at 31 March 2015.
Source: ZSE
22
EXTERNAL SECTOR
Exports
54. Exports in the first quarter, stood at US$716 million compared to US$627
million recorded in the corresponding period in 2014. This represents a
14% increase.
Exports: 2014 & 2015 2014 2015
US$ US$
January 278,197,743 267,020,357
February 192,465,779 260,790,963
March 156,413,793 188,755,986
Total 627,077,315 716,567,305 Source: ZIMSTAT (2015)
55. The increase in exports was mainly driven by a surge in tobacco exports
which stood at US$226 million in the first quarter of 2015 compared to
US$58.6 million realised in the corresponding period in 2014.
56. China remained the major tobacco export destination with export
receipts in the first quarter amounting to about US$168 million worth of
tobacco. South Africa was the second at US$14 million as shown in the
table below.
23
List of Tobacco Exports Destination: 2015
Destination MASS (KG) USD
China 19,643,690 168,450,831
South Africa 4,588,660 14,214,783
Russia 1,553,800 4,645,052
U.S.A 1,504,600 5,963,711
Mauritius 1,353,200 5,415,172
Jordan 1,096,800 3,699,922
U.A.E 848,034 3,182,498
Indonesia 837,080 2,514,411
Sudan 774,000 3,231,040
Paraguay 594,000 207,900
Germany 456,600 1,971,401
Belgium 426,230 2,025,502
Vietnam 387,600 2,094,855
Hong Kong 376,200 2,975,445
Tanzania 336,600 1,231,956
Algeria 297,000 1,321,650
Nigeria 211,200 89,500
New Zealand 178,200 841,104
Kenya 119,520 539,621
Madacascar 100,880 176,986
Malawi 99,000 59,895
Yemen 99,000 405,900
Zambia 85,050 331,395
Bulgaria 79,200 492,228
Korea 77,400 214,740
Botswana 46,500 22,479
Egypt 31,600 3,859
Malaysia 20,160 10,886
Netherlands 19,800 122,508
Singapore 19,800 123,156
Hungary 17,600 6,864
Seychelles 17,400 144,436
Solomon Islands 12,600 65,016
Brazil 41 120
Grand Total 36,309,045 226,796,822
Source: Tobacco Industry and Marketing Board (2015)
24
Imports
57. In the first quarter of 2015, imports stood at US$1.5 billion compared to
US$1.4 billion recorded in the corresponding period of 2014. This
represents a 7% increase.
Imports: 2014 & 2015
2014 2015
US$ US$
January 487,819,582.57 538,202,548.80
February 478,794,479.89 502,921,782.54
March 499,943,511.22 529,021,899.79
Total 1,466,557,573.68 1,570,146,231.13 Source: ZIMSTAT (2015)
58. The increase in imports reflects the lack of competitiveness of the
domestic industries, which makes the locally produced goods less
preferred to imports.
59. Major imports include fuels, food stuffs, and motor accessories. The
importation of finished goods is seriously affecting the country’s
reindustrialisation agenda.
60. The top source countries of imports include South Africa and, China. The
country’s import cover is less than 30 days, which is below the SADC
convergence target of 3 months cover.
25
Trade Gap
61. The trade deficit in the first quarter slightly worsened, reaching US$853
million, compared to US$839 million recorded in 2014. The worsening
trade gap is a reflection of the continued over-reliance on imports of
finished goods by the economy.
CONCLUSION
62. The economic performance during the first quarter of 2015 has been
depressed. The situation have been aggravated by the poor 2014/15
agricultural season. The economy continues to be affected by liquidity
constraints, antiquated plant and machinery, inflexible labour laws,
cheap imports and high cost of production, among other challenges.
26
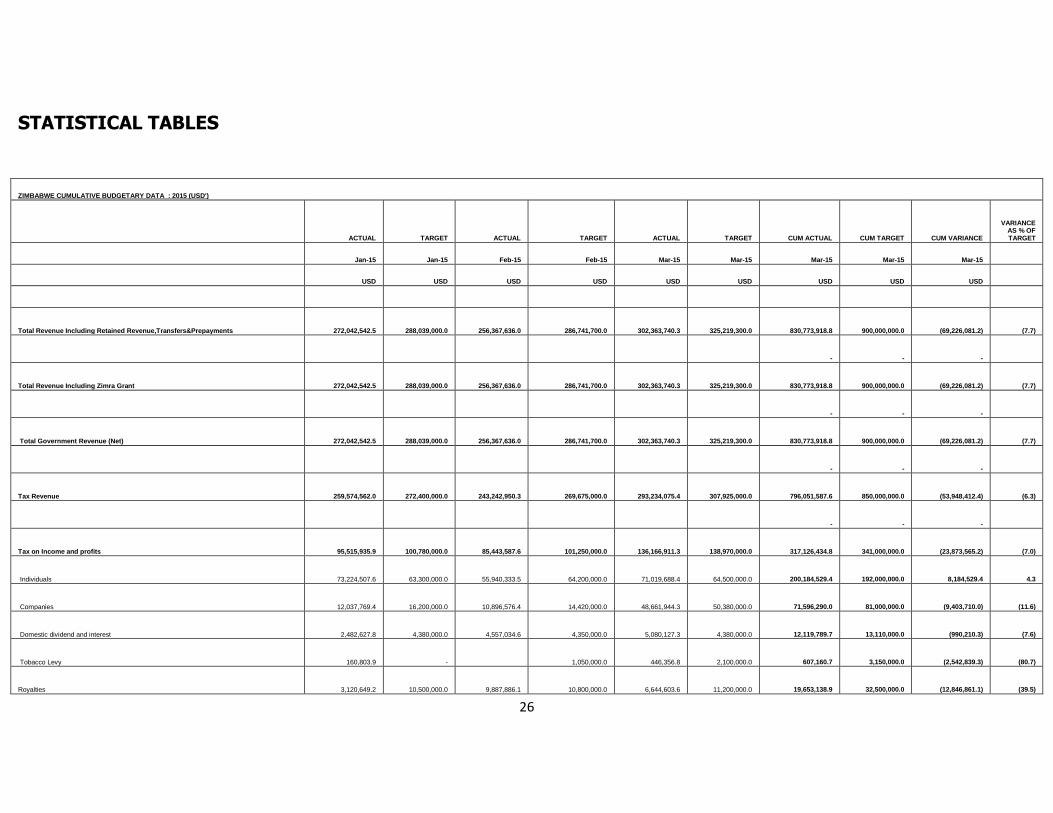
STATISTICAL TABLES
ZIMBABWE CUMULATIVE BUDGETARY DATA : 2015 (USD')
ACTUAL TARGET ACTUAL TARGET ACTUAL TARGET CUM ACTUAL CUM TARGET CUM VARIANCE
VARIANCE AS % OF TARGET
Jan-15 Jan-15 Feb-15 Feb-15 Mar-15 Mar-15 Mar-15 Mar-15 Mar-15
USD USD USD USD USD USD USD USD USD
Total Revenue Including Retained Revenue,Transfers&Prepayments 272,042,542.5 288,039,000.0 256,367,636.0 286,741,700.0 302,363,740.3 325,219,300.0 830,773,918.8 900,000,000.0 (69,226,081.2) (7.7)
- - -
Total Revenue Including Zimra Grant 272,042,542.5 288,039,000.0 256,367,636.0 286,741,700.0 302,363,740.3 325,219,300.0 830,773,918.8 900,000,000.0 (69,226,081.2) (7.7)
- - -
Total Government Revenue (Net) 272,042,542.5 288,039,000.0 256,367,636.0 286,741,700.0 302,363,740.3 325,219,300.0 830,773,918.8 900,000,000.0 (69,226,081.2) (7.7)
- - -
Tax Revenue 259,574,562.0 272,400,000.0 243,242,950.3 269,675,000.0 293,234,075.4 307,925,000.0 796,051,587.6 850,000,000.0 (53,948,412.4) (6.3)
- - -
Tax on Income and profits 95,515,935.9 100,780,000.0 85,443,587.6 101,250,000.0 136,166,911.3 138,970,000.0 317,126,434.8 341,000,000.0 (23,873,565.2) (7.0)
Individuals 73,224,507.6 63,300,000.0 55,940,333.5 64,200,000.0 71,019,688.4 64,500,000.0 200,184,529.4 192,000,000.0 8,184,529.4 4.3
Companies 12,037,769.4 16,200,000.0 10,896,576.4 14,420,000.0 48,661,944.3 50,380,000.0 71,596,290.0 81,000,000.0 (9,403,710.0) (11.6)
Domestic dividend and interest 2,482,627.8 4,380,000.0 4,557,034.6 4,350,000.0 5,080,127.3 4,380,000.0 12,119,789.7 13,110,000.0 (990,210.3) (7.6)
Tobacco Levy 160,803.9 - 1,050,000.0 446,356.8 2,100,000.0 607,160.7 3,150,000.0 (2,542,839.3) (80.7)
Royalties 3,120,649.2 10,500,000.0 9,887,886.1 10,800,000.0 6,644,603.6 11,200,000.0 19,653,138.9 32,500,000.0 (12,846,861.1) (39.5)
27
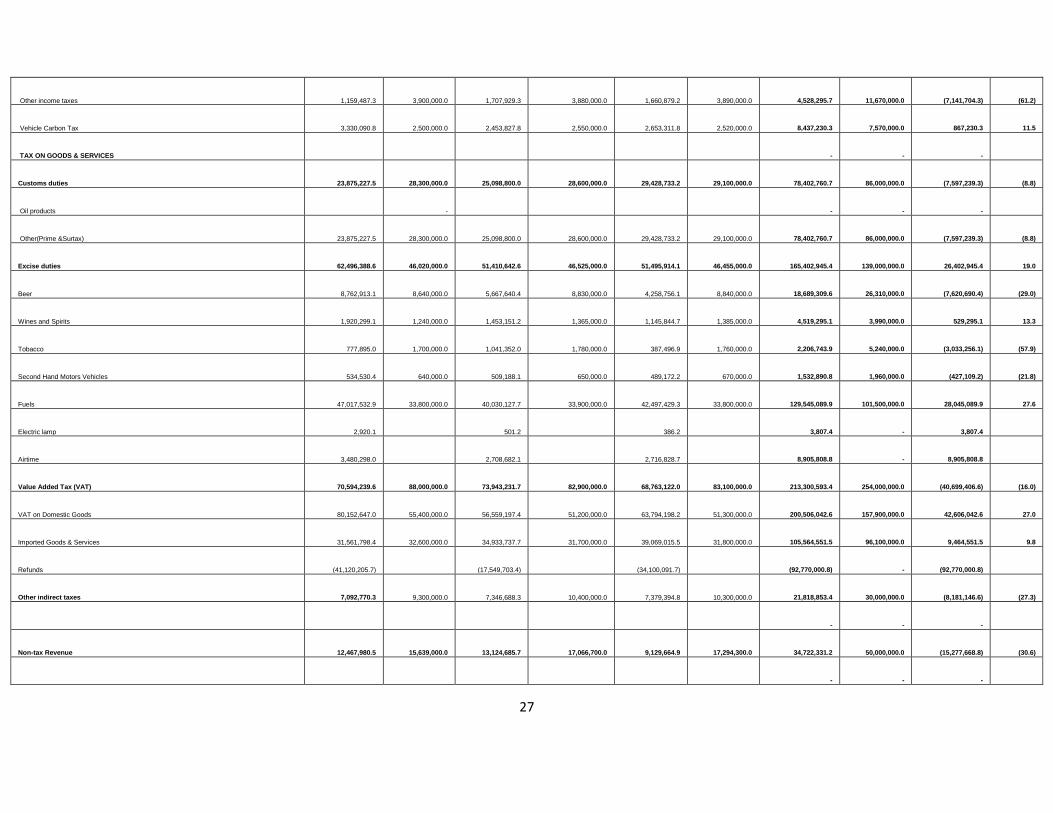
Other income taxes 1,159,487.3 3,900,000.0 1,707,929.3 3,880,000.0 1,660,879.2 3,890,000.0 4,528,295.7 11,670,000.0 (7,141,704.3) (61.2)
Vehicle Carbon Tax 3,330,090.8 2,500,000.0 2,453,827.8 2,550,000.0 2,653,311.8 2,520,000.0 8,437,230.3 7,570,000.0 867,230.3 11.5
TAX ON GOODS & SERVICES - - -
Customs duties 23,875,227.5 28,300,000.0 25,098,800.0 28,600,000.0 29,428,733.2 29,100,000.0 78,402,760.7 86,000,000.0 (7,597,239.3) (8.8)
Oil products - - - -
Other(Prime &Surtax) 23,875,227.5 28,300,000.0 25,098,800.0 28,600,000.0 29,428,733.2 29,100,000.0 78,402,760.7 86,000,000.0 (7,597,239.3) (8.8)
Excise duties 62,496,388.6 46,020,000.0 51,410,642.6 46,525,000.0 51,495,914.1 46,455,000.0 165,402,945.4 139,000,000.0 26,402,945.4 19.0
Beer 8,762,913.1 8,640,000.0 5,667,640.4 8,830,000.0 4,258,756.1 8,840,000.0 18,689,309.6 26,310,000.0 (7,620,690.4) (29.0)
Wines and Spirits 1,920,299.1 1,240,000.0 1,453,151.2 1,365,000.0 1,145,844.7 1,385,000.0 4,519,295.1 3,990,000.0 529,295.1 13.3
Tobacco 777,895.0 1,700,000.0 1,041,352.0 1,780,000.0 387,496.9 1,760,000.0 2,206,743.9 5,240,000.0 (3,033,256.1) (57.9)
Second Hand Motors Vehicles 534,530.4 640,000.0 509,188.1 650,000.0 489,172.2 670,000.0 1,532,890.8 1,960,000.0 (427,109.2) (21.8)
Fuels 47,017,532.9 33,800,000.0 40,030,127.7 33,900,000.0 42,497,429.3 33,800,000.0 129,545,089.9 101,500,000.0 28,045,089.9 27.6
Electric lamp 2,920.1 501.2 386.2 3,807.4 - 3,807.4
Airtime 3,480,298.0 2,708,682.1 2,716,828.7 8,905,808.8 - 8,905,808.8
Value Added Tax (VAT) 70,594,239.6 88,000,000.0 73,943,231.7 82,900,000.0 68,763,122.0 83,100,000.0 213,300,593.4 254,000,000.0 (40,699,406.6) (16.0)
VAT on Domestic Goods 80,152,647.0 55,400,000.0 56,559,197.4 51,200,000.0 63,794,198.2 51,300,000.0 200,506,042.6 157,900,000.0 42,606,042.6 27.0
Imported Goods & Services 31,561,798.4 32,600,000.0 34,933,737.7 31,700,000.0 39,069,015.5 31,800,000.0 105,564,551.5 96,100,000.0 9,464,551.5 9.8
Refunds (41,120,205.7) (17,549,703.4) (34,100,091.7) (92,770,000.8) - (92,770,000.8)
Other indirect taxes 7,092,770.3 9,300,000.0 7,346,688.3 10,400,000.0 7,379,394.8 10,300,000.0 21,818,853.4 30,000,000.0 (8,181,146.6) (27.3)
- - -
Non-tax Revenue 12,467,980.5 15,639,000.0 13,124,685.7 17,066,700.0 9,129,664.9 17,294,300.0 34,722,331.2 50,000,000.0 (15,277,668.8) (30.6)
- - -
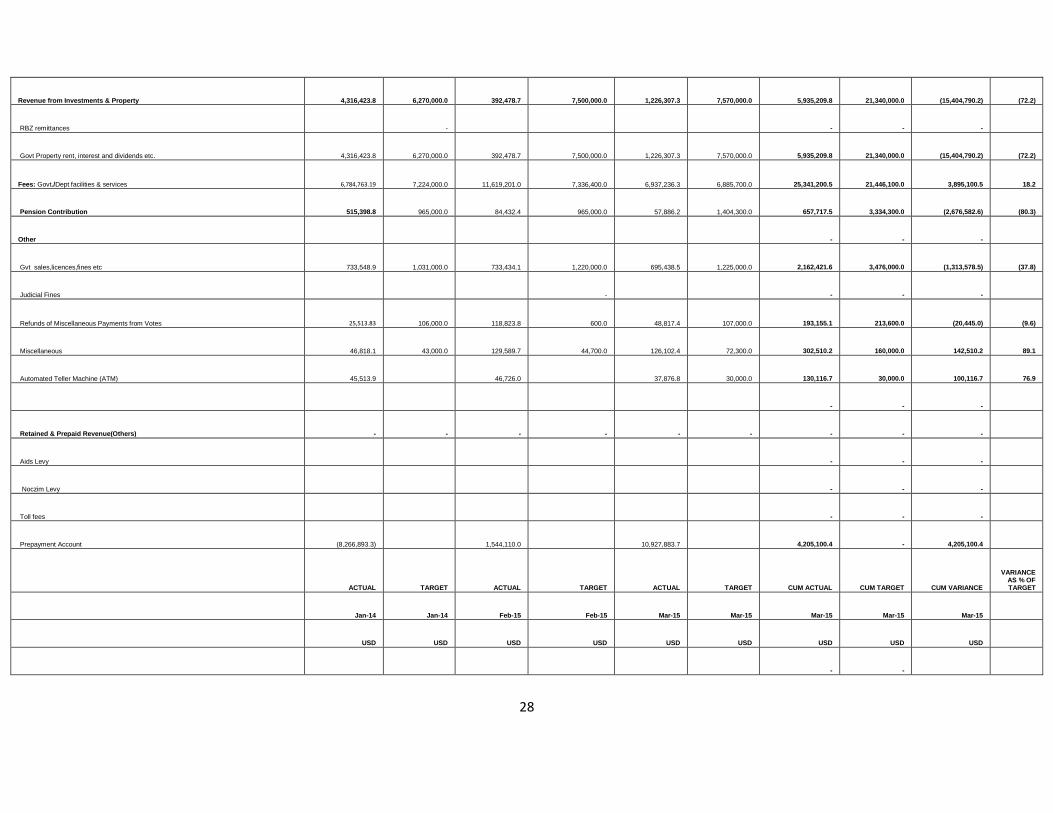
28
Revenue from Investments & Property 4,316,423.8 6,270,000.0 392,478.7 7,500,000.0 1,226,307.3 7,570,000.0 5,935,209.8 21,340,000.0 (15,404,790.2) (72.2)
RBZ remittances - - - -
Govt Property rent, interest and dividends etc. 4,316,423.8 6,270,000.0 392,478.7 7,500,000.0 1,226,307.3 7,570,000.0 5,935,209.8 21,340,000.0 (15,404,790.2) (72.2)
Fees: Govt./Dept facilities & services 6,784,763.19 7,224,000.0 11,619,201.0 7,336,400.0 6,937,236.3 6,885,700.0 25,341,200.5 21,446,100.0 3,895,100.5 18.2
Pension Contribution 515,398.8 965,000.0 84,432.4 965,000.0 57,886.2 1,404,300.0 657,717.5 3,334,300.0 (2,676,582.6) (80.3)
Other - - -
Gvt sales,licences,fines etc 733,548.9 1,031,000.0 733,434.1 1,220,000.0 695,438.5 1,225,000.0 2,162,421.6 3,476,000.0 (1,313,578.5) (37.8)
Judicial Fines - - - -
Refunds of Miscellaneous Payments from Votes 25,513.83 106,000.0 118,823.8 600.0 48,817.4 107,000.0 193,155.1 213,600.0 (20,445.0) (9.6)
Miscellaneous 46,818.1 43,000.0 129,589.7 44,700.0 126,102.4 72,300.0 302,510.2 160,000.0 142,510.2 89.1
Automated Teller Machine (ATM) 45,513.9 46,726.0 37,876.8 30,000.0 130,116.7 30,000.0 100,116.7 76.9
- - -
Retained & Prepaid Revenue(Others) - - - - - - - - -
Aids Levy - - -
Noczim Levy - - -
Toll fees - - -
Prepayment Account (8,266,893.3) 1,544,110.0 10,927,883.7 4,205,100.4 - 4,205,100.4
ACTUAL TARGET ACTUAL TARGET ACTUAL TARGET CUM ACTUAL CUM TARGET CUM VARIANCE
VARIANCE AS % OF TARGET
Jan-14 Jan-14 Feb-15 Feb-15 Mar-15 Mar-15 Mar-15 Mar-15 Mar-15
USD USD USD USD USD USD USD USD USD
- -
29
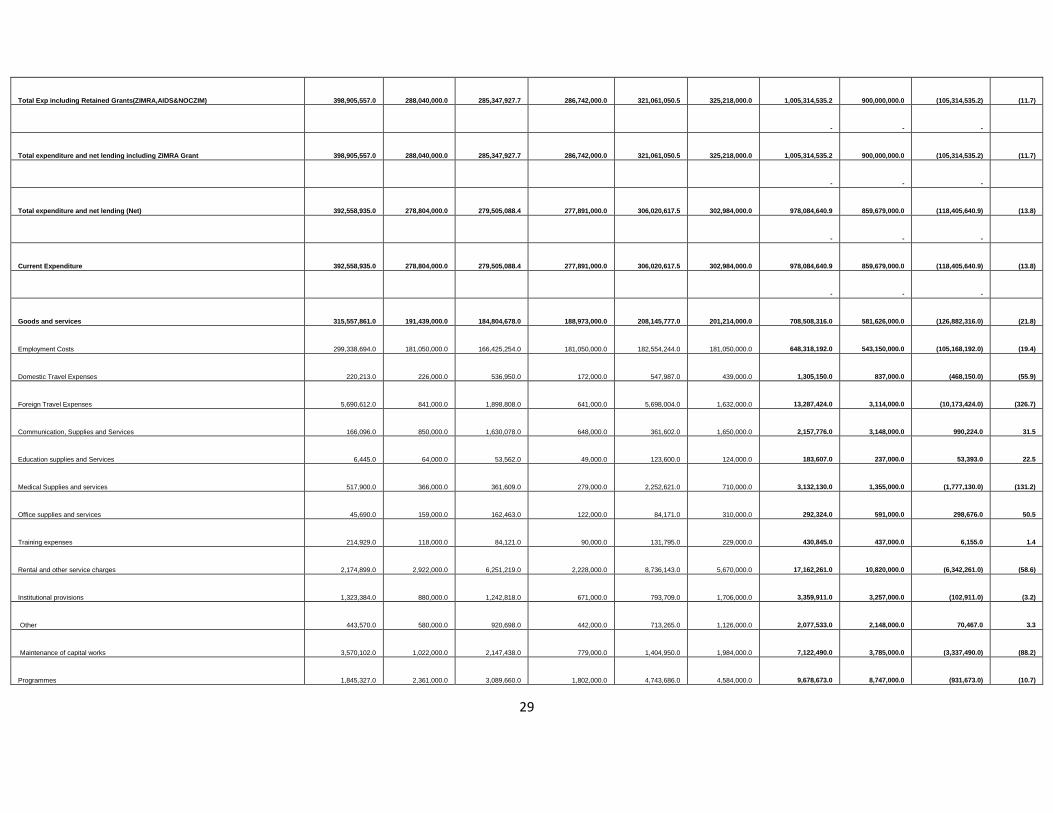
Total Exp including Retained Grants(ZIMRA,AIDS&NOCZIM) 398,905,557.0 288,040,000.0 285,347,927.7 286,742,000.0 321,061,050.5 325,218,000.0 1,005,314,535.2 900,000,000.0 (105,314,535.2) (11.7)
- - -
Total expenditure and net lending including ZIMRA Grant 398,905,557.0 288,040,000.0 285,347,927.7 286,742,000.0 321,061,050.5 325,218,000.0 1,005,314,535.2 900,000,000.0 (105,314,535.2) (11.7)
- - -
Total expenditure and net lending (Net) 392,558,935.0 278,804,000.0 279,505,088.4 277,891,000.0 306,020,617.5 302,984,000.0 978,084,640.9 859,679,000.0 (118,405,640.9) (13.8)
- - -
Current Expenditure 392,558,935.0 278,804,000.0 279,505,088.4 277,891,000.0 306,020,617.5 302,984,000.0 978,084,640.9 859,679,000.0 (118,405,640.9) (13.8)
- - -
Goods and services 315,557,861.0 191,439,000.0 184,804,678.0 188,973,000.0 208,145,777.0 201,214,000.0 708,508,316.0 581,626,000.0 (126,882,316.0) (21.8)
Employment Costs 299,338,694.0 181,050,000.0 166,425,254.0 181,050,000.0 182,554,244.0 181,050,000.0 648,318,192.0 543,150,000.0 (105,168,192.0) (19.4)
Domestic Travel Expenses 220,213.0 226,000.0 536,950.0 172,000.0 547,987.0 439,000.0 1,305,150.0 837,000.0 (468,150.0) (55.9)
Foreign Travel Expenses 5,690,612.0 841,000.0 1,898,808.0 641,000.0 5,698,004.0 1,632,000.0 13,287,424.0 3,114,000.0 (10,173,424.0) (326.7)
Communication, Supplies and Services 166,096.0 850,000.0 1,630,078.0 648,000.0 361,602.0 1,650,000.0 2,157,776.0 3,148,000.0 990,224.0 31.5
Education supplies and Services 6,445.0 64,000.0 53,562.0 49,000.0 123,600.0 124,000.0 183,607.0 237,000.0 53,393.0 22.5
Medical Supplies and services 517,900.0 366,000.0 361,609.0 279,000.0 2,252,621.0 710,000.0 3,132,130.0 1,355,000.0 (1,777,130.0) (131.2)
Office supplies and services 45,690.0 159,000.0 162,463.0 122,000.0 84,171.0 310,000.0 292,324.0 591,000.0 298,676.0 50.5
Training expenses 214,929.0 118,000.0 84,121.0 90,000.0 131,795.0 229,000.0 430,845.0 437,000.0 6,155.0 1.4
Rental and other service charges 2,174,899.0 2,922,000.0 6,251,219.0 2,228,000.0 8,736,143.0 5,670,000.0 17,162,261.0 10,820,000.0 (6,342,261.0) (58.6)
Institutional provisions 1,323,384.0 880,000.0 1,242,818.0 671,000.0 793,709.0 1,706,000.0 3,359,911.0 3,257,000.0 (102,911.0) (3.2)
Other 443,570.0 580,000.0 920,698.0 442,000.0 713,265.0 1,126,000.0 2,077,533.0 2,148,000.0 70,467.0 3.3
Maintenance of capital works 3,570,102.0 1,022,000.0 2,147,438.0 779,000.0 1,404,950.0 1,984,000.0 7,122,490.0 3,785,000.0 (3,337,490.0) (88.2)
Programmes 1,845,327.0 2,361,000.0 3,089,660.0 1,802,000.0 4,743,686.0 4,584,000.0 9,678,673.0 8,747,000.0 (931,673.0) (10.7)
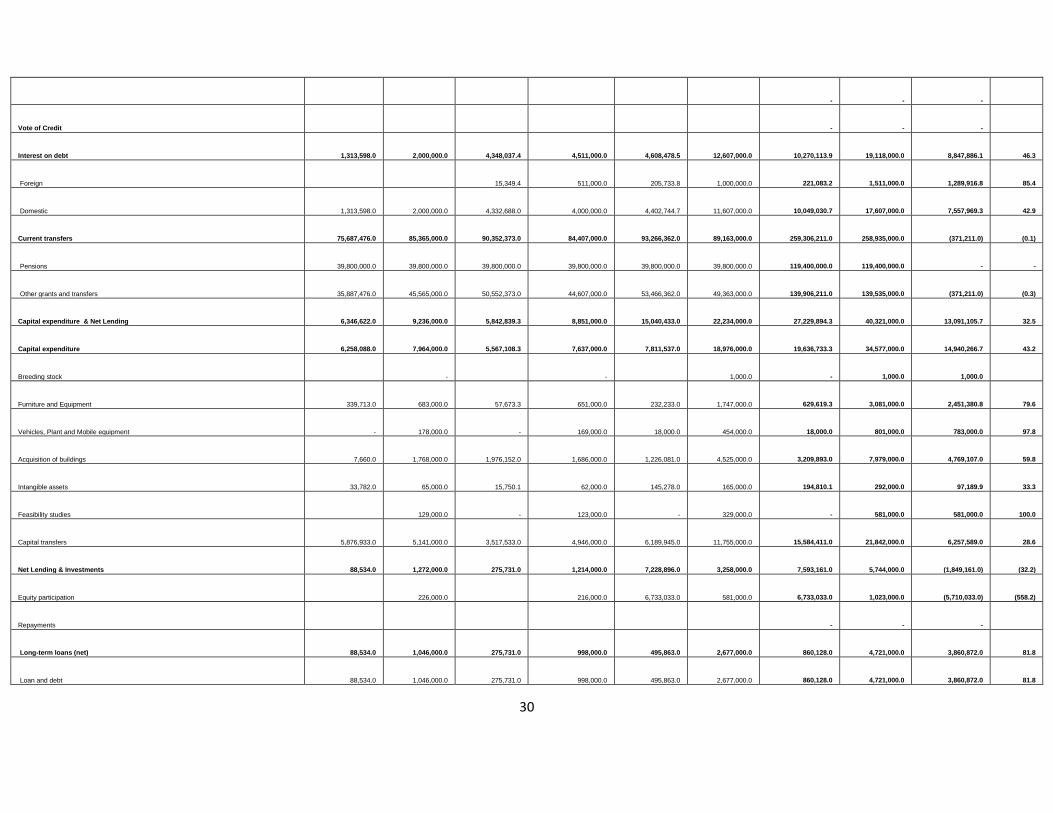
30
- - -
Vote of Credit - - -
Interest on debt 1,313,598.0 2,000,000.0 4,348,037.4 4,511,000.0 4,608,478.5 12,607,000.0 10,270,113.9 19,118,000.0 8,847,886.1 46.3
Foreign 15,349.4 511,000.0 205,733.8 1,000,000.0 221,083.2 1,511,000.0 1,289,916.8 85.4
Domestic 1,313,598.0 2,000,000.0 4,332,688.0 4,000,000.0 4,402,744.7 11,607,000.0 10,049,030.7 17,607,000.0 7,557,969.3 42.9
Current transfers 75,687,476.0 85,365,000.0 90,352,373.0 84,407,000.0 93,266,362.0 89,163,000.0 259,306,211.0 258,935,000.0 (371,211.0) (0.1)
Pensions 39,800,000.0 39,800,000.0 39,800,000.0 39,800,000.0 39,800,000.0 39,800,000.0 119,400,000.0 119,400,000.0 - -
Other grants and transfers 35,887,476.0 45,565,000.0 50,552,373.0 44,607,000.0 53,466,362.0 49,363,000.0 139,906,211.0 139,535,000.0 (371,211.0) (0.3)
Capital expenditure & Net Lending 6,346,622.0 9,236,000.0 5,842,839.3 8,851,000.0 15,040,433.0 22,234,000.0 27,229,894.3 40,321,000.0 13,091,105.7 32.5
Capital expenditure 6,258,088.0 7,964,000.0 5,567,108.3 7,637,000.0 7,811,537.0 18,976,000.0 19,636,733.3 34,577,000.0 14,940,266.7 43.2
Breeding stock - - 1,000.0 - 1,000.0 1,000.0
Furniture and Equipment 339,713.0 683,000.0 57,673.3 651,000.0 232,233.0 1,747,000.0 629,619.3 3,081,000.0 2,451,380.8 79.6
Vehicles, Plant and Mobile equipment - 178,000.0 - 169,000.0 18,000.0 454,000.0 18,000.0 801,000.0 783,000.0 97.8
Acquisition of buildings 7,660.0 1,768,000.0 1,976,152.0 1,686,000.0 1,226,081.0 4,525,000.0 3,209,893.0 7,979,000.0 4,769,107.0 59.8
Intangible assets 33,782.0 65,000.0 15,750.1 62,000.0 145,278.0 165,000.0 194,810.1 292,000.0 97,189.9 33.3
Feasibility studies 129,000.0 - 123,000.0 - 329,000.0 - 581,000.0 581,000.0 100.0
Capital transfers 5,876,933.0 5,141,000.0 3,517,533.0 4,946,000.0 6,189,945.0 11,755,000.0 15,584,411.0 21,842,000.0 6,257,589.0 28.6
Net Lending & Investments 88,534.0 1,272,000.0 275,731.0 1,214,000.0 7,228,896.0 3,258,000.0 7,593,161.0 5,744,000.0 (1,849,161.0) (32.2)
Equity participation 226,000.0 216,000.0 6,733,033.0 581,000.0 6,733,033.0 1,023,000.0 (5,710,033.0) (558.2)
Repayments - - -
Long-term loans (net) 88,534.0 1,046,000.0 275,731.0 998,000.0 495,863.0 2,677,000.0 860,128.0 4,721,000.0 3,860,872.0 81.8
Loan and debt 88,534.0 1,046,000.0 275,731.0 998,000.0 495,863.0 2,677,000.0 860,128.0 4,721,000.0 3,860,872.0 81.8

31
Recoveries - - -
Investments - - - -
Short-term loans (net) - - - - - - - - -
Lending - - -
Recoveries - - -
- - -
ZIMRA Grant - - -
- - -
Other Grants - - - - - - - - -
Noczim Grant - - -
Aids Grant - - -
- - -
ACTUAL TARGET ACTUAL TARGET ACTUAL TARGET CUM ACTUAL CUM TARGET CUM VARIANCE
VARIANCE AS % OF TARGET
Jan-14 Jan-14 Feb-15 Feb-15 Mar-15 Mar-15 Mar-15 Mar-15 Mar-15
USD USD USD USD USD USD USD USD USD
GRANTS - -
- - -
FINANCING 85,530,019.4 - 51,781,254.0 - (53,653,796.4) - 83,657,477.0 - (83,657,477.0)
- - -
Foreign Financing (net) (5,519,667.0) - (150,000.0) - (3,318,450.4) - (8,988,117.4) - 8,988,117.4
Borrowings-SDR - - -
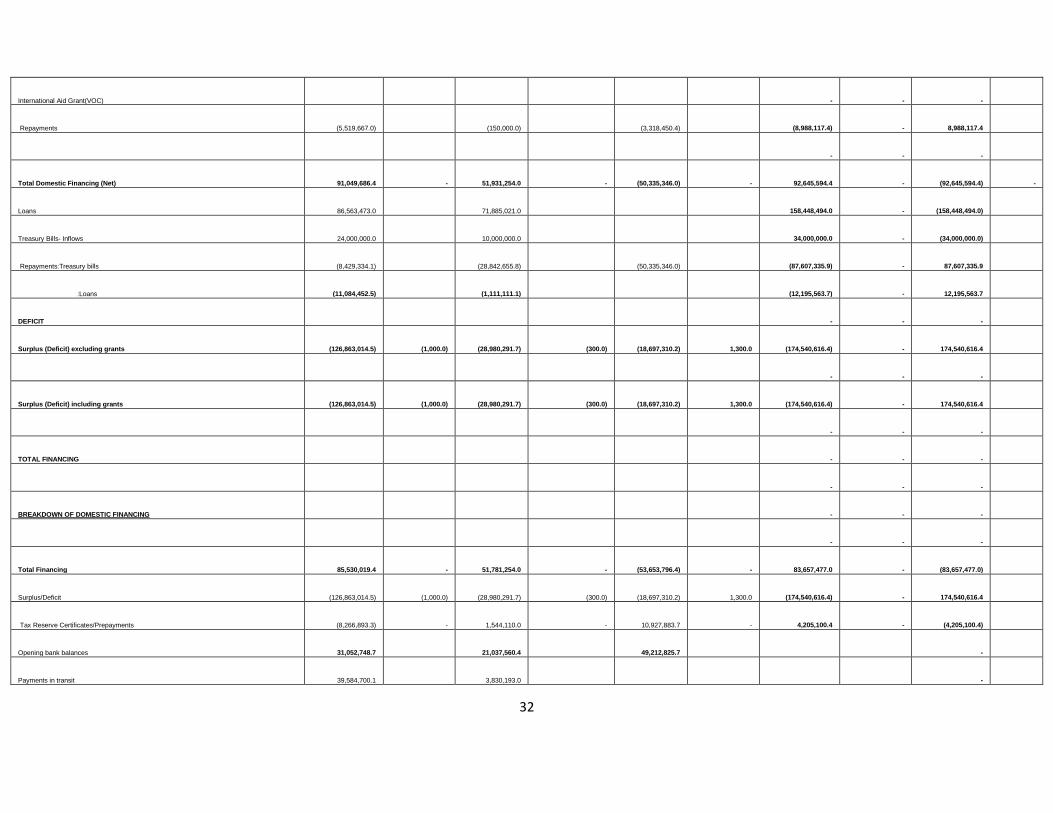
32
International Aid Grant(VOC) - - -
Repayments (5,519,667.0) (150,000.0) (3,318,450.4) (8,988,117.4) - 8,988,117.4
- - -
Total Domestic Financing (Net) 91,049,686.4 - 51,931,254.0 - (50,335,346.0) - 92,645,594.4 - (92,645,594.4) -
Loans 86,563,473.0 71,885,021.0 158,448,494.0 - (158,448,494.0)
Treasury Bills- Inflows 24,000,000.0 10,000,000.0 34,000,000.0 - (34,000,000.0)
Repayments:Treasury bills (8,429,334.1) (28,842,655.8) (50,335,346.0) (87,607,335.9) - 87,607,335.9
:Loans (11,084,452.5) (1,111,111.1) (12,195,563.7) - 12,195,563.7
DEFICIT - - -
Surplus (Deficit) excluding grants (126,863,014.5) (1,000.0) (28,980,291.7) (300.0) (18,697,310.2) 1,300.0 (174,540,616.4) - 174,540,616.4
- - -
Surplus (Deficit) including grants (126,863,014.5) (1,000.0) (28,980,291.7) (300.0) (18,697,310.2) 1,300.0 (174,540,616.4) - 174,540,616.4
- - -
TOTAL FINANCING - - -
- - -
BREAKDOWN OF DOMESTIC FINANCING - - -
- - -
Total Financing 85,530,019.4 - 51,781,254.0 - (53,653,796.4) - 83,657,477.0 - (83,657,477.0)
Surplus/Deficit (126,863,014.5) (1,000.0) (28,980,291.7) (300.0) (18,697,310.2) 1,300.0 (174,540,616.4) - 174,540,616.4
Tax Reserve Certificates/Prepayments (8,266,893.3) - 1,544,110.0 - 10,927,883.7 - 4,205,100.4 - (4,205,100.4)
Opening bank balances 31,052,748.7 21,037,560.4 49,212,825.7 -
Payments in transit 39,584,700.1 3,830,193.0 -
33
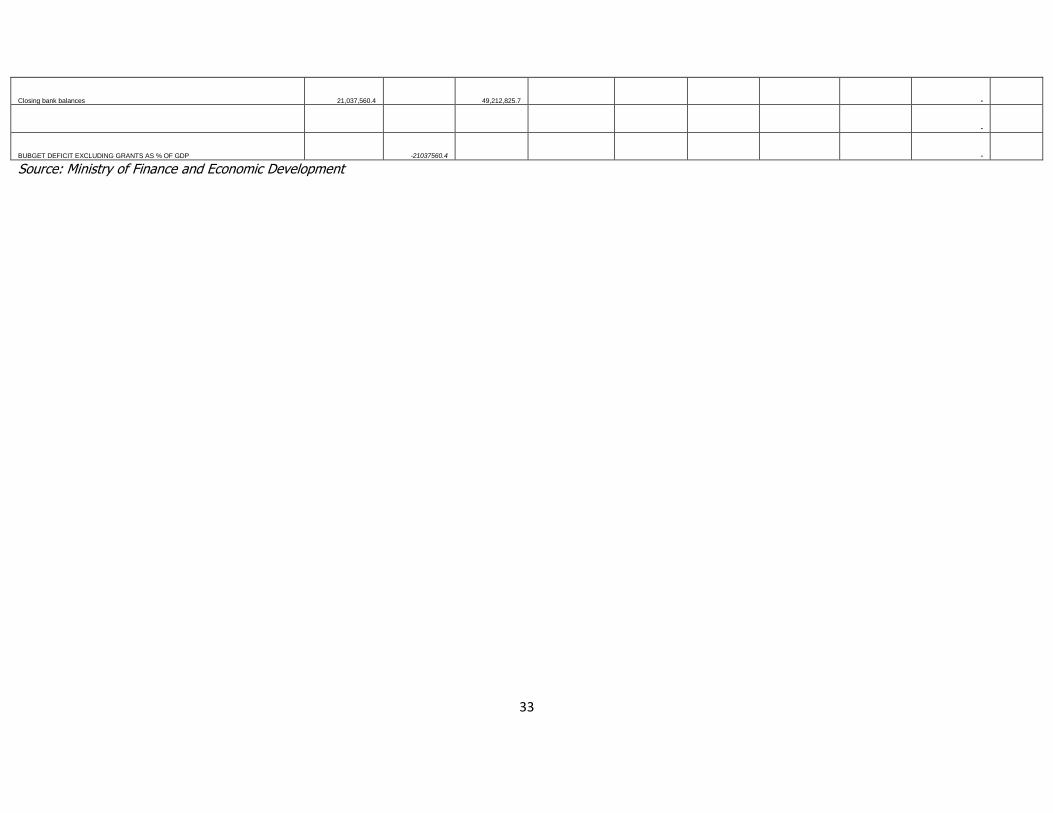
Closing bank balances 21,037,560.4 49,212,825.7 -
-
BUBGET DEFICIT EXCLUDING GRANTS AS % OF GDP -21037560.4 -
Source: Ministry of Finance and Economic Development