TRB 2008-Emerging Roles of the Private Sector in ... · Emerging Roles of the Private Sector in...
25
1 Emerging Roles of the Private Sector in Transportation Asset Management in India Snehamay Khasnabis, Ph.D., P.E. Professor, Dept. of Civil and Environmental Engineering Wayne State University 5050 Anthony Wayne Drive Detroit, MI 48202 Tel: (313) 577-3861 Fax: (313) 577-8171 Email: [email protected] Sunder L. Dhingra, Ph.D. Professor of Transportation Systems Engineering Indian Institute of Technology Bombay Powai, India 400076 Tel: 91-22-2576-7329 Email: [email protected] Sabyasachee Mishra Graduate Research Assistant Department of Civil and Environmental Engineering Wayne State University 5050 Anthony Wayne Drive Detroit, MI 48202 Tel: (313) 577-3803 Email:[email protected] Chirag Safi Traffic Engineer McMohan Associates, Inc. Exton, PA-19341 Phone: (614) 594-9995-Ext. 109 Fax: (610) 594-9565 Email: [email protected] Word Count: 5202 Number of Tables: 7 Number of Figures: 2 Total Count: = 5202+ (9x250)=7452 Date Submitted: July 2007 Submitted for Peer Review and for Compendium of Papers CD-ROM at the Annual Meeting of the Transportation Research Board (TRB) in January 2008, and for Publication in the Journal of TRB
Transcript of TRB 2008-Emerging Roles of the Private Sector in ... · Emerging Roles of the Private Sector in...

1
Emerging Roles of the Private Sector in
Transportation Asset Management in India
Snehamay Khasnabis, Ph.D., P.E.
Professor, Dept. of Civil and Environmental Engineering Wayne State University
5050 Anthony Wayne Drive Detroit, MI 48202
Tel: (313) 577-3861 Fax: (313) 577-8171
Email: [email protected]
Sunder L. Dhingra, Ph.D. Professor of Transportation Systems Engineering
Indian Institute of Technology Bombay Powai, India 400076
Tel: 91-22-2576-7329 Email: [email protected]
Sabyasachee Mishra
Graduate Research Assistant Department of Civil and Environmental Engineering
Wayne State University 5050 Anthony Wayne Drive
Detroit, MI 48202 Tel: (313) 577-3803
Email:[email protected]
Chirag Safi
Traffic Engineer McMohan Associates, Inc.
Exton, PA-19341 Phone: (614) 594-9995-Ext. 109
Fax: (610) 594-9565 Email: [email protected]
Word Count: 5202
Number of Tables: 7 Number of Figures: 2
Total Count: = 5202+ (9x250)=7452 Date Submitted: July 2007
Submitted for Peer Review and for Compendium of Papers CD-ROM at the Annual Meeting of the Transportation Research Board (TRB) in January 2008, and for Publication in the Journal of
TRB

2
Emerging Roles of the Private Sector in
Transportation Asset Management in India By
S. Khasnabis, S.L. Dhingra, S. Mishra, and C. Safi
ABSTRACT
In this paper, the authors examine the emerging roles of the private sector in transportation infrastructure programs/asset management strategies in India. Roles identified vary from those of a financier to an operator that may result in successful joint public-private ventures, particularly in developing countries. A case study involving such a joint venture in India, the Mumbai Pune Expressway/National Highway 4 (MPEW/NH4) is presented, and fiscal implications of the program, both from the perspective of the public and the private enterprise are examined. The study concludes that if properly planned, such joint ventures can be mutually beneficial. A joint public-private program may enable the public sector to use the resources saved for other public projects. It also provides the private agency the opportunity to invest monies in a profitable enterprise that also yields social benefits, e.g. improving mobility, economic development, etc. Careful analysis must be conducted before the project is undertaken to ensure that the project continues to yield benefits, after the private sector fulfills its obligations, and that the project does not become a public burden.

3
A. INTRODUCTION
Transportation agencies worldwide invest large amounts of monies to build, operate, maintain and upgrade the physical infrastructure under their jurisdiction. Clearly, judicious investment at the local, regional, and national level is a key to the success of such programs. Since the last decade that the concept of “Asset Management” in transportation has been gaining momentum. Asset Management in the context of transportation, can be defined as a systematic process of constructing, upgrading, and maintaining assets, combining sound engineering and economic principles to facilitate an organized approach to make prudent investment decisions (1,2). While the private industry has a long track record of using asset management techniques, it is only in the recent past that the public sector has attempted to apply these principles in transportation investment decisions. Current U.S. policies clearly indicate that future transportation investment decisions must carefully examine the implication of alternate asset management principles (2). Reasons are manifold. Most important is the realization that proper use of asset management techniques will result in optimal benefits to the users when all factors are considered together. Besides the U.S., a number of other countries including many in Europe, Australia, Canada, New Zealand, and lately India, have been adopting asset management principles in their transportation investment decisions (3,4). The topic of this paper is ‘Public-Private Participation in Transportation Asset Management in India.’ Background Information
The multi billion dollar highway infrastructure in the US was built over the last 200 years and has been financed primarily by public dollars through various forms of user taxes (5). Factors such as improved mobility, reduced congestion, and higher safety, along with economic benefits have been used to justify these investments. Tollways and turnpikes, regardless of tenure, constitute a very small fraction of US highways, and are somewhat of an exception to this rule. Typically, these facilities are financed by long-term bonds, and the revenue generated by the facilities is used to pay for the investment. Very little, if any, private funding has been used in the US for roadway infrastructure. Private participation is, however, more common in other modes of transportation, particularly rail, air and transit (and prior to 1950s). By contrast, the private sector is being increasingly involved in transportation infrastructure development in India, even though, historically, India has used tax revenues as the primary source of funds for road projects. A recent World Bank Report shows that India currently has 3.5 million km of roads, of which approximately 170,000 kilometers (kms) are under the national and state highway category (mostly two-lane facilities), representing modest design standards (6). The National Highway System totaling 58,000 km of two-lane facilities, carries 45% of total traffic. In spite of significant Government expenditure on roads in recent times, there is a great need today for high quality, high capacity highways to accumulate the ever-increasing traffic in metropolitan areas. Among major transportation programs that the Government has undertaken are; a 50 billion dollar highway improvement for the National and State

4
Highway System and another multi billion dollar program to connect small villages through a network of roadways. Additionally, $ 1.5 billion is needed annually to maintain the 170,000 km of National and State Highways that serve as the backbone for regional mobility and economic development. But resources needed to support the construction and maintenance of this massive infrastructure development are not readily available at the Governmental exchequer. As the aforementioned World Bank Report mentions, “All of these expenditures have to be financed within a current fiscal environment of high government deficits, amounting to 9.5% of GDP” (6) India has in the past, used the traditional approach of road financing, where roads are treated as publicly owned/operated facilities, and are funded from a myriad of sources including general revenue, road user taxes, etc. It is only in recent times, that tolls are being applied to generate revenues. Private sector financing is being sought to fund infrastructure programs. However, private sector financing “can not replace the role of the public sector, nor can it reduce the importance of rational, fair and transparent public financing system” (6). Thus, joint public-private ventures appear to be the key to the financial success of such projects.
Purpose of the Paper
The purpose of this paper is two-fold. First, a brief discussion is presented on the emerging roles of the private sector in transportation infrastructure development in India, with specific examples when possible. Second, a case-study on the recently completed Mumbai-Pune Expressway (MPEW), and a companion facility along the National Highway 4 (NH4) is presented, where the private sector has been called upon to play a major role in the long term operation of these two facilities. The financial implication of this role, both to the public and private entity is examined and conclusions drawn about the future roles of the private sector. B. ROLE OF THE PRIVATE SECTOR
Public/Private partnership is a technique to attract private capital in a public project that would otherwise be beyond the reach of the public entity. It has been used both in developing and developed countries as a means of delivering, operating and maintaining infrastructure projects, such as bridges, highways, urban rail systems, and power plants. Examples include involvement of the private sector in: the SR-125 project in San Diego County California (7), the city of Cleveland for the long term sustainable development (8), a road rehabilitation and expansion project in Orange County California (9), a large city link toll road project in Melbourne, Australia (10), a light-rail transit system in Portland, Oregon (11), tunnel projects in Hong Kong (12), and a series of toll bridge projects in India (13). Our literature review indicates a number of ways in which the private sector can be involved in transportation asset management. Based upon our discussions with experts in India, it appears that the private sector has been involved in two ways in India: in the role of a lender, and in the role of a promoter.
5
The Role of a Lender
In this role, the private entity acts as a financier and is interested in the project, primarily from an investment point of view, where profit margins are expected to be high. Depending on the size of the project, the private entity can be a single investor; or a group of investors; a corporation; a banking institution or a group of corporations/institutions. The private entity, depending on the agreement, may or may not participate in the policy-making activities of the Principal/Organization seeking the loan. An example of this role in India can be found in urban rail systems currently being built in Delhi Metropolitan Area (the nation’s capital) by the Delhi Metropolitan Rail Corporation (DMRC). This is a multi-phase urban rail transit designed to meet projected traffic demand for the year 2021, consisting of 8 stations and 244 km of rail network to be built in four phases. Phase 1 of the project has recently been completed and includes a combination of underground, elevated and at-grade sections comprising 65 km and 59 stations (14). A group of Japanese Banks, led by Japan Bank for International Corporation (JBIC), is a major financier for the project, and is expected to cover more than 60% of the project cost with a “soft loan” (15). Property development along the rail corridor is expected to generate significant revenue for this project (16).
The Role of a Promoter
A Promoter may participate under the Build Own Operate Transfer (BOOT) program and to raise capital funds from private resources and build and operate the facility in exchange of future revenues to be generated by the project. It has been used extensively in Europe and more recently in India and is defined as (17,18):
“A project based on the granting of a concession by a Principal, usually a government, to the Promoter, sometimes known as the Concessionaire, who is responsible for the construction, financing, operation and maintenance of a facility over the period of concession before finally transferring the facility, a no cost to the Principal, as a fully operational facility. During the concession period the Promoter owns and operates the facility and collects revenues to repay the financing and investment costs, maintain and operate the facility and make a margin of profit”.
The concession agreement precisely defines the roles and responsibilities of the participating agencies, particularly the Principal, the Promoter, and the support agencies. BOOT projects are essentially turnkey contracts financed by the contractor, with extended operation and maintenance periods. If the project is planned properly, the Principal or the Government agency has nothing to lose, as it essentially inherits a free facility that is “fully operational”, at the end of the concession period. It is however important for the Governmental agency to ensure that the facility continues to generate revenue at the end of the concession period without a major investment of resources. The private entity on the other hand, can take advantage of an investment opportunity, and generate a healthy return over the concession period.

6
Variations of the BOOT concept have been used in different countries in many different forms, as stated below: FBOOT finance-build-own-operate-transfer; BOO build-own-operate; BOT build-operate-transfer; BOL build-operate-lease; DBOM design-build-operate-maintain; DBOT design-build-operate-transfer; BOD build-operate-deliver; BOOST build-own-operate-subsidies-transfer; BRT build-rent-transfer; BTO build-transfer-operate; ROT rebuild-operate-transfer LOT Lease-operate-transfer Among the concepts outlined above, the last two, ROT and LOT have been used in India. The rebuilding part of the ROT program can be in the form of upgrading the facility by improving the pavement, geometric/operational features; and/or expanding the current facility by such actions as: adding lanes, adding shoulders, building grade-separated structures, etc. In exchange for the capital investment by the private entity, it is allowed to operate the facility and collect toll charges during the concession period, and thereby recover its investment costs. The public entity is spared the investment cost as well as the task of operating the facility during the concession period. The case of the National Highway 4 (NH4), connecting Mumbai with Pune discussed later in case study, is an example of this program.
The Lease, Operate & Transfer (LOT) program is another derivative of the BOOT concept whereby the private entity leases an existing facility for a specified amount, operates the system for the concession period, and transfers the operational rights of the facility to the Principal at the end of the prescribed period. Technically, the public entity “sells” the operational rights of the facility to private agency for a negotiated price. In exchange, the private agency “earns” the right to collect and retain the toll charges as its earnings from the investment. The facility must be returned to the government in fully operational condition at the end of the prescribed term. The Mumbai-Pune Expressway (MPEW) discussed in the next section is an example of the LOT concept. C. CASE STUDY OF MPEW and NH4
Mumbai is the commercial and financial capital of India with a population of more than 15 million. Pune is the cultural capital of the state of Maharashtra, and is growing into a major industrial and commercial center, being the automotive capital of India. Hence, the importance of Mumbai-Pune travel corridor increased tremendously in last decade. The travel demand is currently served by a multimodal system comprising rail, air and highways. The road traffic demand warrants a ten-lane system between the two cities (19).

7
Background Information
For a long time, the National Highway 4 (NH4) was the only available roadway connecting the two cities. This section of NH4, a two-lane roadway built to modest design standards, is a part of the National Highway System and is one of the most congested facilities in the country. The poor operating condition on NH4 made it necessary for the Maharashtra Government to build an independent toll expressway, as this travel corridor represents the economic backbone of the region. The Maharashtra State Road Development Corporation (MSRDC), an agency of the state Govt. built the Mumbai Pune Expressway (MPEW), a six-lane facility with high design standards in 2000 and was authorized to collect tolls from road users (19). MSRDC has invested $525 million (Rs. 2100 crores) over a four year period to construct the 95 km long six-lane carriageway using high design standards and modern machineries. MPEW was opened to traffic as a toll facility in the year 2001. It should be noted that a foreign exchange conversion rate of 40 Indian Rupees per US Dollar was used in this paper.
FIGURE 1 MPEW and NH4 between Mumbai and Pune (Source: Ref. 19)
In the year 2004, MSRDC entered into an agreement with the private operator to operate, maintain and collect tolls on MPEW and to rebuild, maintain, operate and collect tolls on NH4, both for a period of 15 years (2005-2019). Further, the private operator paid MSRDC $ 225 million (Rs. 900 crores) and agreed to invest necessary capital to upgrade NH4 to a four-lane facility. The MPEW and the NH4 projects can thus be designated as a LOT and a ROT projects respectively, in the light of the discussion presented in the previous section. During lease period, the private entity was required to widen NH4 from two lanes to four lanes and open the facility to traffic in 2007. MPEW and NH4 are to be delivered to MSRDC and Govt. of Maharashtra respectively in 2020 in fully operational condition. MSRDC will resume its role of operating and maintaining MPEW for the remainder of its service life up to the year 2030. Since NH4 is an older facility, it was assumed for the purpose of this case study, that NH4 will not have any further life left after 2019. Realistically however, to meet the traffic demand, the Govt. of India may be required to
NH4
MPEW MPEW
TO MUMBAI
TO PUNE

8
make significant investment to keep the facility operational. No decision on the disposition of MH4 beyond 2019 has been made at this point. Table 1 shows the traffic and other key features of the two facilities obtained mostly from MSRDC. Six categories of vehicles, with different toll rates and operating characteristics were considered: Car, Light Commercial Vehicles (LCV), Truck, Bus, 3 Axle (3AX), and Multi Axle (MA). LCV, Trucks, 3AX and MA are generally used for freight transportation. As explained earlier a total of $525 million (Rs 2100 crores) was invested in the MPEW facility during the period 1997-2000. Per MSRDC estimates, approximately 20% of the capital cost ($ 525 million) was incurred at the end of the first and fourth year and 30% was incurred at the end of the second and third year. The cost of improving NH4 to a four lane facility was estimated as $100 millions, mostly invested in 2004. TABLE 1 General Information on Alternative Characteristics
Facility Characteristics Car LCV Truck Bus 3AX MA
MPEW (2001) 3,071,765 337,116 1,221,929 441,184 117,142 44,398
NH-4 (2005) Traffic
(Annual Vehicles) 2,825,210 1,253,569 1,238,703 628,216 204,481 168,984
MPEW 5.709% 9.476% -8.080% 0.078% 1.451% 3.384%
NH-4 Growth (%)
2.738% 2.655% 1.944% 2.785% 7.474% 20.899%
MPEW 70 60 60 60 60 60
NH-4 Posted Speed Limit
(Km/hr) 55 50 45 45 45 45
MPEW 3 5 6 9 15 20
NH-4 Toll Rate
($) 2 3 4 6 10 13
MPEW 95 km
NH-4 Length (Km) 104 km
MPEW 6 lanes
NH-4 Lanes 4 lanes
MPEW Asphalt Concrete
NH-4 Pavement Type Bituminous
Method of Analysis
The Internal Rate of Return (IRR) method of analysis was used, that provides an estimate of the return or yield of the investment, given a set of expenditure and revenue data along with their expected dates over the life of the project. It is defined as the interest rate at which the Net Present Worth (or Net Annual Worth or Net Future Worth) of the investment is equal to zero. The algorithm used symbolically is:
“Estimate the interest rate ‘i’ at which the Net Present worth (NPW) of the investment = 0”, or “Present worth of Costs = Present worth of Benefits”
The procedure to estimate ‘i’ is heuristic one, by which the ‘i’-value is sought at which the NPW approaches a zero value. This is accompanied by systematically
9
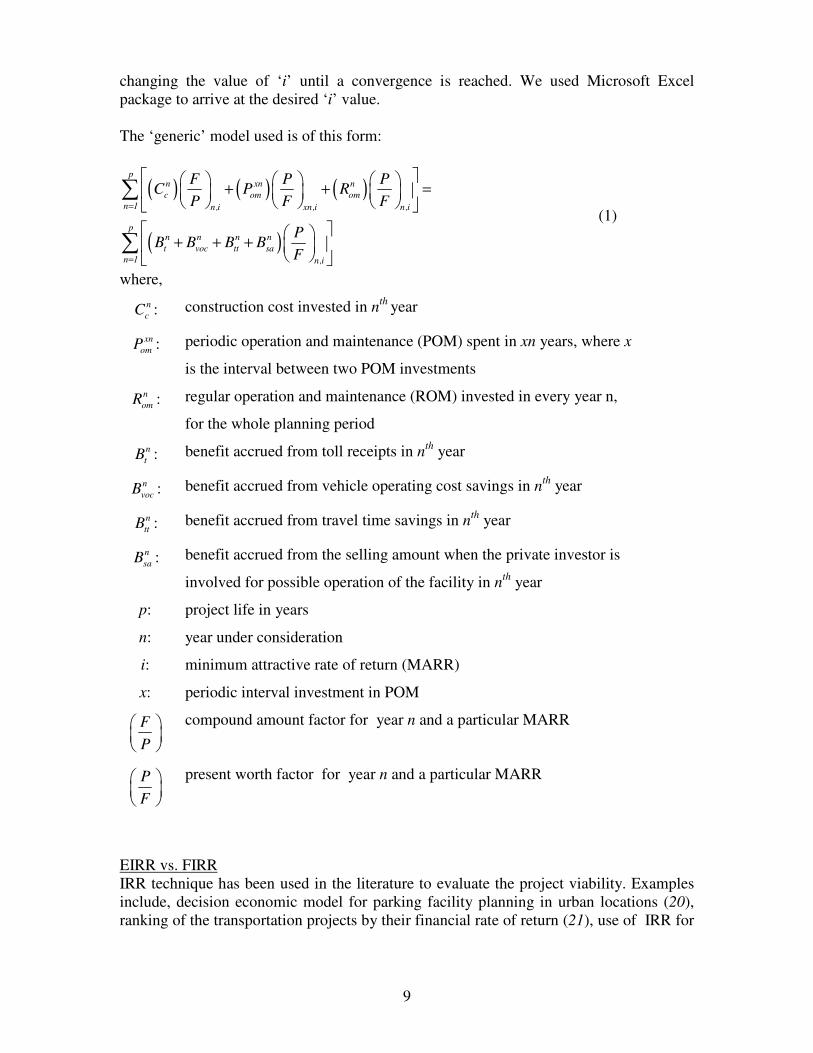
changing the value of ‘i’ until a convergence is reached. We used Microsoft Excel package to arrive at the desired ‘i’ value. The ‘generic’ model used is of this form:
( ) ( ) ( )
( )
pn xn n
c om om
n 1 n,i xn,i n ,i
pn n n n
t voc tt sa
n 1 n,i
F P PC P R
P F F
PB B B B
F
=
=
+ + =
+ + +
∑
∑ (1)
where,
n
cC : construction cost invested in nth year
xn
omP : periodic operation and maintenance (POM) spent in xn years, where x
is the interval between two POM investments
n
omR : regular operation and maintenance (ROM) invested in every year n,
for the whole planning period
n
tB : benefit accrued from toll receipts in nth year
n
vocB : benefit accrued from vehicle operating cost savings in nth year
n
ttB : benefit accrued from travel time savings in nth year
n
saB : benefit accrued from the selling amount when the private investor is
involved for possible operation of the facility in nth year
p: project life in years
n: year under consideration
i: minimum attractive rate of return (MARR)
x: periodic interval investment in POM
F
P
compound amount factor for year n and a particular MARR
P
F
present worth factor for year n and a particular MARR
EIRR vs. FIRR IRR technique has been used in the literature to evaluate the project viability. Examples include, decision economic model for parking facility planning in urban locations (20), ranking of the transportation projects by their financial rate of return (21), use of IRR for

10
a series of economic evaluation projects (22), for testing the feasibility of multiple agency development projects at proposed transit stations (23). For joint public private projects, questions are often raised about the inclusion of externalities, or social costs/benefits. Externalities include environment damages, pollution, savings in travel time, travel cost, etc., that are not reflected in the markets (24). It is customary to ignore these externalities in any analysis dealing with the private sector, as these do not affect the private sector’s decision. The term used for this return is Financial Internal Rate of Return (FIRR), where only the direct expenditures and revenues are included. For the public sector, two sets of returns are generally estimated. First, the FIRR is used to benchmark public sector performance with that of the private sector. An additional analysis that includes the externalities (both costs and benefits) is conducted to estimate the Economic Internal Rate of Return (EIRR). The definitions of EIRR and FIRR are as follows: EIRR: The rate of return that would be achieved on all project resource costs, where all benefits and costs are measured in economic prices (25). For a project to be acceptable the EIRR should be greater than the economic opportunity cost of capital. FIRR: The rate of return that would be achieved on all project costs, where all costs are measured in financial prices and when benefits represent the financial revenues that would accrue to the main project participant (25). It should be compared with the opportunity cost of capital, or the weighted average cost of capital, to assess the financial sustainability of a project. In this paper, we report two broad categories of analysis, (1) for the private entity, and (2) for the public entity. Following the principles prescribed above, for the private entity, the only benefit considered were the toll receipts for FIRR analysis. For the public entity, benefits include only the toll receipts for FIRR analysis. Additionally savings in vehicle operating cost (VOC), and savings in travel time (TT) were included in the EIRR analysis. These savings were compiled based upon a “Do-Nothing Alternative”, that is continued reliance of the old NH4 as the only possible means of roadway transportation between Mumbai and Pune. For both the private and public entity, costs include: capital cost, regular (annual) operating and maintenance cost, as well as periodic operating and maintenance cost. Procedures for Estimating Costs and Benefits
While the cost, data on toll, charges, volume, expected growth, etc., were derived directly from MSRDC, savings in VOC were computed utilizing a comprehensive procedure developed by the Central Road Research Institute (CRRI), Government of India (26). A detailed discussion of this procedure is beyond the scope of the paper. This procedure, which consists of a set of sequential steps of deriving parameters through use of the

11
models, calibrated with Indian roads and traffic conditions. The calculation of VOC and TT is summarized below. The operation cost is determined by the pavement roughness, rise and fall, and the carriageway width available for movement of traffic for various road types. Roughness contains other deterioration characteristics such as cracking, rutting , patching, raveling and potholing. The roughness model used is described below
t 0 tR R Nφ= + (2)
( )1/ 3 1 / 3
10
1250
anti log a b 1.3841φ =
− + (3)
2a 0.20209 23.1318C 4.809C= + − (4)
2b 0.20209 23.1318C 4.809C= + + (5)
C 2.1989 MSN= − (6)
( )N
2CBR CBR
10 10
1
MSN a D 3.51 log 0.85 log 1.43ω ω
ω=
= + × − −∑ (7)
M6 m m
t t f d
m 1
N 10 y lγ−
=
= ∑ (8)
miVOC
e 1 2 t 3 4log c c R c RF c W= + + + (9)
nMc ql d= (10)
M
mm m
t t c
m 1
T v o t=
=∑ (11)
where,
Rt: roughness at time period t
R0: initial roughness
Nt: number of millions of standard axles at time period t
φ : estimated coefficient for calculation of Rt
a,b, and c: parameters to calculate φ

12
MSN: modified structural number
aω : the strength coefficient for layer ω
Dω : the thickness of layer ω in inches
N: total number of layers in the pavement
CBR: California Bearing Ratio of the subgrade
m
ty : annual traffic volume for mode m at year t
m
fγ : truck factor for mode m
ld : lane distribution factor
VOC: vehicle operating cost
RF: rise and fall of the pavement in m/km
W : width of carriage way in meters
c1… c4: calibrated coefficients to calculate vehicle operating cost
Mc : maintenance cost in rupees
q : maintenance cost in rupees per lane per kilometer per year
ln: number of lanes available for vehicular operation
d: total distance of roadway in km
M: total number modes in operation for the facility
tT : total travel time savings
m
tv : value of travel time per hour for mode m
m
co : occupancy of mode m
mt : travel time needed to traverse the facility for mode m
Equation (2) is used to obtain roughness of the pavement surface. The necessary values of previous year roughness, number of millions of standard axles and its coefficients are required to calculate the parameter m. Equations (4-6) are applied to find m which is represented in equation (3). Equation (3) requires Modified Structural Number (MSN) to calculate C. MSN is a pavement characteristic which is a function of depth of pavement layers, layer coefficients and California Bearing Ratio (CBR). Equation (8) determines number of Millions of Standard Axles (MSA), to be used in equation (2). Traffic consist of various modes, so truck factors are used to convert all modes to number of standard axles. Annual traffic volume is multiplied by corresponding truck factors (for Indian conditions, obtained from CRRI) and lane distribution factor to obtain MSA. Equation (9) is used to calculate vehicle operating cost in dollars per kilometer for a roadway facility, with specific roughness, rise and fall and width of carriageway. Annual Maintenance Cost (MC) is calculated by multiplying the cost per

13
unit distance per lane with the total length of the roadway (Equation 10). Equation (11) represents value of travel time (TT) savings for all modes for a particular year t. Results
The savings in VOC and TT (for the two candidate alternatives, MPEW and NH4 with respect to the NH4 (old) or the base conditions), computed according to the CRRI procedures are presented in Table 2 and Table 3. In Table 2, the parameters computed for each of the three facilities (MPEW, NH4 and NH4 (old)) for five vehicular categories are represented in columns 3, 4, 5, and 6. These were used to estimate VOC’s as shown in column 7. Column 8 in Table 2 shows the savings in VOC for the two candidate facilities, MPEW and NH4. The last four columns of Table 2 show the operating cost, maintenance cost, total operation and maintenance cost, and savings in VOC for the base year using the CRRI procedure. TABLE 3 Value of Travel Time Savings
Facility Mode
Travel time
savings (min)
Unit value of travel time ($/hr)
Value of travel time
saved ($)
Total Value of Travel Time
Saved (Million $) for the base year
Cars 75 3.25 4.06
LCV 50 1.50 1.25
Buses 60 8.75 8.75
HCV 70 1.88 2.19
3A 70 1.88 2.19
MP
EW
MA 70 1.88 2.19
19.79 (2001)
Cars 50 3.25 2.71
LCV 33 1.50 0.83
Buses 40 8.75 5.83
HCV 47 1.88 1.46
3A 47 1.88 1.46 NH
4 (
New
)
MA 47 1.88 1.46
15.33 (2005)
Table 3 shows the savings in TT for the two candidate facilities, using standard hourly rates for the five vehicular groups considering average vehicular occupancy derived from CRRI. Additionally, Table 3 shows the total value of the travel time saved for the base year in the last column

14
TABLE 2 Savings in Vehicle Operating Cost
FACILITY (1)
MODE (2)
c1
(3) c2
(4) c3
(5) c4
(6)
VOC $/100Km
(7)
Savings in VOC
($/100Km) (8)
Operation Cost (Million $)
(9)
Maintenance Cost
(Million $) (10)
Total O&M Cost
(Million $) (11)
VOC Savings
(Million $)
(12)
Car 0.082 0.038 0.008 3.033 4.010
LCV 0.618 0.027 0.010 5.069 7.759 Truck 0.886 0.024 0.006 6.515 10.037
Bus 0.775 0.021 0.009 5.833 8.718 MPEW
3AX & MA 1.380 0.017 0.014
NA
10.651 14.725
7.29 (2001)
0.14 (2001)
7.44 (2001)
31.42 (2001)
Car 0.336 0.056 0.010 4.828 2.215 LCV 0.748 0.027 0.012 6.822 6.007
Truck 1.176 0.031 0.009 10.148 6.403
Bus 0.956 0.031 0.010 8.270 6.281
NH-4 (New)
3AX & MA 1.384 0.022 0.013
NA 12.940 12.435
5.71 (2005)
0.10 (2005)
5.81 (2005)
32.43 (2005)
Car 1.381 0.083 0.013 -0.115 7.043 LCV 1.643 0.027 0.013 -0.039 12.828
Truck 2.072 0.041 0.010 -0.065 16.552 Bus 1.935 0.046 0.012 -0.070 14.551
NH-4 (Old)
3AX & MA
2.726 0.030 0.014 -0.050 25.376
- - - -

15
Public Entity Perspective Figure 2(a) and 2(b) show the cash flow diagrams reflected in the economic analysis for the MPEW and NH4 projects respectively from the public entity’s perspective. Corresponding results are presented in Table 4. Case (a) of Table 4 shows that the FIRR and EIRR generated for the MPEW project for the public entity are 5.07% and 13.95% (columns 10 and 11) respectively. Corresponding figures for NH4 are shown in case (b). Since the public entity did not invest any money on the project, and does not receive any toll, the FIRR calculation is not applicable (NA). By the same token, the public entity is deriving the savings in VOC and in TT without any investment, so that corresponding EIRR is very high or infinity. A number of other analyses are presented in Table 4. Case (c) shows the analysis for the (now) hypothetical case of public entity continuing to operate MPEW without any private investment whatsoever. In that case, the expected FIRR and EIRR for the public entity would have been 7.05% and 14.75% respectively, both considerably higher than their corresponding values of 5.07% and 13.95% under current operation. This is expected, as the public entity must be ready to share the project returns with its partners to attract private capital. The differential between the two EIRR’s/FIRR’s can be looked upon as the “price” paid by the public entity to secure private participation. Case (d), Table 4 shows that if current operating plan for MPEW were to be continued over the life of the project, i.e. if the private entity is allowed continue the operation of MPEW beyond the year 2019 (up to the year 2030), the minimum “asking price” by the public entity will be $524.31 millions in the year 2019 (column 6) for it to earn the same FIRR of 5.07%. Stated differently, the private entity must be wiling to pay a minimum of $ 524.31 million to the public entity to continue to operate MPEW and collect toll beyond the year 2019 up to the year 2030. Case (e) of Table 4 shows the combined FIRR and EIRR to the public entity from the two plans under current operating plans are 5.07% and 16.32% respectively. Since the public entity neither invests any money in the NH4 project, nor receives any direct benefit, the combined FIRR to the public entity from the two projects is the same as the FIRR from MPEW. However, the combined EIRR is higher because of the additional external benefits (savings in VOC and TT) at no extra cost. Lastly, case (f) shows that a combination of current NH4 operation and the hypothetical scenario of MPEW, without any private involvement will result in 7.05% and 17.89% of FIRR and EIRR respectively. As expected, for case (f), the FIRR is the same as in case (c), while the EIRR has increased from 14.75% to 17.89%. Private Entity Perspective: Figure 2(c) and 2(d) represent the cash flow diagrams from the private entity’s perspective for the two facilities as currently planned and implemented. The corresponding results are shown in Table 5. Since no external benefits are involved (being the private entity’s perspective), only FIRR values are calculated as 12.77% and 33.05% for MPEW and NH4 respectively, with a combined FIRR of 20.21%. The NH4

16
project generates much higher return than the MPEW project, because it requires much smaller investment, and provides much higher comparative benefit. Sensitivity and Scenario Analysis An additional set of analyses was conducted to test if the procedure/methods used to estimate the project returns from the perspective of public and private entity are sensitive to the changes in key variables. Table 6 shows that an increase in operating cost, reduction in volume, and reduction in toll rates, considered one factor at a time, will result in reduction in the EIRR’s and FIRR’s (where appropriate), both for the public and private entity for the two facilities. Also, Table 6 shows that an increase in toll rate will result in increase in EIRR and FIRR. Additionally, a set of scenario analysis, with each scenario comprising changes in all three factors together (operation and maintenance cost, traffic volume and toll rates), is reported in Table 7. Table 7 shows that resultant changes in the EIRR and FIRR do follow expected trends. For example, the joint effect of an increase in O&M cost, a decrease in traffic volume and a decrease in toll rate (Scenarios 1, 2, and 3) will result in a decrease of EIRR and FIRR. Similarly, an increase in traffic volume, and an increase in toll rates (Scenario-4) result in an increase in FIRR and EIRR., suggesting that the positive effect of toll increase “outweighs” the adverse effect of higher volume (resulting in higher operation and maintenance cost).

17
(a) Economic and financial aspects of the public entity for MPEW-Existing Scenario
(b) Economic and financial aspects of the public entity for NH-4
FIGURE 2 Example cash flow diagram: economic and financial aspects for public and private entity for MPEW and NH4
(Current Operation)
Note:
Receipts
Expenditures
Receipts
Expenditures

18
(c) Financial aspects of the private entity for MPEW
(d) Financial aspects of the private entity for NH4 FIGURE 2 Example cash flow diagram: economic and financial aspects for public and private entity for MPEW and NH4
(Current Operation)
Note: Receipts
Expenditures
Receipts
Expenditures

19
TABLE 4 Economic and Financial Aspects of the Public Entity Cost Benefit
Case Project
(1) Initial Cost (Million $)
(2)
Periodic Investment
at every 5th year
(Million $) (3)
Regular Operation
and Maintenance
Cost (1st Year)
(Million $) (4)
Project Life (5)
Selling Amount (Million
$) (6)
Savings in VOC
(1st Year)
(Million
$) (7)
Savings in VOT
(1st Year)
(Million $) (8)
Toll (1st
Year)
(Million $) (9)
FIRR (10)
EIRR (11)
(a) Mumbai Pune Expressway (Current operation)
525 (1997-2001)
52.5 (2001)
7.43 (2001) 2001-2030 225
(2005) 31.4
(2001) 19.78 (2001)
24.85 (2001)
5.07% 13.95%
(b) NH-4 (Current operation)
- - - 2005-2019 - 32.42 (2005)
15.32 (2005)
- NA Very High
(c) Mumbai Pune Expressway (No private involvement)
525 (1997-2001)
52.5 (2001)
7.43 (2001) - 31.4
(2001) 19.78 (2001)
24.85 (2001)
7.05% 14.75%
(d) Mumbai Pune Expressway (Continued private operation)
525 (1997-2001)
52.5 (2001)
7.43 (2001) 524.31 (2019)
31.4 (2001)
19.78 (2001)
24.85 (2001)
5.07% 13.95%
(e) Combination (a + b) 5.07% 16.32%
(f) Combination (b + c) 7.05% 17.89%
Note:
a: Represents current operation c: represents a hypothetical scenario, where the private sector is not involved at all, and the public entity is responsible for all expenditures and system operation d: represents a hypothetical scenario, where the private sector is responsible for all expenditures and system operation, but it provides one time payment at two stages 2005 and 2019. TABLE 5 Financial Aspects of the Private Entity
Project (1)
Initial Cost (Million $)
(2)
Periodic Investment at every 5th year
(Million $) (3)
Regular Operation and Maintenance
Cost (Million $)
(4)
Project Life (5)
Toll for first year (Million $)
(6)
FIRR (7)
(a) Mumbai Pune Expressway
225.00 (2005)
52.50 (2005)
7.44 (2005)
2005-2019 30.97 (2005)
12.77%
(b) NH-4 100.00 (2005)
10.00 (2005)
5.81 (2005)
2005-2019 22.58 (2005
33.05%
Combination 20.21%

20
TABLE 6 Sensitivity Analysis for both Private and Public Entity
Private Entity (3)
Public Entity (4)
FIRR FIRR EIRR Variation
(1) Percentage
Change (2) MPEW NH4 Cumulative MPEW NH4 Cumulative MPEW NH4 Cumulative
Base Case 0 12.77% 33.05% 20.21% 5.07% NA 5.07% 13.95% Very High 16.32%
10 9.74% 28.70% 16.93% 4.49% NA 4.49% 13.37% Very High 15.32% Increase in O&M Cost
20 9.22% 28.12% 16.87% 4.40% NA 4.40% 13.32% Very High 15.27%
-5 10.25% 29.57% 17.52% 4.58% NA 4.58% 13.41% Very High 15.38% Volume of Traffic
-10 9.25% 28.07% 16.32% 4.35% NA 4.35% 12.98% Very High 14.86%
-5 11.36% 31.07% 18.70% 4.80% NA 4.80% 13.83% Very High 15.88%
-10 9.91% 29.10% 17.16% 4.52% NA 4.52% 13.71% Very High 15.66% Toll Rates
5 14.14% 35.04% 21.70% 5.32% NA 5.32% 14.07% Very High 17.16%
TABLE 7 Scenario Analysis for both Private and Public Entity
Private Entity (4)
Public Entity (5)
FIRR FIRR EIRR Scenarios (1)
Variation (2)
Percentage Change
(3) MPEW NH4 Cumulative MPEW NH4 Cumulative MPEW NH4 Cumulative
Base Case No Variation 0 12.77% 33.05% 20.21% 5.07% NA 5.07% 13.95% Very High
16.32%
Increase in O&M Cost
10
Volume of Traffic -10 Scenario-1
Toll Rates -5
8.30% 26.98% 15.49% 4.21% NA 4.21% 12.91% Very High
14.38%
Increase in O&M Cost
10
Volume of Traffic -10 Scenario-2
Toll Rates 0
9.66% 28.74% 16.90% 4.48% NA 4.48% 13.03% Very High
14.59%
Increase in O&M Cost
20
Volume of Traffic -10 Scenario-3
Toll Rates -5
7.77% 26.27% 14.94% 4.12% NA 4.12% 12.87% Very High
14.23%
Increase in O&M Cost
0
Volume of Traffic 10 Scenario-4
Toll Rates 5
16.43% 38.48% 24.25% 5.74% NA 5.74% 14.87% Very High
18.16%

21
D. CONCLUSIONS
Initial discussions presented in this paper identify various roles that private sector may play in transportation asset management in India that is characterized by large ongoing investments in the emerging infrastructure program. It appears that the Government sector of India will be increasingly looking to the private industry for participation in transportation asset management. This participation can take a number of different forms, and examples of such private industry involved in India are cited in the paper. The case study involving the MPEW and NH4 is presented to examine the consequence of joint private-public participation in asset management. The authors feel that it is not the exact number, but the trend, that is more important in drawing meaningful conclusions. The sensitivity and the scenario analyses show that the trends observed are reasonable and logical. The case study indicates that joint participation infrastructure projects has been mutually beneficial for the public and private entity. The private entity in this case, derives a healthy return 20% from the combination of the two projects MPEW and NH4, with a larger contribution by the latter project. The public entity, by transferring the operational rights of the two facilities, loses the opportunity for earning a sustained level of revenue. However even with the income foregone through future toll charges, the public sector earns a 5.07% FIRR and 16.32% EIRR. Considering that a primary mission of the public sector is to derive social benefits from public investment, a 16.32% EIRR appears to be an excellent investment. The $ 225 M (Rs. 900 crores) received from the private entity for the MPEW project, along with the maintenance/operational expenses saved, will allow the public entity. to invest public funds in other socially desirable programs. Similarly, the $ 100 M (Rs. 400 crores) “saved” by the public entity along with associated maintenance and operating expenses in rebuilding and operating NH4 can be used to finance other programs to benefit the taxpayers. Lastly the public entity is protected from any risks/uncertainties associated with collection of future tolls during the concession period. Additional efforts should be undertaken to examine the financial implications of these programs from the perspective of the public sector and the private sector. Future research should incorporate the concept of risk and uncertainty into the economic analysis. The EIRR and FIRR-values computed in this paper are based upon the assumption of the future returns (toll charges, savings in VOV, and TT) being fully known. In reality, there are uncertainties associated with these returns. Further, over an extended life period, the more distant the future is, the more uncertain the return is likely to be. This feature underscores the importance of incorporating risks and uncertainties into the analysis. Lastly, the final acceptance of a project should be based upon the Minimum Attractive Rate of Return (MARR), defined as the return below which all investment proposed are to be considered unacceptable (27). The MARR value is set based upon predominant lending rates and economic conditions, and if often treated as an exogenous variable, a detailed discussion of which is beyond the scope of this paper. It is however conceivable, that the public and private entities may identify different MARRs as a benchmark of accepting/rejecting investment proposals.

22
ACKNOWLEDGMENTS
The principal author served as a Fulbright Research Scholar in India during the Fall of 2004 studying how transportation management strategies are being deployed in India. He would like to express his appreciation to the Fulbright Foundation and to the Council of International Exchange of Scholars, Washington, D.C. for providing him the opportunity to conduct the research reported in this paper. He is also thankful to Wayne State University for granting him sabbatical leave during the fall 2004 semester and to the Indian Institute of Technology Bombay (IITB), India for providing him valuable support for his research in India. The assistance and support he received from faculty members and graduate students of the Transportation System Engineering Group at IITB deserve special mention. Lastly, the authors thankfully acknowledges the assistance of many individuals in different organizations in India, particularly, MSRDC and Mumbai Metropolitan Region Development Authority (MMRDA), and Navi Mumbai Special Economic Zone (NMSEZ) for sharing information with them. The opinions and viewpoints expressed are entirely those of the authors, and do not necessarily represent policies and programs of the agencies motioned in the paper.

23
REFERENCE
1. AASHTO Asset Management Task Force. Strategic Plan. American Association of State Highways and Transportation Officials, Washington D.C., 1998.
2. AASHTO Task Force on Asset Management. American Association of State Highways and Transportation Officials, Accessed July 16, 2007. http://www.dot.state.ia.us/aashtoam/whatis.htm. Date Accessed: May 2007.
3. Strategy for Improving Asset Management Practice. Austroads, Sydney, 1997 4. New Zealand National Asset Management Steering Group and the Institute of Public
Works Engineering Australia, International Infrastructure Management Manual, Australia/New Zealand Edition, version 1.0, April 2000.
5. Garbs, N.J., and Hoel, L.A. Traffic & Highway Engineering , Thompson Engineering, Pacific Groove, CA, USA, 2001.
6. Highway Sector Financing in India, A Policy Note. Published by the World Bank Group, 2004.
7. Garin, R., Harvilla, G., and Stoll, S.M. Route 125 Public-Private Partnership Project in San Diego County, California. Transportation Congress, Volumes 1 and 2 - Civil
Engineers - Key to the World’s Infrastructure, American Society of Civil Engineers Conference, 1995.
8. Gauss, D.N. Build up Greater Cleveland: A Successful Public-Private Infrastructure Investment Partnership. Beneath Our Feet: Challenges and Solutions, Pipeline Division
Specialty Conference, American Society of Civil Engineers, 2002. 9. Henk, G. Privatization and the Public/Private Partnership. Journal of Management in
Engineering, 1998, Vol. 14(4), pp. 28-29. 10. Conde, A.B.A, Brown, C., and Suarej, J. R. Public private partnerships: Incentives, risk
transfer and real options. Journal of Financial Economics, 2007, In press. 11. Landers, J. MAX Transit. Journal of Transportation Engineering, American Society of
Civil Engineers, 2002,Vol. 72(1), pp 44-49. 12. Zhang, X. Q., and Kumaraswamy, M. M. BOT-based approaches to infrastructure
development in China. Journal of Infrastructure Systems, American Society of Civil Engineers, 2001, Vol. 7(1), pp18–25.
13. Malini, E. Build Operate Transfer Municipal Bridge Projects in India. Journal of
Management in Engineering, American Society of Civil Engineers, 1999, Vol. 15(4), pp 51-58
14. “Driving Delhi Forward” brochure published by Delhi Metro Rail Corporation (DMRC), updated, website: http://www.delhimetrorail.com. Accessed: June 2007.
15. Sreedharan, E. Mass Rapid Transit System for Delhi Metropolis: A Trend Story RITES, A quarterly journal of the Rail India Technical & Economic Sources LTD., Jan-April, 2004.
16. Meeting notes of S.Khasnabis, principal author with E. Sreedharan, Managing Director DMRC at Delhi, India, Nov 24, 2004.
17. Merna, A. and Njira, C. Financing and Managing Infrastructure. Asia Law and Practice Publishing Ltd., Hong Kong, 1998 (ISBN: 962-936-046-2).
18. Merna, A., and Smith, N.J. Guide to Preparation and Evaluations of BOOT Project
Tenders. Asia Law and Practice, Hong Kong,1996. 19. MSRDC: Maharastra State Road Development Corporation: Website:
http://www.msrdc.org. Date Accessed: June, 2007.

24
20. Merino, D.N. Predesign Planning for Parking Facilities. Journal of Management in
Engineering, American Society of Civil Engineers, 1989, Vol. 5(3), pp 301-313. 21. Bonnafous, A, and Jensen, P. Ranking transport projects by their socioeconomic value or
financial internal rate of return. Transportation Policy, 2005, Vol. 12(1), pp 131-136 22. Borgonovo, E., and Peccati, L. Sensitivity analysis in investment project evaluation.
International Journal of Production Economics, 2005, Vol 90 (1), pp 17-25. 23. Khasnabis, S., Opiela, K.S., and Arbogast, R.G. Economic Evaluation of Development
Projects on Transportation ROW. Transportation Engineering Journal, American Society of Civil Engineers, 1982, Vol. 108(1), pp. 51-70.
24. Planning and Markets. Website: http://www-pam.usc.edu/. Date Accessed: May 2007. 25. ADB (2000). “Asian Development Bank (ADB) Glossaries for Economic and Financial
Analysis” Source: http://www.adb.org/Documents/Handbooks /PIA_Eco_ Analysis/glossary_ref.pdf. Accessed: December 2006
26. CRRI. Updation of Road User Cost Data. Traffic and Transportation Division, Central
Road Research Institute, New Delhi, India, 2001. 27. Blank, L. and Tarquin, M., Engineering Economy. McGraw Hill, New York, 2005 (ISBN
0-07-291863-2)

25
Acronyms Explanation
3AX: three axle vehicles BOOT: build own operate and transfer CRRI: Central road research institute EIRR: Economic Internal rate of return FIRR: Financial Internal rate of return
IRR: Internal rate of return LCV: Light Commercial Vehicles LOT: Lease operate and transfer MA: Multi axle vehicles
MARR: Minimum Attractive Rate of Return MMRDA: Mumbai Metropolitan Region Development Authority
MPEW: Mumbai Pune Expressway MSN: Modified Structural Number
MSRDC: Maharastra State Road Development Corporation NH4: National Highway No-4
NMSEZ: Navi Mumbai Special Economic Zone ROT: Rebuild operate and transfer VOC: Vehicle Operating Cost