
Travelling speed and the risk of crash involvement: … · Travelling Speed and the Risk of ......
69
Travelling Speed and the Risk of Crash Involvement “In a 60 km/h speed limit area, the risk of involvement in a casualty crash doubles with each 5 km/h increase in travelling speed above 60 km/h” Volume 1 - Findings Kloeden CN, McLean AJ, Moore VM, Ponte G NHMRC Road Accident Research Unit The University of Adelaide November 1997
-
Upload
nguyentuyen -
Category
Documents
-
view
230 -
download
0
Transcript of Travelling speed and the risk of crash involvement: … · Travelling Speed and the Risk of ......
Travelling Speed and the Risk of Crash Involvement
“In a 60 km/h speed limit area, the riskof involvement in a casualty crash
doubles with each 5 km/h increase intravelling speed above 60 km/h”
Volume 1 - Findings
Kloeden CN, McLean AJ, Moore VM, Ponte G
NHMRC Road Accident Research UnitThe University of Adelaide
November 1997

FEDERAL OFFICE OF ROAD SAFETY DOCUMENT RETRIEVAL INFORMATION
Report No. Date Pages ISBN ISSN
CR 172 November 1997 72 0 642 25590 3 (Vol 1) 0810-770X 0 642 25548 2 (Set) Title and Subtitle
Travelling Speed and the Risk of Crash Involvement
Volume 1: Findings Authors
Kloeden CN, McLean AJ, Moore VM, Ponte G Performing Organisation
NHMRC Road Accident Research Unit University of Adelaide SOUTH AUSTRALIA 5005 Sponsored by / Available from
Federal Office of Road Safety GPO Box 594 CANBERRA ACT 2601
Project Officer: John Goldsworthy Abstract
The relationship between free travelling speed and the risk of involvement in a casualty crash in a 60 km/h speed limit zone was quantified using a case control study design. The 151 case vehicles were passenger cars involved in crashes in the Adelaide metropolitan area which were investigated at the scene by the NHMRC Road Accident Research Unit and reconstructed using the latest computer aided crash reconstruction techniques. The 604 control vehicles were passenger cars matched to the cases by location, direction of travel, time of day, and day of week and their speeds were measured with a laser speed gun. It was found that the risk of involvement in a casualty crash doubled with each 5 km/h increase in free travelling speed above 60 km/h. Hypothetical speed reductions applied to the case vehicles indicated large potential safety benefits from even small reductions in travelling speed, particularly on arterial roads. Keywords SPEED, RISK, SPEED LIMIT, CASUALTY, CRASH, RECONSTRUCTION, ENFORCEMENT
NOTES:
(1) FORS research reports are disseminated in the interests of information exchange. (2) The views expressed are those of the author(s) and do not necessarily represent those of the Commonwealth
Government.
Reproduction of this page is authorised
Volume 2 of this Report “Case and Reconstruction Details” contains detailedinformation on each individual case and explains the method of analysis usedin the reconstruction process. It is not necessary to view Volume 2 in order tounderstand the general method and results of the study. However, it may beof interest to researchers wishing to examine the study in detail or to conductanother similar study. In light of this, Volume 2 is being made available onlyin electronic format on the Internet (along with the electronic version ofVolume 1) at the following locations:
http://raru.adelaide.edu.au/speedand
http://www.dot.gov.au/programs/fors/forshome.htm
i
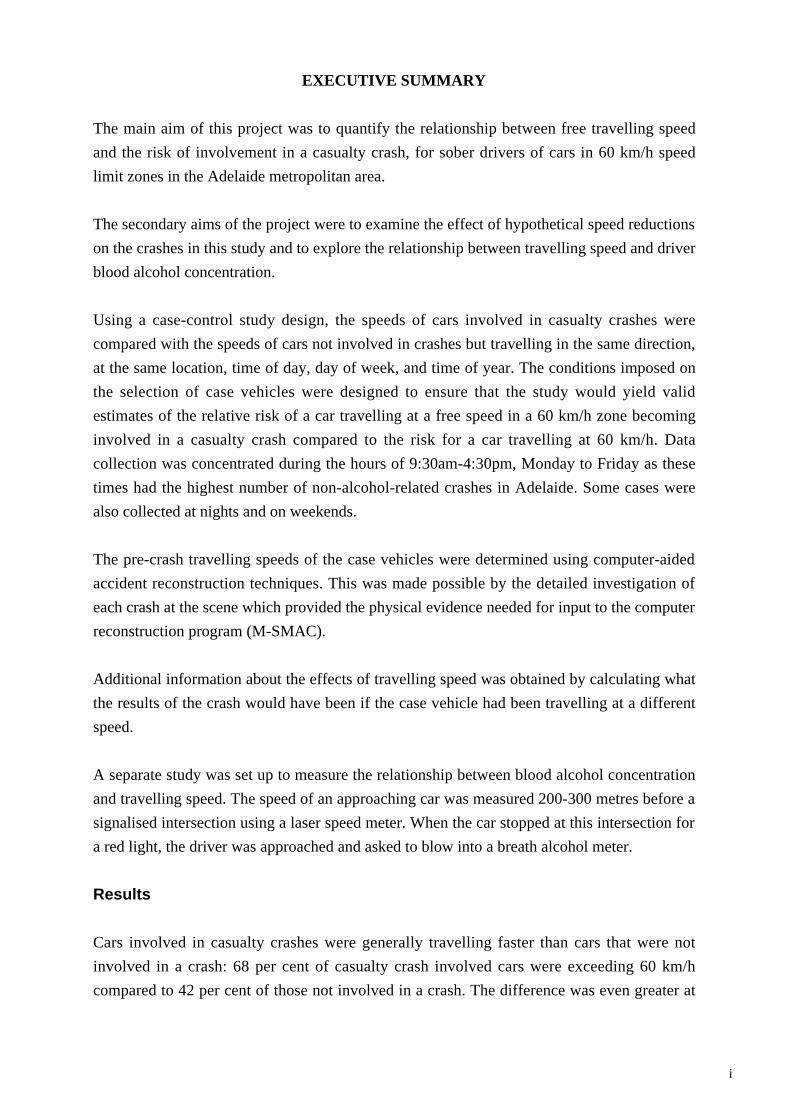
EXECUTIVE SUMMARY
The main aim of this project was to quantify the relationship between free travelling speed
and the risk of involvement in a casualty crash, for sober drivers of cars in 60 km/h speed
limit zones in the Adelaide metropolitan area.
The secondary aims of the project were to examine the effect of hypothetical speed reductions
on the crashes in this study and to explore the relationship between travelling speed and driver
blood alcohol concentration.
Using a case-control study design, the speeds of cars involved in casualty crashes were
compared with the speeds of cars not involved in crashes but travelling in the same direction,
at the same location, time of day, day of week, and time of year. The conditions imposed on
the selection of case vehicles were designed to ensure that the study would yield valid
estimates of the relative risk of a car travelling at a free speed in a 60 km/h zone becoming
involved in a casualty crash compared to the risk for a car travelling at 60 km/h. Data
collection was concentrated during the hours of 9:30am-4:30pm, Monday to Friday as these
times had the highest number of non-alcohol-related crashes in Adelaide. Some cases were
also collected at nights and on weekends.
The pre-crash travelling speeds of the case vehicles were determined using computer-aided
accident reconstruction techniques. This was made possible by the detailed investigation of
each crash at the scene which provided the physical evidence needed for input to the computer
reconstruction program (M-SMAC).
Additional information about the effects of travelling speed was obtained by calculating what
the results of the crash would have been if the case vehicle had been travelling at a different
speed.
A separate study was set up to measure the relationship between blood alcohol concentration
and travelling speed. The speed of an approaching car was measured 200-300 metres before a
signalised intersection using a laser speed meter. When the car stopped at this intersection for
a red light, the driver was approached and asked to blow into a breath alcohol meter.
Results
Cars involved in casualty crashes were generally travelling faster than cars that were not
involved in a crash: 68 per cent of casualty crash involved cars were exceeding 60 km/h
compared to 42 per cent of those not involved in a crash. The difference was even greater at
ii
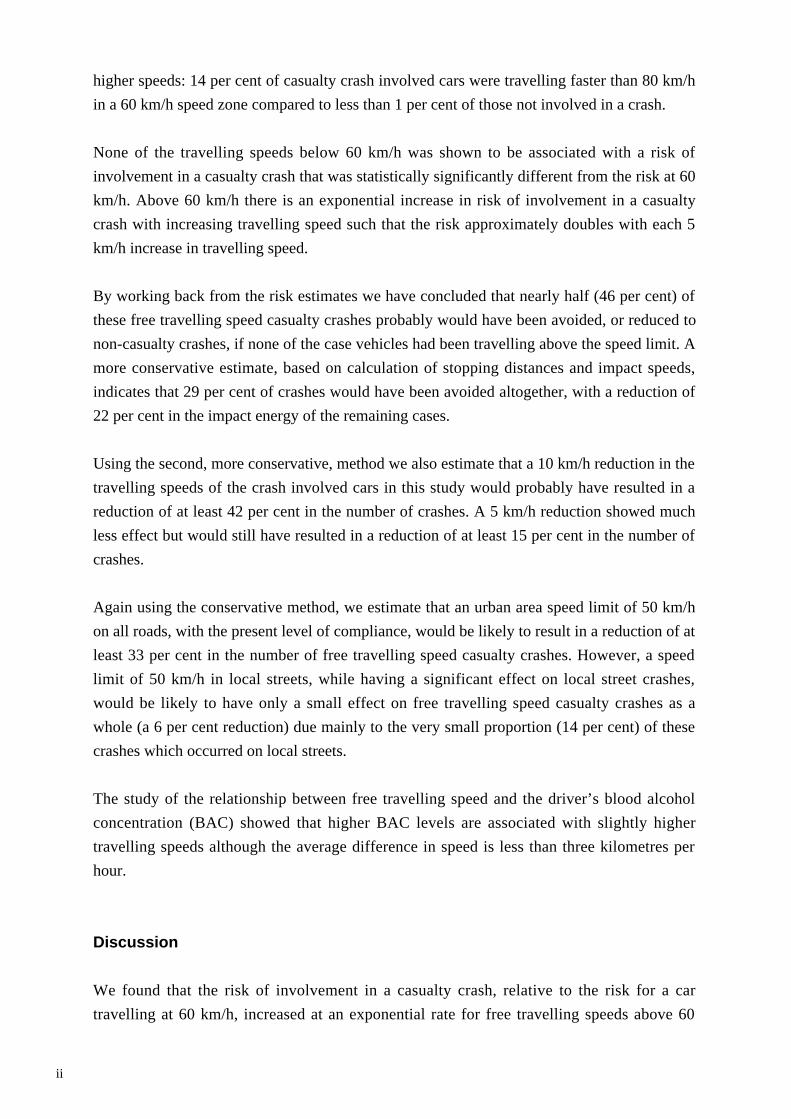
higher speeds: 14 per cent of casualty crash involved cars were travelling faster than 80 km/h
in a 60 km/h speed zone compared to less than 1 per cent of those not involved in a crash.
None of the travelling speeds below 60 km/h was shown to be associated with a risk of
involvement in a casualty crash that was statistically significantly different from the risk at 60
km/h. Above 60 km/h there is an exponential increase in risk of involvement in a casualty
crash with increasing travelling speed such that the risk approximately doubles with each 5
km/h increase in travelling speed.
By working back from the risk estimates we have concluded that nearly half (46 per cent) of
these free travelling speed casualty crashes probably would have been avoided, or reduced to
non-casualty crashes, if none of the case vehicles had been travelling above the speed limit. A
more conservative estimate, based on calculation of stopping distances and impact speeds,
indicates that 29 per cent of crashes would have been avoided altogether, with a reduction of
22 per cent in the impact energy of the remaining cases.
Using the second, more conservative, method we also estimate that a 10 km/h reduction in the
travelling speeds of the crash involved cars in this study would probably have resulted in a
reduction of at least 42 per cent in the number of crashes. A 5 km/h reduction showed much
less effect but would still have resulted in a reduction of at least 15 per cent in the number of
crashes.
Again using the conservative method, we estimate that an urban area speed limit of 50 km/h
on all roads, with the present level of compliance, would be likely to result in a reduction of at
least 33 per cent in the number of free travelling speed casualty crashes. However, a speed
limit of 50 km/h in local streets, while having a significant effect on local street crashes,
would be likely to have only a small effect on free travelling speed casualty crashes as a
whole (a 6 per cent reduction) due mainly to the very small proportion (14 per cent) of these
crashes which occurred on local streets.
The study of the relationship between free travelling speed and the driver’s blood alcohol
concentration (BAC) showed that higher BAC levels are associated with slightly higher
travelling speeds although the average difference in speed is less than three kilometres per
hour.
Discussion
We found that the risk of involvement in a casualty crash, relative to the risk for a car
travelling at 60 km/h, increased at an exponential rate for free travelling speeds above 60
iii
km/h. We are aware of a number of matters which could have affected the validity of the risk
estimates and they are discussed in the report. However, we are not aware of any consistent
bias which would be likely to invalidate the general relationship between free travelling speed
and the risk of involvement in a casualty crash that we present in this report. A detailed
description of each crash and the methods that we used to estimated the travelling speed of the
case vehicles is presented in Volume 2.
Our results show that the risk of involvement in a casualty crash is twice as great at 65 km/h
as it is at 60 km/h, and four times as great at 70 km/h. Increases in risk of such magnitude
would appear to be sufficient to justify the reduction or elimination of the enforcement
tolerance that currently applies to the enforcement of speed limits.
Although the risk of involvement in a casualty crash increases rapidly with increasing speed,
the overall contribution of speeding to crash causation is still considerable at speeds below,
say, 75 km/h because the majority of speeding drivers are travelling in the speed range from
61 to 74 km/h.
A large proportion of the crashes in this study would have been avoided had the case vehicles
been travelling at a slower speed. We have shown that even modest reductions in travelling
speeds can have the potential to greatly reduce crash and injury frequency. Large though these
potential safety benefits are, it is probable they are still considerable underestimates. This is
because we have only considered the effect of reduced travelling speed on the collision
configuration that we actually observed and not taken into account possibilities for crash
avoidance and the lower potential for injury at lower speeds.
It is instructive to compare the extent to which the risk of involvement in a casualty crash
varies with a driver’s blood alcohol concentration (BAC) and with travelling at a speed above
the speed limit. We are able to do this because a case-control study of crash risk and BAC was
conducted by the Road Accident Research Unit in Adelaide in 1979. Comparable case control
studies on speed and alcohol have not been conducted in the same city anywhere else in the
world. The results of these two studies indicate that if the blood alcohol concentration is
multiplied by 100, and the resulting number is added to 60 km/h, the risk of involvement in a
casualty crash associated with that free travelling speed is almost the same as the risk
associated with the blood alcohol concentration. Hence, the risk is similar for 0.05 and 65; for
0.08 and 68; for .12 and 72, and so on.
Given that the relative risk of involvement in a casualty crash at 72 km/h is similar to that for
a BAC of 0.12, it is more than a little incongruous that the penalty for the BAC offence is a
$500-$900 fine and automatic licence disqualification for at least six months while the
penalty for the speeding offence is only a $110 fine.
iv
Conclusions and Recommendations
In a 60 km/h speed limit area, the risk of involvement in a casualty crash doubles with each 5
km/h increase in travelling speed above 60 km/h.
Speeding in an urban area is as dangerous as driving with an illegal blood alcohol
concentration. Even travelling at 5 km/h above the 60 km/h limit increases the risk of crash
involvement as much as driving with a blood alcohol concentration of 0.05.
In this study the free speed casualty crashes occurred almost entirely on main roads. There is a
compelling case for a lower speed limit throughout urban areas, particularly on arterial roads.
Most motorised countries have an urban area speed limit of 50 km/h, as did Victoria and
NSW until the early 1960s.
We therefore recommend that:
1. The tolerance allowed in the enforcement of the 60 km/h speed limit be reduced or
removed.
2. The level of enforcement of the 60 km/h speed limit be increased.
3. The penalties for speeding and illegal drink driving be reviewed to align them more
closely to the risk of being involved in a casualty crash.
4. The level of public awareness of the risk of involvement in a casualty crash associated
with speeding be increased with the aim of developing a culture of compliance with
speed limits, similar to that which has developed in relation to compliance with blood
alcohol limits during the past 15 years.
5. To assist with the preceding recommendation, we also recommend that the results of
this study be widely publicised, emphasising the risks associated with speeding in
relation to the risks associated with illegal drink driving.
6. After a period with stricter enforcement of the 60 km/h urban area speed limit,
consideration be given to changing the urban area speed limit to 50 km/h on all roads,
as in most other highly motorised countries.
v
CONTENTS
1. INTRODUCTION .......................................................................................................................................... 1
1.1 Aims of this Project ................................................................................................................................. 2
1.2 Background ............................................................................................................................................. 2
1.3 Effects of Lowering Speeds..................................................................................................................... 3
1.4 Alcohol and Speed................................................................................................................................... 3
2. LITERATURE REVIEW ............................................................................................................................... 4
2.1 Studies Based on Speeds in Specific Crashes ......................................................................................... 6
2.2 Driver’s Characteristic Speed and Accident History............................................................................. 14
2.3 Correlational Studies ............................................................................................................................. 17
2.4 Summary ............................................................................................................................................... 25
3. METHOD ..................................................................................................................................................... 26
3.1 Case-Control Study Risk Estimation ..................................................................................................... 263.1.1 Case Vehicle Selection Criteria .................................................................................................... 263.1.2 Case Vehicle Investigation Procedure .......................................................................................... 283.1.3 Determining Speeds of Case Vehicles.......................................................................................... 293.1.4 Control Vehicle Selection Criteria................................................................................................ 303.1.5 Measuring Speeds of Control Vehicles......................................................................................... 30
3.2 Hypothetical Crash Outcome Method ................................................................................................... 31
3.3 Relationship Between Speed and Alcohol ............................................................................................ 32
4. RESULTS ..................................................................................................................................................... 33
4.1 Travelling Speed and the Risk of Involvement in a Casualty Crash ..................................................... 334.1.1 Data Collection on Cars Involved in Casualty Crashes ................................................................ 334.1.2 Data Collection on Non-Crash Involved Cars .............................................................................. 344.1.3 Comparing the Travelling Speeds of Cases and Controls ............................................................ 344.1.4 Travelling Speed and the Relative Risk of Involvement in a Casualty Crash .............................. 364.1.5 Free Travelling Speed Crash Types.............................................................................................. 40
4.2 Hypothetical Crash Outcomes at Reduced Travelling Speed ............................................................... 404.2.1 Injuries Sustained in the Crashes .................................................................................................. 414.2.2 Location of Crashes ...................................................................................................................... 414.2.3 Hypothetical Outcomes at Reduced Travelling Speeds................................................................ 424.2.4 Estimated Effect of Eliminating Speeding Vehicles Based on Risk Estimates ............................ 43
4.3 Relationship Between Speed and Alcohol ............................................................................................ 44
5. DISCUSSION ............................................................................................................................................... 45
5.1 Travelling Speed and the Risk of Involvement in a Casualty Crash ..................................................... 455.1.1 Reasons for the Rate of Increase in Risk of Involvement in a Casualty Crash ............................ 455.1.2 Validity of the Risk Estimates ...................................................................................................... 495.1.3 Implications for the Setting of Speed Limits ................................................................................ 525.1.4 Implications for Enforcement ....................................................................................................... 52
5.2 Hypothetical Travelling Speed and Crash Severity............................................................................... 53
5.3 The Relationship Between Speed and Alcohol ..................................................................................... 53
5.4 Speed, Alcohol and the Risk of Involvement in a Casualty Crash ....................................................... 535.4.1 Comparing Speed and Alcohol Risks ........................................................................................... 545.4.2 Penalties for Speeding and Drink Driving .................................................................................... 54
6. CONCLUSIONS AND RECOMMENDATIONS ....................................................................................... 56
ACKNOWLEDGEMENTS .............................................................................................................................. 57
REFERENCES ................................................................................................................................................. 58

vi

1
1. INTRODUCTION
In Australia during 1996, almost 2,000 (1,973) persons died of injuries which were the result
of a road traffic crash. This represents 11 fatalities per 100,000 population per year. In
addition, the rate for serious casualties resulting from road crashes is typically at least ten
times that of fatalities (Federal Office of Road Safety, 1994).
Young people are affected disproportionately, which is of special concern. In 1995, 38 per
cent of all road traffic crash fatalities were under 25 years of age. More generally, with the
exception of the first year of life, road trauma is the leading cause of death amongst
individuals aged less than 25 years and one of the foremost causes amongst individuals less
than 45 years (Australian Bureau of Statistics, 1995). For males, almost 16 per cent of years
of potential life lost before age 65 is due to road trauma, which is more than the contributions
of heart disease and cancer (Federal Office of Road Safety, 1992).
Vehicle occupants account for the majority of those fatally injured, 68 per cent in 1995, with
pedestrians (20%), and then motorcyclists and pedal cyclists (10 and 2%, respectively)
(Federal Office of Road Safety, 1996). The latter groups of road users are more vulnerable
than vehicle occupants and are consequently proportionally over-represented among the fatal
cases.
Excessive speed is reported to be an important contributory factor in many crashes. Analyses
of a number of large data bases in the United States indicated that speeding or excessive speed
contributed to around 12 per cent of all crashes reported to the police and to about one third of
fatal crashes (Bowie and Walz, 1991). In Australia, excessive speed is an important factor in
approximately 20 per cent of fatal crashes (Haworth and Rechnitzer, 1993) and speed is a
probable or possible cause in 25 per cent of rural crashes (Armour and Cinquegrana, 1990). It
has been argued that such figures are likely to under-estimate the role of speed in crashes
because subtle effects, such as the amplification of other dangers in the traffic situation by
relatively small increases in speed, are likely to be overlooked (Plowden and Hillman, 1984).
A large body of evidence suggests that there is a positive association between speed and the
risk of crash involvement. This evidence includes the findings from case-control studies and
from studies of fatality and casualty rates before and after changes to speed limits, and
evidence from comparisons of fatality rates for countries with different maximum speed
limits. Three case-control studies conducted in the United States more than 20 years ago
attempted to elucidate this relationship, but the validity of the results and their interpretation
have been questioned. In addition, it is not clear how these results might apply in Australia at
the present time.
2
Quantitative knowledge of the relationship between speed and the risk of crash involvement
would advance the understanding of the causes of road crashes. It would also make an
important contribution to the debate about the appropriateness of speed limits and their
enforcement. Research to this end has been recommended on a number of occasions (Cowley
1987; Victoria, Parliament, 1991; Fildes, Rumbold and Leening, 1991).
1.1 Aims of this Project
The main aim of this project is to quantify the relationship between travelling speed and the
risk of involvement in an injury producing crash, for sober drivers in an urban setting. Using a
case-control study design, speeds of vehicles involved in injury crashes are compared with
speeds of vehicles not involved in crashes but travelling in the same direction, at the same
location, time of day, day of week, and time of year.
The secondary aims of the project are to examine the effect of hypothetical speed reductions
on this set of crashes and to explore the relationship between travelling speed and driver blood
alcohol concentration.
1.2 Background
A number of studies have investigated the relationship between speed and crash risk but most
of them have had significant limitations. They are discussed in detail in the literature review
section of this report.
The results of a pilot case-control study, conducted by the Road Accident Research Unit in
1994, of the association between travelling speed and the risk of involvement in a serious or
fatal car crash showed that there appeared to be at least as high a crash risk involved in
travelling more than 25 km/h above the 60 km/h speed limit as there was in driving with a
blood alcohol concentration above 0.15 (Moore, Dolinis and Woodward, 1995). However, the
pilot study did not contain enough cases to assess the effect on crash risk of travelling only
slightly above the speed limit, nor did it attempt to address the possible confounding effects of
alcohol impaired driving.
The present study attempted to deal with both of these limitations by collecting a larger
number of cases to increase statistical power and by studying only sober case and control
drivers to eliminate confounding by the effects of alcohol.
3
1.3 Effects of Lowering Speeds
By looking at actual crashes and hypothesising different travelling speeds, some insight can
be gained into the possible effects of lowering travel speeds. The present report thus includes
a section in which travelling speeds are hypothetically varied.
1.4 Alcohol and Speed
It is well established that there is a positive association between driver blood alcohol
concentration and risk of crash involvement (Borkenstein, et al., 1974; McLean, Holubowycz
and Sandow, 1980), however, there is little research that explores the relationship between
travelling speed and alcohol impairment. Both are known to be risk factors for road crashes
but it is not clear how they relate to each other. The present study will attempt to quantify this
relationship.
4
2. LITERATURE REVIEW
This literature review concerns studies which have been undertaken to quantify the
relationship between travelling speed and the risk of crash involvement. That is, it focuses on
studies which were intended to indicate how the likelihood of a crash occurring varies across
a range of travelling speeds.
The following data bases were searched using the terms speed and accident or crash: the Road
Accident Research Unit library holdings; Medline; Literature Analysis System On Road
Safety (produced by the Library of the Department of Transport and Regional Development,
Canberra); Transportation Research Information Service (United States Department of
Transportation and the Transportation Research Board, Washington). All abstracts compiled
by this broad search strategy were scanned to identify articles that focused on the relationship
between travelling speed and the occurrence of a crash.
The research question posed in such studies is different from that addressed by studies
examining the relationship between speed and the consequences of a crash (usually injury
severity). It is well-established that once a crash has occurred, the severity of the injuries
sustained by the individuals involved is an increasing function of vehicle speed. The
relationship is non-linear, with a specified increase in vehicle speed producing a
proportionately greater increase in injury severity. For example, Joksch (1975) showed that
compared to the risk of an occupant fatality following involvement in a crash at 40 mph, the
risk of a fatality was 2.5 times greater at 60 mph, 6 times greater at 70 mph, and
approximately 20 times greater at 80 mph. Injury severity is, in fact, more directly related to
the change in velocity experienced during the crash, but change in velocity tends to increase
with increasing pre-crash speed (O’Day and Flora, 1982). Research about crash involvement
may embody an aspect of crash consequences by specifying involvement in a crash with a
particular outcome, for example, an occupant fatality, where the risk being estimated is the
joint probability of a crash occurring and one of the occupants being fatally injured.
A number of research designs may be used to gain information about the likelihood of
becoming involved in a crash at different travelling speeds. Theoretically, the strongest
approach is to compare the pre-crash speeds of individual vehicles involved in crashes with
the speeds of selected control vehicles. Limited use has been made of this research design
because of the practical problem of accurately determining pre-crash speeds, the lesser
problem of selecting and measuring speeds of appropriate controls, and the overall expense of
such detailed research. Three studies with this design were conducted in the United States
some three decades ago, and a pilot study using this method was recently undertaken in
Adelaide.
5
Another research approach involves examining the relationship between a driver’s speed in a
specific setting and his or her accident history. To the extent that it can be assumed that
drivers’ speeds in one setting are indicative of their speeds on other occasions, and prior to a
crash in particular, this study design provides insight into the relationship between speed and
crash involvement. While this type of study is easier to undertake than that outlined above,
the evidence gained by this method is obviously more tenuous. One problem with this
research design is that only drivers who have survived past crashes are able to be studied, and
since high-speed crashes are least likely to be survivable, it is possible that involvement rates
for high speeds may be systematically under-estimated. In practice, most studies of this form
have not linked accident history to a continuum of free speeds, but rather have presented
differences in terms of relatively low or high speeds. Such dichotomous results do not allow
the relationship between (present preferred) speed and (past) accident involvement to be fully
described. A recent study of this type conducted in Victoria is a notable exception (Fildes,
Rumbold and Leening, 1991).
A third approach is to infer the relationship in question from aggregate crash data pertaining
to circumstances in which there is some variation in speed: before and after a change in speed
limit at a specific location; from a set of sites which have different speed limits or
characteristic speeds; from states or countries with different maximum speed limits. There are
two important limitations of this approach. First, only certain parts of the speed distribution
are usually examined in any one study; a posted limit of 60 km/h versus 70 km/h, for
example. Generalisation from the scenario examined is not necessarily valid: the change in
crash risk may not be the same for each 10 km/h speed increment. Secondly, as with any
assessment of a relationship that is based on group rather than individual data, there is
uncertainty about whether the relationship holds in a causal sense at the individual level (the
ecological fallacy, in epidemiological terms). Many studies with this type of design have been
reported, but few offer results in a form that allows quantification of the relationship between
speed and crash involvement.
As an aside, the principles of physics provide another source of information about the likely
form of the relationship between speed and crash involvement. Factors such as braking
distance, the probability of exceeding the critical speed on a curve, loss of friction between
tyres and the road, are all increasing functions of vehicle speed. Since all may have a role in
crash avoidance or involvement, the suggestion from first principles is that speed is positively
related to the likelihood of crash involvement.
Only data from real-life events can provide information on how speed actually relates to crash
risk, however. This relationship may depend on the setting, with different settings making
different demands on the driver, possibly giving rise to different roles for speed in the
potential for crash involvement. In other words, as many authors have noted, excessive speed
6
for the circumstances may be more pertinent than absolute speed, at least to some degree. The
chief distinction here is between urban and rural settings, and most research has been
undertaken in the latter. Likewise, possible differences between countries cannot be ruled out,
although this would appear to be a lesser factor. The relationship may also have changed over
time, particularly over periods in which there was substantial improvement in vehicle design
and handling that led to improved ability to avoid a potential crash at any given speed. Thus
the location and the year of the research to be reviewed should be borne in mind when
considering the relevance of results to other circumstances.
2.1 Studies Based on Speeds in Specific Crashes
As mentioned already, three studies undertaken in the United States more than 25 years ago
attempted to quantify the relationship between speed and crash involvement by ascertaining
pre-crash speeds for individual vehicles (Solomon, 1964; Cirillo, 1968; Research Triangle
Institute, 1970). In each study the essence of the method was to establish pre-crash travelling
speeds for vehicles involved in crashes on designated stretches of road, and to compare these
speeds with speed measurements for traffic not involved in crashes. The studies were
conducted on rural roads, and all reported that the relationship was U-shaped, with crash risk
being elevated at both relatively low and relatively high speeds. However, critical appraisal of
these studies highlights the possibility that aspects of the way the studies were carried out
inadvertently contributed to the apparent increase in risk at relatively low speeds. Thus it is
arguable that these studies do not reliably quantify the relationship between speed and crash
involvement at the lower end of the speed distribution. By contrast, the estimates of crash risk
at the upper end of the speed distribution appear to be free of severe bias and may be taken as
indicative, at least for that place and time.
The first and best known attempt to quantify the relationship between speed and crash
involvement was that of Solomon (1964), undertaken in the United States in the late 1950s.
The aim of Solomon’s study was to relate crash involvement to various driver and vehicle
factors, including speed. To this end, information from the accident records of nearly 10,000
drivers was compared with speed measurements and interview data from 290,000 drivers not
involved in crashes.
Six hundred miles of main rural highway were included in the study, 35 sections in 11 states.
The sections were reported to have been representative of main rural highways in the United
States: three quarters were two-lane highways, with the remainder being four-lane divided
highways; the average section length was 17 miles, although one section was 91 miles long; a
daytime speed limit of 55 to 70 mph applied to 28 sections, 45 mph to two sections, and
subjective limits (relying on drivers’ judgements) to the remainder; on average, there were
7
two entrances to businesses and four intersections per three mile distance. For each section,
speed measurements were made using a concealed device at one location, chosen on the
grounds that the speeds there were typical of the average for the entire section. Selected
drivers were stopped and interviewed after their speeds were registered.
Accident data were obtained from the records of all reported crashes that had occurred on the
35 highway sections during a period of three to four years prior to June 30, 1958. For
comparison purposes the ‘travel speed’ of crash-involved vehicles was required, this being the
speed at which the vehicle was moving before the driver became aware of the impending
collision. In the accident reports this speed was estimated by drivers, police, or witnesses;
about 20 per cent of accident reports did not contain an estimate.
While the information collected enabled the speed distributions of accident-involved and non-
involved drivers to be directly compared, the results were also presented in a manner that took
into account the amount of travel at a particular speed, that is, in terms of involvements per
hundred million vehicle-miles (100 mvm). To achieve these involvement rates, the vehicle-
miles for each section were calculated as the product of the section length and the number of
vehicles using the section over the period for which accident data were obtained, extrapolated
from traffic volume counts. The vehicle-miles were then apportioned to speed categories
according to the distribution of speeds obtained for the section; the figures for the different
sections were combined to give total vehicle-miles for each speed band. Finally, the number
of involvements with reported travel speed in a particular category was divided by the total
vehicle-miles for that category.
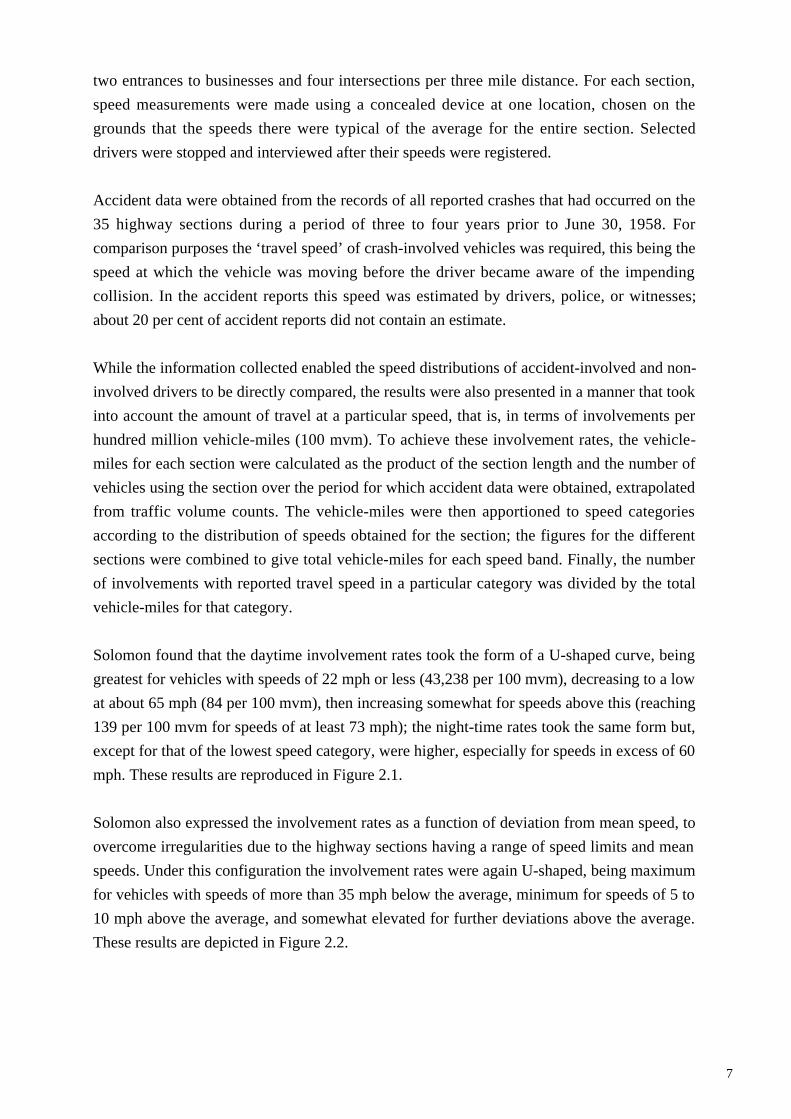
Solomon found that the daytime involvement rates took the form of a U-shaped curve, being
greatest for vehicles with speeds of 22 mph or less (43,238 per 100 mvm), decreasing to a low
at about 65 mph (84 per 100 mvm), then increasing somewhat for speeds above this (reaching
139 per 100 mvm for speeds of at least 73 mph); the night-time rates took the same form but,
except for that of the lowest speed category, were higher, especially for speeds in excess of 60
mph. These results are reproduced in Figure 2.1.
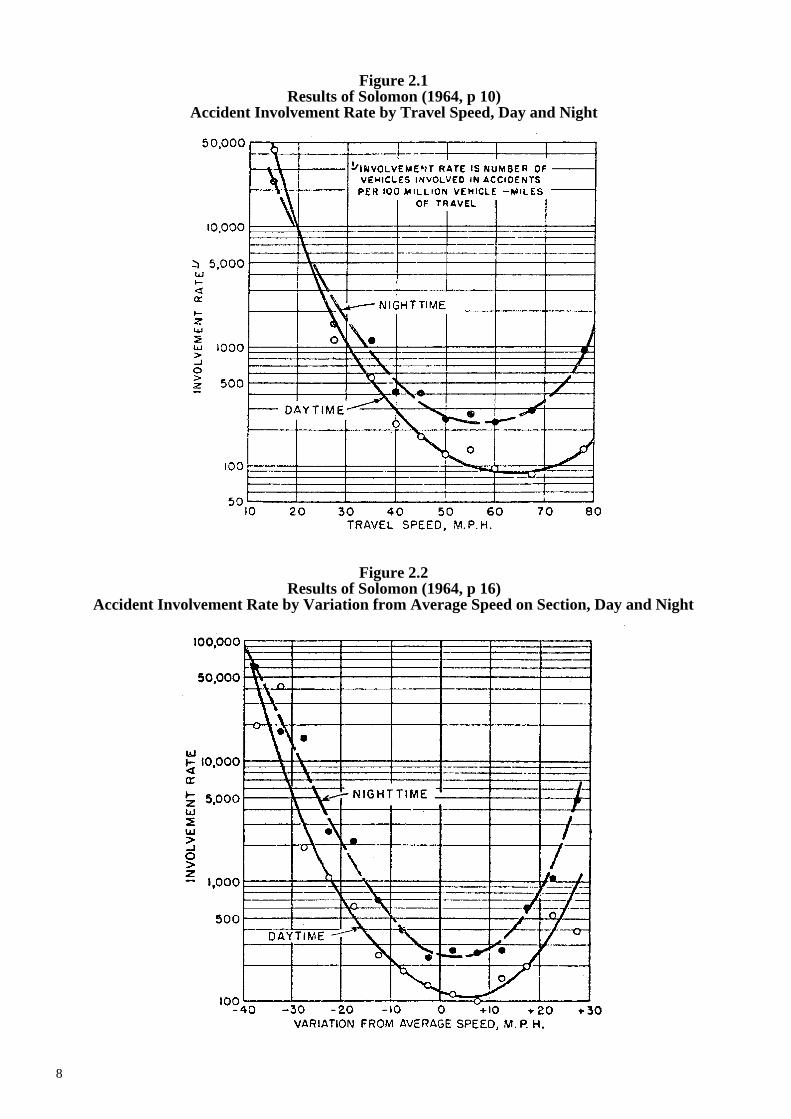
Solomon also expressed the involvement rates as a function of deviation from mean speed, to
overcome irregularities due to the highway sections having a range of speed limits and mean
speeds. Under this configuration the involvement rates were again U-shaped, being maximum
for vehicles with speeds of more than 35 mph below the average, minimum for speeds of 5 to
10 mph above the average, and somewhat elevated for further deviations above the average.
These results are depicted in Figure 2.2.
8
Figure 2.1Results of Solomon (1964, p 10)
Accident Involvement Rate by Travel Speed, Day and Night
Figure 2.2Results of Solomon (1964, p 16)
Accident Involvement Rate by Variation from Average Speed on Section, Day and Night
9
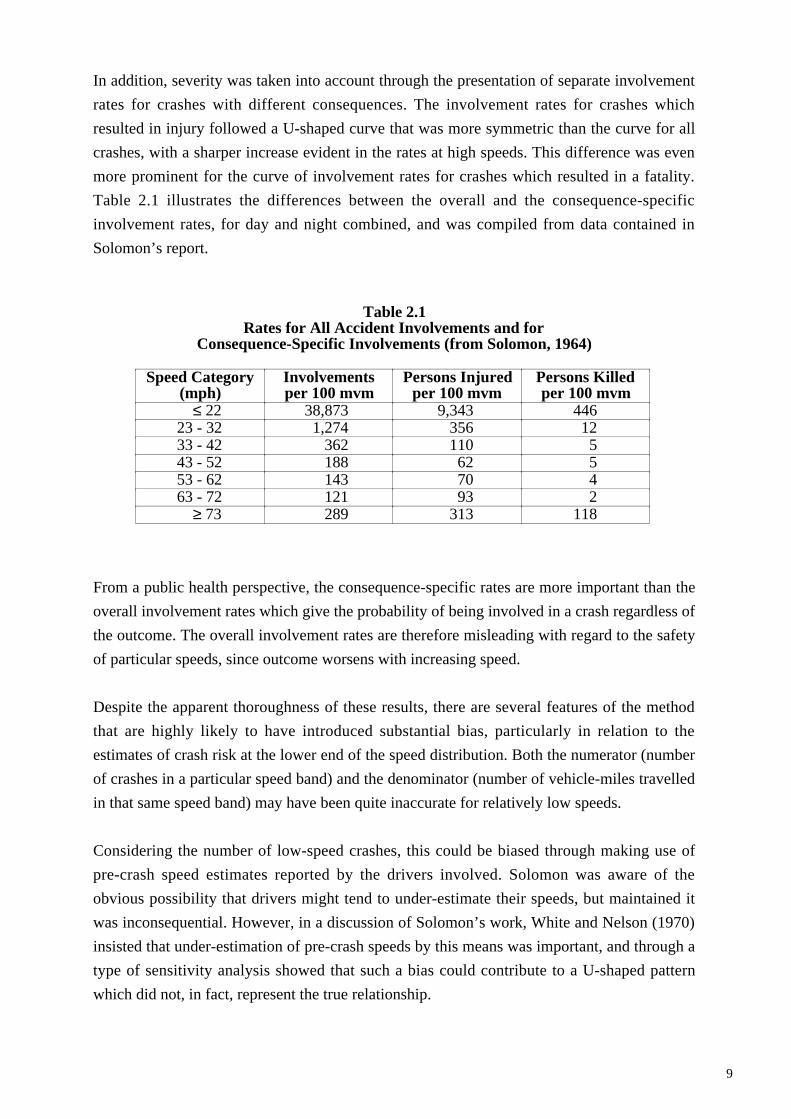
In addition, severity was taken into account through the presentation of separate involvement
rates for crashes with different consequences. The involvement rates for crashes which
resulted in injury followed a U-shaped curve that was more symmetric than the curve for all
crashes, with a sharper increase evident in the rates at high speeds. This difference was even
more prominent for the curve of involvement rates for crashes which resulted in a fatality.
Table 2.1 illustrates the differences between the overall and the consequence-specific
involvement rates, for day and night combined, and was compiled from data contained in
Solomon’s report.
Table 2.1Rates for All Accident Involvements and for
Consequence-Specific Involvements (from Solomon, 1964)
Speed Category(mph)
Involvementsper 100 mvm
Persons Injuredper 100 mvm
Persons Killedper 100 mvm
≤ 22 38,873 9,343 44623 - 32 1,274 356 1233 - 42 362 110 543 - 52 188 62 553 - 62 143 70 463 - 72 121 93 2
≥ 73 289 313 118
From a public health perspective, the consequence-specific rates are more important than the
overall involvement rates which give the probability of being involved in a crash regardless of
the outcome. The overall involvement rates are therefore misleading with regard to the safety
of particular speeds, since outcome worsens with increasing speed.
Despite the apparent thoroughness of these results, there are several features of the method
that are highly likely to have introduced substantial bias, particularly in relation to the
estimates of crash risk at the lower end of the speed distribution. Both the numerator (number
of crashes in a particular speed band) and the denominator (number of vehicle-miles travelled
in that same speed band) may have been quite inaccurate for relatively low speeds.
Considering the number of low-speed crashes, this could be biased through making use of
pre-crash speed estimates reported by the drivers involved. Solomon was aware of the
obvious possibility that drivers might tend to under-estimate their speeds, but maintained it
was inconsequential. However, in a discussion of Solomon’s work, White and Nelson (1970)
insisted that under-estimation of pre-crash speeds by this means was important, and through a
type of sensitivity analysis showed that such a bias could contribute to a U-shaped pattern
which did not, in fact, represent the true relationship.
10
In addition, it is possible that crashes at entrances to businesses or intersections accounted for
many of the slow moving vehicles. Solomon acknowledged this possibility also, even
suggesting that as many as half of the involvements in the 10 to 30 mph category were of this
nature, but claimed that excluding such crashes would change the results very little. This
claim is somewhat at odds with the explanation offered for the lower involvement rates on
four-lane highways compared with two-lane highways, which was in terms of the superior
control of access on four-lane highways. It is also clear from Solomon’s work that the pattern
of involvement rates varied with the type of crash, with rear-end collisions being much more
likely to occur at low than at high speeds. Thus it is difficult to accept that removing low-
speed crashes associated with particular manoeuvres (rather than low free speeds) would
hardly affect the results.
Turning to the denominator, the potential for bias there exacerbates the likelihood that an
artifactual U-shaped curve would emerge from the data. Recall that for each section of
highway, crashes along the whole length were included in the study, but comparison speeds
were measured at only one location at selected times. Although this location was chosen to be
in some sense typical of the section, speeds there may not have represented the speed of
traffic at crash locations, particularly when driveways or entrances to businesses were
proximal to the latter. It is also difficult to comprehend how speeds measured at one location
can be considered to be adequately representative of speeds on road sections up to 91 miles in
length. Hence it is conceivable that the comparison speed distributions, which formed the
basis for the denominator of the crash rates, systematically omitted low speeds that would
have been found at crash locations.
A few years later Cirillo (1968) published results of a study similar to Solomon’s, but
undertaken on interstate highways rather than rural highways. Briefly, twenty state highway
departments supplied the data which related to rural and urban sections of interstate highways,
with a number of criteria applied to eliminate intersections and to make the sections
somewhat homogeneous. Information was obtained on the proportion of traffic in different
speed categories and the speeds of vehicles involved in crashes. Only crashes which occurred
between 9 am and 4 pm and which were either rear-end, same-direction side-swipe or angle
collisions were included. The time restriction was necessary for compatibility with the speed
data collected for non-involved vehicles, while the type of collision was restricted as the focus
was on the way differences in speeds of vehicles in the same traffic stream contributed to
crashes.
Cirillo’s results were in terms of deviation from mean speed and were similar to those of
Solomon: the accident involvement rates followed a U-shaped curve, being highest for
vehicles travelling about 32 mph below the mean speed, falling to a minimum for vehicles
travelling around 12 mph above the mean speed, then rising moderately with further

11
deviations from the mean. In addition, the relationship between involvement rates and
proximity to an interchange (a connection between major roads) was examined. In urban
areas, the involvement rates were highest for sections closest to interchanges and decreased as
distance from the interchange increased. There was no obvious pattern for sections in rural
areas. In general, the rates at urban interchanges were higher than those for rural interchanges.
These results suggested a role for traffic volume as well as speed differences in the occurrence
of crashes.
It follows from the similarity in procedures that Cirillo’s study suffers from much the same
potential for bias as Solomon’s work. In addition, Cirillo’s results only relate to specific crash
types. The Insurance Institute for Highway Safety (1991) pointed out that single vehicle
crashes account for more than half of the fatal crashes on interstate highways and such crashes
are likely to be associated with high speeds, so the omission of this type of crash means that
Cirillo’s study almost certainly under-estimated the involvement rates for high speeds.
Furthermore, again according to the Insurance Institute for Highway Safety, many of the very
slow speeds were probably related to disabled vehicles leaving the road or at the side of the
road, rather than to elected travelling speeds of vehicles in the traffic stream.
A third study which aimed to quantify the relationship between speed and the occurrence of a
crash was reported by the Research Triangle Institute (1970). It was undertaken a decade after
Solomon’s study and, while the essential idea was the same, some aspects of the method were
different. The study covered all state highways and county roads with a speed limit or a mean
speed of at least 40 mph in Monroe County, Indiana, in all about 70 miles of road. A total of
294 crashes were included in the study.
Efforts were made to obtain pre-crash speeds that were more reliable than those abstracted
from accident reports, including the use of accident investigation and of a computer-sensor
system. For the first eight months of the study an accident investigation team determined the
pre-crash speeds on the basis of physical evidence at the crash site and driver and witness
reports. In the meantime, a computer-sensor system (basically a series of magnetic loop pairs
connected to an on-line computer enabling collection of speeds and traffic volumes) was
developed. The sensors were embedded at 16 points along the main highway, Indiana
Highway 37. Using this system it was possible to identify accident-involved vehicles or the
platoon in which they had been travelling and thereby obtain pre-crash speeds, so accident
investigation was replaced by the computer-sensor system for the last few months of the
study.
Further information on the operation and output of the computer-sensor system was provided
by West and Dunn (1971). In order to test the reliability of the system, measures of pre-crash
speed for a group of 36 crashes were obtained using both available methods. It was found that
12
in a quarter of the cases the speed of the accident-involved vehicle or the platoon in which it
had been travelling could be identified confidently from the computer output (a result which
seemed to be regarded as an achievement rather than as a cause for misgivings about the
quality of the data). Some information was retrievable for the remaining crashes, but it was
not made clear how these less certain estimates were gained or treated.
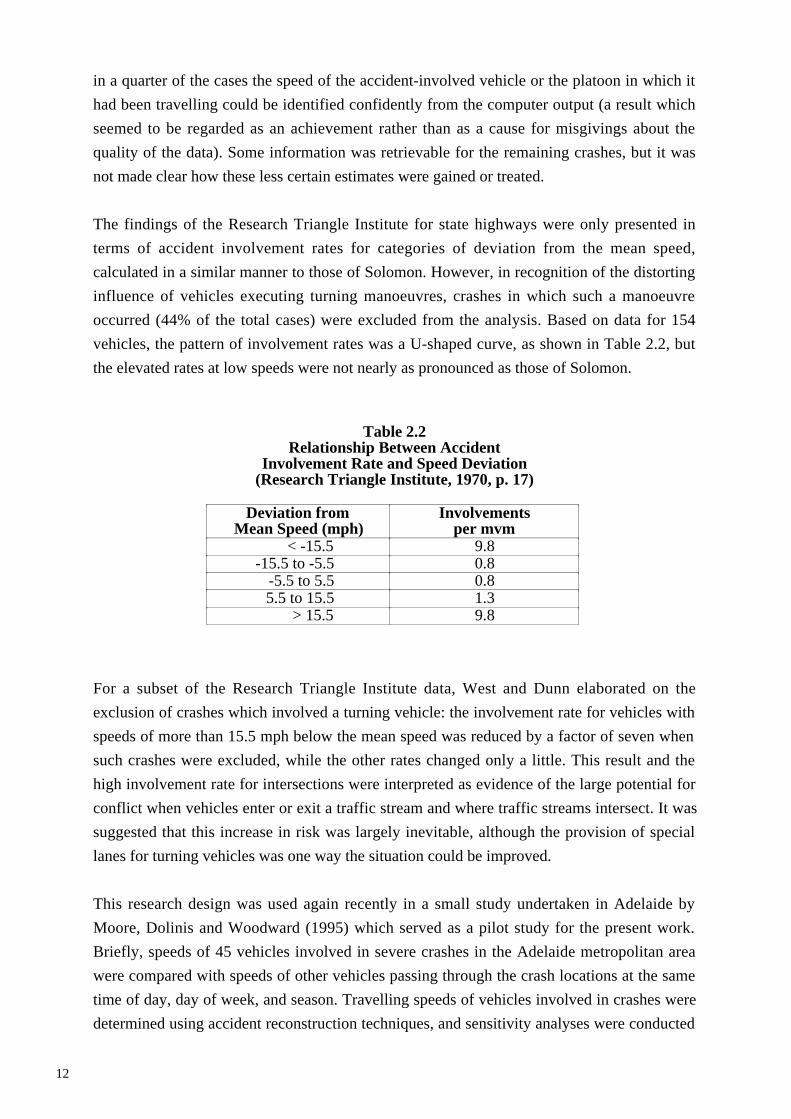
The findings of the Research Triangle Institute for state highways were only presented in
terms of accident involvement rates for categories of deviation from the mean speed,
calculated in a similar manner to those of Solomon. However, in recognition of the distorting
influence of vehicles executing turning manoeuvres, crashes in which such a manoeuvre
occurred (44% of the total cases) were excluded from the analysis. Based on data for 154
vehicles, the pattern of involvement rates was a U-shaped curve, as shown in Table 2.2, but
the elevated rates at low speeds were not nearly as pronounced as those of Solomon.
Table 2.2Relationship Between Accident
Involvement Rate and Speed Deviation(Research Triangle Institute, 1970, p. 17)
Deviation fromMean Speed (mph)
Involvementsper mvm
< -15.5 9.8-15.5 to -5.5 0.8
-5.5 to 5.5 0.85.5 to 15.5 1.3
> 15.5 9.8
For a subset of the Research Triangle Institute data, West and Dunn elaborated on the
exclusion of crashes which involved a turning vehicle: the involvement rate for vehicles with
speeds of more than 15.5 mph below the mean speed was reduced by a factor of seven when
such crashes were excluded, while the other rates changed only a little. This result and the
high involvement rate for intersections were interpreted as evidence of the large potential for
conflict when vehicles enter or exit a traffic stream and where traffic streams intersect. It was
suggested that this increase in risk was largely inevitable, although the provision of special
lanes for turning vehicles was one way the situation could be improved.
This research design was used again recently in a small study undertaken in Adelaide by
Moore, Dolinis and Woodward (1995) which served as a pilot study for the present work.
Briefly, speeds of 45 vehicles involved in severe crashes in the Adelaide metropolitan area
were compared with speeds of other vehicles passing through the crash locations at the same
time of day, day of week, and season. Travelling speeds of vehicles involved in crashes were
determined using accident reconstruction techniques, and sensitivity analyses were conducted

13
to examine effects of errors in these estimates of pre-crash speed. Overall, crash-involved
vehicles were relatively more frequent than controls in the highest speed categories, as shown
in Figure 2.3.
Figure 2.3Speeds of all Cases (solid columns)
and Control Vehicles (hatched columns)(Moore, Dolinis and Woodward, 1995)
0
10
20
30
Rel
ativ
e Fr
eque
ncy
(%)
Controls 5 16 46 121 110 68 40 29 12 3 Cases 0 1 2 7 5 6 7 8 2 7
< 35 35-44 45-54 55-64 65-74 75-84 85-94 95-104 105-114 ≥ 115
Speed Category (km/h)
The relative risk of involvement in a severe crash was calculated for vehicles in 60 km/h
zones. With 55-64 km/h used as the reference category, the risk of involvement in a severe
crash appeared to be elevated for vehicles travelling in excess of 75 km/h, as shown in Table
2.3.
Table 2.3Odds Ratios for Involvement in a Severe Crash in a 60 km/h Zone
(Moore, Dolinis and Woodward, 1995)
Speed(km/h)
No. CaseVehicles
No. ControlVehicles
OddsRatio
95% CI
< 55 2 65 0.6 0.1 - 3.555 - 64 6 117 1.0 -65 - 74 3 72 0.8 0.1 - 4.075 - 84 4 10 7.8 1.4 - 38.8
≥ 85 12 6 39.0 9.3 - 171N 27 270
14
These results must be viewed cautiously as the sample size was small, the comparison speeds
were collected up to 3 years after the crash occurred, and the degree of confounding by blood
alcohol concentration was unknown. However, the study demonstrated the feasibility of this
research design in an urban setting and ways of ameliorating the serious sources of bias found
in previous studies of this type.
2.2 Driver’s Characteristic Speed and Accident History
Interest in relating a driver’s speed on some occasion to his or her accident history has been
evident from at least the 1930s (Tilden, 1936). Early studies indicated that fast drivers,
defined variously, had greater experience of (recorded) crash involvement than relatively slow
drivers (DeSilva, 1940; Lefeve, 1956; Cleveland, 1959). However, this dichotomous
classification of speed behaviour meant that the relationship between speed and crash risk was
not depicted over a range of speeds.
From the early 1960s, the notion that an individual’s manner of driving on one occasion
would be linked to their past accident involvement was pursued in a series of studies using a
device known as a drivometer. This mechanical device could be fitted to a car to record
information such as the trip time, steering actions that changed the direction of the vehicle,
accelerator and brake applications, and vehicle speed. At least two studies that searched for
differences in drivometer variables between accident-free and accident-involved drivers found
no difference in the case of speed (Greenshields, 1963; Johns and Bundy, 1974).
This vein of research was taken up again by Wilson and Greensmith (1983). These authors
used the drivometer to record various aspects of driving behaviour of 100 volunteers. Males
and females differed in their manner of driving, taking into account the number of miles
driven per year (exposure). With regard to accident history, the overall suggestion from the
data was that accident-involved drivers had higher speeds and moved more continually in
traffic during the drivometer tests than other drivers. In particular, among males and females
with moderate exposure to driving, mean preferred speed on a clear stretch of road was lower
among those with no history of accidents than those who had been involved in accidents in
the past. Among males with high exposure to driving, mean clear speed did not distinguish
between those with and without prior accident-involvement, but the accident-free males
appeared to adjust their speeds to changing conditions more than the accident-involved males.
However, as this summary of results shows, there was no attempt to describe the full
functional form of the relationship between speed and crash involvement.
A study which compared the crash involvement of slow, moderate and fast drivers was
conducted by Munden (1967). It covered 31,000 vehicles travelling on rural main roads in the
15
south-east of England during 1962. At each of ten locations, speeds and registration numbers
were recorded in the evening peak flow of traffic, to try to identify regular travellers and gain
repeated measurements of their speeds.
To indicate a driver’s speed in relation to other traffic at the same time and location, the
absolute speed measurement for each vehicle was converted to a speed ratio, calculated as the
measured speed divided by the mean of the four preceding and the four following recorded
speeds. When data for the ten sites were combined, these speed ratios were also standardised.
In addition, adjustments were made for the likelihood of over-estimating the characteristic
speed deviation of the slowest and fastest drivers. The repeated measurements of speed
enabled the assumption that a driver has a characteristic relative speed to be examined, and
there was a reasonable degree of correlation between pairs of relative speeds for the same
vehicle from different locations.
Registration numbers were matched to those in about 14,000 accident records, where the
accident occurred in 1961 or 1962 but not necessarily on the roads surveyed. This allowed the
proportion of accident-involved drivers to be calculated for different categories of
standardised speed ratio (SSR). The main result, for drivers whose speeds were recorded at
least twice, was that the proportions took the form of a U-shaped curve: 10 per cent of drivers
with SSR less than -1.0 were accident-involved, around 5 per cent of drivers with SSR
between -1.0 and 0.59 were accident-involved, while almost 7 per cent of drivers with SSR of
at least 0.6 were accident-involved. It should be noted that the U-shaped pattern did not
emerge consistently in other groupings of the data, there was a large degree of variability in
the proportions for even the middle SSR categories, and small numbers hampered much of the
analysis. Munden interpreted these results with caution, recognising that speed per se may not
have had a causal role in the observed relationship, but that other characteristics of drivers
who chose to travel relatively fast or slowly might have been responsible for the elevated
accident-involvement at these extremes.
Another study which related drivers’ typical speeds and accident rates is that of Wasielewski
(1984). The aim was to examine factors which predicted risky driving, where speed was taken
as an indicator of risky driving. Speeds were recorded for vehicles using a two-lane road in
Michigan. Vehicles were photographed and some 2,600 registration numbers were matched
with state files. Repeated measurements of speed were obtained for about half of the sample;
the correlations between pairs of speeds for the same vehicle were relatively weak. However,
a positive correlation was found between the number of crashes a vehicle had been involved
in during the preceding seven years and the mean speed of vehicles in each crash-frequency
group.
16
A study was conducted in Australia by Fildes, Rumbold and Leening (1991) with the aim of
examining relationships between speed behaviour and a large number of possible contributory
factors, including driver, vehicle and trip characteristics, and driver attitudes. In addition, the
relationship between speed behaviour and five year accident history of the driver was
assessed.
Unobtrusive measurements of vehicle speeds were made on two urban arterial roads and on
two rural undivided highways in Victoria during 1989 and 1990. It is noteworthy that an
urban sample was obtained, since little work of this kind has been undertaken in an urban
setting. More than 700 drivers were stopped and interviewed after their speeds were recorded;
these drivers were asked whether they had been involved in a crash in the past five years and,
if so, to give details of when and how severe the crash was. As noted earlier, a problem with
this research design is that only drivers who have survived past crashes are able to be studied,
and since high-speed crashes are least likely to be survivable, it is possible that involvement
rates for high speeds may be systematically under-estimated.
Speed behaviour was found to be associated with many of the variables on which information
was collected when considered separately. Multivariate analyses for the urban data suggested
that the following factors were the most important indicators of a speeding driver: being aged
less than 34 years and having a high accident history; reporting a safe travelling speed that
was high; having a vehicle less than five years old; travelling on business and doing a large
amount of such travel each week. However, only a third of the variance in speed behaviour
was able to be explained.
For the urban sample a linear relationship between characteristic speed and crash involvement
was found. Drivers with speeds above the 85th percentile were more likely to have been
involved in a crash, than were drivers with speeds in the middle range, while drivers with
speeds below the 15th percentile were less likely. In addition, fast drivers were more likely to
have experienced multiple and more severe crashes than relatively slow drivers. Results for
the rural sample were consistent with those of the urban sample.
Fildes, Rumbold and Leening (1991) contrasted their results with those of Solomon (1964),
drawing attention to the fact that they found no evidence of elevated crash involvement for
drivers who travelled slowly, rather the reverse, but noting that their sample size was
relatively small and that few extreme speeds were recorded. It was also acknowledged that
self-reports of crash involvement were probably subject to error, however, it was pointed out
that another study had demonstrated self-reports to be more reliable than official records.
The results of Fildes, Rumbold and Leening (1991) are consistent with those of a study
carried out in England at about the same time. West, et al. (1993) recruited 48 drivers,
17
ostensibly to test an automated in-car route guidance system. Assessors recorded aspects of
the subject’s driving, including maximum and preferred speed, over a 50 mile test drive. A
high preferred speed was found to be positively associated with self-reported involvement in
at least one accident during the past three years. The models developed indicated that for each
1 km/h increase in preferred speed on the motorway, the odds of having had a crash in the
past 3 years increased by a factor of between 1.27 and 1.55.
The survivor bias inherent in most of these studies has already been mentioned, as well as the
need to assume that the characteristic speed applied at the time of involvement in a crash.
Also it is conceivable that a driver’s speeding behaviour may change after involvement in a
crash. A further difficulty with this approach is the required sample size. Crashes are
relatively rare events, so a large sample is needed in order to capture sufficient individuals
with recent crash involvement for a full analysis. It is not clear how far back the accident
history remains relevant, so while increasing this time span effectively increases the available
data, it also renders the method more dubious. These weaknesses in the method mean that it is
more useful for other purposes, such as characterising crash-involved drivers, than for
quantifying the relationship between speed and crash risk.
2.3 Correlational Studies
Studies which are not based on speeds of specific vehicles but rather relate some aggregate
indicator of speed to crash frequency are much more common than either of the preceding
study designs. This approach has the longest history of use to describe the role of speed in
crash causation (although, as will be discussed, it is not well-suited to this task). For example,
an article in the June 1931 issue of “The American City” with the title “Are traffic accidents
caused by speed?” reported that a correlation between monthly average speed and number of
crashes had been established from technical observations made on Rhode Island since 1924.
Studies based on group characteristics generally provide weaker evidence than studies based
on individual data. They are subject to further sources of bias and confounding, making the
results more open to interpretation, and there is a fundamental difficulty in attributing to
individual events (a single crash) a characteristic that was assessed at the group level (mean
speed or speed limit). As well as this inherent weakness, such studies have limited ability to
provide a complete description of the relationship between speed and crash involvement
because they are usually concerned with a selected part of the continuum of speeds. For
example, when correlational studies are used to examine the change in accident frequency
following a change in speed limit, the information obtained is restricted to a difference in
crash risk under two speed scenarios. Furthermore, in this circumstance mean speed is not
usually measured. It is presumed to have changed, but by an unknown amount, likely to have
18
been much less than the difference in the two posted limits (Finch, et al., 1994). Thus it is
very difficult to know precisely what the results of such correlational studies imply for the
speed and crash involvement relationship.
In addition to evaluating changes in accident frequency following changes in speed limits,
correlational designs are the basis for studies which model differences in accident rates across
sites or states or countries (sometimes called cross-sectional studies). The common aim is to
link variation in speed (limit) to variation in crash rate. In the first case this is done using (a
minimum of) one site and information from different time points, whereas in the latter
instance there are multiple sites but it is only necessary to have crash data from one time
interval. (By extension, complex models can be used to consider multiple sites and time
intervals.) All configurations suffer from similar problems with interpretation. In speed limit
evaluation studies relating to certain sites, the site characteristics are fixed, but other factors
which affect the crash rate may have varied (for example, traffic volume and season). In
models built on data from different places, there may be systematic differences between site
characteristics as well as differences in all of the other factors which affect the crash rate. To
appreciate the magnitude of this problem, consider that Fridstrom, et al. (1995) showed that
randomness and exposure accounted for 80 to 90 per cent of the observed variation in
accident counts from 68 provinces in four Nordic countries. Against this backdrop, effects of
speed limit or mean speed differences are likely to be hard to detect in the first place, as well
as being difficult to indisputably separate from other factors. The capacity of a model to
provide insights relevant to the real world is limited both by theoretical knowledge of
influential factors and the data that can actually be collected. Most correlational studies take
into account only a few potentially influential variables. This may be adequate when assessing
whether, for example, a change in speed limit made any difference to the accident rate, but is
not a sound basis for elucidating the relationship between speed and crash risk.
Hillman and Plowden (1986, cited in Finch, et al., 1994) identified at least two dozen
evaluations of speed limits dating back to 1935. Almost all studies indicated that the
imposition or lowering of a speed limit was accompanied by a reduction in accident
frequency. Most of this work contributes little to a detailed description of the relationship
between speed and crash risk, particularly where a speed limit was imposed without
documentation of what speeds actually were to begin with. The benefits claimed in many of
the studies reviewed by Hillman and Plowden are much larger than those suggested by recent
experience, perhaps reflecting an overly simple approach to analysis (see Lloyd, 1990), or
publication bias (Dickersin, 1990). During the past decade it has been increasingly recognised
that quite sophisticated techniques are required to confidently identify changes in accidents
associated with changes in speed limits. A good example is the work of Johansson (1996)
which included a time series analysis using both Poisson and negative binomial distributions
for accident frequency.
19
In one of the largest exercises of its type, Fieldwick and Brown (1987) modelled fatality
counts from 21 countries with different urban and rural speed limits. Most of the variation in
fatalities could be attributed to population size, although the fit of the model developed was
improved by including speed limit variables. Predictions from the model were that a reduction
in the urban limit from 60 km/h to 50 km/h, with the rural limit constant at 100 km/h, would
lead to a 28 per cent reduction in the fatality rate (per million population). A reduction in the
rural limit from 100 km/h to 90 km/h, with the urban limit constant at 60 km/h, was expected
to produce an 11 per cent decrease in the fatality rate. A 10 km/h reduction in both the urban
and rural limits, originally set at 60 km/h and 100 km/h, respectively, was predicted to result
in a 36 per cent decline in the fatality rate.
Evaluations of speed limit changes were recently revisited by Finch, et al. (1994). These
authors updated the work of Hillman and Plowden (1986, cited in Finch, et al., 1994) and
undertook a meta-analysis to ascertain the overall expected effect of a change in speed limit.
Only studies in which there was an initial speed limit were suitable for this analysis. Finch
and colleagues did not state the number of studies that were included in their data synthesis,
although they mentioned that the data set was sparse and dealt mainly with rural roads.
Overall, the percentage change in accidents was estimated to be 1.0 to 2.5 times the change in
speed limit (in mph). In other words, a 10 km/h reduction in (rural) speed limit was expected
to confer a 6 to 16 per cent decrease in the number of fatal accidents.
In an Australian context, Sliogeris (1992) analysed a change of speed limits on Melbourne’s
rural and outer freeway network. On 1 June 1987, the speed limit on these roads was raised
from 100 km/h to 110 km/h and in September 1989 the limit was lowered again to 100 km/h.
Analysis of crash data showed an increase in injury accident rate per kilometre travelled of
24.6 per cent in the ‘before 110’ to ‘during 110’ period and a decrease of 19.3 per cent in the
‘during 110’ to ‘after 110’ period in comparison with a control group.
These overviews indicate that the relationship between speed and crash risk is positive, at
least for that part of the spectrum of speeds considered, typically 80 to 100 km/h. However,
they quantify the relationship fairly crudely and cannot clarify whether successive increments
in speed (of 10 km/h, for example) are associated with a fixed or an escalating increase in
risk.
A noteworthy exception is the work of Nilsson (1990) in which a number of evaluations of
changes to speed limits in Sweden were amalgamated. The ratio of the fatality rates before
and after a change in speed limits was found to be proportional to the fourth power of the ratio
of the corresponding median speeds. The ratio of rates of casualty crashes before and after a
change in speed limit was proportional to the third power of the median speed ratio. Most of
this work related to roads outside built-up areas, and the limits concerned were high (90 to
20
110 km/h), which suggests some bounds on the extent to which these relationships may be
generalised.
A substantial body of work has been undertaken in relation to recent increases in speed limits
in the United States. An interest in effects of speed limits in that country has continued since
the nationwide 55 mph maximum speed limit was introduced in 1974, in response to the Arab
oil embargo rather than concern for safety. That year, however, the number of highway
fatalities was 16 per cent less than the previous year, an unprecedented drop outside of
wartime. The Transportation Research Board (1984) reviewed studies of the 55 mph limit and
concluded that after factors such as reduced travel and improved medical services were taken
into account, the new limit probably accounted for 5 to 10 per cent of the remarkable
reduction in fatalities.
In 1987 the United States Congress voted to allow states to increase the limit on rural
interstate highways to 65 mph, and subsequently, in November 1995, authorised states to set
their own speed limits. The most recent increases in limits have not been in place long enough
for sound evaluations to emerge (Graham, 1996), but the prior 65 mph limit was adopted by
40 states and effects were scrutinised in a number of studies. As summarised by Godwin
(1992), many of these studies found that road traffic fatalities tended to be higher following
the increase in the maximum limit, but very few could demonstrate a statistically significant
change, not surprising in view of the relative rarity of fatal crashes and hence the small
sample sizes available in single states. Congress also exempted the 65 mph roads from speed
monitoring, which is another reason why these studies provide uncertain information as to the
speed and crash involvement relationship.
Through the Transportation Research Board, Godwin (1992) obtained some speed data from
18 states that had moved to the 65 mph limit, as well as information on fatalities and
comparable data from 7 states that did not change their maximum limit. These data suggested
that average speeds had increased by 3 mph under the 65 mph limit (less than the 10 mph
difference in the maximum limit, as lack of compliance with the 55 mph limit was
widespread). Also, on roads to which the increased limit applied, fatalities had increased by
35 per cent, against a background trend of a 9 per cent increase on rural interstate highways
where the limit remained at 55 mph. An increase in fatalities was also evident when the rate
for rural interstate highways was compared with that for other roads within the same states.
Godwin also discussed four studies that had considered longer-term national trends: despite
different methodologies, all found evidence of a higher fatality rate on rural interstate
highways after the 65 mph limit was introduced.
There is a dissenting view, however. Lave and Elias (1994) argued that the 65 mph limit
saved lives when the change was evaluated at a system level. In their model, Lave and Elias
21
considered not the fatality rate for particular roads or collections of roads, but fatalities rates
for states as a whole. They argued that the increased speed limit might confer a safety benefit
through encouraging more traffic to use the interstate highways which were of superior design
and therefore safer than other roads, and through allowing police resources to be directed
elsewhere resulting in improved safety on other roads. This is not the place for a full
discussion of the potential pitfalls of the approach of Lave and Elias, suffice to say that as the
outcome variable used (in this case, statewide fatality rate) becomes more distant from the
event of interest (changes to speed limit on only a few roads), it is increasingly difficult to
interpret results of a model which inevitably over-simplifies a complex situation. The point to
be made in the context of the current review is that Lave and Elias do not argue that the 65
mph limit roads themselves became safer than they were when the limit was 55 mph.
Another theme in the literature, addressed sporadically by correlational studies, is that
variation in traffic speed is also a determinant of crash risk. This idea appears to be in a large
part derived from the work of Solomon (1964), particularly the results in terms of deviation
from mean speed which also had the U-shaped form. As discussed earlier, there are a number
of reasons why Solomon’s estimates of the crash risk associated with low speeds (deviations
below the mean) are unreliable. Nonetheless, the speed variation idea gained weight, more
through successive restatements than through good research, it would seem.
Conceptually it is possible to separate speed variance from mean speed, but practical
demonstrations of separate effects are difficult. This is because, in reality, both factors are
strongly tied to characteristics of the road which are fundamental determinants of the local
accident rate. (In theory, the role of speed variation would best be addressed by examining
accident rates for a set of roads that were matched for geometry and other characteristics, but
which had a different degree of speed variation for the same mean speed. While this is
unlikely to be feasible, the point is that any less rigorous approach will entail major problems
with interpretation of the underlying cause of differences in the accident rate. This point
seems not to have been fully appreciated by some researchers.)
In early research reflecting a version of the speed variation idea, Taylor (1965) sought criteria
for the allocation of speed zones, and proposed that non-normal variation in speed between
drivers at a particular location was due to some drivers being unable to evaluate the situation
properly. Taylor argued that the speed distribution itself provided information as to where
speed zones would be useful. He then examined changes in accident rates upon the
introduction of 51 speed zones on two-lane rural highways in Ohio during 1958 to 1962.
Taylor found that the greatest reductions in accident rates occurred where the speed
distribution changed from non-normal to normal, as indicated by skewness, after the
introduction of a speed zone. However, not all non-normal distributions became normal upon
the introduction of a speed zone. On the whole, this study raises more questions than it
22
answers. It was not stated whether the skewness that characterised non-normal distributions
was positive or negative, nor how mean speeds were affected. In the absence of such
information, the results cannot be fully interpreted and it remains possible that speed
dispersion was unduly credited with influence.
A decade later, Krzeminski (1976) re-examined the proposal that at locations where a
relatively large number of crashes had occurred the speed distribution was more likely to be
skewed than at sites with few crashes. This proposal was supported by data for 12 sites on
low-volume rural highways in Tippecanoe County, Indiana. Although it was reasoned that
skewness of the speed distribution indicated that drivers experienced perceptual difficulties at
that location, no demonstration of underlying causes was attempted.
A study to examine factors which influence speed variation and to quantify the relationship
between speed variation and accident rates was conducted by Garber and Gadirau (1988). The
underlying hypothesis was that the difference between design and posted speeds was the
major factor that influenced speed variation and thereby accident rates. Data for the study
were obtained from 36 sections of interstate highway in Virginia. Seven types of interstate
highway were covered and each section included was considered to represent its type and had
a posted speed limit of 55 mph. The design speeds for the sections varied from 40 mph to 70
mph, where this speed was (presumably judged to be) the maximum safe speed under
favourable conditions, and was used as a summary of the geometric characteristics of the
section.
The results of Garber and Gadirau indicated that the different types of highways had different
average speeds and variations in speed, despite having the same posted speed limit. Average
speed was found to increase with increasing design speed, that is, with better road geometry,
while speed variance decreased with increasing average speed. In addition, it was reported
that speed variance was a U-shaped function of the difference between design and posted
speeds, being minimum when this difference was 6 to 12 mph.
A negative correlation between accident rate and average speed was reported. Garber and
Gadirau recognised that this was unlikely to be a causal relationship and was most probably
due to the fact that the roads with the highest average speeds were better roads. It was also
found that accident rates increased as speed variance increased but, by contrast, this
relationship was implicitly regarded as causal. It was concluded that since accident rates
increased with increasing speed variance, and since speed variance was minimum when the
posted speed limit was some 5 to 10 mph below the design speed, changing posted speed
limits to within this band would minimise accident rates.
23
There are a number of grounds on which the appropriateness of the conclusions drawn by
Garber and Gadirau are questionable. To begin with, the measure of speed variation appears
to be extremely dependent on the number of very slow vehicles at a site; for example, at one
location the slowest 2 per cent of vehicles accounted for 47 per cent of speed variance. Thus
speed variance would seem to indicate the relative frequency of very slow vehicles at a site.
Furthermore, as far as it is possible to judge (visually and by partial re-analysis), the data
which supposedly showed a U-shaped relationship between speed variance and the difference
between design and posted speeds could equally well support a linear relationship. A linear
form would be readily interpretable: given that all speed limits were 55 mph, this form could
simply mean that highways with low design speeds have more slow moving vehicles since
they do not have good provision for passing slow vehicles and slow platoons develop,
whereas these are less common on highways with high design speeds. In any case, there was
no indication of how much of the fluctuation in speed variance was accounted for by design
speed, and within the data there is a suggestion that other factors over-ride this influence, in
that for rural and urban interstate highways with similar design speeds, the measures of speed
variation are markedly different. Thus it is possible that the results relating to speed variance
merely confirm what was deduced from the relationship between average speed and accident
rates, that better roads have lower accident rates, not directly through speed variation but
through features which produce this, such as ease of overtaking and special provision for
turning vehicles.
The Transportation Research Board (1984) of the United States discussed the issue of mean
speed versus speed variance in its review of the effects of the nationwide 55 mph speed limit.
The improvements in safety associated with that speed limit were considered to have resulted
from both slower speeds and a more uniform pace of travel. It was suggested that the
persistence of reduced fatality rates over the decade following the implementation of the 55
mph limit, despite some increases in mean speeds, may have been due in part to the
maintenance of reduced variation in speeds. However, this was largely conjecture, as mean
speeds increased on urban interstates, by a few miles per hour only, but were stable on other
types of highway. Also, precise comparisons of speed variation over time were not possible as
there were major changes to the way the measurements were obtained. Furthermore,
significant changes to other factors influencing fatality rates, such as vehicle crashworthiness,
occurred over the same period. It was concluded that it was not clear to what extent speed
variation and mean speed independently influenced crash involvement and it was uncertain
how much weight should be given to each factor.
While this conclusion would seem reasonable, an alternative view has been put forward by
Lave (1985), who claimed to have separated the influences of mean speed and speed variation
on fatality rates and to have found no effect related to mean speed alone. For six types of
highway, multiple regression analyses were performed on data from up to 50 states. Data
24
points included the average speed for that type of highway, the number of fatalities per 100
million vehicle miles, and the 85th percentile speed. Except possibly for rural interstates, the
model which was used to demonstrate the superior influence of speed variation (in this case,
the difference between the mean speed and the 85th percentile speed) does not actually fit the
data very well. Furthermore, as pointed out by Godwin and Kulash (1988), the data for each
state are extremely aggregated and, rather than depicting speeds on single roads at certain
times, relate to many roads and many times, so that the meaning of the variance measure is
uncertain. Lastly, judging the relative causal influence of a factor from its impact within a
regression model is a very dubious practice (Neter, et al., 1990). A model may prefer one
variable over another very closely related variable (speed variance over mean speed) for
pragmatic mathematical reasons that give no insight as to which is the primary causal
variable.
Baruya and Finch (1994) recently investigated the role of speed variance and other aspects of
the speed distribution on accidents on rural roads in Britain. Results suggested effects of both
mean speed and the coefficient of variation of the speed distribution (a measure of speed
dispersion) on the occurrence of accidents. These relationships were exponential rather than
linear. On roads where mean speed was relatively high, the coefficient of variation tended to
be comparatively low. This pattern was seen in cross-sectional data (a snap-shot of the current
situation) and does not necessarily imply that changing the mean speed will actually influence
the variance. Assuming that it did, however, Baruya and Finch showed that the increase in the
accident rate associated with a certain increase in mean speed would overwhelm any
reduction that might accrue through a reduced coefficient of variation.
Recent work by Schmidt (1996) provides further context for the speed variation idea.
Accidents rates on two-lane rural roads in Germany were modelled. The accident rate
decreased as the quality of the construction of the stretch of road increased. The dominant
influences on the accident rate were alignment and width of the carriageway. Together with
median speed, these variables explained about half the variation in accident rates, with the
speed variable accounting for approximately 7 per cent of the total variance. The standard
deviation of the speed distribution did not contribute additional predictive capacity to the
model.
Finally, it should be noted that a body of recent work concerning renewed enforcement of
speed limits (for example: Cameron, Cavallo and Gilbert, 1992; Winnett, 1994; Stuster,
1995), while generally confirming safety benefits of this activity, does not provide direct
information about the relationship between speed and crash occurrence. Also, reductions in
speed limits in residential areas have been associated with reductions in crashes, and although
this finding is not universal, it is widely agreed that neighbourhood speed limits have safety
benefits (see the review of Brindle, 1996). These studies are plagued by small numbers which
25
undermines their capacity to detect effects of interest. Due to the study designs, the residential
contexts, and the use of devices to constrain speeds, these studies yield uncertain information
about travelling speed and the likelihood of crash involvement.
2.4 Summary
Evidence from correlational studies suggests there is a positive association between speed and
crash involvement. This type of study is unable to provide full details of the relationship,
however.
Three studies conducted in the United States more than 25 years ago attempted to enumerate
the relationship between speed and crash involvement using data from individual crashes.
These studies concluded that crash involvement was a U-shaped function of vehicle travelling
speed. The studies were subject to methodological problems, with the consequence that the
meaning of the results is not certain. In particular, it is debatable as to whether the elevated
involvement rates found at low speeds were due to bias, to vehicles undertaking slow
manoeuvres, or to drivers genuinely electing to travel slowly.
Studies which have linked drivers’ speeds and accident histories have, on the whole, not
supported a U-shaped relationship between speed and crash involvement. In particular, a
recent Australian study found that the slowest drivers had the least experience of crashes,
while the fastest drivers had the greatest experience of crashes.
Progress in determining the nature of the relationship in question would appear to require
further use of the most direct study design, bearing in mind and attempting to overcome past
deficiencies. Estimates of pre-crash speed are a potential weakness of the approach, but this
could be improved using contemporary accident reconstruction methods and computer
programs (in the absence of a representative and valid cohort study using ‘black box’ speed
recorders). In addition, care should be taken to ensure that all vehicles contributing to the data
set were actually travelling at a free speed and that controls are truly comparable.
26
3. METHOD
The current study had three phases: the case-control risk estimation phase, the hypothetical
crash outcome phase and the examination of the relationship between speed and alcohol. The
methods used in each of the phases are presented in the sections below.
3.1 Case-Control Study Risk Estimation
This part of the study used a case-control design in which the travelling speeds of vehicles
involved in crashes from which at least one person was transported by an ambulance were
compared with the speeds of other vehicles passing through the crash locations. The study
was conducted in 60 km/h speed limit zones in the Adelaide metropolitan area.
3.1.1 Case Vehicle Selection Criteria
The following criteria were used for the selection of case vehicles:
• Crash was in the Adelaide metropolitan area
• Road was 60 km/h speed limit zone
• Not on a section of road with an advisory speed sign of less than 60 km/h
• Case vehicle was a car or car derivative (eg station wagon or utility)
• At least one person was transported from the crash scene by ambulance
• Case vehicle had a free travelling speed prior to the crash
• Case vehicle not executing an illegal manoeuvre prior to the start of the crash sequence
• Case vehicle driver did not suffer from a medical condition that caused the crash
• Case vehicle driver had a zero blood alcohol concentration (BAC)
• Sufficient information was available to carry out a computer-aided crash reconstruction
• Case vehicle did not roll over
• Crash did not occur while it was raining
Cases were restricted to crashes occurring in the Adelaide metropolitan area in 60 km/h speed
zones in the interest of uniformity. Higher speed zones would have had fundamentally
different speed distributions which would have made the case-control analysis more
complicated to perform and the results harder to interpret. Sections of road with advisory
speed signs of less than 60 km/h were excluded for similar reasons. Requiring the case vehicle
to be a car or car derivative was also specified in an attempt to get a homogeneous sample of
cases.
27
An injury severe enough to require ambulance transport was used as the crash severity
criterion. This was based on the importance of injury as opposed to property damage in the
crash consequences. It was also a criterion which could readily be used at the scene of the
crash.
The case vehicles must have had a free travelling speed prior to the crash. A travelling speed
was defined as the speed of a vehicle moving along a mid-block section of road, or with right
of way through an intersection, and not slowing to join, or accelerating away from, a traffic
stream. This criterion operationally defined travelling speed as it is popularly understood and
aimed to ensure that the association between travelling speed and crash involvement was not
confused by the inclusion of vehicles executing (necessarily slow) manoeuvres or disobeying
right-of-way rules.
Vehicles executing illegal manoeuvres prior to the crash sequence were excluded as cases
since they would have had other high risk factors involved. For example, going through a red
light increases the chance of a crash independent of travelling speed.
In order to assess the relationship between travelling speed and the risk of crash involvement
without possible confounding by alcohol impairment, a case was included only if the driver’s
BAC was measured and found to be zero.
There also had to be sufficient information available for a computer-aided reconstruction of
the crash to be performed. In some cases, vehicles were removed before the arrival of Unit
personnel, and/or the point of impact and the final positions of the vehicles could not be
determined. These cases were abandoned.
Crashes in which the case vehicle rolled over were excluded due to the greatly increased
difficulty in reconstruction. Crashes that occurred while it was raining were excluded due
mainly to the difficulty in obtaining control data under the same weather conditions.
In summary, the conditions imposed on the selection of case vehicles were designed to ensure
that the study would yield valid estimates of the relative risk of a car travelling at a free speed
in a 60 km/h zone becoming involved in a casualty crash compared to the risk for a car
travelling at 60 km/h.
28
3.1.2 Case Vehicle Investigation Procedure
The following procedure was used in the investigation of crashes:
• Notification of crash by ambulance radio or paging service
• Attendance at scene by RARU personnel
• Judgement of case suitability based on selection criteria
• Photographs and measurements of scene
• Photographs and measurements of vehicles
• Interviews with police, participants and witnesses
• Review of information collected by the police
• Computer-aided reconstruction of crash
• Review of case material and reconstruction by expert panel
• Final decision on case suitability and estimated travelling speeds
The primary method of being advised of the occurrence of a vehicle accident was to listen to
the ambulance radio frequency on a hand held scanner. This provided notification of crashes
at the same time as an ambulance was informed of the location. However, when an ambulance
was despatched from a depot rather than on the road, notification of the ambulance was by
phone and not transmitted on the radio. The South Australian Ambulance Service notified the
Road Accident Research Unit (RARU) of these crashes by means of a paging service.
Upon the receipt of notification, RARU personnel proceeded directly to the crash scene. On
arrival, a quick survey was made to see if the crash met the selection criteria. If it appeared
that the case met the criteria, one of the crash investigation team then photographed the scene
and the vehicles involved while the other member interviewed police, participants and
witnesses. Relevant measurements of the vehicles and the scene were also made. In some
cases, vehicles were followed up at crash repairers for further photographs and measurements.
The police accident report on the crash was reviewed to obtain further crash details and
verification of zero blood alcohol concentration for drivers who were not breath tested by
police or RARU personnel at the scene.
If the crash was found to satisfy the criteria listed in the previous section it was then
reconstructed using computer-aided reconstruction techniques to obtain the speeds of the
vehicles on impact and, when the necessary additional information was available, the
travelling speeds of the vehicles.
All information about the crash, including the crash reconstruction, was then reviewed by an
expert panel to determine the suitability of the case and the validity of the reconstruction.
29
Further work on the reconstruction was carried out if necessary with the results being re-
reviewed by the panel.
A final decision was then made about the inclusion of the case in the study and the travelling
speeds of the vehicles involved.
Data collection was concentrated during the hours of 9:30am-4:30pm, Monday to Friday as
these times had the highest number of non-alcohol crashes in Adelaide. Some cases were also
collected at nights and on weekends. Peak hour traffic times were avoided due to the reduced
incidence of free speed travelling during those times.
3.1.3 Determining Speeds of Case Vehicles
The pre-crash travelling speeds of the case vehicles were determined using accident
reconstruction techniques. This was made possible by the detailed investigations of the
crashes at scene. Features of the crash such as tyre marks, impact points, final positions of
vehicles, damage to vehicles, and participant and witness statements were all used in the
reconstruction process.
Considerable use was made of the SMAC (Simulation Model of Automobile Collisions)
computer program that was developed by Ray McHenry at the (then) Cornell Aeronautical
Laboratory of Cornell University about 30 years ago.
SMAC, despite the inclusion of the word “simulation” in the name, is a true reconstruction
program in which each step has been developed on the basis of physical testing and studies of
vehicle dynamics. In application, it is an iterative program in which a collision between two
cars is modelled by starting with the alignment of the cars on impact, which can be
determined from the damage to the cars, and estimating impact velocities. The predicted post-
impact motions of the vehicles are then compared with the actual motions, deduced from skid
marks and the rest positions. If necessary, adjustments are made to the modelled impact
geometry and impact velocities until a satisfactory match is obtained.
Having been developed for the National Highway Traffic Safety Administration (NHTSA),
the SMAC program was available in the public domain and now is used in a number of
commercially available packages, such as ED-SMAC. A simplified pre-processor for SMAC,
CRASH (Cornell Reconstruction of Accident Speeds on the Highway) was also developed in
the1970s. It enables a less accurate estimate of impact speed to be made from the nature and
extent of the collision damage to a car. McHenry, with his son Brian McHenry, has continued
to develop both SMAC and CRASH and so the Road Accident Research Unit (RARU)
30
entered into an arrangement whereby the latest versions of both programs were made
available and Brian McHenry visited Adelaide for a week to instruct RARU staff in their use.
Subsequently, during the study, in some cases the crash data and the RARU reconstruction
were sent to Brian McHenry in North Carolina for assessment and, if necessary, a re-run of
what they now refer to as the M-SMAC program.
Other methods were also used to establish both impact and travelling speeds. They are all
described in some detail in Volume 2 of this report, together with a description of the methods
used in each case.
3.1.4 Control Vehicle Selection Criteria
The following criteria were used in the selection of control vehicles:
• Same location, weather conditions, day of week, and time of day as the crash
• Same direction of travel as the case vehicle
• Car or car derivative
• Free travelling speed
Control vehicles were matched to the case vehicles based on the location of the crash,
direction of travel, the time of day (within 1/2 hour) and the day of week. The control vehicles
also had to be car or car derivatives and were required to have a free travelling speed as
defined for the case vehicles. Control speeds were also measured in the same weather
conditions, which meant a dry road in almost all cases.
3.1.5 Measuring Speeds of Control Vehicles
Among the controls meeting the selection criteria, a random sample had their speed measured
by a member of the Unit using a laser speed meter. This meter can measure the speed of a
specified car to within 1 km/h from distances up to 1 km away. The minimum distance from
the meter to the car while collecting controls was 200 metres.
The laser speed meter that was used is similar in appearance to a video camera. Even so,
every effort was made to avoid alerting the drivers to the presence of speed measuring
equipment. Checks were made of the behaviour of drivers travelling in the opposite direction
to ensure that none of them were flashing their lights to warn oncoming drivers to slow down.
After the speed of a randomly selected control vehicle had been recorded, two-way radios
were used to alert a police random breath testing unit (set up further down the roadway by

31
previous arrangement) of the approach of the desired vehicle. The police then stopped this
vehicle and carried out a breath alcohol test on the driver. As the vehicle had been selected
randomly, and well before the driver could be seen, this operation was treated as an extension
of normal random breath testing operations.
Testing continued until four controls with a driver blood alcohol concentration (BAC) of zero
were collected for each case vehicle. These four then formed the control group for that case.
Part way through the study, the use of police to stop the controls became difficult to arrange
so only a small proportion of the final control sample had verified zero BAC readings (7.3%).
However, it is felt that this does not have a meaningful effect, if any, on the results of the
study since only a very few of all the controls tested did in fact have a positive BAC (3%) and
the differences in average speed between zero BAC and positive BAC drivers was found to be
only a few km/h (see Sections 3.3 and 4.3).
3.2 Hypothetical Crash Outcome Method
Additional information about the effects of travelling speed was obtained by calculating what
the change in velocity at impact (delta V) for those people injured in the crash would have
been if the case vehicle had been travelling at a different speed, using methods similar to
those applied in the recent Road Accident Research Unit study of speed effects in fatal
pedestrian collisions (McLean, et al., 1994).
The calculated travelling speed for the case vehicle was changed, if necessary, according to
the hypothetical scenario. All other crash factors were kept constant including points of
impacts on vehicles. If the driver of the case vehicle reacted before the collision, by applying
brakes, the distance away from the crash site (calculated using reaction times) when he or she
reacted was used as the starting point for the scenario. Full details of the calculations used are
presented in Volume 2 of this report.
The resulting crash severity, measured by change in velocity at impact, for all persons injured
was calculated and compared to the original crash severity.
The following hypothetical scenarios were examined:
1. Uniform 5 km/h speed reduction by all case vehicles
2. Uniform 10 km/h speed reduction by all case vehicles
3. Speed limit 50 km/h with similar compliance to that at present
4. Speed limit 50 km/h with similar compliance (only cases on local streets)
5. Speed limit 60 km/h with total compliance (no vehicles travelling faster than 60 km/h)
32
Under Scenario 1, all case vehicles were assumed to have a travelling speed of 5 km/h less
than their calculated travelling speed.
Under Scenario 2, all case vehicles were assumed to have a travelling speed of 10 km/h less
than their calculated travelling speed.
Under Scenario 3, all vehicles that were calculated as travelling over 60 km/h were assumed
to be travelling 10 km/h slower; all vehicles calculated as travelling between 50 and 60 km/h
were assumed to be travelling at 50 km/h; and all vehicles calculated as travelling under 50
km/h did not have their speeds changed. This scenario was intended as a first approximation
estimate of the effect of a change in speed limit from 60 to 50 km/h.
Scenario 4 was the same as Scenario 3 except that the reductions were only applied to crashes
occurring on a local street; crashes on main roads did not have their speeds altered. This
scenario was intended as a first approximation estimate of the effect of a change in speed limit
from 60 to 50 km/h on local streets only.
Under Scenario 5, all case vehicles with a calculated travelling speed above 60 km/h were
assumed to be travelling at 60 km/h.
There is virtually no evidence in the literature dealing with the risk of ambulance transport by
change in vehicle velocity in a crash so calculating hypothetical reduced rates of injury in
these scenarios could not be done. However, under the hypothetical scenarios a large
proportion of the crashes would not have happened so this is used as the main measure of the
effect of the scenarios.
3.3 Relationship Between Speed and Alcohol
It was originally planned that the collection of data on the driver’s blood alcohol
concentration (BAC) and the travelling speed of the control group would also allow the
relationship between BAC and travelling speed to be examined. However, the fact that almost
all day time drivers were sober made this infeasible in the context of the case-control study.
Therefore a separate study was set up to measure this relationship. The speed of an
approaching car was measured using a laser speed meter 200-300 metres before a signalised
intersection. When the car stopped at this intersection for a red light, the driver was
approached by a Road Accident Research Unit (RARU) staff member and a voluntary breath
alcohol test was requested using a procedure developed by RARU (Holubowycz, McLean and
McCaul, 1991). Testing was conducted at night in 60 km/h zones at 5 sites in the Adelaide
metropolitan area.
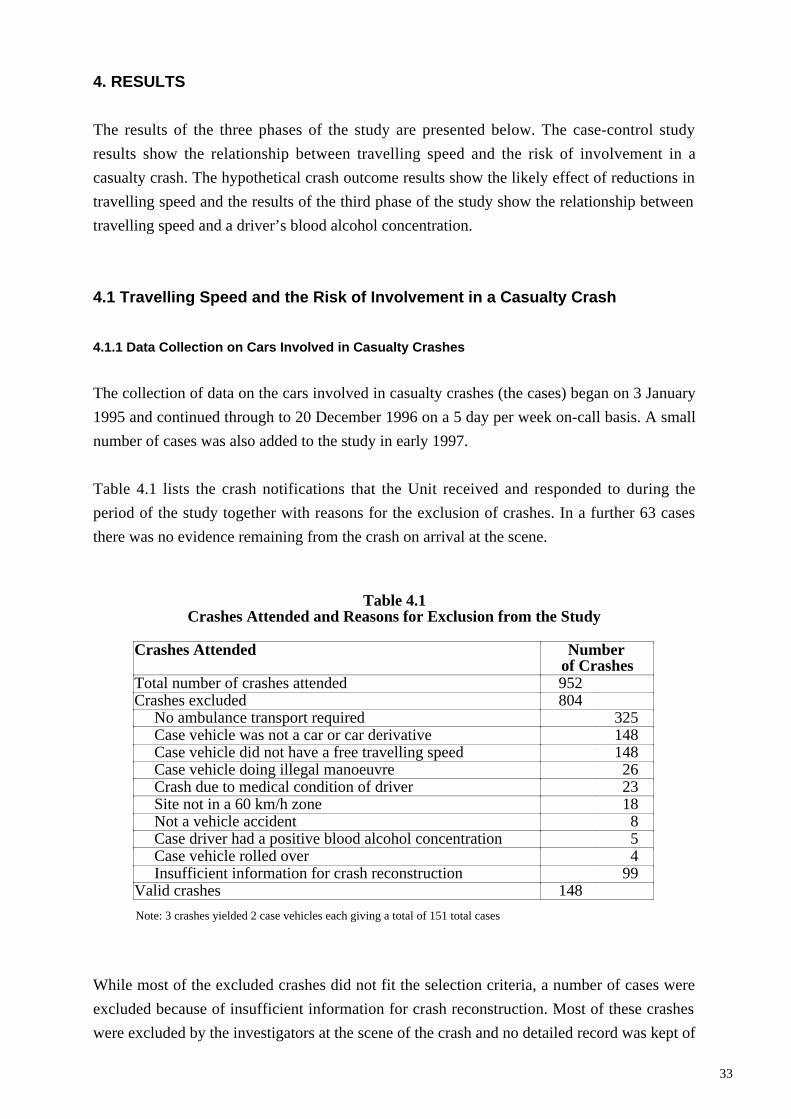
33
4. RESULTS
The results of the three phases of the study are presented below. The case-control study
results show the relationship between travelling speed and the risk of involvement in a
casualty crash. The hypothetical crash outcome results show the likely effect of reductions in
travelling speed and the results of the third phase of the study show the relationship between
travelling speed and a driver’s blood alcohol concentration.
4.1 Travelling Speed and the Risk of Involvement in a Casualty Crash
4.1.1 Data Collection on Cars Involved in Casualty Crashes
The collection of data on the cars involved in casualty crashes (the cases) began on 3 January
1995 and continued through to 20 December 1996 on a 5 day per week on-call basis. A small
number of cases was also added to the study in early 1997.
Table 4.1 lists the crash notifications that the Unit received and responded to during the
period of the study together with reasons for the exclusion of crashes. In a further 63 cases
there was no evidence remaining from the crash on arrival at the scene.
Table 4.1Crashes Attended and Reasons for Exclusion from the Study
Crashes Attended Numberof Crashes
Total number of crashes attended 952Crashes excluded 804 No ambulance transport required 325 Case vehicle was not a car or car derivative 148 Case vehicle did not have a free travelling speed 148 Case vehicle doing illegal manoeuvre 26 Crash due to medical condition of driver 23 Site not in a 60 km/h zone 18 Not a vehicle accident 8 Case driver had a positive blood alcohol concentration 5 Case vehicle rolled over 4 Insufficient information for crash reconstruction 99Valid crashes 148
Note: 3 crashes yielded 2 case vehicles each giving a total of 151 total cases
While most of the excluded crashes did not fit the selection criteria, a number of cases were
excluded because of insufficient information for crash reconstruction. Most of these crashes
were excluded by the investigators at the scene of the crash and no detailed record was kept of
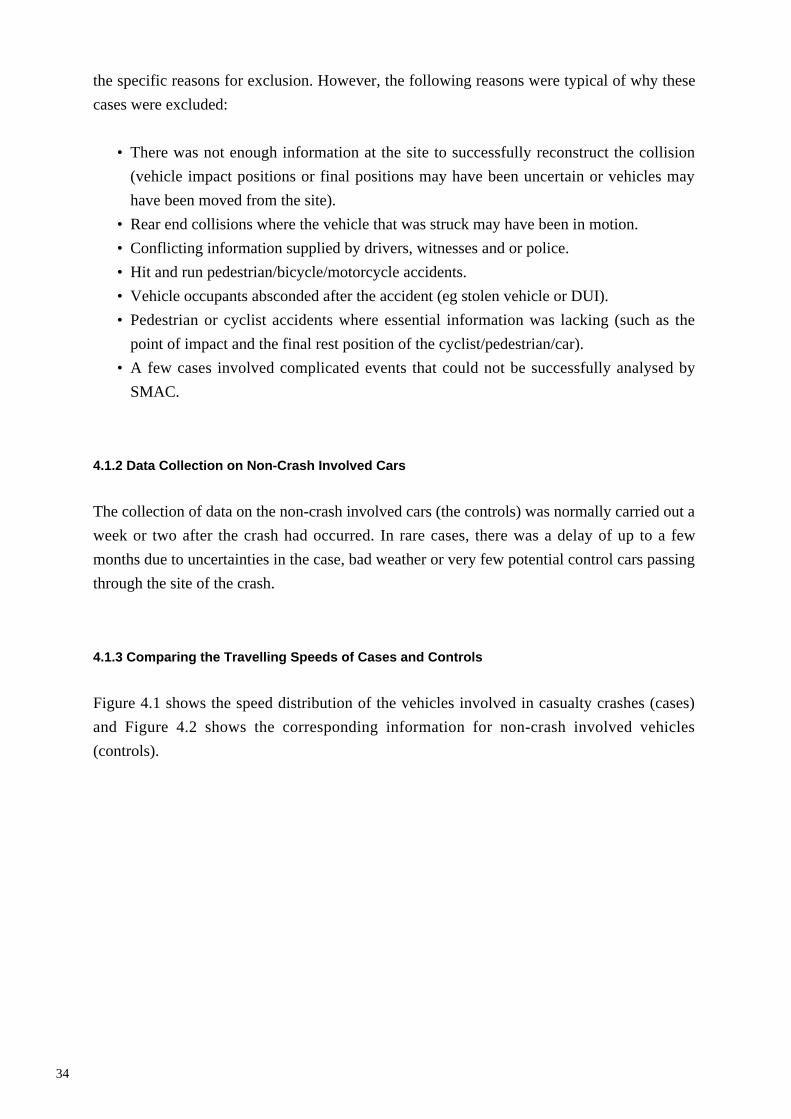
34
the specific reasons for exclusion. However, the following reasons were typical of why these
cases were excluded:
• There was not enough information at the site to successfully reconstruct the collision
(vehicle impact positions or final positions may have been uncertain or vehicles may
have been moved from the site).
• Rear end collisions where the vehicle that was struck may have been in motion.
• Conflicting information supplied by drivers, witnesses and or police.
• Hit and run pedestrian/bicycle/motorcycle accidents.
• Vehicle occupants absconded after the accident (eg stolen vehicle or DUI).
• Pedestrian or cyclist accidents where essential information was lacking (such as the
point of impact and the final rest position of the cyclist/pedestrian/car).
• A few cases involved complicated events that could not be successfully analysed by
SMAC.
4.1.2 Data Collection on Non-Crash Involved Cars
The collection of data on the non-crash involved cars (the controls) was normally carried out a
week or two after the crash had occurred. In rare cases, there was a delay of up to a few
months due to uncertainties in the case, bad weather or very few potential control cars passing
through the site of the crash.
4.1.3 Comparing the Travelling Speeds of Cases and Controls
Figure 4.1 shows the speed distribution of the vehicles involved in casualty crashes (cases)
and Figure 4.2 shows the corresponding information for non-crash involved vehicles
(controls).
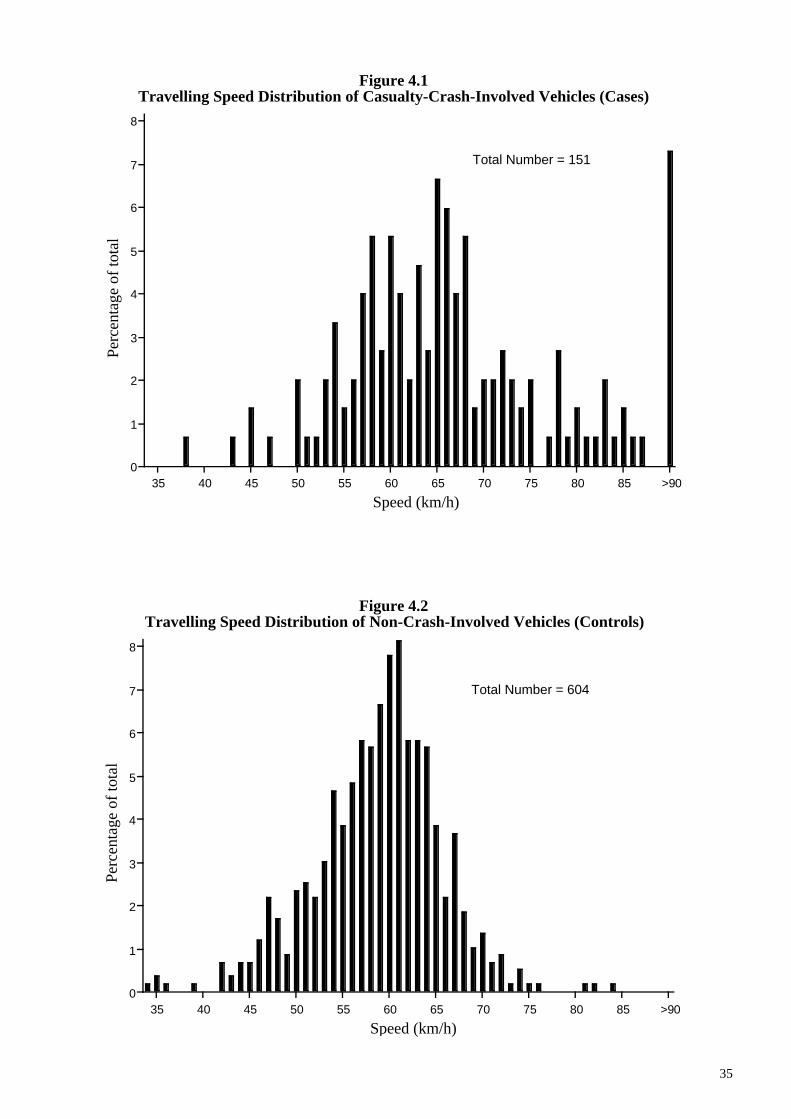
35
Figure 4.1Travelling Speed Distribution of Casualty-Crash-Involved Vehicles (Cases)
35 40 45 50 55 60 65 70 75 80 85 >900
1
2
3
4
5
6
7
8
Speed (km/h)
Perc
enta
ge o
f to
tal
Total Number = 151
Figure 4.2Travelling Speed Distribution of Non-Crash-Involved Vehicles (Controls)
.
35 40 45 50 55 60 65 70 75 80 85 >900
1
2
3
4
5
6
7
8
Speed (km/h)
Perc
enta
ge o
f to
tal
Total Number = 604
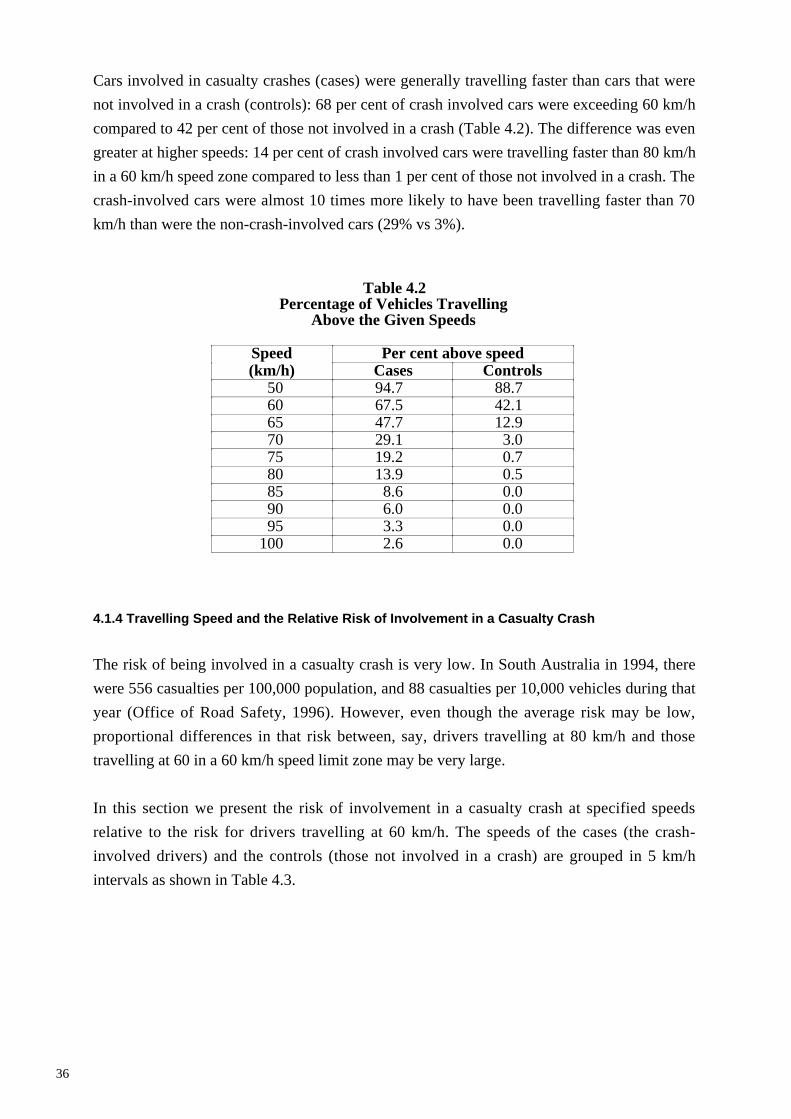
36
Cars involved in casualty crashes (cases) were generally travelling faster than cars that were
not involved in a crash (controls): 68 per cent of crash involved cars were exceeding 60 km/h
compared to 42 per cent of those not involved in a crash (Table 4.2). The difference was even
greater at higher speeds: 14 per cent of crash involved cars were travelling faster than 80 km/h
in a 60 km/h speed zone compared to less than 1 per cent of those not involved in a crash. The
crash-involved cars were almost 10 times more likely to have been travelling faster than 70
km/h than were the non-crash-involved cars (29% vs 3%).
Table 4.2Percentage of Vehicles Travelling
Above the Given Speeds
Speed Per cent above speed(km/h) Cases Controls
50 94.7 88.760 67.5 42.165 47.7 12.970 29.1 3.075 19.2 0.780 13.9 0.585 8.6 0.090 6.0 0.095 3.3 0.0
100 2.6 0.0
4.1.4 Travelling Speed and the Relative Risk of Involvement in a Casualty Crash
The risk of being involved in a casualty crash is very low. In South Australia in 1994, there
were 556 casualties per 100,000 population, and 88 casualties per 10,000 vehicles during that
year (Office of Road Safety, 1996). However, even though the average risk may be low,
proportional differences in that risk between, say, drivers travelling at 80 km/h and those
travelling at 60 in a 60 km/h speed limit zone may be very large.
In this section we present the risk of involvement in a casualty crash at specified speeds
relative to the risk for drivers travelling at 60 km/h. The speeds of the cases (the crash-
involved drivers) and the controls (those not involved in a crash) are grouped in 5 km/h
intervals as shown in Table 4.3.
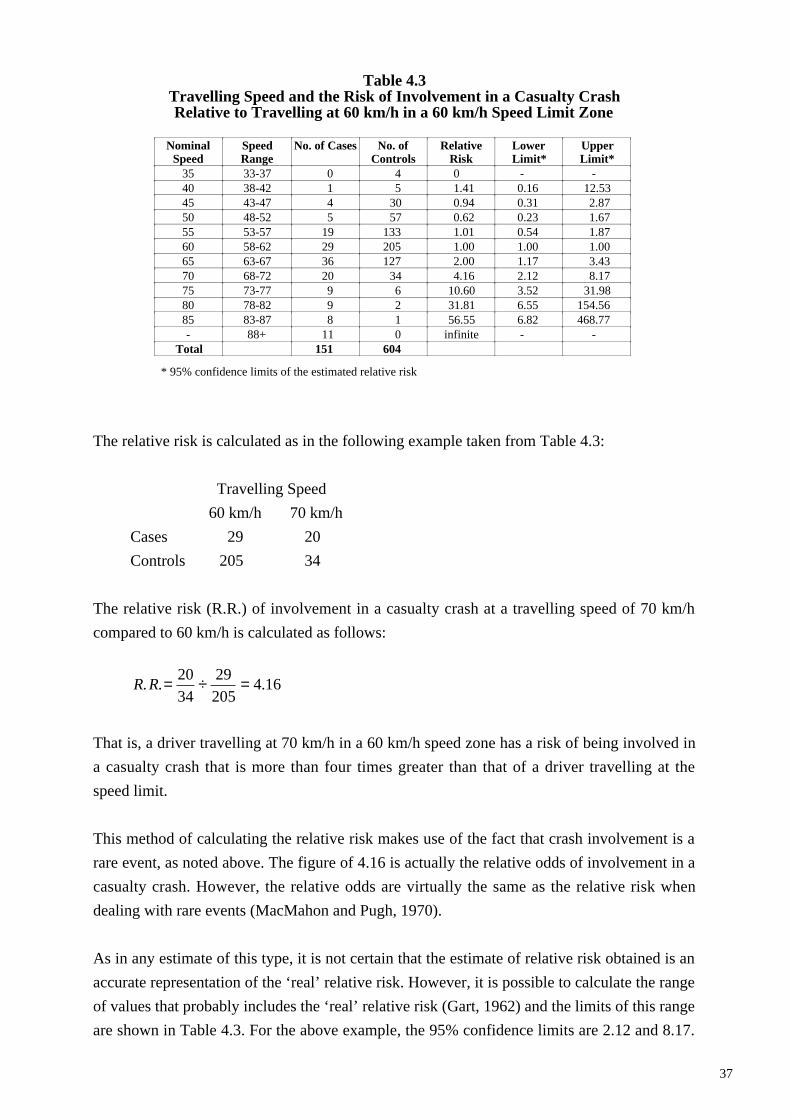
37
Table 4.3Travelling Speed and the Risk of Involvement in a Casualty CrashRelative to Travelling at 60 km/h in a 60 km/h Speed Limit Zone
NominalSpeed
SpeedRange
No. of Cases No. ofControls
RelativeRisk
LowerLimit*
UpperLimit*
35 33-37 0 4 0 - -40 38-42 1 5 1.41 0.16 12.5345 43-47 4 30 0.94 0.31 2.8750 48-52 5 57 0.62 0.23 1.6755 53-57 19 133 1.01 0.54 1.8760 58-62 29 205 1.00 1.00 1.0065 63-67 36 127 2.00 1.17 3.4370 68-72 20 34 4.16 2.12 8.1775 73-77 9 6 10.60 3.52 31.9880 78-82 9 2 31.81 6.55 154.5685 83-87 8 1 56.55 6.82 468.77- 88+ 11 0 infinite - -
Total 151 604
* 95% confidence limits of the estimated relative risk
The relative risk is calculated as in the following example taken from Table 4.3:
Travelling Speed
60 km/h 70 km/h
Cases 29 20
Controls 205 34
The relative risk (R.R.) of involvement in a casualty crash at a travelling speed of 70 km/h
compared to 60 km/h is calculated as follows:
R. R.= 2034
÷ 29205
= 4.16
That is, a driver travelling at 70 km/h in a 60 km/h speed zone has a risk of being involved in
a casualty crash that is more than four times greater than that of a driver travelling at the
speed limit.
This method of calculating the relative risk makes use of the fact that crash involvement is a
rare event, as noted above. The figure of 4.16 is actually the relative odds of involvement in a
casualty crash. However, the relative odds are virtually the same as the relative risk when
dealing with rare events (MacMahon and Pugh, 1970).
As in any estimate of this type, it is not certain that the estimate of relative risk obtained is an
accurate representation of the ‘real’ relative risk. However, it is possible to calculate the range
of values that probably includes the ‘real’ relative risk (Gart, 1962) and the limits of this range
are shown in Table 4.3. For the above example, the 95% confidence limits are 2.12 and 8.17.
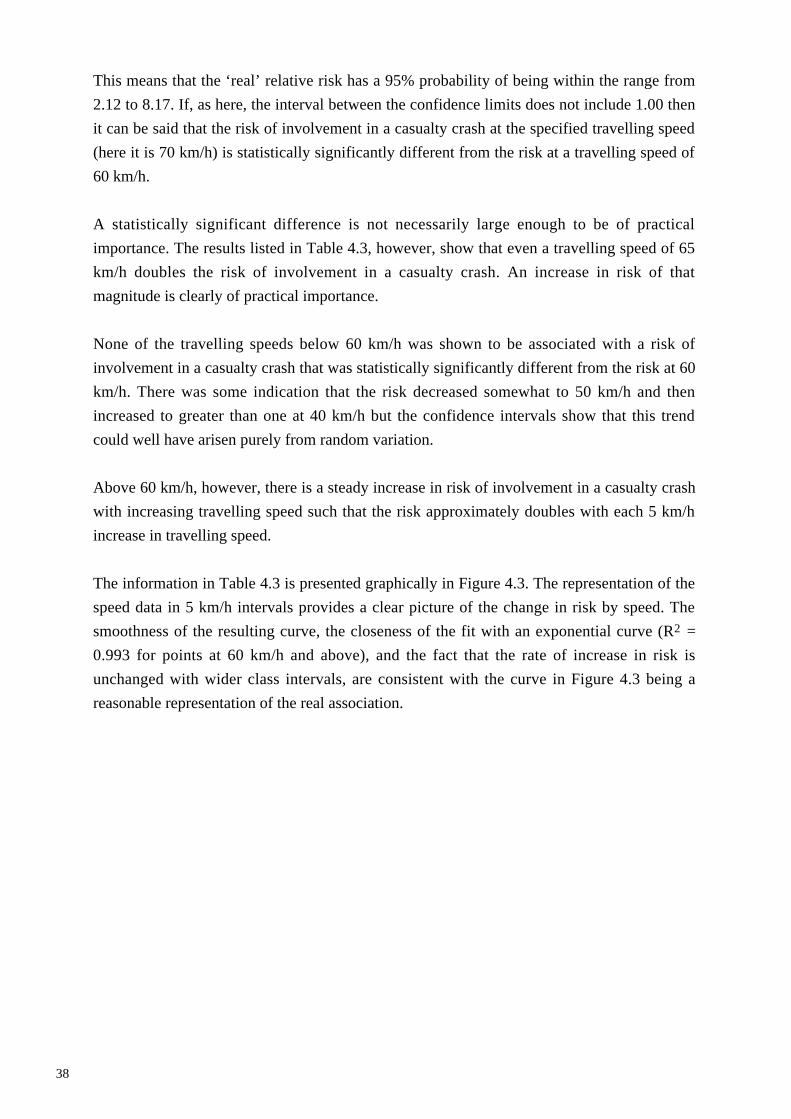
38
This means that the ‘real’ relative risk has a 95% probability of being within the range from
2.12 to 8.17. If, as here, the interval between the confidence limits does not include 1.00 then
it can be said that the risk of involvement in a casualty crash at the specified travelling speed
(here it is 70 km/h) is statistically significantly different from the risk at a travelling speed of
60 km/h.
A statistically significant difference is not necessarily large enough to be of practical
importance. The results listed in Table 4.3, however, show that even a travelling speed of 65
km/h doubles the risk of involvement in a casualty crash. An increase in risk of that
magnitude is clearly of practical importance.
None of the travelling speeds below 60 km/h was shown to be associated with a risk of
involvement in a casualty crash that was statistically significantly different from the risk at 60
km/h. There was some indication that the risk decreased somewhat to 50 km/h and then
increased to greater than one at 40 km/h but the confidence intervals show that this trend
could well have arisen purely from random variation.
Above 60 km/h, however, there is a steady increase in risk of involvement in a casualty crash
with increasing travelling speed such that the risk approximately doubles with each 5 km/h
increase in travelling speed.
The information in Table 4.3 is presented graphically in Figure 4.3. The representation of the
speed data in 5 km/h intervals provides a clear picture of the change in risk by speed. The
smoothness of the resulting curve, the closeness of the fit with an exponential curve (R2 =
0.993 for points at 60 km/h and above), and the fact that the rate of increase in risk is
unchanged with wider class intervals, are consistent with the curve in Figure 4.3 being a
reasonable representation of the real association.
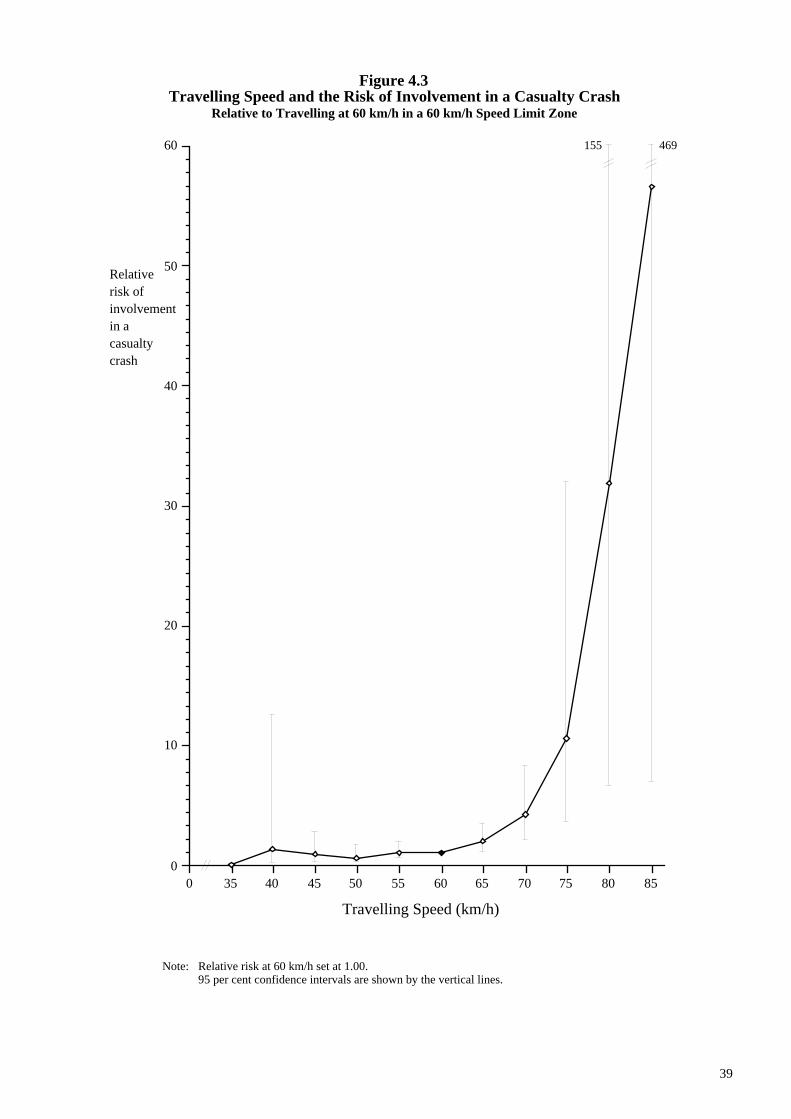
39
Figure 4.3Travelling Speed and the Risk of Involvement in a Casualty Crash
Relative to Travelling at 60 km/h in a 60 km/h Speed Limit Zone
0
10
20
30
40
50
60
0 35 40 45 50 55 60 65 70 75 80 85
155 469
Relativerisk ofinvolvementin acasualtycrash
Travelling Speed (km/h)
Note: Relative risk at 60 km/h set at 1.00.95 per cent confidence intervals are shown by the vertical lines.
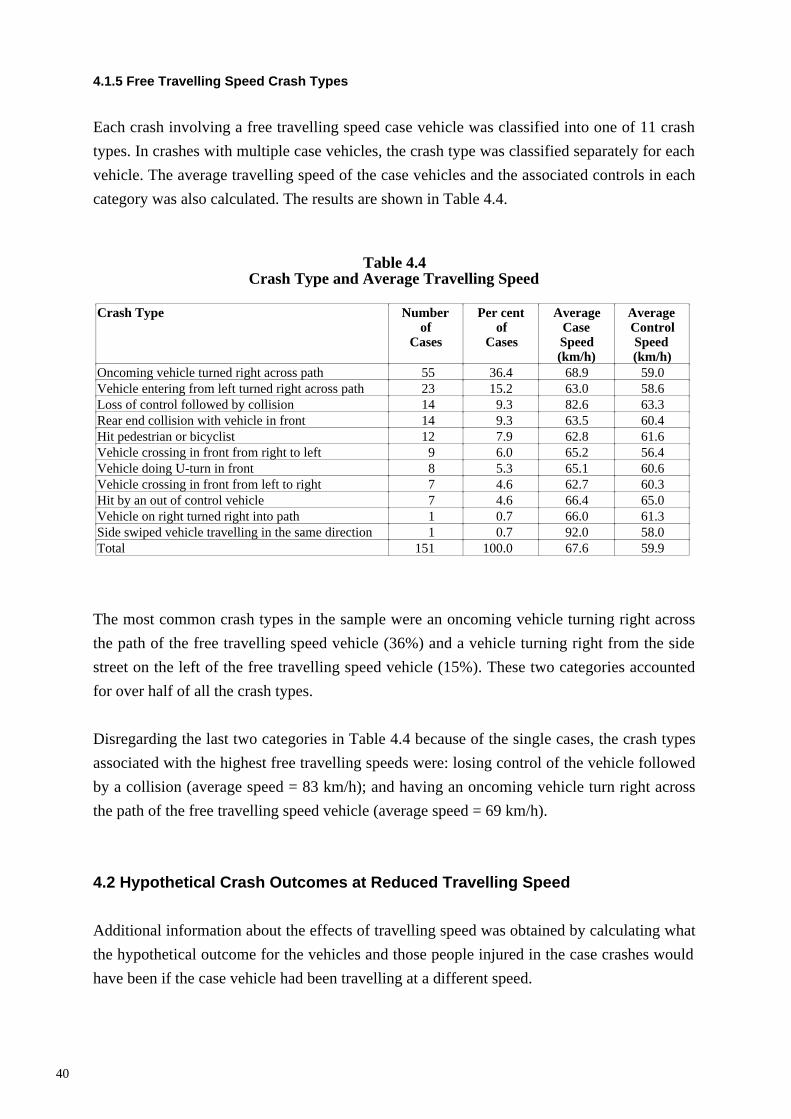
40
4.1.5 Free Travelling Speed Crash Types
Each crash involving a free travelling speed case vehicle was classified into one of 11 crash
types. In crashes with multiple case vehicles, the crash type was classified separately for each
vehicle. The average travelling speed of the case vehicles and the associated controls in each
category was also calculated. The results are shown in Table 4.4.
Table 4.4Crash Type and Average Travelling Speed
Crash Type Numberof
Cases
Per centof
Cases
AverageCaseSpeed(km/h)
AverageControlSpeed(km/h)
Oncoming vehicle turned right across path 55 36.4 68.9 59.0Vehicle entering from left turned right across path 23 15.2 63.0 58.6Loss of control followed by collision 14 9.3 82.6 63.3Rear end collision with vehicle in front 14 9.3 63.5 60.4Hit pedestrian or bicyclist 12 7.9 62.8 61.6Vehicle crossing in front from right to left 9 6.0 65.2 56.4Vehicle doing U-turn in front 8 5.3 65.1 60.6Vehicle crossing in front from left to right 7 4.6 62.7 60.3Hit by an out of control vehicle 7 4.6 66.4 65.0Vehicle on right turned right into path 1 0.7 66.0 61.3Side swiped vehicle travelling in the same direction 1 0.7 92.0 58.0Total 151 100.0 67.6 59.9
The most common crash types in the sample were an oncoming vehicle turning right across
the path of the free travelling speed vehicle (36%) and a vehicle turning right from the side
street on the left of the free travelling speed vehicle (15%). These two categories accounted
for over half of all the crash types.
Disregarding the last two categories in Table 4.4 because of the single cases, the crash types
associated with the highest free travelling speeds were: losing control of the vehicle followed
by a collision (average speed = 83 km/h); and having an oncoming vehicle turn right across
the path of the free travelling speed vehicle (average speed = 69 km/h).
4.2 Hypothetical Crash Outcomes at Reduced Travelling Speed
Additional information about the effects of travelling speed was obtained by calculating what
the hypothetical outcome for the vehicles and those people injured in the case crashes would
have been if the case vehicle had been travelling at a different speed.
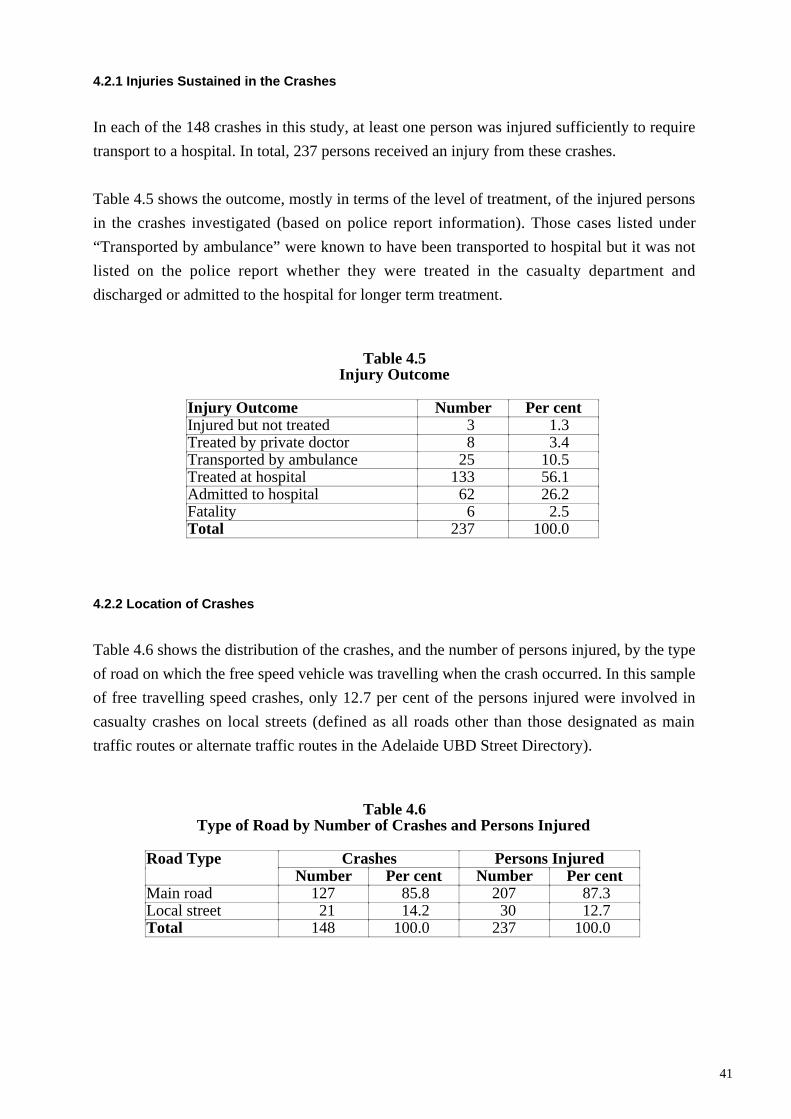
41
4.2.1 Injuries Sustained in the Crashes
In each of the 148 crashes in this study, at least one person was injured sufficiently to require
transport to a hospital. In total, 237 persons received an injury from these crashes.
Table 4.5 shows the outcome, mostly in terms of the level of treatment, of the injured persons
in the crashes investigated (based on police report information). Those cases listed under
“Transported by ambulance” were known to have been transported to hospital but it was not
listed on the police report whether they were treated in the casualty department and
discharged or admitted to the hospital for longer term treatment.
Table 4.5Injury Outcome
Injury Outcome Number Per centInjured but not treated 3 1.3Treated by private doctor 8 3.4Transported by ambulance 25 10.5Treated at hospital 133 56.1Admitted to hospital 62 26.2Fatality 6 2.5Total 237 100.0
4.2.2 Location of Crashes
Table 4.6 shows the distribution of the crashes, and the number of persons injured, by the type
of road on which the free speed vehicle was travelling when the crash occurred. In this sample
of free travelling speed crashes, only 12.7 per cent of the persons injured were involved in
casualty crashes on local streets (defined as all roads other than those designated as main
traffic routes or alternate traffic routes in the Adelaide UBD Street Directory).
Table 4.6Type of Road by Number of Crashes and Persons Injured
Road Type Crashes Persons InjuredNumber Per cent Number Per cent
Main road 127 85.8 207 87.3Local street 21 14.2 30 12.7Total 148 100.0 237 100.0
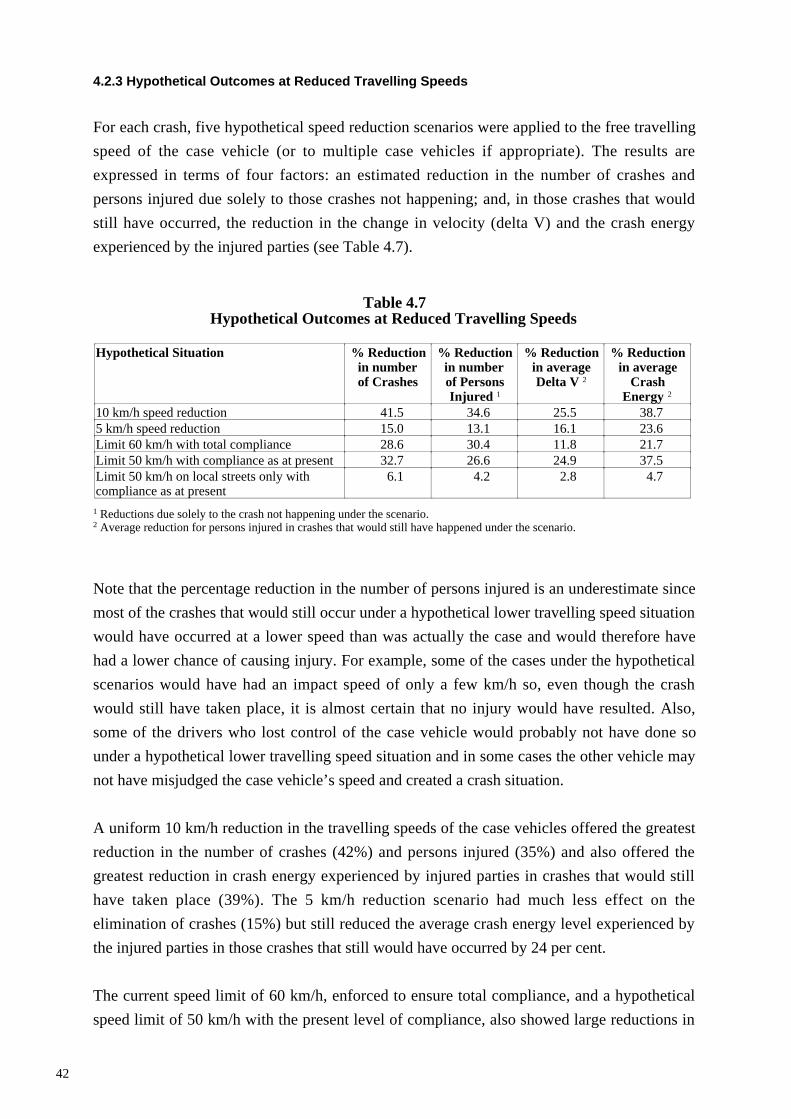
42
4.2.3 Hypothetical Outcomes at Reduced Travelling Speeds
For each crash, five hypothetical speed reduction scenarios were applied to the free travelling
speed of the case vehicle (or to multiple case vehicles if appropriate). The results are
expressed in terms of four factors: an estimated reduction in the number of crashes and
persons injured due solely to those crashes not happening; and, in those crashes that would
still have occurred, the reduction in the change in velocity (delta V) and the crash energy
experienced by the injured parties (see Table 4.7).
Table 4.7Hypothetical Outcomes at Reduced Travelling Speeds
Hypothetical Situation % Reductionin numberof Crashes
% Reductionin numberof PersonsInjured 1
% Reductionin averageDelta V 2
% Reductionin average
CrashEnergy 2
10 km/h speed reduction 41.5 34.6 25.5 38.75 km/h speed reduction 15.0 13.1 16.1 23.6Limit 60 km/h with total compliance 28.6 30.4 11.8 21.7Limit 50 km/h with compliance as at present 32.7 26.6 24.9 37.5Limit 50 km/h on local streets only withcompliance as at present
6.1 4.2 2.8 4.7
1 Reductions due solely to the crash not happening under the scenario.2 Average reduction for persons injured in crashes that would still have happened under the scenario.
Note that the percentage reduction in the number of persons injured is an underestimate since
most of the crashes that would still occur under a hypothetical lower travelling speed situation
would have occurred at a lower speed than was actually the case and would therefore have
had a lower chance of causing injury. For example, some of the cases under the hypothetical
scenarios would have had an impact speed of only a few km/h so, even though the crash
would still have taken place, it is almost certain that no injury would have resulted. Also,
some of the drivers who lost control of the case vehicle would probably not have done so
under a hypothetical lower travelling speed situation and in some cases the other vehicle may
not have misjudged the case vehicle’s speed and created a crash situation.
A uniform 10 km/h reduction in the travelling speeds of the case vehicles offered the greatest
reduction in the number of crashes (42%) and persons injured (35%) and also offered the
greatest reduction in crash energy experienced by injured parties in crashes that would still
have taken place (39%). The 5 km/h reduction scenario had much less effect on the
elimination of crashes (15%) but still reduced the average crash energy level experienced by
the injured parties in those crashes that still would have occurred by 24 per cent.
The current speed limit of 60 km/h, enforced to ensure total compliance, and a hypothetical
speed limit of 50 km/h with the present level of compliance, also showed large reductions in
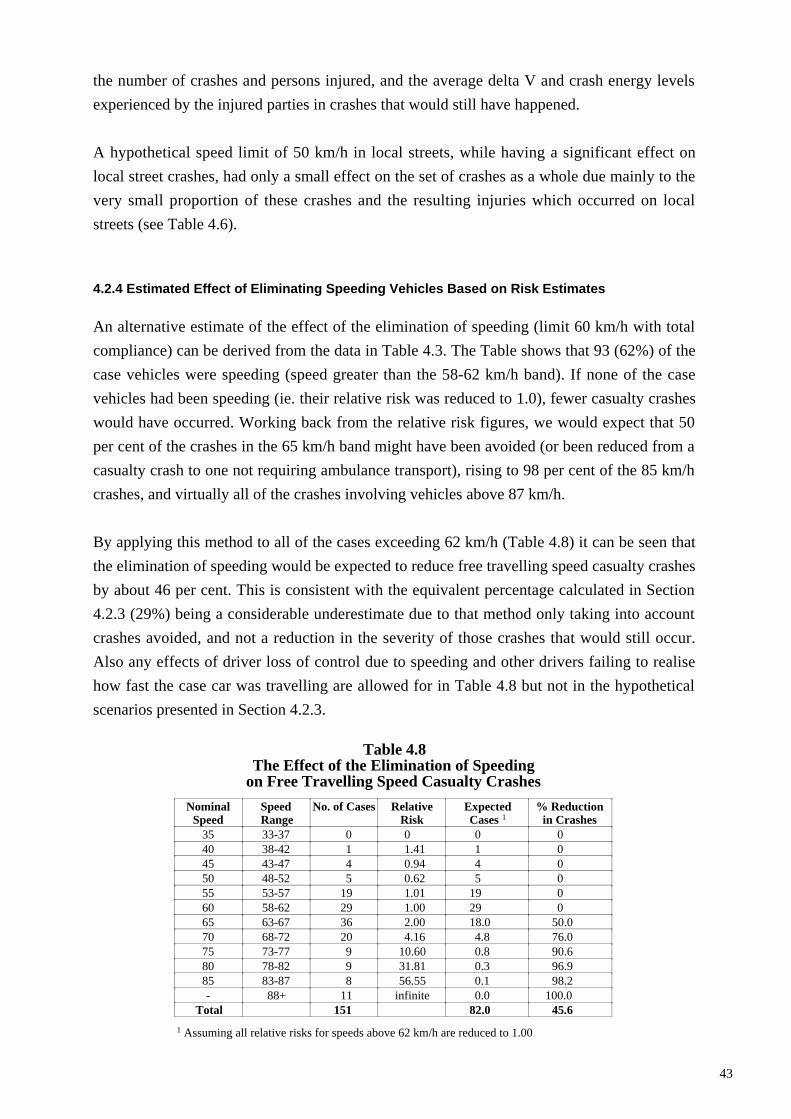
43
the number of crashes and persons injured, and the average delta V and crash energy levels
experienced by the injured parties in crashes that would still have happened.
A hypothetical speed limit of 50 km/h in local streets, while having a significant effect on
local street crashes, had only a small effect on the set of crashes as a whole due mainly to the
very small proportion of these crashes and the resulting injuries which occurred on local
streets (see Table 4.6).
4.2.4 Estimated Effect of Eliminating Speeding Vehicles Based on Risk Estimates
An alternative estimate of the effect of the elimination of speeding (limit 60 km/h with total
compliance) can be derived from the data in Table 4.3. The Table shows that 93 (62%) of the
case vehicles were speeding (speed greater than the 58-62 km/h band). If none of the case
vehicles had been speeding (ie. their relative risk was reduced to 1.0), fewer casualty crashes
would have occurred. Working back from the relative risk figures, we would expect that 50
per cent of the crashes in the 65 km/h band might have been avoided (or been reduced from a
casualty crash to one not requiring ambulance transport), rising to 98 per cent of the 85 km/h
crashes, and virtually all of the crashes involving vehicles above 87 km/h.
By applying this method to all of the cases exceeding 62 km/h (Table 4.8) it can be seen that
the elimination of speeding would be expected to reduce free travelling speed casualty crashes
by about 46 per cent. This is consistent with the equivalent percentage calculated in Section
4.2.3 (29%) being a considerable underestimate due to that method only taking into account
crashes avoided, and not a reduction in the severity of those crashes that would still occur.
Also any effects of driver loss of control due to speeding and other drivers failing to realise
how fast the case car was travelling are allowed for in Table 4.8 but not in the hypothetical
scenarios presented in Section 4.2.3.
Table 4.8The Effect of the Elimination of Speeding
on Free Travelling Speed Casualty Crashes
NominalSpeed
SpeedRange
No. of Cases RelativeRisk
ExpectedCases 1
% Reductionin Crashes
35 33-37 0 0 0 040 38-42 1 1.41 1 045 43-47 4 0.94 4 050 48-52 5 0.62 5 055 53-57 19 1.01 19 060 58-62 29 1.00 29 065 63-67 36 2.00 18.0 50.070 68-72 20 4.16 4.8 76.075 73-77 9 10.60 0.8 90.680 78-82 9 31.81 0.3 96.985 83-87 8 56.55 0.1 98.2- 88+ 11 infinite 0.0 100.0
Total 151 82.0 45.6
1 Assuming all relative risks for speeds above 62 km/h are reduced to 1.00
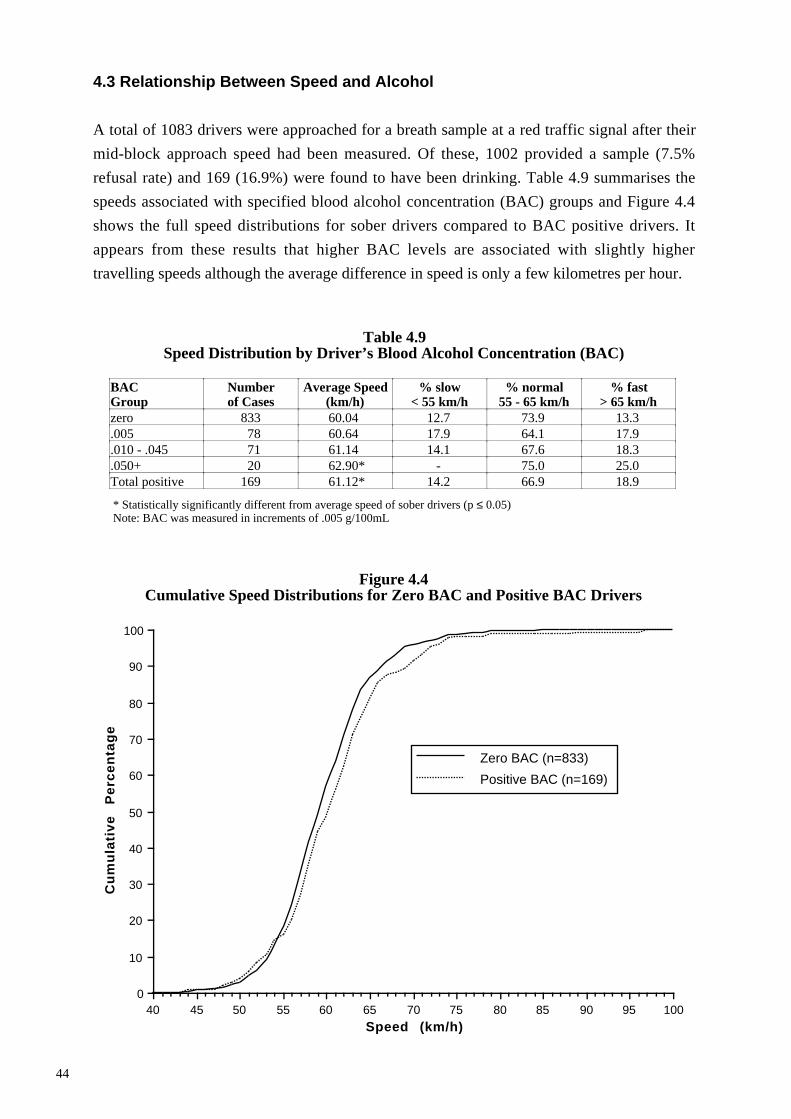
44
4.3 Relationship Between Speed and Alcohol
A total of 1083 drivers were approached for a breath sample at a red traffic signal after their
mid-block approach speed had been measured. Of these, 1002 provided a sample (7.5%
refusal rate) and 169 (16.9%) were found to have been drinking. Table 4.9 summarises the
speeds associated with specified blood alcohol concentration (BAC) groups and Figure 4.4
shows the full speed distributions for sober drivers compared to BAC positive drivers. It
appears from these results that higher BAC levels are associated with slightly higher
travelling speeds although the average difference in speed is only a few kilometres per hour.
Table 4.9Speed Distribution by Driver’s Blood Alcohol Concentration (BAC)
BACGroup
Numberof Cases
Average Speed(km/h)
% slow< 55 km/h
% normal55 - 65 km/h
% fast> 65 km/h
zero 833 60.04 12.7 73.9 13.3.005 78 60.64 17.9 64.1 17.9.010 - .045 71 61.14 14.1 67.6 18.3.050+ 20 62.90* - 75.0 25.0Total positive 169 61.12* 14.2 66.9 18.9
* Statistically significantly different from average speed of sober drivers (p ≤ 0.05)Note: BAC was measured in increments of .005 g/100mL
Figure 4.4Cumulative Speed Distributions for Zero BAC and Positive BAC Drivers
1009590858075706560555045400
10
20
30
40
50
60
70
80
90
100
Zero BAC (n=833)
Positive BAC (n=169)
Speed (km/h)
Cu
mu
lati
ve
P
erc
en
tag
e
45
5. DISCUSSION
As noted in the Introduction, the aim of this study was to quantify the association between
travelling speed and the risk of involvement in a casualty crash. The two subsidiary studies
were intended to predict the likely effects on injury and crash severity of lower travelling
speeds in the cases investigated and to assess the extent to which travelling speed might be
related to a driver’s blood alcohol concentration (BAC).
5.1 Travelling Speed and the Risk of Involvement in a Casualty Crash
As shown in Figure 4.3, we found that there was an exponential increase in the risk of
involvement in a casualty crash with increasing travel speed above the legal urban area speed
limit of 60 km/h.
5.1.1 Reasons for the Rate of Increase in Risk of Involvement in a Casualty Crash
Involvement in a crash is often a consequence of a large number of inter-related causal factors
that cannot all be quantified after the event. This study was not designed to investigate the
mechanisms by which increases in travelling speed lead to increases in crash risk but a
number of possible mechanisms are apparent.
Travelling Speed, Reaction Distance and Braking Distance
In most of the crashes included in this study the driver of the case vehicle attempted, clearly
unsuccessfully, to avoid the crash by braking. One hundred and seven, or 71 per cent, of the
151 case vehicles skidded under emergency braking before the crash. Two of the 151 vehicles
were equipped with antilock brakes but their drivers were among the 44 who were thought not
to have braked, either because they did not have time to attempt any avoiding action or
because they were not aware that a crash was imminent.
We refer here to “reaction distance” rather than the more common term “reaction time”
because we find that it emphasises the reasons why small differences in travelling speed can
result in very large differences in impact speed. We have discussed this phenomenon at some
length in a report on a previous study of the role of vehicle travelling speed in fatal pedestrian
accidents (McLean et al, 1994).
46
In calculating the reaction distance we have assumed that the time taken by the driver to
identify that a crash is likely, decide on avoiding action, and implement that action, is 1.5
seconds (the reasons for selecting 1.5 seconds are presented in McLean et al, 1994). In some
cases it may have been less, in others more. (There were some cases in which the driver had
no warning of the crash before the impact and hence no opportunity to react.) The reaction
distance is therefore assumed to be that distance travelled by the vehicle in 1.5 seconds and so
it is directly proportional to the travelling speed of the vehicle. At 60 km/h it is 25 metres; at
70 km/h, 29 metres.
Given that the case vehicles were chosen because they had a free travelling speed, among
other criteria, their speed is essentially unchanged over the reaction distance. After 25 metres
at 60 km/h it is still travelling at 60 km/h. After 29 metres at 70 km/h it is still travelling at 70
km/h. These differences do not appear to be particularly worthy of comment. However their
importance becomes apparent when the second stage of the precrash sequence, emergency
braking, is considered.
Although it is not uncommon for drivers to claim that they swerved to attempt to avoid a
collision, in practice any attempt at avoiding action almost invariably involves emergency
braking. In the absence of antilock brakes, braking in an emergency from the speeds seen in
this study results in the wheels locking and the vehicle skidding, even for highly skilled
drivers. (An emergency situation in normal traffic is, by definition, unanticipated, unlike some
apparently similar situations on the race track.) Skidding under emergency braking is
accompanied by the loss of steering control and hence the loss of the ability to steer away
from an object in the path of the vehicle.
Braking distance, from travelling speed to a standstill, is proportional to the square of the
speed. From 60 km/h (under the assumptions set out in Volume 2 of this report) the braking
distance is 24 metres, from 70 km/h it is 31 metres.
When the reaction distance is added to the braking distance, it can be seen that from 60 km/h
it requires 49 metres to stop in an emergency, whereas from 70 km/h 60 metres are needed (a
22% increase). Obviously, a driver travelling at 60 km/h will be involved in fewer crashes
(avoiding those in the zone from 49 to 60 metres) than one travelling at 70 km/h.
However, even this comparison understates the importance of a 10 km/h difference in
travelling speed. For example, consider two cars that are travelling side by side at a given
instant, one travelling at 60 km/h and the other overtaking at 70 km/h. Suppose that a child
runs onto the road at a point just beyond that at which the car travelling at 60 km/h can stop.
The other car will still be travelling at 45 km/h at that point. A difference in travelling speed

47
of 10 km/h can mean a difference in impact speed of 45 km/h, or no impact and one at 45
km/h.
In this study we recorded far greater differences in speed between some of the cases and the
control cars than in the previous example and this is reflected in even more extreme
differences in speed at the moment when the slower car has stopped under emergency
braking. For example, if a car travelling at 100 km/h is overtaking a car travelling at 60 km/h
at the moment when both drivers realise that they have to try to stop, when the slower car has
stopped the faster car will still be travelling at 94 km/h.
The calculations earlier in this section assume that the relationship between stopping distance
and crash risk is linear. If other road users appeared more or less at random in a vehicle’s path
then, other things being equal, a 22 per cent increase in stopping distance (from 60 to 70
km/h) would mean a 22 per cent increase in collisions. However, it seems reasonable to
assume that other road users do not always behave at random, and that they are more likely to
appear in a vehicle’s path at a range of 50-60m than at 0-10m or 10-20m. If this is the case,
then a 22 per cent increase in stopping distance may increase crash risk by much more than 22
per cent.
Impact Speed and Crash Energy
The energy of a vehicle that must be dissipated in a crash is proportional to the square of the
speed of the vehicle at impact. This means that small differences in impact speed are
associated with large differences in crash energy, and correspondingly large differences in
injury potential.
In a situation where no speed reduction action is taken (29 per cent of cases in this study) the
impact speed is the same as the travelling speed so the energy of the impact is the square of
the travelling speed and we would expect the risk of an injury crash to increase rapidly with
travelling speed.
Travelling Speed and Loss of Control
A number of cars involved in crashes in this study were travelling at very high speeds (greater
than 90 km/h) when the driver lost control of the vehicle. This coupled with the total absence
of any of the cars not involved in crashes travelling at these speeds, indicates that very high
speeds are associated with extremely high risks of losing control of the vehicle and
subsequent crashes and injuries.
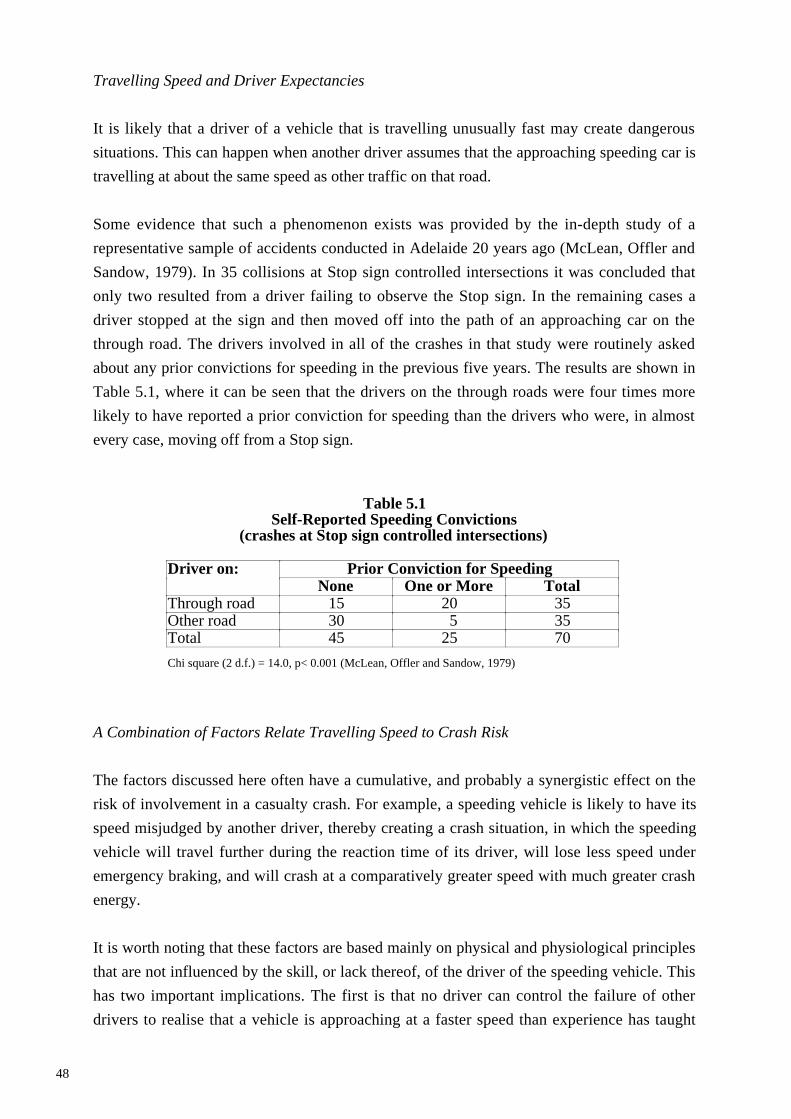
48
Travelling Speed and Driver Expectancies
It is likely that a driver of a vehicle that is travelling unusually fast may create dangerous
situations. This can happen when another driver assumes that the approaching speeding car is
travelling at about the same speed as other traffic on that road.
Some evidence that such a phenomenon exists was provided by the in-depth study of a
representative sample of accidents conducted in Adelaide 20 years ago (McLean, Offler and
Sandow, 1979). In 35 collisions at Stop sign controlled intersections it was concluded that
only two resulted from a driver failing to observe the Stop sign. In the remaining cases a
driver stopped at the sign and then moved off into the path of an approaching car on the
through road. The drivers involved in all of the crashes in that study were routinely asked
about any prior convictions for speeding in the previous five years. The results are shown in
Table 5.1, where it can be seen that the drivers on the through roads were four times more
likely to have reported a prior conviction for speeding than the drivers who were, in almost
every case, moving off from a Stop sign.
Table 5.1Self-Reported Speeding Convictions
(crashes at Stop sign controlled intersections)
Driver on: Prior Conviction for SpeedingNone One or More Total
Through road 15 20 35Other road 30 5 35Total 45 25 70
Chi square (2 d.f.) = 14.0, p< 0.001 (McLean, Offler and Sandow, 1979)
A Combination of Factors Relate Travelling Speed to Crash Risk
The factors discussed here often have a cumulative, and probably a synergistic effect on the
risk of involvement in a casualty crash. For example, a speeding vehicle is likely to have its
speed misjudged by another driver, thereby creating a crash situation, in which the speeding
vehicle will travel further during the reaction time of its driver, will lose less speed under
emergency braking, and will crash at a comparatively greater speed with much greater crash
energy.
It is worth noting that these factors are based mainly on physical and physiological principles
that are not influenced by the skill, or lack thereof, of the driver of the speeding vehicle. This
has two important implications. The first is that no driver can control the failure of other
drivers to realise that a vehicle is approaching at a faster speed than experience has taught
49
them to expect. The second is that if an “advanced” driver training course encourages a driver
to believe that he or she has become more capable of controlling a car at speed (despite the
fact that Newton’s Laws of Motion are not affected by such tuition) it may in fact increase the
likelihood that the course graduate will choose to travel faster than would otherwise be the
case and thereby unwittingly create emergency situations of the type referred to here.
5.1.2 Validity of the Risk Estimates
The results presented in Section 4.1 are our best estimates of the relationship between
travelling speed and the risk of involvement in a casualty crash. We are aware of a number of
matters which could have affected the validity of the risk estimates and they are discussed
here.
Crash Severity
Higher travelling speeds are almost certainly related to more serious injuries in the resulting
crashes. Insofar as we have presented our risk estimates in terms of free travelling speed
casualty crashes as a whole, any bias towards more severe crashes could introduce a
corresponding bias towards higher risk estimates. In fact it may be more precise to say that
such an effect would mean that our risk estimates are based on a slightly higher than average
level of crash severity.
In the study reported here we have attempted to obtain a reasonably representative sample of
crashes to which an ambulance was called and which resulted in at least one person being
transported to hospital, as well as one of the vehicles being a passenger car which had a free
travelling speed. The Adelaide in-depth accident study is an example of the type of study
design needed to be confident of obtaining a representative sample of crashes (McLean and
Robinson, 1979). That approach is costly in terms of on-call time and so the approach adopted
for this study relied on the fact that we usually did not know the type or severity of the
accident we were responding to when we were notified of its occurrence by the ambulance
service.
Excluded Cases
A number of cases that met the selection criteria of the study had to be excluded for various
reasons and where this exclusion was potentially related to travelling speed it may have been
a source of bias or a caveat on the level of crash severity as mentioned above.
50
The more serious crashes were more likely to have the necessary information available for
reconstruction of the crash. Because the police tended to keep serious crash scenes intact for
longer and to mark out positions of vehicles and physical evidence in more detail, while
minor crash scenes were cleaned up quickly and the vehicles taken away, we were more likely
to arrive at the scene of a serious crash in time to be able to collect the evidence needed for
input to the crash reconstruction program. So while ambulance transport from the crash scene
was the nominal severity level of the crashes, it is likely that this set of cases deals with
slightly more serious crash outcomes in terms of the severity of the injuries and the damage to
the vehicles. There are other matters which may have a bearing on the validity of the sample
of cases selected for use in this study. For example, the selection of case vehicles on the basis
of free travelling speed obviously placed considerable demands on the judgement of the
investigators at the crash scene. In general, if there was some uncertainty the crash was still
investigated and, if it was considered necessary, rejected at a later date when all of the
available evidence relating to whether or not the case vehicle had a free travelling speed
before the crash could be considered.
Case Vehicle Speed Calculation
The validity of the risk estimates depends on the accuracy of the reconstruction of the
travelling speed of the case vehicles. While non-systematic errors will just increase the
variability of the risk estimates, systematic errors have the potential to bias the risk estimates.
The crash reconstruction method used in this study depends primarily on the physical
evidence left at the scene after the crash event. The greatest potential for bias in this respect is
due to the inability of the method to take into account speed lost before impact due to braking
without leaving skid marks. It is possible that some proportion of the 29 per cent of the case
vehicles included in the study that showed no physical evidence of braking before impact
actually did brake without leaving skid marks. This would mean that their travelling speeds
would have been underestimated leading to a bias in the overall risk estimate.
There were also a few cases where the damage to the vehicles indicated that the case vehicle
was braking at impact (eg: lower than usual front bumper height) but there was no physical
evidence of braking at the scene. In this situation, the case was rejected because while it was
known that speed was lost before impact, this speed could not be quantified. If these cases
differed systematically in their travelling speed from the other cases, their exclusion could
have biased the risk estimates. However, there is no reason to believe that such a bias exists in
these cases.
51
It is emphasised that the travelling speed listed for each case is our best estimate of the actual
speed. We believe that we have made use of the best available methods of crash
reconstruction, both computer-aided and in interpretation of the physical evidence at the crash
scene and the damage to the vehicles involved. Nevertheless we recognise that the final
decision on the travelling speed of a case vehicle is a matter of judgement that may have
involved some unknown bias on the part of the investigators. In Volume 2 we present the
evidence that we used in arriving at our estimate of travelling speed in each case.
It is sometimes claimed that the only truly accurate way to estimate vehicle travelling speed
before a crash is by the use of a crash recorder installed in the vehicle. Such devices are
available which are designed to retain a record of the speed of the vehicle for a specified time
interval before a crash. It is obvious that such a device should provide a very accurate record
of the travelling speed of the vehicle, but it cannot provide information on whether or not that
speed was a free travelling speed.
What appears to be less obvious is that a valid estimate of the relationship between travelling
speed and the risk of crash involvement requires control data on a sample of similar vehicles.
If the crash recorders are fitted to a fleet of cars owned by a public authority, for example, the
relevant control speeds would be those of other vehicles in that fleet at the crash location at
the same time of day and day of week (and lighting and weather conditions).
Matching of Cases and Controls
Although the controls were matched to the cases based on location, time of day and day of
week, there may have been other factors that affected the travelling speed of the cases that did
not affect the controls. The most obvious of these would be the presence of another vehicle
turning in front of the cases, and not in front of the controls. The presence of this vehicle may
have caused the case vehicle to either slow down because of a perceived risk or may have
caused them to speed up in an effort to claim that space on the road. The existence and
direction of any such bias is not known.
Risk Factors Other than Travelling Speed
It may be that drivers who choose to travel faster than the speed limit also exhibit other risk
taking behaviour. It may be, therefore, that some of the increase in risk seen in this study is
due to this risk taking behaviour and not solely to the higher travelling speed itself. However,
we note here that the study design largely controlled for one of the other main forms of risk
taking, alcohol impaired driving.

52
5.1.3 Implications for the Setting of Speed Limits
The results presented in Table 4.3 and Figure 4.3 show no statistically significant difference
in the risk of involvement in a casualty crash at travelling speeds below 60 km/h. This is a
reflection of the fact that the numbers of cases were comparatively small in the speed
categories below 55 km/h, as were the differences in risk below 60 km/h. It does not mean
that there would be little to be gained from a reduction in the general urban area speed limit
to, say, 50 km/h, a matter which is addressed in Section 5.2.
5.1.4 Implications for Enforcement
It is customary for an enforcement tolerance to be added to the legal speed limit such that a
driver is not charged with a speeding violation below a speed of about 70 km/h. The reasons
for this tolerance go back to the days when speed limits were enforced by a police vehicle
following a speeding vehicle for a sufficient length of time for the police officer to be able to
state that its speed was the same as that which was indicated on the speedometer of the police
vehicle. With the introduction of radar speed meters, and more recently laser speed meters,
the speed of a vehicle can be measured accurately to within a small fraction of 1 km/h.
Our results show that the risk of involvement in a casualty crash is twice as great at 65 km/h
as it is at 60 km/h, and four times as great at 70 km/h. Increases in risk of such magnitude
would appear to be sufficient to justify the elimination of the current practice of applying an
enforcement tolerance to speed limits, or at least a substantial reduction in such a tolerance.
Although the risk increases rapidly with increasing speed, the contribution of speeding to
crash causation is much greater at speeds below, say, 75 km/h than it might appear from the
risk curve in Figure 4.3. In this study, more than two thirds of the crashes involving speeding
cars occurred at a speed that was below 75 km/h, because more drivers are travelling in the
speed range from 61 to 74 km/h than above the latter speed.
There also appears to be considerable public support for a reduction in the enforcement
tolerance to speed limits. In a recent Australian national survey (Mitchell-Taverner, Adams
and Hejtmanek, 1997) people were asked “Now thinking about 60 km/h speed zones in urban
areas, how fast should people be allowed to drive without being booked for speeding?”. The
results showed that 44 per cent of people believed that 60 km/h limits should be strictly
enforced. A further 34 per cent would tolerate exceeding the limit by 5 km/h and 18 per cent
expressed the view that 70 km/h would be acceptable in current 60 km/hr speed zones. Only 2
per cent felt that speeds above 70 km/h should be permitted.
53
5.2 Hypothetical Travelling Speed and Crash Severity
A large proportion of the injuries sustained in crashes in this study would have been avoided
had the case vehicles been travelling at a slower speed. The change in velocity in the crash
(delta V) and the severity of the injuries that would still have occurred would have been
markedly reduced. Even modest reductions in travelling speeds can have a profound
beneficial effect on crash and injury frequency.
Despite the considerable magnitude of the predicted benefits, shown in Table 4.7, it is
probable that they are still considerable underestimates. This is because we have only
considered the effect of reduced travelling speed on the elimination of crashes in the collision
configuration that we actually observed. Many of the hypothetical crashes would not have
happened because the driver would not have lost control at a lower speed, the other vehicle
may not have misjudged the case vehicle’s speed and created a crash situation, and the
lowered impact speeds of the crashes that did still happen would have produced fewer and
less severe injuries.
This is borne out by the alternative method of estimating the effect of the elimination of
speeding among the sample of crashes by working back from the risk estimates (Section
4.2.4). Using this method it was found that 46 per cent of the free travelling speed crashes
examined here would not have resulted in a casualty if none of the vehicles had been
speeding.
5.3 The Relationship Between Speed and Alcohol
Although we found that drivers with a positive blood alcohol concentration had higher
travelling speeds on average than did sober drivers, the speeds of the two groups were
remarkably similar with their mean speeds differing by only a few kilometres per hour. This
suggests that the contributions of alcohol impairment and speeding to the causation of road
crashes are largely independent.
5.4 Speed, Alcohol and the Risk of Involvement in a Casualty Crash
The role of alcohol impairment in crash causation is universally accepted. This has stemmed
from a general recognition that intoxicated driving is dangerous and also from case control
studies such as the one reported here which have related the risk of crash involvement to a
driver’s blood alcohol concentration. A study of this type (dealing predominantly with
casualty crashes drawn from a representative sample of crashes to which an ambulance was
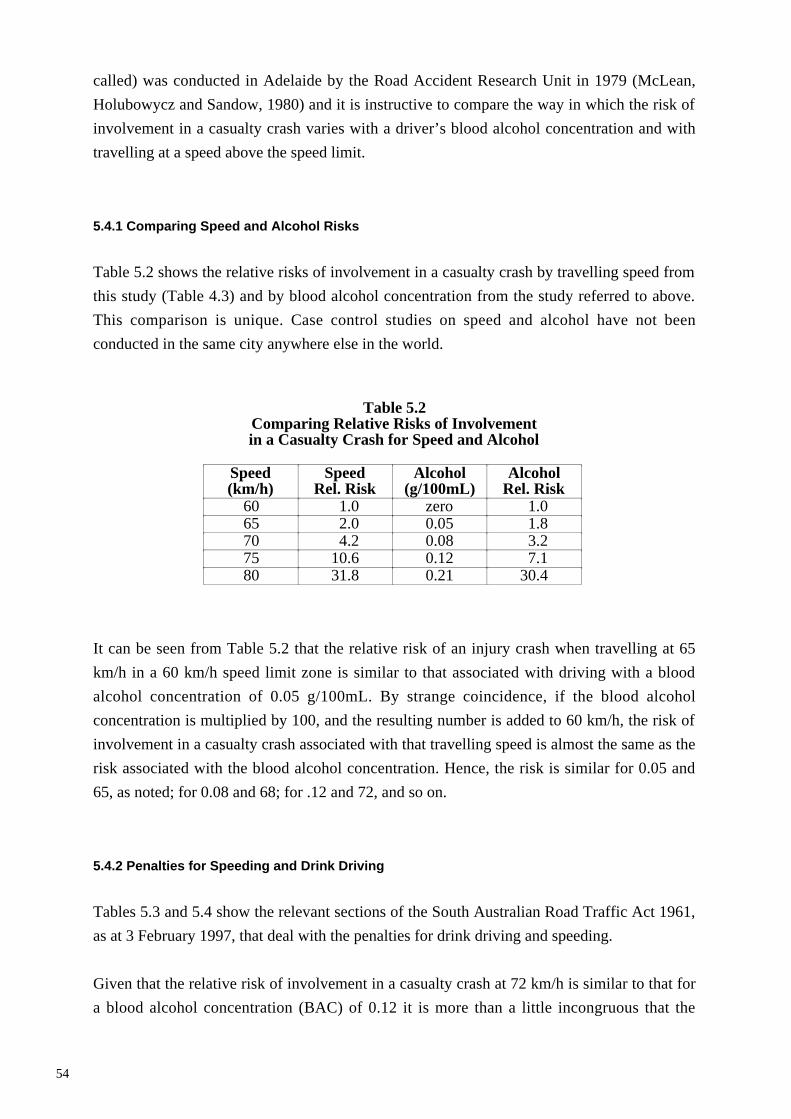
54
called) was conducted in Adelaide by the Road Accident Research Unit in 1979 (McLean,
Holubowycz and Sandow, 1980) and it is instructive to compare the way in which the risk of
involvement in a casualty crash varies with a driver’s blood alcohol concentration and with
travelling at a speed above the speed limit.
5.4.1 Comparing Speed and Alcohol Risks
Table 5.2 shows the relative risks of involvement in a casualty crash by travelling speed from
this study (Table 4.3) and by blood alcohol concentration from the study referred to above.
This comparison is unique. Case control studies on speed and alcohol have not been
conducted in the same city anywhere else in the world.
Table 5.2Comparing Relative Risks of Involvementin a Casualty Crash for Speed and Alcohol
Speed(km/h)
SpeedRel. Risk
Alcohol(g/100mL)
AlcoholRel. Risk
60 1.0 zero 1.065 2.0 0.05 1.870 4.2 0.08 3.275 10.6 0.12 7.180 31.8 0.21 30.4
It can be seen from Table 5.2 that the relative risk of an injury crash when travelling at 65
km/h in a 60 km/h speed limit zone is similar to that associated with driving with a blood
alcohol concentration of 0.05 g/100mL. By strange coincidence, if the blood alcohol
concentration is multiplied by 100, and the resulting number is added to 60 km/h, the risk of
involvement in a casualty crash associated with that travelling speed is almost the same as the
risk associated with the blood alcohol concentration. Hence, the risk is similar for 0.05 and
65, as noted; for 0.08 and 68; for .12 and 72, and so on.
5.4.2 Penalties for Speeding and Drink Driving
Tables 5.3 and 5.4 show the relevant sections of the South Australian Road Traffic Act 1961,
as at 3 February 1997, that deal with the penalties for drink driving and speeding.
Given that the relative risk of involvement in a casualty crash at 72 km/h is similar to that for
a blood alcohol concentration (BAC) of 0.12 it is more than a little incongruous that the
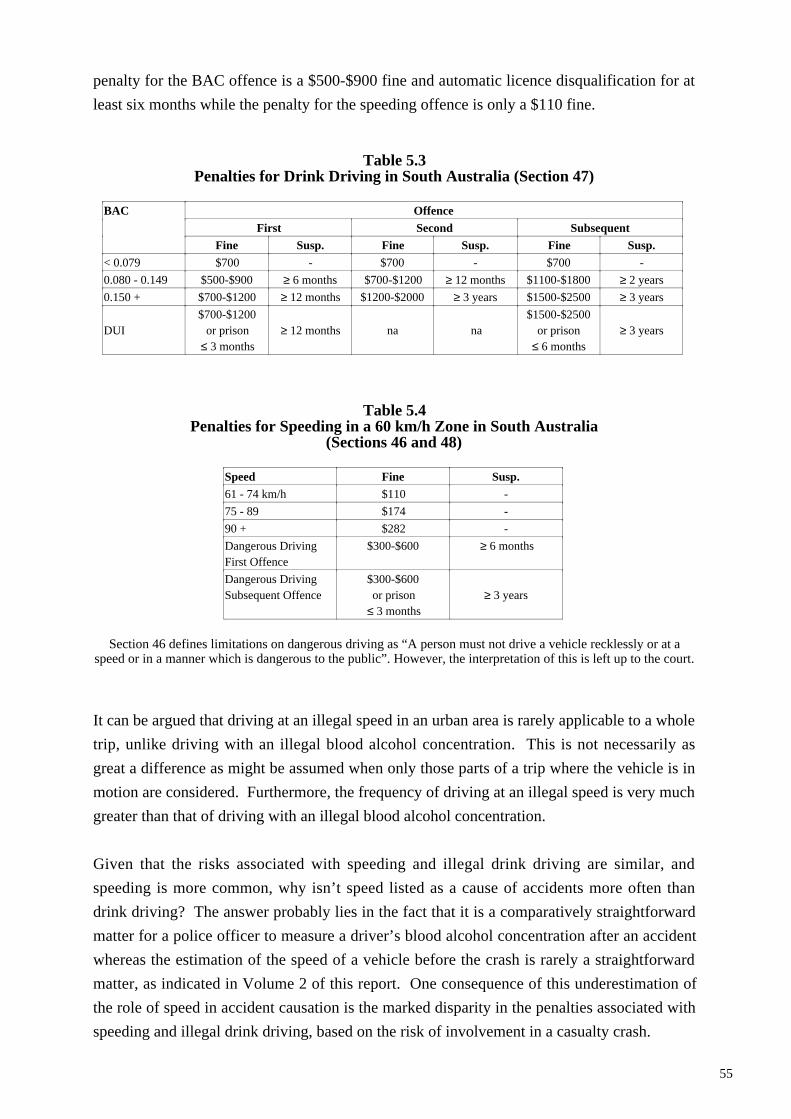
55
penalty for the BAC offence is a $500-$900 fine and automatic licence disqualification for at
least six months while the penalty for the speeding offence is only a $110 fine.
Table 5.3Penalties for Drink Driving in South Australia (Section 47)
BAC Offence
First Second Subsequent
Fine Susp. Fine Susp. Fine Susp.
< 0.079 $700 - $700 - $700 -
0.080 - 0.149 $500-$900 ≥ 6 months $700-$1200 ≥ 12 months $1100-$1800 ≥ 2 years
0.150 + $700-$1200 ≥ 12 months $1200-$2000 ≥ 3 years $1500-$2500 ≥ 3 years
DUI$700-$1200
or prison≤ 3 months
≥ 12 months na na$1500-$2500
or prison≤ 6 months
≥ 3 years
Table 5.4Penalties for Speeding in a 60 km/h Zone in South Australia
(Sections 46 and 48)
Speed Fine Susp.
61 - 74 km/h $110 -
75 - 89 $174 -
90 + $282 -
Dangerous DrivingFirst Offence
$300-$600 ≥ 6 months
Dangerous DrivingSubsequent Offence
$300-$600or prison
≤ 3 months≥ 3 years
Section 46 defines limitations on dangerous driving as “A person must not drive a vehicle recklessly or at aspeed or in a manner which is dangerous to the public”. However, the interpretation of this is left up to the court.
It can be argued that driving at an illegal speed in an urban area is rarely applicable to a whole
trip, unlike driving with an illegal blood alcohol concentration. This is not necessarily as
great a difference as might be assumed when only those parts of a trip where the vehicle is in
motion are considered. Furthermore, the frequency of driving at an illegal speed is very much
greater than that of driving with an illegal blood alcohol concentration.
Given that the risks associated with speeding and illegal drink driving are similar, and
speeding is more common, why isn’t speed listed as a cause of accidents more often than
drink driving? The answer probably lies in the fact that it is a comparatively straightforward
matter for a police officer to measure a driver’s blood alcohol concentration after an accident
whereas the estimation of the speed of a vehicle before the crash is rarely a straightforward
matter, as indicated in Volume 2 of this report. One consequence of this underestimation of
the role of speed in accident causation is the marked disparity in the penalties associated with
speeding and illegal drink driving, based on the risk of involvement in a casualty crash.
56
6. CONCLUSIONS AND RECOMMENDATIONS
In a 60 km/h speed limit area, the risk of involvement in a casualty crash doubles with each 5
km/h increase in travelling speed above 60 km/h.
Speeding in an urban area is as dangerous as driving with an illegal blood alcohol
concentration. Even travelling at 5 km/h above the 60 km/h limit increases the risk of crash
involvement as much as driving with a blood alcohol concentration of 0.05.
In this study the free speed casualty crashes occurred almost entirely on main roads. There is a
compelling case for a lower speed limit throughout urban areas, particularly on arterial roads.
Most motorised countries have an urban area speed limit of 50 km/h, as did Victoria and
NSW until the early 1960s.
We therefore recommend that:
1. The tolerance allowed in the enforcement of the 60 km/h speed limit be reduced or
removed.
2. The level of enforcement of the 60 km/h speed limit be increased.
3. The penalties for speeding and illegal drink driving be reviewed to align them more
closely to the risk of being involved in a casualty crash.
4. The level of public awareness of the risk of involvement in a casualty crash associated
with speeding be increased with the aim of developing a culture of compliance with
speed limits, similar to that which has developed in relation to compliance with blood
alcohol limits during the past 15 years.
5. To assist with the preceding recommendation, we also recommend that the results of
this study be widely publicised, emphasising the risks associated with speeding in
relation to the risks associated with illegal drink driving.
6. After a period with stricter enforcement of the 60 km/h urban area speed limit,
consideration be given to changing the urban area speed limit to 50 km/h on all roads,
as in most other highly motorised countries.
57
ACKNOWLEDGEMENTS
The help of the following people and organisations is greatly appreciated:
South Australia Police, for assistance with breath alcohol testing and the provision of
information on crashes (particularly Sharon Fraser).
The South Australian Ambulance Service for notification of crashes.
Brian G. and Raymond R. McHenry, McHenry Software, Inc. for assistance with computer-
aided crash reconstruction.
Lisa Wundersitz for the drafting of site diagrams.
Those people who worked on the collection of data for this study: Roland Earl, Roger
Galbraith, Robert Baird and Matthew Baldock.
Chris Brooks and John Goldsworthy from the Federal Office of Road Safety for invaluable
feedback and suggestions during the whole course of the study.
The study was funded by the Federal Office of Road Safety of the Australian Department of
Transport and Regional Development and supported by the secondment of an engineer from
the South Australian Department of Transport.
The NHMRC Road Accident Research Unit is supported by a Research Unit Grant from the
National Health and Medical Research Council
58
REFERENCES
Armour M, Cinquegrana C. 1990. Victorian study of single vehicle rural accidents. Proceedings of the 15thAustralian Road Research Board Conference, Part 7, Australian Road Research Board, Melbourne, pp.79-91.
Australian Bureau of Statistics. 1995. Causes of Death Australia 1994. Cat. No. 3303.0, Australian Bureau ofStatistics, Canberra.
Baruya A, Finch DJ. 1994. Investigation of traffic speeds and accidents on urban roads. In: Traffic managementand road safety: Proceedings of Seminar J held at the PTRC European Transport Forum; 1994 Sep 12-16;Warwick. London: PTRC Education and Research Services, 1994: 219-230.
Borkenstein RF, Crowther FG, Shumate RP, Zeil WB, Zylman R. 1974. The role of the drinking driver in trafficaccidents. Blutalkohol, vol. 11 (suppl. 1), pp 1-132.
Bowie N, Walz M. 1991. Data analysis of the speed-related crash issue. Paper presented to 13th InternationalTechnical Conference on Experimental Safety Vehicles, Paris, 4-7 Nov.
Brindle RE. 1996. The relationship between traffic management, speed and safety in neighbourhoods. In: Livingwith traffic: twenty-seven contributions to the art and practice of traffic calming 1979-1992. Melbourne:ARRB Transport Research. Special Report No.: 53.
Cameron M, Cavallo A, Gilbert A. 1992. Crash-based evaluation of the speed camera program in Victoria 1990-1991: Phase 1: General effects: Phase 2: Effects of program mechanisms. Melbourne: Monash UniversityAccident Research Centre. Report No.: 42.
Cirillo JA. 1968. Interstate system accident research: study II, interim report II. Public Roads 1968; 35(3): 71-75.
Cleveland DE. 1959. Driver characteristics and speed performance related to the facility. Highway ResearchBoard Bulletin; 212: 1-10.
Cowley JE. 1987. The Relationship Between Speed and Accidents: A Literature Review. Report No. GR/87/2,Road Traffic Authority, Hawthorn, Victoria.
DeSilva HR. 1940. A study of motor-vehicle drivers and speed in Connecticut. Public Roads 1940; 21: 89-101.
Dickersin K. 1990. The existence of publication bias and risk factors for its occurrence. Journal of the AmericanMedical Association; 263(10): 1385-1389.
Federal Office of Road Safety. 1992. Years of Potential Life Lost Through Road Crashes: 1990, A Comparisonwith Other Causes of Death. Federal Office of Road Safety, Department of Transport andCommunications, Canberra.
Federal Office of Road Safety. 1994. Road Fatalities Australia. Federal Office of Road Safety, Department ofTransport, Canberra.
Federal Office of Road Safety. 1996. Road fatality trends in Australia: 1995 summary. Federal Office of RoadSafety, Department of Transport and Regional Development, Canberra.
Fieldwick R, Brown RJ. 1987. The effect of speed limits on road casualties. Traffic Engineering and Control;28(12): 635-640.
Fildes BN, Rumbold G, Leening A. 1991. Speed behaviour and drivers’ attitudes to speeding. Melbourne:VicRoads. Report No.: 16.
Finch DJ, Kompfner P, Lockwood CR, Maycock G. 1994. Speed, speed limits and accidents. Crowthorne,Berkshire: Transport Research Laboratory. Project Report No.: 58.
Fridstrom L, Ifver J, Ingebrigtsen S, Kulmala R, Krogsgard Thomsen L. 1995. Measuring the contribution ofrandomness, exposure, weather, and daylight to the variation in road accident counts. Accident Analysisand Prevention; 27(1): 1-20.
Garber NJ, Gadirau R. 1988. Speed variance and its influence on accidents. Washington, DC: AAA Foundationfor Traffic Safety.
Gart JJ. 1962. Approximate confidence limits for the relative risk. J.R. Statist. Soc. B. 24; 454-63.
Godwin SR, Kulash DJ. 1988. The 55 mph limit on US roads: authors’ closure. Transport Reviews; 8(3): 245-247.
Godwin SR. 1992. Effect of the 65 mph speed limit on highway safety in the USA. Transport Reviews; 12(1): 1-14.
Graham S. 1996. Will higher speed limits kill? Traffic Safety; 96(3): 6-10.
Greenshields BD. 1963. Driving behaviour and related problems. Highway Research Record; 25: 14-32.
Haworth N, Rechnitzer G. 1993. Description of fatal crashes involving various causal variables. Department ofTransport, Federal Office of Road Safety, CR 119, Canberra, Australia.
59
Holubowycz OT, McLean AJ, McCaul KA. 1991. A new method of breath testing the general drivingpopulation. J Stud Alcohol; 52: 474-477.
Insurance Institute for Highway Safety. 1991. Is speed variation, not speed itself, the real problem? AccidentReconstruction Journal; 3(6): 16.
Johansson P. 1996. Speed limitation and motorway casualties: a time series count data regression approach.Accident Analysis and Prevention; 28(1): 73-87.
Johns TR, Bundy HL. 1974. Driver performance in young males as measured by the Highways SystemsResearch Car. Chapel Hill, North Carolina: University of North Carolina.
Joksch HC. 1975. An empirical relation between fatal accident involvement per accident involvement and speed.Accident Analysis and Prevention; 7(2): 129-132.
Krzeminski RJ. 1976. The use of skewed speed distributions to locate points of high accident potential on lowvolume two-lane rural highways. West Lafayette, Indiana: Purdue University & Indiana State HighwayCommission.
Lave AC. 1985. Speeding, coordination, and the 55 MPH limit. The American Economic Review; 75(5): 1159-1164.
Lave C, Elias P. 1994. Did the 65 mph speed limit save lives? Accident Analysis and Prevention; 26(1): 49-62.
Lefeve BA. 1956. Relation of accidents to speed habits and other driver characteristics. Highway ResearchBoard Bulletin; 120: 6-30.
Lloyd CJ. 1990. The comparison of accident counts up to the present date. Journal of Safety Research; 21(2): 75-8.
MacMahon B, Pugh TF. 1970. Epidemiology principles and methods. Little, Brown and Company; Boston,Massachusetts.
McLean AJ, Anderson RWG, Farmer MJB, Lee BH, Brooks CG. 1994. Vehicle travel speeds and the incidenceof fatal pedestrian collisions. Department of Transport, Federal Office of Road Safety, CR 146, Canberra,Australia.
McLean AJ, Holubowycz OT and Sandow BL, 1980. Alcohol and Crashes: Identification of Relevant Factors inthis Association. Road Accident Research Unit, University of Adelaide, Adelaide.
McLean AJ, Offler WJ, Sandow BL. 1979. Adelaide in-depth accident study 1975-1979, Part 7: Road and trafficfactors. Adelaide: Road Accident Research Unit, University of Adelaide.
McLean AJ, Robinson GK. 1979. Adelaide in-depth accident study 1975-1979, Part 1: Overview. Adelaide:Road Accident Research Unit, University of Adelaide.
Mitchell-Taverner P, Adams K and Hejtmanek S. 1997. Community attitudes to road safety: Communityattitudes survey wave 10. Federal Office of Road Safety, Department of Transport and RegionalDevelopment, Canberra, Australia.
Moore VM, Dolinis J, Woodward AJ. 1995. Vehicle speed and risk of a severe crash. Epidemiology; 6(3): 258-62.
Munden JM. 1967. The relation between a driver’s speed and his accident rate. Crowthorne, Berkshire:Transport and Road Research Laboratory. Report No.: LR 88.
Neter J, Kutner MH, Nachtsheim CJ, Wasserman W. 1990. Applied linear statistical models. Chicago: Irwin.
Nilsson G. 1990. Reduction in the speed limit from 100 km/h to 90 km/h during summer 1989: effects onpersonal injury accidents, injured and speeds. Linkoping, Sweden: Swedish Road and Traffic ResearchInstitute. Report No.: 358A.
O’Day J, Flora J. 1982. Alternative measures of restraint system effectiveness: interaction with crash severityfactors. Warrendale, Pennsylvania: Society of Automotive Engineers. Technical Paper No.: 820798.
Office of Road Safety. 1996. Road Crashes in South Australia. Office of Road Safety, South AustralianDepartment of Transport, Adelaide.
Plowden S, Hillman M. 1984. Danger on the Road: The Needless Scourge. Policy Studies Institute, London.
Research Triangle Institute. 1970. Speed and accidents: Volume I. Washington, DC: US Department ofTransportation.
Schmidt G. 1996. Results of speed and accident studies on two-lane rural roads in Germany. In: Proceedings ofthe Conference Road Safety in Europe and Strategic Highway Research Program (SHRP); 1995 Sep 20-22; Prague. Linkoping, Sweden: Swedish National Road and Transport Research Institute: No 4A, Part 2,1-16.
Sliogeris J. 1992. 110 kilometre per hour speed limit - evaluation of road safety effects. Melbourne: VicRoads.Report No.: GR92-8.
60
Solomon D. 1964. Accidents on main rural highways related to speed, driver and vehicle. Washington, DC: USDepartment of Commerce & Bureau of Public Roads.
Stuster JW. 1995. Experimental evaluation of municipal speed enforcement programs: final report. Washington:National Highway Traffic Safety Administration. Report No.: DOT HS 808 325.
Taylor WC. 1965. Speed zoning: a theory and its proof. Traffic Engineering; 35(4): 48-51.
Tilden CJ. 1936. Motor vehicle speeds on Connecticut highways. New Haven: Yale University.
Transportation Research Board. 1984. 55: A decade of experience. Washington, DC: National Research Council.Special Report No.: 204.
Victoria, Parliament. 1991. Inquiry into Speed Limits in Victoria: Report from the Social DevelopmentCommittee. Parl. Paper 196, Melbourne.
Wasielewski P. 1984. Speed as a measure of driver risk: observed speeds versus driver and vehiclecharacteristics. Accident Analysis and Prevention; 16(2): 89-103.
West LB, Dunn JW. 1971. Accidents, speed deviation and speed limits. Traffic Engineering. Jul; 41: 52-55.
West R, French D, Kemp R, Elander J. 1993. Direct observation of driving, self reports of driver behaviour, andaccident involvement. Ergonomics; 36(5): 557-67.
White SB, Nelson AC. 1970. Some effects of measurement errors in estimating involvement rate as a function ofdeviation from mean traffic speed. Journal of Safety Research; 2(2): 67-72.
Wilson T, Greensmith J. 1983. Multivariate analysis of the relationship between drivometer variables anddrivers’ accident, sex, and exposure status. Human Factors; 25(3): 303-12.
Winnett M. 1994. A review of speed camera operations in the UK. In: Traffic management and road safety:Proceedings of Seminar J held at the PTRC European Transport Forum; 1994 Sep 12-16; Warwick.London: PTRC Education and Research Services: 265-276.