Travel & Tourism - Official Site · WTTC Travel & Tourism Economic Impact 2015 The World Travel &...
24
The Authority on World Travel & Tourism Travel & Tourism ECONOMIC IMPACT 2015 GRENADA
Transcript of Travel & Tourism - Official Site · WTTC Travel & Tourism Economic Impact 2015 The World Travel &...
The Authority on World Travel & Tourism
Travel & Tourism Economic impact 2015 Grenada

For more information, please contact:
Rochelle TurnerHead of Research
©2015 World travel & tourism council
WTTC Travel & Tourism Economic Impact 2015
The World Travel & Tourism Council (WTTC) is the global authority on the economic and social contribution of Travel & Tourism. WTTC promotes sustainable growth for the sector, working with governments and international institutions to create jobs, to drive exports and to generate prosperity.
Travel & Tourism’s impact on the economic and social development of a country can be enormous; opening it up for business, trade and capital investment, creating jobs and entrepreneurialism for the workforce and protecting heritage and cultural values. To fully understand its impact, however, governments, policy makers and businesses around the world require accurate and reliable data on the impact of the sector. Data is needed to help assess policies that govern future industry development and to provide knowledge to help guide successful and sustainable Travel & Tourism investment decisions.
For 25 years, WTTC has been quantifying the economic impact of Travel & Tourism. This year, the 2015 Annual Economic Reports cover 184 countries and 25 regions of the world, including, for the first time, the Pacific Alliance.
Travel & Tourism generated US$7.6 trillion (10% of global GDP) and 277 million jobs (1 in 11 jobs) for the global economy in 2014. Recent years have seen Travel & Tourism growing at a faster rate than both the wider economy and other significant sectors such as automotive, financial services and health care. Last year was no exception. International tourist arrivals also surged, reaching nearly 1.14billion and visitor spending more than matched that growth. Visitors from emerging economies now represent a 46% share of these international arrivals (up from 38% in 2000), proving the growth and increased opportunities for travel from those in these new markets.
The sector faces challenges every year and this year is likely to be no different. The weakness and potential volatility of many currencies against the US dollar and a deep recession in Russia, a key outbound market, will slow outbound spending in line with slower world trade overall in 2015. However, falling oil prices will bring significant improvements for net oil importers in 2015, easing upward pressure on living costs, increasing disposable household incomes and domestic consumer spending, and lowering air fares. As a result, Travel & Tourism expansion is forecast to continue at a stronger rate than last year, with the total contribution to GDP expected to increase by 3.7%. New destinations and investment opportunities will also continue to emerge as tourism becomes increasingly affordable across the developing world. This growth will require countries to adopt a concerted and coordinated approach to talent planning and development between their industry, governments and educational institutions to ensure they fulfil their potential in the years ahead.
WTTC is proud to continue to provide this clear and empirical data in order to help both public and private bodies make the right decisions for the future growth of a sustainable Travel & Tourism sector.
David ScowsillPresident & CEOWTTC
Foreword
Foreword
2015 Annual Research: Key Facts ...............................................1
Defining the Economic Contribution of Travel & Tourism .............2
Travel & Tourism’s Contribution to GDP .......................................3
Travel & Tourism’s Contribution to Employment ..........................4
Visitor Exports and Investment ....................................................5
Different Components of Travel & Tourism ...................................6
Country Rankings: Absolute Contribution, 2014 ..........................7
Country Rankings: Relative Contribution, 2014 ...........................8
Country Rankings: Real Growth, 2015 .........................................9
Country Rankings: Long Term Growth, 2015-2025 ....................10
Summary Tables: Estimates & Forecasts ...................................11
The Economic Contribution of Travel & Tourism: Real 2014 Prices ........................................................................12
The Economic Contribution of Travel & Tourism: Nominal Prices ...........................................................................13
The Economic Contribution of Travel & Tourism: Growth ..........14
Glossary .....................................................................................15
Methodological Note ..................................................................16
Regions, Sub-regions, Countries ...............................................17
UsE of matERial is aUtHoRisEd, pRovidEd soURcE is acknoWlEdgEd
Harlequin Building, 65 southwark street, london, sE1 0HR, Uk tel: +44 (0)20 7481 8007 Email: [email protected] www.wttc.org
The Economic Impact of Travel & Tourism 2015
Contents
1All values are in constant 2014 prices & exchange rates
= Total contribution of Travel & Tourism
Grenada
2015 ANNUAL RESEARCH: KEY FACTS 2015 forecast
EMPLOYMENT: DIRECT CONTRIBUTION
EMPLOYMENT: TOTAL CONTRIBUTION
VISITOR EXPORTS
INVESTMENT
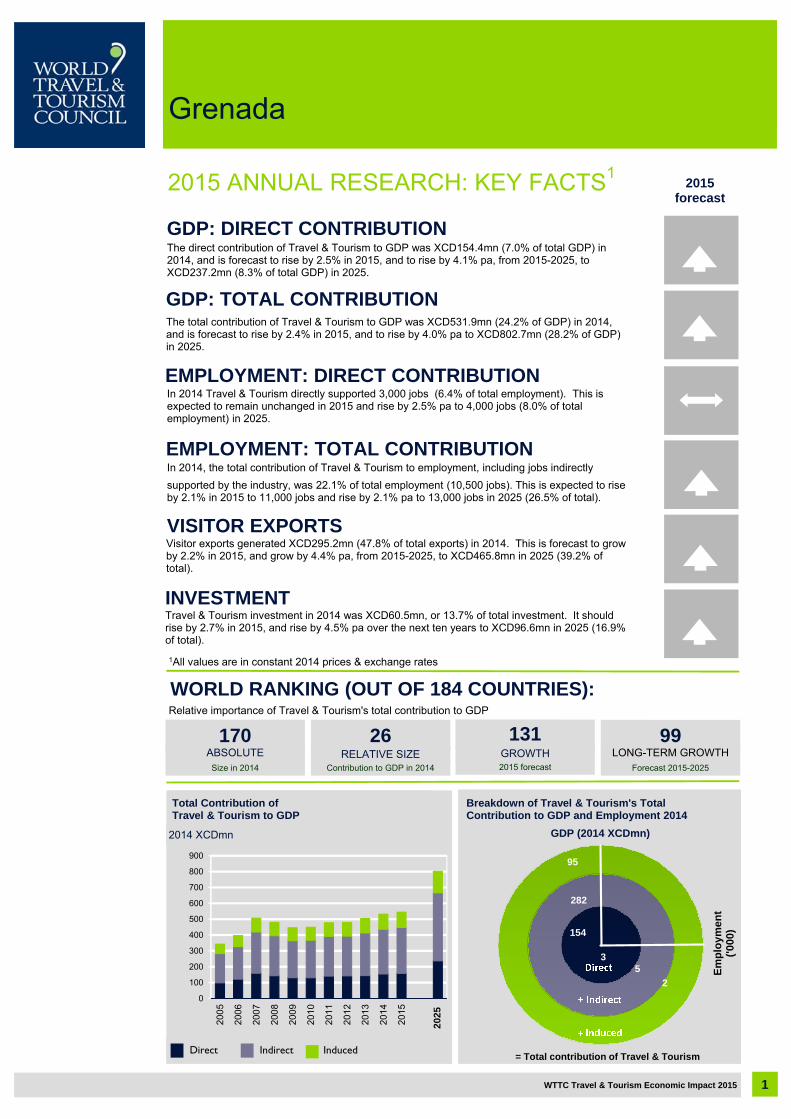
WORLD RANKING (OUT OF 184 COUNTRIES):Relative importance of Travel & Tourism's total contribution to GDP
170ABSOLUTE
Size in 2014
26
Contribution to GDP in 2014
RELATIVE SIZE
131GROWTH2015 forecast
Total Contribution of Travel & Tourism to GDP
Breakdown of Travel & Tourism's Total Contribution to GDP and Employment 2014
2014 XCDmn GDP (2014 XCDmn)
Direct Indirect Induced
0
100
200
300
400
500
600
700
800
900
200
5
200
6
200
7
200
8
200
9
201
0
201
1
201
2
201
3
201
4
201
5
202
5
2014 XCDmn2014 XCDmn
Em
plo
ymen
t ('
000)
WTTC Travel & Tourism Economic Impact 2015 1
The direct contribution of Travel & Tourism to GDP was XCD154.4mn (7.0% of total GDP) in 2014, and is forecast to rise by 2.5% in 2015, and to rise by 4.1% pa, from 2015-2025, to XCD237.2mn (8.3% of total GDP) in 2025.
The total contribution of Travel & Tourism to GDP was XCD531.9mn (24.2% of GDP) in 2014, and is forecast to rise by 2.4% in 2015, and to rise by 4.0% pa to XCD802.7mn (28.2% of GDP) in 2025.
In 2014 Travel & Tourism directly supported 3,000 jobs (6.4% of total employment). This is expected to remain unchanged in 2015 and rise by 2.5% pa to 4,000 jobs (8.0% of total employment) in 2025.
In 2014, the total contribution of Travel & Tourism to employment, including jobs indirectly
Visitor exports generated XCD295.2mn (47.8% of total exports) in 2014. This is forecast to grow by 2.2% in 2015, and grow by 4.4% pa, from 2015-2025, to XCD465.8mn in 2025 (39.2% of total).
Travel & Tourism investment in 2014 was XCD60.5mn, or 13.7% of total investment. It should rise by 2.7% in 2015, and rise by 4.5% pa over the next ten years to XCD96.6mn in 2025 (16.9% of total).
2025
GDP: DIRECT CONTRIBUTION
GDP: TOTAL CONTRIBUTION
supported by the industry, was 22.1% of total employment (10,500 jobs). This is expected to rise by 2.1% in 2015 to 11,000 jobs and rise by 2.1% pa to 13,000 jobs in 2025 (26.5% of total).
99LONG-TERM GROWTH
Forecast 2015-2025
1
95
282
154
35
2
●
●
●
WTTC Travel & Tourism Economic Impact 20152
Defining the economiccontribution of Travel & Tourism
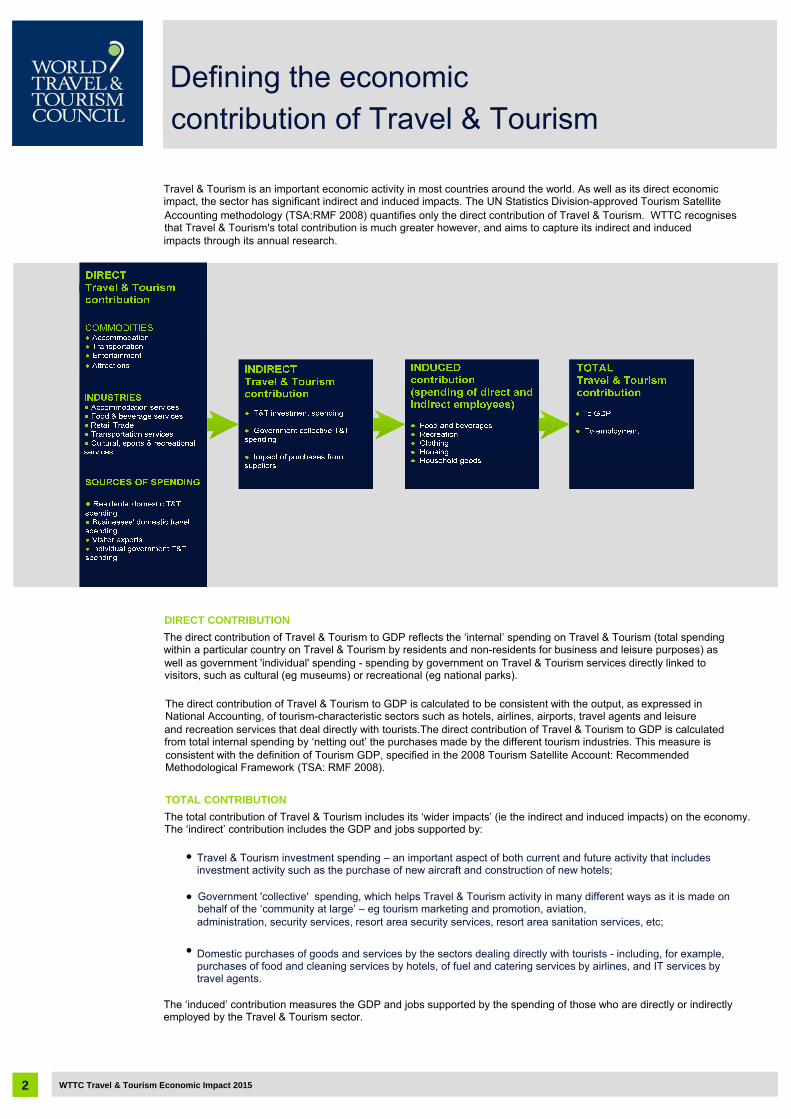
Travel & Tourism is an important economic activity in most countries around the world. As well as its direct economic impact, the sector has significant indirect and induced impacts. The UN Statistics Division-approved Tourism SatelliteAccounting methodology (TSA:RMF 2008) quantifies only the direct contribution of Travel & Tourism. WTTC recognises that Travel & Tourism's total contribution is much greater however, and aims to capture its indirect and induced impacts through its annual research.
DIRECT CONTRIBUTION
The direct contribution of Travel & Tourism to GDP reflects the ‘internal’ spending on Travel & Tourism (total spending within a particular country on Travel & Tourism by residents and non-residents for business and leisure purposes) as well as government 'individual' spending - spending by government on Travel & Tourism services directly linked to visitors, such as cultural (eg museums) or recreational (eg national parks).
The direct contribution of Travel & Tourism to GDP is calculated to be consistent with the output, as expressed in National Accounting, of tourism-characteristic sectors such as hotels, airlines, airports, travel agents and leisure and recreation services that deal directly with tourists.The direct contribution of Travel & Tourism to GDP is calculated from total internal spending by ‘netting out’ the purchases made by the different tourism industries. This measure is consistent with the definition of Tourism GDP, specified in the 2008 Tourism Satellite Account: Recommended Methodological Framework (TSA: RMF 2008).
TOTAL CONTRIBUTION
The total contribution of Travel & Tourism includes its ‘wider impacts’ (ie the indirect and induced impacts) on the economy.The ‘indirect’ contribution includes the GDP and jobs supported by:
Travel & Tourism investment spending – an important aspect of both current and future activity that includes investment activity such as the purchase of new aircraft and construction of new hotels;
Government 'collective' spending, which helps Travel & Tourism activity in many different ways as it is made on behalf of the ‘community at large’ – eg tourism marketing and promotion, aviation, administration, security services, resort area security services, resort area sanitation services, etc;
Domestic purchases of goods and services by the sectors dealing directly with tourists - including, for example, purchases of food and cleaning services by hotels, of fuel and catering services by airlines, and IT services by travel agents.
The ‘induced’ contribution measures the GDP and jobs supported by the spending of those who are directly or indirectly employed by the Travel & Tourism sector.
GRENADA: DIRECT CONTRIBUTION OF TRAVEL & TOURISM TO GDP
GRENADA: TOTAL CONTRIBUTION OF TRAVEL & TOURISM TO GDP
1 All values are in constant 2014 prices & exchange rates
3
Travel & Tourism'scontribution to GDP1
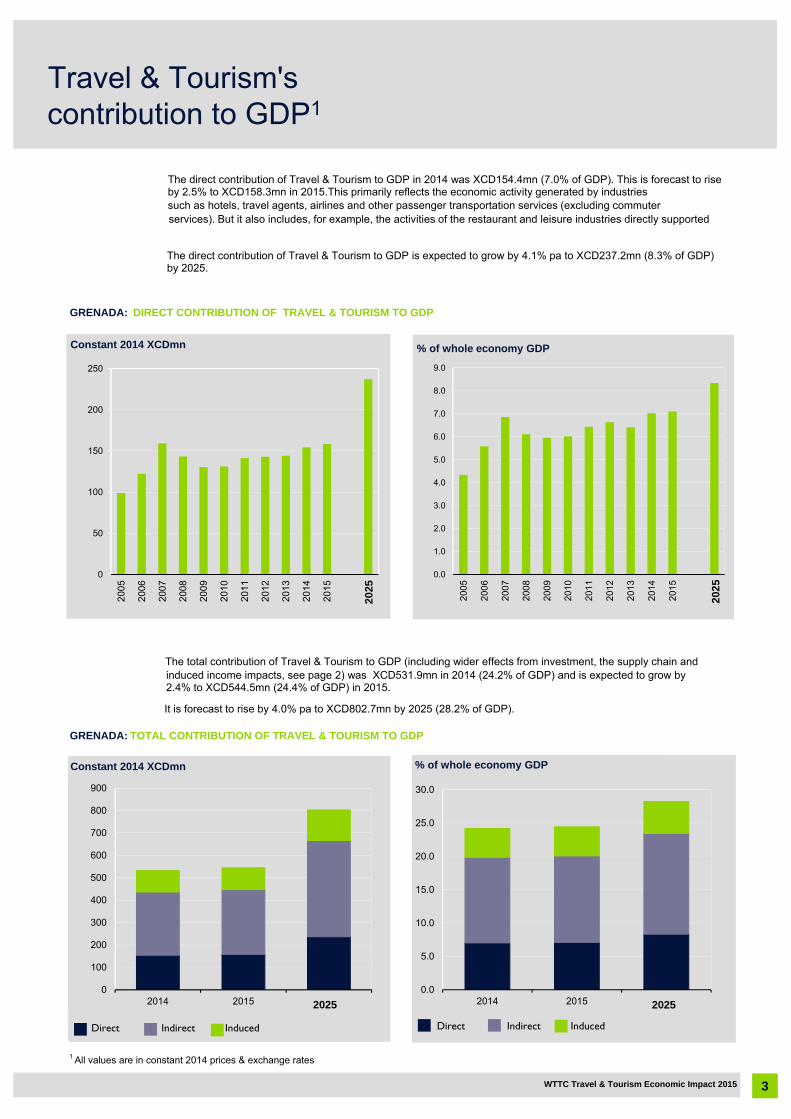
The direct contribution of Travel & Tourism to GDP in 2014 was XCD154.4mn (7.0% of GDP). This is forecast to rise by 2.5% to XCD158.3mn in 2015.This primarily reflects the economic activity generated by industries such as hotels, travel agents, airlines and other passenger transportation services (excluding commuter services). But it also includes, for example, the activities of the restaurant and leisure industries directly supported
The direct contribution of Travel & Tourism to GDP is expected to grow by 4.1% pa to XCD237.2mn (8.3% of GDP) by 2025.
0
50
100
150
200
250
2005
2006
2007
2008
2009
2010
2011
2012
2013
2014
2015
2025
2025
Constant 2014 XCDmn % of whole economy GDP
0.0
1.0
2.0
3.0
4.0
5.0
6.0
7.0
8.0
9.0
200
5
200
6
200
7
200
8
200
9
201
0
201
1
201
2
201
3
201
4
201
5
202
520
25
induced income impacts, see page 2) was XCD531.9mn in 2014 (24.2% of GDP) and is expected to grow by 2.4% to XCD544.5mn (24.4% of GDP) in 2015.
It is forecast to rise by 4.0% pa to XCD802.7mn by 2025 (28.2% of GDP).
Constant 2014 XCDmn
Direct Indirect Induced
0
100
200
300
400
500
600
700
800
900
2014 2015 202520252025
0.0
5.0
10.0
15.0
20.0
25.0
30.0
2014 2015 20252025
% of whole economy GDP
Direct Indirect Induced
WTTC Travel & Tourism Economic Impact 2015
The total contribution of Travel & Tourism to GDP (including wider effects from investment, the supply chain and
GRENADA: DIRECT CONTRIBUTION OF TRAVEL & TOURISM TO EMPLOYMENT
GRENADA: TOTAL CONTRIBUTION OF TRAVEL & TOURISM TO EMPLOYMENT
4
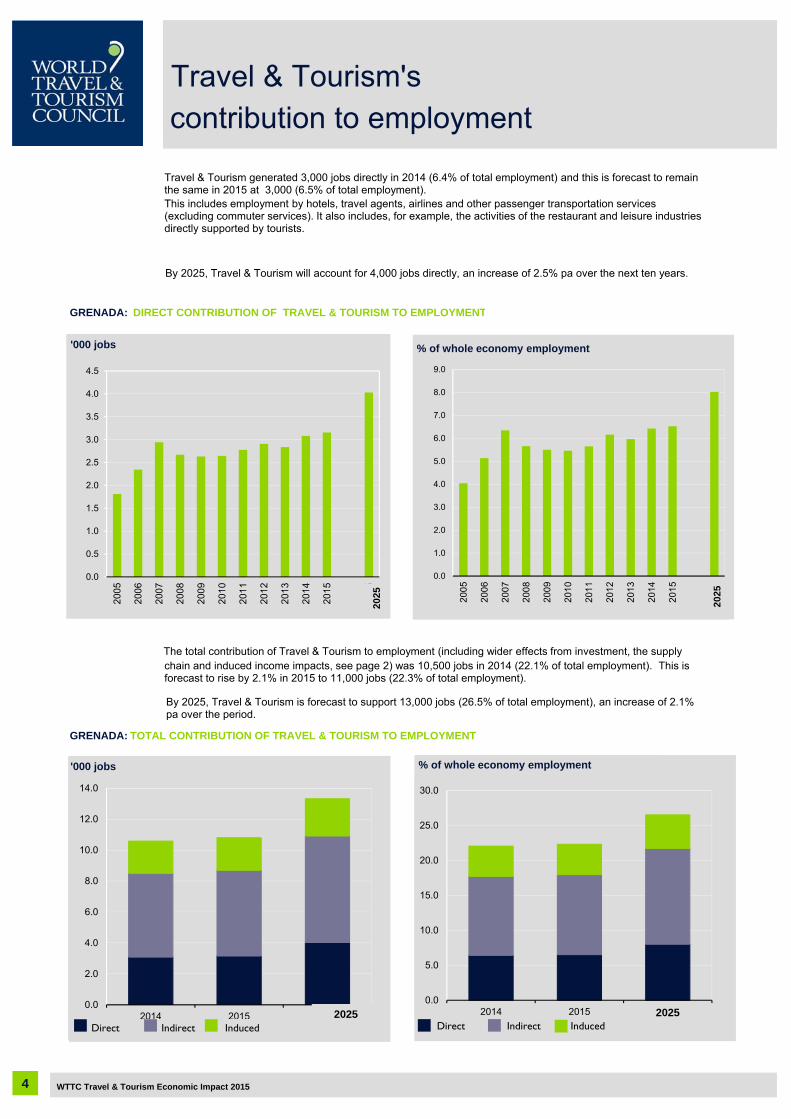
Travel & Tourism generated 3,000 jobs directly in 2014 (6.4% of total employment) and this is forecast to remain the same in 2015 at 3,000 (6.5% of total employment).This includes employment by hotels, travel agents, airlines and other passenger transportation services (excluding commuter services). It also includes, for example, the activities of the restaurant and leisure industries directly supported by tourists.
By 2025, Travel & Tourism will account for 4,000 jobs directly, an increase of 2.5% pa over the next ten years.
0.0
0.5
1.0
1.5
2.0
2.5
3.0
3.5
4.0
4.5
2005
2006
2007
2008
2009
2010
2011
2012
2013
2014
2015
2025
'000 jobs % of whole economy employment
0.0
1.0
2.0
3.0
4.0
5.0
6.0
7.0
8.0
9.0
200
5
200
6
200
7
200
8
200
9
201
0
201
1
201
2
201
3
201
4
201
5
202
5
The total contribution of Travel & Tourism to employment (including wider effects from investment, the supply
By 2025, Travel & Tourism is forecast to support 13,000 jobs (26.5% of total employment), an increase of 2.1% pa over the period.
'000 jobs
Direct Indirect Induced
0.0
2.0
4.0
6.0
8.0
10.0
12.0
14.0
2014 2015 202520250.0
5.0
10.0
15.0
20.0
25.0
30.0
2014 2015 20252025
% of whole economy employment
Direct Indirect Induced
WTTC Travel & Tourism Economic Impact 2015
Travel & Tourism'scontribution to employment
chain and induced income impacts, see page 2) was 10,500 jobs in 2014 (22.1% of total employment). This is forecast to rise by 2.1% in 2015 to 11,000 jobs (22.3% of total employment).
2025
2025
VISITOR EXPORTS
GRENADA: VISITOR EXPORTS AND INTERNATIONAL TOURIST ARRIVALS
INVESTMENT
GRENADA: CAPITAL INVESTMENT IN TRAVEL & TOURISM
1 All values are in constant 2014 prices & exchange rates
5
Visitor Exports and Investment1
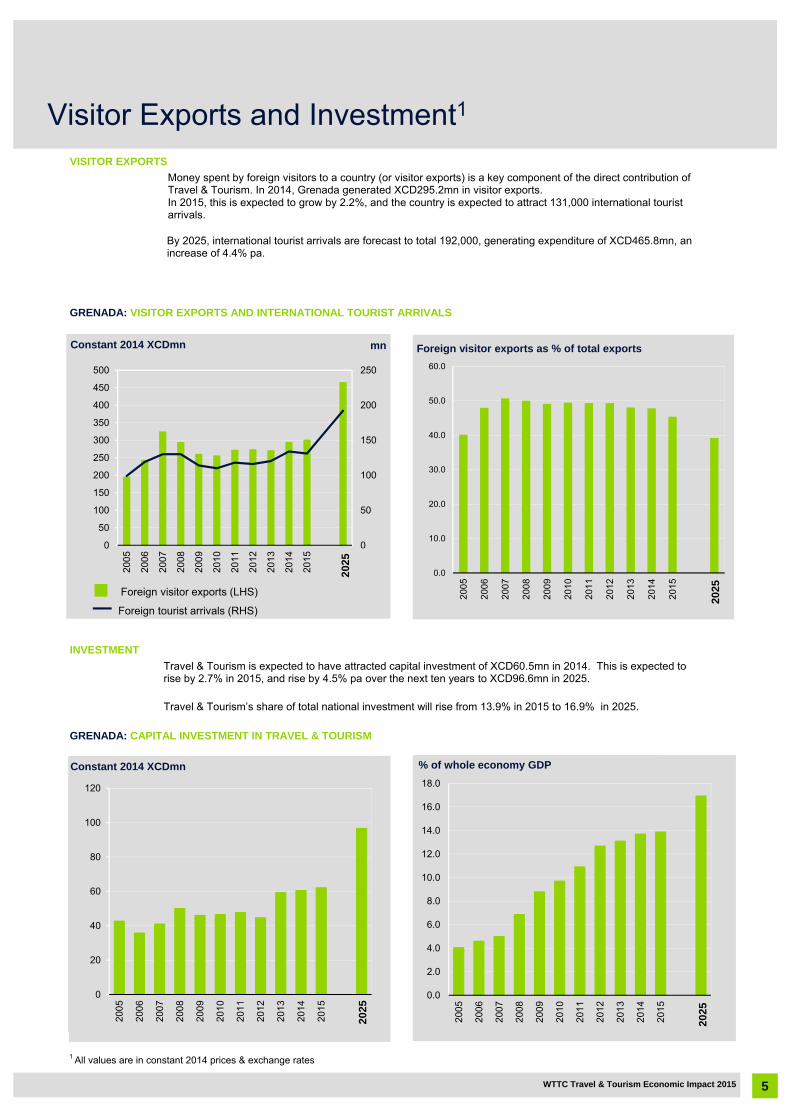
Money spent by foreign visitors to a country (or visitor exports) is a key component of the direct contribution of Travel & Tourism. In 2014, Grenada generated XCD295.2mn in visitor exports. In 2015, this is expected to grow by 2.2%, and the country is expected to attract 131,000 international tourist arrivals.
By 2025, international tourist arrivals are forecast to total 192,000, generating expenditure of XCD465.8mn, an increase of 4.4% pa.
Constant 2014 XCDmn Foreign visitor exports as % of total exports
0.0
10.0
20.0
30.0
40.0
50.0
60.0
200
5
200
6
200
7
200
8
200
9
201
0
201
1
201
2
201
3
201
4
201
5
202
520
25
Travel & Tourism is expected to have attracted capital investment of XCD60.5mn in 2014. This is expected to rise by 2.7% in 2015, and rise by 4.5% pa over the next ten years to XCD96.6mn in 2025.
Travel & Tourism’s share of total national investment will rise from 13.9% in 2015 to 16.9% in 2025.
Constant 2014 XCDmn
0
20
40
60
80
100
120
2005
2006
2007
2008
2009
2010
2011
2012
2013
2014
2015
2025
2025
0.0
2.0
4.0
6.0
8.0
10.0
12.0
14.0
16.0
18.0
2005
2006
2007
2008
2009
2010
2011
2012
2013
2014
2015
2025
2025
% of whole economy GDP
WTTC Travel & Tourism Economic Impact 2015
mn
Foreign tourist arrivals (RHS)
0
50
100
150
200
250
0
50
100
150
200
250
300
350
400
450
500
2005
2006
2007
2008
2009
2010
2011
2012
2013
2014
2015
2025
Foreign visitor exports (LHS)
2025
Leisure spending
Business spending
Foreign visitor spending
Domestic spending
Direct
Induced
Indirect
34.7%
11.1%
7.3% 1 All values are in constant 2014 prices & exchange rates
(b) Investment
72.7%
27.3%
81.2%
18.8%
(c) Government collective
29.0%
17.9%
53.1%Indirect is the sum of:
(a) Supply chain
6 WTTC Travel & Tourism Economic Impact 2015
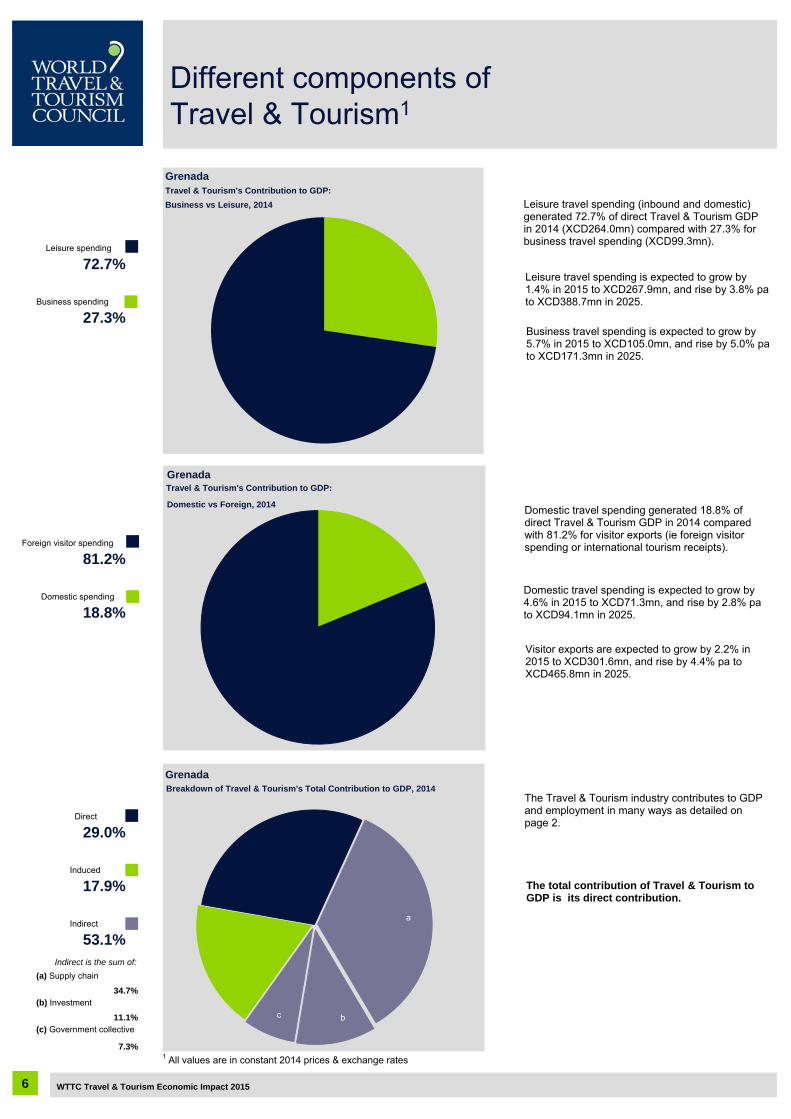
Different components ofTravel & Tourism1
GrenadaTravel & Tourism's Contribution to GDP:
Business vs Leisure, 2014 Leisure travel spending (inbound and domestic) generated 72.7% of direct Travel & Tourism GDP in 2014 (XCD264.0mn) compared with 27.3% for business travel spending (XCD99.3mn).
Business travel spending is expected to grow by 5.7% in 2015 to XCD105.0mn, and rise by 5.0% pa to XCD171.3mn in 2025.
Leisure travel spending is expected to grow by 1.4% in 2015 to XCD267.9mn, and rise by 3.8% pa to XCD388.7mn in 2025.
Grenada
Domestic vs Foreign, 2014
Travel & Tourism's Contribution to GDP:
Domestic travel spending generated 18.8% of direct Travel & Tourism GDP in 2014 compared with 81.2% for visitor exports (ie foreign visitor spending or international tourism receipts).
Domestic travel spending is expected to grow by 4.6% in 2015 to XCD71.3mn, and rise by 2.8% pa to XCD94.1mn in 2025.
Visitor exports are expected to grow by 2.2% in 2015 to XCD301.6mn, and rise by 4.4% pa to XCD465.8mn in 2025.
a
bc
GrenadaBreakdown of Travel & Tourism's Total Contribution to GDP, 2014
The Travel & Tourism industry contributes to GDP and employment in many ways as detailed on page 2.
The total contribution of Travel & Tourism to GDP is its direct contribution.
2014 2014(US$bn) (US$bn)
World Average 19.4 World Average 58.3
Americas Average 16.3 Americas Average 47.6
88 Bahamas 1.7 93 Bahamas 3.8
117 Trinidad and Tobago 0.8 111 Aruba 2.3
118 Aruba 0.8 114 Trinidad and Tobago 2.0
137 Martinique 0.4 130 Martinique 1.5
143 Bermuda 0.3 142 Bermuda 0.9
153 Antigua and Barbuda 0.2 147 Antigua and Barbuda 0.7
155 St Lucia 0.2 151 St Lucia 0.5
172 Anguilla 0.1 168 St Kitts and Nevis 0.2
174 Grenada 0.1 170 Grenada 0.2
175 St Kitts and Nevis 0.1 172 Anguilla 0.2
2014 2014'000 jobs '000 jobs
World Average 827.0 World Average 2076.6
Americas Average 366.9 Americas Average 943.1
110 Bahamas 51.2 119 Bahamas 98.1
135 Trinidad and Tobago 27.4 133 Trinidad and Tobago 72.7
146 Aruba 16.4 147 Aruba 45.8
149 St Lucia 15.6 151 St Lucia 33.8
169 Antigua and Barbuda 4.9 165 Antigua and Barbuda 16.3
170 Martinique 4.3 166 Martinique 16.1
172 Bermuda 3.6 172 Grenada 10.6
176 Grenada 3.1 179 Bermuda 7.1
183 Anguilla 1.6 180 St Kitts and Nevis 5.9
184 St Kitts and Nevis 1.6 184 Anguilla 4.7
2014 2014(US$bn) (US$bn)
Americas Average 4.9 World Average 7.5
World Average 4.5 Americas Average 6.6
91 Bahamas 0.4 71 Bahamas 2.3
99 Trinidad and Tobago 0.3 91 Aruba 1.6
122 Aruba 0.2 115 Trinidad and Tobago 0.8
142 Antigua and Barbuda 0.1 127 Martinique 0.5
147 Martinique 0.1 133 Bermuda 0.4
155 St Lucia 0.1 138 Antigua and Barbuda 0.4
159 St Kitts and Nevis 0.0 141 St Lucia 0.4
168 Bermuda 0.0 158 Anguilla 0.1
170 Grenada 0.0 160 St Kitts and Nevis 0.1
181 Anguilla 0.0 162 Grenada 0.1
Travel & Tourism's Direct Travel & Tourism's Total Contribution to GDP Contribution to GDP
Travel & Tourism's Direct Travel & Tourism's Total
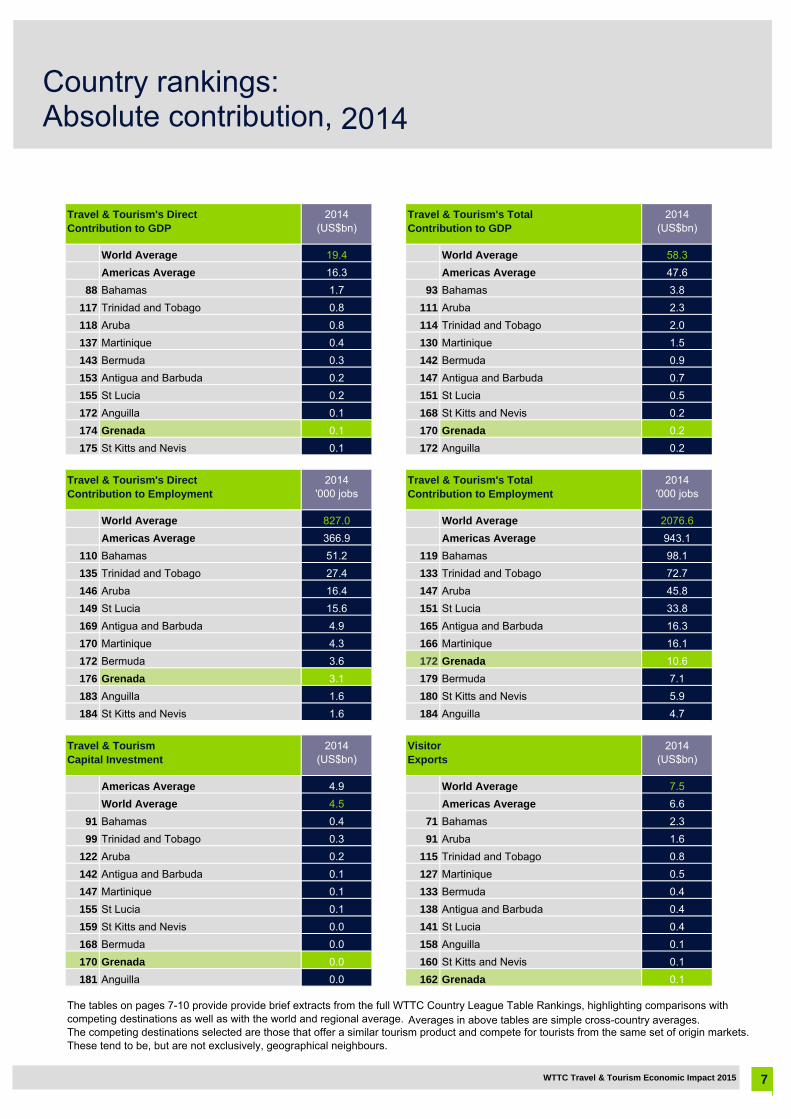
The tables on pages 7-10 provide provide brief extracts from the full WTTC Country League Table Rankings, highlighting comparisons with competing destinations as well as with the world and regional average. The competing destinations selected are those that offer a similar tourism product and compete for tourists from the same set of origin markets. These tend to be, but are not exclusively, geographical neighbours.
Contribution to Employment Contribution to Employment
Travel & Tourism VisitorCapital Investment Exports
7
Country rankings: Absolute contribution, 2014
7WTTC Travel & Tourism Economic Impact 2015
Averages in above tables are simple cross-country averages.
2014 2014% share % share
4 Aruba 28.6 1 Aruba 88.4
6 Anguilla 21.0 5 Anguilla 61.2
7 Bahamas 19.4 6 Antigua and Barbuda 58.3
10 Antigua and Barbuda 15.5 10 Bahamas 43.6
14 St Lucia 13.8 12 St Lucia 39.5
35 Grenada 7.0 25 St Kitts and Nevis 25.5
39 St Kitts and Nevis 6.7 26 Grenada 24.2
56 Bermuda 5.0 47 Bermuda 15.3
96 Trinidad and Tobago 3.2 66 Martinique 12.0
World 3.1 World 9.8
108 Martinique 2.9 106 Trinidad and Tobago 8.7
Americas 2.9 Americas 8.4
2014 2014% share % share
3 Aruba 32.5 2 Aruba 90.8
5 Bahamas 27.0 4 Anguilla 63.4
7 Anguilla 22.4 7 Antigua and Barbuda 53.0
8 St Lucia 20.4 8 Bahamas 51.6
11 Antigua and Barbuda 15.9 9 St Lucia 44.1
22 Bermuda 10.4 23 St Kitts and Nevis 24.2
38 St Kitts and Nevis 6.6 28 Grenada 22.1
39 Grenada 6.4 29 Bermuda 20.5
69 Trinidad and Tobago 4.4 60 Martinique 12.3
Americas 3.7 68 Trinidad and Tobago 11.6
World 3.6 Americas 9.6
96 Martinique 3.3 World 9.4
2014 2014% share % share
2 Antigua and Barbuda 42.0 2 Anguilla 86.5
5 Aruba 31.0 4 Antigua and Barbuda 71.6
12 St Lucia 20.5 6 Aruba 66.9
15 Bahamas 18.3 10 Bahamas 61.5
19 St Kitts and Nevis 17.4 13 St Lucia 59.2
31 Grenada 13.7 22 Grenada 47.8
33 Anguilla 13.2 24 Martinique 41.1
41 Trinidad and Tobago 10.7 32 St Kitts and Nevis 34.6
Americas 4.5 57 Bermuda 19.1
World 4.3 Americas 7.0
126 Martinique 3.6 World 5.7
152 Bermuda 2.7 120 Trinidad and Tobago 5.1
Travel & Tourism's Direct Travel & Tourism's Total Contribution to GDP Contribution to GDP
Travel & Tourism's Direct Travel & Tourism's Total Contribution to Employment Contribution to Employment
Travel & Tourism Investment Visitor ExportsContribution to Total Capital Investment Contribution to Total Exports
WTTC Travel & Tourism Economic Impact 2015
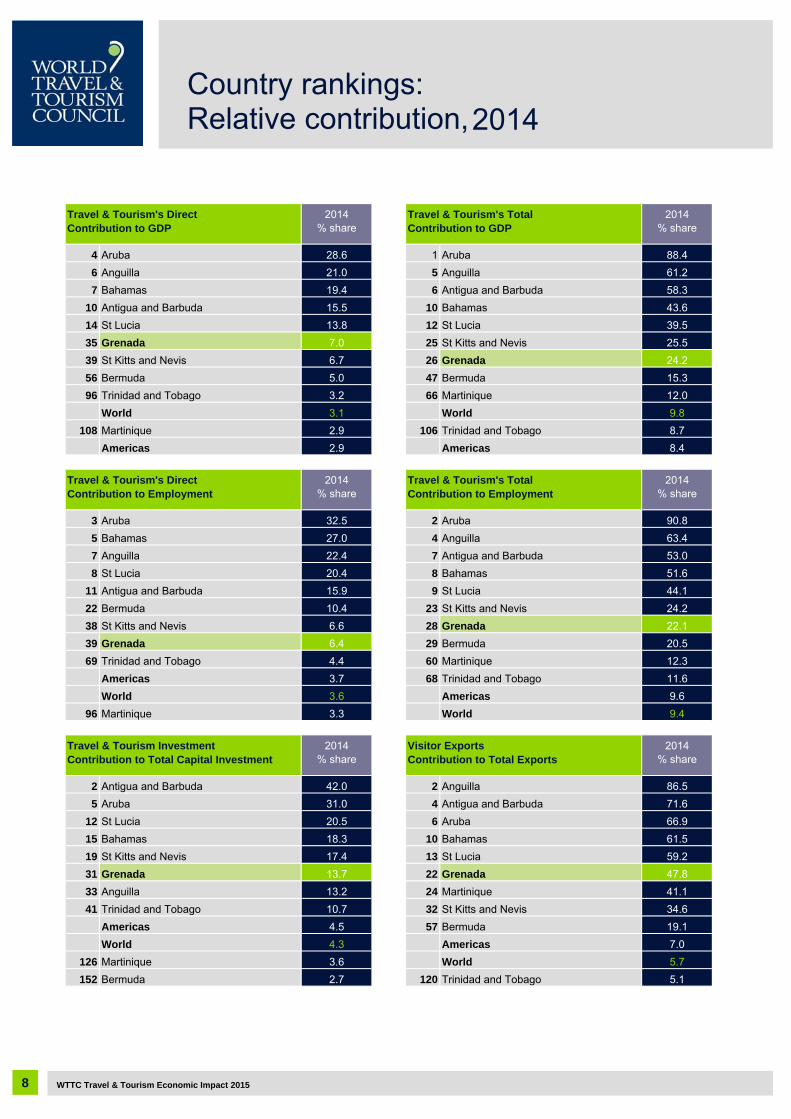
Country rankings: Relative contribution,2014
8
2015 2015% growth % growth
18 Bahamas 6.7 19 Bahamas 6.3
21 St Lucia 6.4 25 St Lucia 5.9
35 St Kitts and Nevis 5.6 49 St Kitts and Nevis 5.0
88 Bermuda 3.7 World 3.7
World 3.7 93 Bermuda 3.3
Americas 3.2 Americas 3.3
109 Anguilla 3.0 94 Aruba 3.2
110 Aruba 3.0 98 Anguilla 3.2
129 Trinidad and Tobago 2.6 123 Trinidad and Tobago 2.5
130 Grenada 2.5 131 Grenada 2.4
135 Martinique 2.3 135 Antigua and Barbuda 2.1
143 Antigua and Barbuda 1.8 144 Martinique 1.7
2015 2015% growth % growth
17 St Lucia 5.7 14 St Lucia 5.1
26 Bahamas 5.0 16 Bahamas 5.0
34 Bermuda 4.4 32 Bermuda 4.1
53 St Kitts and Nevis 3.6 57 St Kitts and Nevis 2.9
Americas 2.7 Americas 2.9
82 Grenada 2.4 World 2.6
World 2.0 68 Aruba 2.5
113 Anguilla 1.3 88 Grenada 2.1
116 Aruba 1.2 113 Trinidad and Tobago 1.4
127 Trinidad and Tobago 1.0 114 Anguilla 1.4
143 Martinique 0.5 153 Martinique -0.2
146 Antigua and Barbuda 0.3 157 Antigua and Barbuda -0.5
2015 2015% growth % growth
52 Martinique 6.3 18 Bahamas 7.8
World 4.8 31 St Lucia 6.4
Americas 4.8 39 St Kitts and Nevis 5.9
89 Aruba 4.8 49 Bermuda 5.3
95 St Kitts and Nevis 4.6 96 Martinique 3.2
107 Bahamas 4.1 97 Trinidad and Tobago 3.1
108 Anguilla 4.1 101 Aruba 2.9
109 Trinidad and Tobago 4.1 103 Anguilla 2.9
130 Antigua and Barbuda 2.7 World 2.8
132 Grenada 2.7 120 Grenada 2.2
135 St Lucia 2.5 129 Antigua and Barbuda 1.7
177 Bermuda 0.1 Americas 1.4
Travel & Tourism's Direct Travel & Tourism's Total Contribution to GDP Contribution to GDP
Travel & Tourism's Direct Travel & Tourism's Total Contribution to Employment Contribution to Employment
Travel & Tourism VisitorInvestment Exports
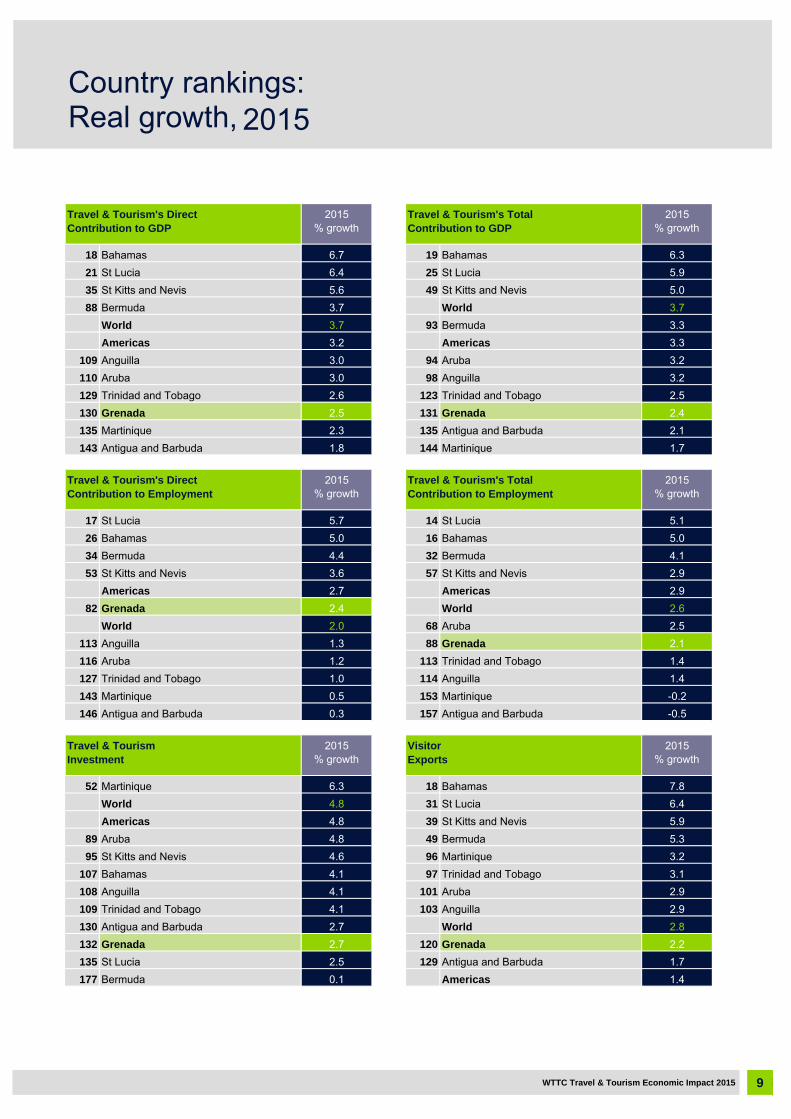
Country rankings: Real growth,
7
2015
9WTTC Travel & Tourism Economic Impact 2015
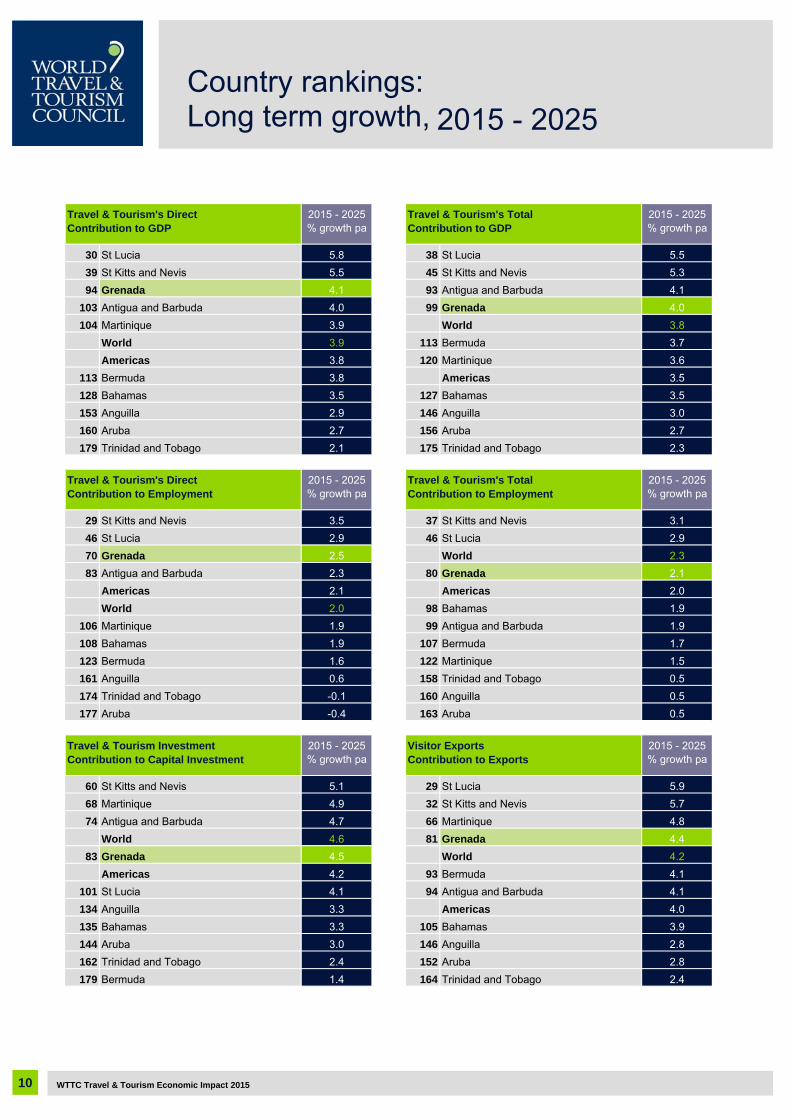
2015 - 2025 2015 - 2025% growth pa % growth pa
30 St Lucia 5.8 38 St Lucia 5.5
39 St Kitts and Nevis 5.5 45 St Kitts and Nevis 5.3
94 Grenada 4.1 93 Antigua and Barbuda 4.1
103 Antigua and Barbuda 4.0 99 Grenada 4.0
104 Martinique 3.9 World 3.8
World 3.9 113 Bermuda 3.7
Americas 3.8 120 Martinique 3.6
113 Bermuda 3.8 Americas 3.5
128 Bahamas 3.5 127 Bahamas 3.5
153 Anguilla 2.9 146 Anguilla 3.0
160 Aruba 2.7 156 Aruba 2.7
179 Trinidad and Tobago 2.1 175 Trinidad and Tobago 2.3
2015 - 2025 2015 - 2025% growth pa % growth pa
29 St Kitts and Nevis 3.5 37 St Kitts and Nevis 3.1
46 St Lucia 2.9 46 St Lucia 2.9
70 Grenada 2.5 World 2.3
83 Antigua and Barbuda 2.3 80 Grenada 2.1
Americas 2.1 Americas 2.0
World 2.0 98 Bahamas 1.9
106 Martinique 1.9 99 Antigua and Barbuda 1.9
108 Bahamas 1.9 107 Bermuda 1.7
123 Bermuda 1.6 122 Martinique 1.5
161 Anguilla 0.6 158 Trinidad and Tobago 0.5
174 Trinidad and Tobago -0.1 160 Anguilla 0.5
177 Aruba -0.4 163 Aruba 0.5
2015 - 2025 2015 - 2025% growth pa % growth pa
60 St Kitts and Nevis 5.1 29 St Lucia 5.9
68 Martinique 4.9 32 St Kitts and Nevis 5.7
74 Antigua and Barbuda 4.7 66 Martinique 4.8
World 4.6 81 Grenada 4.4
83 Grenada 4.5 World 4.2
Americas 4.2 93 Bermuda 4.1
101 St Lucia 4.1 94 Antigua and Barbuda 4.1
134 Anguilla 3.3 Americas 4.0
135 Bahamas 3.3 105 Bahamas 3.9
144 Aruba 3.0 146 Anguilla 2.8
162 Trinidad and Tobago 2.4 152 Aruba 2.8
179 Bermuda 1.4 164 Trinidad and Tobago 2.4
Travel & Tourism's Direct Travel & Tourism's Total Contribution to GDP Contribution to GDP
Travel & Tourism's Direct Travel & Tourism's Total Contribution to Employment Contribution to Employment
Travel & Tourism Investment Visitor ExportsContribution to Capital Investment Contribution to Exports
WTTC Travel & Tourism Economic Impact 2015
Country rankings: Long term growth, 2015 - 2025
10
2015
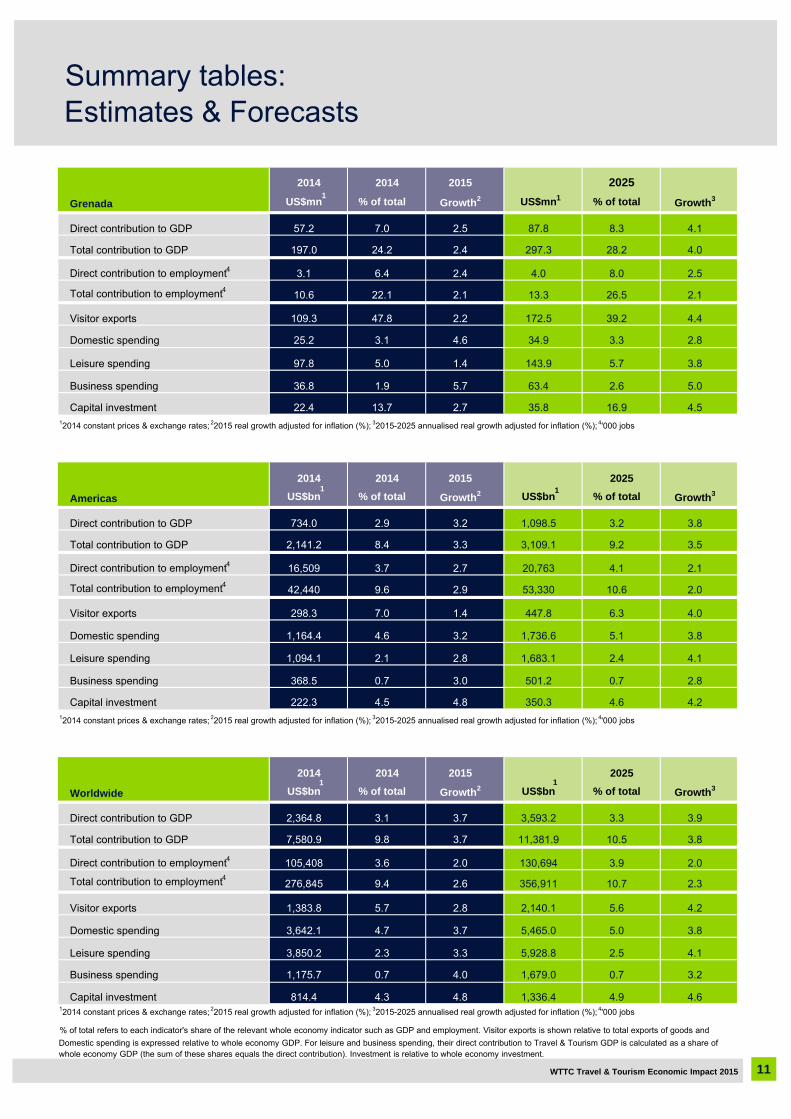
Grenada US$mn % of total Growth2 US$mn % of total Growth3
Direct contribution to GDP 57.2 7.0 2.5 87.8 8.3 4.1
Total contribution to GDP 197.0 24.2 2.4 297.3 28.2 4.0
Direct contribution to employment4 3.1 6.4 2.4 4.0 8.0 2.5
Total contribution to employment4 10.6 22.1 2.1 13.3 26.5 2.1
Visitor exports 109.3 47.8 2.2 172.5 39.2 4.4
Domestic spending 25.2 3.1 4.6 34.9 3.3 2.8
Leisure spending 97.8 5.0 1.4 143.9 5.7 3.8
Business spending 36.8 1.9 5.7 63.4 2.6 5.0
Capital investment 22.4 13.7 2.7 35.8 16.9 4.512014 constant prices & exchange rates; 22015 real growth adjusted for inflation (%); 32015-2025 annualised real growth adjusted for inflation (%); 4'000 jobs
2015
Americas US$bn % of total Growth2 US$bn % of total Growth3
Direct contribution to GDP 734.0 2.9 3.2 1,098.5 3.2 3.8
Total contribution to GDP 2,141.2 8.4 3.3 3,109.1 9.2 3.5
Direct contribution to employment4 16,509 3.7 2.7 20,763 4.1 2.1
Total contribution to employment4 42,440 9.6 2.9 53,330 10.6 2.0
Visitor exports 298.3 7.0 1.4 447.8 6.3 4.0
Domestic spending 1,164.4 4.6 3.2 1,736.6 5.1 3.8
Leisure spending 1,094.1 2.1 2.8 1,683.1 2.4 4.1
Business spending 368.5 0.7 3.0 501.2 0.7 2.8
Capital investment 222.3 4.5 4.8 350.3 4.6 4.212014 constant prices & exchange rates; 22015 real growth adjusted for inflation (%); 32015-2025 annualised real growth adjusted for inflation (%); 4'000 jobs
2015
Worldwide US$bn % of total Growth2 US$bn % of total Growth3
Direct contribution to GDP 2,364.8 3.1 3.7 3,593.2 3.3 3.9
Total contribution to GDP 7,580.9 9.8 3.7 11,381.9 10.5 3.8
Direct contribution to employment4 105,408 3.6 2.0 130,694 3.9 2.0
Total contribution to employment4 276,845 9.4 2.6 356,911 10.7 2.3
Visitor exports 1,383.8 5.7 2.8 2,140.1 5.6 4.2
Domestic spending 3,642.1 4.7 3.7 5,465.0 5.0 3.8
Leisure spending 3,850.2 2.3 3.3 5,928.8 2.5 4.1
Business spending 1,175.7 0.7 4.0 1,679.0 0.7 3.2
Capital investment 814.4 4.3 4.8 1,336.4 4.9 4.612014 constant prices & exchange rates; 22015 real growth adjusted for inflation (%); 32015-2025 annualised real growth adjusted for inflation (%); 4'000 jobs
2014 2014 2025
2014 2014 2025
2014 2014 2025
% of total refers to each indicator's share of the relevant whole economy indicator such as GDP and employment. Visitor exports is shown relative to total exports of goods and
WTTC Travel & Tourism Economic Impact 2015 11
Summary tables:Estimates & Forecasts
1
1
1
1
1
1
Domestic spending is expressed relative to whole economy GDP. For leisure and business spending, their direct contribution to Travel & Tourism GDP is calculated as a share of whole economy GDP (the sum of these shares equals the direct contribution). Investment is relative to whole economy investment.
2009 2010 2011 2012 2013 2014 2015E 2025F
Domestic expenditure
(includes government individual spending)
3. Internal tourism consumption
(= 1 + 2 )
4. Purchases by tourism providers,
including imported goods
(supply chain)
5. Direct contribution of Travel & Tourism to GDP(= 3 + 4)
Other final impacts
(indirect & induced)
6. Domestic supply chain
11. Total contribution of Travel & Tourism to GDP(= 5 + 6 + 7 + 8 + 9 + 10)
Employment impacts ('000)
12.
Other indicators
14. Expenditure on outbound travel
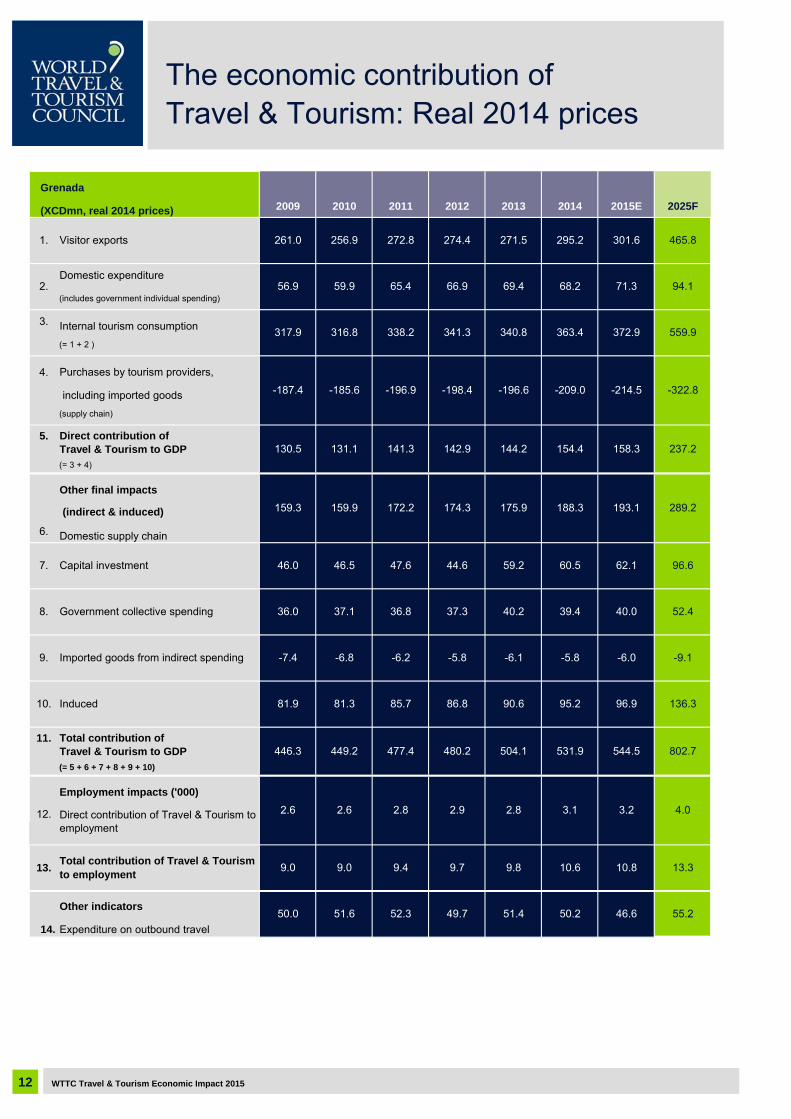
Grenada
(XCDmn, real 2014 prices)
1. Visitor exports 261.0 256.9 272.8 274.4 271.5 295.2 301.6 465.8
2. 56.9 59.9 65.4 66.9 69.4 68.2 71.3 94.1
317.9 316.8 338.2 341.3 340.8 363.4 372.9 559.9
-187.4 -185.6 -196.9 -198.4 -196.6 -209.0 -214.5 -322.8
130.5 131.1 141.3 142.9 144.2 154.4 158.3 237.2
159.3 159.9 172.2 174.3 175.9 188.3 193.1 289.2
7. Capital investment 46.0 46.5 47.6 44.6 59.2 60.5 62.1 96.6
8. Government collective spending 36.0 37.1 36.8 37.3 40.2 39.4 40.0 52.4
9. Imported goods from indirect spending -7.4 -6.8 -6.2 -5.8 -6.1 -5.8 -6.0 -9.1
10. Induced 81.9 81.3 85.7 86.8 90.6 95.2 96.9 136.3
446.3 449.2 477.4 480.2 504.1 531.9 544.5 802.7
2.6 2.6 2.8 2.9 2.8 3.1 3.2 4.0Direct contribution of Travel & Tourism to employment
13.Total contribution of Travel & Tourism to employment
9.0 9.0 9.4 9.7
50.0 51.6 52.3 49.7 51.4 50.2 46.6 55.2
9.8 10.6 10.8 13.3
WTTC Travel & Tourism Economic Impact 201512
The economic contribution ofTravel & Tourism: Real 2014 prices
2009 2010 2011 2012 2013 2014 2015E 2025F
Domestic expenditure
(includes government individual spending)
3. Internal tourism consumption
(= 1 + 2 )
4. Purchases by tourism providers,
including imported goods
(supply chain)
5. Direct contribution of Travel & Tourism to GDP(= 3 + 4)
Other final impacts
(indirect & induced)
6. Domestic supply chain
11. Total contribution of Travel & Tourism to GDP(= 5 + 6 + 7 + 8 + 9 + 10)
Employment impacts ('000)
12.
Other indicators
14. Expenditure on outbound travel
Historical data for concepts has been benchmarked to match reported TSA data where available.
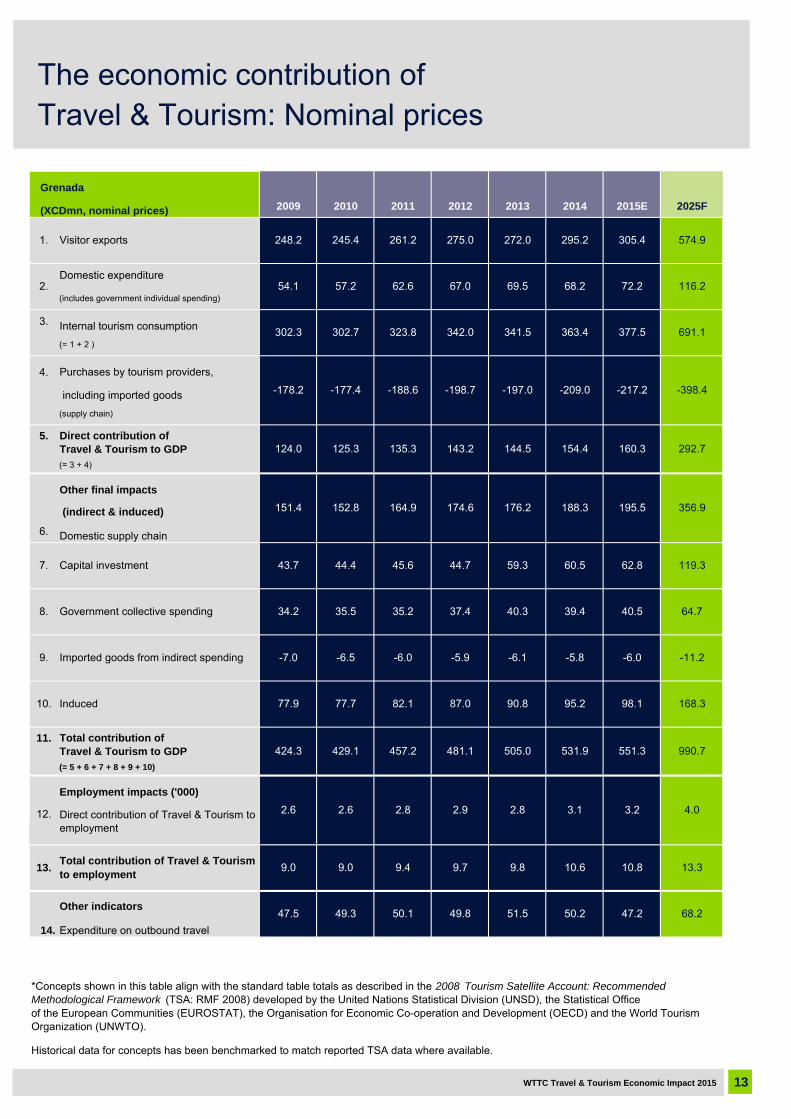
Grenada
(XCDmn, nominal prices)
1. Visitor exports 248.2 245.4 261.2 275.0 272.0 295.2 305.4 574.9
2. 54.1 57.2 62.6 67.0 69.5 68.2 72.2 116.2
302.3 302.7 323.8 342.0 341.5 363.4 377.5 691.1
-178.2 -177.4 -188.6 -198.7 -197.0 -209.0 -217.2 -398.4
188.3 195.5
124.0 125.3 135.3 143.2 144.5 154.4
60.5 62.8
160.3 292.7
151.4 152.8 164.9 174.6 176.2
39.4 40.5
356.9
7. Capital investment 43.7 44.4 45.6 44.7 59.3
-5.8 -6.0
119.3
8. Government collective spending 34.2 35.5 35.2 37.4 40.3
95.2 98.1
64.7
9. Imported goods from indirect spending -7.0 -6.5 -6.0 -5.9 -6.1
551.3 990.7
-11.2
10. Induced 77.9 77.7 82.1 87.0 90.8
2.9 2.8 3.1
168.3
424.3 429.1 457.2 481.1 505.0 531.9
13.Total contribution of Travel & Tourism to employment
9.0 9.0 9.4 9.7
51.5 50.2 47.2
3.2 4.0Direct contribution of Travel & Tourism to employment
9.8
2.6 2.6 2.8
68.2
*Concepts shown in this table align with the standard table totals as described in the 2008 Tourism Satellite Account: Recommended Methodological Framework (TSA: RMF 2008) developed by the United Nations Statistical Division (UNSD), the Statistical Officeof the European Communities (EUROSTAT), the Organisation for Economic Co-operation and Development (OECD) and the World Tourism Organization (UNWTO).
10.6 10.8 13.3
47.5 49.3 50.1 49.8
WTTC Travel & Tourism Economic Impact 2015 13
The economic contribution ofTravel & Tourism: Nominal prices
2009 2010 2011 2012 2013 2014 2015E 2025F 2
Domestic expenditure
(includes government individual spending)
3. Internal tourism consumption
(= 1 + 2 )
4. Purchases by tourism providers,
including imported goods
(supply chain)
5. Direct contribution of Travel & Tourism to GDP(= 3 + 4)
Other final impacts
(indirect & induced)
6. Domestic supply chain
11. Total contribution of Travel & Tourism to GDP(= 5 + 6 + 7 + 8 + 9 + 10)
Employment impacts ('000)
12.
Other indicators
14. Expenditure on outbound travel
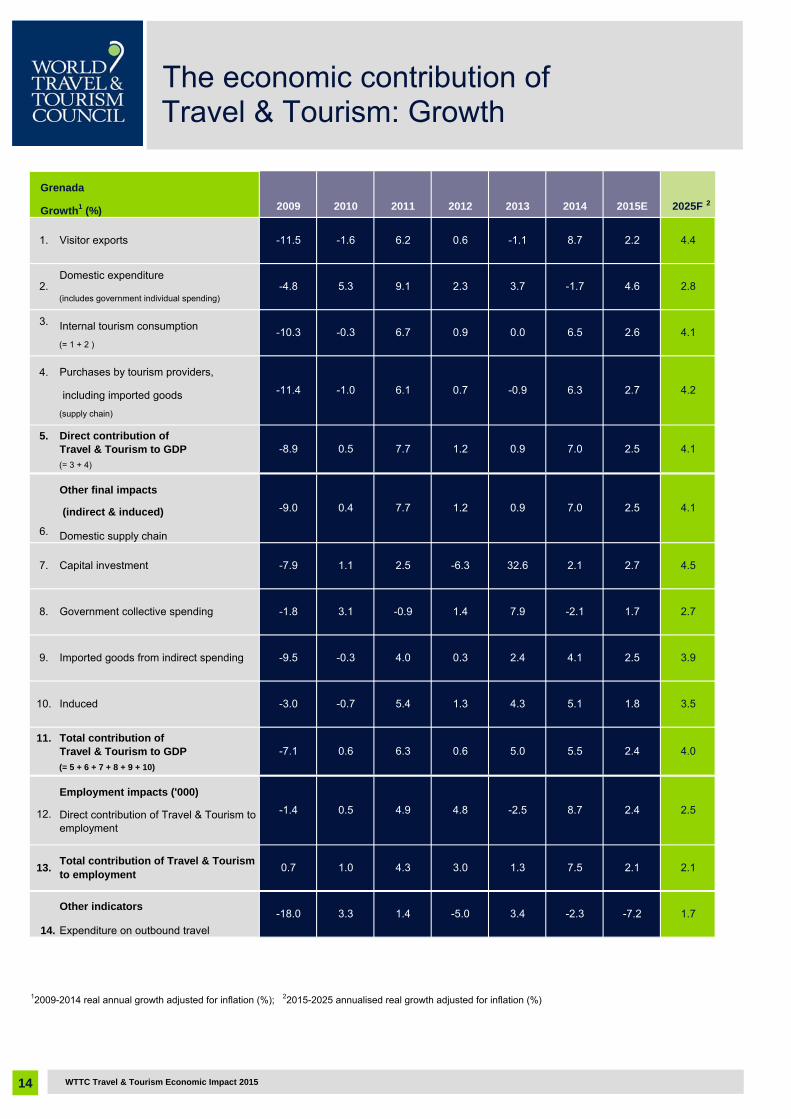
Grenada
Growth1 (%)
1. Visitor exports -11.5 -1.6 6.2 0.6 -1.1 8.7 2.2 4.4
2. -4.8 5.3 9.1 2.3 3.7 -1.7 4.6 2.8
-10.3 -0.3 6.7 0.9 0.0 6.5 2.6 4.1
-11.4 -1.0 6.1 0.7 -0.9 6.3 2.7 4.2
7.0 2.5
-8.9 0.5 7.7 1.2 0.9 7.0
2.1 2.7
2.5 4.1
-9.0 0.4 7.7 1.2 0.9
-2.1 1.7
4.1
7. Capital investment -7.9 1.1 2.5 -6.3 32.6
4.1 2.5
4.5
8. Government collective spending -1.8 3.1 -0.9 1.4 7.9
5.1 1.8
2.7
9. Imported goods from indirect spending -9.5 -0.3 4.0 0.3 2.4
2.4 4.0
3.9
10. Induced -3.0 -0.7 5.4 1.3 4.3
4.8 -2.5 8.7
3.5
-7.1 0.6 6.3 0.6 5.0 5.5
13.Total contribution of Travel & Tourism to employment
0.7 1.0 4.3 3.0
3.4 -2.3 -7.2
2.4 2.5Direct contribution of Travel & Tourism to employment
1.3
-1.4 0.5 4.9
1.7
12009-2014 real annual growth adjusted for inflation (%); 22015-2025 annualised real growth adjusted for inflation (%)
7.5 2.1 2.1
-18.0 3.3 1.4 -5.0
WTTC Travel & Tourism Economic Impact 201514
The economic contribution ofTravel & Tourism: Growth
15WTTC Travel & Tourism Economic Impact 2015
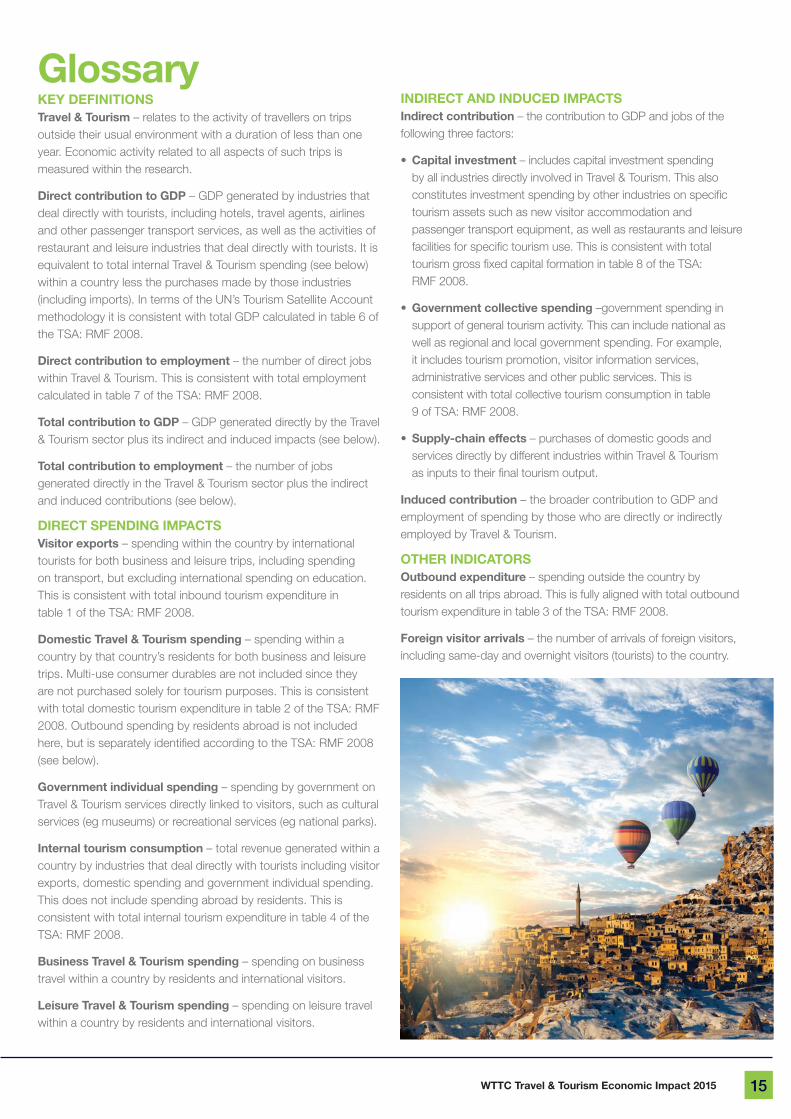
Key DeFINITIONSTravel & Tourism – relates to the activity of travellers on trips outside their usual environment with a duration of less than one year. Economic activity related to all aspects of such trips is measured within the research.
Direct contribution to GDP – GDP generated by industries that deal directly with tourists, including hotels, travel agents, airlines and other passenger transport services, as well as the activities of restaurant and leisure industries that deal directly with tourists. It is equivalent to total internal Travel & Tourism spending (see below) within a country less the purchases made by those industries (including imports). In terms of the UN’s Tourism Satellite Account methodology it is consistent with total GDP calculated in table 6 of the TSA: RMF 2008.
Direct contribution to employment – the number of direct jobs within Travel & Tourism. This is consistent with total employment calculated in table 7 of the TSA: RMF 2008.
Total contribution to GDP – GDP generated directly by the Travel & Tourism sector plus its indirect and induced impacts (see below).
Total contribution to employment – the number of jobs generated directly in the Travel & Tourism sector plus the indirect and induced contributions (see below).
DIReCT SPeNDING IMPACTSVisitor exports – spending within the country by international tourists for both business and leisure trips, including spending on transport, but excluding international spending on education. This is consistent with total inbound tourism expenditure in table 1 of the TSA: RMF 2008.
Domestic Travel & Tourism spending – spending within a country by that country’s residents for both business and leisure trips. Multi-use consumer durables are not included since they are not purchased solely for tourism purposes. This is consistent with total domestic tourism expenditure in table 2 of the TSA: RMF 2008. Outbound spending by residents abroad is not included here, but is separately identified according to the TSA: RMF 2008 (see below).
Government individual spending – spending by government on Travel & Tourism services directly linked to visitors, such as cultural services (eg museums) or recreational services (eg national parks).
Internal tourism consumption – total revenue generated within a country by industries that deal directly with tourists including visitor exports, domestic spending and government individual spending. This does not include spending abroad by residents. This is consistent with total internal tourism expenditure in table 4 of the TSA: RMF 2008.
Business Travel & Tourism spending – spending on business travel within a country by residents and international visitors.
Leisure Travel & Tourism spending – spending on leisure travel within a country by residents and international visitors.
INDIReCT AND INDuCeD IMPACTS Indirect contribution – the contribution to GDP and jobs of the following three factors:
• Capitalinvestment– includes capital investment spending by all industries directly involved in Travel & Tourism. This also constitutes investment spending by other industries on specific tourism assets such as new visitor accommodation and passenger transport equipment, as well as restaurants and leisure facilities for specific tourism use. This is consistent with total tourism gross fixed capital formation in table 8 of the TSA: RMF 2008.
• Governmentcollectivespending –government spending in support of general tourism activity. This can include national as well as regional and local government spending. For example, it includes tourism promotion, visitor information services, administrative services and other public services. This is consistent with total collective tourism consumption in table 9 of TSA: RMF 2008.
• Supply-chaineffects– purchases of domestic goods and services directly by different industries within Travel & Tourism as inputs to their final tourism output.
Induced contribution – the broader contribution to GDP and employment of spending by those who are directly or indirectly employed by Travel & Tourism.
OTheR INDICATORSOutbound expenditure – spending outside the country by residents on all trips abroad. This is fully aligned with total outbound tourism expenditure in table 3 of the TSA: RMF 2008.
Foreign visitor arrivals – the number of arrivals of foreign visitors, including same-day and overnight visitors (tourists) to the country.
Glossary
16 WTTC Travel & Tourism Economic Impact 2015
Methodological note
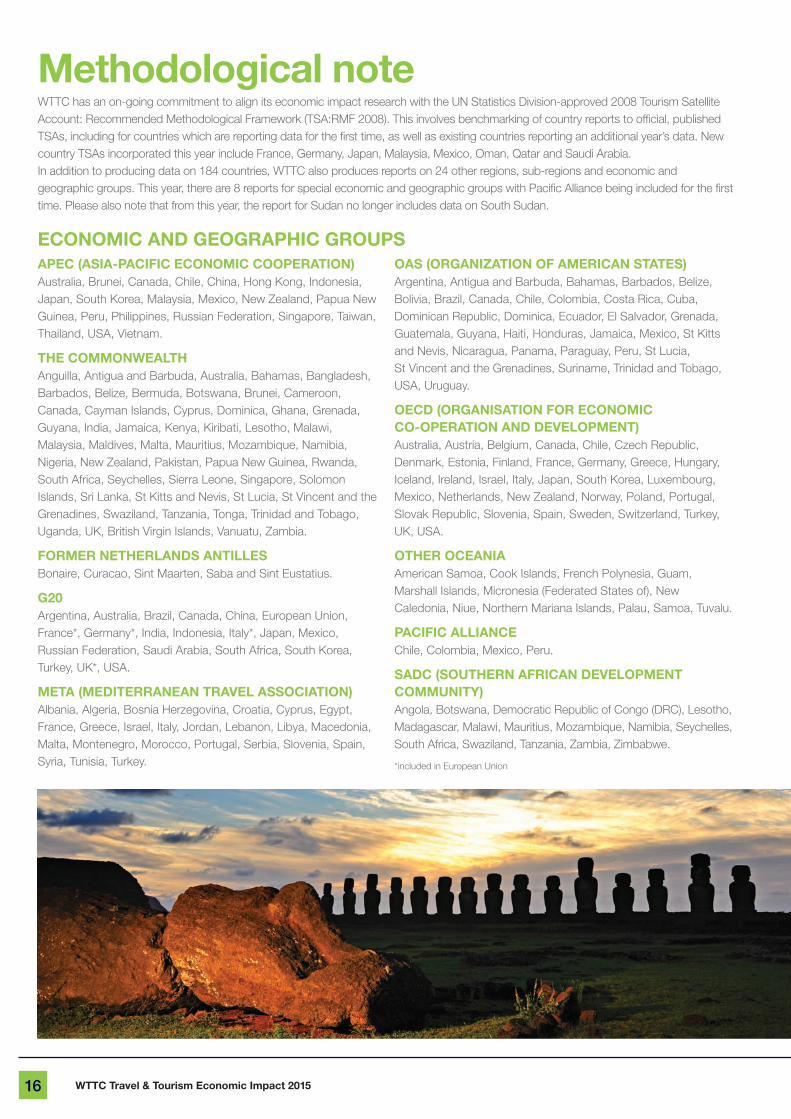
APEC(ASiA-PACifiCEConomiCCooPErAtion)Australia, Brunei, Canada, Chile, China, Hong Kong, Indonesia, Japan, South Korea, Malaysia, Mexico, New Zealand, Papua New Guinea, Peru, Philippines, Russian Federation, Singapore, Taiwan, Thailand, USA, Vietnam.
The COMMONweALThAnguilla, Antigua and Barbuda, Australia, Bahamas, Bangladesh, Barbados, Belize, Bermuda, Botswana, Brunei, Cameroon, Canada, Cayman Islands, Cyprus, Dominica, Ghana, Grenada, Guyana, India, Jamaica, Kenya, Kiribati, Lesotho, Malawi, Malaysia, Maldives, Malta, Mauritius, Mozambique, Namibia, Nigeria, New Zealand, Pakistan, Papua New Guinea, Rwanda, South Africa, Seychelles, Sierra Leone, Singapore, Solomon Islands, Sri Lanka, St Kitts and Nevis, St Lucia, St Vincent and the Grenadines, Swaziland, Tanzania, Tonga, Trinidad and Tobago, Uganda, UK, British Virgin Islands, Vanuatu, Zambia.
FORMeR NeTheRLANDS ANTILLeSBonaire, Curacao, Sint Maarten, Saba and Sint Eustatius.
G20Argentina, Australia, Brazil, Canada, China, European Union, France*, Germany*, India, Indonesia, Italy*, Japan, Mexico, Russian Federation, Saudi Arabia, South Africa, South Korea, Turkey, UK*, USA.
mEtA(mEditErrAnEAntrAvElASSoCiAtion)Albania, Algeria, Bosnia Herzegovina, Croatia, Cyprus, Egypt, France, Greece, Israel, Italy, Jordan, Lebanon, Libya, Macedonia, Malta, Montenegro, Morocco, Portugal, Serbia, Slovenia, Spain, Syria, Tunisia, Turkey.
oAS(orGAnizAtionofAmEriCAnStAtES)Argentina, Antigua and Barbuda, Bahamas, Barbados, Belize, Bolivia, Brazil, Canada, Chile, Colombia, Costa Rica, Cuba, Dominican Republic, Dominica, Ecuador, El Salvador, Grenada, Guatemala, Guyana, Haiti, Honduras, Jamaica, Mexico, St Kitts and Nevis, Nicaragua, Panama, Paraguay, Peru, St Lucia, St Vincent and the Grenadines, Suriname, Trinidad and Tobago, USA, Uruguay.
OeCD (ORGANISATION FOR eCONOMIC Co-oPErAtionAnddEvEloPmEnt)Australia, Austria, Belgium, Canada, Chile, Czech Republic, Denmark, Estonia, Finland, France, Germany, Greece, Hungary, Iceland, Ireland, Israel, Italy, Japan, South Korea, Luxembourg, Mexico, Netherlands, New Zealand, Norway, Poland, Portugal, Slovak Republic, Slovenia, Spain, Sweden, Switzerland, Turkey, UK, USA.
OTheR OCeANIAAmerican Samoa, Cook Islands, French Polynesia, Guam, Marshall Islands, Micronesia (Federated States of), New Caledonia, Niue, Northern Mariana Islands, Palau, Samoa, Tuvalu.
PACIFIC ALLIANCeChile, Colombia, Mexico, Peru.
SADC (SOuTheRN AFRICAN DeVeLOPMeNT Community)Angola, Botswana, Democratic Republic of Congo (DRC), Lesotho, Madagascar, Malawi, Mauritius, Mozambique, Namibia, Seychelles, South Africa, Swaziland, Tanzania, Zambia, Zimbabwe.
*included in European Union
WTTC has an on-going commitment to align its economic impact research with the UN Statistics Division-approved 2008 Tourism Satellite Account: Recommended Methodological Framework (TSA:RMF 2008). This involves benchmarking of country reports to official, published TSAs, including for countries which are reporting data for the first time, as well as existing countries reporting an additional year’s data. New country TSAs incorporated this year include France, Germany, Japan, Malaysia, Mexico, Oman, Qatar and Saudi Arabia. In addition to producing data on 184 countries, WTTC also produces reports on 24 other regions, sub-regions and economic and geographic groups. This year, there are 8 reports for special economic and geographic groups with Pacific Alliance being included for the first time. Please also note that from this year, the report for Sudan no longer includes data on South Sudan.
eCONOMIC AND GeOGRAPhIC GROuPS
17WTTC Travel & Tourism Economic Impact 2015
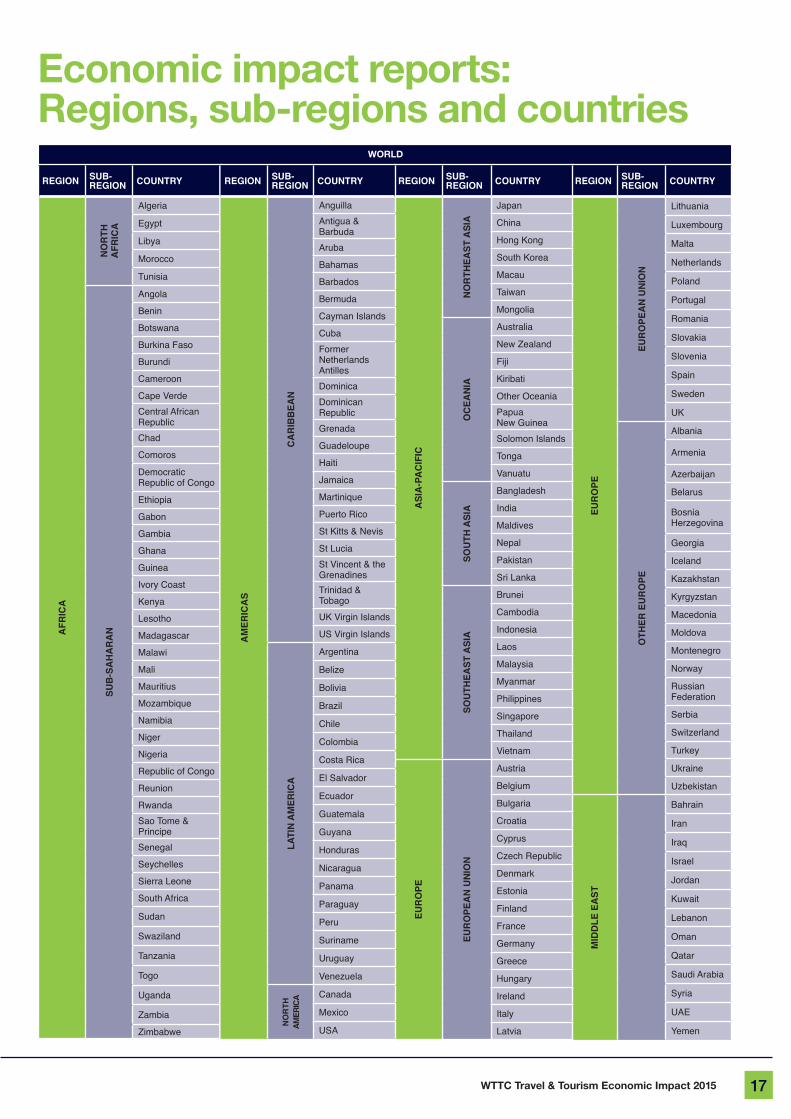
economic impact reports:regions,sub-regionsandcountries
wORLD
Region Sub- Region CountRy
AfR
iCA
no
Rth
A
fRiC
A
Algeria
Egypt
Libya
Morocco
Tunisia
Sub
-SA
hA
RA
n
Angola
Benin
Botswana
Burkina Faso
Burundi
Cameroon
Cape VerdeCentral African RepublicChad
Comoros
Democratic Republic of Congo
Ethiopia
Gabon
Gambia
Ghana
Guinea
Ivory Coast
Kenya
Lesotho
Madagascar
Malawi
Mali
Mauritius
Mozambique
Namibia
Niger
Nigeria
Republic of Congo
Reunion
RwandaSao Tome & PrincipeSenegal
Seychelles
Sierra Leone
South Africa
Sudan
Swaziland
Tanzania
Togo
Uganda
Zambia
Zimbabwe
Region Sub-Region CountRy
euR
ope
euR
ope
An
un
ion
Lithuania
Luxembourg
Malta
Netherlands
Poland
Portugal
Romania
Slovakia
Slovenia
Spain
Sweden
UK
oth
eR e
uR
ope
Albania
Armenia
Azerbaijan
Belarus
Bosnia Herzegovina
Georgia
Iceland
Kazakhstan
Kyrgyzstan
Macedonia
Moldova
Montenegro
Norway
Russian Federation
Serbia
Switzerland
Turkey
Ukraine
Uzbekistan
Mid
dle
eA
St
Bahrain
Iran
Iraq
Israel
Jordan
Kuwait
Lebanon
Oman
Qatar
Saudi Arabia
Syria
UAE
Yemen
Region Sub-Region CountRy
ASi
A-p
AC
ifiC
no
Rth
eASt
ASi
A
Japan
China
Hong Kong
South Korea
Macau
Taiwan
Mongolia
oC
eAn
iA
Australia
New Zealand
Fiji
Kiribati
Other OceaniaPapua New GuineaSolomon Islands
Tonga
VanuatuSo
uth
ASi
A
Bangladesh
India
Maldives
Nepal
Pakistan
Sri Lanka
Sou
theA
St A
SiA
Brunei
Cambodia
Indonesia
Laos
Malaysia
Myanmar
Philippines
Singapore
Thailand
Vietnam
euR
ope
euR
ope
An
un
ion
Austria
Belgium
Bulgaria
Croatia
Cyprus
Czech Republic
Denmark
Estonia
Finland
France
Germany
Greece
Hungary
Ireland
Italy
Latvia
Region Sub- Region CountRy
AM
eRiC
AS
CA
Rib
beA
n
AnguillaAntigua & BarbudaAruba
Bahamas
Barbados
Bermuda
Cayman Islands
CubaFormer Netherlands AntillesDominicaDominican RepublicGrenada
Guadeloupe
Haiti
Jamaica
Martinique
Puerto Rico
St Kitts & Nevis
St LuciaSt Vincent & the GrenadinesTrinidad & TobagoUK Virgin Islands
US Virgin Islands
lAti
n A
MeR
iCA
Argentina
Belize
Bolivia
Brazil
Chile
Colombia
Costa Rica
El Salvador
Ecuador
Guatemala
Guyana
Honduras
Nicaragua
Panama
Paraguay
Peru
Suriname
Uruguay
Venezuela
no
Rth
AM
eRiC
A Canada
Mexico
USA
18 WTTC Travel & Tourism Economic Impact 2015
The wORLD TRAVeL & TOuRISM COuNCIL IS The GLOBAL AuThORITy ON The eCONOMIC AND SOCIAL CONTRIBuTION OF TRAVeL & TOuRISM. WTTC promotes sustainable growth for the sector, working with governments and international institutions to create jobs, to drive exports and to generate prosperity. Council Members are the Chairs, Presidents and Chief Executives of the world’s leading, private sector Travel & Tourism businesses.
Together with its research partner, Oxford Economics, WTTC produces annual research that shows Travel & Tourism to be one of the world’s largest sectors, supporting over 276 million jobs and generating 9.8% of global GDP in 2014. Comprehensive reports quantify, compare and forecast the economic impact of Travel & Tourism on 184 economies around the world. In addition to the individual country reports, WTTC produces a world report highlighting global trends and 24 further reports that focus on regions, sub-regions and economic and geographic groups.
To download reports or data, please visit www.wttc.org
ASSISTING wTTC TO PROVIDe TOOLS FOR ANALySIS, BeNChMARKING, FOReCASTING AND PLANNING.Over the last 33 years, Oxford Economics has built a diverse and loyal client base of over 800 international organisations, including leading multinational companies and financial institutions; key government bodies and trade associations; and top universities, consultancies, and think tanks. Headquartered in Oxford, England, with regional centres in London, New York and Singapore, Oxford Economics has offices across the globe in Belfast, Chicago, Dubai, Miami, Milan, Paris, Philadelphia, San Francisco, and Washington DC. The company employs over 140 full-time people, including more than 90 professional economists, industry experts and business editors – one of the largest teams of macroeconomists and thought leadership specialists – underpinned by our heritage with Oxford University and the academic community including a contributor network of over 500 economists, analysts and journalists around the world.
For more information, please take advantage of a free trial on our website, www.oxfordeconomics.com or contact Frances Nicholls, Director of Business Development, Oxford Economics Ltd, Broadwall House, 21 Broadwall, London SE1 9PL. Email: [email protected]
CHAIRMAN
TUI DEUTSCHLAND GMBH & TUIFLY GMBHDr Michael FrenzelChairman of the Supervisory Boards
PRESIDENT & CEO
WORLD TRAVEL & TOURISM COUNCILDavid Scowsill
VICE CHAIRMEN
BEIJING TOURISM GROUPDUAN QiangChairman
ETIHAD AIRWAYSJames HoganCEO
HILTON WORLDWIDEChristopher J NassettaPresident & CEO
JUMEIRAH GROUPGerald LawlessPresident & Group CEO
MANDARIN ORIENTALEdouard EttedguiGroup Chief Executive
SILVERSEA CRUISESManfredi Lefebvre d’Ovidio di Balsorano de ClunieresChairman
THE TRAVEL CORPORATIONBrett TollmanPresident & Chief Executive
EXECUTIVE COMMITTEE
ABERCROMBIE & KENTGeoffrey J W KentFounder, Chairman & CEO
ACCORSébastien BazinChairman & CEO
AMERICAN EXPRESS COMPANYWilliam GlennPresident & CEO of American Express Global Business Travel
AMERICAN INTERNATIONAL GROUP, INCJeffrey C RutledgeChief Executive Officer, AIG Travel
BHARAT HOTELSJyotsna SuriChairperson & Managing Director
CARLSONDouglas Anderson President & CEO Carlson Wagonlit Travel
DUBAI AIRPORTS INTERNATIONALPaul GriffithsCEO
EMIRATESGary ChapmanPresident Group Services & Dnata, Emirates Group
HNA GROUPCHEN Feng Chairman of the Board
INTERCONTINENTAL HOTELS GROUP Richard SolomonsCEO
JTB CORPHiromi TagawaChairman of the Board
MARRIOTT INTERNATIONAL JW Marriott, JrChairman Arne M SorensonPresident & CEO
OUTRIGGER ENTERPRISES GROUPRichard R KelleyChairman Emeritus
REVOLUTION PLACES, LLCPhilippe BourguignonVice Chairman
ROYAL CARIBBEAN CRUISESRichard D FainChairman & CEO
SABRE HOLDINGSTom Klein President & CEO
SHUN TAK HOLDINGS LIMITEDPansy HoManaging Director
TRAVELPORTGordon WilsonPresident & CEO
TSOGO SUN GROUPMarcel von AulockCEO
VISITBRITAINChristopher Rodrigues, CBEChairman
WYNDHAM WORLDWIDEStephen P HolmesChairman & CEO
GLOBAL MEMBERS
ABU DHABI TOURISM & CULTURE AUTHORITYMubarak Hamad Al MuhairiDirector General
AGODARob RosensteinCEO
ALL NIPPON AIRWAYS (ANA)Osamu ShinobePresident & CEO
ALTOURAlexandre ChemlaPresident
AMADEUS IT GROUP SALuis MarotoPresident & CEO
AVIS BUDGET GROUPRonald L NelsonChairman & CEO
BEIJING CAPITAL INTERNATIONAL AIRPORT COLIU Xuesong General ManagerSHI BoliGeneral Manager
BEIJING TOURISM GROUPLIU YiPresident
BRITISH AIRWAYSKeith WilliamsExecutive Chairman
CANNERY ROW COMPANYTed J BalestreriChairman & CEO
CHANGI AIRPORT GROUPLee Seow HiangCEO
CHICAGO DEPARTMENT OF AVIATIONMichael BolandActing Commissioner
CHINA EASTERN AIRLINESLIU ShaoyongChairman
CHINA INTERNATIONAL TRAVEL SERVICE, HEAD OFFICE (CITS)YU NingningPresident
CHINA SOUTHERN AIRLINESTAN WangengPresident & CEO
CHIMELONG SU ZhigangChairman & CEOCHEN WanchengPresident
COSTA CRUISESMichael ThammCEO
CORPORATE TRAVEL SERVICES José Luis CastroFounder & CEO
CROWN LIMITEDRowen Craigie Managing Director & CEO
CTRIP.COM INTERNATIONALFAN MinVice Chairman of the Board and President
DALLAS FORT WORTH AIRPORTSean DonohueCEO
DFS GROUPPhilippe SchausChairman & CEO
DEPARTMENT OF TOURISM & COMMERCE MARKETING, GOVERNMENT OF DUBAIH.E. Helal Saeed Khalfan Al MarriDirector General
DIAMOND RESORTS INTERNATIONALStephen J CloobeckFounder & Chairman
DUBAILANDMohammed Al HabbaiCEO
EAST JAPAN RAILWAY COMPANYSatoshi SeinoChairman & Director
ENTERPRISE HOLDINGSPamela NicholsonCEO
EXPEDIA INCDara KhosrowshahiPresident & CEO
FAIRMONT HOTELS & RESORTSJennifer FoxPresident
FINTRAXJohn MooreChairman
GLOBAL BLUE GROUPDavid Baxby President & CEO
GLOBAL LEISURE PARTNERS LLPMark HarmsChairman & CEO
GREATER TORONTO AIRPORTS AUTHORITYHoward Eng President & CEO
HAWAIIAN AIRMark DunkerleyPresident & CEO
HERTZ CORPORATIONMichel TaridePresident, Hertz International
HOGG ROBINSON GROUPDavid RadcliffeChief Executive
HONG KONG & SHANGHAI HOTELSClement KwokManaging Director & CEO
HUANGSHAN TOURISM GROUPHUANG LinmuPresident and Chairman of the Board
HYATT HOTELS CORPORATIONMark S HoplamazianPresident and CEO
IBMMarty SalfenGeneral Manager, Global Travel & Transportation Industry
INDIAN HOTELS COMPANY LTDRakesh K Sarna Managing Director & CEO
INTERNATIONAL AIRLINES GROUPWillie WalshChief Executive
JAPAN AIRLINES CO. LTDMasaru OnishiChairman
KERZNER INTERNATIONALAlan LeibmanCEO
KUONI TRAVEL HOLDING LTDPeter MeierCEO
LAS VEGAS SANDS CORP.Robert GoldsteinPresident and Chief Operating Officer
LEBUA HOTELS & RESORTS Narawadee BualertPresidentDeepak OhriCEO
LOTTEDong-Bin ShinChairman
MESSE BERLIN GMBHChristian GökePresident & CEO
MISSION HILLS GROUPDr Ken ChuChairman & CEO
NH HOTEL GROUPFederico Gonzalez TejeraCEO
NOEL GROUP, A BERKSHIRE HATHAWAY COMPANYJohn M. Noel CEO
NORWEGIAN CRUISE LINESFrank Del RioPresident & CEO
ORBITZ WORLDWIDEBarney HarfordCEO
OTI HOLDINGAyhan BektasChairman
OZALTIN HOLDINGÖznur Özdemir ÖzaltinChief Executive Özaltin Holding (Tourism Group)
PEAK ADVENTURE TRAVEL Darrell WadeCEO
QUNARZHUANG ChenchaoCo-Founder & CEO
RADISSON EDWARDIAN HOTELSJasminder SinghChairman & CEO
RELAIS & CHÂTEAUXPhilippe Gombert President International, Chairman of the Board
R TAUCK & PARTNERRobin Tauck President
SHANGHAI JIN JIANG INTERNATIONAL HOTELSYANG WeiminCEO
SHANGHAI SPRING INTERNATIONAL TRAVEL SERVICESXIAO QianhuiGeneral Manager
STARWOOD HOTELS & RESORTS WORLDWIDEAdam AronCEO
TAP PORTUGALFernando PintoCEO
TRAVEL LEADERS GROUPMichael BattFounder & Chairman
TURKISH AIRLINESTemel Kotil CEO
UNITED AIRLINESJeff Smisek President & CEOJim ComptonVice Chairman & Chief Revenue Officer
VALUE RETAILDesiree BollierCEO
VIRTUOSO Matthew D Upchurch CTCCEO
ZAGAT SURVEY LLCTim ZagatCo-Founder, Co-Chair & CEO
INDUSTRY PARTNERS
BOSTON CONSULTING GROUPAchim FechtelSenior Partner & Managing Director
THE COCA-COLA COMPANYStefanie D MillerGroup Vice President, Strategic Partnership Marketing
DELOITTEAdam WeissenbergVice Chairman, Global Travel, Hospitality & Leisure Leader
ECOLABMichael HickeyExecutive Vice President and President, Global Institutional
GOLDMAN SACHSBen LeahyManaging Director, Investment Banking Division
GOOGLERob TorresManaging Director for Travel
JCBKoremitsu SannomiyaPresident & Chief Operating Officer
JONES LANG LASALLE HOTELSArthur de HaastChairman Hotels & Hospitality Group
SPENCER STUARTJerry NoonanGlobal Consumer Leader
TOSHIBA CORPORATIONAtsutoshi NishidaChairman of the Board
VISA WORLDWIDERoss JacksonVice President, Cross-Border, Brand, Product & Client Marketing Asia Pacific Region
REGIONAL MEMBERS
ABACUS INTERNATIONALRobert BaileyPresident & CEO
ACTION GROUP HOLDINGH E Sheikh Mubarak Al Abdullah Al Mubarak Al SabahChairman
ALATURRicardo Souto FerreiraVice President
ALPITOURGabriele BurgioCEO
AMBASSADOR HOTEL GROUPJung-Ho SuhChairman
APPLE LEISURE GROUPAlex ZozayaChairman & CEO
COCHA TRAVELMario FuenzalidaCEO
DESPEGARRoberto SouvironCEO
DIETHELM TRAVELMaarten GroeneveldCEO
DOURO AZULMário FerreiraPresident & CEO
EL CID RESORTSCarlos BerdeguéCEO
GRUPO MASOEsteban TorbarCEO
HAKUBA HOTEL GROUPAdrian BellCEO
HELLOWORLDElizabeth GainesCEO
JA RESORTS AND HOTELSDavid ThomsonCOO
MINOR HOTEL GROUPDillip RajakarierCEO
NORTHERN CAUCASUS RESORTSSergey Victorovich VereshchaginDirector General
NRMA GROUPTony StuartGroup CEO
PALACE RESORTSJosé Chapur ZahoulPresident
PREMIER HOTELS & RESORTSClaudio SilvestriPresident & CEO
ROTANA HOTEL MANAGEMENT CORPORATIONOmer KaddouriPresident & CEO
SENTOSA DEVELOPMENT CORPORATIONMike BarclayCEO
SHKP HOTELSRicco De BlankCEO
SONEVA RESORTS Sonu ShivdasaniChairman & CEO
SOUTH AMERICAN TOURSFederico BuekerCEO
SWAIN DESTINATIONSIan SwainPresident
THOMAS COOK INDIAMadhaven MenonManaging Director
TREND OPERADORA LTDALuis Paulo LuppaPresident
Harlequin Building65 Southwark Street
London, SE1 0HRUnited Kingdom
Telephone: +44 (0)20 7481 8007Fax: +44 (0) 207 488 1008Email: [email protected]
www.wttc.org
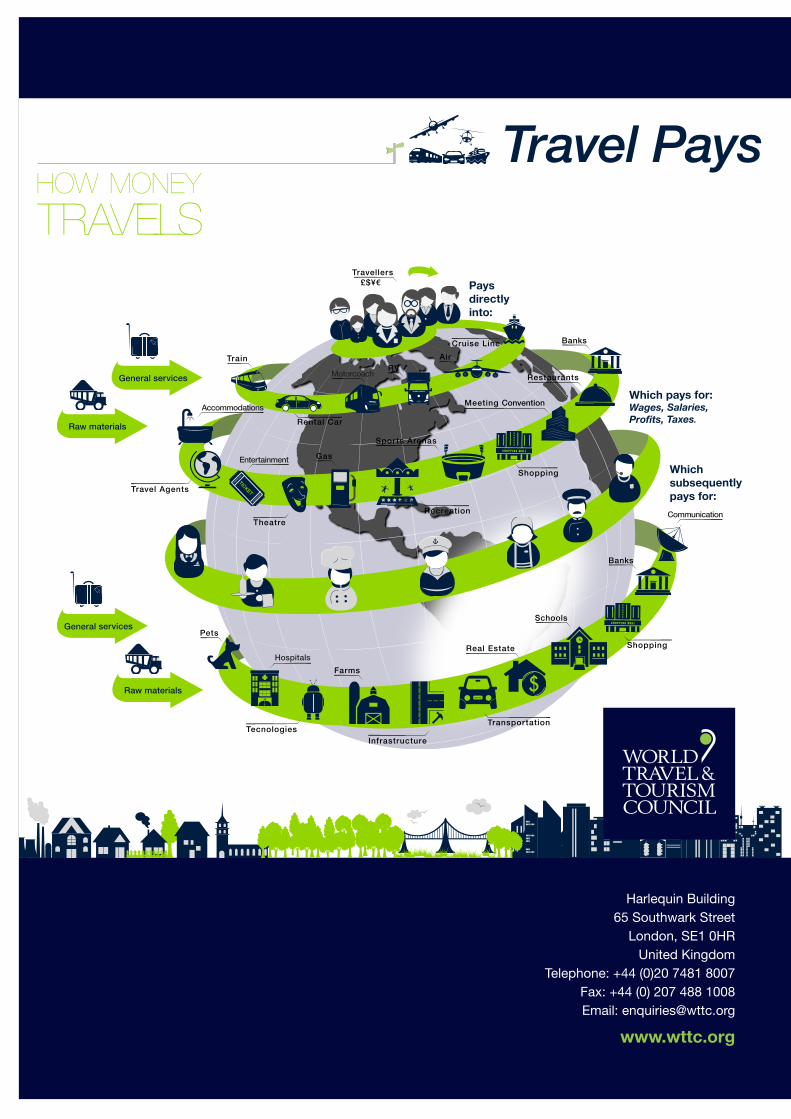
Travel Pays
General services
General services
Raw materials
Raw materials
Which pays for:Wages, Salaries, Profits, Taxes.
Whichsubsequentlypays for:
Paysdirectlyinto:
TrainRV
Cruise LineAir
Rental CarAccommodations
Motorcoach
Entertainment
Theatre
Gas
Sports Arenas
Restaurants
Meeting Convention
Recreation
Banks
Banks
Shopping
Shopping
Travel Agents
Pets
Hospitals
Communication
Schools
Tecnologies
Farms
WTTC
Transportation
Infrastructure
Real Estate
Travellers £$¥€