Research Article Incidence of Orofacial Clefts in Kumasi ...

TRAVEL TIME VARIABILITY ANALYSIS: THE CASE OF KUMASI, GHANA
Abena A. Obiri-Yeboah1, Joseph F. X. Ribeiro2, Benjamin Pappoe3
1 Kumasi Technical University, Civil Engineering Department, Ghana2 Kumasi Technical University, Mechanical Engineering Department, Ghana3 Ghana Highway Authority, Ghana
Received 3 August 2020; accepted 24 August 2020
Abstract: Travel time variability describes the adjustable and probable changes in travel times that occur during a typical trip on a monitored road segment. Fluctuations in the travel time have direct impact on the route capacity which, in turn, negatively impacts the effectiveness of operational measures of the subject route’s capacity. In this study, travel time analysis was carried out for three different frequently used road segments using three different travel modes: private and commercial (mass transit (“trotro”) and shared taxis) for 13 days by measuring travel times from start to the end of each study section. Three different times of day were employed for the analysis that is the morning peak (7:00am to 10:00am), afternoon peak (1:00pm to 3:00pm) and the evening peak periods (4:00pm to 7:00pm). The results obtained suggest that there are huge variations in the travel time variability for both the morning, afternoon and evening peak periods for the three travel modes studied on the selected routes. The paper concludes that the wide differences in travel time variability, which could be attributed to the prevalence of side friction agents and multiple stops, make trip planning and its related prediction efforts extremely challenging and recommends a scale-up of study to establish the conclusions made from this study.
Keywords: travel time variability, travel mode, side friction, Kumasi.
1 Corresponding author: [email protected]
UDC: 656.056.43(667) DOI: http://dx.doi.org/10.7708/ijtte.2020.10(4).08
1. Introduction and Literature Review
Tra nspor tat ion is a n essent ia l da i ly occurrence. In the current dispensation of global development, the impact of t ranspor tat ion, par t icularly h ighway transportation, on the global economic and social development is significant (Biliyamin and Abosede, 2012; Yesufu et al., 2019). For instance, the annual total time and money expenditures on transport in the US are estimated to value more than USD 5 trillion (2007), which corresponds to more
than 30% of the US GDP (Winston, 2013; Fosgerau, 2017). Economic opportunities are increasingly being related to the mobility of people and freight (Rodrigue and Notteboom, 2020). This makes the dynamic role of highway transportation system in daily life a critical component for long-term planning (Javid and Javid, 2018). Generally, transportation, recognized as the movement of people, goods and services from one location to another, requires accompanying satisfactory infrastructure to facilitate movement without which achieving
494
Obiri-Yeboah A. A. et al. Travel Time Variability Analysis: The Case of Kumasi, Ghana

the anticipated efficacy of the transportation system becomes challenging (Biliyamin and Abosede, 2012; Yesufu et al., 2019; Rodrigue and Notteboom, 2020).
Travel time, defined as the actual time ta ken to move f rom one locat ion to another considering all stops and delays encountered on the journey (FH WA, 1998), is an important consideration for highway planners, designers and users alike. Knowledge of travel time is critical for an efficient transportation system (Chien and Liu, 2012; Kieu et al., 2015; Durán-Hormazábal & Tirachini, 2016) and travel planning (Abdel-Aty et al., 1995; Xu et al., 2013). The degree or distance by which each individual travel is a direct measure of the travel time expended. Due to consistent variations in a number of factors including time of day, weather, traffic, roadside friction (Obiri-Yeboah et al . , 2020) economic, entertainment, and commercial activities, among others, designed or anticipated travel time is often different from actual measured travel time. Additionally, with particular reference to public transport, number of stops as well as the average spacing between stops has been identif ied to introduce variations in time travel. Variations in time required to travel forecasting and prediction of the parameter challenging and brings into sharp focus the need and ability to accurately predict travel time from one location to another.
Variability in travel time presents challenges for stakeholders in highway transportation. The inability to transport people and goods to their destinations on time has serious personal and commercial cost implications which ultimately affect the global economy. For instance, for the US in 2011, road congestion for work trips alone caused an
estimated 5.5 billion hours of travel delay and 2.9 billion gallons (11 billion litres) of extra fuel consumption with a total cost of USD 121 billion (Schrank et al., 2012; Fosgerau, 2017). Additionally, it holds the potential to introduce some behavioral reactions when a high level of uncertainty occurs. For travellers, for instance, travel time variability introduces uncertainty in decision-making about departure time and route choice as well as the anxiety and stress caused by such uncertainty (Li, 2004). For these reasons, some researchers propose the selection of a “slack time” or “safety margin” by travelers to compensate for the anticipated variability (Gaver Jr, 1968; Knight, 1974). These notwithstanding, many travelers often calculate travel time fairly accurately before their trips especially when the traffic system is near reliable based on their previous trip experiences (Li, 2004).
Variabilities in travel time have been the subject of intense research for decades. Results from research efforts have and continue to establish previously unknown factors by introducing their inf luence on the variabilities in travel time. For instance, researchers including Schrank et al. (2012), Fosgerau et al. (2008), Raheem et al. (2015), Fosgerau et al. (2017) and Yesufu et al. (2019) report traffic congestion, accidents, bad weather, poor land-use planning, design of road networks notably the number of stops and special events among others as contributory factors to travel time variability. In addition, number of stops commercial vehicles make before they finally arrive at their destinations has also been established to inf luence travel time variability (Furth and Rahbee, 2000; Li and Bertini, 2008, 2 0 0 9; A m mons, 2 0 01; R ei l ly, 1997; Demetsky and Bin-Mau Lin, 1982; van Nes and Bovy, 2000; Sankar et al., 2003).
495
International Journal for Traffic and Transport Engineering, 2020, 10(4): 494 - 507

Further, using data obtained, researchers have modelled the phenomenon (Gopi et al., 2019) by employing multinomial logit (MNL) modelling for travel time analysis for students in a metropolitan area. Others have implemented time distribution analysis (Kwon et al., 2000; Sun et al., 2003) while some have developed correlations (Li, 2004) to describe the occurrence. Kwon et al. (2000) analyzed the daily pattern of travel times observed from probe vehicles. Their analysis revealed that the distribution of travel time was skewed to the right. Sun et al. (2003) investigated the distribution of travel time in a one-and-a-half-hour travel time window (8:00-9:30am) on one day by analyzing 500 samples from two video detectors spaced 130m apart. The study found that the travel time distribution was not symmetrical. (Li, 2004) developed and used multiple regression with two-way interaction terms to quantify the contribution of various sources to the variability in travel time.
Highway transportation constitutes the major means of transport for people, goods and services in Ghana and important to the Ghanaian economy. Estimates indicate that road transport accounts for 96% of passenger and freight traffic in Ghana and about 97% of passenger miles in the country (GIPC, 2020). Road transport in Ghana may be categorized into 3 main segments, namely highways, urban roads and feeder roads (Table 1). Demand for urban passenger transport is mainly by residents commuting to work, school, and other economic, social and leisure activities. According to the usage or function, road transport constitutes majority of urban transportation in Ghana and is provided for by both private and commercial transport which could be private vehicles, taxis, mini-buses and state/private-supported bus services. By road transport, buses account for about 60% of passenger movement, taxis accounting for another 14.5% with private vehicles accounting for the rest (GIPC, 2020).
Table 1Functional Classification of Roads by Road Agencies in GhanaClassification Ghana Highway
Authority (GHA)Department of Urban Roads
(DUR)Department of Feeder Roads
(DFR)Primary National Major Arterials Primary/Inter-District
Secondary Secondary/Inter Regional Collectors/Distributors Travel Mobility Feeder Roads (Connectors)
Tertiary Regional Local/Access Access
Source: (Twerefou et al., 2015)
Currently, it is estimated that Ghana’s road transport infrastructure is about 67,291 km of road network. This comprises approximately 12,785 km trunk roads; 42,394 km feeder roads and 12,112 km urban roads (Styles and Trigona, 2018). There has been significant investment and expansion in the road transportation of Ghana. In 2012, an estimated amount of GHC∕1 billion (US$500 million) was expended in the Ghanaian road sector (China Daily, 2012). Currently, almost GHC1.3 billion has been budgeted for the next three years. Of this amount, approximately GHC943 million is to be dedicated to road and bridge construction while about GHC 217 million is to utilized for roads rehabilitation and maintenance (Ministry of Roads and Highways, 2019). Akin to other countries, timely movement of people, goods and services is also essential in Ghana. This brings to the fore the need for research and
496
Obiri-Yeboah A. A. et al. Travel Time Variability Analysis: The Case of Kumasi, Ghana

to develop accurate prediction models for roadway transportation in Ghana. However, against the background of intensive research on-going elsewhere, it appears there is very little research relevant to Ghana.
This study seeks to investigate the differences in travel time during the morning, evening and off-peak periods for three different travel modes thus “trotros” (mini-van commercial vehicles), taxis (shared commercial small vehicles) and private vehicles in the Kumasi Metropolis. Activities observed on roads in the Kumasi Metropolis are largely similar to others across the country. Results of the study and subsequent recommendations w i l l be usef ul to stakeholders in the transportation industry to facilitate informed travel planning and decision-mak ing processes.
2. Methodology and Description of Study Sites
In this section, the routes used for the study as well as the methodology to obtain relevant data are brief ly described. The study was conducted for thirteen (13) days (i.e. from the 10th to the 24th of December 2019) on three selected roads within the Kumasi Metropolis namely KNUST-Amakom (N6), Ahodwo-Santasi (Dr. Osei Tuffour Bypass) and Ahodwo-KMA (Harper Road). The roads were selected because they are all major arterial roads and represent typical traffic conditions within the Metropolis. Further, these roads are characteristic of most arterial roads within Kumasi due to its geographical spread. One-way analysis of variance (ANOVA) was conducted to compare the means of travel time in the morning, afternoon and evening for the various vehicle types. Statistical significance was determined at p-value less than 0.05.
2.1. KNUST-Amakom (N6)
The KNUST-Amakom road represents a very small portion of 2.85 km (approx. 1%) of the N6 highway which begins from Nsawam through Nkawkaw and Ejisu to Kumasi. The estimated length of the N6 is 250 km. The road, which is a major arterial within the Kumasi Metropolis, has a total of six (6) major junctions beginning from the KNUST pelican crossing and ending on the Amakom 4-legged signalized intersection. In between, there are two (2) 4-legged signalized intersections at Bomso and Anloga and one (1) signalized T-intersection at Stadium and another unsignal ized intersection at Susuanso. The general road surface condition from KNUST to Amakom is good but for a few locations where there are severe corrugations and some surface rip offs. The KNIUST-Amakom portion of the N6 is noted for severe hawker activities which impact negatively on vehicular flow along the stretch. A sketch of the road, obtained from (Google Maps, 2020) is shown in Fig. 1(a).
2.2. Ahodwo-Santasi (Dr. Osei Tuffour Bypass)
Both Ahodwo and Santasi are two suburbs in Kumasi noted for their burgeoning and booming business and residential activities. The Ahodwo-Santasi road is about 2.31 km and is in between two (2) roundabouts. The Dr. Osei-Tuffour Bypass is another major arterial within the metropolis and it has one (1) four-leg unsignalized intersection and four (4) unsignalized T-intersections. The road has a semi-residential and commercial land use type characterized by high side frictional conditions such as mechanic shops, vulcanizing activities, vehicle sellers, food vendors, crossing and walking pedestrians, vegetable markets among others (Obiri-
497
International Journal for Traffic and Transport Engineering, 2020, 10(4): 494 - 507

Yeboah et al., 2020). A graphical image of the road obtained from the (Google Maps, 2020) is shown in Fig. 1(b).
2.3. Ahodwo-KMA (Harper Road)
The Ahodwo-KMA (Harper Road) is a 2.1 km minor arterial road length beginning from the Ahodwo roundabout to the Kumasi Metropolitan Assembly (KMA). With a semi-
residential land-use type, the Ahodwo-KMA road also has some side friction conditions such as the presence of walking and crossing pedestrians, food vendors and street-side hawkers (Obiri-Yeboah et al., 2020). There are three (3) unsignalized T-intersections along the road and one (1) 4-legged unsignalized intersection. The illustration of the Ahodwo-KMA road taken from the (Google Maps, 2020) is shown in Fig. 1(c).
(a)
(b) (c)Fig. 1.Study Route Maps: (a) KNUST Junction to Amakom; (b) Santasi Roundabout - Ahodwo Circle Route; (c) The Kumasi Metropolitan Assembly – Ahodwo Circle RouteSource: (Google Maps, 2020)
Real-time travel time data was collected at three different time intervals, that is, morning peak (7:00am to 10:00 am), off peak (1:00pm to 3:00pm) and evening peak (4:00pm to 7:00pm). The daily and/or seasonal variations were also accounted for by collecting data on both weekdays and weekends for the study period. Actual essential traffic data required for analysis
are the field measured travel times of all vehicles that entered and exited the three selected routes in seconds within the study periods. Total travel time in seconds of varying vehicles (taxi, “trotro”, private) plying each route was estimated from Eq. 1, as:
TTt=Tend-Tbegin (1)
498
Obiri-Yeboah A. A. et al. Travel Time Variability Analysis: The Case of Kumasi, Ghana

Where: TTt = Total travel time in seconds; Tend = Time the trip ends; Tbegin = Time the trip begins.
The distances between the beginning and end of the selected routes were obtained using the Google map distance tool bar and were corroborated w ith physica l measurement on site.
3. Results
Actual measured travel times recorded along all three routes for three vehicle categories are presented. For each route, pictorial illustrations (Fig. 2(a) to 4(f)) of the actual
and ideal travel times have been plotted against day of the week. On the graphs, the straight line with diamond bullets represents ideal travel time, the triangular, circular and square bullets represent private, taxi and “trotro” travel modes respectively. Peak periods were morning (7:00am to 10:00am) and evening (4:00pm to 7:00pm); afternoon represented off-peak periods.
3.1. Travel Time Variability Curves for Study Roads
Travel time variability curves for study routes are shown in figures 2(a) to 4(f).
3.1.1. KMA-Ahodwo Route
(a) (b)
(c)Fig. 2(a-c).Travel Time Variability Curves for KMA-Ahodwo Route: (a) Morning; (b) Afternoon; (c) Evening
499
International Journal for Traffic and Transport Engineering, 2020, 10(4): 494 - 507

It is observed from (Fig. 2(a)- (c)), that the deviation from the ideal travel time by the taxis and “ trotros” is higher than private vehicles for morning and evening. Private vehicles recorded much higher deviations from the ideal than the taxis and “trotros” in the evening . Average departure from ideal travel time for all three categories of vehicles from KMA-Ahodwo is well in excess of 300s with the minimum being 229s and the maximum being 968s.
3.1.2. Ahodwo-KMA Route
The results (Fig 2(d)-2(f)) indicate that all transport modes experienced high variabilities in the morning, the highest being the private vehicles decreasing appreciably during the evening peak periods. An average deviation of 312s over and above the ideal travel time of 151s was recorded.
(d) (e)
(f)Fig. 2(d-f).Travel Time Variability Curves for Ahodwo-KMA Route: (d) Morning; (e) Afternoon; ( f) Evening
3.1.3. Ahodwo-Santasi Route
From (Fig. 3(a)- (c)), it shows that actual travel times for both commercial and private vehicles are quite similar in the morning peak period. The trend changes in the afternoon and evening periods when the difference
between the actual and ideal travel time is obvious. During the afternoon and evening periods, private vehicles experienced very low variabilities in travel time. For the other two transport modes, over the same period, variabilities in travel time were high especially during the afternoon off-peak periods.
500
Obiri-Yeboah A. A. et al. Travel Time Variability Analysis: The Case of Kumasi, Ghana

(a) (b)
(c)Fig. 3(a-c).Travel Time Variability Curves for Ahodwo-Santasi Route: (a) Morning; (b) Afternoon; (c) Evening
3.1.4. Santasi-Ahodwo Route
A long the Santasi-A hodwo route, it is observed that all transport modes have actual travel times greater than the ideal travel time of 186s for the morning, afternoon and evening study periods. The private vehicles recorded the greatest deviation off the ideal
in the morning while the taxis recorded the highest in the evening peak period. Interestingly, taxis recorded the highest variations in the afternoon peak period. In Fig. 3(d), it can be observed that the commercial vehicles have a slightly improved travel time than that of the private vehicles. The reverse is true as seen in Fig. 3(f).
(d) (e)
501
International Journal for Traffic and Transport Engineering, 2020, 10(4): 494 - 507

(f)Fig. 3(d-f).Travel Time Variability Curves for Santasi-Ahodwo Route: (d) Morning; (e) Afternoon; ( f) Evening
3.1.5. KNUST-Amakom Route
For the KNUST-Amakom route, it was observed that travel time variabilities (Fig 4(a)-4(c)) are
high at all peak periods for “trotro” vehicles. Variabilities for taxis were relatively low during the morning and evening peak periods but increased during the afternoon peak period.
(a) (b)
(c)Fig. 4(a-c).Travel Time Variability Curves for KNUST-Amakom Route: (a) Morning; (b) Afternoon; (c) Evening
502
Obiri-Yeboah A. A. et al. Travel Time Variability Analysis: The Case of Kumasi, Ghana
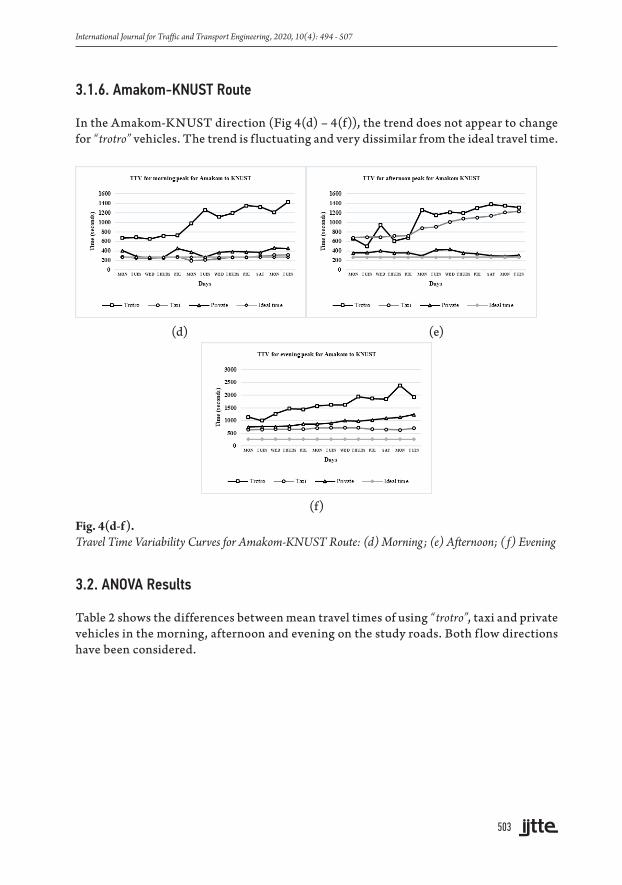
3.1.6. Amakom-KNUST Route
In the Amakom-KNUST direction (Fig 4(d) – 4(f)), the trend does not appear to change for “trotro” vehicles. The trend is f luctuating and very dissimilar from the ideal travel time.
(d) (e)
(f)Fig. 4(d-f).Travel Time Variability Curves for Amakom-KNUST Route: (d) Morning; (e) Afternoon; ( f) Evening
3.2. ANOVA Results
Table 2 shows the differences between mean travel times of using “trotro”, taxi and private vehicles in the morning, afternoon and evening on the study roads. Both f low directions have been considered.
503
International Journal for Traffic and Transport Engineering, 2020, 10(4): 494 - 507

Table 2Results of One-way Analysis of Variance (ANOVA)
Selected Arterial
Roads
Morning Afternoon Evening P-valueMean Travel
Time (s)Standard Deviation
Mean Travel Time (s)
Standard Deviation
Mean Travel Time (s)
Standard Deviation
KMA - Ahodwo“Trotro” 356.2 150.6 331.3 79.4 407.6 101.4 0.236
Taxi 363.9 172.8 337.3 117.4 382.3 75.8 0.671
Private 309.6 21.6 302.5 13.9 859.8 76.4 0.001Ahodwo - KMA
“Trotro” 520.9 95.2 335.7 149.8 443.9 115.6 0.002Taxi 560.1 145.7 316.8 108.5 469.2 70.6 0.001
Private 700.2 39.7 421.5 29.7 301.3 31.8 0.001Ahodwo-Santasi
“Trotro” 627.5 118.3 773.2 69.6 525.3 87.9 0.001Taxi 504.3 71.4 673.5 64.1 611 81.9 0.001
Private 503.8 52 405 25.9 387.2 25.1 0.001Santasi-Ahodwo
“Trotro” 548.4 89.4 497 14.9 659.2 110 0.001Taxi 613.9 57.9 421.5 23.6 1008 206.6 0.001
Private 704.1 39.4 368.3 33.4 365.7 38.9 0.001KNUST - Amakom
“Trotro” 1460.8 169.9 1144.1 338.8 1818.2 330.6 0.001Taxi 405.4 34.9 808.7 186.3 798.7 105.6 0.001
Private 338.4 58 348.1 68.2 374.3 64.3 0.342Amakom-KNUST
“Trotro” 1024.7 295.7 1041.9 320.3 1623.5 373.2 0.001Taxi 263.2 34.2 925.8 211.5 677 32.6 0.001
Private 365 73 353.8 46.6 936.3 155.9 0.001
Note: significant p-values are shown in bold.
The table also shows that the variabilities for all routes studied using the three modes of transportation are statistically different except the K NUST-Amakom route for private vehicles and KMA-Ahodwo route for taxis and “trotros” respectively.
4. Discussion
4.1. KMA-Ahodwo: Ahodwo-KMA
KMA is the central business district (CBD) of Kumasi. The morning rush hour is from Ahodwo to KMA while the evening rush hour is from KMA to Ahodwo. Mean travel
times for “trotros” and taxis for the KMA-Ahodwo route do not show any significant differences. The major difference exists for private vehicles only and in the evening peak. In the reverse direction however, significant differences in the means were observed for all travel modes in all peak times. This discrepancy could be attributed to the fact that, commuters who are not captives to commercial vehicles, have the liberty to make other stops at their own discretion, could stay longer during their stops, consequently adding to the increased deviation from the ideal travel time in the evening for the KMA-Ahodwo route coupled
504
Obiri-Yeboah A. A. et al. Travel Time Variability Analysis: The Case of Kumasi, Ghana

with the fact that commuters have finished their businesses and are returning.
4.2. Ahodwo-Santasi: Santasi-Ahodwo
For both Ahodwo-Santasi and Santasi-Ahodwo routes, significant differences exist between the actual travel times for both commercial and private vehicles. This route is characterized by substantial side frictional agents. A range of roadside friction agent activities, such as presence of vulcanizing activities, lay-byes, walking and crossing pedestrians, street-side hawkers and mini marts, exists on most of the major and minor arterial roads within the Kumasi metropolis. These frictional agents serve as attraction sights for motorists compelling them to stop to patronize their products (Obiri-Yeboah et al., 2020).
4.3. KNUST-Amakom: Amakom-KNUST
T he K N UST-A m a kom road, a du a l carriageway, is a major arterial connecting Accra to the CBD of Kumasi within the Ashanti Region. Signif icant statistical difference exists for all travel modes and all peak periods for the KNUST-Amakom and Amakom-KNUST routes except for private vehicles in the KNUST-Amakom direction. The differences could be attributed to the side frictional agents present, indiscriminate stops along route, dissimilar waiting times for different travel modes and different peak periods, freedom of movement for a dual carriageway amidst higher speeds than normal.
5. Conclusions and Recommendations
This work examined travel time variability for three selected roads at during three different times of day (morning, afternoon
and evening) for three different travel modes (“trotros”, taxi and private). Statistical difference was significant for all routes and travel modes except for KMA-Ahodwo for trotros and taxis and KNUST-Amakom for private vehicles. Side frictional agents and their attractions leading to multiple stops have been a major source of the variations. Other reasons identified were stopping at undesignated locations, different peak times of observations, disparate waiting time at stops and the possibility of driving above designated speed limit. The authors recommend that to reduce travel time variabilities within the CBD, side friction attractions have to be dealt with. Road side friction agents must be relocated away from the roadside. Further, commuters must make more trips during off peak periods and have the variabilities in mind when trips have to be made during the peak times so as to incorporate the additional time variations in journey plans. It is also recommended that an extension of the study be carried out on other arterials to ascertain and validate the findings in this study.
Acknowledgements
The authors acknowledge the contribution of Benjamin Pappoe, a recent Bachelor of Technology graduate from the Civil Eng i neer i ng Depa r t ment of Ku masi Technical University for leading the data collection. All project costs were borne by the authors.
References
Abdel-Aty, M.; Kitamura, R.; Jovanis, P. 1995. Exploring route choice behavior using geographical information system-based alternative routes and hypothetical travel time information input, Transportation Research Record 1493: 74–80.
505
International Journal for Traffic and Transport Engineering, 2020, 10(4): 494 - 507

Ammons, D.N. 2001. Municipal benchmarks: Assessing local performance and establishing community standards. 2nd ed, Thousand Oaks: Sage Publications.
Biliyamin, I. A.; Abosede, B. A. 2012. Effects of congestion and travel time variability along Abuja-Keffi corridor in Nigeria, Global Journal of Researches in Engineering Civil and Structural Engineering 12(3): 19-25.
Chien, S.; Liu, X. 2012. An investigation of measurement for travel time variability. In Intelligent Transportation Systems. Abdel-Rahim, A. (Ed.), IntechOpen, 22-40.
China Dialy. 2012. $500m of Chinese loan used on roads in Ghana, says Minister. Available from Internet: <http://www.chinadaily.com.cn/bizchina/2012-12/05/content_15986854.htm>.
Demetsky, M.J.; Bin-Mau Lin, B. 1982. Bus stop location and design, Transportation Engineering Journal of ASCE 108(4): 313– 327.
Durán-Hormazábal, E.; Tirachini, A. 2016. Estimation of travel time variability for cars, buses, metro and door-to-door public transport trips in Santiago, Chile, Research in Transportation Economics 59: 26–39.
FHWA. 1998. Travel time data collection handbook. Office of Highway Information Management. FHWA, US Department of Transport, Texas Transportation Institute, Texas, A&M University System. Report No. FHWA-PL-98-035.
Fosgerau, M. 2017. The valuation of travel-time variability. 39–56 p. Available from Internet: <https://doi.org/10.1787/9789282108093-3-en>.
Fosgerau, M.; Hjorth, K.; Brems, C.; Fukuda, D. 2008. Travel time variability: Definition and valuation. Technical University of Denmark, Copenhagen. 89 p.
Furth, P.G.; Rahbee, A.B. 2000. Optimal bus stop spacing through dynamic programming and geographic modeling, Transportation Research Record 1731(1): 15-22.
Gaver Jr, D. P. 1968. Headstart strategies for combating congestion. Transportation Science 2(2): 172-181.
GIPC. 2020. Infrastructure – Transportation. Ghana Investment Promotion Centre. Available from Internet: <https://www.gipcghana.com/invest-in-ghana/why-ghana/infrastructure/transportation-infrastructure.html>.
Google Maps. 2020. Accessed on the 15th of February, 2020.
Gopi, K. M.; Tanenlimalil, S. G.; Paul, B. 2019. Total travel time analysis for students in a metropolitan area: A study from India, International Journal for Traffic and Transport Engineering 9(4): 419–430.
Javid, J. R.; Javid, J. R. 2018. A framework for travel time variability analysis using urban traffic incident data, IATSS Research 42(1): 30–38.
Kieu, L. M.; Bhaskar, A.; Chung, E. 2015. Public transport travel-time variability definitions and monitoring, Journal of Transportation Engineering 141(1): 23p. Available from Internet: <https://doi.org/10.1061/(ASCE)TE.1943-5436.0000724>.
Knight, T. E. 1974. An approach to the evaluation of changes in travel unreliability: A ‘safety margin’ hypothesis, Transportation 3(4): 393-408.
Kwon, J.; Coifman, B.; Bickel, P. 2000. Day-to-day travel time trends and travel-time prediction from loop-detector data, Transportation Research Record 1717(1): 120-129
Li, H.; Bertini, R.L. 2008. Optimal bus stop spacing for minimizing transit operation cost. In Proceedings of the 6th International Conference on Traffic and Transportation Studies, 553-564.
Li, H.; Bertini, R.L. 2009. Assessing a model for optimal bus stop spacing with high-resolution archived stop-level data, Transportation Research Record 2111(1): 24-32.
506
Obiri-Yeboah A. A. et al. Travel Time Variability Analysis: The Case of Kumasi, Ghana

Li, R. 2004. Examining travel time variability using AVI data. In Proceedings of the Conference of Australian Institutes of Transport Research (CAITR), Melbourne, Victoria, Australia. No. 36. 16 p.
Ministry of Roads and Highways. 2019. Medium term expenditure framework (MTEF) for 2019 – 2022, programme-based budget estimates for 2019. Available from Internet: <https://www.mofep.gov.gh/sites/default/files/pbb-estimates/2019/2019-PBB-MRH.pdf>.
Obiri-Yeboah, A. A.; Amoah, A. S.; Gbeckor-Kove, M. S. 2020. Analysis of congestion on some road link sections using roadside friction in congestion index in Kumasi, International Journal for Traffic and Transport Engineering 10(1): 31-40.
Raheem, S. B.; Olawoore, W. A.; Olagunju, D. P.; Adeokun, E. M. 2015. The cause, effect and possible solution to traffic congestion on Nigeria road: a case study of Basorun-Akobo road, Oyo State, International Journal of Engineering Science Invention 4(9): 10-14.
Reilly, J. M. 1997. Transit service design and operation practices in Western European Countries, Transportation Research Record 1604(1): 3-8.
Rodrigue, J.P.; Notteboom, T. 2020. The Economic Importance of Transportation (Chapter 3) in: The Geography of Transport Systems, New York: Routledge, 456 p. ISBN 978-0-367-36463-2 Available from Internet: <https://transportgeography.org/?page_id=5260>.
Sankar, R.; Kavitha, J.; Karthi, S. 2003. Optimization of bus stop locations using GIS as a tool for Chennai city - A case study. In Map India Conference, Poster Session.
Schrank, D.; Eisele, B.; Lomax, T. 2012. TTI’s 2012 Urban Mobility Report. Texas A&M Transportation Institute, 68 p.
Styles, L.; Trigona, C. 2018. Ghana Road Network. Available from Internet: <https://dlca.logcluster.org/display/public/DLCA/2.3+Ghana+Road+Network>.
Sun, C.; Arr, G.; Ramachandran, R. P. 2003. Vehicle re-identification as method for deriving travel time and travel Time Distribution, Transportation Research Record 1826(1): 25-31.
Twerefou, D. K.; Chinowsky, P.; Adjei-Mantey, K.; Strzepek, N. L. 2015. The economic impact of climate change on road infrastructure in Ghana, Sustainability 7(9): 11949-11966.
van Nes, R.; Bovy, P.H. 2000. Importance of Objectives in Urban Transit-Network Design, Transportation Research Record 1735(1): 25-34.
Winston, C. 2013. On the performance of the U.S. Transportation System: Caution Ahead, Journal of Economic Literature 51(3): 773–824. doi:10.1257/jel.51.3.773.
Xu, X.; Chen, A.; Cheng, L. 2013. Assessing the effects of stochastic perception error under travel time variability, Transportation 40(3): 525–548.
Yesufu, T. K.; Otesi le, R . O.; Ejidokun, T. O.; Ogunseye, A. A. 2019. Investigation and analysis of travel time variability of selected road intersection, International Journal for Traffic and Transport Engineering 9(4): 442 – 455.
507
International Journal for Traffic and Transport Engineering, 2020, 10(4): 494 - 507