Travel Image 2015
56
The largest Nordic image report on 101 outbound destinations TRAVEL IMAGE 2015 THE NORDIC OUTBOUND TRAVEL MARKET The no. 1 destination is ...
description
Spain is the destination with the best image in the Nordic countries in 2015, climbing seven places from last year’s report. USA and Scotland are ranked second and third, while London is the most popular destination for city breaks among the Nordic travellers.
Transcript of Travel Image 2015

The largest Nordic image report on 101 outbound destinations
TRAVEL IMAGE 2015THE NORDIC OUTBOUND TRAVEL MARKET
The no. 1 destination is ...

© V
isitB
rita
in
discover the beaches of fort myers & sanibel.
surround yourself with the thingsthat matter most.
Think southwest Florida and imagine blue skies and warm Gulf
waters blending together on the horizon. Think perpetual sunshine,
white-sand beaches and more than one hundred islands to discover. Think
fashionable boutique and outlet shopping. Think of days spent spotting
dolphins and searching for shells. Find your best vacation, naturally, at
FortMyers-Sanibel.com and request a free Lonely Planet guidebook.
LEE500-6268_DiscoverAmericaNordics_195x270.indd 1 3/3/15 8:58 AM
© S
pani
sh T
ouri
st B
oard

You can take
a peek at page 7
IF YOU’RE
CURIOUS
about which destinations
Nordic travellers believe
have the best image.
1
No.
2
No.
3
No.
© V
isitB
rita
in
© T
emar
esor
© S
pani
sh T
ouri
st B
oard
discover the beaches of fort myers & sanibel.
surround yourself with the thingsthat matter most.
Think southwest Florida and imagine blue skies and warm Gulf
waters blending together on the horizon. Think perpetual sunshine,
white-sand beaches and more than one hundred islands to discover. Think
fashionable boutique and outlet shopping. Think of days spent spotting
dolphins and searching for shells. Find your best vacation, naturally, at
FortMyers-Sanibel.com and request a free Lonely Planet guidebook.
LEE500-6268_DiscoverAmericaNordics_195x270.indd 1 3/3/15 8:58 AM
7
14
31
46
TABLE OF CONTENTSThe Second Edition Is the Hardest 4
About the Analysis 6
TRAVEL IMAGE 2015
DESTINATIONSTravel Image 2015 - Destinations 7
Destination Images – How to use them 10
Interview with the winner 14
Travel Image 2015 – The Nordic Countries 19
Travel Image 2015 – Segments 24
Travel Image 2015 – Age Groups 28
Nepal – a Climber within the Himalayas 31
TRAVEL IMAGE 2015
AWARENESS & ATTRACTIVENESS Travel Image 2015 – Awareness 34
Travel Image 2015 – Attractiveness 35
Travel Image 2015 – Awareness x Attractiveness 36
What Are the Major Threats to a Destination Image? 40
Favorite Destinations – Top 25 42
TRAVEL IMAGE 2015
CITIES Travel Image 2015 – Cities 43
Travel Image 2015 – Cities – The Nordic Countries 44
Travel Image 2015 – Cities – Age Groups 45
City Breaks – a Never-Ending Love Story among Nordic Travellers 46
TRAVEL IMAGE 2015
VISITS, EXPERIENCES AND IMPRESSIONS Experience with a visited destination – and the desire to revisit 48
Impressions of a destination that are not visited – and the desire to visit 49
Which European destinations have the Nordic travellers visited? 50
Which destinations outside Europe have the Nordic travellers visited? 50
Which destinations do the Nordics travellers want to visit? 51
The Wanderlust of the Nordic Travellers 53
TRAVEL IMAGE 2015
SPENDING Holiday Budget 2015 54
Average Holiday Budget 2015 54
Expected change in Holiday Budget 54
© S
pani
sh T
ouri
st B
oard

4 Travel Image 2015
By now you are reading the second edition of our Travel Image. Last year we were excited about the very first publication, and yet we worried.
We worried about the reception, and we worried that nobody would be able to use the statistics that we had gathered for you. Luckily those concerns were un-founded.
The immediate reaction from the industry was posi- tive, and over the past year, the continuing feedback has been both positive and supportive. Many of you have found the results exciting and usable – just like we had hoped.
However, this year our publication must stand its real test, because it is in the second edition that we must prove to you that Travel Image 2014 wasn’t just a whim or a one-time occurrence. Travel Image is a recurring publication.
WHO GOES UP, WHO GOES DOWN?One of the interesting parts about the second edition is that we can now start comparing the developments over time. Who is climbing up the latter and who is dropping down?
For each chart, we have indicated how many places a destination has climbed or fallen since 2014. The colour-ed arrows make it quick and easy to get an overview.
In general it seems that awareness is more or less the same as last year, while attractiveness has changed. We find that quite interesting but perhaps not a big surprise.
13 NEW MEMBERS OF OUR FINE CLUB This year we have added 13 new destinations to our list. This is partially because things in the industry have changed, and also because we, since last year, have been overwhelmed by feedback from the destinations that were not featured on our list. Several of those des-tinations are featured this year and the Caribbean is now separated into its respective destinations instead of being merged into one.
This essentially makes our list longer, and this year we feature 101 destinations. That is why some desti-nations may have dropped on our list despite the fact that they actually scored higher than last year. So be-fore you draw any conclusions about a particular desti-nation, keep that in mind. The calculation methods are exactly the same this year as they were last year, which makes the numbers between 2014 and 2015 absolute-ly comparable.
NEW INFORMATION AND MUCH MORE DATAAdditionally, we have chosen to include a number of charts that indicate the travel habits of the Nordic travellers. These charts will tell you where they have been, what their impressions of the destinations were, which destinations are doing well, which are doing poorly, how much money are the Nordic travellers will-ing to spend – and most important – are they expecting to spend more in 2015 than in 2014.
We have gathered so much data that we couldn’t fit it all in this edition. However, if you are interested in the data that we left out, please feel free to send us an e-mail at: [email protected]
Furthermore, this year we have not produced a new Travel Behaviour & Destination Images, since our almost 200-page long 2014 edition covered both 2014 and 2015. If you missed it last year, you can now buy it with a 50% discount. Contact Related at: [email protected]
Whether this is the first time you hear about our Travel Image or you are a recurring reader, I hope that you find our material both exciting and usable.
Enjoy your reading!
Henrik KochCEO, Related
Art Direction & Design: Strups Prepress & Print: DigitalhusetCirculation: 9,400
Related: Jyllandsgade 8 • 7100 Vejle • DenmarkKungsgatan 37, 8 • 111 56 Stockholm • Sweden
THE SECOND EDITION
IS THE HARDEST
Publisher: Henrik Koch – [email protected] Editor in Chief: Trine Abild – [email protected] Media Sales: Henrik Koch – [email protected] & Analysis: A&B AnalyseContent: Related

EXPERIENCE ICELAND WITH ICELANDAIR
+ Book your Iceland adventure at www.icelandair.com

6 Travel Image 2015
ABOUT THE ANALYSIS
THE RESPONDENTSThe analysis was conducted based on a representative cross section of people from the largest provider of panellists in the Nordics, M3 Research.
The panellists’ demographics were registered, and based on this, a simple and random selection of Swedish, Danish, Finnish and Norwegian citizens was drawn. These panellists then received an online questionnaire that they answered via PC or tablet.
REPRESENTATIVITYThe study encompasses responses from 2,200 people over the age of 18, distributed reasonably even across the four Nordic countries. It is in all aspects a very large study, which ensures a high degree of statistic certainty but also ample opportunity for breaking down the background data. The gathered data has been weighted according to gender, age and geography, making the responses representative of the four Nordic countries.
To make the analysis as accurate as possible, the four Nordic countries were included in the questionnaire. However, the citizens of each individual country couldn’t select their own country as a preferred holi-day destination. Swedes were for example able to select Denmark, Norway or Finland as a preferred destina-tion, but not Sweden.
As such, if for example Sweden appears on a list, it’s expressive of the share of responses that were received from the other three countries.
THE IMAGE INDEXThe image index has been calculated based on the respondents’ ranking of each individual destination. The value has been calculated with two dimensions as points of reference: awareness and attractiveness. The better you know a destination and the higher you rank it – the higher the image value. The calculation also includes several measurement criteria that for example take into account whether the awareness is based on visits to the destination or an “undocumented” assess-ment.
This calculation provides an image value that makes it possible to rank the rated destinations in relation to each other. Higher value means better image.
The data was collected in the period from January 26th to February 8th, 2015.
René FrederiksenA&B ANALYSE A/S
The analysis behind Travel Image 2015 has been produced in
collaboration with A&B ANALYSE A/S.

Travel Image 2015 7
1SPAIN
No.
© S
pani
sh T
ouri
st B
oard
2USA
No.
3SCOTLAND
No.
TRAVEL IMAGE 2015

8 Travel Image 2015 8 Travel Image 2014
1. Spain 394.7 7
2. USA 393.4 À 2
3. Scotland 391.7 Â 0
4. Denmark 391.5 À 3
5. Italy 391.4 À 1
6. Australia 388.4 Á -1
7. England 386.1 Á -5
8. New Zealand 385.9 Á -7
9. Norway 381.9 À 5
10. Iceland 381.8 À 1
11. Germany 378.6 À 5
12. Ireland 376.5 À 1
13. Austria 372.5 Á -3
14. Portugal 372.4 À 3
15. Netherlands 366.1 À 6
16. Sweden 364.6 À 2
17. Switzerland 363.4 Á -2
18. Japan 361.6 À 5
19. Canada 361.3 Á -10
20. Wales 360.5 Á -1
TRAVEL IMAGE 2015
Here you can see the complete image index for 101 destinations, as rated by Nordic travellers across the four
Nordic countries. You can read more about the background for the index on page 6 and 10-13. The indexes for each of the four
Nordic countries can be seen on pages 20-23.
1. New Zealand 396,1 1. Spain 394.7À7
The winner is ...

Travel Image 2015 9
21. France 359.0 Á -1
22. Finland 345.0 À 7
23. Greece 337.8 À 5
24. Greenland 336.9 Á -2
25. Maldives 336.1 À 6
26. Thailand 332.6 Á -2
27. Malta 331.9 Á -1
28. Luxembourg 325.2 Â New
29. Czech Republic 324.0 À 6
30. Faroe Islands 323.7 Á -3
31. Croatia 322.4 À 8
32. Mauritius 320.6 À 10
33. Bahamas 320.3 Â New
34. Hungary 317.7 À 4
35. Singapore 316.6 Á -10
36. Cyprus 315.6 Á -4
37. Belgium 311.8 Â 0
38. Barbados 308.9 Â New
39. Estonia 308.4 Â New
40. US Virgin Islands 307.5 À 1
41. Brazil 300.7 Á -8
42. Puerto Rico 299.5 À 4
43. Seychelles 289.2 À 1
44. Nepal 287.8 À 15
45. Poland 286.6 À 12
46. Madagascar 277.6 Á -17
47. Philippines 277.2 À 5
48. Vietnam 276.8 Á -14
49. China 275.4 Á -6
50. Mexico 275.4 À 1
51. Dubai 274.4 Â 0
52. Latvia 273.5 Â New
53. Jamaica 272.7 Â New
54. Slovakia 272.6 À 11
55. Malaysia 271.9 Á -7
56. Cuba 268.7 Á -1
57. South Africa 268.2 Á -12
58. Slovenia 267.0 À 7
59. Dominican Republic 264.4 Á -5
60. Chile 264.1 Á -7
61. Cape Verde 263.4 Á -12
62. Aruba 261.5 Â New
63. Fiji 261.0 Á -27
64. Argentina 260.5 Á -17
65. Lithuania 260.3 Â New
66. Indonesia 250.0 Á -6
67. Peru 244.7 Á -27
68. Venezuela 244.6 À 3
69. South Korea 239.0 Á -5
70. Trinidad and Tobago 236.7 Â New
71. Costa Rica 233.9 Á -8
72. Sri Lanka 232.6 Á -16
73. India 227.0 Á -4
74. Kenya 221.0 Á -13
75. Abu Dhabi 210.7 Á -1
76. Tanzania 210.4 Á -10
77. Ecuador 208.6 Á -7
78. Macedonia 208.6 Á -9
79. Morocco 206.3 Á -7
80. Israel 204.4 Á -5
81. Laos 197.9 Â New
82. Bulgaria 197.0 Á -5
83. Bosnia and Herzegovina 195.6 Á -4
84. Jordan 188.4 Á -8
85. Namibia 186.8 Â New
86. Egypt 178.8 Á -6
87. Serbia 167.6 Á -4
88. Tunisia 165.3 Á -10
89. Turkey 165.3 Á -30
90. Panama 161.1 Á -23
91. Qatar 158.4 Á -18
92. Zimbabwe 153.5 Á -10
93. Colombia 152.4 Á -8
94. Gambia 146.1 Á -10
95. Burma 141.6 Â New
96. Russia 128.8 Á -10
97. Oman 128.1 Á -16
98. Albania 117.7 Á -11
99. Rwanda 99.3 Â New
100. Romania 97.2 Á -12
101. Pakistan 15.4 Á -12
Travel Image 2014 9

DESTINATION IMAGES – HOW TO
USE THEMEverybody is talking about destination images, and we all agree on
their importance. But only very few actually use them actively. Because how exactly do you work actively with the numbers? And how do you
measure whether or not your own work is a success? Our Travel Image gives you the answer to both these questions. The index is calculat-ed based on several indicators, and if we take a closer look at each
of these indicators, a world of possibilities to evaluate, measure and improve opens up.
10 Travel Image 2015

Travel Image 2015 11
It’s no secret that we have been commended for our Travel Image, but it also isn’t a secret that we have been asked a lot of questions about how we calcu-
late an image, what an image consists of and how to work actively on improving your image. In this article I want to answer these questions. I want to answer them by explaining the indicators, by exemplifying and examining this year’s winner – Spain.
MEASURABLE AND COMPARABLE The goal of the Travel Image has always been to make an image measurable and comparable. It took a lot of thinking and deciding before we – in cooperation with a renowned analysis agency – managed to develop a valid model of measurement.
I have to make it perfectly clear, of course, that our Travel Image is not the only way to measure an image. However, I feel that this is a qualified approach.
We actually wanted to make it even more specific, as one of the problems when discussing image analysis is that it often ends up being blurry, and we forget exactly what we were arguing. To be able to discuss the premises of an image, compare images and work active- ly to improve your image, it is important to know the indicators and what is being measured.
THE FOUR PILLARS OF AN IMAGETravel Image is built on 4 parameters, which are explained below:
1. Awareness2. Attractiveness – among those who have visited the
destination3. Attractiveness – among those who have not visited
the destination4. Favourite destinations
1. AWARENESSAwareness is basically how many people know about your destination. In Travel Image it is defined as those who feel that they know your destination well enough to have formed an opinion about it. It does not indicate whether or not people have actually visited your desti-nation, or if they can point to anything in particular (for example a sight), only that they know of the destination and have an opinion about it.
It can be discussed whether awareness should be in-cluded in an image evaluation; we chose to include it because we believe it is a crucial parameter in making the destinations comparable.
Example: If you are a small and unknown island jewel that is only visited by approximately 100 travellers a year, all with relatives on the island, you will have a high ranking in attractiveness for this particular group, but the evaluation is based on very little data. When you attract so little awareness it will naturally have an impact on your image. This is why awareness is a pa-rameter in the Travel Image.
2. + 3. ATTRACTIVENESSAttractiveness is a very important parameter when discussing image. It is so important that we decided to split it into two:
• Experiences: image among those who have visited the destination
• Impressions: image among those who have NOT visited the destination
These are two completely different things and two completely different ways to gain success. Experienc-es are about providing a great experience to those who are visiting (and meeting or exceeding their expecta-tions). Impressions are about branding and advertise-ment (and about gaining ambassadors in the people who have already visited your destination).
It therefore makes sense to evaluate the two parame-ters separately when examining how to improve your image. For this reason and others, we have chosen to include some of these numbers in this year’s Travel Image publication (the numbers are found on pages 48-49).
4. FAVOURITE DESTINATIONSWhen we ask people to evaluate a number of destina-tions, many of these destinations will receive positive feedback. Many destinations will receive a “I would like to visit”, which might not give a 100% correct picture of where the person actually wants to go, and most cer-tainly not where he or she dreams of going. To accom-modate this issue, we have included an “I want to go”

12 Travel Image 2015
factor where the respondent is asked to mention three of their favourite destinations. It is an open question with no predefined alternatives, which means that a combination of awareness, attractiveness – the overall image of the destination – will define the respondent’s answers.
This evaluation is a part of the 4th and final parameter.
CHANGE OF AN IMAGETo give a practical example of image development, how the perception of an image changes and how the com-plexity of the image ranking works, we will use this year’s winner, Spain, as an example.
Spain has managed to climb from its 8th place in the 2014 report to number one in 2015. This jump has hap-pened for several reasons. Below we explain how this repositioning is reflected in the four parameters.1
CHANGE IN AWARENESS When we examine the awareness index (page 34) as an isolated parameter, Spain has climbed from number 6 (in 2014) to number 4 (in 2015). This means that apart from our closest neighbours of Denmark, Sweden and Norway, Spain is now the destination that Nordic travellers know the best.
Spain Value Ranking
2014 138.1 6
2015 144.0 4
Difference +5.9 +2
This particular development is quite impressive, con-sidering that awareness is a hard parameter to change. No other top 40 country has managed to climb more than 3 places from 2014 to 2015. It is a long process to change the awareness of a destination. It demands pa-tience and an intense and consistent level of communi-cation, in different media and on all types of platforms, in order to make an impact.
Those that managed to climb the awareness index lad-der the most in 2015 are Fiji (+5), Italy (+3), Hungary (+3) and Mauritius (+3).
CHANGE IN ATTRACTIVENESSWhen we examine the attractiveness index (page 35), Spain has moved from number 13 to number 8 across all four Nordic countries. Spain is especially attractive
in Finland, climbing 7 places from number 20 in 2014 to 13th place in 2015.
Other destinations that have made the most positive impact on their attractiveness in the 2015 Travel Im-age are: Slovakia (+17), Mauritius (+15), Nepal (+15) and Poland (+13).
Spain’s success is on its own quite interesting and mostly explains the overall progress on the overall Travel Image list. However, to be able to use the num-bers actively, you need to use the numbers behind the index. This includes what the people that have visited the destination have to say, and what the people that haven’t visited the destination have to say.
EXPERIENCES – THOSE WHO HAVE BEEN THEREThese numbers provide an indication about the quality of the product and how tourist expectations were met.
Spain Negative PositivePositive and would
like to revisit
2014 2.5% 27.0% 70.5%
2015 2.6% 27.6% 69.9%
Change 0.1% 0.6% -0.6%
In 2015, 2.6% of the past visitors to Spain had a nega-tive experience, while 27.6% had a positive experience and 69.9% would like to revisit. Loyal and revisiting travellers are the best brand ambassadors that a des-tination can ever have. It is something that all destina-tion marketing organizations crave.
In the case of Spain, it is worth mentioning that +0.1% had a negative experience and less people are inter-ested in revisiting (-0.6%) compared to 2014. These insights are valuable and it is important to investigate whether or not this is a lasting tendency or just some unfortunate factors.
EXPERIENCES ARE IMPORTANTExperiences can be used for explaining many things. Belgium, for example, has a ‘positive experience’ index of 61.5% and a ‘positive would-like-to-revisit’ index of only 33%. This can indicate that the travellers had a positive visit but also feel that they saw what needs seeing in Belgium. This further indicates that the coun-try of Belgium and the travel agents haven’t succeeded in communication the possibilities of the destination. If we look at the United States of America, they are the
1/ This will be the technical explanation – go to page 14 to read our interview with the Spanish Tourist Board about their reflections on this positive change.

complete opposite. They actually have a ‘positive expe- rience’ index of 19.4% and a ‘positive would-like-to- revisit’ index of 77.1%. This indicates that after visiting the US, travellers discovered more possibilities.
‘Experiences’ is a heavy parameter in the Travel Image. If you improve on this parameter, your image value will climb. In 2015, Madagascar took an exceptionally bad hit this year in this regard. 23.1% of the visitors had a negative experience. In 2014 the figure was 0.0% and as a result, they have dropped 17 places on the image list from number 29 to 46.
IMPRESSIONS – THOSE WHO HAVEN’T VISITEDThis year the amount of Nordic travellers with a nega-tive impression of Spain has declined and at the same time the amount of people who wants to visit has ex-ploded.
Spain Negative PositivePositive and would
like to revisit
2014 7.8% 42.4% 49.8%
2015 6.4% 36.0% 57.6%
Change -1.4% 6.4% 7.8%
This could indicate that Spain has succeeded in profil-ing their product in a highly positive way. Everything is pointing to a successful branding strategy in the form of promotional messages, advertising and/or informa-tion from the tour operators, the travel agencies or the airlines, as well as news stories in the media, social me-dia and positive word of mouth.
FAVOURITE DESTINATIONSSpain comes in at number two on the favourites list. 19.5% rank Spain as one of their top 3 destinations. This is one step up since last year and contributes to the overall success on the overall image list. Last year, Australia was one step ahead of Spain, this year the two destinations have switched places.
For the second year in a row, USA is the most popular destination: 34.9% names USA as one of their top 3 fa-vourite destinations, which is 15.4% more than Spain.
GET TO WORKThis account illustrates that an image is a complex mat-ter, but if you break it down in parts, it becomes much easier to work with actively. The Travel Image index provides an exact picture of your strengths and weak-
nesses and indicates in which direction you are moving in comparison to your competitors.
My hope is that because of this Travel Image 2015 can not only be used to evaluate your development and where to focus in the future, but also as a means to measure the results of your initiatives when we pub-lish Travel Image in 2016.
Henrik KochManaging Director, Related
Henrik Koch has been the Managing Director at Related since 2006. Related has offices in Den-mark and Sweden and is one of the largest PR and Marketing agencies in the Nordic countries. Related produces the Travel Image – this year for the second time.
Related has specialized in helping destinations, regions, airlines and other operators in the travel industry attract Nordic travellers.
It was Henrik who came up with the idea for the Travel Image and he has since developed the calculations behind the index in cooperation with the analysis agency A&B Analyse.

14 Travel Image 2015
© S
pani
sh T
ouri
st B
oard
In 4 years the number of
NORDIC TRAVELLERS
VISITING SPAIN
has grown by 41.1%
from 3.5 million in 2010 to
5 MILLION
IN 2014

Travel Image 2015 15
SPAIN’S REVIVAL ON THE GOLDEN THRONE
Spain has been a popular charter destination for centuries, attracting Nordic travellers since the mid-fifties. These past few
years, the country has reinvented its offers and products, creating a revival for destinations like the Canary Islands, Mallorca and Ibiza.
Spain has a lot to offer that attracts the Nordic visitors: warm climate all year round, sunny beaches, tasty food, an interesting
history, genuine culture and contemporary modern cities.
We asked Octavio González Manteca, Nordic Director of the Spanish Tourist Board, why he thinks Spain has managed to climb 7 places
from last year, taking over the golden throne from New Zealand.
Congratulations! Spain is the winner in the 2015 image report. Why do you think the image of your country has improved so much since last year? This is the result of a process that has taken place over several years. We have seen an intense growth of of-fers and demand for trips to Spain. The number of di-rect flights has increased significantly as well as the variety of destinations within our country.
Why do you think your destination is so popular among the Nordic people, and what is the reason for the revival of the Canary Islands, Mallorca and Ibiza in the Nordic countries? The climate is obviously an important factor, as well as the sun and beaches. The Balearic and Canary Islands are considered safe destinations, suitable for families. Gastronomy is growing in importance; we can see that the Basque Country, for example, is positioning itself in this segment, attracting Nordic gourmands. The life-style is also a very important aspect of our image; it’s a notion which includes references to the friendly and welcoming nature of the population, and the Spanish culture is perceived as interesting and genuine. The Canary Islands, Mallorca, Ibiza and also Menorca are
renovated destinations with a powerful and dynamic tourist industry.
How much does a city magnet like Barcelona in-fluence the overall image and attractiveness of the destination? Barcelona has contributed to Spain’s profile as a city break destination and has also boosted the image of Spain’s offers for meetings and conferences. Barcelona stands for modernity and openness and has helped portray Spain as a country with a strong culture. Many Spanish cities have followed the path of the post-Olym-pic effect of Barcelona. One example is Malaga, a city that has renewed its seaside front and created mu-seums such as the Picasso Museum. Today Malaga is a culturally attractive and charming city. And we shouldn’t forget the impressive architectural develop-ment of Valencia, the new developments in Palma de Mallorca and Las Palmas.
Spain has been a holiday destination for Nordic travellers for decades - what is the secret weapon that now makes Spanish destinations boom?Spain was the first destination that introduced the Nor-dic people to sun and beach holidays in the 50’s and the 60’s and we have been dominating the market ever since. As one of the first tourist industries in the world, we have a strong capacity for renovating and adapting to demands. I also think that the professional charac-ter of our tourism branch is an important factor - it has

16 Travel Image 2015
been a worldwide pioneer in many aspects. Some of our hotel chains have become important Spanish multina-tional companies, and we can see how our tourist con-cept is being exported by other countries. We also have the multifaceted character of our destinations: you can go swimming in the sea, go skiing in the mountains, visit big cities, discover genuine small towns full of history and art, and experience first class football matches.
How is your future strategy?We will broaden our offers and highlight the impor-tance of our great products of gastronomy and wine. Cultural tourism and cities are also some of our prior-ities. Seasonality, new destinations and increasing the power of our brand are other focus areas.
What are the upcoming regions or destinations in Spain?Some of the new destinations are Green Spain, in the north of Spain, close to the Cantabrian area and the Biscay Bay, the Pilgrims Way to Santiago and the new Bilbao. San Sebastian will also be European Capital of Culture in 2016. And of course, on our islands and along the Mediterranean coast there are more and more des-tinations that are becoming more and more attractive:
Costa de la Luz, Almería, the Andalusian cities, Valencia and Castellón, to mention a few. In 2014 Spain was the country with the third most World Heritage Sites in the world, 44 in total. The cultural power of many cities in the inland in combination with their genuine charac-ter, the landscape, the nature and the gastronomy are important elements to boost this part of our country.
© S
pani
sh T
ouri
st B
oard
97.4% say they had a positive experience of their visit to Spain and 69.8% would like to visit again. Only 2.5% have had a negative ex-perience.
Older couples and families with children have the biggest desire to visit Spain.
Looking at the age groups, people between 35-49 years of age rank Spain the highest.
Facts


Travel Image 2015 19
THE NORDIC COUNTRIES
SEGMENTS
AGE GROUPS
TRAVEL IMAGE 2015
© M
aldi
ves M
arke
ting
& P
ublic
Rel
atio
ns C
orpo
ratio
n

20 Travel Image 2015
1. England 403.7 Â 0
2. USA 399.9 À 1
3. Italy 396.4 À 5
4. Scotland 386.1 Â 0
5. Spain 384.6 À 6
6. Denmark 383.5 À 8
7. Norway 380.6 À 13
8. New Zealand 379.1 Á -2
9. Iceland 378.1 À 15
10. Australia 377.8 Á -8
11. Ireland 375.6 À 6
12. Mauritius 359.2 À 18
13. Netherlands 359.0 À 20
14. Germany 357.4 À 7
15. France 356.9 À 4
16. Japan 356.6 À 11
17. Portugal 354.3 Á -1
18. Greece 353.8 À 8
19. Austria 353.3 Á -10
20. Finland 349.2 À 8
21. Switzerland 349.0 Á -4
22. Croatia 348.7 À 17
23. Thailand 342.1 Á -1
24. Wales 339.0 Á -9
25. Barbados 336.6 Â New
26. Canada 335.8 Á -19
27. Madagascar 335.5 Á -2
28. Maldives 333.0 Â New
29. Singapore 329.7 Á -16
30. Bahamas 329.2 Â New
31. Seychelles 323.3 À 26
32. Czech Republic 322.3 À 5
33. Cyprus 319.1 À 2
34. Cape Verde 316.6 À 20
35. Malaysia 314.8 À 8
36. Vietnam 311.7 À 2
37. Brazil 309.8 Á -14
38. Dominican Republic 309.6 À 3
39. Aruba 309.4 Â New
40. Malta 309.0 Á -4
41. Luxembourg 307.8 Â New
42. Jamaica 306.2 Â New
43. Greenland 305.4 À 15
44. Faroe Islands 298.2 Á -10
45. Mexico 296.7 À 5
46. Puerto Rico 296.6 Á -14
47. Belgium 295.3 Á -2
48. Hungary 293.4 À 3
49. Estonia 290.3 Â New
50. Philippines 290.1 Á -1
51. Indonesia 285.8 À 5
52. China 284.5 Á -8
53. Dubai 284.4 Á -1
54. Chile 283.4 Á -14
55. Trinidad and Tobago 281.8 Â New
56. US Virgin Islands 279.7 Á -27
57. Slovenia 278.7 À 5
58. Fiji 275.9 Á -46
59. Poland 275.2 À 9
60. Kenya 274.7 À 4
61. Cuba 274.6 Á -8
62. Nepal 273.0 À 12
63. Slovakia 272.3 À 3
64. South Africa 270.6 Á -17
65. Ecuador 269.1 Á -4
66. Argentina 262.5 Á -20
67. Latvia 260.1 Â New
68. Laos 254.4 Â New
69. Costa Rica 254.3 Á -27
70. Morocco 250.8 À 3
71. Peru 248.8 Á -40
72. Lithuania 246.4 Â New
73. Macedonia 244.1 Á -6
74. Jordan 243.6 À 5
75. Sri Lanka 243.4 Á -27
76. India 242.7 Á -16
77. Venezuela 232.2 Á -1
78. South Korea 224.8 Á -15
79. Namibia 224.3 Â New
80. Bosnia and Herzegovina 223.0 Á -8
81. Bulgaria 220.4 Á -1
82. Abu Dhabi 218.6 Á -17
83. Zimbabwe 212.8 Á -1
84. Tunisia 210.1 Á -6
85. Turkey 210.1 Á -29
86. Israel 204.8 Á -1
87. Tanzania 201.2 Á -17
88. Egypt 199.6 Á -5
89. Serbia 194.1 Á -8
90. Gambia 193.7 Á -13
91. Colombia 189.2 Á -22
92. Oman 187.1 Á -21
93. Burma 182.8 Â New
94. Panama 179.3 Á -35
95. Qatar 163.2 Á -20
96. Albania 163.0 Á -10
97. Russia 134.4 Á -13
98. Rwanda 123.1 Â New
99. Romania 101.4 Á -11
100. Pakistan 81.9 Á -13
SWEDISH TRAVELLERSTRAVEL IMAGE 2015
TRAVEL IMAGE 2015
THE NORDIC COUNTRIES Here you can see the image index as split over the
four Nordic countries.

Travel Image 2015 21
DANISH TRAVELLERSTRAVEL IMAGE 2015
1. New Zealand 427.2 Â 0
2. Australia 406.4 À 2
3. Spain 404.6 À 2
4. Scotland 402.4 À 5
5. England 401.6 À 2
6. Italy 393.2 Â 0
7. USA 390.9 Á -4
8. Canada 388.9 Â 0
9. Germany 387.1 À 6
10. Iceland 384.6 Â 0
11. Greenland 383.4 Á -9
12. Portugal 381.4 Â 0
13. Wales 380.5 À 8
14. Ireland 380.0 À 9
15. Norway 376.5 À 1
16. Austria 376.0 Á -2
17. France 371.9 À 9
18. Netherlands 364.0 Â 0
19. Japan 363.7 À 6
20. Sweden 361.7 Á -9
21. Switzerland 354.4 Á -2
22. Malta 345.3 Â 0
23. Finland 339.5 À 6
24. Bahamas 336.7 Â New
25. Faroe Islands 332.3 Á -8
26. Thailand 329.6 Á -2
27. Maldives 329.2 À 9
28. Greece 328.4 À 6
29. US Virgin Islands 324.7 Á -16
30. Czech Republic 311.3 À 18
31. Singapore 306.7 À 7
32. Seychelles 305.8 À 5
33. Jamaica 303.6 Â New
34. Nepal 303.1 À 16
35. Luxembourg 302.5 Â New
36. Hungary 302.2 À 17
37. Madagascar 300.4 Á -2
38. Belgium 297.4 À 1
39. Barbados 291.8 Â New
40. Brazil 287.4 Á -9
41. Vietnam 287.3 Á -13
42. China 287.2 À 7
43. Mauritius 279.1 À 8
44. Estonia 277.0 Â New
45. Cyprus 275.1 Á -13
46. South Africa 275.0 Á -6
47. Puerto Rico 272.1 Á -4
48. Latvia 271.4 Â New
49. Peru 271.0 Á -7
50. Fiji 270.7 Á -20
51. Cuba 267.0 Á -6
52. Croatia 265.6 Â 0
53. Argentina 262.3 Á -12
54. Philippines 258.6 Á -9
55. Poland 258.1 À 8
56. Kenya 257.7 Á -2
57. Malaysia 250.9 Á -2
58. Chile 249.8 Á -32
59. Indonesia 244.8 À 2
60. Mexico 243.9 Á -13
61. Dubai 243.5 Á -17
62. India 234.0 À 3
63. Lithuania 233.2 Â New
64. Slovakia 232.8 À 6
65. Costa Rica 230.9 Á -5
66. Tanzania 227.7 Á -9
67. South Korea 225.2 Á -9
68. Slovenia 220.7 Á -2
69. Cape Verde 216.0 Á -36
70. Sri Lanka 209.9 Á -14
71. Israel 203.2 Á -2
72. Venezuela 203.2 Á -4
73. Dominican Republic 198.0 Á -2
74. Morocco 193.9 Á -2
75. Jordan 189.4 À 2
76. Ecuador 183.4 Á -1
77. Abu Dhabi 179.7 Á -18
78. Laos 177.1 Â New
79. Aruba 171.8 Â New
80. Trinidad and Tobago 168.8 Â New
81. Bosnia and Herzegovina 160.9 À 2
82. Egypt 157.8 Á -9
83. Bulgaria 150.6 Á -4
84. Colombia 148.7 À 2
85. Namibia 148.5 Â New
86. Tunisia 143.1 Á -12
87. Turkey 143.1 Á -24
88. Russia 137.9 Á -8
89. Burma 125.2 Â New
90. Panama 122.1 Á -22
91. Macedonia 114.2 Á -15
92. Zimbabwe 110.8 Á -14
93. Serbia 109.1 Á -11
94. Gambia 95.9 Á -9
95. Qatar 80.9 Á -31
96. Romania 70.1 Á -15
97. Oman 69.6 Á -13
98. Rwanda 64.2 Â New
99. Albania 17.6 Á -12
100. Pakistan -30.3 Á -12
© S
inga
pore
Tou
rism
Boa
rd

22 Travel Image 2015
© V
isit
Flan
ders
TRAVEL IMAGE 2015
FINNISH TRAVELLERS
1. Australia 410.2 À 14
2. New Zealand 407.8 Á -1
3. Scotland 406.0 Á -1
4. Spain 393.6 À 12
5. Ireland 392.2 À 2
6. Germany 392.0 À 5
7. Italy 391.4 À 4
8. Switzerland 391.3 Â 0
9. Denmark 390.6 À 3
10. Austria 390.5 Á -5
11. USA 386.7 À 6
12. Norway 386.0 Á -3
13. Canada 383.0 Á -3
14. Portugal 381.4 À 5
15. Netherlands 378.9 À 5
16. Iceland 376.7 Á -13
17. Japan 375.8 Á -11
18. Wales 375.7 Â 0
19. US Virgin Islands 371.3 À 34
20. France 362.8 À 4
21. Estonia 361.7 Â new
22. England 359.3 Á -18
23. Sweden 358.4 Â 0
24. Hungary 358.0 Á -2
25. Luxembourg 357.2 Â new
26. Singapore 356.7 Á -5
27. Czech Republic 348.7 À 6
28. Greenland 348.4 À 18
29. Thailand 335.6 Á -2
30. Cyprus 334.4 À 1
31. Barbados 333.9 Â new
32. Malta 331.7 Á -7
33. Belgium 331.3 Á -1
34. Croatia 324.5 À 3
35. Bahamas 321.7 Â new
36. Dubai 321.5 À 5
37. Greece 321.2 Á -11
38. Brazil 319.6 Á -4
39. Slovenia 315.7 À 11
40. Slovakia 315.0 À 9
41. Chile 312.7 À 28
42. Peru 312.3 Á -12
43. Puerto Rico 306.8 Á -14
44. Poland 306.3 À 4
45. Mauritius 303.7 Á -1
46. South Korea 299.3 À 17
47. Venezuela 299.2 À 21
48. Faroe Islands 298.3 À 7
49. China 296.7 Á -14
50. Latvia 295.4 Â new
51. Lithuania 294.4 Â new
52. Sri Lanka 290.5 À 6
53. Trinidad and Tobago 279.0 Â new
54. Nepal 277.3 Á -14
55. Mexico 274.8 Á -16
56. Maldives 274.6 À 9
57. South Africa 271.0 Â 0
58. Aruba 266.1 Â new
59. Dominican Republic 265.5 Á -14
60. Vietnam 265.3 Á -24
61. Malaysia 260.1 Á -23
62. Philippines 259.3 Á -15
63. Jamaica 248.4 Â new
64. Seychelles 242.8 Á -13
65. Argentina 239.7 Á -13
66. Abu Dhabi 227.4 À 10
67. Cape Verde 225.0 Á -24
68. Costa Rica 220.0 Á -1
69. Burma 219.7 Â new
70. Fiji 215.1 À 1
71. Bulgaria 214.2 Á -1
72. Panama 207.6 Á -16
73. Cuba 207.0 Á -31
74. Bosnia and Herzegovina 206.2 À 6
75. India 205.2 Á -1
76. Macedonia 200.9 Á -12
77. Qatar 200.7 Á -17
78. Indonesia 200.2 Á -19
79. Israel 199.0 Á -4
80. Egypt 191.0 Á -8
81. Ecuador 179.3 Á -15
82. Serbia 177.9 Á -4
83. Tunisia 176.9 Â 0
84. Turkey 176.9 Á -29
85. Tanzania 174.4 Á -23
86. Laos 171.4 Â new
87. Kenya 164.7 Á -26
88. Jordan 161.6 Á -11
89. Morocco 160.9 Á -10
90. Albania 136.6 Á -3
91. Russia 117.6 Á -9
92. Namibia 107.8 Â new
93. Colombia 105.1 Á -20
94. Rwanda 101.5 Â new
95. Gambia 97.1 Á -14
96. Romania 91.3 Á -11
97. Madagascar 90.9 Á -69
98. Oman 89.5 Á -12
99. Zimbabwe 40.0 Á -15
100. Pakistan -1.8 Á -12

Travel Image 2015 23
© S
pani
sh T
ouri
st B
oard
TRAVEL IMAGE 2015
NORWEGIAN TRAVELLERS
1. USA 393.5 À 7
2. Spain 391.2 À 3
3. Iceland 384.2 À 8
4. Italy 382.1 À 2
5. England 378.4 Á -4
6. Maldives 376.1 À 13
7. Scotland 375.8 Á -5
8. Denmark 373.9 Á -5
9. Sweden 373.2 À 1
10. Portugal 370.8 À 4
11. Germany 369.0 À 7
12. Austria 368.1 À 1
13. Ireland 364.0 Á -9
14. Netherlands 362.1 À 5
15. Switzerland 361.0 À 2
16. Australia 360.9 Á -1
17. Japan 356.8 À 12
18. Finland 353.6 À 8
19. Greece 348.1 À 6
20. Wales 347.5 Á -8
21. Croatia 344.4 À 9
22. France 342.1 Á -1
23. Faroe Islands 341.7 À 4
24. New Zealand 340.9 Á -17
25. Canada 333.4 Á -16
26. Malta 333.4 Á -1
27. Mauritius 333.4 À 9
28. Thailand 330.4 Á -6
29. Cyprus 329.4 À 3
30. Luxembourg 328.6 Â New
31. Belgium 321.7 À 4
32. Puerto Rico 321.1 À 31
33. Nepal 313.9 À 5
34. Hungary 310.3 À 5
35. Estonia 309.0 Â New
36. Poland 306.2 À 4
37. Czech Republic 305.5 Â 0
38. Cuba 304.1 À 26
39. US Virgin Islands 300.5 À 40
40. Bahamas 299.1 Â New
41. Brazil 292.3 Â 0
42. Singapore 287.8 Á -11
43. Mexico 287.1 À 6
44. Latvia 284.1 Â New
45. Barbados 281.3 Â New
46. Seychelles 279.4 Á -10
47. Philippines 279.3 Á -5
48. Vietnam 269.9 Á -15
49. Dominican Republic 267.6 À 10
50. Lithuania 267.4 Â New
51. South Africa 264.2 Á -8
52. Dubai 262.8 À 2
53. Slovakia 262.2 Á -1
54. Malaysia 261.6 Á -9
55. Jamaica 258.7 Â New
56. Greenland 256.4 Á -28
57. Chile 255.6 Á -7
58. Argentina 255.0 Á -14
59. Slovenia 254.5 À 1
60. Aruba 250.8 Â New
61. Fiji 250.5 Á -13
62. Cape Verde 249.0 Á -16
63. Venezuela 247.1 À 3
64. Indonesia 246.6 Á -8
65. China 244.8 Á -18
66. South Korea 238.9 Á -11
67. Macedonia 237.2 Á -14
68. India 235.6 À 3
69. Costa Rica 229.9 À 6
70. Peru 223.1 Á -19
71. Israel 219.7 Á -2
72. Abu Dhabi 219.5 À 10
73. Tanzania 218.6 Á -15
74. Morocco 217.7 Á -12
75. Trinidad and Tobago 216.2 Â New
76. Namibia 213.8 Â New
77. Gambia 208.0 À 8
78. Laos 205.7 Â New
79. Ecuador 205.2 Á -1
80. Bosnia and Herzegovina 204.1 Á -3
81. Madagascar 203.8 Á -58
82. Bulgaria 203.0 Á -8
83. Qatar 197.5 Á -7
84. Sri Lanka 195.2 Á -23
85. Kenya 187.4 Á -18
86. Serbia 178.7 Á -6
87. Zimbabwe 170.2 Á -22
88. Egypt 160.6 Á -5
89. Jordan 158.5 Á -19
90. Albania 147.9 Á -17
91. Panama 142.4 Á -23
92. Oman 137.5 Á -11
93. Russia 129.7 Á -9
94. Romania 123.9 Á -8
95. Burma 122.9 Â New
96. Colombia 122.2 Á -8
97. Tunisia 122.0 Á -25
98. Turkey 122.0 Á -40
99. Rwanda 99.5 Â New
100. Pakistan 15.6 Á -13

24 Travel Image 2015
TRAVEL IMAGE 2015
SEGMENTSHere you can see the image index as split over the
four primary segments across the four Nordic countries.
SINGLESTRAVEL IMAGE 2015
1. Scotland 398.4 À 2
2. New Zealand 395.2 Á -1
3. Denmark 394.4 À 6
4. Italy 390.9 À 3
5. USA 390.3 Á -3
6. Spain 388.3 Á -1
7. Germany 386.7 À 5
8. Australia 382.2 Á -2
9. England 381.9 Á -1
10. Ireland 381.7 À 10
11. Sweden 380.5 À 8
12. Portugal 380.0 À 6
13. Iceland 374.0 À 9
14. Norway 372.6 À 1
15. Austria 365.4 Á -4
16. Wales 364.6 À 5
17. Finland 364.5 À 17
18. Netherlands 364.3 À 6
19. Switzerland 358.2 Á -6
20. France 355.8 À 5
21. Japan 353.2 Á -4
22. Canada 346.1 Á -18
23. Faroe Islands 339.3 À 4
24. Greece 336.7 À 4
25. Thailand 333.9 Á -2
26. Singapore 326.7 Â 0
27. Hungary 323.9 À 13
28. Czech Republic 323.2 À 4
29. Maldives 321.1 À 19
30. Luxembourg 320.6 Â New
31. Greenland 319.3 Á -17
32. Malta 313.1 À 1
33. Estonia 311.2 Â New
34. Cyprus 306.2 À 1
35. Belgium 305.9 À 1
36. Bahamas 304.3 Â New
37. Barbados 299.7 Â New
38. Puerto Rico 294.3 Â 0
39. Croatia 293.5 À 8
40. Poland 291.7 À 20
41. Peru 282.5 À 2
42. US Virgin Islands 277.4 À 17
43. Mexico 276.4 Á -1
44. Brazil 274.5 Á -14
45. Nepal 274.4 À 19
46. Slovenia 272.6 À 18
47. South Africa 272.1 Á -3
48. Mauritius 270.6 À 1
49. Slovakia 268.9 À 17
50. South Korea 266.1 Á -9
51. Venezuela 263.8 À 10
52. Vietnam 263.3 Á -23
53. China 262.1 Á -17
54. Aruba 260.5 Â New
55. Latvia 258.6 Â New
56. Seychelles 257.9 À 13
57. Philippines 257.7 Á -18
58. Dominican Republic 254.1 Á -7
59. Argentina 253.4 Á -9
60. Sri Lanka 253.3 Á -7
61. Dubai 251.3 Á -9
62. Trinidad and Tobago 249.7 Â New
63. Chile 249.2 Á -17
64. Tanzania 247.5 Á -9
65. Jamaica 246.8 Â New
66. Fiji 246.7 Á -35
67. Cuba 238.4 Á -5
68. India 234.9 Á -10
69. Malaysia 234.5 Á -24
70. Lithuania 232.7 Â New
71. Cape Verde 231.2 Á -4
72. Israel 213.8 À 4
73. Macedonia 210.1 Â 0
74. Costa Rica 206.5 Á -3
75. Abu Dhabi 205.6 À 5
76. Indonesia 205.1 Á -20
77. Kenya 203.2 Á -20
78. Bosnia and Herzegovina 200.5 À 3
79. Madagascar 199.3 Á -63
80. Morocco 199.3 Á -11
81. Tunisia 197.1 Á -6
82. Turkey 197.1 Á -27
83. Bulgaria 193.1 Á -4
84. Serbia 191.2 Â 0
85. Egypt 191.0 Á -2
86. Panama 190.6 Á -16
87. Laos 188.6 Â New
88. Jordan 171.2 Á -14
89. Qatar 162.6 Á -17
90. Gambia 160.1 Á -13
91. Colombia 151.8 Á -4
92. Russia 151.0 Á -6
93. Zimbabwe 146.6 Á -15
94. Oman 142.6 Á -12
95. Albania 134.1 Á -10
96. Ecuador 128.4 Á -33
97. Rwanda 126.7 Â New
98. Burma 123.4 Â New
99. Namibia 101.6 Â New
100. Romania 95.4 Á -12
101. Pakistan 86.6 Á -12

Travel Image 2015 25
* This destination was not listed in Travel Image 2014 since there was not sufficient data to rate this destination within this segment
YOUNG COUPLES WITHOUT CHILDRENTRAVEL IMAGE 2015
1. USA 415.0 À 4
2. England 403.0 À 1
3. Canada 393.2 À 6
4. Italy 388.9 À 10
5. Spain 384.3 À 7
6. Norway 383.4 À 10
7. Ireland 381.6 À 12
8. New Zealand 381.1 Á -7
9. Germany 378.6 À 16
10. Maldives 376.5 Á -6
11. Iceland 369.3 Â 0
12. France 368.6 À 6
13. Australia 364.3 Á -11
14. Portugal 360.9 À 7
15. Thailand 358.9 À 9
16. Wales 355.5 À 11
17. Denmark 352.7 Á -4
18. Austria 351.5 Á -3
19. Scotland 351.4 Á -12
20. Japan 347.4 Á -12
21. Croatia 342.9 À 14
22. Netherlands 342.6 À 6
23. Switzerland 341.4 Á -7
24. Greece 339.7 À 5
25. Malta 331.8 À 1
26. Czech Republic 322.5 À 10
27. Vietnam 311.4 À 7
28. Sweden 308.9 Á -5
29. Belgium 308.8 À 11
30. Hungary 308.4 À 16
31. Barbados 307.0 Â New
32. US Virgin Islands 305.8 Â *
33. Singapore 304.6 Á -12
34. Bahamas 302.2 Â New
35. Dubai 300.2 Á -2
36. Greenland 300.2 À 18
37. Cyprus 295.3 À 1
38. Finland 293.3 Á -7
39. China 289.7 À 4
40. Faroe Islands 285.6 À 8
41. Estonia 276.5 Â New
42. Malaysia 275.4 À 9
43. South Africa 275.2 À 2
44. Luxembourg 273.9 Â New
45. Chile 273.3 À 10
46. Brazil 266.3 Á -16
47. Nepal 263.0 Â *
48. Latvia 257.6 Â New
49. Poland 255.6 À 8
50. Mauritius 246.5 Á -40
51. Lithuania 242.7 Â New
52. Argentina 242.0 À 2
53. Indonesia 239.4 À 5
54. Costa Rica 237.4 Á -34
55. Cape Verde 234.6 Â *
56. Ecuador 234.0 À 7
57. Bulgaria 231.5 À 9
58. South Korea 228.3 À 6
59. Bosnia and Herzegovina 227.7 À 14
60. Sri Lanka 226.9 Á -21
61. Tanzania 224.8 Â *
62. Laos 223.0 Â New
63. Philippines 222.1 Á -31
64. India 216.1 Á -5
65. Mexico 215.6 Á -28
66. Puerto Rico 212.1 Á -24
67. Abu Dhabi 203.2 Á -6
68. Slovakia 200.0 Â 0
69. Kenya 198.1 Á -17
70. Zimbabwe 197.7 À 8
71. Cuba 192.9 Á -24
72. Slovenia 190.5 Á -10
73. Madagascar 184.9 Â *
74. Burma 184.3 Â New
75. Egypt 183.4 Á -4
76. Jamaica 182.9 Â New
77. Morocco 182.8 Á -10
78. Israel 175.9 Á -3
79. Namibia 173.4 Â New
80. Gambia 171.4 Á -4
81. Trinidad and Tobago 169.2 Â New
82. Dominican Republic 166.4 Á -38
83. Seychelles 166.4 Â *
84. Venezuela 162.7 Â *
85. Tunisia 160.4 Á -21
86. Turkey 160.4 Á -25
87. Jordan 138.0 Á -18
88. Aruba 130.9 Â New
89. Russia 128.0 Á -12
90. Fiji 120.2 Á -49
91. Peru 120.2 Á -34
92. Serbia 98.1 Á -22
93. Oman 92.6 Â *
94. Albania 91.4 Â *
95. Macedonia 79.5 Á -24
96. Qatar 78.1 Á -47
97. Panama 64.1 Â *
98. Romania 57.6 Á -24
99. Colombia 30.4 Á -49
100. Pakistan -47.1 Â *
101. Rwanda -79.8 ÂNew
Singles People living alone 28.9%
Young couples without children Couples age 18-40 12.2%
Families with children Families with children under 17 living at home
28.0%
Older couples Couples age 50+ with no children living at home
24.8%
Outside segments 6.0%
THE FOUR SEGMENTS

26 Travel Image 2015
© K
enya
FAMILIES WITH CHILDRENTRAVEL IMAGE 2015
1. Spain 400.4 À 11
2. USA 396.9 Â 0
3. Italy 395.9 À 2
4. Denmark 394.9 À 4
5. Australia 390.9 À 6
6. England 388.6 Á -5
7. Iceland 383.4 À 2
8. Norway 382.2 À 5
9. Scotland 378.6 Á -3
10. New Zealand 371.5 À 17
11. Netherlands 368.4 À 15
12. Austria 365.8 À 3
13. Germany 364.7 À 10
14. Ireland 364.3 À 5
15. Japan 360.2 À 19
16. Switzerland 357.8 À 5
17. France 349.5 À 7
18. Sweden 348.9 Á -11
19. Madagascar 348.7 Á -3
20. Mauritius 348.4 À 27
21. Wales 344.4 Á -1
22. Bahamas 343.9 Â New
23. Portugal 339.5 Á -13
24. Greece 338.4 À 8
25. Finland 338.3 À 4
26. Luxembourg 332.2 Â New
27. Croatia 329.7 À 11
28. Canada 329.1 Á -25
29. Thailand 327.5 Á -7
30. Jamaica 322.7 Â New
31. Cyprus 317.3 À 6
32. Malta 311.4 Á -7
33. Czech Republic 310.7 À 6
34. Puerto Rico 310.3 À 28
35. Estonia 306.5 Â New
36. Dubai 305.0 À 8
37. Greenland 304.7 À 4
38. Dominican Republic 303.8 À 12
39. Belgium 302.9 Á -3
40. Maldives 302.4 Á -26
41. Nepal 298.5 À 12
42. Malaysia 294.8 À 3
43. Singapore 293.5 Á -15
44. Brazil 293.3 À 2
45. Seychelles 292.4 Á -42
46. Cape Verde 292.1 À 2
47. Hungary 291.8 Á -5
48. Fiji 290.5 Á -31
49. China 289.9 Á -9
50. Indonesia 288.4 À 2
51. Philippines 288.4 À 10
52. Aruba 283.8 Â New
53. Barbados 280.6 Â New
54. Faroe Islands 279.6 Á -21
55. US Virgin Islands 279.2 Á -25
56. Latvia 277.2 Â New
57. Cuba 277.1 Á -2
58. Vietnam 275.2 Á -9
59. Lithuania 271.8 Â New
60. Venezuela 271.5 À 27
61. Poland 270.5 Á -2
62. Mexico 267.6 Á -8
63. Morocco 262.8 À 6
64. Kenya 261.8 À 2
65. Costa Rica 259.7 Á -22
66. Argentina 257.6 Á -31
67. Peru 257.0 Á -36
68. Slovakia 253.6 Á -5
69. Chile 251.0 Á -4
70. Abu Dhabi 245.8 Á -15
71. Jordan 237.6 À 10
72. Laos 237.4 Â New
73. Ecuador 235.4 Á -2
74. Namibia 234.4 Â New
75. India 230.6 Á -3
76. South Africa 228.6 Á -15
77. Slovenia 225.9 Á -19
78. Macedonia 225.6 Á -14
79. South Korea 225.0 Á -4
80. Bulgaria 209.0 Á -12
81. Egypt 206.1 Á -7
82. Colombia 196.2 Á -2
83. Trinidad and Tobago 191.3 Â New
84. Israel 188.4 Á -17
85. Tanzania 184.9 Á -6
86. Bosnia and Herzegovina 178.6 Á -1
87. Qatar 172.1 Á -17
88. Zimbabwe 172.0 Â 0
89. Albania 164.8 Á -6
90. Tunisia 155.3 Á -13
91. Turkey 155.3 Á -39
92. Gambia 153.2 Á -6
93. Serbia 149.0 Á -15
94. Burma 144.4 Â New
95. Rwanda 142.7 Â New
96. Russia 142.6 Á -14
97. Sri Lanka 130.5 Á -21
98. Oman 106.1 Á -25
99. Panama 95.3 Á -42
100. Romania 90.1 Á -16
101. Pakistan 79.0 Á -12
Travel Image 2015 27
© V
isit
Flan
ders
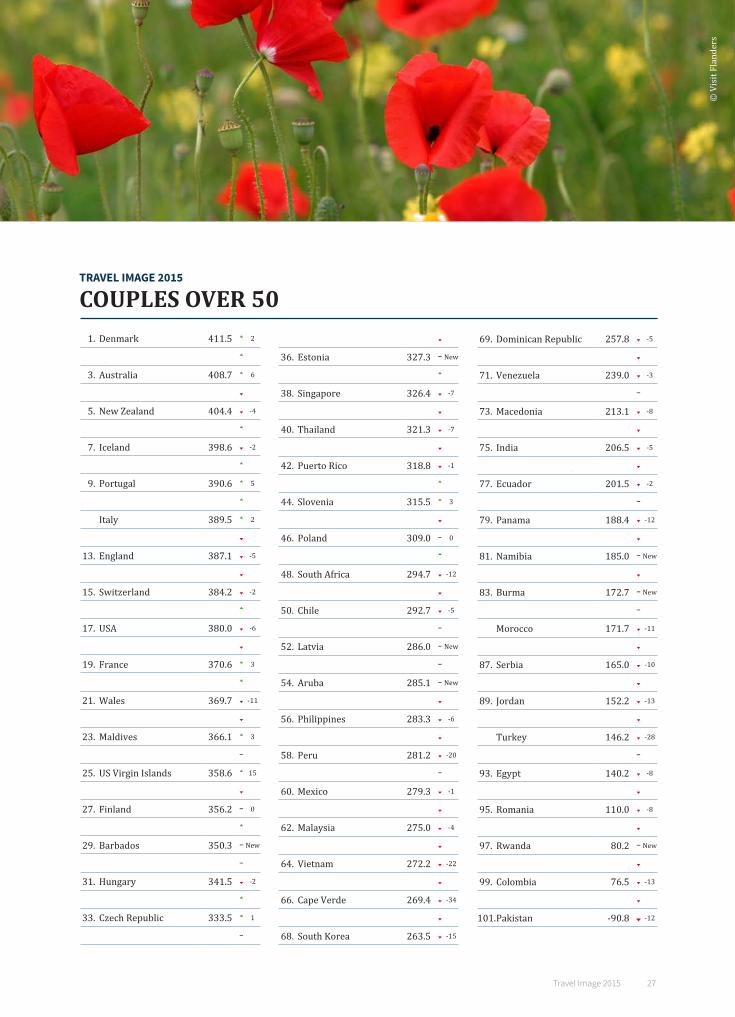
COUPLES OVER 50TRAVEL IMAGE 2015
1. Denmark 411.5 À 2
2. Spain 409.0 À 5
3. Australia 408.7 À 6
4. Scotland 407.6 Á -2
5. New Zealand 404.4 Á -4
6. Sweden 399.7 À 13
7. Iceland 398.6 Á -2
8. Norway 395.8 À 13
9. Portugal 390.6 À 5
10. Germany 389.5 À 5
11. Italy 389.5 À 2
12. Austria 388.6 Á -8
13. England 387.1 Á -5
14. Ireland 385.8 Á -8
15. Switzerland 384.2 Á -2
16. Canada 380.7 À 1
17. USA 380.0 Á -6
18. Greenland 378.5 Á -2
19. France 370.6 À 3
20. Netherlands 370.6 À 4
21. Wales 369.7 Á -11
22. Faroe Islands 368.4 Á -2
23. Maldives 366.1 À 3
24. Japan 361.5 Â 0
25. US Virgin Islands 358.6 À 15
26. Malta 358.0 Á -1
27. Finland 356.2 Â 0
28. Mauritius 352.3 À 11
29. Barbados 350.3 Â New
30. Bahamas 345.9 Â New
31. Hungary 341.5 Á -2
32. Seychelles 335.6 À 17
33. Czech Republic 333.5 À 1
34. Luxembourg 331.7 Â New
35. Greece 329.9 Á -7
36. Estonia 327.3 Â New
37. Belgium 327.0 À 6
38. Singapore 326.4 Á -7
39. Brazil 325.8 Á -2
40. Thailand 321.3 Á -7
41. Cyprus 319.8 Á -11
42. Puerto Rico 318.8 Á -1
43. Slovakia 318.2 À 12
44. Slovenia 315.5 À 3
45. Croatia 312.7 Á -10
46. Poland 309.0 Â 0
47. Cuba 301.8 À 4
48. South Africa 294.7 Á -12
49. Madagascar 293.3 Á -1
50. Chile 292.7 Á -5
51. Trinidad and Tobago 291.6 Â New
52. Latvia 286.0 Â New
53. Jamaica 285.6 Â New
54. Aruba 285.1 Â New
55. Sri Lanka 284.7 Á -11
56. Philippines 283.3 Á -6
57. Argentina 282.4 Á -3
58. Peru 281.2 Á -20
59. Lithuania 280.6 Â New
60. Mexico 279.3 Á -1
61. Nepal 276.5 Á -4
62. Malaysia 275.0 Á -4
63. Fiji 273.5 Á -2
64. Vietnam 272.2 Á -22
65. China 271.6 Á -9
66. Cape Verde 269.4 Á -34
67. Dubai 264.4 Á -4
68. South Korea 263.5 Á -15
69. Dominican Republic 257.8 Á -5
70. Indonesia 240.8 Á -1
71. Venezuela 239.0 Á -3
72. Israel 214.9 Â 0
73. Macedonia 213.1 Á -8
74. Costa Rica 212.8 Á -8
75. India 206.5 Á -5
76. Bosnia and Herzegovina 201.8 Á -5
77. Ecuador 201.5 Á -2
78. Qatar 200.7 Â 0
79. Panama 188.4 Á -12
80. Kenya 186.0 Á -20
81. Namibia 185.0 Â New
82. Tanzania 182.3 Á -30
83. Burma 172.7 Â New
84. Bulgaria 171.7 Â 0
85. Morocco 171.7 Á -11
86. Abu Dhabi 165.1 Á -12
87. Serbia 165.0 Á -10
88. Oman 154.6 Á -6
89. Jordan 152.2 Á -13
90. Tunisia 146.2 Á -9
91. Turkey 146.2 Á -28
92. Laos 143.4 Â New
93. Egypt 140.2 Á -8
94. Gambia 122.9 Á -15
95. Romania 110.0 Á -8
96. Russia 98.0 Á -16
97. Rwanda 80.2 Â New
98. Zimbabwe 79.7 Á -15
99. Colombia 76.5 Á -13
100. Albania 70.4 Á -12
101. Pakistan -90.8 Á -12

28 Travel Image 2015
TRAVEL IMAGE 2015
AGE GROUPSHere you can see the image index as split over thethree age groups across the four Nordic countries.
TRAVEL IMAGE 2015
AGE GROUP 18-34
1. USA 398.8 À 1
2. England 385.8 Á -1
3. Spain 382.1 À 4
4. New Zealand 380.6 À 1
5. Norway 377.8 À 8
6. Italy 377.5 À 2
7. Germany 375.9 À 11
8. Denmark 372.0 À 4
9. Australia 364.3 Á -6
10. Japan 358.2 À 11
11. France 352.7 À 13
12. Scotland 347.3 Á -8
13. Iceland 346.2 À 2
14. Sweden 346.0 À 6
15. Netherlands 343.1 À 11
16. Ireland 340.2 À 7
17. Austria 338.8 Á -3
18. Switzerland 338.2 Á -2
19. Finland 336.5 À 11
20. Thailand 334.7 Á -10
21. Portugal 333.5 Á -4
22. Wales 331.0 Â 0
23. Canada 329.9 Á -17
24. Greece 325.1 À 3
25. Croatia 318.4 À 12
26. Maldives 297.8 À 14
27. Malta 296.8 À 5
28. Barbados 295.1 Â New
29. Madagascar 294.2 Á -20
30. Luxembourg 293.7 Â New
31. Czech Republic 293.4 À 3
32. Greenland 291.2 À 12
33. Bahamas 289.1 Â New
34. Estonia 287.6 Â New
35. Mauritius 287.5 À 15
36. Cyprus 287.0 Á -1
37. Belgium 281.5 À 1
38. Singapore 280.2 Á -19
39. Hungary 278.9 À 12
40. Nepal 278.3 À 40
41. Dubai 275.5 Á -12
42. Vietnam 275.4 Á -6
43. Cape Verde 269.6 À 16
44. Malaysia 266.9 Á -5
45. US Virgin Islands 266.1 À 1
46. Faroe Islands 264.3 À 1
47. Jamaica 260.7 Â New
48. China 260.1 Á -17
49. Brazil 257.7 Á -21
50. Poland 255.4 À 11
51. Latvia 253.8 Â New
52. Mexico 252.1 Á -11
53. India 248.0 À 17
54. Puerto Rico 244.9 Á -12
55. Philippines 243.3 Á -22
56. Indonesia 243.1 Á -3
57. South Africa 241.8 Á -8
58. Dominican Republic 234.2 Á -15
59. Aruba 233.6 Â New
60. South Korea 233.6 Á -4
61. Chile 233.0 Á -13
62. Abu Dhabi 231.0 À 11
63. Seychelles 229.9 À 1
64. Argentina 225.1 Á -19
65. Morocco 223.8 À 6
66. Fiji 223.7 Á -41
67. Jordan 222.7 À 10
68. Venezuela 222.4 Á -6
69. Costa Rica 219.2 Á -12
70. Cuba 219.0 Á -5
71. Laos 215.8 Â New
72. Bulgaria 215.4 Á -6
73. Lithuania 210.2 Â New
74. Ecuador 208.7 Á -16
75. Tanzania 208.3 Á -1
76. Peru 206.3 Á -24
77. Egypt 204.4 À 1
78. Slovenia 202.2 Á -9
79. Slovakia 193.1 Á -3
80. Bosnia and Herzegovina 190.0 À 6
81. Kenya 189.5 Á -21
82. Namibia 181.7 Â New
83. Macedonia 180.0 Á -8
84. Sri Lanka 179.1 Á -21
85. Colombia 177.0 Á -3
86. Tunisia 176.8 Á -18
87. Turkey 176.8 Á -32
88. Zimbabwe 172.9 Á -16
89. Trinidad and Tobago 171.8 Â New
90. Gambia 170.4 Á -6
91. Burma 164.1 Â New
92. Israel 158.1 Á -13
93. Russia 149.8 Á -8
94. Serbia 142.6 Á -13
95. Albania 135.3 Á -12
96. Qatar 134.8 Á -40
97. Rwanda 122.3 Â New
98. Panama 120.6 Á -31
99. Oman 101.3 Á -11
100. Romania 52.3 Á -13
101. Pakistan 27.5 Á -12

Travel Image 2015 29
TRAVEL IMAGE 2015
AGE GROUP 35-49
1. Australia 409.3 À 1
2. Spain 404.5 À 10
3. Scotland 403.2 À 1
4. Denmark 401.4 À 9
5. Italy 398.7 À 2
6. USA 395.2 Á -1
7. Ireland 394.8 À 9
8. Iceland 391.4 À 9
9. Maldives 386.5 Á -1
10. England 385.8 Á -7
11. Norway 378.6 À 7
12. New Zealand 377.4 Á -11
13. Austria 373.5 À 1
14. Bahamas 373.4 Â New
15. Netherlands 372.8 À 8
16. Japan 368.7 À 13
17. Portugal 368.1 À 5
18. Canada 362.3 Á -12
19. Wales 361.1 Á -4
20. Germany 361.0 À 1
21. Switzerland 356.4 Á -2
22. Sweden 354.9 Á -11
23. France 348.1 À 3
24. Greece 347.9 À 5
25. Brazil 343.6 À 19
26. Mauritius 341.1 À 9
27. Finland 336.3 À 5
28. Puerto Rico 335.6 À 18
29. Malta 332.8 Á -9
30. Thailand 332.8 Á -2
31. Singapore 331.3 Â 0
32. Belgium 330.9 À 5
33. Czech Republic 330.7 À 10
34. Luxembourg 328.8 Â New
35. Cyprus 326.6 Á -1
36. Seychelles 323.9 À 5
37. Croatia 323.1 À 15
38. Faroe Islands 322.2 Â 0
39. Cuba 312.8 À 14
40. Dominican Republic 312.5 À 14
41. Fiji 311.7 Á -2
42. Hungary 308.5 Â 0
43. Philippines 307.5 À 17
44. US Virgin Islands 307.4 Á -8
45. Estonia 307.3 Â New
46. Greenland 306.1 Á -22
47. Aruba 302.8 Â New
48. Dubai 300.5 À 1
49. Barbados 298.3 Â New
50. Nepal 294.9 Á -22
51. Jamaica 291.6 Â New
52. Costa Rica 290.4 À 6
53. Vietnam 288.5 Á -20
54. Argentina 287.0 Á -14
55. Chile 284.7 À 2
56. Mexico 281.1 Á -8
57. Poland 280.2 À 4
58. China 280.1 Á -8
59. Malaysia 278.8 Á -14
60. Latvia 271.8 Â New
61. Lithuania 271.7 Â New
62. Slovakia 268.8 Â 0
63. Venezuela 260.5 À 19
64. Abu Dhabi 258.6 À 5
65. Slovenia 257.0 Á -2
66. Kenya 256.9 À 2
67. South Africa 256.5 Á -12
68. Trinidad and Tobago 254.1 Â New
69. Indonesia 250.3 Á -13
70. Madagascar 250.2 Á -60
71. Peru 249.2 Á -46
72. Ecuador 245.2 Á -6
73. Macedonia 242.0 Á -9
74. Cape Verde 241.9 Á -23
75. South Korea 234.5 À 3
76. Sri Lanka 228.6 Á -5
77. Morocco 223.4 Á -3
78. Laos 219.9 Â New
79. India 215.1 Á -14
80. Bosnia and Herzegovina 213.3 Á -1
81. Israel 210.6 Á -8
82. Tanzania 209.8 Á -12
83. Bulgaria 208.2 Á -6
84. Qatar 206.2 Á -17
85. Namibia 204.1 Â New
86. Egypt 189.3 Á -10
87. Colombia 187.7 Á -15
88. Zimbabwe 182.3 Á -2
89. Serbia 171.3 Á -4
90. Albania 169.8 Á -3
91. Jordan 167.8 Á -8
92. Tunisia 161.2 Á -11
93. Turkey 161.2 Á -33
94. Oman 159.7 Á -19
95. Panama 152.8 Á -48
96. Gambia 145.4 Á -16
97. Russia 135.1 Á -13
98. Romania 118.4 Á -10
99. Burma 105.6 Â New
100. Rwanda 95.0 Â New
101. Pakistan 84.4 Á -12
© V
isit
Brita
in

30 Travel Image 2015
TRAVEL IMAGE 2015
AGE GROUP 50+
1. Denmark 405.0 À 1
2. Scotland 404.8 À 1
3. Spain 403.8 À 1
4. New Zealand 403.5 Á -3
5. Iceland 395.7 À 5
6. Sweden 395.6 À 15
7. Australia 395.1 À 1
8. Italy 394.8 Á -2
9. Germany 391.9 À 2
10. Portugal 391.0 À 6
11. Austria 390.2 Á -6
12. Norway 390.0 À 8
13. Ireland 387.2 Á -4
14. England 386.7 Á -7
15. USA 386.1 Á -1
16. Switzerland 384.0 Á -3
17. Greenland 377.5 Á -2
18. Netherlands 376.1 À 6
19. Wales 374.2 Á -2
20. Faroe Islands 373.8 Á -2
21. Canada 373.3 Á -9
22. France 371.0 Â 0
23. Maldives 361.7 À 2
24. Japan 359.9 À 2
25. Malta 358.9 À 2
26. Finland 357.7 Á -3
27. Mauritius 355.7 À 7
28. Hungary 350.5 À 4
29. Czech Republic 340.4 À 7
30. Luxembourg 337.6 Â New
31. Greece 336.7 Á -3
32. Barbados 332.3 Â New
33. Singapore 330.7 Á -3
34. Bahamas 329.4 Â New
35. US Virgin Islands 328.7 À 7
36. Thailand 328.2 Á -3
37. Estonia 327.1 Â New
38. Seychelles 325.2 À 5
39. Cyprus 323.1 Á -8
40. Puerto Rico 322.1 À 5
41. Slovakia 319.7 À 19
42. Belgium 318.7 Á -5
43. Croatia 318.7 Á -2
44. Fiji 318.2 Â 0
45. Slovenia 315.7 À 10
46. Poland 315.2 À 5
47. Brazil 309.7 Á -12
48. Philippines 303.0 À 4
49. Trinidad and Tobago 302.8 Â New
50. Peru 301.3 Á -12
51. South Africa 298.5 Á -10
52. Madagascar 297.9 Á -3
53. Nepal 294.1 Á -6
54. Cuba 288.3 Á -1
55. Mexico 287.2 À 6
56. Jamaica 287.1 Â New
57. Latvia 286.2 Â New
58. Sri Lanka 279.3 Á -12
59. Lithuania 278.6 Â New
60. Chile 278.2 Á -12
61. China 277.7 Á -7
62. Cape Verde 276.1 Á -33
63. Vietnam 275.3 Á -24
64. Malaysia 274.3 Á -8
65. South Korea 274.3 Á -6
66. Argentina 270.2 Á -16
67. Aruba 258.2 Â New
68. Venezuela 257.1 À 2
69. Dominican Republic 255.2 Á -7
70. Indonesia 252.1 Á -3
71. Dubai 250.7 Á -8
72. Tanzania 222.1 Á -15
73. India 221.0 Á -4
74. Israel 220.1 À 3
75. Macedonia 214.1 Á -11
76. Kenya 213.4 Á -17
77. Ecuador 207.1 Á -5
78. Costa Rica 199.4 Á -13
79. Bosnia and Herzegovina 198.8 Á -5
80. Qatar 198.4 Á -4
81. Namibia 196.9 Â New
82. Panama 196.5 Á -14
83. Serbia 174.1 Á -4
84. Bulgaria 173.2 Á -3
85. Morocco 173.0 Á -12
86. Laos 168.1 Â New
87. Jordan 163.9 Á -12
88. Burma 158.2 Â New
89. Oman 149.4 Á -11
90. Tunisia 145.0 Á -10
91. Turkey 145.0 Á -25
92. Egypt 144.4 Á -8
93. Gambia 129.6 Á -11
94. Abu Dhabi 125.9 Á -23
95. Russia 107.0 Á -10
96. Rwanda 106.2 Â New
97. Romania 102.8 Á -9
98. Zimbabwe 97.5 Á -15
99. Colombia 72.6 Á -13
100. Albania 66.2 Á -13
101. Pakistan -70.0 Á -12
© T
ouri
sm N
ew Z
eala
nd

Travel Image 2015 31 Travel Image 2014 31
© T
emar
eson
NEPAL – A CLIMBER WITHIN
THE HIMALAYASMention Nepal and a lot of people probably think of mountains:
Mount Everest and breathtaking views of the Himalayas. Nepal is a mecca for climbers and trekkers, attracting visitors that are look-
ing for an active holiday. In Travel Image 2015 Nepal has improved its image more than any other destination – climbing 15 places
compared to the 2014 list.

Travel Image 2014 32
The five countries that have improved their image the most in the 2015 analysis are: Nepal, Poland, Slovakia, Mauritius and Croatia. So what are the
reasons for this?
“I would say the diversity, the nature, the value for money and the improved service and quality of hotels and restaurants. When we do our guided city tours, people are knocked out by the fantastic colours! Nepal is a paradise for people who are interested in photogra-phy,” explains Stefan Maurbakken, Product & Contract-ing Manager at Temaresor/TUI Nordic, a Nordic tour operator that organises guided tours in Nepal.
“We have also seen a growing interest in active travel, and we can see that more airlines are flying in to Kath-mandu; Turkish Airlines just recently started flying there from the Nordics, for example. Nepal is also a gateway to Bhutan and India, and it is very easy to get a visa. Travellers will get a visa on arrival; this also af-fects the image of the destination,” Stefan Maurbakken continues.
VALUE FOR MONEYNordic people are sensitive to exchange rates and often seize the opportunity to travel to a destination where they get the most value for money.
“For Poland I think the value for money aspect is very important, as well as the improved flight connections, especially from Norway,” says Malgorzata Hudyma, Di-rector Nordics & Baltics at the Polish Tourist Organi-sation.
“The 2012 UEFA European Championship in football was also very important for boosting the image of our country,” Malgorzata Hudmya continues.
SERVICE AND KNOWLEDGE Mauritius’ major strengths are service, well-educated hotel staff, quality food and value for money, according to Lotta Kronstam, Founder and Business Developer at Lime Travel, a Swedish travel agency that has extensive experience with Mauritius as a destination.
“Most hotels offer sports activities like water skiing, windsurfing, kayaking, tennis and gyms at no extra cost, which is a very good concept for keeping your guests happy. The hotel properties and the surround-ing gardens are also very spacious.”
And last but not least:
“Mauritius collaborates very closely with the hotels and airlines. For many years they have invited the travel trade and product managers to experience 10-15 dif-ferent hotels for a week, try out the golf courses, the different excursions and get to know the destination. This is a great advantage. There is so much competi-tion, and knowledge is the most valuable asset. A cus-tomer is more likely to buy a product that the travel agent knows by heart,” Lotta Kronstam explains.
SEEING IS BELIEVINGCroatia has been a booming destination in the Mediter-ranean for the past couple of years. Paul Sikic, Nordic Director at the Croatian Tourist Board, has a clear opin-ion on why this is:
“You cannot improve an image in an artificial way. A better image means that the increasing number of Nordic travellers that have visited Croatia are satisfied with their experiences and are spreading the word to their friends.”
THE TOP 5 COUNTRIES THAT HAVE IMPROVED THEIR IMAGE THE MOST IN THE 2015 IMAGE REPORT:
Rank Index rank Country Jump
1 44 Nepal +15
2 45 Poland +12
3 54 Slovakia +11
4 32 Mauritius +10
5 31 Croatia +8
© T
emar
esor
© T
emar
esor
32 Travel Image 2015

Travel Image 2015 33
© T
ouri
sm K
enya
AWARENESS & ATTRACTIVENESS
The two central elements of the image index are awareness and attractiveness. Here are the lists showing the ranking for
each of these two parameters.
TRAVEL IMAGE 2015

34 Travel Image 2015
TRAVEL IMAGE 2015
AWARENESS
TRAVEL IMAGE 2015
AWARENESSAwareness is calculated based on how many respondents know of a given destination as well as how many feel that they can actually rank it – including, of course, those that
have visited the destination themselves.
The complete ranking of destinations rated byawareness grouped acrossthe four Nordic countries,segments and age groups is
available. Contact Related at [email protected]
1. Sweden 170.8 Â 0
2. Denmark 156.5 Â 0
3. Norway 148.5 Â 0
4. Spain 144.0 À 2
5. Germany 143.7 Á -1
6. Italy 126.0 À 3
7. Greece 125.7 Â 0
8. England 125.6 Á -3
9. France 124.1 Á -1
10. Finland 116.2 Â 0
11. Netherlands 108.3 À 1
12. USA 107.7 À 1
13. Austria 106.5 Á -2
14. Estonia 94.8 Â New
15. Switzerland 93.5 Â 0
16. Portugal 91.0 À 1
17. Belgium 88.9 Á -1
18. Poland 88.0 À 1
19. Scotland 86.6 Á -1
20. Thailand 85.7 À 1
21. Cyprus 85.6 Á -1
22. Czech Republic 83.4 Â 0
23. Iceland 80.7 À 1
24. Ireland 80.5 Á -1
25. Russia 80.4 Â 0
26. Australia 78.2 Â 0
27. Hungary 78.2 À 3
28. Canada 77.0 Â 0
29. Egypt 75.9 Á -2
30. Luxembourg 73.3 Â New
31. Croatia 72.8 Á -1
32. Bulgaria 71.1 Â 0
33. Malta 69.9 Á -1
34. New Zealand 69.5 Â 0
35. Japan 68.3 Â 0
36. China 67.9 Â 0
37. Latvia 67.3 Â New
38. Wales 66.2 Â 0
39. Brazil 66.1 Â 0
40. Mexico 64.5 Â 0
41. Bahamas 64.0 Â New
42. Morocco 63.6 Á -1
43. Singapore 63.3 Â 0
44. Israel 62.8 Á -6
45. Lithuania 62.8 Â New
46. Faroe Islands 61.9 Â 0
47. Barbados 61.5 Â New
48. Dubai 61.2 Á -3
49. India 60.8 Á -7
50. Greenland 60.2 Á -6
51. South Africa 59.2 Á -1
52. Tunisia 59.2 Á -4
53. Turkey 59.2 Á -37
54. Jamaica 58.6 Â New
55. Maldives 57.9 Á -2
56. Cuba 57.8 Á -5
57. Romania 57.8 Á -8
58. Slovakia 57.2 Á -9
59. Slovenia 54.1 Á -7
60. Chile 53.9 Á -4
61. Philippines 53.8 Á -7
62. Vietnam 53.8 Á -7
63. Malaysia 53.5 Á -2
64. Mauritius 53.5 À 3
65. Pakistan 52.0 Á -3
66. Kenya 51.9 Á -6
67. Argentina 51.4 Á -4
68. Serbia 51.4 Á -9
69. Fiji 51.3 À 5
70. South Korea 51.3 Á -4
71. Bosnia and Herzegovina 51.0 Á -12
72. Indonesia 50.8 Á -15
73. Puerto Rico 50.8 Á -9
74. Colombia 50.4 Á -6
75. Dominican Republic 50.0 Á -5
76. Costa Rica 49.8 Á -7
77. Peru 49.6 Á -5
78. Sri Lanka 49.4 Á -12
79. Venezuela 49.1 Á -7
80. Madagascar 48.8 Á -9
81. Seychelles 48.8 Á -2
82. Tanzania 47.5 Á -5
83. Nepal 47.3 Á -8
84. Rwanda 45.9 Â New
85. Jordan 45.4 Á -9
86. Macedonia 44.2 Á -3
87. US Virgin Islands 43.5 À 2
88. Qatar 43.3 Á -2
89. Burma 43.2 Â New
90. Zimbabwe 43.1 Á -11
91. Gambia 42.7 Á -11
92. Cape Verde 42.5 Á -7
93. Namibia 42.5 Â New
94. Abu Dhabi 41.8 Á -13
95. Ecuador 41.8 Á -12
96. Laos 41.5 Â New
97. Panama 41.5 Á -9
98. Albania 41.2 Á -14
99. Trinidad and Tobago 40.8 Â New
100. Oman 36.1 Á -12
101. Aruba 32.2 ÂNew

Travel Image 2015 35
TRAVEL IMAGE 2015
ATTRACTIVENESS
TRAVEL IMAGE 2015
ATTRACTIVENESSAttractiveness is calculated based on the respondents’
experience with – or impression of – a given destination. That is, how excited they are about the experience they
actually had, or how positive their impression of the country is without having visited.
The complete ranking of destinations rated by attractiveness grouped across
the four Nordic countries, segments and age groups is
available. Contact Related at [email protected]
1. Scotland 321.6 À 1
2. New Zealand 320.5 Á -1
3. Australia 318.3 Â 0
4. USA 317.6 Â 0
5. Iceland 312.9 À 5
6. Italy 310.5 À 3
7. Ireland 309.9 À 5
8. Spain 309.5 À 5
9. England 308.3 Á -2
10. Portugal 303.8 À 4
11. Wales 303.3 Á -3
12. Austria 300.6 Á -1
13. Denmark 300.3 À 3
14. Japan 298.4 À 6
15. Germany 295.4 À 6
16. Switzerland 293.8 Á -1
17. Canada 293.6 Á -12
18. Netherlands 292.7 À 9
19. Norway 292.7 À 8
20. Maldives 280.6 À 5
21. France 280.0 À 8
22. Greenland 280.0 Á -4
23. Sweden 271.4 À 5
24. Malta 271.2 Â 0
25. Mauritius 269.4 À 15
26. Luxembourg 267.8 Â New
27. US Virgin Islands 267.2 À 4
28. Finland 267.0 À 8
29. Faroe Islands 266.9 Á -7
30. Thailand 266.1 Á -7
31. Czech Republic 264.7 À 7
32. Croatia 264.2 À 9
33. Singapore 262.7 Á -14
34. Bahamas 259.6 Â New
35. Hungary 259.6 À 5
36. Greece 259.1 Á -1
37. Puerto Rico 251.5 À 9
38. Cyprus 250.6 Á -1
39. Barbados 250.4 Â New
40. Belgium 245.0 À 3
41. Estonia 244.5 Â New
42. Nepal 242.4 À 15
43. Seychelles 242.1 Á -1
44. Brazil 239.8 Á -11
45. Aruba 231.4 Â New
46. Madagascar 230.1 Á -28
47. Vietnam 228.0 Á -17
48. Philippines 226.6 À 2
49. Slovakia 224.7 À 17
50. Malaysia 224.0 Á -5
51. Cape Verde 223.3 Á -7
52. Poland 223.2 À 13
53. Latvia 221.2 Â New
54. Slovenia 221.0 À 7
55. Dubai 219.0 Á -3
56. Dominican Republic 218.9 Á -2
57. Mexico 217.4 Á -6
58. Jamaica 216.5 Â New
59. China 216.1 Á -10
60. Cuba 214.5 Á -4
61. South Africa 214.0 Á -13
62. Chile 213.3 Á -9
63. Argentina 212.0 Á -16
64. Fiji 212.0 Á -31
65. Lithuania 208.7 Â New
66. Indonesia 203.3 Á -8
67. Venezuela 198.9 À 6
68. Trinidad and Tobago 198.0 Â New
69. Peru 197.9 Á -36
70. South Korea 190.1 Á -7
71. Costa Rica 186.6 Á -11
72. Sri Lanka 185.9 Á -17
73. Abu Dhabi 172.6 Á -1
74. Kenya 172.5 Á -15
75. India 170.9 Á -5
76. Ecuador 168.8 Á -7
77. Macedonia 168.2 Á -10
78. Tanzania 166.5 Á -16
79. Laos 159.4 Â New
80. Morocco 153.1 Á -6
81. Bosnia and Herzegovina 150.2 Á -2
82. Israel 149.0 Á -5
83. Namibia 146.2 Â New
84. Jordan 145.9 Á -9
85. Bulgaria 140.4 Á -5
86. Panama 121.6 Á -22
87. Serbia 121.3 Á -4
88. Qatar 117.7 Á -17
89. Tunisia 117.3 Á -11
90. Turkey 117.3 Á -21
91. Egypt 116.1 Á -7
92. Zimbabwe 112.7 Á -11
93. Gambia 105.7 Á -11
94. Colombia 104.1 Á -9
95. Burma 100.9 Â New
96. Oman 93.8 Á -20
97. Albania 79.1 Á -11
98. Russia 64.9 Á -11
99. Rwanda 54.8 Â New
100. Romania 45.4 Á -12
101. Pakistan -34.9 Á -12

36 Travel Image 2015
AWARENESS × ATTRACTIVENESS
TRAVEL IMAGE 2015
By combining the two factors – awareness and attractiveness – in a matrix, we can create a visual representation of how the destinations rank both in
relation to the two factors and to their competitors.
This gives us some insight into which destinations can benefit from working on building up their product, which destinations can benefit from marketing more to the Nordic travellers, and which are so-called “star” destinations that are currently ranking high in both awareness and attractiveness.
The following pages show the placement of the 101 destinations on the two dimensional matrix – and how they’re ranked in relation to each other.
BUT WHAT DOES A PLACEMENT IN THE VARIOUS AREAS OF THE MATRIX ACTUALLY MEAN?
350
300
250
200
150
100
50
0
ATTRACTIVENESS
0 20 40 60 80 100 120 140 160 180
AWARENESS
“THE STARS”(HIGH AWARENESS – HIGH ATTRACTION)
“THE TALENTS”(LOW AWARENESS – HIGH ATTRACTION)
“THE EXTRAS”1
(HIGH AWARENESS – LOW ATTRACTION)
“THE UP-AND-COMERS”(LOW AWARENESS – LOW ATTRACTION)
1/ None of the 101 destinations listed in Travel Image 2015 are placed within this area.

Travel Image 2015 37
“THE TALENTS” (LOW AWARENESS – HIGH ATTRACTION)In the upper left quadrant, we find a lot of exciting destinations. Here are the desti-nations that seemingly have a very good product, but that not many know of. This means that there’s plenty opportunity for expanding the tourism for Nordic travel-lers, and if more tourists are desired, it might also be beneficial to increase the marketing budget to take advantage of the talent potential. These destinations aren’t neglecting their potential, but they may not be harnessing it fully – whether deliberately or not.
350
300
250
200
100
50
0
-50
ATTRACTIVENESS (+)
ATTRACTIVENESSATTRACTIVENESS
0 20 40 60 80 100 120 140 160 180
AWARENESSAWARENESS (-)
THAILAND
BAHAMASCROATIASINGAPORE
US VIRGIN ISLANDSFAROE ISLANDSMAURITIUS
LUXEMBOURG
CZECH REPUBLICHUNGARY
MALTA
BARBADOSPUERTO RICO
BRAZILSEYCHELLESNEPALBELGIUM
ESTONIA
CYPRUS
AUSTRALIANEW ZEALAND SCOTLAND
IRELANDICELAND
CANADA
PORTUGAL
SWITZERLANDJAPAN
WALES
GREENLANDMALDIVES
ABU DHABI INDIA
INDIA
KENYA
ECUADOR
LAOS
TANZANIA
ISRAELBOSNIA AND HERZEGOVINA
MOROCCO
ARGENTINA
POLAND
JAMAICA CHINA
FIJI LITHUANIA
SOUTH AFRICAMEXICO
COSTA RICA
PERUTRINIDAD AND TOBAGOVENEZUELA
SRI LANKA
SOUTH KOREA
CHILE
SLOVENIACUBA
DOMINICAN REPUBLICLATVIADUBAI
ARUBAVIETNAMMADAGASCAR
CAPE VERDEPHILIPPINESSLOVAKIAMALAYSIA
ALBANIA
ROMANIA
RWANDA
RUSSIA
PAKISTAN
SWEDEN
© M
aldi
ves M
arke
ting
& P
ublic
Rel
atio
ns C
orpo
ratio
n
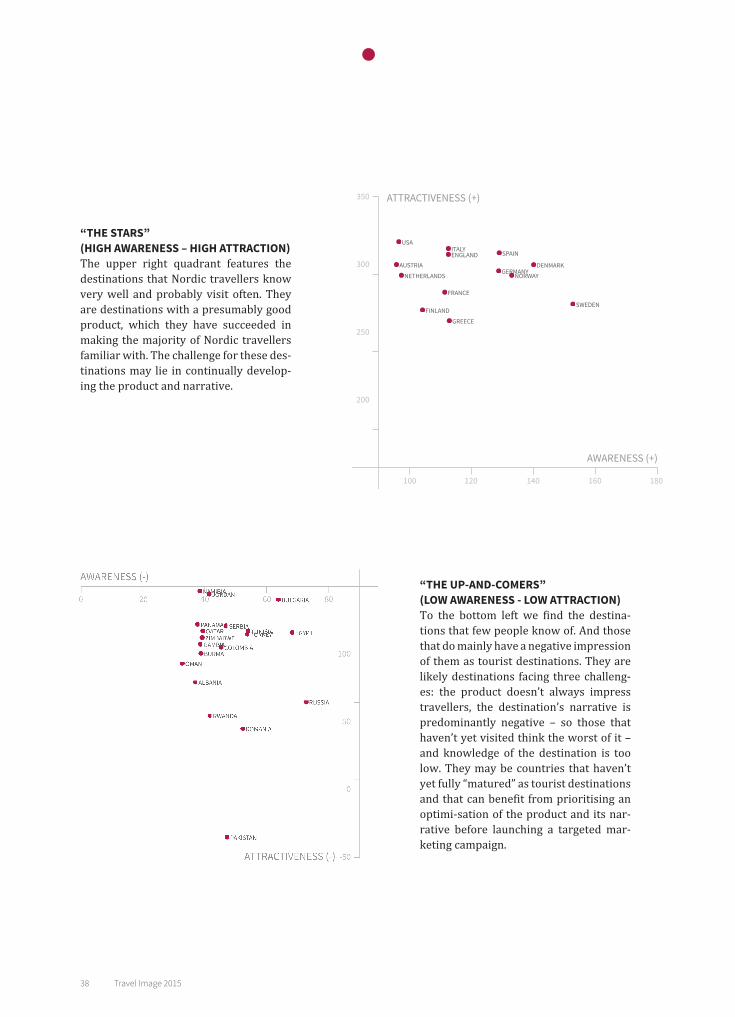
38 Travel Image 2015
“THE UP-AND-COMERS” (LOW AWARENESS - LOW ATTRACTION) To the bottom left we find the destina-tions that few people know of. And those that do mainly have a negative impression of them as tourist destinations. They are likely destinations facing three challeng-es: the product doesn’t always impress travellers, the destination’s narrative is predominantly negative – so those that haven’t yet visited think the worst of it – and knowledge of the destination is too low. They may be countries that haven’t yet fully “matured” as tourist destinations and that can benefit from prioritising an optimi-sation of the product and its nar-rative before launching a targeted mar-keting campaign.
“THE STARS” (HIGH AWARENESS – HIGH ATTRACTION)The upper right quadrant features the destinations that Nordic travellers know very well and probably visit often. They are destinations with a presumably good product, which they have succeeded in making the majority of Nordic travellers familiar with. The challenge for these des-tinations may lie in continually develop-ing the product and narrative.
350
300
250
200
100
50
0
-50
ATTRACTIVENESSATTRACTIVENESS
ATTRACTIVENESS (-)
0 20 40 60 80 100 120 140 160 180
AWARENESSAWARENESS (-)
DENMARKGERMANY
SPAIN
NORWAY
BULGARIAJORDANNAMIBIA
EGYPTTUNISIATURKEYPANAMA SERBIA
QATARZIMBABWE
ALBANIA
ROMANIA
RWANDA
RUSSIA
PAKISTAN
OMANBURMA
COLOMBIAGAMBIA
SWEDEN
350
300
250
200
100
50
0
-50
ATTRACTIVENESS (+)
ATTRACTIVENESSATTRACTIVENESS
0 20 40 60 80 100 120 140 160 180
AWARENESS (+)AWARENESS
DENMARKGERMANY
SPAIN
NORWAY
ENGLANDAUSTRIA
ITALYUSA
NETHERLANDS
FINLAND
GREECE
FRANCE
LAOS
BULGARIAJORDANNAMIBIA
ISRAEL
EGYPTTUNISIATURKEYPANAMA SERBIA
QATARZIMBABWE
BOSNIA AND HERZEGOVINA
MOROCCO
ALBANIA
ROMANIA
RWANDA
RUSSIA
PAKISTAN
OMANBURMA
COLOMBIAGAMBIA
SWEDEN

Travel Image 2015 39
Three times the realBaliwww.wernerlau.com
HEADOFFICE GERMANY Email: [email protected]: +49 40 692 105 38telefax: +49 40 692 105 39
Our three Boutique Hotels are located in the genuine Bali, in the north west and in the north east. Siddhartha Ocean Front Resort & Spa: HHHHH Star Hotel, 33 Bungalows and Villaswith a real good value for moneyAlam Anda Ocean Front Resort & Spa: HHHH Star Hotel, 28 Bungalows and Villas inauthentic Bali stylePondok Sari Beach Resort & Spa: HHH Star Hotel, 40 Bungalows and Villas is a hotel like no other else with exceptional rates
Travel Image 2014 39

40 Travel Image 2015
Director of Media Sales, Etraveli
In your opinion, what are the major threats to a destination image, and what can be done to mini-mize the damage for tourism?Besides all the external factors, I would say that the biggest mistake destinations tend to make is to put PR/marketing on hold. With a solid communication strategy and always present marketing activities, there will be less damage. Why not have crisis plans? When things happen that affect the market, there is a list of activities that can quickly be put into effect to counter-act any damage. Stopping communication is never an option. South Africa has fallen from 45 to 57, which is the best image for an African destination. Why do you think African destinations are suffering image is-sues right now? It’s a really complex issue with different external fac-tors involved. Unfortunately, it seems that the whole continent suffers from some regional issues. In terms of creating an image, there’s the risk that you as a des-tination become too defensive instead of pushing for-ward and presenting the world with a correct picture of your destination. For 34 out of 101 different destinations, 20% or more travellers have had a bad experience going there. Why do you think that is so common? Weather, the breakfast at the hotel or the service at the airport - it’s all part of the overall destination package. People think of a destination as the total experience, I guess. Travellers are nice but demanding people.
Head of Public Relations, Apollo, Denmark
What are your thoughts on Spain as a winner - climbing 7 places, from number 8 in 2014?To be honest, it doesn’t surprise me. Spain has everything for tourists in our part of the world! It of-fers a warm and sunny climate all year round. It has a tasty variety of food and wine, fascinating culture, architecture, sandy beaches, and rough mountains.
Why do you think African destinations are suffer-ing image issues right now? Africa has experienced some tough challenges when it comes to headlines in the media over the past year: Ebola in West Africa and political unrest in countries that are normally very popular with international leisure travellers. In your opinion, what are the major threats to a destination image, and what can be done to mini-mize the damage for tourism?I would say terrorism and political or financial unrest, as well as crime and environmental damage media stories.A destination needs a clear PR policy on how it wants to market itself and stay extremely focused on how to eliminate or minimize the above damage factors. For 34 out of 101 different destinations, 20% or more travellers have had a bad experience going there. Why do you think that is so common?I believe that a big part of your travel experience is all about building up expectations before arriving at the destination. It is therefore extremely important to market a destination in an authentic manner and not oversell the product and services.
WHAT ARE THE MAJOR THREATS TO A DESTINATION IMAGE?
A destination image is complex. What are the major threats to a destination, and what can be done to minimize the damage for tourism?
We asked four experts in the travel industry to share their thoughts and experiences.
Glenn BisgaardHelena Sjogren..

Travel Image 2015 41
Manager Nordic & Russia, VisitBritain
What are your thoughts on Spain as a winner - climbing 7 places, from number 8 in 2014?Spain is an amazing destination with a lot of great ex-periences for a wide range of travellers. To be honest, I was surprised it was number 8 last year!
Why do you think African destinations are suffer-ing image issues right now? I’m quite surprised by this result as I get the impression that South Africa (particularly Cape Town) is very in vogue at the moment. This sort of thing is always hard to analyse, as there are so many factors that contribute to people’s perceptions of a destination and sometimes not scoring well on a couple of factors can skew overall results. When I look at VisitBritain’s internal research, awareness is always a key factor in achieving a posi-tive image of Britain; people are heavily influenced by films, television and what they see in the news.
Have you ever travelled to a destination and been surprised that the image didn’t correspond with reality (for better or worse)?Constantly, and I think this is the essence of travel. One can spend hours researching to form an opinion. But travel is very much an individual experience and the people you meet (such as taxi drivers, airport staff, waiters, and hotel staff) is one factor you can’t control and it can play a very important factor in shaping your holiday.
For 34 out of 101 different destinations, 20% or more travellers have had a bad experience going there. Why do you think that is so common?Holidays are rarely 100% positive, or is that just me? They tend to be made up of a variety of experiences, just like life. But I think that this is about people’s ex-pectations versus reality. Travel companies are getting better at finding authentic experiences to suit their customers, and social media and review sites are ex-tremely powerful tools for the consumer to question how the destination is sold in the brochure.
Director Tourism Sweden, Innovation Norway
In your opinion, what are the major threats to a destination image, and what can be done to mini-mize the damage for tourism?A destination image is based upon several factors, such as demography, perception, experiences, influences from media and personal experiences. To minimize damage for the tourism industry, you should always strive to communicate facts and serve your audience with good, accessible and reliable information. Don’t oversell!
Why do you think African destinations are suffer-ing image issues right now? Africa is a large continent, and from a Western view-point we tend to see it only as that, not a melting pot of different countries with distinct differences and qualities. A few countries in Africa have been hit hard by epidemics like Ebola, and areas are terrorized by militant groups such as Boko Haram. This is what we as outsiders hear about Africa in the daily news, which will influence the way we think of the continent as a whole, often in a negative way. Have you ever travelled to a destination and been surprised that the image didn’t correspond with reality (for better or worse)?A good example is Mallorca. Once known for being a charter destination without much charm to offer – basically known only for the three S’s: Sun, Sea and Sex. Mallorca has been totally transformed and is now an upmarket destination, attracting all kinds of visitors – also hordes of well-heeled tourists.
For 34 out of 101 different destinations, 20% or more travellers have had a bad experience going there. Why do you think that is so common?Too high expectations might be the cause of many bad experiences. If a destination fails to market itself in an honest way, tourists might expect more or bet-ter of whatever it might be. Honest communication and straight-forward campaigns that don’t oversell your product is key. Too often we also see that bad experiences are caused by a poor service level, which can easily be avoided if proper training and skill development is provided to the personnel serving the tourists.
Gary Robson Robert Nygårdhs

42 Travel Image 2015
TOP 25This list shows the destinations Nordic travellers
would prefer to visit if they could choose just three.
Favourite destinationsTRAVEL IMAGE 2015
The complete ranking of preferred destinations and the ranking when grouped across the four Nordic countries, segments, age groups, income and gender is avail-able. Contact Related at [email protected]
1. USA 34.9 Â 0
2. Spain 19.4 À 1
3. Australia 18.3 Á -1
4. Italy 18.1 Â 0
5. England 12.1 À 18
6. France 11.9 À 2
7. Greece 11.6 Á -1
8. Thailand 11.5 Á -3
9. New Zealand 8.9 Á -2
10. Germany 7.9 À 1
11. Japan 7.6 Á -1
12. Iceland 6.4 Á -3
13. Canada 5.6 Â 0
14. Cuba 5.2 Â New
15. Turkey 5.1 À 2
16. China 4.7 À 5
17. Norway 4.6 À 5
18. Austria 4.0 Á -2
19. Ireland 4.0 Á -5
20. Portugal 3.8 À 5
21. Maldives 3.6 Á -2
22. Sweden 3.6 Á -1
23. Scotland 3.5 Á -11
24. Brazil 3.3 Â 0
25. Denmark 3.3 Á -6

1. London 38.8 À 1
2. New York City 35.1 Á -1
3. Paris 32.2 Â 0
4. Rome 22.4 Â 0
5. Barcelona 13.0 Â 0
6. Berlin 12.2 Â 0
7. Los Angeles 6.8 À 4
8. Tokyo 6.8 À 1
9. Prague 6.2 Á -2
10. Sydney 5.7 Á -1
11. Copenhagen 5.2 À 1
12. Stockholm 4.4 Á -2
13. Madrid 4.3 À 1
14. Vienna 3.7 Á -1
15. San Francisco 3.3 À 4
16. Amsterdam 3.2 Â 0
17. Budapest 3.1 Á -2
18. Oslo 2.5 À 4
19. Athens 2.4 À 9
20. Miami 2.3 À 6
21. Dublin 2.2 Á -1
22. Rio De Janeiro 2.2 À 3
23. Bangkok 2.1 Á -6
24. Lisbon 2.0 Á -6
25. Venice 2.0 À 5
CITIESCity breaks are a hit in the Nordic countries.
These cities are the 25 most popular city break destinations – among the Nordic travellers.
PopularTRAVEL IMAGE 2015
The complete ranking of the 50 most preferred city break destinations is available. Contact Related at [email protected]
Travel Image 2015 43

44 Travel Image 2015
TRAVEL IMAGE 2015
There are a few variations in the ranking of preferred city break destinations from country to country.
Here’s the top 10 from each of the four Nordic countries.
CITIES – THE NORDIC COUNTRIES
1. New York City 39.6 Â 0
2. London 33.8 Â 0
3. Paris 29.5 Â 0
4. Rome 19.7 Â 0
5. Barcelona 12.6 Â 0
6. Los Angeles 9.6 À 4
7. Tokyo 9.2 Â 0
8. Sydney 7.2 Á -2
9. Berlin 5.0 Â 0
10. Rio De Janeiro 5.0 À 9
1. London 45.2 À 1
2. Paris 36.8 À 1
3. New York City 34.2 Á -2
4. Rome 28.8 Â 0
5. Berlin 22.0 Â 0
6. Barcelona 12.6 Â 0
7. Prague 6.9 Â 0
8. Madrid 5.4 À 2
9. Stockholm 4.5 À 2
10. Sydney 4.4 Á -2
TRAVEL IMAGE 2015
SWEDISH TRAVELLERS
TRAVEL IMAGE 2015
DANISH TRAVELLERS
The complete ranking of the 50 most preferred city break destinations for each of the four Nordic countries is available. Contact Related at [email protected]
1. Paris 38.3 À 1
2. London 35.7 Á -1
3. New York City 33.6 Â 0
4. Rome 19.5 Â 0
5. Barcelona 11.9 À 2
6. Berlin 10.1 Á -1
7. Tokyo 8.6 Á -1
8. Los Angeles 8.0 À 7
9. Prague 6.6 Á -1
10. Vienna 5.9 À 1
1. London 40.4 Â 0
2. New York City 33.0 Â 0
3. Paris 24.3 Â 0
4. Rome 21.3 Â 0
5. Barcelona 14.7 Â 0
6. Berlin 11.5 À 1
7. Prague 7.8 À 1
8. Copenhagen 7.6 Á -2
9. Sydney 6.5 À 1
10. Tokyo 6.1 Á -1
TRAVEL IMAGE 2015
FINNISH TRAVELLERS
TRAVEL IMAGE 2015
NORWEGIAN TRAVELLERS

Travel Image 2015 45
1. New York City 46.0 Â 0
2. London 33.2 Â 0
3. Paris 27.0 Â 0
4. Rome 13.0 Â 0
5. Tokyo 12.6 Â 0
6. Los Angeles 11.5 À 2
7. Berlin 10.8 Â 0
8. Barcelona 8.8 Á -2
9. Sydney 5.5 Â 0
10. Madrid 4.8 À 1
1. London 42.2 À 1
2. New York City 37.1 Á -1
3. Paris 31.4 Â 0
4. Rome 22.1 Â 0
5. Barcelona 14.3 Â 0
6. Berlin 9.4 Â 0
7. Sydney 7.9 Â 0
8. Tokyo 7.0 À 1
9. Los Angeles 6.4 À 3
10. Prague 6.1 Á -2
TRAVEL IMAGE 2015
AGE GROUP 18-34
TRAVEL IMAGE 2015
AGE GROUP 35-49
TRAVEL IMAGE 2015
Age has some influence on which big cities Nordic travellers would prefer to visit.
Here’s the top 10 for each of the three age groups.
CITIES – AGE GROUPS
The complete ranking of the 50 most preferred city break destinations for each of the four Nordic countries is available. Contact Related at [email protected]
1. London 40.6 Â 0
2. Paris 37.1 Â 0
3. Rome 30.0 Â 0
4. New York City 25.0 Â 0
5. Berlin 15.4 Â 0
6. Barcelona 15.2 Â 0
7. Prague 8.6 Â 0
8. Vienna 6.6 Â 0
9. Copenhagen 5.8 À 1
10. Stockholm 5.8 Â 0
TRAVEL IMAGE 2015
AGE GROUP 50+

46 Travel Image 2015
The Travel Image 2015 report shows that London is the preferred city destination for travellers in the Nordic region, followed by New York and
Paris. London is particularly predominant in Denmark and Norway, while New York is most popular in Swe-den. In Finland, London is also on top, while New York has surpassed Paris in the second place compared to the 2014 report.
We had a chat with Magdalena Öhrn, Communications Manager at VING/Thomas Cook Sweden, to find out more about the current trends and the Nordic travel-lers’ inclination towards short breaks.
Do you see any new trends within the city break travel segments? Most of our customers want to travel with their partner or their friends. We can also see that more and more families are going on city breaks. It is a segment that has been growing the past few years. It’s almost as if parents of children in the Nordics see it as an essential part of their kids’ education to see major cities, experi-ence the culture, see the major attractions and so on.
How do you see the trend of city breaks develop-ing in the future? Is there a limit to how many trips the Nordic travellers are willing to take per year, or how far they are willing to travel for a weekend? The advantage of a weekend break is of course that you only need to take one or two days off work. Spring and autumn are the peak periods, but we can see that more and more people are taking short breaks all year round. But there is of course a limit to how much money you can spend on travels per year; which is probably one of the reasons we see an increased demand for cities like Budapest, Prague and Berlin.
So what will be the next big city - will we see any changes in the top? I think London will remain in the top. The value for money is an important aspect, though, and I therefore think that cities like Budapest, Vilnius, Warsaw and Prague will continue to grow in popularity. For more long-haul destinations, I think San Francisco, Chicago and in the long run, Tel Aviv.
CITY BREAKS – A NEVER-ENDING
LOVE STORY AMONG NORDIC TRAVELLERS
City breaks are the perfect getaway for Nordic travellers. The desire to experience new cultures and destinations can easily be fulfilled within a few hours.
There is no doubt that city breaks are here to stay and will continue to grow as new destinations get within easy reach and offer value for money.
Nordic travellers’ inclination to head west has resulted in a desire for long-haul short breaks in trendy American cities. The US is dominating the city index in the Travel Image 2015. New York, Los Angeles, San Francisco and Miami all rank within the top 20 as the most popular city destinations among Nordic travellers. Direct routes, an increasing number of low cost car-riers flying directly to New York City and Mi-ami, for example, as well as a favourable dollar against Nordic currencies are some of the rea-sons for this.
Go West
New York 2nd place -1
Los Angeles 7th place +4
San Francisco 15th place +4
Miami 25th place +6

© V
isitB
rita
in©
Spa
nish
Tou
rist
Boa
rd
65.1% of Nordic travellers are planning to spend the same amount of money or less on travels in 2015 compared to 2014. For more information about the Nordic travellers’ travel budgets and spending, see page 54.
Facts
“From our own customer research we can see that Nordic people
are primarily looking for destinations that offer quality food
and drinks, value for money and famous attractions ”Magdalena Ohrn, VING
..
Travel Image 2015 47

48 Travel Image 2015
“Positive” means that the respondents had a positive experience with the destination, but haven’t indicated a desire to revisit. The complete list is available. Contact Related at [email protected]
This table shows what percentages of travellers that have visited a given destination have had a given experience.Countries are rated by the column: ”Positive and would like to revisit”.
Negative Positive
Positive and would like to
revisit
1. USA 3.4% 19.4% 77.1%
2. Australia 7.4% 18.5% 74.1%
3. New Zealand 7.3% 19.5% 73.2%
4. Spain 2.6% 27.6% 69.9%
5. Thailand 6.8% 25.0% 68.2%
6. England 2.7% 29.5% 67.8%
7. Scotland 3.6% 29.1% 67.3%
8. Italy 2.7% 31.3% 66.1%
9. Ireland 3.6% 30.9% 65.5%
10. Japan 5.9% 29.4% 64.7%
11. Greenland 9.1% 27.3% 63.6%
12. Iceland 5.1% 31.4% 63.6%
13. Denmark 1.7% 35.2% 63.1%
14. Croatia 4.8% 32.2% 63.0%
15. Portugal 4.9% 32.1% 62.9%
16. Maldives 16.7% 20.8% 62.5%
17. Wales 4.4% 33.3% 62.2%
18. Germany 2.1% 36.0% 61.8%
19. Austria 2.6% 35.8% 61.6%
20. France 6.2% 32.6% 61.2%
Negative Positive
Positive and would like to
revisit
21. Greece 4.0% 35.7% 60.2%
22. US Virgin Islands 15.6% 25.0% 59.4%
23. Vietnam 10.0% 32.0% 58.0%
24. Nepal 10.5% 31.6% 57.9%
25. Czech Republic 3.7% 39.4% 56.8%
26. Norway 2.9% 40.8% 56.3%
27. Sweden 2.8% 41.2% 55.9%
28. Canada 7.5% 37.6% 54.8%
29. South Africa 14.0% 32.0% 54.0%
30. Switzerland 2.1% 43.9% 54.0%
31. Netherlands 2.3% 43.8% 53.9%
32. Brazil 15.4% 30.8% 53.8%
33. Puerto Rico 14.3% 32.1% 53.6%
34. Hungary 5.0% 41.8% 53.2%
35. Namibia 21.1% 26.3% 52.6%
36. Aruba 19.0% 28.6% 52.4%
37. Malta 12.0% 35.9% 52.2%
38. Mauritius 13.0% 34.8% 52.2%
39. Singapore 8.5% 39.4% 52.1%
40. Dubai 8.6% 39.7% 51.7%
EXPERIENCE WITH A VISITED DESTINATION -
AND THE DESIRE TO REVISIT
40TOP

Travel Image 2015 49
“Positive impression” means that the respondents have a positive impression with the destination, but haven’t indicated a desire to visit. The complete list is available. Contact Related at [email protected]
This table shows what percentages of travellers that haven’t visited a given destination have a given impression of it. Countries are rated by the column: ”Positive and would like to visit”.
Negative Positive*
Positive and would like to
visit
1. New Zealand 1.6% 33.1% 65.3%
2. Scotland 1.9% 32.8% 65.3%
3. Iceland 2.8% 32.0% 65.1%
4. Australia 2.9% 32.3% 64.8%
5. USA 8.0% 28.7% 63.3%
6. Maldives 5.3% 32.8% 62.0%
7. Italy 5.6% 33.5% 60.9%
8. Ireland 4.6% 34.7% 60.7%
9. Seychelles 5.7% 34.8% 59.5%
10. Canada 2.4% 39.0% 58.6%
11. Portugal 3.7% 38.3% 58.0%
12. Spain 6.4% 36.0% 57.6%
13. Wales 3.7% 38.8% 57.5%
14. Bahamas 3.3% 39.5% 57.1%
15. Japan 5.7% 37.5% 56.8%
16. England 5.3% 38.0% 56.7%
17. Mauritius 6.5% 37.0% 56.4%
18. Barbados 4.3% 40.0% 55.7%
19. Faroe Islands 5.4% 40.4% 54.2%
20. Malta 5.4% 40.8% 53.8%
Negative Positive*
Positive and would like to
visit
21. US Virgin Islands 7.0% 39.9% 53.1%
22. Netherlands 4.4% 43.4% 52.2%
23. Greenland 8.6% 39.7% 51.7%
24. Norway 4.7% 43.8% 51.5%
25. Denmark 5.4% 43.2% 51.4%
26. Fiji 6.6% 42.0% 51.4%
27. Jamaica 11.0% 38.1% 50.9%
28. France 9.7% 39.5% 50.7%
29. Switzerland 3.3% 46.2% 50.5%
30. Germany 6.2% 43.6% 50.2%
31. Austria 2.9% 46.9% 50.1%
32. Singapore 11.2% 38.7% 50.1%
33. Madagascar 9.5% 41.3% 49.1%
34. Cape Verde 12.5% 39.3% 48.3%
35. Puerto Rico 10.4% 42.3% 47.3%
36. Cyprus 9.9% 43.0% 47.1%
37. Trinidad and Tobago 17.2% 36.1% 46.7%
38. Thailand 17.3% 36.6% 46.1%
39. Brazil 14.4% 40.2% 45.4%
40. Greece 19.2% 35.3% 45.4%
IMPRESSIONS OF A DESTINATION THAT ARE NOT VISITED -
AND THE DESIRE TO VISIT
40TOP

50 Travel Image 2015
20TOP
20TOP
The complete list – including national differences – is available. Contact Related at [email protected]
The table shows the top 20 percentages of travellers that have visited a given European destination.
The complete list – including national differences – is available. Contact Related at [email protected]
The table shows the top 20 percentages of travellers that have visited a given non-European destination.
1. Sweden 77.6% Â 0
2. Denmark 65.3% Â 0
3. Germany 60.5% Â 0
4. Norway 59.3% Â 0
5. Spain 58.8% Â 0
6. England 47.8% Â 0
7. Greece 47.0% Â 0
8. France 45.1% Â 0
9. Italy 45.1% À 1
10. Finland 38.2% Â 0
11. Netherlands 34.9% Â 0
12. Austria 34.6% Â 0
13. Estonia 30.9% Â New
14. Poland 24.6% À 3
15. Czech Republic 24.1% À 1
16. Switzerland 23.9% Á -2
17. Portugal 22.4% À 1
18. Belgium 22.1% Á -3
19. Hungary 20.1% Â 0
20. Russia 16.5% Â 0
1. USA 31.9% Â 0
2. Cyprus 20.6% Â 0
3. Thailand 19.2% Â 0
4. Egypt 13.2% Â 0
5. Tunisia 11.2% Â 0
6. Morocco 10.4% Â 0
7. Singapore 9.4% À 1
8. Canada 9.3% Á -1
9. China 8.6% Á -4
10. Australia 8.1% Â 0
11. Israel 7.4% Á -2
12. Mexico 6.5% Â 0
13. Dubai 5.8% À 2
14. Malaysia 5.6% Â 0
15. Brazil 5.2% À 5
16. Japan 5.1% Á -3
17. South Africa 5.0% À 19
18. Vietnam 5.0% À 6
19. India 4.7% Á -3
20. Dominican Republic 4.5% À 7
WHICH EUROPEAN
DESTINATIONS HAVE
THE NORDIC TRAVELLERS
VISITED?
WHICH DESTINATIONS
OUTSIDE EUROPE HAVE
THE NORDIC TRAVELLERS
VISITED?

Travel Image 2015 51
WHICH DESTINATIONS
DO THE NORDICS TRAVELLERS
WANT TO VISIT ?
40TOP
1. Spain 56.3% À 2
2. Denmark 54.5% Â 0
3. USA 52.4% À 1
4. Italy 51.6% À 2
5. England 49.4% Á -4
6. Sweden 49.1% Á -1
7. Germany 48.8% À 2
8. Norway 48.8% À 3
9. Australia 46.2% Á -2
10. Scotland 46.1% Á -2
11. France 44.8% À 4
12. Iceland 44.7% Â 0
13. New Zealand 43.0% Á -2
14. Greece 42.7% À 3
15. Ireland 41.1% À 1
16. Portugal 40.9% À 3
17. Austria 40% Á -3
18. Canada 39.3% Á -5
19. Netherlands 38.9% À 5
20. Japan 36.3% À 1
21. Switzerland 36.0% Á -1
22. Thailand 34.9% À 1
23. Finland 34.5% Á -1
24. Maldives 34.4% À 2
25. Bahamas 34.3% Â New
26. Wales 33.3% Á -1
27. Malta 32.5% À 1
28. Barbados 32.0% Â New
29. Faroe Islands 30.6% À 1
30. Greenland 29.8% Á -1
31. Cyprus 28.9% Á -4
32. Czech Republic 28.9% À 7
33. Mauritius 28.8% À 3
34. Croatia 28.3% Â 0
35. Estonia 28.2% Â New
36. Brazil 28.1% Á -5
37. Jamaica 28.1% Â New
38. Seychelles 27.7% Á -6
39. Singapore 27.2% Á -6
40. Hungary 26.9% Â 0
The complete list – including nationality, segment and age differences - is available. Contact Related at [email protected]
This table shows the percentage of travellers that want to visit a given destination (the numbers include both the travellers that have visited the destination before and those that want to visit it for the first time).

52 Travel Image 2015
ADVERTORIAL

Travel Image 2015 53
This table shows an index of the wanderlust, based on the percentage of travellers that have indicated a desire to visit the various continents – and the average per nationality. All the travellers that have indicated that they would like to visit a destination on a given continent have been added up and then divided by the number of destinations on the given continent, resulting in an average measure of wanderlust value for each individual continent.
THE WANDERLUST OF THE NORDIC TRAVELLERS
(WANDERLUST-INDEX)
The desire of the four nationalities to visit the various destinations can be converted into a wanderlust value that shows the desire to visit
the respective continents.
Average Sweden Denmark Finland Norway
1. Africa 17.2% 19.8% 15.0% 16.5% 17.6%
2. Asia and Oceania 23.9% 25.5% 22.8% 24.1% 23.5%
3. Europe 31.7% 29.8% 29.7% 33.0% 32.6%
4. Middle East 15.6% 17.8% 12.0% 16.2% 16.6%
5. North, Middle and South America 23.4% 24.9% 21.8% 23.4% 23.5%
6. Average 23.5% 20.2% 22.7% 22.7%

54 Travel Image 2015
HOLIDAY BUDGET 2015HOLIDAY BUDGET 2015
AVERAGE HOLIDAY BUDGET 2015
EXPECTED CHANGE IN HOLIDAY BUDGET
Average Sweden Denmark Finland Norway
Less than EUR 650 13.8% 15.1% 12.9% 18.8% 8.4%
EUR 650-1,499 13.7% 11.9% 15.5% 16.6% 10.7%
EUR 1,500-1,999 7.7% 8.0% 8.1% 9.9% 4.9%
EUR 2,000-2,499 9.4% 11.6% 7.0% 8.6% 10.5%
EUR 2,500-2,999 6.9% 7.5% 7.7% 4.8% 7.4%
EUR 3,000-3,999 7.7% 8.1% 6.4% 6.3% 10.0%
EUR 4,000-4,499 4.5% 4.0% 5.5% 3.0% 5.7%
EUR 4,500-4,999 3.1% 3.7% 1.9% 2.3% 4.4%
EUR 5,000-5,999 3.8% 5.7% 2.0% 2.7% 4.8%
EUR 6,000-6,499 2.2% 2.2% 1.8% 1.2% 3.7%
More than EUR 6,500 6.6% 5.2% 8.3% 4.1% 9.0%
Do not know/Will not state 20.5% 17.0% 22.9% 21.8% 20.5%
Average Sweden Denmark Finland Norway
Per household (EUR) 2,739.1 2,732.8 2,724.7 2,222.4 3,301.3
Average/person (EUR) 1,183.2 1,167.9 1,216.4 1,010.6 1,320.5
Average Sweden Denmark Finland Norway
Budget is smaller than in 2014 17.2% 17.0% 15.9% 20.7% 15.3%
Unchanged 47.9% 52.0% 45.5% 45.7% 48.4%
Budget is bigger than in 2014 20.9% 18.8% 26.8% 18.0% 20.0%
The table shows the expected yearly holiday budget for 2015 in Euro – for each nationality and compared to the Nordic average. The holiday budgets here are per household.
The table shows the expected yearly holiday budget for 2015 in Euro – for each nationality and compared to the Nordic average. The holiday budgets here are per household.
This table shows the expected change of holiday budgets from 2014 to 2015 as the percentage of a given group that expects a given change – on average and for each Nordic country. On average, 14.0% didn’t commit to an expected change.

Travel Image 2015 55

188 pages on the Nordic travellers’ outbound behaviour, including their travel habits, holiday budget and spending, preferred type of holiday and destination, preferences in relation to accom-modation and transport, booking process and future travel and holiday plans.
The report is based on an extensive survey among 2,300 selected representative respondents in the
four Nordic countries. The survey is conducted by noted research agency A&B Analyse.
The report presents statistics and puts them into perspective through a series of articles.
TABLE OF CONTENTS
THE NORDIC TRAVEL MARKETDESTINATIONS
IMAGETRAVEL PATTERNS
SPENDINGTRAVEL HABITS
BOOKINGCITIES
THE NORDIC TRAVELLERS’ OUTBOUND BEHAVIOUR
“Travel Behaviour & Destination Images”
covers the Nordic travellers’ expectations
and preferences for both 2014 and 2015.
It is now available for EUR 200.
Please contact Related directly at
[email protected] or at www.related.dk/uk
OFF
50%


![Travel Training Program. Planning Your Trip [Insert Image]](https://static.fdocuments.net/doc/165x107/55177cea5503463e368b507a/travel-training-program-planning-your-trip-insert-image.jpg)