Travel and Tourism – SINGAPORE MARKET ... · Web view1. EXECUTIVE SUMMARY The travel and tourism...
180
Travel and Tourism – SINGAPORE MARKET 1. EXECUTIVE SUMMARY The travel and tourism industry in 2005 witnessed an increase in both arrivals and departures. The total number of arrivals increased by 7%, while departures grew by 14%. The growth achieved by arrivals and departures is primarily due to the buoyant economy of the country and increased travel confidence. The Singapore Tourism Board (STB); the key tourism agency in Singapore, took several initiatives in 2005. Some of the initiatives taken by STB included its vision for making Singapore a powerful tourism hub for attracting visitors, businesses and talents from across the world by 2015. The efforts made in this direction included 'Make It Singapore plus' Campaign to attract MICE events, participation in 2005 World Exposition which was held in Japan, and opening of Singapore Education Services Centre. STB also upgraded its online services and made it interactive and user friendly. Travel accommodation grew by 10% in current value terms in 2005, to reach a total of S$1 billion. The growth is largely attributed to the increase in tourist arrivals especially from countries such as Indonesia, India, China and Thailand, as travellers regained confidence in travelling. Transportation in 2005 was impacted by the proliferation of low cost carriers. The budget airlines contributed significantly to the increase in tourist arrivals in Singapore, by increasing their operations and connecting several countries with Singapore. The up and coming low cost carrier market in Singapore witnessed the merger of two budget airlines in July 2005. Qantas Airways- supported Jetstar Asia and Singapore-based Valuair merged their businesses and formed a single corporate entity. Under the deal worth S$60 million, Qantas will have 44.5% stake in Jetstar Asia. The merger is likely to provide a platform for growth in the Gathered by: Department of Tourism ASEAN Page 1
Transcript of Travel and Tourism – SINGAPORE MARKET ... · Web view1. EXECUTIVE SUMMARY The travel and tourism...

Travel and Tourism – SINGAPORE MARKET
1. EXECUTIVE SUMMARY
The travel and tourism industry in 2005 witnessed an increase in both arrivals and departures. The total number of arrivals increased by 7%, while departures grew by 14%. The growth achieved by arrivals and departures is primarily due to the buoyant economy of the country and increased travel confidence.
The Singapore Tourism Board (STB); the key tourism agency in Singapore, took several initiatives in 2005. Some of the initiatives taken by STB included its vision for making Singapore a powerful tourism hub for attracting visitors, businesses and talents from across the world by 2015. The efforts made in this direction included 'Make It Singapore plus' Campaign to attract MICE events, participation in 2005 World Exposition which was held in Japan, and opening of Singapore Education Services Centre. STB also upgraded its online services and made it interactive and user friendly.
Travel accommodation grew by 10% in current value terms in 2005, to reach a total of S$1 billion. The growth is largely attributed to the increase in tourist arrivals especially from countries such as Indonesia, India, China and Thailand, as travellers regained confidence in travelling.
Transportation in 2005 was impacted by the proliferation of low cost carriers. The budget airlines contributed significantly to the increase in tourist arrivals in Singapore, by increasing their operations and connecting several countries with Singapore.
The up and coming low cost carrier market in Singapore witnessed the merger of two budget airlines in July 2005. Qantas Airways-supported Jetstar Asia and Singapore-based Valuair merged their businesses and formed a single corporate entity. Under the deal worth S$60 million, Qantas will have 44.5% stake in Jetstar Asia. The merger is likely to provide a platform for growth in the Asian markets, particularly in China, for Qantas. The two airlines will have a combined fleet of eight aircraft.
Car rental in 2005 witnessed growth of 5% in current value terms over the previous year. The factors which impacted car rental positively were the increase in tourist traffic, and the growing number of business meetings and conventions held in Singapore.
Travel retail in 2005 grew steadily at 12% and is S$3 billion in value terms as compared to 2004. This is as a result of a better performing economy and increase in travel confidence. The rise of the low cost carriers and lowering of package deals by travel agencies also encouraged more people to travel, as travelling is becoming more affordable.
Gathered by: Department of Tourism ASEAN Page 1

Travel and Tourism – SINGAPORE MARKET
2. OPERATING ENVIRONMENT
2.1 Macroeconomic Parameters
GDP and tourism
Singapore's total GDP grew by 7% in 2005, a stable rise, although a slow-down on the 8% growth seen in 2004. Growth remains heavily dependent on certain key exports, and on economic developments in the region. Tourism was among the leading areas which contributed to Singapore's economy in a significant manner. The tourism industry in 2005 witnessed an increase in overseas arrivals, which led to higher retail sales as well as improved hotel revenue and occupancy rates.
The government also made ambitious plans to further propel tourism and tourism-related services in Singapore. One such plan includes two proposed casino resorts. The casino resorts are likely to boost the economic growth of the country and indirectly create jobs.
Disposable income
Buoyant economic growth experienced in 2005 boosted the per capita income of the local people in Singapore, which in turn led to higher disposable income, boosting tourism spending on outbound travel as well as domestic travel amongst Singaporeans.
Consumer expenditure on leisure
The positive economic scenario and increase in disposable income in 2005 led to increased spending on leisure. The spending on outbound travel, domestic tourism and shopping constitute an important part of consumer spending on leisure. Among the above three, outbound travel showed the maximum increase in 2005.
Table 1 Operating Environment Parameters 2000-2005S$ bn 2000 2001 2002 2003 2004 2005
Annual disposable income 82.5 87.4 91.3 99.1 105.2 109.1Total GDP 159.8 153.4 158.4 161.5 181.7 194.4
Leisure and recreation 9.0 8.1 8.0 8.1 8.8 9.2Source: Euromonitor International from national statistical offices
2.2 Political and Legislative Environment
Long-term initiatives by Singapore Tourism Board (STB)
Gathered by: Department of Tourism ASEAN Page 2

Travel and Tourism – SINGAPORE MARKET
Tourism is one of the key industries in Singapore, and forms an important part of the economy. Singapore Tourism Board (STB), which is the main economic development agency for tourism in Singapore, aims to develop and enhance tourism in the coming years. Some of the initiatives taken by STB include its vision for making Singapore a powerful tourism hub for attracting visitors, businesses and talents from across the world by 2015
STB identified three key areas of focus for achieving this goal; enhancing Singapore’s position as the leading convention & exhibition city in Asia; providing high end quality services such as healthcare and education services; and improving Singapore’s image as a leading Asian leisure destination.
Government Tourism Development Fund to boost infrastructure
The government’s contribution in this direction includes a S$2 billion Tourism Development Fund (TDF). This fund will be directed to developing critical infrastructure pertaining to tourism, anchoring mega events pertaining to leisure as well as the business world, and improving the potential of travel channel partners. The fund will also be used for developing strategic tourism products. Another key effort made by the Government in an attempt to rejuvenate tourism, was the lifting of the ban on casinos. The major step taken, pertaining to the development of integrated resorts with casinos is expected to enhance the volume of tourist arrivals as well as increase the yield per tourist.
In addition to the goals set for 2015, STB made web-based developments in 2005 in order to attract the growing internet savvy population. These developments included re-launching Singapore's destination website; www.visitsingapore.com. The new portal is available in a variety of languages including English, Simplified Chinese, Traditional Chinese, Thai, Vietnamese, Bahasa, Japanese, Korean, Russian, Arabic, French and German. The new website is easy to navigate and showcases all the prime attractions of Singapore. The interactive nature of the website allows customisation as per the requirements of the traveller.
Singapore Airlines; the local airline of the country, also took several initiatives in 2005 to promote tourism in Singapore. Some of these steps included signing a Memorandum of Understanding (MoU) with the Queensland Government. Another MoU was signed with South Australian Tourism Commission. The main purpose of these agreements was to jointly boost tourist arrivals with Singapore airlines as the preferred airline.
STB opens Indian branch office
In 2005, STB opened its New Delhi Regional Office. The office will primarily conduct marketing campaigns so as to attract Indian tourists to Singapore. STB also made special efforts for transit passengers. This included the launch of Phase Two of the Transit Programme. Phase Two includes free bus shuttle services from the airport to Suntec City/Little India/Parkway Parade with return transfer to the airport, Tourist Day Pass for transit visitors preferring to travel and venture through Singapore on their own, food and beverages/shower facility vouchers for use at the airport upon return after transit experience, free city tour in Chinese and taxi tourist guide.
Gathered by: Department of Tourism ASEAN Page 3

Travel and Tourism – SINGAPORE MARKET
2.3 Terrorism and Security
Like other countries across the region, Singapore has been characterised by increased insecurity amongst the population, due to increased threats surrounding terrorism and attacks.
Singapore’s more significant attacks have included the 1965 bomb explosion at the central location, Orchard Road, which killed two Chinese and one Malay, and injured 33 people. In January 1974, members of the Japanese Red Army (JRA) bombed petroleum tanks at Pulau Bukom, and in 1991, terrorists hijacked a Singapore Airlines shuttle flight SQ117 from Subang International Airport (Kuala Lumpur) with 129 passengers onboard. In 1985, the government uncovered planned activities of a local terrorist network, the Liberation Tiger of Tamil Ealam (LTTE), headed by Sri Lankans in Singapore, deporting members of the network back to their country of origin.
Stepping up security
Following the 9/11 US attacks in 2001, and the Bali bombings, the threat of terrorist attacks in Singapore is thought to be relatively high compared to other countries, due to the strong Western presence in the country, and large-scale business interests in Singapore. In response to this, the government has continued to be proactive in counteracting terrorism threats, and since the 9/11 US attacks in 2001, has stepped up its security measures significantly.
In December 2001, 15 people involved in terrorist-related activities were arrested, and several major plots, including plans to carry out attacks on Singapore’s MRT public transport system, were uncovered. In 2005, measures were taken to increase security further, with initiatives such as the encouragement of people to own an emergency “Ready Bag” (bags containing items and equipment to help people in an emergency), as well as the tracking of users of prepaid mobile phone cards to prevent their abuse by terror groups. Together with Malaysia and Indonesia, the “Eyes in the Sky” campaign was launched as a security measure for waterways. Furthermore, in 2006, the government plans to stage “Exercise NorthStar 2006”, which will simulate a terror attack in Singapore to test the response of the different agencies and the public in such a scenario.
Enhancing the sharing of intelligence
Singapore has also readily shared relevant intelligence with foreign security agencies. This has led to the arrest of several Jemaah Islamiyah (JI) members in the region spread over several countries. Singapore participates actively in many international and regional security forums, sharing its experiences in counter-terrorism and hosting training courses for regional countries.
Tackling terrorism on the ideological and social fronts
Gathered by: Department of Tourism ASEAN Page 4

Travel and Tourism – SINGAPORE MARKET
Ministers in Singapore have met up with Muslim and non-Muslim community leaders to discuss the terrorism issue openly and rationally. The local Muslim community has also developed and implemented self regulatory measures to prevent radical and extremist groups from subverting and misleading Singapore Muslims.
Enhancing Protective and Preventive Measures
Enhancing home front security
In the area of maritime and port security, since 1 July 2004, Singapore has complied fully with security measures adopted by the International Maritime Organisation (or IMO). Singapore also tightened security screening of incoming cargo and travellers, deploying radiographic scanners in doing so.
Singapore is also moving towards greater use of biometrics for immigration clearance. In December 2005, new passports formats were introduced with enhanced security features and higher technology identification software.
2.4 Sustainable Tourism
At the national level, the Singapore Tourism Board (STB) is responsible for sustainable tourism. Other agencies responsible for the planning and management of sustainable resources in Singapore include the Urban Redevelopment Board (URA), National Parks Board (NParks), and the National Heritage Board (NHB).
Eco-tourism continues to be promoted as part of its other activities, although this area remains a small part of many areas of promotion, rather than a key focus area of expansion. Compared to its neighbouring countries, Singapore’s nature reserves are more limited, and as such, eco-tourism is considered a relatively higher risk area of investment, and visitors continue to perceive Singapore as a city destination.
Nevertheless, Singapore continues to promote itself as a country offering something for everyone, and there are a wide range of nature zones and parks designated as eco-sites. Such major areas include: forested areas, such as the Bukit Timah Nature Reserve and Central Catchment Nature Reserve, Bukit Batok, Labrador Park and Singapore Botanic Gardens. Singapore’s marshes and mangrove swamps are found at the Pasir Ris Park, Marina South fresh water marsh, Sungei Mandai, Kranji Reservoir, Sungei Buloh, Khatib Bongsu and the Western Catchment Area.
Singapore’s ridges and hillocks include Kent Ridge Park, Mount Faber and Telok Blangah Hill Park. Its offshore islands also attract a high degree of tourism, including at islands such as Pulau Ubin, Pulau Semakau, Sentosa and Pulau Tekong.
2.5 Positive Growth Factors
Gathered by: Department of Tourism ASEAN Page 5

Travel and Tourism – SINGAPORE MARKET
The tourism industry in 2005 witnessed an increase in tourist arrivals, departures and domestic tourists. One of the key events which gave a major boost to tourism in Singapore was the proliferation of low cost carriers. The budget carriers opened the travel market for tourists who could not afford the airfares of traditional airlines. Besides this, the low cost carriers added new destinations, which led to an influx of tourist traffic to these new destinations. The new destinations added by the budget airlines in 2005 were mainly the second tier cities in the countries, which are located at short haul distance. For example, Valuair added Surabaya in Indonesia, and Tiger Airways added Darwin in Australia.
Another prime factor which contributed to the positive growth was the improved economic scenario of Singapore and led to increase i
n both arrivals and departures. The positive economic growth, which led to increase tourism spending, propelled the outbound travel. In terms of inbound travel, the growing economy enhanced the brand image of the country and improved travel confidence among the incoming tourists.
In addition to the above factors, STB played a major role in enhancing Singapore’s image as an attractive tourist destination. STB launched 'Make It Singapore plus' campaign, to attract MICE events. This campaign was an extension of 'Make It Singapore' campaign which was launched on November 2003. The ‘Make It Singapore’ campaign attracted about 40 major events in 2004. Some of these events included the Global Brand Forum, Nortel Networks sales and training rally, the Amway India incentive group, the Asia Pacific low cost airline symposium, the International Conference on Materials for Advanced Technologies (ICMAT) and the International Conference on Advanced Materials (ICAM).
The new 'Make It Singapore plus' campaign, offered additional benefits such as better event management in the form of value-adds. Some of these value added services included videography services, team-building activities for corporate meetings and incentive groups and publicity support.
The overseas effort made by Singapore Tourism Board included taking part in 2005 World Exposition (World Expo), which was held in Japan, and showcased many unique aspects of Singapore. Pertaining to high-end services; STB opened Singapore Education Services Centre in 2005, with the aim to provide information on various education options, registration procedures and processes.
Summary 1 Positive Growth FactorsGrowth of low-cost carriers with additional regional routes
Improved economic climate increased propensity to to travel Improved travel confidence Strong branding and marketing efforts by STB
Source: Company websites, company annual reports, trade interviews, Euromonitor International
Gathered by: Department of Tourism ASEAN Page 6

Travel and Tourism – SINGAPORE MARKET
2.6 Negative Growth Factors
The natural calamities and terrorist activities in the Asia Pacific region indirectly affected tourist traffic
While the tourism industry remained buoyant in 2005, some external as well as internal factors slowed growth. Some of these factors included the threat of security and terrorism in the Asia Pacific region. One such event was the Bali bombing, which led to many cancellations of Singapore-Bali travel packages. The region also suffered from several natural calamities such as the tsunami at the end of 2004 and bird flu in 2005. Though Singapore remained safe from such incidents, the tourism market was indirectly affected for travel packages, which included Singapore as one of the destinations.
In addition to this, Singapore is facing competition from several upcoming destinations such as Dubai. The new convention centre and hotels being built in Dubai to attract MICE events to the city are likely to take away a certain percentage of MICE related business from Singapore. Besides this, neighbouring countries such as Malaysia are also upgrading themselves and enhancing their image as shopping destinations. Thus the cheaper shopping alternative in Malaysia and other neighbouring countries have impacted on the shopping tourism in Singapore.
Tourism in Singapore was also negatively affected by the fuel price surcharge. The transportation sector; especially the airlines, had to adjust their fuel surcharge for tickets. The surcharge, which translated into higher pricing for travellers, also negatively impacted tourist arrivals.
Summary 2 Negative Growth FactorsTerrorism in the region
Natural disaster in nearby destinations Diseases such as bird flu, dengue fever Competition from other regional destinations Price surge on transport
Gathered by: Department of Tourism ASEAN Page 7

Travel and Tourism – SINGAPORE MARKET
3. COMPETITIVE ENVIRONMENT
3.1 Recent Mergers and Acquisitions
The mergers and acquisitions that took place in 2005 were as follows:
Raffles Holding and Colony Capital
Raffles Holdings sold its hotel business, including Singapore's 118-year-old Raffles Hotel, to a US private-equity investor Colony Capital. Raffles Holdings is expected to gain $605 million and will retain its 45% share in Tincel Properties, which has a $700 million stake in Raffles City, the complex houses Swissôtel and Stamford hotels, Raffles City Shopping Centre, Tower Blocks and Convention Centre. Raffles Holdings will also have an option to buy Raffles Hotel at market value after 82 years. Colony Capital plans to maintain all operations under the current brands and will focus on opportunities to grow the franchise, especially in Asia.
Jetstar Asia and Valuair
The up and coming low cost carrier market in Singapore witnessed merger of two budget airlines in July 2005. Qantas Airways-supported Jetstar Asia and Singapore-based Valuair merged their businesses and formed a single corporate entity. Under the deal worth S$60 million, Qantas will have 44.5% stake at Jetstar Asia. The merger is likely to provide a platform for growth in the Asian markets, particularly in China.
Summary 3 Major Mergers and Acquisitions 2001-2005Operator Date M&A details
Colony Capital September 2005
Acquisition of Raffles hotel by Colony Capital
Valuair and Jetstar Asia
July 2005 Merger of Valuair and Jetstar Asia to form Orange Star
Source: Company websites, company annual reports, trade interviews
3.2 Key Strategic Alliances
Singapore Airlines and the Queensland Government
Gathered by: Department of Tourism ASEAN Page 8

Travel and Tourism – SINGAPORE MARKET
Singapore Airlines and the Queensland Government signed a Memorandum of Understanding (MoU) to boost visitor arrivals into the Australian State of Queensland. The MoU is effective from 1st April 2005 and is valid for three years. The main aim of the alliance is to make co-ordinated efforts to promote Queensland as an attractive destination, and Singapore Airlines as the preferred airline. Some of the efforts made in this direction include jointly-funded marketing campaigns in key markets, conducting familiarisation trips to important tourism sights in Queensland for the consumer as well as trade media from key markets, and holding joint road shows.
Singapore Airlines and South Australian Tourism Commission
Singapore Airlines signed a MoU with South Australian Tourism Commission, to jointly promote tourism and boost visitor numbers to South Australia. Both Singapore Airlines and South Australian Tourism Commission will commit about S$171,000 each per annum to fund the proposed joint marketing activities in mutually agreed markets. Both the parties have the option to renew MoU after a year.
Singapore Airlines and Air New Zealand
Singapore Airlines and Air New Zealand expanded their code share agreement. This expanded agreement gives Singapore Airlines an option to sell dual Australia and New Zealand destinations on Air New Zealand’s Sydney-Auckland services, and allow passengers on its daily flights to Auckland to connect on Air New Zealand Auckland-Rotorua service. Customers of Air New Zealand can also enjoy more choice of flights on Singapore Airlines services between Singapore and Dubai, Frankfurt and Rome.
Zuji and Mondial Assistance
Zuji has partnered with the travel insurance and assistance provider, Mondial Assistance to introduce a range of travel insurance options that can be purchased online by Zuji customers across the region.
Hilton International has made a global agreement with Expedia that allows Hilton International, to add over 400 of its properties to Expedia’s preferred hotel programme. As part of the agreement, Hilton International is implementing a direct connection with Expedia. Built on the Open Travel Alliance standard, Expedia’s direct connect technology will assist Hilton in cost reduction as well as increase the efficiency in managing inventory.
Summary 4 Key Strategic Alliances 2001-2005Alliance companies Year Sectors Details of alliance
Jet Airways and Qantas 2005 Transportation Promotion for frequent flyer
Gathered by: Department of Tourism ASEAN Page 9

Travel and Tourism – SINGAPORE MARKET
membersSingapore Airlines and the Queensland Government
2005 Transportation MoU for marketing campaign in target segment countries
Singapore Airlines and South Australian Tourism Commission
2005 Transportation MoU for joint marketing campaign in target segment countries
Singapore Airlines and Air New Zealand
2005 Transportation Expansion of code share agreement
Zuji and Mondial Assistance
2005 Travel Retail Introduction of range of travel insurance options
Hilton International and Expedia
2005 Accommodation Agreement aimed at assisting Hilton in cost reduction, as well as increasing the efficiency in managing inventory.
Singapore Tourism Board (STB) and Suzhou Municipal Government
2004 General tourism Signing of a Memorandum of Understanding (MOU) on a tourism cooperation framework
Singapore Airlines, Temasek Holdings, Indigo Partners and Irelandia Investments Ltd
2004 Air transportation Formation of budget airline Tiger Airways
Valuair and Abacus International
2004 Air Transportation Joining the Abacus ticketing and reservation network
Singapore Tourism Board and Melchers Group
2003 Tourist Attraction Industry
Construction of Singapore Flyer
Source: Company websites, company annual reports, trade interviews
3.3 Leading Company Profile: The Hertz Corp
Company background
Hertz Rent-a-car operates a car and equipment rental business, and until September 2005, was a wholly-owned subsidiary of Ford Motor Co. In September 2005, Ford Motor Co sold Hertz rental car unit to a private equity firm composed of Clayton Dubilier & Rice, Carlyle and Merrill Lynch Global Private Equity for US$15 billion.
The core business of Hertz in Singapore is vehicle rental and leasing. It currently lags in fourth place in the Singapore car rental sector, with 4% of total value sales as of 2005. The company has two outlets in the country; one at Changi Airport and the other in the centre of town on Scotts Road. It maintains a young fleet of cars and in line with the rest of the company, focuses on providing quality services. It is also one of the few car rental operators with a presence at the international airport. As such, the company’s prime target segment is business travellers.
Summary 5 Hertz Rent-a-car: Company Factfile 2005
Gathered by: Department of Tourism ASEAN Page 10

Travel and Tourism – SINGAPORE MARKET
Company name and status: Hertz Asia Pacific Pte Ltd
Parent company: The Hertz Corp Country of origin: USTravel and tourism sectors: Car rentalMajor travel and tourism brands: Hertz
Source: Company research, Euromonitor International
Recent news
In an attempt to maintain competitiveness in the car rental sector, Hertz took several initiatives over the review period, mainly in the form of alliances with other businesses, and using synergies to boost usage of their respective products and services. One of its most recent initiatives in 2005 was its partnership with low cost carrier Tiger Airways, whereby it offered car rental services to Tiger Airways passengers at discounted rates. Under the partnership with Hertz, Tiger Airways customers were offered special offers for car rentals in Thailand, Hong Kong and the Philippines. In Thailand and Hong Kong, customers were given one-day free rental and a 15% discount, while in the Philippines Hertz gave 20% discount. Other alliances include agreements with several credit card companies, including Singapore’s People’s Association passion card, where cardholders can obtain a 15% discount when booking through this card.
3.4 Leading Company Profile: Millennium & Copthorne Hotels Plc
Company background
Millennium & Copthorne Hotels Plc is the international hotel arm of the Hong Leong Group, Singapore. As of December 31, 2004, Millennium & Copthorne owned and operated 89 hotels in 15 countries. The Company has two brands, Millennium Hotels and Copthorne Hotels. The Millennium Hotels are four-star deluxe properties situated in premier business locations around the world, while the Copthorne hotels are four-star properties situated at regional business centres or resort locations in the United Kingdom, France, Germany, New Zealand, Malaysia and Singapore.
In Singapore, Millennium & Copthorne International Limited is one of the leading players in the hotel industry. The company operates the Grand Copthorne Waterfront Hotel, M Hotel, Copthorne Orchid Hotel, Copthorne King’s Hotel and the Orchard Hotel in Singapore. The company is focused on providing superior quality service in terms of accommodation to its customers. The prime target segment for the group of hotels under Millennium and Copthorne are business travellers and high spending leisure tourists. All Millennium & Copthorne hotels have fully equipped business centres and a full range of in-
Gathered by: Department of Tourism ASEAN Page 11

Travel and Tourism – SINGAPORE MARKET
room business facilities.
Summary 6 Milenium & Copthorne: Company Factfile 2005Company name and status:
Millennium & Copthorne International Limited
Parent company: Millennium & Copthorne Hotels PlcCountry of origin: United KingdomTravel and tourism sectors:
Travel Accommodation
Major travel and tourism brands:
Grand Copthorne Waterfront Hotel, M Hotel, Copthorne Orchid Hotel, Copthorne King’s Hotel and the Orchard Hotel
Source: Company research, Euromonitor International
Recent news
Millennium & Copthorne Hotels took several initiatives in 2005 to attract incoming tourists, especially for growing markets such as India. The company linked up with Singapore Airlines and Singapore Tourism Board with an offer for incoming tourists from India. The offer included special return Economy Class fares on Singapore Airlines from all cities it operates from in India, a special hotel offer for a minimum of two nights from Millennium Copthorne Hotels, and discount booklets worth S$250 from the Singapore Tourism Board. The promotion was valid from July 1 to September 30, 2005. Millennium & Copthorne International Limited also partnered with American Express to provide special conference and room packages in Singapore, exclusively for American Express card members.
The other promotional activities conducted by Millennium & Copthorne hotel in 2005 included special pricing for Singapore Airline passengers for the room tariff and additional services such as free breakfast, late check out and 500 KrisFlyer miles per stay for KrisFlyer members. The company also conducted a marketing programme for the month of December, which offered prizes such as a holiday for two to Los Angeles, iPod Nanos, weekend stays at its hotels, StarHub mobile subscription plans and a-la-carte dining card memberships for staying or dining at the hotels.
The company made special efforts to enhance its online services by appointing VRX Studios Inc. as its online content provider. VRX’s hotel programme will help Millennium & Copthorne manage the integrity and presentation of its brand across all the online distribution channels of the company.
Summary 7 Millennium & Copthorne: Summary of Key Events 2000-20052001 Millennium & Copthorne Hotels and
Maritim Hotels of Germany form global strategic marketing alliance, which
Gathered by: Department of Tourism ASEAN Page 12

Travel and Tourism – SINGAPORE MARKET
allows guests a choice of 128 hotels in Europe, the US and Asia.
The company also selects IDeaS Inc, provider of revenue management solutions, for their Asian Properties. The Orchard Hotel is the first site to install the e-yield Revenue Management Solution.
2002
M Hotel Singapore re-opens after renovation 2003Waterfront conference centre is launched at Grand Copthorne Waterfront Hotel
2004
Copthorne King’s Hotel completed a $15 million refurbishment project, making it a four-star business hotel with better, modern facilities.
2005
Source: Company websites, press releases, annual reports, Euromonitor International
Financial summary
Millennium and Copthorne hotels in Singapore generated revenue worth S$114 million in 2005. Revenue has grown consistently since 2000, with 2003 being an exception. The outbreak of SARS in 2003, which led to a significant decline in tourist arrivals, severely impacted the overall hotel sector in Singapore. Hence Millennium and Copthorne hotel sales dropped in 2003. The company witnessed revenue growth in 2004 and 2005 as a result of increases in tourist arrivals and special promotions offered by the company.
Summary 8 Millennium & Copthorne: Operational Indicators 2005Financial year end: December
Travel and tourism sales 2005 S$114 million% change over 2004 11%Net earnings 2005 S$13 million% change over 2004 7%Number of employees 266
Source: Company websites, press releases, annual reports, Euromonitor International
3.5 Leading Company Profile: Orange Star
Company background
Valuair; the first low-cost airline to begin operations in Singapore in 2004, merged with Australia’s Jetstar Asia in 2005, to form a single corporate entity called Orange Star. Orange Star is the first major consolidation of Southeast Asia's low-cost airline industry. Under the deal, which is worth S$60 million, Qantas ownership reduced from 49.9% to 44.5% of Jetstar Asia. Other shareholders include Temasek Holdings, Tony Chew with
Gathered by: Department of Tourism ASEAN Page 13

Travel and Tourism – SINGAPORE MARKET
22% in Jetstar Asia and FF Wong with 10% in Jetstar Asia, Singapore Exchange-listed Asiatravel.com and Hong Kong-listed, Malaysian tycoon Lim Goh Tong owned Star Cruises.
Prior to the merger, Valuair offered flights between its base in Singapore to Bangkok, Hong Kong, Jakarta, Perth, Chengdu, and Xiamen. The airline recently dropped services to the Chinese cities of Chengdu and Xiamen and the West Australian city of Perth. It also scrapped services to Bangkok and Hong Kong. Valuair has now become a dedicated Singapore-Indonesia carrier. Hence Valuair will fly to Jakarta and Surabaya. On the other hand, Jetstar Asia offers flights to Bangkok, Hong Kong, Kolkata, Manila, Taipei, Phuket, Yangon, Phnom Penh and Siem Reap,
The main strategy of the newly merged company is to synergise on the strength and reach of both the partners. Though currently both the partners are making losses, the merger is expected to turn the new corporate entity to a profitable venture.
Summary 9 Orange Star: Factfile 2005Company name and status: Orange Star
Parent company: Orange StarCountry of origin: SingaporeTravel and tourism sectors: TransportationMajor travel and tourism brands: Valuair, Jetstar
Source: Company research, Euromonitor International
Recent news
Jetstar Asia tied up with technology and distribution solutions provider, Amadeus for distribution of its flight and fare information to travel agents in Asia-Pacific. This arrangement will help enhance the reach of Jetstar AsiaThe marketing campaign by Jetstar Asia included lower fares to its nine destinations to mark its first year of operations. The airline sold one-way tickets for as low as S$18, for flights to Bangkok. The promotional tickets are valid for travel between January 2 and June 30, 2006Jetstar Asia launched flights to Bangalore, Yangon and to two Cambodian destinations, Phnom Penh and Siem Reap
Summary 10 Orange Star: Summary of Key Events 2000-20052004 Both Valuair and Jetstar were founded in 2004
July 2005 The merged company, Orange Star was foundedAugust 2005 Jetstar Asia begins flights to KolkataSeptember 2005 Valuair announces new flights twice daily from Singapore to JakartaOctober 2005 Valuair announced a new flight from Singapore to SurabayaOctober 2005 Jetstar Asia starts four-times weekly flight service to Phuket
Gathered by: Department of Tourism ASEAN Page 14

Travel and Tourism – SINGAPORE MARKET
Source: Company websites, press releases, annual reports, Euromonitor International
3.6 Leading Company Profile: Raffles Hotels and Resorts Ltd
Company background and travel accommodation operations
Raffles Hotels and Resorts Ltd was established in 1989 to oversee the restoration and re-opening of the world-famous Raffles Hotel in Singapore. Since its establishment, it has built up a portfolio of luxury hotels, and has continued to grow steadily through alliances and agreements with other premium hotel operators worldwide to restore older historic hotels and relaunch them with a luxury, yet traditional style. As of 2006, the company has 9 luxury hotels in operation, as well as a further 5 which are under development and due to open over the next year or two.
Its first step of its international expansion was in 1994, when it took over and restored 2 hotels in Cambodia - Hotel Le Royal in Phnom Penh and Grand Hotel d'Angkor in Siem Reap, which opened for business in 1997.
The company continued to buy up and restore further properties across the globe, penetrating the European market in 1997 with the purchase of Brown's Hotel in London and Hotel Vier Jahreszeiten in Hamburg.
In 1995, Raffles Hotels and Resorts became a subsidiary of Raffles Holdings Ltd, a consortium created to cover a wide range of business interests domestically and internationally in the travel accommodation sector. Raffles Holdings also controlled Swissôtel Hotels & Resorts Ltd under its hotel arm, and under its award-winning concepts and innovative management, both hotel groups extended their global reach and established their name as a respected player in the niche luxury hotels market.
In October 2000, Raffles Hotels and Resorts tapped into North America by acquiring L'Ermitage Beverly Hills. In the same year, it opened new spas under its brand Amrita and several hotel locations, including at its flagship Raffles City in Singapore, as well as Hotel Vier Jahreszeiten in Hamburg and Grand Hotel d'Angkor and Hotel Le Royal, both in Cambodia.
In addition to Amrita spa, Raffles has also developed approximately 50 food and beverage concepts to add to its portfolio, including the Equinox, Jaan, Doc Cheng and THOS SB Raffles brands.
After a change in the top management in 2003, Raffles Holdings restructured its organisation and expanded its hotels portfolio further by initiating management contracts with little or no equity participation. In 2003, The group also received various awards and accolades for its excellence in its hotel operations, top-notch products and services, and innovative human resource management. Raffles was named one of The Strongest Singapore Brands by International Enterprise Singapore for successfully crossing borders
Gathered by: Department of Tourism ASEAN Page 15

Travel and Tourism – SINGAPORE MARKET
and gaining brand recognition worldwide.
In June 2003, Raffles Holdings divested Raffles Brown's Hotel in London for S$161 million with a divestment gain of S$38 million. In December 2003, the Group took over the remaining 43% of its shareholdings to effect a full acquisition in The Raffles Hotel. Total ownership would allow the Group greater flexibility in the financial and operational management of Raffles Hotel.
In July 2005, Raffles Holdings Ltd sold off Raffles Hotels and Resorts Ltd and Swissôtel Hotels & Resorts Ltd for S$1.72 billion to Colony Capital LLC, a US real estate company which owns stakes in several other key properties, including Resorts Atlantic City, Accor, and Costa Smeralda. The purchase of Raffles Hotel by Colony Capital was part of its expansion into property holdings worldwide, especially across Europe and Asia.
Summary 11 Raffles Hotels and Resorts Ltd: Key FactsCompany name and status: Raffles Hotels and Resorts Ltd
Parent company: Colony Capital LLCTravel & tourism industry involvement: Travel accommodationMajor travel & tourism brands: Raffles
Source: Company research, Euromonitor International
Recent news
In August 2004, the company made its mark on the lucrative Indian market by forming a strategic marketing alliance with Taj Hotels Resorts and Palaces, a subsidiary of India’s number one hotel player, Indian Hotels Co Ltd. The alliance is will involve the development of several cross-marketing programmes for Raffles Hotels and Resortst and Taj Luxury Hotels, the brand hotels of both companies in the upper-end segment.
In the same year, the company signed an agreement with Hong Kong company, Veritas Ltd, to manage Raffles Taimana Resort Tahaa, a 65-villa luxury resort in French Polynesia.
In 2005, the company expanded its global reach further, through new agreements in Beijing and Dubai. Raffles Beijing was reopened in May 2006, and Raffles Dubai, a 240-room luxury hotel in Dubai shopping destination, Wafi City is due to open in 2007.
Summary 12 Raffles Holdings: Summary of Key Events 2000-20052000 Opening of Amrita Spas. Acquisition of L'Ermitage Beverly Hills
2002 Raffles International, former management arm of Raffles Hotels and Resorts, takes over the management of Raffles the Plaza and Swissôtel the Stamford, Singapore
Gathered by: Department of Tourism ASEAN Page 16

Travel and Tourism – SINGAPORE MARKET
2003 Raffles named one of “The Strongest Singapore Brands” by International Enterprise Singapore
2004 Enters Indian market through alliance with luxury hotel group, Taj Hotels Resorts and Palaces
2004 Signs agreement to manage Raffles Taimana Resort Tahaa in French Polynesia2005 Raffles Holdings sells hotel business, of which Raffles Hotels and Resorts Ltd is a
subsidiary, to Colony Capital for US$1.45 billionSource: Company websites, press releases, annual reports, Euromonitor International
3.7 Leading Company Profile: Singapore Airlines Ltd (SIA)
Company background
Singapore Airlines Ltd (SIA) began in 1972 and is Singapore's national carrier and leading airline in the country. In 2005, the company commanded a value share of 35% in the Singaporean air industry. SIA's route network spans 90 destinations in 40 countries, and its fleet of 89 passenger aircraft is among the youngest and most modern in the world. SIA has principal activities in air transportation for passenger and cargo services. Other main activities include engineering services, airport terminal services, training of pilots, tour wholesaling and other related activities. Singapore Airlines Ltd has five subsidiaries: Silk Air, Tradewinds Tours & Travel, SIA Engineering Company, SATS and SIA Cargo. Silk Air is a regional airline based in Singapore which operates routes to 25 destinations in Asia, with a focus on leisure tourism. Tradewinds Tours & Travel offers a wide range of tours and travel packages to SIA's worldwide destinations and Silk Air's regional destinations. Tradewinds operates tours and provides a travel agency for both inbound and outbound travel. The SIA Engineering Company is based near Singapore Changi Airport and provides engineering services and maintenance solutions to 80 international carriers. SATS; SIA's ground-handling company, provides a wide range of services including catering, passenger, baggage, cargo and ramp handling, aircraft interior cleaning and aircraft security.
Singapore Airlines is also the largest founding share holder (49%) of the new budget airline Tiger Airways, which is based at Changi Airport. Established in December 2003, the budget airline started operating in September 2004 and now serves four city destinations in Asia with a fleet of two Airbus A320 aircraft.
Singapore Airlines has been a member of Star Alliance since 2000 and has an equity partnership in Virgin Atlantic, the holding company for Virgin Atlantic Airways, Virgin Holidays, Virgin Sun, Virgin's cargo operation and Virgin Aviation Services.
Summary 13 Singapore Airlines Ltd: Company Factfile 2005Company name and status:
Singapore Airlines Ltd
Parent company: Singapore Airlines Ltd
Gathered by: Department of Tourism ASEAN Page 17

Travel and Tourism – SINGAPORE MARKET
Country of origin SingaporeTravel and Tourism sectors:
Air
Major travel and tourism brands:
Singapore Airlines, Silk Air, Tradewinds Tours & Travel, SIA Engineering Company, SATS and SIA Cargo
Source: Company websites, press releases, annual reports, Euromonitor International
Recent news
In 1999, Singapore Airlines signed a Memorandum of Understanding to acquire 49% of Virgin Atlantic, the holding company for Virgin Atlantic Airways, Virgin Holidays, Virgin Sun, Virgin's cargo operation and Virgin Aviation Services. The transaction was completed in 2000. The aim of the partnership was to enable the airlines to implement a wide range of customer benefits as a result of the wider network, including code-sharing, enhancement of their frequent flyer programmes, and shared access to passenger lounges and airport facilities. The two carriers have, however, retained their distinctive identities and continue to develop their own products.
In April 2000, SIA joined the Star Alliance network as the eleventh member, putting it into a position to provide customers with enhanced benefits, such as easier access to a global network, more travel options, and convenient connections.
In 2002, SIA increased operations to Brisbane, Australia to meet the rise in demand of services between Singapore and Australia. Under this arrangement, a total of 70 weekly flights were scheduled between Singapore and various destinations in Australia. Besides these destinations, SIA also recognised Shanghai's potential to bring in a greater number of passengers; being China's leading commercial centre. In 2002, SIA operated an extra daily flight service between Singapore and Shanghai in response to the growing demand for both business and leisure travel to and from Shanghai.
In 2003, SARS struck and had such crippling consequences that SIA had to take drastic cost-cutting measures in order to reduce losses, including retrenchment of staff, wage cuts and mandatory leave-taking. Capacity was also reduced by 32%. At the peak of the crisis, SIA was losing S$5-6 million a day, and thus ended its first quarter with a loss of S$312 million. Nevertheless, the company was able to climb out of the danger zone to post recovery from the losses incurred in the first half of the financial year 2003. The airline continued its recovery with profitable third and fourth quarters, resulting in a year end profit attributable to shareholders of S$849 million. SIA continued its steady growth to post an operating profit of S$307million for the first quarter of the financial year 2004/2005.
In 2004, Singapore Airlines launched the world's longest non-stop flight from Singapore to Los Angeles and New York. The non-stop flights take 16 hours-18 hours. These routes are operated by the airline's newly-acquired A345Leadership aircrafts and provide passengers with a premium economy class, a new class that offers better in-flight entertainment systems and longer legroom for the same price.
Gathered by: Department of Tourism ASEAN Page 18

Travel and Tourism – SINGAPORE MARKET
SIA was abuzz with activities in 2004 to forge new ties and partnerships with other global carriers. In the first half of the financial year, Singapore Airlines agreed to increase code-share flights with Air Canada, Virgin Atlantic and Lufthansa. In the same period, SIA also signed agreements to launch code-share services with British Midland, ANA and Austrian Airlines. SIA also continued to add destinations to its network in 2004, such as Shenzhen in China and Amritsar in India.
In January the same year, Singapore Airlines' Boarding Pass Privileges programme was launched offering customers a range of new privileges and benefits at local and international retailers, resorts, hotels, restaurants and cultural events. The carrier's award-winning in-flight entertainment system, KrisWorld, was also improved, with over 400 entertainment choices available by mid-2004. The expansion in the entertainment choices include 60 blockbuster movies, over 90 TV hits, 196 CDs, 12 audio channels, 33 Nintendo®, 20 PC and three multi-player games. This extensive selection is available on most B747-400 and B777 aircraft, and all A345LeaderShip aircraft.
In 2005, the company sought to boost its coverage of Eastern European markets, and embarked on this through establishing a code-share agreement with LOT Polish Airlines. Through this, customers would have access to a wider choice of flights across Eastern Europe, and travellers from that region would be able to take advantage of Singapore Airline’s existing routes across Asia Pacific.
In 2006, Singapore Airlines extended its destination coverage to Moscow, Russia, with the launch of three flights weekly. Russia is the airline’s first Eastern European destination and with the addition of Russia as a destination, Singapore Airlines now boasts 74 scheduled flights a week to 10 cities in Europe: Moscow, Amsterdam, Athens, Copenhagen, Frankfurt, London, Manchester, Paris, Rome and Zurich.
Summary 14 Singapore Airlines Ltd: Summary of Key Events 1999-20061999 Singapore Airlines signed a memorandum of understanding to acquire 9% of
Virgin Atlantic
2000 Joined Star Alliance as its 11th member2001 SIA Cargo formed as an independently managed subsidiary of Singapore Airlines2002 Increases flights services to meet demand2003 SARS leads to capacity reduction, retrenchments, wage cuts 2004 Introduced longest non-stop long haul flights in the world from Singapore and Los
Angeles and New York2005 Begins code-sharing agreement with LOT Polish Airlines2006 Introduced thrice-weekly flights to Russia
Source: Corporate websites, Press releases, Annual reports, Euromonitor International
Financial summary
Gathered by: Department of Tourism ASEAN Page 19

Travel and Tourism – SINGAPORE MARKET
During the first quarter of 2003, Singapore Airlines Group saw a massive quarterly loss of S$312 million, largely attributable to the Iraq war and the outbreak of SARS. However the business climate proved to be stronger after SARS and careful cost-cutting measures managed to bring the company back to profitably. The overall revenue received by the group fell 7% in the financial year 2003/2004 at S$9,762 million. Overall operating profit also reduced to S$680 million, which corresponded to a drop of 5% as compared to the previous year. Profit before taxation was S$821 million, down 16% from the previous year. The S$156 million decrease was due mainly to lower operating profit, share of profits of associated companies and surplus on disposal of aircraft (including spares and spare engines), and retrenchment and early retirement expenses (included under exceptional items). Profit attributable to shareholders fell by 20% to S$849 million.
Summary 15 Singapore Airlines Ltd: Operational Indicators 2005Financial year end: March
Travel and tourism sales 2005 S$12,013 million% change over 2004 23%Net earnings 2005 S$1,309 million% change over 2004 205%Number of employees 28,554
Source: Trade press (including Travel Daily News, The Straits Times, Travelmole), company research, Euromonitor International
3.8 Leading Company Profile: Zuji Travel Pte Ltd
Company background
Zuji Travel Pte Ltd was established in 2002, and until 2006, was owned by Abacus International and AGC Holdings, a consortium of 15 airlines in the region, including Australian carrier, Qantas. In February 2006, it was acquired by US online travel agency, Travelocity, as part of the company’s move to strengthen its global presence.
Zuji is among the first few travel agents which solely provide online services in Asia. Since 2002, it has grown to become the leading online travel agent in Singapore. In addition to its website in Singapore, it also has operations in Australia, Hong Kong, Korea, New Zealand, and Taiwan. The main strategy of Zuji is to provide exhaustive travel options at attractive prices to a relatively young, affluent and tech-savvy segment of customers. In particular, it
Gathered by: Department of Tourism ASEAN Page 20

Travel and Tourism – SINGAPORE MARKET
continues to target couples, single professional women and fresh graduates. The company’s efforts to attract this target segment include specially tailored packages, such as romance themes for couples and deluxe backpacking tours for younger travellers, which cost 30-40% lower than usual packages.
Zuji offers a range of products, which include airlines, hotels, car rentals and package tours. The airline sales accounted for maximum sales for Zuji’s overall revenue in 2005. In addition to offering traditional airline fares, Zuji also linked up with low cost carriers. Zuji’s efforts in this direction included a package offered in the last quarter of 2004. This package included return Tiger Airways flights on the Singapore-Bangkok route, with one-night hotel accommodation in Bangkok, at a price of S$49. In 2005, Zuji teamed up with Cathay Pacific Airways, to promote travel from Singapore to Sri Lanka. The airfare started from $299 and was valid for trips in the month of May.
The second leading travel segment for Zuji in terms of value sales are hotels. Zuji offered specially discounted rates for several hotel accommodations in 2005. Zuji has also migrated its hotel booking engine to the Travelocity Merchant Hotel platform to promote hotel sales.
Zuji also introduced about 300 international cruise packages, and new lifestyle-tailored themed package vacations, as part of its 2006 holiday collection. These cruise packages, which are valid in 2006, are available on SilverSea cruise line.
Summary 16 Zuji: Company Factfile 2005Company name and status: Zuji Enterprises
Parent company: TravelocityCountry of origin: SingaporeTravel and tourism sectors: Travel RetailMajor travel and tourism brands: Zuji, Priceline
Source: Trade press (including Travel Daily News, The Straits Times, Travelmole), company research, Euromonitor International
Recent news
As part of its growth strategy, Zuji continually teams up with players in the travel and tourism industry to offer promotions to consumers. The most recent alliances include its teaming up with Asia Miles; Asia's leading travel reward programme, to allow travellers a chance to win 1,000,000 Asia Miles if they purchase flight, accommodation and/or car rentals through Zuji’s website. In March 2005, Zuji formed a partnership with major travel guide company, Lonely Planet, whereby Lonely Planet appointed Zuji to power the flight and hotel search, booking and payment functionality for Asia/Pacific on the site Lonelyplanet.com. Such alliances have helped Zuji offer competitive deals to consumers and build its share in the travel agency market.
Gathered by: Department of Tourism ASEAN Page 21

Travel and Tourism – SINGAPORE MARKET
Summary 17 Zuji: Summary of Key Events 2000-20052002 Zuji was launched in Singapore and Hong Kong
2003 Zuji was launched in Taiwan, teamed up with Abacus International to create a new hotel booking solution
2004 Zuji made alliance with MSN, AsiaOne (the Internet arm of Singapore Press Holdings)
2004 Zuji teams up with Asia Miles for promotional online offer2005 Zuji partnership with Lonely Planet
Source: Trade press (including Travel Daily News, The Straits Times, Travelmolee to fuel price surge
4. DEMAND FACTORS
4.1 Leave Entitlement
According to the Employment Act of Singapore, all employees are entitled to paid holidays on days specified in the Schedule of the Holidays during their employment term. In addition, employees are also entitled to a minimum of seven days paid leave with respect to their first 12 months of continuous service with the same employer and provided that the employee has served for a period of no less than three months. Thereafter, employees will be entitled to an additional one-day’s annual leave for every subsequent year during the tenure of employment and this is subjected to a maximum of 14 days. On top of that, employees are also allowed to accept payment in lieu of their annual leave.
As of 2005, Singapore has 11 national holidays falling on working days. For national holidays which fall on a weekend, the next working day becomes the public holiday. The following is a list of national holidays in Singapore for 2005:
1 January – New Year’s Day10 January – Hari Raya Haji
29 January – Chinese New Year30 January – Chinese New Year
14 April – Good Friday29 April – Nature Day
Gathered by: Department of Tourism ASEAN Page 22

Travel and Tourism – SINGAPORE MARKET
1 May – Labour Day12 May – Vesak Day
9 August – National Day21 October – Deepavali
24 October – Hari Raya Puasa25 December – Christmas Day31 December – Hari Raya Haji
Employees in Singapore usually schedule their leave around these national holidays in order to maximise vacation time. There are two periods when longer holidays can be taken. The first is over the Chinese New Year, and the other is the Deepavali and Hari Raya Puasa holidays.
Table 2 Leave Entitlement: Volume 2005Number of days 2005
Total holidays 25.0-Paid holiday 14.0-Public holidays on working days 8.0-Public holidays not on working days 3.0
Source: Ministry of Manpower, Euromonitor International estimates
4.2 Holiday Demographic Trends
Holiday takers
Increase in holiday taking boosted by low cost carriers
Outbound travel among Singaporeans in 2005 witnessed positive growth over the previous years. One of the main factors which contributed to increase in holiday takers in Singapore was the rise of low cost carriers, which made travelling more affordable. The increase in number of destinations covered by low cost carriers ensured outgoing tourist traffic to these destinations as well. In addition to this, several travel agents as well as the National Association of Travel Agents, Singapore (NATAS) offered special promotions, which encouraged holiday-taking and boosted outbound travel.
The other factors which impacted outbound travel included the strong economic
Gathered by: Department of Tourism ASEAN Page 23

Travel and Tourism – SINGAPORE MARKET
performance of the country in 2005, positive economic growth of the country, which led to higher disposable income and enhanced tourism spending as well, in turn encouraging outbound travel by the local people.
Besides the above factors, holiday taking was also impacted by the long weekends, as a result of official holidays falling on Fridays and Mondays. The departures increased significantly on these long weekends to nearby destinations such as Malaysia and Thailand.
Male vs Female
Female travellers accounted for 56% of the total outbound tourist traffic in 2005. While travelling to foreign countries is popular among both males and females in Singapore, females have surpassed males in outbound travel. Over the review period, there was a consistent increase in the number of highly educated, independent, single, working women with relatively higher spending power, and hence tended to take holidays more frequently than their male counterparts.
The relatively high disposable income of female travellers led to increases in high-end travel packages such as spa holidays. Another popular activity among female travellers in 2005 was shopping tourism. These shopping trips were primarily taken to destinations such as Thailand, Indonesia and Hong Kong.
Female travellers also spend relatively higher than their male counterparts on accommodation and transportation in the destination countries, as security and safety is of prime concern.
Age
Travellers in the age group 25 to 34 were the most travelled group, and accounted for 43% of the total outbound travel in 2005. This group comprises of mainly young working adults; of couples or DINK (double-income no kids). The destinations favoured by this group include spa holidays, weekend getaways and leisure trips in nearby destinations such as Thailand, Malaysia, Indonesia and Hong Kong, as well as adventure holidays in parts of Australia and South Africa.
Travellers in the age group 35 to 49, which accounted for 26% of the total outbound travel, were the second most travelled group in 2005. This group is also the major contributor to the travel retail business in Singapore as they are the largest consumer for packaged holidays. This group is comprised mainly professionals of a higher income group, families and business travellers.
There was an increase in the number of travellers belonging to age group15 to 24 in 2005. This was due to the rise of low cost carriers in the region, which makes travelling more affordable. This group primarily consist of students or young working adults. This is also a group which favours free and easy packages, as they offer more flexibility and are not tied
Gathered by: Department of Tourism ASEAN Page 24

Travel and Tourism – SINGAPORE MARKET
to a fixed travel arrangement.
Travellers in the age group 50 to 64 were mainly retirees. This group tends to prefer package tours to destinations that offer sightseeing and cultural trips. Some of their preferred destinations include China, Europe, Australia and New Zealand.
Consumer segmentation
Malaysia was the most popular destination for outbound travel in 2005
Prime destinations for outbound travel in 2005 included Malaysia, Indonesia, Thailand, Hong Kong, China, Australia, South Korea, Taiwan, Japan and Philippines. Malaysia remained the most popular destination, witnessing buoyant growth of 15% in terms of tourist departures from Singapore. The proximity to Malaysia and presence of several natural attractions such as beaches, mountains contributed to its popularity among Singaporeans, especially for short weekend trips. Besides, Malaysia is also an important shopping destination.
Japan was also amongst the fastest-growing markets for outbound travel amongst Singaporeans, up by 15% on the previous year. Japan’s rich culture, as well as unique offerings such as capsule hotels, helped increase tourist traffic from Singapore. The higher spending power of Singaporeans, as a result of positive economic growth of the country, contributed to outbound travel to expensive tourist destinations such as Japan.
Some of the markets with high growth potential in terms of tourist arrivals are India, China and Malaysia. The tourists from these countries primarily visit Singapore for leisure activities such as shopping, sight seeing etc.
Corporate travel grew as a result of buoyant business environment
Outbound travel in 2005 was primarily taken for purpose of leisure, business and visiting friends/relatives. The departures taken for business purposes amounted to three million people. The business trips made in 2005 registered growth of 12% over the previous year. The buoyant business environment witnessed by the country gave a major boost to business travel. One of the trends expected regarding business travel in the coming years, is the shift from travel with traditional airlines by some of the corporate travellers to low cost carriers.
Leisure activities continued to dominate the outbound tourist traffic
Leisure activities continued to dominate outbound tourist traffic. In 2005, the total number of departures grew to 10 million for leisure purpose. Some of the popular destinations for shopping include Hong Kong and Malaysia. The prime activities taken at these destinations are relaxing and shopping.
Special Interest holidays such as spa holidays and golf holidays on the rise
Gathered by: Department of Tourism ASEAN Page 25

Travel and Tourism – SINGAPORE MARKET
One of the types of holiday which has become very popular in recent years is the spa holiday to destinations such as Indonesia and India. Spa holidays are relatively more expensive and are favoured by female travellers. Another type of holiday, which is gaining popularity, is golf holidays. Though there only small segment of tourists opting for this type of holiday, these tourists are high spenders and take these holidays for two to three days.
Short haul holidays registered maximum growth
Holidays taken for short haul as well as long haul destinations in 2005 registered growth over 2004. Holidays taken for duration of up to three days, witnessed the highest growth of 10% over last year. These short duration holidays were primarily taken over long weekends and during official holidays such as Chinese New Year and Deepavali. The main destinations for these holidays were Malaysia and Thailand.
In 2005, long haul holidays; that is, holidays taken for more than a week, grew by 6% over 2004. The popular destinations for long haul were Australia, China and Japan. The long haul holidays were preferred for destinations, which are large in size and hence cannot be covered in a time span of less than a week.
Popularity of package holidays was on the rise in 2005
Package holidays continued to be the most popular type of holiday, taken for outbound travel in 2005. These types of holidays were usually taken to destinations such as China, which is a large country and hence is inconvenient and more expensive to visit without a package tour. Package tours were also preferred for visiting countries with language barriers.
Free and easy holidays, on the other hand, are more favoured in case of repeat visits. The familiarity with countries already visited helped visitors travel at their own convenience. Free and easy are popular among young people as well, who prefer the convenience of travelling on their own.
Table 3 Holiday Demographic Trends 2000-2005% number of people
2000 2001 2002 2003 2004 2005
Holiday takers 91.0 89.0 90.0 85.0 89.0 93.0Non-holiday takers 9.0 11.0 10.0 15.0 11.0 7.0
Source: Singapore Department of Statistics, Euromonitor International estimatesNote: Holiday takers as % of total population
Table 4 Holiday Takers by Sex 2000-2005% number of people
2000 2001 2002 2003 2004 2005
Gathered by: Department of Tourism ASEAN Page 26

Travel and Tourism – SINGAPORE MARKET
Male 49.1 48.0 46.0 46.0 45.0 44.0Female 50.9 52.0 54.0 54.0 55.0 56.0
Source: Singapore Department of Statistics, Euromonitor International estimatesNote: Sex of national tourists (domestic and outbound)
Table 5 Holiday Takers by Age 2000-2005% number of people
2000 2001 2002 2003 2004 2005
0-14 2.0 2.0 2.0 1.0 2.0 2.015-24 14.0 16.0 18.5 18.9 17.5 18.025-34 37.0 39.0 40.5 41.5 41.6 41.535-49 42.0 38.0 34.0 34.6 34.4 36.050-64 3.0 3.0 3.0 2.5 3.0 3.0Over 65 2.0 2.0 2.0 1.5 1.5 1.5
Source: Singapore Department of Statistics, Euromonitor International estimatesNote: Age of national tourists (domestic and outbound)
4.3 Holiday Length of Trip and Seasonality
Length of trip
Trips taken by Singaporeans increased from 8,265,800 in 2004 to 8,855,300 in 2005. The growth in the number of leisure as well as business trips accounted for the increase in the number of trips in 2005.
Trips taken for over seven days witnessed a growth of 6% in 2005 as compared to the previous year. The growth was attributed to the increase in leisure trips to further destinations such as China, Europe, Australia, New Zealand and America, which usually require longer durations of stay.
Trips ranging from four to seven days witnessed a growth of 8% over 2004. The increase was driven by the demand for shopping trips to destinations such as Hong Kong, Taiwan and South Korea.
Trips taken between one to three days had the largest growth of 10% over 2004. The growth was primarily driven by the increase in low cost carriers in the region, which encouraged more outbound travel to nearby destinations such as Indonesia, Malaysia and Thailand.
Seasonality
The highest incidence of holiday taking by Singaporeans was in December, accounting for 12% of the total trips taken in 2005, the period of school holidays and year end holiday
Gathered by: Department of Tourism ASEAN Page 27

Travel and Tourism – SINGAPORE MARKET
season. The month of June, which is also a period of month-long school holidays, had the second highest incidence of holiday taking at 10%. These two periods are popular periods for travel as parents can plan for family trips, and employees can clear their annual leave during year-end. The NATAS fairs which were organised during March and September each year also pushed the demand for outbound travel, giving travellers ample time to plan for their trips in the later months of the year.
Table 6 Length of Trip 2000-20051999 2000 2001 2002 2003 2004 2005
Over 7 days 3,309.3 3,635.0 3,766.0 3,954.3 3,756.6 4,515.2 4,786.14-7 days 3,151.0 3,573.0 3,382.0 3,517.3 2,462.1 2,824.8 3,050.80-3 days 948.0 1,066.0 917.0 962.9 770.3 925.8 1,018.4Length of Trip 7,408.3 8,274.0 8,065.0 8,434.5 6,989.0 8,265.8 8,855.3
Source: Singapore Department of Statistics, Euromonitor International estimatesNote: Includes outbound and domestic trips
5. TOURISM PARAMETERS
5.1 Balance of Tourism Payments
Singapore saw a net balance of tourism payments of S$4 billion in 2005, a decline from S$4.2 billion in 2004. Although total tourism receipts increased by 6% in 2005, the high growth rate of 15% in outgoing tourist expenditure over the previous year led to a slight decline in the balance of tourism payments.
This was due to an increase in outbound travel in 2005 as a result of a better-performing local economy and greater consumer confidence amongst Singaporeans. Shopping trips abroad to Thailand and weekend short-haul trips also helped spur outgoing tourist expenditure compared to the previous year.
Table 8 Balance of Tourism Payments: Value 2000-2005S$ million Receipts Expenditure Balance
2000 10,080.8 7,052.0 3,028.82001 9,121.9 6,546.0 2,575.92002 8,831.2 6,040.0 2,791.22003 6,937.3 5,134.0 1,803.32004 9,799.6 5,647.4 4,152.22005 10,400.0 6,483.2 3,916.8
Gathered by: Department of Tourism ASEAN Page 28
Travel and Tourism – SINGAPORE MARKET
Source: Annual Report of Tourism Statistics, Euromonitor International estimates
5.2 Incoming: Arrivals and Receipts
Arrivals
Arrivals to Singapore in 2005 grew by 7% compared to the previous year, and this represented total of nine million visitors. The main drivers of growth in arrivals were the competitive airfares offered by both budget and full-fledged airlines operating in the region, as well as the increase in travel confidence among regional and international travellers.
The Singapore Tourism Board has set ambitious targets for 2015 to reach 17 million in arrivals and S$30 billion in tourism receipts in 2015. To meet this target, the three key areas of focus identified by STB are to strengthen Singapore’s position as a Leading Convention & Exhibition City in Asia with a strong and dynamic business environment; to develop Singapore as a leading Asian leisure destination by providing an enriching experience that is Uniquely Singapore; and to establish Singapore as the Services Centre of Asia – a place where visitors come to enjoy high-end quality services such as healthcare and education services.
In line with its branding strategy to position Singapore as a unique business and leisure destination, key brand programs were rolled out through broadcast and print media as well as the STB’s “Uniquely Singapore” website: http://www.visitsingapore.com. The brand message was delivered through a series of creative print and TV advertisements that depicted the uniqueness of Singapore through its ways of life, landscapes and trademarks. To complement the branding campaign, other promotions include the ‘My Uniquely Singapore Passport 2005’ which offers both tourists and locals discounts on admission to visitor attractions.
STB will also continue to attract key events that will drive international visitor traffic and help position Singapore as the top-of-mind destination for key customer segments. These key events include the Indian International Film Academy Awards, ITMA Asia – The 2nd Asian International Exhibition of Textile Machinery and the 117th International Olympics Committee Session in 2005, and the Annual Meetings of the International Monetary Fund and the World Bank Group in 2006.
Incoming receipts
Incoming receipts in 2005 amounted to S$10 billion, an increase of 6% in current value terms over 2004. The growth is attributed to the growth in tourist arrivals in 2005.
Expenditure per arrival
Expenditure per arrival declined slightly in 2005 compared to the previous year. The main reason underpinning the decline is the changing profile of incoming tourists, as visitors from Indonesia, China
Gathered by: Department of Tourism ASEAN Page 29

Travel and Tourism – SINGAPORE MARKET
and India, who spend less per visit are becoming more prominent amongst the mix of travellers to Singapore. Total incoming tourism receipts therefore registered a slight downturn following two years of consecutive growth, as countries with more spending power began to increase in number alongside visitors from more developed countries such as Japan, UK and USA.
Table 9 Arrivals: 2000-2005'000 people % growth
2000 7,691.2 -2001 7,518.0 -2.32002 7,566.2 0.62003 6,127.0 -19.02004 8,328.1 35.92005 8,867.5 6.5
Source: Annual Report of Tourism Statistics, Singapore Tourism Board, Euromonitor International
Table 10 Incoming Tourist Receipts: 2000-2005S$ million Current Constant
2000 10,080.8 10,080.82001 9,121.9 9,031.82002 8,831.2 8,778.42003 6,937.3 6,861.02004 9,799.6 9,533.52005 10,400.0 9,977.8
Source: Annual Report of Tourism Statistics, Singapore Tourism Board, Euromonitor International
Table 11 Incoming Tourist Receipts % Growth: 2000-2005% growth Current Constant
2000 5.4 3.92001 -9.5 -10.42002 -3.2 -2.82003 -21.4 -21.82004 41.3 39.02005 6.1 4.7
Source: Annual Report of Tourism Statistics, Singapore Tourism Board, Euromonitor International
Table 12 Expenditure per Arrival: 2000-2005S$
Gathered by: Department of Tourism ASEAN Page 30

Travel and Tourism – SINGAPORE MARKET
2000 1,310.72001 1,213.32002 1,167.22003 1,132.32004 1,176.72005 1,172.8
Source: Annual Report of Tourism Statistics, Euromonitor International estimates
5.3 Incoming: Country of Origin
Top inbound countries
Indonesia, China, Australia, Japan and Malaysia were Singapore’s top five inbound countries in 2005, together accounting for 52% of total visitor arrivals. Growth in total number of arrivals from these countries continued to be driven by the emergence of low cost carriers, particularly for Indonesia, Australia and Malaysia, which were driven by the growth in Adam Air, Jetstar Asia, AirAsia and Valuair, making Singapore more accessible for those seeking to visit their friends and relatives, or come for short breaks in Singapore.
Growth inbound countries
Indonesia remained the largest generating country for tourist arrivals in 2005 and registered 6% growth over 2004. Singapore continued to foster the close tie with Indonesia by signing an Investment Guarantee Agreement in 2005 to boost investments in each other's economies. Tourism is one key area of co-operation and both countries are working towards it by strengthening regional security and fighting terrorism.
STB promoted Singapore in The World Exposition held in Aichi, Japan from March 25 to September 25 through an interactive showcase of Singapore’s culture from a 972 square metre pavilion named “World Without Walls”. Japan remains a key market to Singapore. In 2005, it was the fourth largest source market for Singapore with about 600,000 tourists.
India is one of the fast growing countries contributing to tourist arrivals in Singapore. In 2005, it grew by a solid 15% on the previous year, supported by increased leisure travel as the Singapore Tourism Board (STB) aggressively marketed tourism through the “Uniquely Singapore” campaign. STB also set up a regional office in New Delhi in March 2005 to provide potential visitors with more access to information on Singapore. This is the third regional office set up in India after Mumbai and Chennai. The growth in visitor arrivals was also aided by the emergence of low cost carriers. In April 2005, Jet Airways started running non-stop daily flights between Mumbai and Singapore and in May 2005, Air Sahara commenced a daily service between Delhi and Singapore.
Highest spenders
Gathered by: Department of Tourism ASEAN Page 31

Travel and Tourism – SINGAPORE MARKET
The high volume of tourist arrivals from Indonesia led to high spending by Indonesians
Indonesians accounted for the largest share of 21%, among the total tourist arrivals in Singapore in 2005. They come to Singapore not only for shopping, but also for education as well as medical treatments. While the spend per tourist is not high for Indonesian tourists, the large number of tourist arrivals contributed significantly in high overall spending in Singapore
In contrast to this, the spend per visitor is significantly higher by tourists from countries such as UK, USA and Japan. However, since the tourists from these countries are relatively lesser in number, their contribution to the overall tourism revenue is relatively lower.
The spend per visitor is relatively higher for corporate travellers
In terms of purpose of visit, business visitors accounted for relatively higher spending than those who come for leisure and meeting friends/relatives. Since business travellers value time, efficiency and quality of service and are relatively less budget conscious, the spend per visitor for business travellers was significantly higher than leisure tourists.
Table 13 Arrivals by Country of Origin: 2000-2005'000 people 2000 2001 2002 2003 2004 2005
Australia 510.3 551.0 538.0 392.9 561.2 634.2China 434.3 497.0 671.0 568.5 880.1 924.1Germany 169.4 159.0 157.5 121.4 142.4 151.1Hong Kong, China 286.0 276.0 265.0 226.3 271.7 285.5India 346.4 340.0 374.0 309.4 417.2 480.0Indonesia 1,313.3 1,364.0 1,392.8 1,341.7 1,765.3 1,864.2Japan 929.9 756.0 724.0 434.1 598.8 610.8Malaysia 565.0 576.0 548.5 439.4 537.3 577.6New Zealand 94.3 101.0 94.1 73.5 109.1 119.1Scandinavia 91.6 91.0 84.9 72.6 84.3 86.0South Korea 354.4 359.0 371.0 261.4 361.0 365.0Taiwan 290.8 222.0 209.0 144.9 182.4 218.3Thailand 236.7 261.0 263.8 235.8 341.9 399.3United Kingdom 445.0 460.0 460.0 388.0 457.2 472.7USA 385.6 344.0 328.0 250.7 333.1 368.7Other countries 1,238.2 1,161.0 1,084.6 866.4 1,285.1 1,310.8Arrivals 7,691.2 7,518.0 7,566.2 6,127.0 8,328.1 8,867.5
Source: Annual Report of Tourism Statistics, Singapore Tourism Board, Euromonitor International estimates
5.4 Incoming: Mode of Transport and Purpose of Visit
Gathered by: Department of Tourism ASEAN Page 32

Travel and Tourism – SINGAPORE MARKET
Mode of transport
The number of arrivals by air reached seven million which was 11% growth from 2004. The growth is primarily due to decline in air fares and the rise of the low cost airlines, which has in turn encouraged both inbound and outbound travel. In 2005, two other low cost airlines commenced operations in Singapore and encouraged air travel to and from India. Jet Airways started running non-stop daily flights between Mumbai and Singapore in April 2004 and Air Sahara commenced a daily service between Delhi and Singapore in May 2005.
The number of arrivals by land experienced growth of 9% in 2005. This was primarily due to the improvement of the Vehicle Entry Permit (VEP) scheme which allowed Malaysian visitors to drive in to Singapore and enjoy 10 VEP-free days over a calendar year. Furthermore, the VEP operating hours were shortened from 5pm to 12noon on weekdays during Singapore’s June school holidays.
The number of tourist arrivals by sea saw a marked decline by 29% in 2005, suffering from the popularity of air travel and boom in low cost carriers. It is more time consuming and arguably less comfortable to travel by sea and hence not popular for long distance trips. Cruises remain a relatively popular means of travel for families and older generation travellers to Singapore, although this is set to decline as even these travellers are drawn to the bargain prices and ease to obtain air tickets to Singapore.
Business trends
In 2005, other purposes of visit witnessed growth of 9% over 2004. The growth was boosted by the increase in MICE (meeting, incentives, conventions, exhibitions) events and joint marketing efforts by STB and industry partners. Apart from in-market roadshows and seminars, the board also participated in international trade shows to raise the awareness and familiarity of MICE products among intermediaries and corporate decision makers.
Singapore saw a marked increase in the corporate meetings market. Between 1999 and 2003, Singapore had hosted more than 2,500 corporate meetings, forming 42% of all MICE events during this period. This sector also posted an average growth of 81% that can be attributed in part to the presence of more than 7,000 MNCs in Singapore, of which 4,000 have based their headquarters here. 2005 key events include:
a) The 3rd World Congress of Nephrology (June 26 to 30).Estimated foreign visitors: 5,000
b) The 117th International Olympic Committee Session (July 2 to 9). Estimated foreign visitors: 3,000 to 5,000
c) The World Association for Symphonic Bands and Ensembles International Conference (July 10 to 16). Estimated foreign visitors: 2,000d) The 2nd Asian International Exhibition of Textile Machinery (October 17 to
21).
Gathered by: Department of Tourism ASEAN Page 33

Travel and Tourism – SINGAPORE MARKET
Total exhibition space occupied: 60,000m2
In addition, Singapore’s signature events also drew a significant number of foreign visitors. These include:
International Furniture Fair Singapore 2005 (March 1 to 5).
Number of foreign visitors: 10,500
Infocomm Media Business Exchange (June 13 to 18).
Number of foreign visitors: 29,000
Events that Singapore will host next year include:
a) Asian Aerospace (4,000 foreign delegates expected),
b) Food and Hotel Asia (13,000 foreign delegates)
c) Annual Meetings of the Boards of Governors of the International Monetary Fund and the World Bank Group (15,000 foreign delegates).
Singapore has also launched destination bids for the a) 30,000-strong World Scout Jamboree in 2011 and
b) International Congress & Convention Association Conference in 2007.
Leisure trends
Leisure was the most common purpose of visit in 2005 and grew by 10% as compared to 2004. The high growth rate is partly due to an overall increase in travel confidence and initiatives by STB in promoting Singapore as a unique destination for leisure.
Table 14 Arrivals by Method of Transport: 2000-2005'000 people 2000 2001 2002 2003 2004 2005
Air 5,691.4 5,360.0 5,356.3 4,231.9 6,079.5 6,723.0Land 846.0 984.0 1,033.2 867.1 1,165.9 1,273.4Rail 304.5 310.6 315.9 268.5 311.4 323.9Sea 849.3 863.4 860.8 759.5 771.2 547.2Arrivals 7,691.2 7,518.0 7,566.2 6,127.0 8,328.1 8,867.5
Source: Annual Report of Tourism Statistics, STB website, Euromonitor International estimates
Gathered by: Department of Tourism ASEAN Page 34

Travel and Tourism – SINGAPORE MARKET
Table 15 Arrivals by Purpose of Visit: 2000-2005'000 people 2000 2001 2002 2003 2004 2005
Business 1,407.5 1,263.0 1,389.3 1,091.1 1,499.1 1,637.2Leisure 3,807.1 3,721.0 3,547.7 2,712.9 3,747.6 4,122.4Visiting friends/relatives 469.2 473.2 520.9 453.5 583.0 606.3Others 2,007.4 2,060.8 2,108.3 1,869.5 2,498.4 2,501.6Arrivals 7,691.2 7,518.0 7,566.2 6,127.0 8,328.1 8,867.5
Source: Annual Report of Tourism Statistics, STB website, Euromonitor International estimatesNote: Others includes, MICE, education, others and not stated
5.5 Outgoing: Departures and Expenditure
Departures
The number of departures in 2005 increased by 14% compared to 2004. A more positive economic outlook and increase in travel confidence boosted the growth of departures in 2005. On top of that, local travel retailers and trade associations such as NATAS also aggressively promoted outbound travel by organising travel fairs and offering promotional tour packages. Heightened competition from airlines and the rise of low cost airlines also encouraged travel within the region such as to Indonesia and Thailand.
Outbound expenditure
Outgoing tourism expenditure for 2005 increased by 15% as compared to the previous year as the number of outbound travellers increased.
Expenditure per departure
While outgoing tourist expenditure increased in 2005, the expenditure per departure remained stable at S$409 million. This was mainly due to a declining trend in the prices for tourism goods and services such as transportation and accommodation. The increase in the number of low cost airlines had in turn lowered the average price of air travel, while popularity of budget accommodation such as budget hotels and hostels also lowered the average price of accommodation.
Table 16 Departures: 2000-2005'000 people % growth
2000 10,013.9 -2001 11,188.1 11.72002 11,718.4 4.72003 9,384.8 -19.92004 13,945.3 48.62005 15,851.7 13.7
Source: Annual Report of Tourism Statistics, STB website, Euromonitor International estimates
Gathered by: Department of Tourism ASEAN Page 35

Travel and Tourism – SINGAPORE MARKET
Table 17 Outgoing Tourism Expenditure: 2000-2005S$ million Current Constant
2000 7,052.0 7,052.02001 6,546.0 6,481.42002 6,040.0 6,003.92003 5,134.0 5,077.52004 5,647.4 5,494.12005 6,483.2 6,220.0
Source: Annual Report of Tourism Statistics, STB website, Euromonitor International estimatesTable 18 Outgoing Tourism Expenditure: 2000-2005% growth Current Constant
2000 10.6 9.12001 -7.2 -8.12002 -7.7 -7.42003 -15.0 -15.42004 10.0 8.22005 14.8 13.2
Source: Annual Report of Tourism Statistics, STB website, Euromonitor International estimatesTable 19 Expenditure per Departure: 2000-2005S$
2000 704.22001 585.12002 515.42003 547.12004 405.02005 409.0
Source: Annual Report of Tourism Statistics, STB website, Euromonitor International estimates
5.6 Outgoing: Destination
Top outbound destinations
The top five destinations for outbound travel in 2005 were Malaysia, Indonesia, China, Thailand and Hong Kong. In all, these five countries accounted for 94% of all departures.
Growth outbound destinations
Gathered by: Department of Tourism ASEAN Page 36

Travel and Tourism – SINGAPORE MARKET
Malaysia remained the top choice among Singaporeans, accounting for 69% of all departures in 2005 due to the close proximity and connectivity via air, land and sea. Land travel to Malaysia is also made easier with two causeways connecting the two countries one of which is located at Tuas and the other at Woodlands. According to the Malaysia Tourism Board, Singapore is the number one market for Malaysia and constituted about 70% of the total tourist arrivals to Malaysia.
Indonesia was the second most popular destination for Singaporeans, accounting for 13% of departures in 2005. This was primarily due to its accessibility and rich cultural and natural settings that appealed to Singaporeans. It is also a popular destination for weekend getaways and spa holidays especially at its islands such as Bintan, Batam and Bali.
China and Thailand were the third and fourth most popular destinations respectively, both growing remarkably at 68% and 12% in 2005. Visitors to China continued to be supported by older Singaporean travellers aged 40 and above. As such, growth continued to be driven by growing interest in scenic and cultural package tours such as those to Tibet and Xian. Travel to Thailand also continued to be spurred by prominent marketing campaigns by the Tourism Authority of Thailand (TAT), which continued to attract Singaporeans going to Thailand for short breaks for shopping or beaches. In August 2005, the TAT organized a major roadshow in Singapore to attract Singaporeans, as well as the large number of expatriates residing there. TAT also focussed more on promoting specific destinations within Thailand, such as Chiang Mai, by working with local travel agents as well as with Thai Airways International and the Singaporean carriers to promote special packages to Chiang Mai. New flights also encouraged travel between Thailand and Singapore as Tiger Airways inaugurated its first Singapore-Chiang Mai route service in February 2005, adding to the thrice-weekly direct flights being operated by Silk Air.
Singapore is the largest source market in Southeast Asia for Hong Kong. Growth to Hong Kong is mainly attributed to strong support from travel agents. Hong Kong remained one of the favourite outbound travel destinations as Singaporeans enjoyed two of the favourite national past times, which are shopping and eating in Hong Kong.
Australia is the sixth most popular destination for outbound travel in 2005 and growth is healthy at 7% over 2004. Singapore is a key market for Australia. Tourism Australia organized key events such as a film festival, a fashion and design showcase, visual arts exhibitions, wine and dine promotions and a ‘Study in Australia’ exhibition, and is also moving actively into educational tourism where it has a lead in the region to attract Singapore tourists.
Long haul vs short haul
Short haul holidays were more preferred among Singaporeans in 2005 as the top destinations visited were mostly located in the region. With the boom in low cost carriers, short-haul travel is expected to rise dramatically over the next few years, sparking weekend trips within the region, as Singaporeans seek to venture outside their small island home for a short break. Singapore’s currency also remains relatively strong compared to other
Gathered by: Department of Tourism ASEAN Page 37

Travel and Tourism – SINGAPORE MARKET
regional countries, thus making visits to other countries more affordable. Now that low cost carriers are making short-haul travel far more accessible, travellers who previously restricted the number of holidays abroad will consider trips to nearby destinations such as Bangkok and Bali on a more regular basis as they seek a retreat from their daily routine.
Highest expenditure destinations
The destinations which accounted for highest expenditure in 2005, for outbound travel were Hong Kong and Japan. While Hong Kong is popular among local people for shopping, sight seeing and food, Japan is favoured for its rich culture.
The trips to Japan are expensive due to overall high cost of living. Hence, while the number of departures was less than those made to Hong Kong, the spending per tourist was significantly higher in Japan. In contrast to this, Hong Kong offered a huge range of shopping options ranging from high-end shopping malls to open air markets for bargain deals. Thus, the high departure volume to Hong Kong led to greater overall spending.
In addition to Hong Kong and Japan, the outbound travel to exotic destinations such as Tasmania and Egypt, also accounted for higher spending per tourist.
Table 20 Departures by Destination: 2000-2005'000 people 2000 2001 2002 2003 2004 2005
Australia 587.4 268.0 214.4 253.4 251.1 268.7China 389.0 493.0 546.7 378.1 636.8 708.9Hong Kong, China 400.0 368.0 441.6 265.7 463.9 520.0Indonesia 1,567.3 1,647.4 1,314.7 1,469.3 1,797.0 2,012.6Japan 97.0 76.0 91.2 76.9 90.0 103.5Malaysia 5,420.2 6,951.6 7,547.8 5,922.3 9,520.3 10,948.3Philippines 53.0 44.0 46.2 51.3 60.3 65.2South Korea 99.0 53.6 59.0 76.4 85.2 96.2Taiwan 88.0 134.0 140.7 78.7 116.9 128.6Thailand 719.1 669.0 735.9 515.6 578.0 640.0Other destination countries 593.9 483.5 580.2 297.1 345.8 359.6Departures 10,013.9 11,188.1 11,718.4 9,384.8 13,945.3 15,851.7
Source: PATA (Pacific Asia Travel Association), Euromonitor International estimates
5.7 Outgoing: Mode of Transport and Purpose of Visit
Mode of transport
The number of departures by air increased by 15% in 2005, and accounted for 46% of
Gathered by: Department of Tourism ASEAN Page 38

Travel and Tourism – SINGAPORE MARKET
total departures. The growth was mainly due to heightened competition among airlines that led to a decline in the average price of airfares, as well as the rise of low cost carriers which encouraged travel by air within the region. Outbound departures by land in 2005 grew by 10% over 2004. Outbound travel by land is primarily taken to parts of Malaysia, as well as Indonesia. The modes of transport to Malaysia usually include coaches or cars. However, with the drop in prices for airfares, travellers may opt for air travel instead as land travel is usually more time consuming.
Departures by sea in 2005 grew by 21% over 2004. The growth in sea travel was driven by promotions for cruises, as well as increases in travel to neighbouring islands such as Batam, Bintan, Tanjong Pinang and Tanjong Balai.
Purpose of visit
Business trends
The improvement in the global economic climate, as well as increases in travel confidence, led to an increase in corporate travel. The number of business trips grew by 12% in 2005 as compared to 2004.
Leisure trends
As travelling became more affordable, especially with falling prices of airfares, leisure trips taken by Singaporeans increased. Leisure trips grew by 16% in 2005 as compared to 2004. Travel fairs organized by NATAS and individual travel agents pushed for the growth of leisure trips, as new travel products and existing tour packages for leisure were marketed aggressively.
Table 21 Departures by Mode of Transport: 2000-2005'000 people 2000 2001 2002 2003 2004 2005
Air 2,924.0 3,977.9 5,569.1 5,443.3 6,382.2 7,339.5Land 5,209.7 4,954.0 3,441.9 2,238.4 4,270.9 4,676.7Rail 190.3 257.3 175.8 93.8 237.1 288.2Sea 1,689.9 1,998.9 2,531.6 1,609.3 3,055.1 3,547.3Departures 10,013.9 11,188.1 11,718.4 9,384.8 13,945.3 15,851.7
Source: Annual Report of Tourism Statistics, Euromonitor International estimates
Table 22 Departures by Purpose of Visit: 2000-2005'000 people 2000 2001 2002 2003 2004 2005
Business 1,247.0 1,870.5 2,150.5 1,999.0 2,998.2 3,358.0Leisure 6,514.9 6,139.2 7,296.4 5,799.8 8,646.1 10,029.5Visiting friends/relatives 1,890.0 2,798.4 1,888.7 1,276.3 1,952.3 2,255.0Others 362.0 380.0 382.8 309.7 348.6 209.2Departures 10,013.9 11,188.1 11,718.4 9,384.8 13,945.3 15,851.7
Gathered by: Department of Tourism ASEAN Page 39

Travel and Tourism – SINGAPORE MARKET
Source: Annual Report of Tourism Statistics, Euromonitor International estimates
5.8 Domestic: Trips and Expenditure
Trips
The number of domestic trips taken in 2005 witnessed growth of 7% over 2004. The trips made by locals were primarily to tourist attractions such as Orchard Road, Sentosa, Chinatown, theme parks and theatres as well as other entertainment spots. The increase in domestic trips taken in 2005 reflected a stronger economy in Singapore and also a result of strong marketing efforts by STB and the various tourist attractions.
In order to encourage Singaporean to step out, STB organized yearly events such as the Singapore Food Festival and the Great Singapore Sale which satisfied the two national hobbies of Singaporeans which are eating and shopping.
On top of that, STB continued activities such as “My Tourism Passport” which offered both locals and tourists discounts on visits to various tourist attractions.
Efforts were also made by individual tourist attractions to attract local visitors. For example, the National Heritage board was actively promoting a museum-going culture in Singapore by doing more targeted and membership marketing. Other attractions such as Wild Wild Wet and Singapore Zoo also tried to reach out to locals through offering promotions for family packages.
Expenditure
Domestic tourism expenditure increased by 7% in 2005 to reach S$360 million. Leisure activities such as shopping contributed largely to the domestic spending. According to the Department of Statistics, total retail sales during the period of the Great Singapore Sale rose to $5 billion this year, up from $4.6 billion in the previous corresponding period. Of the $5 billion in retail sales, shopping expenditure by tourists amounted to $650 million, with locals accounting for the remaining $4.35 billion. The amount is the highest since the event was launched 12 years ago.
Expenditure per trip
Expenditure per domestic trip saw minimal change on the previous year, recorded at S$245 in 2005. Falling prices paid for goods and services during domestic trips, and the lowering of some admission fees to some tourist attractions played a role in expenditure per trip, although increased expenditure on food and higher expenditure as a result of successful promotions in shopping malls helped offset any potential decline in expenditure that year.
Table 23 Domestic Tourist Trips: 2000-2005'000 trips % growth
Gathered by: Department of Tourism ASEAN Page 40

Travel and Tourism – SINGAPORE MARKET
2000 905.5 -2001 1,024.9 13.22002 1,124.6 9.72003 1,277.5 13.62004 1,372.7 7.52005 1,470.2 7.1
Source: Ministry of Transport, Euromonitor International estimatesTable 24 Domestic Tourist Expenditure: 2000-2005S$ million Value % value growth
2000 258.6 -2001 273.8 5.92002 286.0 4.52003 310.5 8.62004 336.7 8.42005 360.3 7.0
Source: Ministry of Transport, Euromonitor International estimates
Table 25 Expenditure per Domestic Trip: 2000-2005S$
2000 285.62001 267.12002 254.32003 243.12004 245.32005 245.1
Source: Annual report of tourism statistics, Euromonitor International estimates
5.9 Domestic: Trips by Destination
Top domestic destinations
Orchard Road continued to be the most popular destination in 2005, registering the highest number of domestic trips in 2005. The number of trips made by locals to Orchard Road in 2005 was 439,000, an increase of 13% over 2004. Heightened consumer confidence and effective promotional campaigns, most notably the annual Great Singapore Sale which takes place in June, helped continue to attract high visitor numbers to the area.
Island resort, Sentosa, was the second most popular destination among locals in 2005, and trips taken by locals to Sentosa registered growth of 7% over 2004. The island remains a favourite destination for families and young couples to spend short weekends or day-trips together. Its proximity as a getaway island, which offers a wide variety of major family attractions such as a Dolphin Lagoon and the Underworld, continued to draw in families
Gathered by: Department of Tourism ASEAN Page 41

Travel and Tourism – SINGAPORE MARKET
throughout the year.
Growth in domestic destinations
Orchard Road; which is the premiere shopping district in Singapore, is also comprised of several entertainment spots such as pubs and cinemas as well as food establishments, thus making it a popular destination amongst locals. Some of the activities that attracted crowds to Orchard Road in 2005 included the Glutton Square; a food street that featured a wide variety of local hawker fare located at the car park compound in Somerset, and the Great Singapore Sale which is held yearly during June and July. On top of that, individual malls and boutiques also held their own sales or promotions to attract shoppers. Travelling in Orchard Road was also made easier with improved traffic and pedestrian flow. New traffic schemes at Orchard Link were unveiled on 10 March 2005, whereby LTA commissioned a signalised pedestrian crossing across Orchard Road, between Claymore Road and Cuscaden Road, which enabled pedestrians to cross Orchard Road safely and more easily visit the nearby shopping malls.
In 2005, locals made up 60% of the total visitors to Sentosa. The prime reason for the increase was the launch of new themed spots within the island such as the Carlsberg Sky Tower and the Sentosa Luge, which is a 650-metre luge track with an aerial chair lift cableway where riders can cruise down from the hilltop to the beach.
The revamp of Chinatown to include night markets, as well as the increase in accessibility with the development of the North East Line enabling commuters from the northeast region of Singapore to travel direct to Chinatown via the Mass Rapid Transit, increased the number of domestic tourists visiting this attraction. Apart from that, activities that draw crowds to Chinatown include the Lunar New Year celebration, which is a festive period that lasts for 15 days and usually falls during the months of January and February. The streets of Chinatown are decorated with lighting and night markets with stalls selling New Year goods such as bakery products, decorative items and candies are set up.
A wide spread of specialty restaurants, themed pubs and wine bars can be found in Boat Quay and Clarke Quay, thus making it a popular area for night entertainment. Major banks and offices are also situated in the area, and hence it is also a popular area patronized by working professionals for dining and entertainment in the evenings.
The growth of domestic visitors visiting Marina Square was primarily due to the completion of the renovation of the shopping mall that attracted many locals with its increased number of retailers and food establishments. Ongoing development will also allow the shopping mall to seamlessly connect to the proposed Convention Centre MRT station, Suntec City, Esplanade and the five-star hotels such as The Oriental, Singapore, Pan Pacific Singapore, Ritz Carlton Millennia and Conrad International Centennial Singapore.
Gathered by: Department of Tourism ASEAN Page 42

Travel and Tourism – SINGAPORE MARKET
Table 26 Domestic Trips by Destination: 2000-2005'000 trips 2000 2001 2002 2003 2004 2005
Boat/Clarke Quay 86.6 95.6 100.8 113.3 105.5 107.6Chinatown 116.7 129.0 144.4 151.2 165.9 172.5Jurong BirdPark 38.6 41.4 48.8 54.9 55.6 56.7Marina Square 57.8 67.4 81.3 94.1 98.6 103.5Night Safari 35.7 35.8 37.0 38.6 45.9 48.7Orchard Road 247.6 264.5 301.5 348.9 390.0 438.8Sentosa 224.1 280.6 289.5 334.9 367.1 392.8Singapore Zoological Garden 16.4 17.6 19.5 22.0 22.0 22.7Other domestic tourism destinations
82.0 93.0 101.8 119.6 122.1 127.0
Domestic tourism 905.5 1,024.9 1,124.6 1,277.5 1,372.7 1,470.2Source: Ministry of transport, Euromonitor International estimates
5.10 Domestic: Trips by Mode of Transport
The most preferred mode of transport taken in 2005 was land transport which accounted for 53% of total trips taken by locals. Land transport comprised mainly of buses and taxis of which buses were the most prominent modes of travel in 2005, as they are relatively cheaper and widely accessed.
Trains as a mode of transport taken by locals to tourist attractions registered growth of 6% in 2005. The growth is mainly attributed to the development of the North East Line (NEL) which operates on a route that covers several tourist attractions in Singapore such as Little India, Chinatown, Clarke Quay, Dhoby Ghaut and Harbour Front.
Travel by sea within Singapore in 2005 increased by 5% over 2004. Sea transport is mainly comprised of ferry services operating from the Singapore Cruise Centre to Sentosa and other islands, as well as boat rides along the Singapore River.
Table 27 Domestic Trips by Mode of Transport: 2000-2005'000 trips 2000 2001 2002 2003 2004 2005
Air - - - - - -Land 471.7 533.5 595.2 657.0 722.7 780.5Rail 320.5 365.0 389.7 467.6 491.0 522.9Sea 113.3 126.4 139.7 152.9 159.0 166.7Domestic tourism 905.5 1,024.9 1,124.6 1,277.5 1,372.7 1,470.2
Source: Ministry of Transport, Euromonitor International estimates
Gathered by: Department of Tourism ASEAN Page 43

Travel and Tourism – SINGAPORE MARKET
5.11 Tourism Spending
National tourism spending
Total tourism spending in 2005 amounted to S$11 billion, representing growth of 6% over 2004. The growth was a result of an increase in tourist arrivals in 2005, as well as the continued efforts of STB in promoting Singapore to both tourists and locals.
Shopping continued to be the largest category for tourism spending, accounting for 35% of total tourism spending in 2005, and registering growth of 6% over 2004. Orchard Road and Marina Square are some of the popular destinations for shopping among tourists and locals in Singapore. The Great Singapore Sale (GSS), held in the month of June and July, along with the other key retail events like the Singapore Fashion Festival and Singapore JewelFest, played a key role in enhancing Singapore’s position as Asia’s Shopping Capital. In 2005, STB also launched the “Great Shopping and Eating Transit Programme” in July to entice transit passengers to step out of the airport to experience GSS.
Other efforts to enhance visitors’ shopping experience during the GSS included a tourist lucky dip for a minimum spend of $300 a day. Attractive prizes to be won comprised foot massages and shopping vouchers. STB, together with MasterCard also offered a “Shop for Free” lucky draw for visitors from Indonesia, Malaysia and Thailand. With every S$50 charged to their MasterCard during GSS, these visitors stood to win up to S$1,000 worth of purchases charged to their MasterCard.
Tourism spending on food amounted to S$1 billion, which accounted for 9% of total tourism spending in 2005. Events to promote sales in food included the Singapore Food Festival which is a yearly event held to promote food sales in Singapore. Apart from that, the World Gourmet Summit was held in April where eleven internationally-acclaimed star chefs and ten winemakers from prestigious wineries showcased their skills and specialties. Visitors were also treated to the world’s finest wines and cuisine.
Travel within the country accounted for 4% of total tourism spending in 2005. International travellers spent relatively more on travel compared to their local counterparts, opting for relatively higher-priced taxis instead of other modes of transport such as buses and trains, as they were not familiar with getting around the country.
Entertainment expenditure increased by 4% and accounted for 3% of total tourism spending in 2005. Entertainment expenditure comprised mainly of admission fees to tourist attractions and cover charges to night entertainment spots. The growth in entertainment
Gathered by: Department of Tourism ASEAN Page 44

Travel and Tourism – SINGAPORE MARKET
expenditure is lower as compared to others as admission to some tourist attractions such as Orchard Road, Marina Square and Chinatown are free. In addition, various tourist attractions such as Sentosa and Singapore Zoo offered special promotions which lowered admission sales value.
Outbound tourism expenditure
Outbound tourist expenditure for 2005 increased significantly by 15% over 2004, supported by continued growth in shopping, which, together with accommodation, represents the largest component for outgoing tourist expenditure.
Shopping accounted for 22% of outbound tourist expenditure, the most favoured activity undertaken by Singaporeans as they travelled abroad. Some have planned their trips to coincide with the various seasonal sales in different locations such as in Malaysia, Thailand, Hong Kong and Taiwan.
Food was the third largest component for outgoing tourist expenditure commanding 16% of outgoing tourist expenditure in 2005. Eating and dining was a favourite pastime of Singaporeans. Singaporeans also favoured locations which can offer them an opportunity to savour different cuisines. For instance, Hong Kong and Thailand are two of the most visited countries where food is a major draw for tourists. Closer to home, Singaporeans also enjoyed crossing the causeway to Johor Bahru for seafood treats and other cuisines.
Table 28 Tourism Spending by Sector: Value 2000-2005S$ million 2000 2001 2002 2003 2004 2005
Total tourism expenditure 10,339.4 9,395.7 9,117.2 7,247.8 10,136.3 10,760.3-Accommodation 1,354.9 1,293.5 1,189.0 964.9 1,064.0 1,166.3-Entertainment 252.9 289.5 349.0 225.2 362.8 376.6-Excursions 1.0 2.0 4.0 5.0 9.0 10.0-Food 842.5 846.6 747.6 618.8 1,013.3 1,016.8-Shopping 3,235.1 2,807.9 2,863.8 2,260.8 3,545.3 3,744.6-Travel within country 465.3 431.5 338.5 299.9 412.4 452.1-Other tourism expenditure 4,187.7 3,724.7 3,625.4 2,873.2 3,729.5 3,993.8
Source: Annual report of tourism statistics, Euromonitor International estimatesNote: Others includes incoming airfares with Singapore Airlines, medical and education tourism Note2: Includes incoming tourist receipts and domestic tourist expenditure
Table 29 Outgoing Tourist Expenditure by Sector 2005% retail value rsp 2005
Accommodation 30.0
Gathered by: Department of Tourism ASEAN Page 45

Travel and Tourism – SINGAPORE MARKET
Entertainment 13.8Excursions 1.7Food 15.5Shopping 21.6Travel within country 12.1Others 5.3Total 100.0
Source: Annual report of tourism statistics, Euromonitor International estimates
5.12 Tourism Spending: Method of Payment
Domestic Spending
Amongst domestic spending, cash remained the preferred option in Singapore in 2005 and accounted for 50% of total value sales. Credit cards accounted for 37%, due to relatively high ownership levels as a result of fierce promotional activity from competing credit card companies. Whilst debit cards exist, they remained the least popular option, due to the strength of credit cards. Credit cards are widely accepted in shops and food establishments in Singapore. Prepaid cards are mainly used for travel within countries such as the EZlink card which is used for commuting bus and train services in Singapore.
Outgoing Spending
For outgoing tourism, cash still remained the number one method of payment with 45% of total value sales, supported by the abundance of money changers which are widely accessible in Singapore to easily exchange cash into foreign currencies before travel. However, credit cards held a stronger position than with domestic tourism, commanding 43% in 2005, due to its convenience. Consumers increasingly use credit cards when travelling abroad, driven by the competitive credit card schemes offered, as well as the perception that it is more convenient and safer to carry a card then large amounts of cash.
Table 30 Method of Payments for Tourism Spending: % Breakdown 2005% Retail Value RSP Domestic Outgoing
Cash 50.0 45.0Credit card 37.0 43.0Debit card 12.0 9.0Prepaid cards 1.0 0.0Traveller's cheques 0.0 3.0Total 100.0 100.0
Source: Monetary Authority of Singapore website, Euromonitor International estimates
5.13 Forecast Performance
Arrivals and receipts
Gathered by: Department of Tourism ASEAN Page 46

Travel and Tourism – SINGAPORE MARKET
The number of tourist arrivals in the forecast period is likely to see a CAGR of 6%. The prime reason for the expected growth is the growth of low cost carriers. In the coming years, budget airlines are likely to cover long haul destinations as well and increase their frequency to short haul destinations. Other than budget airlines, STB’s efforts in the forecast period are expected to boost tourist arrivals.
STB’s future plans pertaining to the tourism sector are to focus on three key customer segments, which are BTMICE (Business Travel, Meetings, Incentives, Conventions and Exhibitions), leisure and services (education and healthcare).
Some of the efforts being made by STB in this direction include the launch of a proposal of an integrated resort at Marina Bay and Sentosa. The integrated resort at Marina Bay is aimed to promote Singapore as an important destination for meetings, conventions and exhibitions, while the Sentosa project is focused on enhancing entertainment and leisure activities in Singapore. The Sentosa project includes theme parks, resort hotels, restaurants, shopping and other attractions. The two casinos, which are to be built at Sentosa and Marina Bay, are likely to be completed by 2009. These two projects are expected to add S$1.5 billion a year to the economy.
The Government has also announced a S$1.6 billion package to be invested in Orchard Road. This rejuvenation project is expected to enhance Orchard Road’s image as an important shopping destination. All of the above efforts are likely to enhance not only tourist arrivals, but also the yield per tourist, which in turn is expected to increase the incoming expenditure in the forecast period.
Departures and expenditure
The number of departures in the forecast period is likely to grow at 10%, while the outgoing expenditure is expected to grow at 7% year on year over the same period. The rise of low cost carriers will continue to drive growth in outbound travel, which will see stronger growth compared to outbound expenditure over the next five years.
The improved local economy is likely to boost departures as well as outbound travel expenditure over the forecast period. Also, the expected increase in outbound travel to long haul destinations as well as exotic destinations will boost outbound expenditure in the forecast period. Additionally, the increasing popularity of high-end holidays such as spa holidays, and adventure-based holidays are expected to enhance outbound travel as well as expenditure.
Table 31 Forecast Arrivals: 2005-2010'000 people % growth
2005 8,867.5 -2006 9,421.9 6.32007 10,003.7 6.2
Gathered by: Department of Tourism ASEAN Page 47

Travel and Tourism – SINGAPORE MARKET
2008 10,621.8 6.22009 11,268.4 6.12010 11,950.4 6.1
Source Euromonitor International estimates
Table 32 Forecast Incoming Tourism Receipts: 2005-2010S$ million constant 2005 rsp Value % value growth
2005 10,400.0 -2006 11,440.0 10.02007 12,526.8 9.52008 13,654.2 9.02009 14,814.8 8.52010 16,000.0 8.0
Source Euromonitor International estimates
Table 33 Forecast Departures: 2005-2010'000 people % growth
2005 15,851.7 -2006 17,800.4 12.32007 19,895.9 11.82008 21,932.4 10.22009 23,919.6 9.12010 25,850.1 8.1
Source Euromonitor International estimates
Table 34 Forecast Outgoing Tourism Expenditure: 2005-2010S$ million constant 2005 rsp Value % value growth
2005 6,483.2 -2006 7,001.9 8.02007 7,527.0 7.52008 8,053.9 7.02009 8,577.4 6.52010 9,092.0 6.0
Source Euromonitor International estimates
Table 7 Seasonality of Trips: 20052005
Gathered by: Department of Tourism ASEAN Page 48

Travel and Tourism – SINGAPORE MARKET
Seasonality of trips ('000 trips) --January (% of trips) 7.0-February (% of trips) 6.0-March (% of trips) 7.2-April (% of trips) 7.4-May (% of trips) 8.6-June (% of trips) 10.3-July (% of trips) 7.7-August (% of trips) 7.9-September (% of trips) 8.0-October (% of trips) 8.1-November (% of trips) 9.8-December (% of trips) 12.0
Source: Singapore Department of Statistics, Euromonitor International estimatesNote: For domestic trips and departures by destination
5. TOURISM PARAMETERS
5.1 Balance of Tourism Payments
Singapore saw a net balance of tourism payments of S$4 billion in 2005, a decline from S$4.2 billion in 2004. Although total tourism receipts increased by 6% in 2005, the high growth rate of 15% in outgoing tourist expenditure over the previous year led to a slight decline in the balance of tourism payments.
This was due to an increase in outbound travel in 2005 as a result of a better-performing local economy and greater consumer confidence amongst Singaporeans. Shopping trips abroad to Thailand and weekend short-haul trips also helped spur outgoing tourist expenditure compared to the previous year.
Table 8 Balance of Tourism Payments: Value 2000-2005S$ million Receipts Expenditure Balance
2000 10,080.8 7,052.0 3,028.82001 9,121.9 6,546.0 2,575.92002 8,831.2 6,040.0 2,791.22003 6,937.3 5,134.0 1,803.32004 9,799.6 5,647.4 4,152.22005 10,400.0 6,483.2 3,916.8Source: Annual Report of Tourism Statistics, Euromonitor International estimates
5.2 Incoming: Arrivals and Receipts
Gathered by: Department of Tourism ASEAN Page 49

Travel and Tourism – SINGAPORE MARKET
Arrivals
Arrivals to Singapore in 2005 grew by 7% compared to the previous year, and this represented total of nine million visitors. The main drivers of growth in arrivals were the competitive airfares offered by both budget and full-fledged airlines operating in the region, as well as the increase in travel confidence among regional and international travellers.
The Singapore Tourism Board has set ambitious targets for 2015 to reach 17 million in arrivals and S$30 billion in tourism receipts in 2015. To meet this target, the three key areas of focus identified by STB are to strengthen Singapore’s position as a Leading Convention & Exhibition City in Asia with a strong and dynamic business environment; to develop Singapore as a leading Asian leisure destination by providing an enriching experience that is Uniquely Singapore; and to establish Singapore as the Services Centre of Asia – a place where visitors come to enjoy high-end quality services such as healthcare and education services.
In line with its branding strategy to position Singapore as a unique business and leisure destination, key brand programs were rolled out through broadcast and print media as well as the STB’s “Uniquely Singapore” website: http://www.visitsingapore.com. The brand message was delivered through a series of creative print and TV advertisements that depicted the uniqueness of Singapore through its ways of life, landscapes and trademarks. To complement the branding campaign, other promotions include the ‘My Uniquely Singapore Passport 2005’ which offers both tourists and locals discounts on admission to visitor attractions.
STB will also continue to attract key events that will drive international visitor traffic and help position Singapore as the top-of-mind destination for key customer segments. These key events include the Indian International Film Academy Awards, ITMA Asia – The 2nd Asian International Exhibition of Textile Machinery and the 117th International Olympics Committee Session in 2005, and the Annual Meetings of the International Monetary Fund and the World Bank Group in 2006.
Incoming receipts
Incoming receipts in 2005 amounted to S$10 billion, an increase of 6% in current value terms over 2004. The growth is attributed to the growth in tourist arrivals in 2005.
Expenditure per arrival
Expenditure per arrival declined slightly in 2005 compared to the previous year. The main reason underpinning the decline is the changing profile of incoming tourists, as visitors from Indonesia, China and India, who spend less per visit are becoming more prominent amongst the mix of travellers to Singapore. Total incoming tourism receipts therefore registered a slight downturn following two years of consecutive growth, as countries with more spending power began to increase in number alongside visitors from more developed countries such as Japan, UK and USA.
Table 9 Arrivals: 2000-2005'000 people % growth
Gathered by: Department of Tourism ASEAN Page 50

Travel and Tourism – SINGAPORE MARKET
2000 7,691.2 -2001 7,518.0 -2.32002 7,566.2 0.62003 6,127.0 -19.02004 8,328.1 35.92005 8,867.5 6.5Source: Annual Report of Tourism Statistics, Singapore Tourism Board, Euromonitor International
Table 10 Incoming Tourist Receipts: 2000-2005S$ million Current Constant
2000 10,080.8 10,080.82001 9,121.9 9,031.82002 8,831.2 8,778.42003 6,937.3 6,861.02004 9,799.6 9,533.52005 10,400.0 9,977.8Source: Annual Report of Tourism Statistics, Singapore Tourism Board, Euromonitor International
Table 11 Incoming Tourist Receipts % Growth: 2000-2005% growth Current Constant
2000 5.4 3.92001 -9.5 -10.42002 -3.2 -2.82003 -21.4 -21.82004 41.3 39.02005 6.1 4.7Source: Annual Report of Tourism Statistics, Singapore Tourism Board, Euromonitor International
Table 12 Expenditure per Arrival: 2000-2005S$
2000 1,310.72001 1,213.3
Gathered by: Department of Tourism ASEAN Page 51

Travel and Tourism – SINGAPORE MARKET
2002 1,167.22003 1,132.32004 1,176.72005 1,172.8Source: Annual Report of Tourism Statistics, Euromonitor International estimates
5.3 Incoming: Country of Origin
Top inbound countries
Indonesia, China, Australia, Japan and Malaysia were Singapore’s top five inbound countries in 2005, together accounting for 52% of total visitor arrivals. Growth in total number of arrivals from these countries continued to be driven by the emergence of low cost carriers, particularly for Indonesia, Australia and Malaysia, which were driven by the growth in Adam Air, Jetstar Asia, AirAsia and Valuair, making Singapore more accessible for those seeking to visit their friends and relatives, or come for short breaks in Singapore.
Growth inbound countries
Indonesia remained the largest generating country for tourist arrivals in 2005 and registered 6% growth over 2004. Singapore continued to foster the close tie with Indonesia by signing an Investment Guarantee Agreement in 2005 to boost investments in each other's economies. Tourism is one key area of co-operation and both countries are working towards it by strengthening regional security and fighting terrorism.
STB promoted Singapore in The World Exposition held in Aichi, Japan from March 25 to September 25 through an interactive showcase of Singapore’s culture from a 972 square metre pavilion named “World Without Walls”. Japan remains a key market to Singapore. In 2005, it was the fourth largest source market for Singapore with about 600,000 tourists.
India is one of the fast growing countries contributing to tourist arrivals in Singapore. In 2005, it grew by a solid 15% on the previous year, supported by increased leisure travel as the Singapore Tourism Board (STB) aggressively marketed tourism through the “Uniquely Singapore” campaign. STB also set up a regional office in New Delhi in March 2005 to provide potential visitors with more access to information on Singapore. This is the third regional office set up in India after Mumbai and Chennai. The growth in visitor arrivals was also aided by the emergence of low cost carriers. In April 2005, Jet Airways started running non-stop daily flights between Mumbai and Singapore and in May 2005, Air Sahara commenced a daily service between Delhi and Singapore.
Highest spenders
The high volume of tourist arrivals from Indonesia led to high spending by Indonesians
Gathered by: Department of Tourism ASEAN Page 52

Travel and Tourism – SINGAPORE MARKET
Indonesians accounted for the largest share of 21%, among the total tourist arrivals in Singapore in 2005. They come to Singapore not only for shopping, but also for education as well as medical treatments. While the spend per tourist is not high for Indonesian tourists, the large number of tourist arrivals contributed significantly in high overall spending in Singapore
In contrast to this, the spend per visitor is significantly higher by tourists from countries such as UK, USA and Japan. However, since the tourists from these countries are relatively lesser in number, their contribution to the overall tourism revenue is relatively lower.
The spend per visitor is relatively higher for corporate travellers
In terms of purpose of visit, business visitors accounted for relatively higher spending than those who come for leisure and meeting friends/relatives. Since business travellers value time, efficiency and quality of service and are relatively less budget conscious, the spend per visitor for business travellers was significantly higher than leisure tourists.
Table 13 Arrivals by Country of Origin: 2000-2005'000 people 2000 2001 2002 2003 2004 2005
Australia 510.3 551.0 538.0 392.9 561.2 634.2China 434.3 497.0 671.0 568.5 880.1 924.1Germany 169.4 159.0 157.5 121.4 142.4 151.1Hong Kong, China 286.0 276.0 265.0 226.3 271.7 285.5India 346.4 340.0 374.0 309.4 417.2 480.0Indonesia 1,313.3 1,364.0 1,392.8 1,341.7 1,765.3 1,864.2Japan 929.9 756.0 724.0 434.1 598.8 610.8Malaysia 565.0 576.0 548.5 439.4 537.3 577.6New Zealand 94.3 101.0 94.1 73.5 109.1 119.1Scandinavia 91.6 91.0 84.9 72.6 84.3 86.0South Korea 354.4 359.0 371.0 261.4 361.0 365.0Taiwan 290.8 222.0 209.0 144.9 182.4 218.3Thailand 236.7 261.0 263.8 235.8 341.9 399.3United Kingdom 445.0 460.0 460.0 388.0 457.2 472.7USA 385.6 344.0 328.0 250.7 333.1 368.7Other countries 1,238.2 1,161.0 1,084.6 866.4 1,285.1 1,310.8Arrivals 7,691.2 7,518.0 7,566.2 6,127.0 8,328.1 8,867.5Source: Annual Report of Tourism Statistics, Singapore Tourism Board, Euromonitor International estimates
5.4 Incoming: Mode of Transport and Purpose of Visit
Mode of transport
Gathered by: Department of Tourism ASEAN Page 53

Travel and Tourism – SINGAPORE MARKET
The number of arrivals by air reached seven million which was 11% growth from 2004. The growth is primarily due to decline in air fares and the rise of the low cost airlines, which has in turn encouraged both inbound and outbound travel. In 2005, two other low cost airlines commenced operations in Singapore and encouraged air travel to and from India. Jet Airways started running non-stop daily flights between Mumbai and Singapore in April 2004 and Air Sahara commenced a daily service between Delhi and Singapore in May 2005.
The number of arrivals by land experienced growth of 9% in 2005. This was primarily due to the improvement of the Vehicle Entry Permit (VEP) scheme which allowed Malaysian visitors to drive in to Singapore and enjoy 10 VEP-free days over a calendar year. Furthermore, the VEP operating hours were shortened from 5pm to 12noon on weekdays during Singapore’s June school holidays.
The number of tourist arrivals by sea saw a marked decline by 29% in 2005, suffering from the popularity of air travel and boom in low cost carriers. It is more time consuming and arguably less comfortable to travel by sea and hence not popular for long distance trips. Cruises remain a relatively popular means of travel for families and older generation travellers to Singapore, although this is set to decline as even these travellers are drawn to the bargain prices and ease to obtain air tickets to Singapore.
Business trends
In 2005, other purposes of visit witnessed growth of 9% over 2004. The growth was boosted by the increase in MICE (meeting, incentives, conventions, exhibitions) events and joint marketing efforts by STB and industry partners. Apart from in-market roadshows and seminars, the board also participated in international trade shows to raise the awareness and familiarity of MICE products among intermediaries and corporate decision makers.
Singapore saw a marked increase in the corporate meetings market. Between 1999 and 2003, Singapore had hosted more than 2,500 corporate meetings, forming 42% of all MICE events during this period. This sector also posted an average growth of 81% that can be attributed in part to the presence of more than 7,000 MNCs in Singapore, of which 4,000 have based their headquarters here. 2005 key events include:
The 3rd World Congress of Nephrology (June 26 to 30).Estimated foreign visitors: 5,000The 117th International Olympic Committee Session (July 2 to 9). Estimated foreign visitors: 3,000 to 5,000The World Association for Symphonic Bands and Ensembles International Conference (July 10 to 16). Estimated foreign visitors: 2,000The 2nd Asian International Exhibition of Textile Machinery (October 17 to 21).
Total exhibition space occupied: 60,000m2
In addition, Singapore’s signature events also drew a significant number of foreign visitors.
Gathered by: Department of Tourism ASEAN Page 54

Travel and Tourism – SINGAPORE MARKET
These include:International Furniture Fair Singapore 2005 (March 1 to 5).
Number of foreign visitors: 10,500
Infocomm Media Business Exchange (June 13 to 18).
Number of foreign visitors: 29,000
Events that Singapore will host next year include:
Asian Aerospace (4,000 foreign delegates expected),Food and Hotel Asia (13,000 foreign delegates)Annual Meetings of the Boards of Governors of the International Monetary Fund and the World Bank Group (15,000 foreign delegates).Singapore has also launched destination bids for the 30,000-strong World Scout Jamboree in 2011 andInternational Congress & Convention Association Conference in 2007.
Leisure trends
Leisure was the most common purpose of visit in 2005 and grew by 10% as compared to 2004. The high growth rate is partly due to an overall increase in travel confidence and initiatives by STB in promoting Singapore as a unique destination for leisure.
Table 14 Arrivals by Method of Transport: 2000-2005'000 people 2000 2001 2002 2003 2004 2005
Air 5,691.4 5,360.0 5,356.3 4,231.9 6,079.5 6,723.0Land 846.0 984.0 1,033.2 867.1 1,165.9 1,273.4Rail 304.5 310.6 315.9 268.5 311.4 323.9Sea 849.3 863.4 860.8 759.5 771.2 547.2Arrivals 7,691.2 7,518.0 7,566.2 6,127.0 8,328.1 8,867.5Source: Annual Report of Tourism Statistics, STB website, Euromonitor International estimates
Table 15 Arrivals by Purpose of Visit: 2000-2005'000 people 2000 2001 2002 2003 2004 2005
Gathered by: Department of Tourism ASEAN Page 55
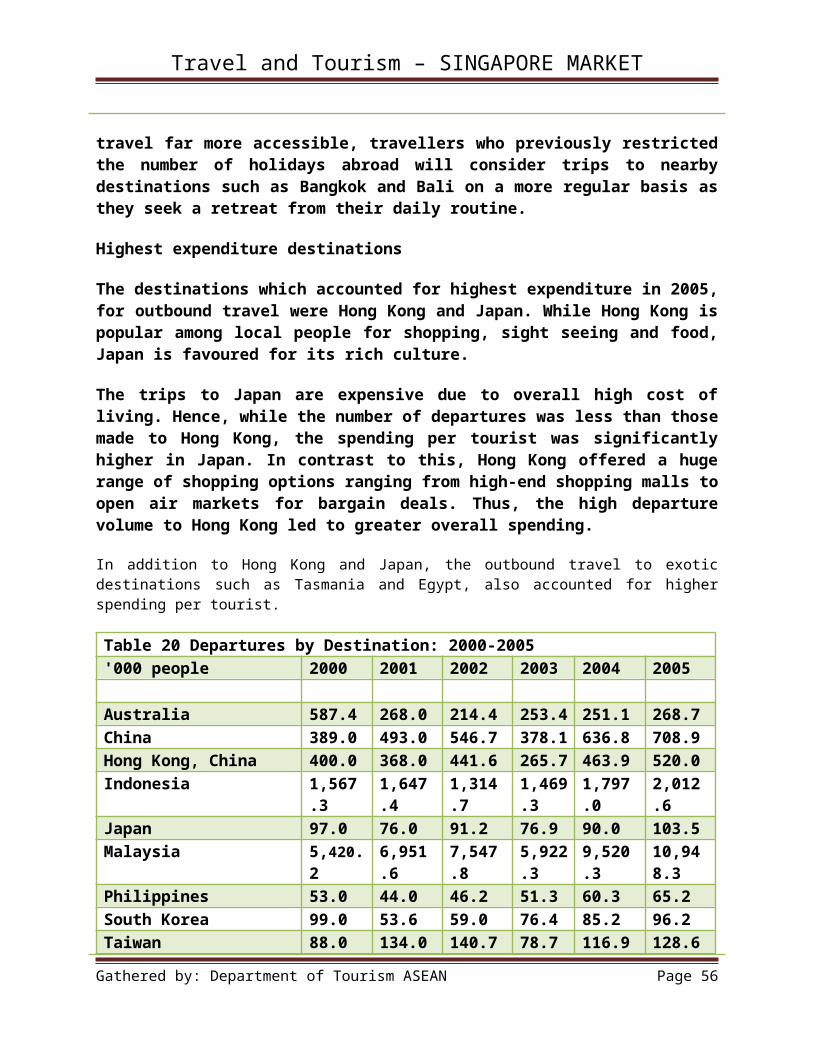
Travel and Tourism – SINGAPORE MARKET
Business 1,407.5 1,263.0 1,389.3 1,091.1 1,499.1 1,637.2Leisure 3,807.1 3,721.0 3,547.7 2,712.9 3,747.6 4,122.4Visiting friends/relatives 469.2 473.2 520.9 453.5 583.0 606.3Others 2,007.4 2,060.8 2,108.3 1,869.5 2,498.4 2,501.6Arrivals 7,691.2 7,518.0 7,566.2 6,127.0 8,328.1 8,867.5Source: Annual Report of Tourism Statistics, STB website, Euromonitor International estimatesNote: Others includes, MICE, education, others and not stated
5.5 Outgoing: Departures and Expenditure
Departures
The number of departures in 2005 increased by 14% compared to 2004. A more positive economic outlook and increase in travel confidence boosted the growth of departures in 2005. On top of that, local travel retailers and trade associations such as NATAS also aggressively promoted outbound travel by organising travel fairs and offering promotional tour packages. Heightened competition from airlines and the rise of low cost airlines also encouraged travel within the region such as to Indonesia and Thailand.
Outbound expenditure
Outgoing tourism expenditure for 2005 increased by 15% as compared to the previous year as the number of outbound travellers increased.
Expenditure per departure
While outgoing tourist expenditure increased in 2005, the expenditure per departure remained stable at S$409 million. This was mainly due to a declining trend in the prices for tourism goods and services such as transportation and accommodation. The increase in the number of low cost airlines had in turn lowered the average price of air travel, while popularity of budget accommodation such as budget hotels and hostels also lowered the average price of accommodation.
Table 16 Departures: 2000-2005'000 people % growth
2000 10,013.9 -2001 11,188.1 11.72002 11,718.4 4.72003 9,384.8 -19.92004 13,945.3 48.62005 15,851.7 13.7Source: Annual Report of Tourism Statistics, STB website, Euromonitor International estimates
Gathered by: Department of Tourism ASEAN Page 56

Travel and Tourism – SINGAPORE MARKET
Table 17 Outgoing Tourism Expenditure: 2000-2005S$ million Current Constant
2000 7,052.0 7,052.02001 6,546.0 6,481.42002 6,040.0 6,003.92003 5,134.0 5,077.52004 5,647.4 5,494.12005 6,483.2 6,220.0Source: Annual Report of Tourism Statistics, STB website, Euromonitor International estimates
Table 18 Outgoing Tourism Expenditure: 2000-2005% growth Current Constant
2000 10.6 9.12001 -7.2 -8.12002 -7.7 -7.42003 -15.0 -15.42004 10.0 8.22005 14.8 13.2Source: Annual Report of Tourism Statistics, STB website, Euromonitor International estimates
Table 19 Expenditure per Departure: 2000-2005S$
2000 704.22001 585.12002 515.42003 547.12004 405.02005 409.0Source: Annual Report of Tourism Statistics, STB website, Euromonitor International estimates
5.6 Outgoing: Destination
Top outbound destinations
The top five destinations for outbound travel in 2005 were Malaysia, Indonesia, China, Thailand and Hong Kong. In all, these five countries accounted for 94% of all departures.
Gathered by: Department of Tourism ASEAN Page 57
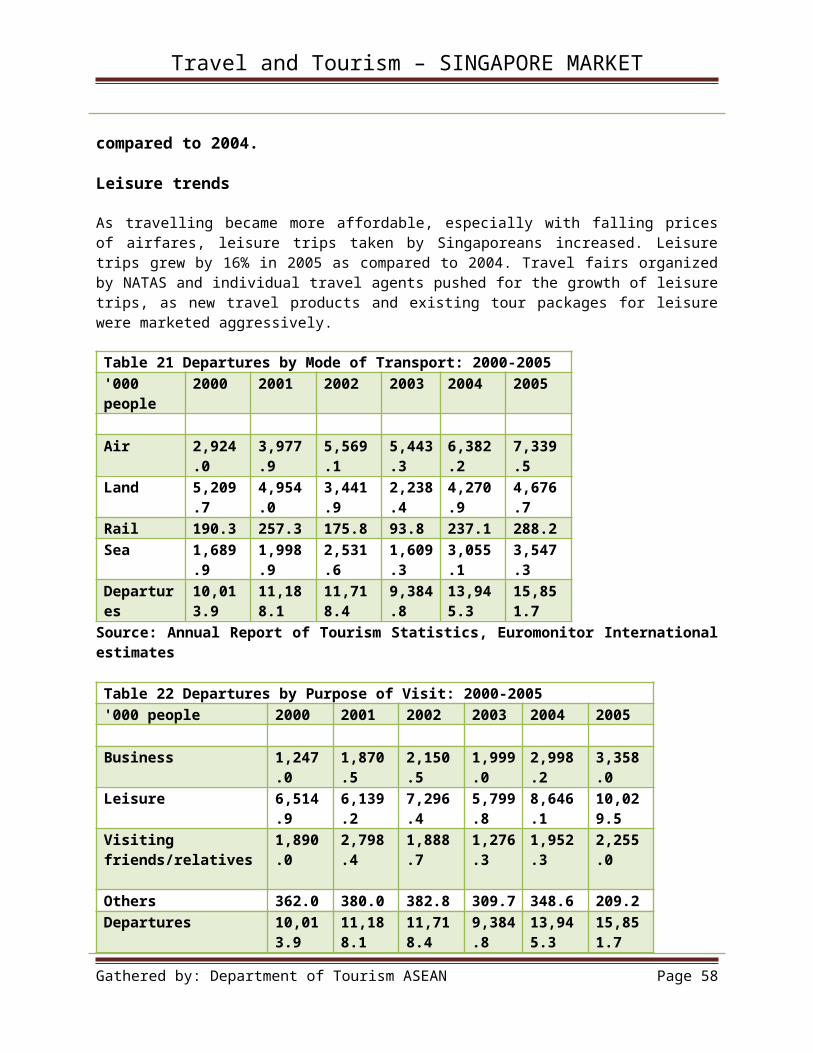
Travel and Tourism – SINGAPORE MARKET
Growth outbound destinations
Malaysia remained the top choice among Singaporeans, accounting for 69% of all departures in 2005 due to the close proximity and connectivity via air, land and sea. Land travel to Malaysia is also made easier with two causeways connecting the two countries one of which is located at Tuas and the other at Woodlands. According to the Malaysia Tourism Board, Singapore is the number one market for Malaysia and constituted about 70% of the total tourist arrivals to Malaysia.
Indonesia was the second most popular destination for Singaporeans, accounting for 13% of departures in 2005. This was primarily due to its accessibility and rich cultural and natural settings that appealed to Singaporeans. It is also a popular destination for weekend getaways and spa holidays especially at its islands such as Bintan, Batam and Bali.
China and Thailand were the third and fourth most popular destinations respectively, both growing remarkably at 68% and 12% in 2005. Visitors to China continued to be supported by older Singaporean travellers aged 40 and above. As such, growth continued to be driven by growing interest in scenic and cultural package tours such as those to Tibet and Xian. Travel to Thailand also continued to be spurred by prominent marketing campaigns by the Tourism Authority of Thailand (TAT), which continued to attract Singaporeans going to Thailand for short breaks for shopping or beaches. In August 2005, the TAT organized a major roadshow in Singapore to attract Singaporeans, as well as the large number of expatriates residing there. TAT also focussed more on promoting specific destinations within Thailand, such as Chiang Mai, by working with local travel agents as well as with Thai Airways International and the Singaporean carriers to promote special packages to Chiang Mai. New flights also encouraged travel between Thailand and Singapore as Tiger Airways inaugurated its first Singapore-Chiang Mai route service in February 2005, adding to the thrice-weekly direct flights being operated by Silk Air.
Singapore is the largest source market in Southeast Asia for Hong Kong. Growth to Hong Kong is mainly attributed to strong support from travel agents. Hong Kong remained one of the favourite outbound travel destinations as Singaporeans enjoyed two of the favourite national past times, which are shopping and eating in Hong Kong.
Australia is the sixth most popular destination for outbound travel in 2005 and growth is healthy at 7% over 2004. Singapore is a key market for Australia. Tourism Australia organized key events such as a film festival, a fashion and design showcase, visual arts exhibitions, wine and dine promotions and a ‘Study in Australia’ exhibition, and is also moving actively into educational tourism where it has a lead in the region to attract Singapore tourists.
Long haul vs short haul
Short haul holidays were more preferred among Singaporeans in 2005 as the top destinations visited were mostly located in the region. With the boom in low cost carriers, short-haul travel is expected to rise dramatically over the next few years, sparking weekend trips within the region, as Singaporeans seek to venture outside their small island home for a short break. Singapore’s currency also remains relatively strong compared to other regional countries, thus making visits
Gathered by: Department of Tourism ASEAN Page 58

Travel and Tourism – SINGAPORE MARKET
to other countries more affordable. Now that low cost carriers are making short-haul travel far more accessible, travellers who previously restricted the number of holidays abroad will consider trips to nearby destinations such as Bangkok and Bali on a more regular basis as they seek a retreat from their daily routine.
Highest expenditure destinations
The destinations which accounted for highest expenditure in 2005, for outbound travel were Hong Kong and Japan. While Hong Kong is popular among local people for shopping, sight seeing and food, Japan is favoured for its rich culture.
The trips to Japan are expensive due to overall high cost of living. Hence, while the number of departures was less than those made to Hong Kong, the spending per tourist was significantly higher in Japan. In contrast to this, Hong Kong offered a huge range of shopping options ranging from high-end shopping malls to open air markets for bargain deals. Thus, the high departure volume to Hong Kong led to greater overall spending.
In addition to Hong Kong and Japan, the outbound travel to exotic destinations such as Tasmania and Egypt, also accounted for higher spending per tourist.
Table 20 Departures by Destination: 2000-2005'000 people 2000 2001 2002 2003 2004 2005
Australia 587.4 268.0 214.4 253.4 251.1 268.7China 389.0 493.0 546.7 378.1 636.8 708.9Hong Kong, China 400.0 368.0 441.6 265.7 463.9 520.0Indonesia 1,567.3 1,647.4 1,314.7 1,469.3 1,797.0 2,012.6Japan 97.0 76.0 91.2 76.9 90.0 103.5Malaysia 5,420.2 6,951.6 7,547.8 5,922.3 9,520.3 10,948.3Philippines 53.0 44.0 46.2 51.3 60.3 65.2South Korea 99.0 53.6 59.0 76.4 85.2 96.2Taiwan 88.0 134.0 140.7 78.7 116.9 128.6Thailand 719.1 669.0 735.9 515.6 578.0 640.0Other destination countries 593.9 483.5 580.2 297.1 345.8 359.6Departures 10,013.9 11,188.1 11,718.4 9,384.8 13,945.3 15,851.7Source: PATA (Pacific Asia Travel Association), Euromonitor International estimates
5.7 Outgoing: Mode of Transport and Purpose of Visit
Mode of transport
The number of departures by air increased by 15% in 2005, and accounted for 46% of total departures. The growth was mainly due to heightened competition among airlines that led to a
Gathered by: Department of Tourism ASEAN Page 59

Travel and Tourism – SINGAPORE MARKET
decline in the average price of airfares, as well as the rise of low cost carriers which encouraged travel by air within the region. Outbound departures by land in 2005 grew by 10% over 2004. Outbound travel by land is primarily taken to parts of Malaysia, as well as Indonesia. The modes of transport to Malaysia usually include coaches or cars. However, with the drop in prices for airfares, travellers may opt for air travel instead as land travel is usually more time consuming.
Departures by sea in 2005 grew by 21% over 2004. The growth in sea travel was driven by promotions for cruises, as well as increases in travel to neighbouring islands such as Batam, Bintan, Tanjong Pinang and Tanjong Balai.
Purpose of visit
Business trends
The improvement in the global economic climate, as well as increases in travel confidence, led to an increase in corporate travel. The number of business trips grew by 12% in 2005 as compared to 2004.
Leisure trends
As travelling became more affordable, especially with falling prices of airfares, leisure trips taken by Singaporeans increased. Leisure trips grew by 16% in 2005 as compared to 2004. Travel fairs organized by NATAS and individual travel agents pushed for the growth of leisure trips, as new travel products and existing tour packages for leisure were marketed aggressively.
Table 21 Departures by Mode of Transport: 2000-2005'000 people 2000 2001 2002 2003 2004 2005
Air 2,924.0 3,977.9 5,569.1 5,443.3 6,382.2 7,339.5Land 5,209.7 4,954.0 3,441.9 2,238.4 4,270.9 4,676.7Rail 190.3 257.3 175.8 93.8 237.1 288.2Sea 1,689.9 1,998.9 2,531.6 1,609.3 3,055.1 3,547.3Departures 10,013.9 11,188.1 11,718.4 9,384.8 13,945.3 15,851.7Source: Annual Report of Tourism Statistics, Euromonitor International estimatesTable 22 Departures by Purpose of Visit: 2000-2005
'000 people 2000 2001 2002 2003 2004 2005
Business 1,247.0 1,870.5 2,150.5 1,999.0 2,998.2 3,358.0Leisure 6,514.9 6,139.2 7,296.4 5,799.8 8,646.1 10,029.5Visiting friends/relatives 1,890.0 2,798.4 1,888.7 1,276.3 1,952.3 2,255.0Others 362.0 380.0 382.8 309.7 348.6 209.2Departures 10,013.9 11,188.1 11,718.4 9,384.8 13,945.3 15,851.7Source: Annual Report of Tourism Statistics, Euromonitor International estimates
5.8 Domestic: Trips and Expenditure
Trips
Gathered by: Department of Tourism ASEAN Page 60
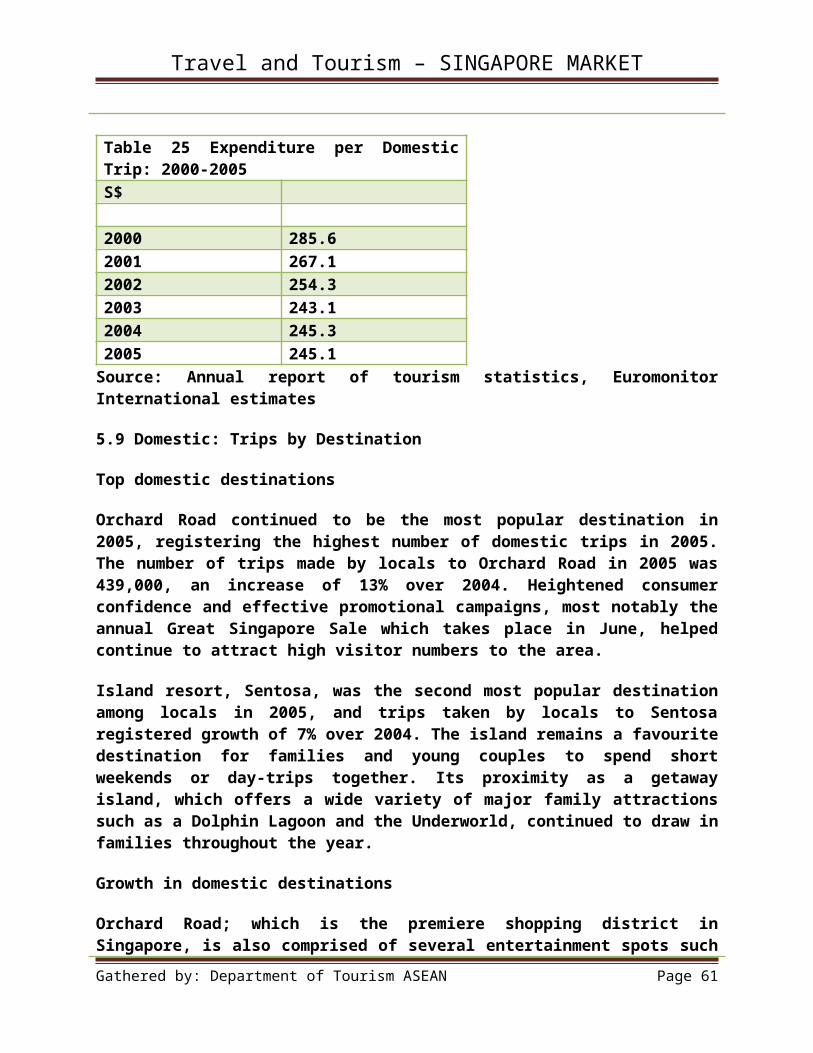
Travel and Tourism – SINGAPORE MARKET
The number of domestic trips taken in 2005 witnessed growth of 7% over 2004. The trips made by locals were primarily to tourist attractions such as Orchard Road, Sentosa, Chinatown, theme parks and theatres as well as other entertainment spots. The increase in domestic trips taken in 2005 reflected a stronger economy in Singapore and also a result of strong marketing efforts by STB and the various tourist attractions.
In order to encourage Singaporean to step out, STB organized yearly events such as the Singapore Food Festival and the Great Singapore Sale which satisfied the two national hobbies of Singaporeans which are eating and shopping.
On top of that, STB continued activities such as “My Tourism Passport” which offered both locals and tourists discounts on visits to various tourist attractions.
Efforts were also made by individual tourist attractions to attract local visitors. For example, the National Heritage board was actively promoting a museum-going culture in Singapore by doing more targeted and membership marketing. Other attractions such as Wild Wild Wet and Singapore Zoo also tried to reach out to locals through offering promotions for family packages.
Expenditure
Domestic tourism expenditure increased by 7% in 2005 to reach S$360 million. Leisure activities such as shopping contributed largely to the domestic spending. According to the Department of Statistics, total retail sales during the period of the Great Singapore Sale rose to $5 billion this year, up from $4.6 billion in the previous corresponding period. Of the $5 billion in retail sales, shopping expenditure by tourists amounted to $650 million, with locals accounting for the remaining $4.35 billion. The amount is the highest since the event was launched 12 years ago.
Expenditure per trip
Expenditure per domestic trip saw minimal change on the previous year, recorded at S$245 in 2005. Falling prices paid for goods and services during domestic trips, and the lowering of some admission fees to some tourist attractions played a role in expenditure per trip, although increased expenditure on food and higher expenditure as a result of successful promotions in shopping malls helped offset any potential decline in expenditure that year.
Table 23 Domestic Tourist Trips: 2000-2005'000 trips % growth
2000 905.5 -2001 1,024.9 13.22002 1,124.6 9.72003 1,277.5 13.62004 1,372.7 7.52005 1,470.2 7.1
Gathered by: Department of Tourism ASEAN Page 61

Travel and Tourism – SINGAPORE MARKET
Source: Ministry of Transport, Euromonitor International estimates
Table 24 Domestic Tourist Expenditure: 2000-2005S$ million Value % value growth
2000 258.6 -2001 273.8 5.92002 286.0 4.52003 310.5 8.62004 336.7 8.42005 360.3 7.0Source: Ministry of Transport, Euromonitor International estimates
Table 25 Expenditure per Domestic Trip: 2000-2005S$
2000 285.62001 267.12002 254.32003 243.12004 245.32005 245.1Source: Annual report of tourism statistics, Euromonitor International estimates
5.9 Domestic: Trips by Destination
Top domestic destinations
Orchard Road continued to be the most popular destination in 2005, registering the highest number of domestic trips in 2005. The number of trips made by locals to Orchard Road in 2005 was 439,000, an increase of 13% over 2004. Heightened consumer confidence and effective promotional campaigns, most notably the annual Great Singapore Sale which takes place in June, helped continue to attract high visitor numbers to the area.
Island resort, Sentosa, was the second most popular destination among locals in 2005, and trips taken by locals to Sentosa registered growth of 7% over 2004. The island remains a favourite destination for families and young couples to spend short weekends or day-trips together. Its proximity as a getaway island, which offers a wide variety of major family attractions such as a Dolphin Lagoon and the Underworld, continued to draw in families throughout the year.
Growth in domestic destinations
Gathered by: Department of Tourism ASEAN Page 62

Travel and Tourism – SINGAPORE MARKET
Orchard Road; which is the premiere shopping district in Singapore, is also comprised of several entertainment spots such as pubs and cinemas as well as food establishments, thus making it a popular destination amongst locals. Some of the activities that attracted crowds to Orchard Road in 2005 included the Glutton Square; a food street that featured a wide variety of local hawker fare located at the car park compound in Somerset, and the Great Singapore Sale which is held yearly during June and July. On top of that, individual malls and boutiques also held their own sales or promotions to attract shoppers. Travelling in Orchard Road was also made easier with improved traffic and pedestrian flow. New traffic schemes at Orchard Link were unveiled on 10 March 2005, whereby LTA commissioned a signalised pedestrian crossing across Orchard Road, between Claymore Road and Cuscaden Road, which enabled pedestrians to cross Orchard Road safely and more easily visit the nearby shopping malls.
In 2005, locals made up 60% of the total visitors to Sentosa. The prime reason for the increase was the launch of new themed spots within the island such as the Carlsberg Sky Tower and the Sentosa Luge, which is a 650-metre luge track with an aerial chair lift cableway where riders can cruise down from the hilltop to the beach.
The revamp of Chinatown to include night markets, as well as the increase in accessibility with the development of the North East Line enabling commuters from the northeast region of Singapore to travel direct to Chinatown via the Mass Rapid Transit, increased the number of domestic tourists visiting this attraction. Apart from that, activities that draw crowds to Chinatown include the Lunar New Year celebration, which is a festive period that lasts for 15 days and usually falls during the months of January and February. The streets of Chinatown are decorated with lighting and night markets with stalls selling New Year goods such as bakery products, decorative items and candies are set up.
A wide spread of specialty restaurants, themed pubs and wine bars can be found in Boat Quay and Clarke Quay, thus making it a popular area for night entertainment. Major banks and offices are also situated in the area, and hence it is also a popular area patronized by working professionals for dining and entertainment in the evenings.
The growth of domestic visitors visiting Marina Square was primarily due to the completion of the renovation of the shopping mall that attracted many locals with its increased number of retailers and food establishments. Ongoing development will also allow the shopping mall to seamlessly connect to the proposed Convention Centre MRT station, Suntec City, Esplanade and the five-star hotels such as The Oriental, Singapore, Pan Pacific Singapore, Ritz Carlton Millennia and Conrad International Centennial Singapore.
Table 26 Domestic Trips by Destination: 2000-2005'000 trips 2000 2001 2002 2003 2004 2005
Boat/Clarke Quay 86.6 95.6 100.8 113.3 105.5 107.6Chinatown 116.7 129.0 144.4 151.2 165.9 172.5Jurong BirdPark 38.6 41.4 48.8 54.9 55.6 56.7Marina Square 57.8 67.4 81.3 94.1 98.6 103.5
Gathered by: Department of Tourism ASEAN Page 63

Travel and Tourism – SINGAPORE MARKET
Night Safari 35.7 35.8 37.0 38.6 45.9 48.7Orchard Road 247.6 264.5 301.5 348.9 390.0 438.8Sentosa 224.1 280.6 289.5 334.9 367.1 392.8Singapore Zoological Garden 16.4 17.6 19.5 22.0 22.0 22.7Other domestic tourism destinations 82.0 93.0 101.8 119.6 122.1 127.0Domestic tourism 905.5 1,024.9 1,124.6 1,277.5 1,372.7 1,470.2Source: Ministry of transport, Euromonitor International estimates
5.10 Domestic: Trips by Mode of Transport
The most preferred mode of transport taken in 2005 was land transport which accounted for 53% of total trips taken by locals. Land transport comprised mainly of buses and taxis of which buses were the most prominent modes of travel in 2005, as they are relatively cheaper and widely accessed.
Trains as a mode of transport taken by locals to tourist attractions registered growth of 6% in 2005. The growth is mainly attributed to the development of the North East Line (NEL) which operates on a route that covers several tourist attractions in Singapore such as Little India, Chinatown, Clarke Quay, Dhoby Ghaut and Harbour Front.
Travel by sea within Singapore in 2005 increased by 5% over 2004. Sea transport is mainly comprised of ferry services operating from the Singapore Cruise Centre to Sentosa and other islands, as well as boat rides along the Singapore River.
Table 27 Domestic Trips by Mode of Transport: 2000-2005'000 trips 2000 2001 2002 2003 2004 2005
Air - - - - - -Land 471.7 533.5 595.2 657.0 722.7 780.5Rail 320.5 365.0 389.7 467.6 491.0 522.9Sea 113.3 126.4 139.7 152.9 159.0 166.7Domestic tourism 905.5 1,024.9 1,124.6 1,277.5 1,372.7 1,470.2Source: Ministry of Transport, Euromonitor International estimates
5.11 Tourism Spending
National tourism spending
Total tourism spending in 2005 amounted to S$11 billion, representing growth of 6% over 2004. The growth was a result of an increase in tourist arrivals in 2005, as well as the continued efforts of STB in promoting Singapore to both tourists and locals.
Shopping continued to be the largest category for tourism spending, accounting for 35% of total tourism spending in 2005, and registering growth of 6% over 2004. Orchard Road and Marina Square are some of the popular destinations for shopping among tourists and locals in
Gathered by: Department of Tourism ASEAN Page 64

Travel and Tourism – SINGAPORE MARKET
Singapore. The Great Singapore Sale (GSS), held in the month of June and July, along with the other key retail events like the Singapore Fashion Festival and Singapore JewelFest, played a key role in enhancing Singapore’s position as Asia’s Shopping Capital. In 2005, STB also launched the “Great Shopping and Eating Transit Programme” in July to entice transit passengers to step out of the airport to experience GSS.
Other efforts to enhance visitors’ shopping experience during the GSS included a tourist lucky dip for a minimum spend of $300 a day. Attractive prizes to be won comprised foot massages and shopping vouchers. STB, together with MasterCard also offered a “Shop for Free” lucky draw for visitors from Indonesia, Malaysia and Thailand. With every S$50 charged to their MasterCard during GSS, these visitors stood to win up to S$1,000 worth of purchases charged to their MasterCard.
Tourism spending on food amounted to S$1 billion, which accounted for 9% of total tourism spending in 2005. Events to promote sales in food included the Singapore Food Festival which is a yearly event held to promote food sales in Singapore. Apart from that, the World Gourmet Summit was held in April where eleven internationally-acclaimed star chefs and ten winemakers from prestigious wineries showcased their skills and specialties. Visitors were also treated to the world’s finest wines and cuisine.
Travel within the country accounted for 4% of total tourism spending in 2005. International travellers spent relatively more on travel compared to their local counterparts, opting for relatively higher-priced taxis instead of other modes of transport such as buses and trains, as they were not familiar with getting around the country.
Entertainment expenditure increased by 4% and accounted for 3% of total tourism spending in 2005. Entertainment expenditure comprised mainly of admission fees to tourist attractions and cover charges to night entertainment spots. The growth in entertainment expenditure is lower as compared to others as admission to some tourist attractions such as Orchard Road, Marina Square and Chinatown are free. In addition, various tourist attractions such as Sentosa and Singapore Zoo offered special promotions which lowered admission sales value.
Outbound tourism expenditure
Outbound tourist expenditure for 2005 increased significantly by 15% over 2004, supported by continued growth in shopping, which, together with accommodation, represents the largest component for outgoing tourist expenditure.
Shopping accounted for 22% of outbound tourist expenditure, the most favoured activity undertaken by Singaporeans as they travelled abroad. Some have planned their trips to coincide with the various seasonal sales in different locations such as in Malaysia, Thailand, Hong Kong and Taiwan.
Food was the third largest component for outgoing tourist expenditure commanding 16% of outgoing tourist expenditure in 2005. Eating and dining was a favourite pastime of Singaporeans. Singaporeans also favoured locations which can offer them an opportunity to savour different cuisines. For instance,
Gathered by: Department of Tourism ASEAN Page 65

Travel and Tourism – SINGAPORE MARKET
Hong Kong and Thailand are two of the most visited countries where food is a major draw for tourists. Closer to home, Singaporeans also enjoyed crossing the causeway to Johor Bahru for seafood treats and other cuisines.
Table 28 Tourism Spending by Sector: Value 2000-2005S$ million 2000 2001 2002 2003 2004 2005
Total tourism expenditure 10,339.4 9,395.7 9,117.2 7,247.8 10,136.3 10,760.3-Accommodation 1,354.9 1,293.5 1,189.0 964.9 1,064.0 1,166.3-Entertainment 252.9 289.5 349.0 225.2 362.8 376.6-Excursions 1.0 2.0 4.0 5.0 9.0 10.0-Food 842.5 846.6 747.6 618.8 1,013.3 1,016.8-Shopping 3,235.1 2,807.9 2,863.8 2,260.8 3,545.3 3,744.6-Travel within country 465.3 431.5 338.5 299.9 412.4 452.1-Other tourism expenditure 4,187.7 3,724.7 3,625.4 2,873.2 3,729.5 3,993.8Source: Annual report of tourism statistics, Euromonitor International estimatesNote: Others includes incoming airfares with Singapore Airlines, medical and education tourism Note2: Includes incoming tourist receipts and domestic tourist expenditure
Table 29 Outgoing Tourist Expenditure by Sector 2005% retail value rsp 2005
Accommodation 30.0Entertainment 13.8Excursions 1.7Food 15.5Shopping 21.6Travel within country 12.1Others 5.3Total 100.0Source: Annual report of tourism statistics, Euromonitor International estimates
5.12 Tourism Spending: Method of Payment
Domestic Spending
Amongst domestic spending, cash remained the preferred option in Singapore in 2005 and accounted for 50% of total value sales. Credit cards accounted for 37%, due to relatively high ownership levels as a result of fierce promotional activity from competing credit card companies. Whilst debit cards exist, they remained the least popular option, due to the strength of credit cards. Credit cards are widely accepted in shops and food establishments in Singapore. Prepaid cards are mainly used for travel within countries such as the EZlink card which is used for commuting bus and train services in Singapore.
Gathered by: Department of Tourism ASEAN Page 66

Travel and Tourism – SINGAPORE MARKET
Outgoing Spending
For outgoing tourism, cash still remained the number one method of payment with 45% of total value sales, supported by the abundance of money changers which are widely accessible in Singapore to easily exchange cash into foreign currencies before travel. However, credit cards held a stronger position than with domestic tourism, commanding 43% in 2005, due to its convenience. Consumers increasingly use credit cards when travelling abroad, driven by the competitive credit card schemes offered, as well as the perception that it is more convenient and safer to carry a card then large amounts of cash.
Table 30 Method of Payments for Tourism Spending: % Breakdown 2005% Retail Value RSP Domestic Outgoing
Cash 50.0 45.0Credit card 37.0 43.0Debit card 12.0 9.0Prepaid cards 1.0 0.0Traveller's cheques 0.0 3.0Total 100.0 100.0Source: Monetary Authority of Singapore website, Euromonitor International estimates
5.13 Forecast Performance
Arrivals and receipts
The number of tourist arrivals in the forecast period is likely to see a CAGR of 6%. The prime reason for the expected growth is the growth of low cost carriers. In the coming years, budget airlines are likely to cover long haul destinations as well and increase their frequency to short haul destinations. Other than budget airlines, STB’s efforts in the forecast period are expected to boost tourist arrivals.
STB’s future plans pertaining to the tourism sector are to focus on three key customer segments, which are BTMICE (Business Travel, Meetings, Incentives, Conventions and Exhibitions), leisure and services (education and healthcare).
Some of the efforts being made by STB in this direction include the launch of a proposal of an integrated resort at Marina Bay and Sentosa. The integrated resort at Marina Bay is aimed to promote Singapore as an important destination for meetings, conventions and exhibitions, while the Sentosa project is focused on enhancing entertainment and leisure activities in Singapore. The Sentosa project includes theme parks, resort hotels, restaurants, shopping and other attractions. The two casinos, which are to be built at Sentosa and Marina Bay, are likely to be completed by 2009. These two projects are expected to add S$1.5 billion a year to the economy.
The Government has also announced a S$1.6 billion package to be invested in Orchard Road. This rejuvenation project is expected to enhance Orchard Road’s image as an important shopping
Gathered by: Department of Tourism ASEAN Page 67

Travel and Tourism – SINGAPORE MARKET
destination. All of the above efforts are likely to enhance not only tourist arrivals, but also the yield per tourist, which in turn is expected to increase the incoming expenditure in the forecast period.
Departures and expenditure
The number of departures in the forecast period is likely to grow at 10%, while the outgoing expenditure is expected to grow at 7% year on year over the same period. The rise of low cost carriers will continue to drive growth in outbound travel, which will see stronger growth compared to outbound expenditure over the next five years.
The improved local economy is likely to boost departures as well as outbound travel expenditure over the forecast period. Also, the expected increase in outbound travel to long haul destinations as well as exotic destinations will boost outbound expenditure in the forecast period. Additionally, the increasing popularity of high-end holidays such as spa holidays, and adventure-based holidays are expected to enhance outbound travel as well as expenditure.
Table 31 Forecast Arrivals: 2005-2010'000 people % growth
2005 8,867.5 -2006 9,421.9 6.32007 10,003.7 6.22008 10,621.8 6.22009 11,268.4 6.12010 11,950.4 6.1Source Euromonitor International estimates
Table 32 Forecast Incoming Tourism Receipts: 2005-2010S$ million constant 2005 rsp Value % value growth
2005 10,400.0 -2006 11,440.0 10.02007 12,526.8 9.52008 13,654.2 9.02009 14,814.8 8.52010 16,000.0 8.0Source Euromonitor International estimates
Table 33 Forecast Departures: 2005-2010'000 people % growth
2005 15,851.7 -2006 17,800.4 12.32007 19,895.9 11.82008 21,932.4 10.22009 23,919.6 9.12010 25,850.1 8.1
Gathered by: Department of Tourism ASEAN Page 68

Travel and Tourism – SINGAPORE MARKET
Source Euromonitor International estimates
Table 34 Forecast Outgoing Tourism Expenditure: 2005-2010S$ million constant 2005 rsp Value % value growth
2005 6,483.2 -2006 7,001.9 8.02007 7,527.0 7.52008 8,053.9 7.02009 8,577.4 6.52010 9,092.0 6.0Source Euromonitor International estimates
6. TRAVEL ACCOMMODATION
6.1 Sales and Outlets by Sector
Travel accommodation grew by 10% in value terms in 2005 to reach a total of S$1 billion. The growth is largely attributed to the increase in tourist arrivals especially from countries such as Indonesia, India, China and Thailand as travellers regained confidence in travelling. The growth in travel accommodation sales was also driven by STB’s initiatives in attracting business and leisure travellers through events and promotions.
Sales
The hotel sector achieved robust growth in value terms in 2005.
The highest growth sector in 2005 was hotels, which registered growth of 10% in value terms over 2004. This was as a result of STB’s initiatives in promoting Singapore, as well as the strong marketing promotions run by the individual hotels. To achieve the tourism targets set for 2015, the STB plans to focus its efforts on further developing three key customer segments; BTMICE (Business Travel, Meetings, Incentives, Conventions and Exhibitions), leisure and services (education and healthcare). In 2005, key MICE events such as World Congress of Nephrology, International Olympic Committee Session, World Association for Symphonic Bands and Ensembles International Conference and Asian International Exhibition of Textile Machinery were held in Singapore which further boosted hotel sales for 2005.
Hostels registered a surge in demand in 2005, driven by the growth in budget travellers from source markets within the region. The rise in low cost carrier sales also reflected the increase in budget travellers visiting Singapore and staying in mid- to non-rated accommodation.
Outlets
Chained vs Independent hotels
The hotel sector in 2005 experienced marginal growth of 2% over 2004 in terms of the number of outlets, recording 218 hotels in 2005. Chained hotels accounted for 70% of the total number of
Gathered by: Department of Tourism ASEAN Page 69

Travel and Tourism – SINGAPORE MARKET
hotels in the same year. Though chained hotels occupy the largest market share in volume terms, they experienced only marginal growth of 1% in 2005 over the previous year. The marginal growth of chained hotels is due to a slight reduction in number of high spending tourists compared to the last few years. Hence, the shrinking population of high end tourists led to decline in demand for luxury hotels and their high end services and facilities.
In comparison to this, the independent outlets grew at the rate of 3% over the last year. The rise in the independent outlets is primarily due to the growing number of tourists who tend to be mid range spenders. Since this tourist segment is budget conscious and prefers value for money services, the independent hotels, which suit the needs of this growing tourist segment, witnessed relatively higher growth than chained hotels.
Budget travellers boosted demand for budget accommodations
The growth in the number of chained hotels in 2005 was due to two new outlets that were added to the Hotel 81 chain of budget hotels. The market for budget travellers opened up due to the rise of budget airlines since 2004. As such, this also spurred the demand for budget accommodation. In 2005, there were a total 137 budget hotels which represented a growth of 25% as compared to the previous year.
The two leading players of the budget hotel sector in Singapore are Hotel 81 and Fragrance Hotel, and together they make up 45% of the total number of budget hotels rooms in Singapore. Hotel 81 is local chain with 19 outlets located at Geylang, Chinatown, and Joo Chiat while Fragrance Hotel had eight outlets located at Balestier, Joo Chiat and Geylang.
Boutique hotels gaining grounds in the niche segment
Boutique hotels is a niche segment in the Singapore hotel sector and most of them are located near Chinatown away from the mid-premium chained hotels in the city area. Falling into this category are mainly independent hotels such as The Scarlet Hotel, Gallery Hotel, Hotel 1929 and other smaller ones which together makes up 3% the total number of hotels in Singapore. The themed or stylish boutique hotels differentiate themselves from larger chain or branded hotels by providing an exceptional and personalized level of accommodation, services and facilities.
A small percentage of the total travel market is comprised of discerning travellers, who place a high importance on privacy, luxury and service delivery. As such, the primary target market for boutique hotels will be typically corporate travellers, who tend to have a higher purchasing power, and where demand for travel is also non seasonal.
Table 35 Travel Accommodation Sales by Sector: Value 2000-2005S$ million 2000 2001 2002 2003 2004 2005
Hotels 1,325.1 1,258.6 1,151.4 920.5 1,012.5 1,113.8-Chained hotels 1,072.8 1,056.8 831.0 752.4 810.0 891.0-Independent hotels 252.3 201.8 320.4 168.1 202.5 222.8
Gathered by: Department of Tourism ASEAN Page 70

Travel and Tourism – SINGAPORE MARKET
Campsites 0.3 0.3 0.3 0.3 0.3 0.3Chalets 1.2 1.1 1.2 1.4 1.4 1.6Guesthouses 0.4 0.4 0.5 0.5 0.6 0.7Hostels 6.6 7.0 8.2 11.2 15.4 16.9Motels - - - - - -Private accommodation - - - - - -Self-catering apartments 21.3 26.1 27.5 31.1 33.8 33.2Other other travel accomodation - - - - - -Other travel accomodation 29.8 34.9 37.6 44.4 51.5 52.6Travel accommodation 1,354.9 1,293.5 1,189.0 964.9 1,064.0 1,166.3Source: Annual report of Tourism Statistics 2003, Singapore Department of Statistics, Euromonitor International estimates
Table 36 Travel Accommodation by Sector: Units 2000-2005Outlets 2000 2001 2002 2003 2004 2005
Hotels 206.0 205.0 204.0 205.0 214.0 218.0-Chained hotels 144.0 144.0 144.0 144.0 150.0 152.0-Independent hotels 62.0 61.0 60.0 61.0 64.0 66.0Campsites 6.0 6.0 6.0 6.0 6.0 7.0Chalets 3.0 3.0 3.0 3.0 5.0 5.0Guesthouses 2.0 2.0 2.0 2.0 2.0 2.0Hostels 19.0 19.0 19.0 25.0 28.0 31.0Motels - - - - - -Private accommodation - - - - - -Self-catering apartments 32.0 35.0 35.0 37.0 34.0 36.0Other other travel accomodation - - - - - -Other travel accomodation 62.0 65.0 65.0 73.0 75.0 81.0Travel accommodation 268.0 270.0 269.0 278.0 289.0 299.0Source: Annual report of Tourism Statistics 2003, Singapore Department of Statistics, Euromonitor International estimates
6.2 Hotels by Region
Star ratings
Regional distinctions for the location of hotels include tourist attractions associated with the beach, culture and mountains. In 2005, there was one 5-star and two 4-stars hotels located near the beach. The hotels located near the beach are namely The Sentosa Resort and Spa, Shangri-La's Rasa Sentosa Resort, and Sijori Resort, which are all situated in Sentosa. There were a total of 113 hotels located in city/culture break, of which 24 were 5-star hotels, 21 were 4-star hotels, 20 were 3-star hotels and 48 were others. Orchard Road; which is the premiere shopping district in Singapore, has the highest concentration of premium hotels such the Grand Hyatt Hotel, Four Seasons Hotel, and Shangri-La Hotel located in the area. Out of the 32 hotels located in Orchard
Gathered by: Department of Tourism ASEAN Page 71

Travel and Tourism – SINGAPORE MARKET
Road, twelve are 5-star hotels, eight 4-star hotels, seven 3-star hotels and five unrated located in the area.
Premium hotels such as The Ritz Carlton, Conrad, The Oriental, Pan Pacific and Marina Mandarin are situated at Marina Centre; another popular city break area with major shopping malls and convention centre such as the remodelled Marina Square and Suntec City. The hotels in this area are primarily targeting business travellers and discerning travellers who are seeking luxurious accommodation services.
Hotels such as The Fullerton, Swissôtel Merchant Court, and Grand Copthorne Waterfront Hotel are located in Clarke Quay/Boat Quay which is an area popular with tourists and expatriates for dining and night entertainment. There are two 5-star hotels, seven 4-star hotels and one 3-star hotels located in the area.
Budget and boutique hotels fall in the category of others. These hotels are mainly located near culture break tourist attractions such as Chinatown and Little India. Boutique hotels located in Chinatown include The Scarlet Hotel, Gallery Hotel, Hotel 1929 and The Royal Peacock Hotel. Budget hotels in the area include independent establishments like The Inn at Temple Street, The Keong Saik Hotel and also those operated by the Hotel 81 chain.
Rooms and beds
Hotels located in the tourist attractions recorded a total of 26,000 rooms and 39,000 beds in 2005. The majority of the number of rooms and beds were contributed by the 5-star and 4-star hotels in the various tourist attractions, which together formed 63% of the total rooms and beds in all tourist locations.
Occupancy trends
Hotels in the Orchard area recorded a higher occupancy rate at 82% in 2005. This was primarily due to its strategic location, as Orchard Road is a bustling area with many shopping and food establishments and the most visited tourist attraction in Singapore. Hotels near Marina Square recorded an occupancy rate of 80%. This is an area that apart from being located near major shopping malls like the Marina Square, is also close to the convention venues at Suntec City and theatres at Esplanade. Hotels located near Boat/Clarke Quay area registered an occupancy rate of 77%. Business travellers are the prime target market for hotels located in the three strategic locations of Orchard Road, Marina Square and Boat/Clarke Quay due to the concentration of commercial activities located in the areas.
On the other hand, hotels near Chinatown, comprised of mainly budget travellers, and they contributed to the occupancy rate of 75%. These budget travellers were less concerned about the locations of their hotels as there are also many budget accommodations such as hostels to choose from, besides staying at hotels near to tourist attractions.
Hotels within Sentosa Island had an occupancy rate of 70% in 2005. The main reason for the lower occupancy rate is because many tourists still prefer to stay in hotels in strategic locations,
Gathered by: Department of Tourism ASEAN Page 72

Travel and Tourism – SINGAPORE MARKET
rather than on an offshore island, so that they can carry out their activities and tour around Singapore more conveniently.
Table 37 Regional Hotel Parameters 2005Unit 5-
star4-star
3-star
2-star
1-star
Unrated Number of rooms
Number of beds
Occupancy rate %
Boat/Clarke Quay
2.0 7.0 1.0 - - - 10.4 15.6 77.0
Chinatown - 1.0 - - - - 0.7 1.1 75.0Marina Square
5.0 - - - - - 3.0 4.5 80.0
Orchard Road
12.0 8.0 7.0 - - - 10.9 16.3 82.0
Sentosa 2.0 1.0 - - - - 0.7 1.1 70.0Source: Annual Report of Tourism Statistics, Euromonitor International
6.3 Online Sales
Online developments
Whilst penetration of internet usage per household in Singapore still remains relatively low, at under 3%, computer ownership and internet usage has recorded double-digit year-on-year growth over the review period, underpinning the surge in online hotel sales and other travel retail services in 2005. The value of online hotel sales increased by 67% in 2005, and is set to be one of the most dynamic growth areas for tourism over the next few years.
The advent of budget carriers, which almost solely offer their services online, has also boosted growth in online travel bookings and online hotel bookings. Investments in websites and reliable security for safe online transactions have increased consumer confidence in making purchases for all services online.
Direct suppliers performance
Online hotel sales from direct suppliers accounted for 22% of total online hotel sales in 2005. The significant growth of 57% that year was attributed to many hotels focusing on developing their own online sales platforms, having realised the potential consumer base offered through internet users. Even leading hotel Raffles, now has an online booking service; http://www.raffles.com/raffles/reservations/reservations.asp, whereby clients can browse and book rooms across all hotels of the Raffles and Swissôtel chain.
Intermediaries performance
Online hotel sales from intermediaries, the main type of online service with 78% of total online value sales, grew by a further 70% in 2005. Zuji, the leading intermediary in Singapore, noted hotel sales constituted 20% of its total revenue in 2005. Zuji has significantly increased hotel
Gathered by: Department of Tourism ASEAN Page 73

Travel and Tourism – SINGAPORE MARKET
value sales by keeping its overheads low and offering an automated booking process, which allows consumers to book, and pay for hotels in real time online, with long or short lead times to suit their own needs. Hotels can be booked with instant confirmation, unlike many other online sites, where customers need to wait for an e-mail or call for confirmation.
Table 38 Travel Accommodation Internet Sales by Direct Suppliers and Intermediaries: Internet Transaction Value 2000-2005S$ million 2000 2001 2002 2003 2004 2005
Internet 1.2 3.1 9.8 13.4 34.6 63.5- Direct suppliers 0.2 1.0 2.8 3.4 7.6 12.9- Intermediaries 1.0 2.1 7.0 10.0 27.0 50.6Others 1,353.7 1,290.4 1,179.2 951.5 1,029.4 1,102.8Total 1,354.9 1,293.5 1,189.0 964.9 1,064.0 1,166.3Source: Trade interviews, Euromonitor International estimates
6.4 Key Performance Indicators
Sales
Hotels accounted for the highest value sales of the overall accommodation sector
The travel accommodation sector in 2005 amounted to S$1 billion, up 10% on the previous year. The intensive efforts of STB, especially towards target countries such as China and India, and a relatively stable economy, led to an overall increase in tourist arrivals for leisure as well as business purposes. However, despite the growth in value sales of accommodation in 2005, sales are still lower than that achieved in 2002, indicating that arrivals have yet to fully recover from their decline following the SARS outbreak. The rise in number of mid-range spenders, who primarily visit Singapore for leisure and focus on value for money deals, has also continued to hamper the full recovery in value terms, due to their desire for lower priced services and products.
Hotels were by far the leading type of accommodation in Singapore, commanding 95% of the total travel accommodation revenue in 2005. The remaining 30% was mainly comprised of self catering apartments and hostels, whilst campsites, chalets and guesthouses represented a minor share.
Among the hotels, the chained hotels continued to be the major source of revenue generation in 2005, due to the strong brand name of hotels, superior quality of services and various promotions offered throughout the year. In addition to this, chained hotels are located at prime tourist destinations in Singapore, which adds to the convenience for tourists. Besides, chained hotels are a popular choice for business meetings and conventions.
Despite the chained hotels being the prime source of revenue contribution to the accommodation sector, there were some independent hotels which occupied the leading position in terms of value
Gathered by: Department of Tourism ASEAN Page 74

Travel and Tourism – SINGAPORE MARKET
sales. One such hotel was the Raffles hotel. Raffles is an integral part of Singapore’s history. Besides this, the superior services and facilities offered at the Raffles hotel ensured its lead position despite being an independent hotel.
Outlets
Budget hotels and hostels are the growth areas for the accommodation sector
The total number of travel accommodation outlets in 2005 stood at 299, marginally increasing by 3% over the previous year. This is faster than hotels; the main type of accommodation, which grew by 2% over the previous year.
The outlets which have grown significantly in 2005 are hostels and budget hotels. The growth in number of hostels is attributed to the increase in education tourism, which resulted in an influx of young people in the age group 15 to 25. Since this target segment has a limited budget, hostels are a popular choice for them. Popular hostels in Singapore include YMCA International house, Singapore Youth hostel and InnCrowd Hostel.
The rise in popularity of budget hotels in 2005 was attributed to the proliferation of low cost carriers, linking Singapore to several countries. These low cost carriers made it possible for budget travellers and backpackers to visit Singapore. These visitors mainly opted for budget hotels for accommodation in Singapore. Some of the popular budget hotels included The Metropolitan YMCA, Hotel 81 and Fragrance Hotel.
The major activities pertaining to the outlets in 2005 were the opening of The Holiday Inn Atrium Singapore. The Holiday Inn Atrium Singapore was previously known as Concorde Hotel Singapore and is InterContinental Hotels Group’s second Holiday Inn in Singapore. The other major development in the same year included the re-branding of Hotel New Otani to Novotel Clarke Quay Singapore, by Accor.
Rooms and beds
The increase in tourist arrivals has significantly impacted the accommodation parameters such as rooms and beds available for tourists. The number of bed nights for the total accommodation market grew from 12.2 million in 2004 to 12.3 million in 2005. Location is of prime importance among the incoming tourists, hence hotels and other accommodation choices located at Orchard Road accounted for largest number of beds and rooms available for tourists. These were closely followed by those located at Boat/Clarke Quay, in terms of both beds and rooms. Since Boat/Clarke Quay have riverside views and offer dining as well as shopping, the hotels located at these places are favoured by many incoming tourists. The number of rooms at Orchard Road and Boat/Clark Quay were 10,900 and 10,400 respectively in 2005.
The spending per bed night increased from S$87 in 2004 to S$95 in 2005, as a result of increase in business travellers in Singapore. The spending per bed night is also likely to increase in the forecast period. The expected increase in conventions and meetings, along with world class
Gathered by: Department of Tourism ASEAN Page 75

Travel and Tourism – SINGAPORE MARKET
services provided at high end hotels in Singapore will contribute significantly to the expected growth in spending per bed night.
Occupancy
While the occupancy of various travel accommodation options grew in general, the ones located at Orchard Road registered the highest occupancy at 82%. The travel accommodation options located at Orchard Road are primarily the high-end hotels, which are popular with business travellers as well as high spending tourists. The easy accessibility of the tourist destinations and central business district from Orchard Road, along with the superior quality of services provided at these hotels ensured their high occupancy in 2005.
The second most popular location in terms of occupancy was Marina Square. Marina Square has a number of hotels, shopping malls and can be easily reached to and from business centres such as Suntec City and tourist destinations such as Esplanade - Theatres on the Bay.
RevPAR
RevPAR showed an increased across the country, in line with growth at regional level on the previous year. Amongst the major hotels in Singapore, Marriott Hotels Singapore Pte Ltd stood out as having the highest RevPAR in 2005, underpinned by its combination of high room rates and relatively high occupancy rate of 75%. The Four Seasons Hotel also boasted strong RevPAR of S$195 in 2005, supported by its high room prices, despite a less successful occupancy rate that year.
Amongst the underperformers was Grand Hyatt Singapore, which felt the impact of other competing hotel chains, as well as the effect of its discount room rates. Five-star establishment, The Oriental Hotel also fared less well than average, with a RevPAR of SG$115 in 2005.
Table 39 Hotel National Brand Owners by Key Performance Indicators 2005outlets rooms '000 beds '000 % occupancy revPAR (S$)
Raffles Holdings Ltd 4 2.6 3.9 80.7 163Shangri-La Hotel & Resort Inc 3 1.7 2.6 73.0 161Millennium & Copthorne Hotels Plc 5 2.4 3.6 71.4 110Grand Hyatt Singapore 1 0.6 0.9 80.0 100Ritz-Carlton Hotel Co LLC, The 1 0.6 0.9 70.0 172Marriott Hotels Singapore Pte Ltd 1 0.4 0.6 75.0 220Four Seasons Hotels Inc 2 0.7 1.0 63.4 195The Oriental, Singapore 1 0.5 0.8 55.0 115Conrad Centennial Singapore 1 0.5 0.8 75.0 180Source: Trade interviews, company websites, Euromonitor International
6.5 Hotel Market Shares
Gathered by: Department of Tourism ASEAN Page 76

Travel and Tourism – SINGAPORE MARKET
The key event for Raffles in 2005, was the change in ownership to Colony Capital
Raffles Holdings remained the market leader in terms of value sales in 2005, and occupied 21 of the overall hotel sector in Singapore. 2005 was of special relevance to Raffles, with a change in its ownership from Raffles Holdings Limited to Colony Capital LLC. This change follows the successful completion of the sale by Raffles Holdings of its hotel business to Colony Capital LLC for an enterprise value of S$1.72 billion.
Raffles remains one the most popular hotels among business travellers. The four outlets of Raffles put together experienced the highest occupancy of 81% in 2005. The strong brand image of the hotel, the superior quality of services offered and its special place in Singapore’s history, have contributed significantly to the leading position of Raffles International in the travel accommodation sector in Singapore. In addition to this, the hotel also offered special promotions throughout. Some of these promotions included a tie up with Singapore Airlines, whereby Singapore Airlines passengers were offered special rates, which also included buffet breakfast for two, late checkout, free stay for a child under 12 with parents and 500 Kris Flyer miles per stay. It also introduced a special pricing primarily targeted at business travellers. This promotion included a special pricing for a three day/two night stay with a complimentary breakfast, all day coffee/tea, limousine transfer between hotel and airport and special ayurvedic treatments at Raffles Amrita Spa. Raffles also partnered with American Express with the aim to offer luxury service and amenities for American Express Centurion card members globally.
Shangri-La occupied the second leading position in the travel accommodation sector
Shangri-La Hotel & Resort Inc, the second largest player in Singapore, accounted for 12% of the hotel sector in terms of value sales in 2005. Some of the special efforts made by Shangri-La in 2005 were the special pricing for weekend stays, as well as special packages for non-discounted stays. This special package for non-discounted stay included various services such as complimentary breakfast, free transport to and from airport, free laundry, free broadband access and extended check-out time.
Millennium & Copthorne Hotels Plc and Grand Hyatt Singapore occupied third and fourth position in the accommodation sector.
Millennium & Copthorne Hotels Plc accounted for 10% of overall hotel sales in 2005 and occupied third position. The hotel has five outlets, which registered occupancy of 71% in the same year. The next leading player in the hotel sector was Grand Hyatt Singapore; it accounted for 6% of the overall hotel sector in terms of value sales. In 2005, Grand Hyatt Singapore integrated its Central Reservation System with IDeaS ASP based Revenue optimisation solution. The integration will enable the hotel to centrally consolidate its available rooms, so its distribution channels can sell from the same optimised inventory. The hotel has also unveiled its newly designed Grand Deluxe Rooms and suites. These 335 new rooms are targeted at business travellers.
Another hotel which underwent renovation in 2005 was Marina Mandarin. The hotel re-opened after a S$25 million renovation, with a host of facilities and services for the MICE travellers.
Gathered by: Department of Tourism ASEAN Page 77

Travel and Tourism – SINGAPORE MARKET
Table 40 Hotel National Brand Owners by Market Share 2001-2005% retail value rsp 2001 2002 2003 2004 2005
Raffles Holdings Ltd 21.1 23.1 23.5 20.9 21.2Shangri-La Hotel & Resort Inc 6.6 8.0 12.8 11.9 12.1Millennium & Copthorne Hotels Plc 9.5 11.1 10.4 10.1 10.4Grand Hyatt Singapore 6.6 5.8 5.9 5.6 5.5Ritz-Carlton Hotel Co LLC, The 5.2 5.3 5.5 4.7 4.9Four Seasons Hotels Inc 4.4 4.7 4.2 4.2 4.2Marriott Hotels Singapore Pte Ltd 4.5 4.6 3.9 3.9 3.9The Oriental, Singapore 3.6 3.7 3.5 3.6 3.5Conrad Centennial Singapore 2.9 3.1 2.7 2.7 2.8Others 35.6 30.6 27.6 32.4 31.5Total 100.0 100.0 100.0 100.0 100.0Source: Trade interviews, company websites, Euromonitor International
6.6 Forecast Sales and Outlets
Sales
The expected MICE events and increase in leisure tourists will propel sales for the accommodation sector
Travel accommodation sales are forecast to grow at 11% year-on-year over the next five years. The expected increase in tourist arrivals for leisure purposes as well as MICE events in the coming years will ensure a strong performance in travel accommodation sales. The initiatives taken by the Singapore government to promote Singapore as an education hub will also directly impact the accommodation sector, boosting sales through budget accommodation such as hostels for overseas students. In addition to this, the expected increase in corporate travel to Singapore will impact sales for chained hotels positively in the forecast period. Since the yield per tourist is higher for business travellers as compared to other tourists, the chained hotels in Singapore are likely to experience a maximum growth of 12% in the forecast period.
Outlets
The growth of outlets is linked to the growth of hostels and independent hotels
The total number of outlets is expected to grow by 2% year-on-year in the forecast period. The two most popular categories of travel accommodation, which are poised for significant growth over the forecast period, are hotels and hostels. Hostels, which are expected to see year-on-year growth of 8% over the forecast period, are favoured by youth travellers, backpackers and students. In terms of hotels, the chained hotels are expected to grow marginally by less than 1%, while the independent hotels are likely to grow by 3% in the forecast period. The expected increase in mid range spending tourists in the forecast period is likely to propel growth for independent hotels.
Gathered by: Department of Tourism ASEAN Page 78
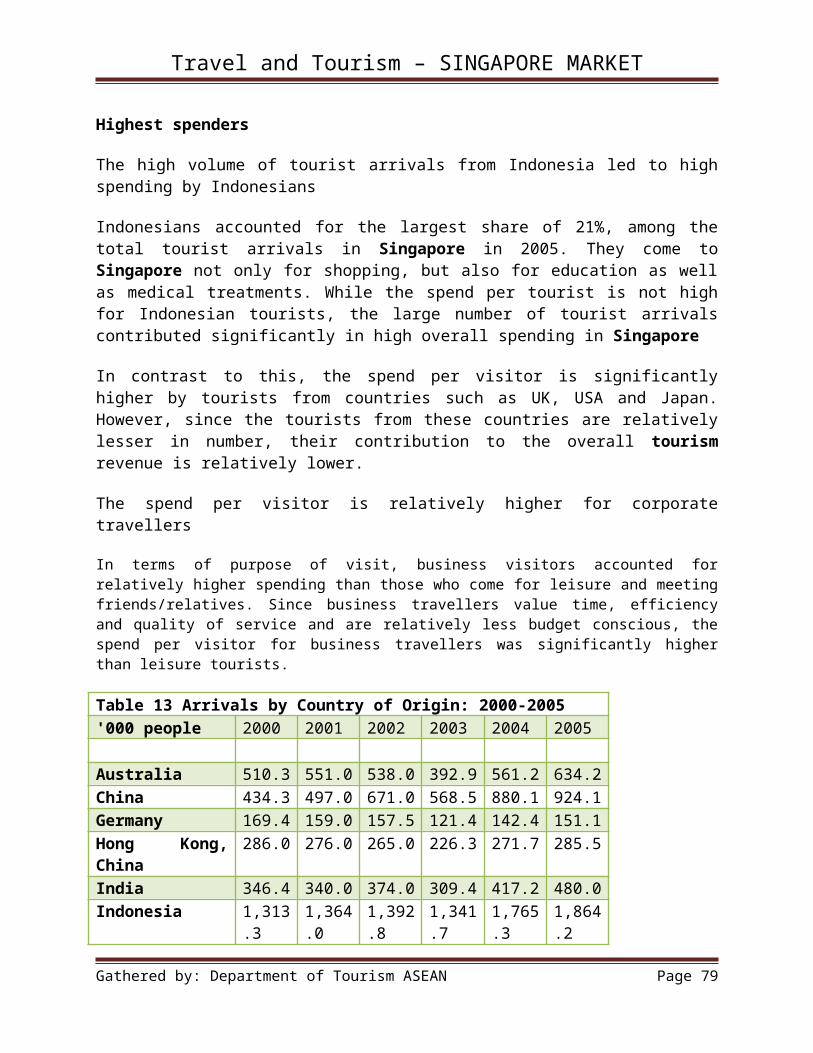
Travel and Tourism – SINGAPORE MARKET
Major developments in the accommodation sector in the coming years
Some of the major outlets which are likely to be set up in the forecast period include the opening of St. Regis in 2007. The St. Regis Singapore is expected be developed in Orchard Road shopping and entertainment district and will feature 299 guest rooms, which will include 30 suites and about 15,000 square feet of meeting facilities. Other facilities will include four food and beverage outlets, health/spa centre and other recreational facilities.
Another hotel which is expected to be developed is Robertson Quay Hotel, a S$35 million mid-tier resort along Siloso Beach. In addition to this, the Amara group is also developing a 125-room boutique resort at Sentosa. The resort, with an investment of S$60 million is expected to be completed in 2007. Another upcoming project is that of Pontiac Land Group. The group is developing The Knolls; a 6-star, super luxury resort. The resort, with an investment of S$150 million, will be headed for completion in 2008.
Online trends
Online sales for the accommodation sector is expected to grow by more than 500% in the 2005-2010 forecast period. The online services as a medium between tourists and travel accommodation providers is likely to continue gaining popularity in the coming years due to the expected increase in internet savvy population. In addition to this, the availability of a wide range of accommodation options, based on location, size, price and facilities on the internet at any time is likely to increase the usage of online services. Also, direct suppliers, as well as intermediaries, are likely to upgrade their services and simplify the transaction process.
In comparison to other online travel and tourism services, accommodation sales through the internet are expected to register the highest growth. The prime reason attributed to the highest growth is that all types of outlets, especially the hotels, are likely to use internet as a medium of promotion as well as publicity. The direct suppliers as well as the intermediaries are likely to set up portals, which would contain an exhaustive list of options in terms of various services and facilities offered. In addition to this, these websites would also offer bargain deals as well as value for money deals, which would be the prime attraction for majority of the visitors. Hence the online accommodation services are expected to cater to a wider range of tourists as well as offer huge variety in terms of their services and facilities, as compared to other sectors.
Table 41 Forecast Travel Accommodation Sales by Sector: Value 2005-2010S$ million 2005 2006 2007 2008 2009 2010
Hotels 1,113.8 1,249.6 1,396.1 1,553.1 1,720.3 1,897.3-Chained hotels 891.0 1,006.8 1,132.7 1,268.6 1,414.5 1,570.1-Independent hotels 222.8 242.8 263.4 284.5 305.8 327.3Campsites 0.3 0.3 0.3 0.3 0.3 0.4Chalets 1.6 1.6 1.7 1.7 1.8 1.9Guesthouses 0.7 0.7 0.7 0.8 0.8 0.9Hostels 16.9 18.7 20.7 22.7 24.9 27.1
Gathered by: Department of Tourism ASEAN Page 79

Travel and Tourism – SINGAPORE MARKET
Table 41 Forecast Travel Accommodation Sales by Sector: Value 2005-2010S$ million 2005 2006 2007 2008 2009 2010Motels - - - - - -Private accommodation - - - - - -Self-catering apartments 33.2 34.8 36.4 37.9 39.2 40.4Other other travel accomodation - - - - - -Other travel accomodation 52.6 56.2 59.8 63.4 67.1 70.6Travel accommodation 1,166.3 1,305.8 1,455.9 1,616.6 1,787.4 1,968.0Source: Euromonitor International estimates
Table 42 Forecast Travel Accommodation by Sector: Units 2005-2010Outlets 2005 2006 2007 2008 2009 2010
Hotels 218.0 222.0 224.0 226.0 228.0 230.0-Chained hotels 152.0 152.0 154.0 154.0 154.0 154.0-Independent hotels 66.0 70.0 70.0 72.0 74.0 76.0Campsites 7.0 7.0 7.0 8.0 8.0 8.0Chalets 5.0 5.0 5.0 5.0 5.0 5.0Guesthouses 2.0 2.0 2.0 2.0 2.0 2.0Hostels 31.0 33.0 36.0 39.0 42.0 45.0Motels - - - - - -Private accommodation - - - - - -Self-catering apartments 36.0 37.0 38.0 39.0 40.0 41.0Other other travel accomodation - - - - - -Other travel accomodation 81.0 84.0 88.0 93.0 97.0 101.0Travel accommodation 299.0 306.0 312.0 319.0 325.0 331.0Source: Euromonitor International estimates
Table 43 Forecast Travel Accommodation Internet Sales by Sector: Internet Transaction Value 2005-2010S$ million 2005 2006 2007 2008 2009 2010
Internet 63.5 100.0 150.2 217.0 302.0 414.0- Direct suppliers 12.9 20.0 30.2 44.0 62.0 86.0- Intermediaries 50.6 80.0 120.0 173.0 240.0 328.0Others 1,102.8 1,205.8 1,305.7 1,399.6 1,485.4 1,554.0Total 1,166.3 1,305.8 1,455.9 1,616.6 1,787.4 1,968.0Source: Euromonitor International estimat
7. TRANSPORTATION
7.1 Sales by Sector
Gathered by: Department of Tourism ASEAN Page 80

Travel and Tourism – SINGAPORE MARKET
2005 headlines
Budget airlines change market scenario of air travel in SingaporeAir travel continues to be the highest contributor to the value sales of transportation sectorSTB and Land Transport Authority take initiative for boosting transportation sectorRise in oil prices leads to increase in fuel surcharge by the airlines
Sales
The value sales of the transportation grew from S$24 billion in 2004 to S$26 billion in 2005. Positive economic growth and relatively stable political environment in the region led to higher spending power of tourists as well as helped improve travel confidence. This directly impacted transportation in Singapore and led to growth of 7% in current value terms over 2004.
The transportation sector in 2005 was impacted by the proliferation of low cost carriers. The budget airlines have contributed significantly to the increase in tourist arrivals in Singapore, by increasing their operations and connecting several countries with Singapore. The budget airlines, which offer competitive pricing, also impacted the traditional airlines. The competition from low cost carriers made the traditional airlines take several initiatives to maintain their customer base, including special pricings and tie-ups with hotels.
One of the highlights of 2005 pertaining to the low cost carriers was the merger of Valuair and Jetstar Asia. The merger is expected to create a stronger corporate entity, so as to be able to compete in the air travel space and complement the strengths of the parent companies.
Among the different types of travel modes, air travel sales were the highest in 2005. While the other modes of transportation such as buses, rail and cruises also experienced growth in 2005, the revenue from air travel continue to be significantly higher than that generated by other transportation subsectors.
The Government also made some efforts to boost the travel market in 2005. The joint contribution of STB and Land Transport Authority to the transportation sector included shortening of vehicle entry permits operating hours on Fridays. This allowed the exemption from fee payment for drivers of foreign-registered cars and motorcycles if they enter Singapore after 5.00pm on all weekdays. The extension of shorter VEP operating hours to all weekdays made it more appealing for visitors to drive over to Singapore for a visit or to enjoy the line-up of concerts, musicals and other performances.
Despite the positive impact of low cost carriers, one factor which negatively impacted the transportation sector in 2005 was the increase in fuel surcharge as a result of rising oil prices. The subsector which suffered most due to this was air travel. In an attempt to counter the rise in
Gathered by: Department of Tourism ASEAN Page 81

Travel and Tourism – SINGAPORE MARKET
oil price, several airlines increased their fuel surcharge. This translated into a slight raise in the airfares, which marginally reduced the sales for the airlines.
Air
Air travel accounts for more than 90% of the total transportation value sales. This subsector also experienced the highest growth of 7% in current value terms in 2005. In absolute value terms, air travel amounted to S$24 billion. The expansion of operations of low cost carriers contributed significantly to the increase in value sales for air travel. Traditional airlines such as Singapore Airlines also expanded operations to new destinations such as Hyderabad, and increased its frequency to destinations such as Hanoi, Fukuoka and Christchurch.
Rail
Rail travel accounted for second highest value sales, amounting to S$978 million in 2005. Since rail is linked to most of the tourist destinations in Singapore, it is a popular choice of travel within the country. Some of the major efforts being done to enhance usage of rail included the commencement of Circle Line Phases 4 & 5 in the third quarter of 2004, which is targeted for completion by 2010. Phases 4 & 5 will have a total route length of 17 kilometres and will comprise of 13 stations. Some of the other developments in the pipeline include the extension of East West Line westwards, which is scheduled to be completed by 2009. Also there are plans to build three new rail lines (two MRT and one LRT) over the next 10 to 15 years to serve Bukit Timah, Jurong and estates in the eastern part of Singapore.
Buses
Buses; which are a popular mode of transport for local tourists, experienced growth of 6% in 2005. Buses and coaches are mainly used for travel to and from Malaysia, appealing to travellers as they are not only cheaper than air travel, but also convenient and bookings are easily available.
Cruise
Cruise registered value sales worth S$213 million in 2005. While cruise sales experienced growth in the last two years of the review period, sales were still lower than that achieved in 2002. The prime reason for the slower pace of growth is the limited number of destinations offered by cruise lines. In addition to this, cruises are mostly taken once only to a particular destination, as a result of lack of innovativeness in the cruise packages. In an attempt to overcome these limitations, some cruise lines offered special pricing and added new destinations. Despite these efforts, sales experienced a sluggish growth of 5% in 2005 over the previous year.
Ferry
Ferry value sales in 2005 registered a marginal increase of 3% over the previous year. The usage of ferries is likely to remain stagnant as they are used only for select destinations in Malaysia and Indonesia. Local travel in ferries is also very limited to a few outlying islands. Though there is a ferry
Gathered by: Department of Tourism ASEAN Page 82
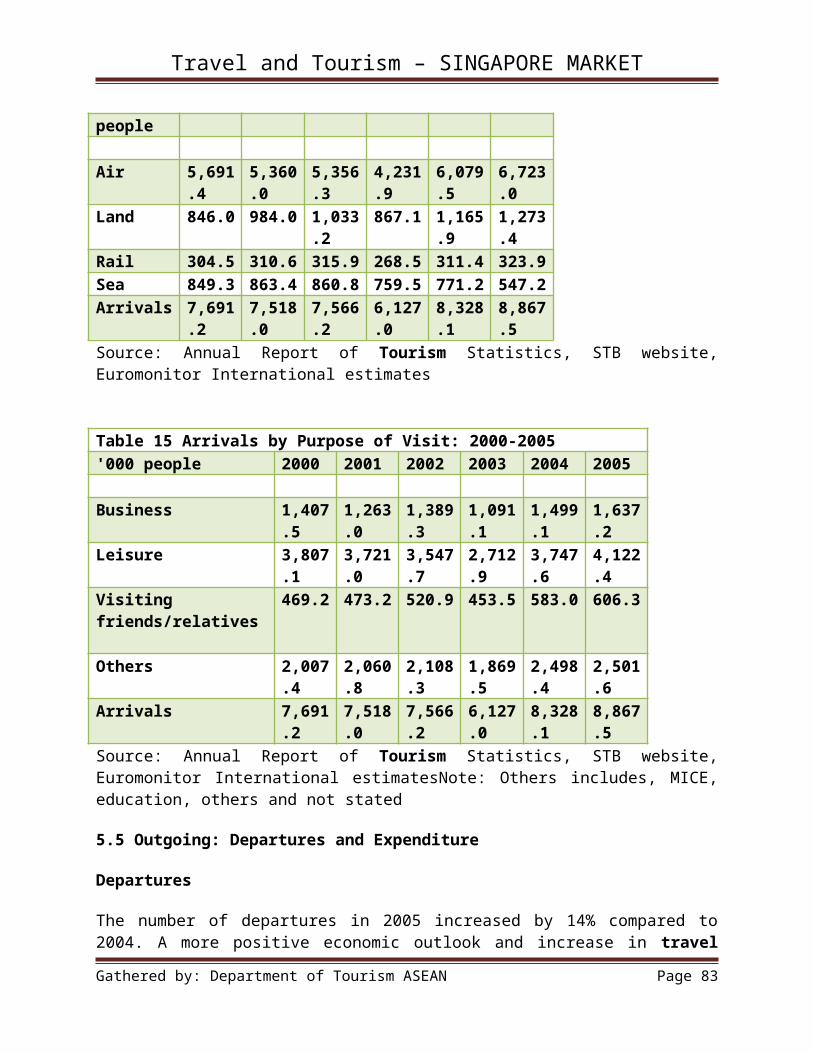
Travel and Tourism – SINGAPORE MARKET
terminal at Sentosa, the availability of alternate options such as cable car and buses have further restricted the usage of ferries. Additionally ferry operators imposed a new fuel surcharge on all ferry passengers departing from the Tanah Merah Ferry Terminal. This fuel surcharge of S$5.00 and a security tax S$1.20, will further limit the number of passengers and hence the value sales for ferry operators.
Table 44 Transportation Sales by Sector: Value 2000-2005S$ million 2000 2001 2002 2003 2004 2005
Air 30,201.4 28,438.3 22,750.6 15,925.4 22,295.6 23,856.3Other transportation 1,542.1 1,583.0 1,529.9 1,544.3 1,624.7 1,717.0Bus/coach 433.5 409.0 429.5 451.0 475.8 502.9Chauffeur-driven car 8.2 6.1 5.9 5.1 5.2 5.4Cruise 358.6 380.1 306.8 184.0 203.3 212.5Ferry 15.1 15.4 16.3 17.1 17.8 18.3Rail 726.7 772.4 771.4 887.1 922.6 978.0Transportation 31,743.5 30,021.3 24,280.5 17,469.7 23,920.3 25,573.3Source: Euromonitor International from trade interviews, Land Transport Authority, Ministry of Transport
7.2 Airline Capacity and Utilisation
Capacity
Airline capacity in 2005 increased to 63 million seats. Though the capacity for low cost carriers is significantly lower than that of scheduled flights, budget airlines witnessed maximum growth over 2004. The prime reason for this is that the budget airlines, which initially offered short haul destinations, started offering long haul destinations in 2005. Low cost carriers also increased their frequency to popular destinations. For example, Jet Airways started non-stop daily flights between Mumbai and Singapore, while Air Sahara commenced a daily service between Delhi and Singapore in 2005. Air Asia, which initially focused on less popular sectors within Malaysia, branched out to link Bangkok, Phuket, and Chiang Mai to its Malaysian network.
Some of the major additions made in scheduled flights in 2005 included addition of flights to South Indian cities such as Hyderabad by Singapore Airlines. Besides this, Singapore Airlines also increased its frequency to Bangalore.
Utilisation
Traditional airlines experienced higher utilisation in 2005 as compared to 2004, supported by the increase in corporate travel. While there was a decline in high spending tourists, several of airlines such as Singapore Airlines had special price based promotions to push their utilisations in the face of competition from budget carriers. Thus 2005 saw an increase in mid-range visitors attracted to price promotions on flight tickets to Singapore. In addition to this, the traditional airlines also offered several promotions for their passengers. Some of these promotions included
Gathered by: Department of Tourism ASEAN Page 83
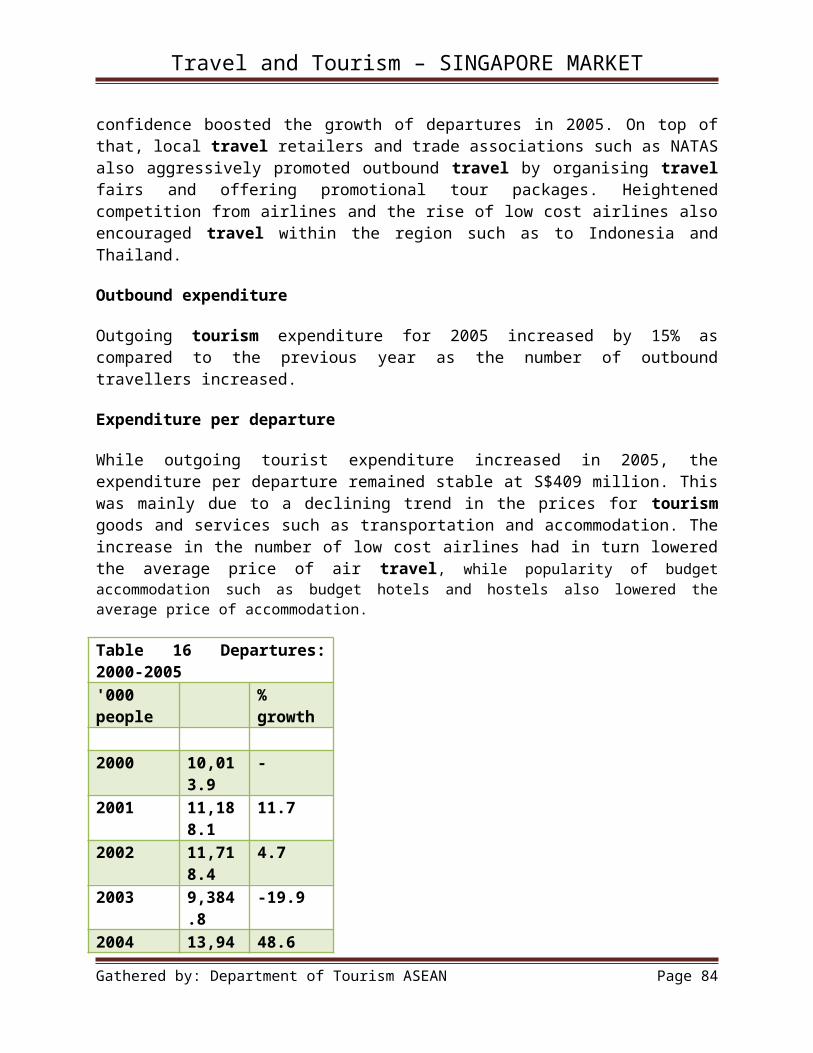
Travel and Tourism – SINGAPORE MARKET
special pricing and tie-ups with tourist destinations, hotels or travel agents. These promotions were offered by most of the major airlines operating in Singapore.
Table 45 Airline Capacity: 2000-2005'000 seats 2000 2001 2002 2003 2004 2005
Airline capacity 60,720.0 59,736.0 61,518.2 52,873.0 57,990.2 63,097.6-Schedule (capacity) 59,753.0 58,749.0 60,511.5 51,967.0 56,464.4 61,484.1-Charter (capacity) 967.0 987.0 1,006.7 906.0 869.8 826.3-Low cost carriers (capacity) - - - - 656.0 787.2Source: Trade interviews, Euromonitor International estimates
Table 46 Airline Utilisation: 2000-2005'000 seats 2000 2001 2002 2003 2004 2005
Airline seats sold by type 49,968.5 45,364.8 49,450.0 34,599.6 43,182.5 48,812.8-Schedule (utilisation) 49,953.0 45,348.0 49,433.9 34,586.6 42,771.5 48,331.8-Charter (utilisation) 15.5 16.8 16.1 13.0 17.4 16.5-Low cost carriers (utilisation) - - - - 393.6 464.5Source: Trade interviews, Euromonitor International estimates
Table 47 Airline % Utilisation 2000-2005% airline utilisation 2000 2001 2002 2003 2004 2005
Airline seats sold by type 82.3 75.9 80.4 65.4 74.5 77.4-Schedule (utilisation) 83.6 77.2 81.7 66.6 75.7 78.6-Charter (utilisation) 1.6 1.7 1.6 1.4 2.0 2.0-Low cost carriers (utilisation) - - - - 60.0 59.0Source: Trade interviews, Euromonitor International estimates
7.3 Airline Seat Class and Distance
Seat class
Economy class continues to occupy the highest share and accounted for 95% of the total seats in 2005. The relatively higher share of leisure tourists as compared to corporate travellers contributed to the higher usage of economy class. The business class seats in the airlines registered a marginal decline in its percentage share among the total seats, though in absolute terms, business class seats increased in comparison to the previous year. Since the share of business travellers and high spending tourists declined over last few years, the share of business class seats also dipped in 2005.
Gathered by: Department of Tourism ASEAN Page 84

Travel and Tourism – SINGAPORE MARKET
Distance
The share of short haul flights increased by one percentage point to 9% in 2005. The entry of new low cost carriers, as well as increased frequency of flights to destinations less than five hours by flight, led to increased travel on short haul flights. However, the increase in number of flights and their frequency has not translated to a proportional increase in value sales for short haul flights. The long haul flights still continue to be the higher revenue generator, primarily because these flights cost relatively more than short haul flights. Thus the high yield per tourist, combined with increase in outbound travel to long haul destinations, led to higher value sales for long haul flights.
Table 48 Airline Volume Sales by Seat Class: % Breakdown: 2000-2005% 2000 2001 2002 2003 2004 2005
Airline seats sold by class 100.0 100.0 100.0 100.0 100.0 100.0-Economy class (utilisation) 92.3 93.4 94.2 94.3 94.5 94.7-Business class (utilisation) 7.1 6.2 5.4 5.4 5.2 5.0-First class (utilisation) 0.6 0.4 0.3 0.3 0.3 0.3Source: Trade interviews, Euromonitor International estimates
Table 49 Airline Volume Sales by Distance: % Breakdown: 2000-2005% 2000 2001 2002 2003 2004 2005
Airline seats sold by distance 100.0 100.0 100.0 100.0 100.0 100.0-Short haul (utilisation) 4.6 6.2 6.5 7.2 7.9 8.7-Long haul (utilisation) 95.4 93.8 93.5 92.8 92.1 91.3Source: Trade interviews, Euromonitor International estimates
7.4 Online Sales
Online developments
Online sales of airlines in 2005 registered 20% increase over 2004. In terms of shares, online sales grew from 9% in 2004 to 10% of transportation sales in 2005. Online sales for air travel accounted for almost 90% of the total transportation sales made via internet. The easy accessibility of information and convenience of booking have made the internet an important part of the airline industry. The internet usage for travel bookings is likely to grow further in the coming years as customers feel more confident of handling internet transactions and as increasing numbers of airlines or their intermediaries offer bargain deals on the internet.
Direct suppliers performance
The direct suppliers for air travel witnessed a decline in their share from 16% in 2004 to 15% in 2005. This decline is attributed to the lack of proactive efforts made by traditional airlines to promote the usage of their websites, depending instead on travel agents for their sales. A more
Gathered by: Department of Tourism ASEAN Page 85

Travel and Tourism – SINGAPORE MARKET
severe decline was prevented by growth in sales from low cost carriers, which largely depend on the internet for sales and maintain minimal costs by removing the involvement of travel agents. Nevertheless, despite online growth for low cost carriers, their share was very low, as they fly to very few destinations and their value sales are relatively lower than traditional airlines, thus making their contribution to the market still limited. However, over the next few years, the performance of direct suppliers is expected to improve as low cost carriers build their share against traditional airlines and become the driving force for online sales.
Intermediaries performance
Intermediaries in the air travel sector accounted for 85% of the total online sales for air travel in 2005. In absolute terms, their value sales amounted to S$2 billion in 2005. The intermediaries in air travel offered several attractive deals for customers. In addition to this, they also offered complete travel solutions, which complemented the travel plans of tourists. Hence, customers could get various combinations such as just air tickets or air ticket and hotel stay arrangements.
Intermediaries are likely to lead the online sales in the coming years as well, as the internet usage among customers increases and the services provided by the intermediaries improve further. Some of the major players in the on-line airline ticketing industry include Zuji, Priceline, Amadeus, Expedia and Orbitz.
Table 50 Transportation Internet Sales by Direct Suppliers and Intermediaries: Internet Transaction Value 2000-2005S$ million 2000 2001 2002 2003 2004 2005
Internet 634.9 900.6 1,456.8 1,397.6 2,151.0 2,656.7- Direct suppliers 102.1 153.2 229.8 227.5 334.4 430.0- Intermediaries 532.8 747.4 1,227.0 1,170.1 1,816.6 2,226.7Others 31,108.6 29,120.7 22,823.7 16,072.1 21,769.3 22,916.6Total 31,743.5 30,021.3 24,280.5 17,469.7 23,920.3 25,573.3Source: Trade interviews, Euromonitor International estimates
7.5 Key Performance Indicators
Sales
The airline market in Singapore is fairly consolidated with major airline operators in 2005 accounting for 72% of the total market. In absolute terms, air travel in 2005 amounted to S$24 billion. Though the value sales for air travel in 2005, experienced growth over previous years, it was lower than the value sales witnessed in 2001.
2003 was the worst hit as a result of negative economic growth and SARS, which led to a significant decline in tourist arrivals. 2004 witnessed the economic rebound, as well as increase in travel confidence, which gave a major boost to the air travel market. 2004 was also of special
Gathered by: Department of Tourism ASEAN Page 86

Travel and Tourism – SINGAPORE MARKET
relevance as it marked the entry of budget airlines. Hence, while the volume sales grew significantly, value sales experienced relatively less growth in 2005.
Fleet size
The fleet size for Singapore Airlines stood at 90 in 2005. During financial year 2004-05, the airline added two Airbus 340-500s and five Boeing 777s, while three Boeing 747-400s were retired from the operating fleet. As at 31 March 2005, the operating fleet comprised of 27 B747 -400s, 57 B777s and five A340-500s. One of the key developments made by Singapore Airlines was the purchase of Airbus A380. Singapore Airlines will be the launch customer for Airbus and is expected to take delivery of its first A380 in 2006. Singapore Airlines have made a confirmed offer of 10 A380s. However, it may add another 15 A380s in the coming year. Qantas; the second leading airline, has also placed order for 12 Airbus A380s and will take delivery in April 2007.
Load factor
The load factor for Singapore Airlines; the leading airline in 2005, was 79%, which was the highest among all the major airlines. The prime reason attributed to this was the aggressive promotional activities offered by Singapore Airlines. The load factor for other major airlines ranged from 67% to 74% for the same year. All the major airlines experienced an increase in load factor as a result of increased tourist arrivals, as well as departures, to Singapore.
Revenue passengers-kms
Singapore Airlines registered the highest revenue passengers-km in 2005 of 65,500 million. The company is linked with over 89 cities in 40 countries. The next leading airline in terms of revenue passengers-km in 2005 was Qantas Airways. Qantas Airways registered revenue passenger-km of 8,188 million in 2005.
Passengers flown
The traditional airlines experienced an increase in passenger volume in 2005 as compared to 2004, as new destinations were added by several airlines. In addition to this, the increase in tourist arrivals from countries such as China and India helped increase the tourist traffic to and from Singapore. The leading airline in terms of passengers flown in 2005 was Singapore Airlines. Since Singapore Airlines had the maximum reach to different destinations, it accounted for the highest amount of passengers flown in 2005 at 12 million. Additionally, the special price based promotion offered by Singapore Airlines also helped attain the highest passenger volume.
Table 51 Airline National Brand Owners by Key Performance Indicators 2005Fleet size
Passengers carried (millions)
Revenue passenger kms (million)
% average load factor
Singapore Airlines Ltd 90 11.9 65,500 79.0
Gathered by: Department of Tourism ASEAN Page 87
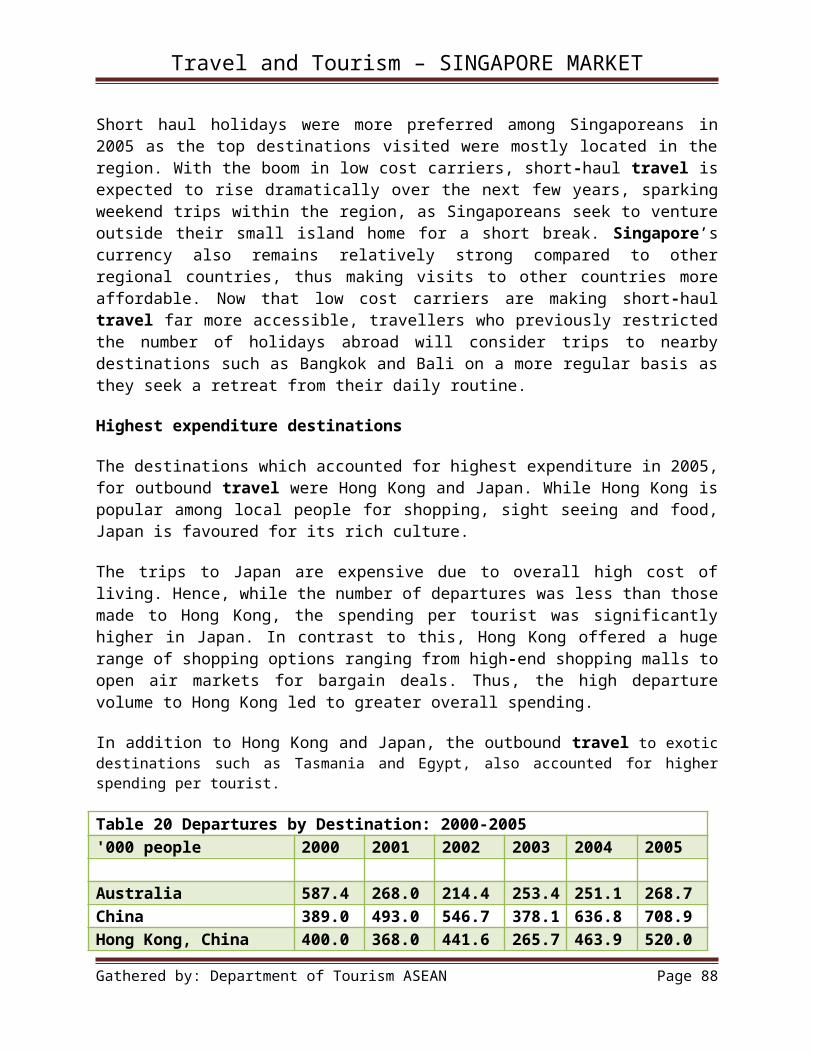
Travel and Tourism – SINGAPORE MARKET
Table 51 Airline National Brand Owners by Key Performance Indicators 2005Fleet size
Passengers carried (millions)
Revenue passenger kms (million)
% average load factor
(SIA) Qantas Airways Ltd 45 4.9 8,188 72.0British Airways Plc 30 1.2 3,087 69.0Cathay Pacific Airways Ltd 25 1.9 6,489 74.0
Deutsche Lufthansa AG 15 0.7 3,275 67.0
Thai Airways International PCL 25 2.3 5,240 73.0
Malaysian Airlines System Bhd 40 3.8 5,568 70.0
Emirates Airlines 30 0.2 1,965 71.0Source: Trade interviews, company reports, Euromonitor International estimates
7.6 Airline Market Shares
Singapore Airline remained the market leader
Despite the emergence of low cost carriers, Singapore Airlines Ltd continued to enjoy the leading position in the air travel sector for 2005. The airline accounted for 35% of the total air travel market in terms of value sales. Some of the major initiatives taken by the airline in 2005 included an increase in its capacity on existing routes by about 5%. It increased its frequencies to Hanoi, Fukuoka and Christchurch to provide daily flights, while frequencies to Mumbai were increased to twice-daily flights. Additional twice a week flights were added to both Brisbane and Melbourne. Singapore Airlines also increased its frequencies from three to five flights per week to Shenzhen in China. It also started its four times weekly services to Hyderabad. Other than increasing its frequency and adding new destinations, the airline signed a three year Memorandum of Understanding (MoU) with Tourism Australia. This MoU, which is worth S$16 million, is aimed at marketing Australia in international markets served by Singapore Airlines.
In terms of online services, Singapore Airline’s attempts to maintain its customer base included the introduction of an in-flight broadband service. The airline also simplified its process of online booking. The other developments included the launch an online merchandising product with Amadeus e-Travel. This online merchandising solution offers the airline availability, faring, and shopping capabilities for its international and domestic travellers.
In addition to all of above, Singapore Airlines also launched live TV onboard in its international flights. For its transit passengers, Singapore Airlines tied up with Singapore’s Changi Airport to provide its passengers several shopping, dining and lifestyle services at discounts of up to 50 per cent at the airport.
Gathered by: Department of Tourism ASEAN Page 88

Travel and Tourism – SINGAPORE MARKET
British Airways, ranked second behind Singapore Airlines, and Qantas Airways, the sixth leading player in 2005, both saw significant activity as they sought to enhance their share on the previous year. The major initiatives taken by Qantas in 2005 were the opening of a new joint business lounge at Singapore Airport, in collaboration with British Airways. The business lounge, which was upgraded for US$7 million, provides better facilities for passengers. Some of these facilities are an increase in number of seats, six fully equipped private workstations, 12 high speed internet PCs, printing, photocopying, phone and fax services. Other improvements include a new buffet and self-serve bar, an 18 metre long cocktail bar and a TV/entertainment zone.
Table 52 Airline Market Shares 2001-2005% retail value rsp 2001 2002 2003 2004 2005
Singapore Airlines Ltd (SIA) 35.0 30.0 36.0 34.0 35.0British Airways Plc 6.4 7.0 6.8 6.7 6.7Cathay Pacific Airways Ltd 5.7 6.4 6.0 6.0 6.2Thai Airways International PCL 3.8 3.7 3.9 4.1 4.2Deutsche Lufthansa AG 2.9 2.9 3.3 4.2 4.0Qantas Airways Ltd 2.8 2.9 2.9 2.7 3.0Malaysian Airlines System Bhd 1.8 1.9 1.8 2.0 2.0Emirates Airlines 0.9 0.9 1.1 1.1 1.3Others 40.7 44.3 38.2 39.2 37.6Total 100.0 100.0 100.0 100.0 100.0Source: Trade interviews, company reports, Euromonitor International estimates
7.7 Forecast Sales by Sector
Sector sales
Air travel sales growth expected to be influenced by competition amongst budget airlines and traditional airlines
The air travel sector is expected to grow by 9% each year over the forecast period to reach S$36.7 billion by 2010. The major drivers for the growth include the expected increase in tourist arrivals, for business as well as leisure purpose. Besides this, the budget airlines will continue linking up with new short haul as well as long haul destinations, thus creating a new target segment for the airlines. In addition, the traditional airlines are also likely to increase their destinations as well as frequencies. Hence the expected increase in passenger volume will lead to increase in sales.
Cruise sales are set for second highest growth in the forecast period
Gathered by: Department of Tourism ASEAN Page 89

Travel and Tourism – SINGAPORE MARKET
Cruises are also expected to enjoy a solid performance over the forecast period, increasing by over 7% year-on-year to stand at just under S$300 million by 2010. Value sales are likely to be driven by increase in operations to new destinations. The cruise sales will also benefit from several initiatives taken by the operators, which include extensive promotion, upgraded services and facilities on the cruises.
The growth in sales of buses and coaches in the forecast period is linked to the tourist traffic between Singapore and Malaysia
Buses and coaches follow next in terms of growth rate in the forecast period. The increasing tourist traffic to and from Malaysia and addition of several luxury coaches on this route, will contribute in achieving the growth rate of 5% year-on-year for buses/coaches in the forecast period. However, one factor which would negatively impact the travel via buses and coaches is the rise of low cost carriers to and from Malaysia. The low pricing of budget airlines is expected to shift in travel preference for some travellers from buses to low cost carriers.
Rail travel expected to achieve a marginal growth in the forecast period
Rail travel is expected to achieve slower growth over the forecast period, underperforming other types of transportation. The limited accessibility of rail to the tourist destinations and availability of convenient options such as buses and taxis, have stunted the growth potential of rail travel. Some of the efforts made by the government for improving the rail services include its decision to build the 'Downtown Extension' with 5 stations between Millennia station on the Circle Line and Chinatown station on the North East Line, with intermediate stations at Bayfront, Landmark and Cross Street The project is likely to be completed by 2012.
Online trends
Online sales of the overall transportation sector is poised for growth of 59% over the five-year forecast period, boosted by the continued uptake of computer ownership, as well as ongoing rise in major travel retailers such as www.zuji..com.sg and www.asiatravel.com.sg. The rise of such intermediaries will be a major driving force behind online transportation sales in the next five years.
Airline direct suppliers are also expected to step up their competitive positioning against intermediaries by offering more aggressive promotions and pricing. This will be good news for the consumer, who will be offered with an array of competitively priced air tickets and bargain fares from both traditional carriers and low cost carriers. This trend will help ensure dynamic growth in online sales throughout the forecast period.
Table 53 Forecast Transportation Value Sales by Sector: Value 2005-2010S$ million 2005 2006 2007 2008 2009 2010
Air 23,856.326,241.928,734.931,321.033,983.336,702.0Other transportation 1,717.0 1,794.1 1,866.4 1,932.9 1,992.9 2,046.9Bus/coach 502.9 533.1 562.4 590.5 617.1 641.8
Gathered by: Department of Tourism ASEAN Page 90

Travel and Tourism – SINGAPORE MARKET
Table 53 Forecast Transportation Value Sales by Sector: Value 2005-2010S$ million 2005 2006 2007 2008 2009 2010Chauffeur-driven car 5.4 5.4 5.5 5.6 5.7 5.9Cruise 212.5 229.5 246.7 263.9 281.1 299.4Ferry 18.3 18.8 19.3 19.7 20.0 20.2Rail 978.0 1,007.3 1,032.5 1,053.1 1,068.9 1,079.6Transportation 25,573.328,036.030,601.333,254.035,976.238,748.9Source: Euromonitor International estimatesTable 54 Forecast Transportation Internet Sales by Sector: Internet Transaction Value 2005-2010S$ million 2005 2006 2007 2008 2009 2010
Internet 2,656.7 3,040.9 3,384.8 3,690.4 3,948.7 4,220.6- Direct suppliers 430.0 550.0 690.0 850.0 1,020.0 1,210.0- Intermediaries 2,226.7 2,490.9 2,694.8 2,840.4 2,928.7 3,010.6Others 22,916.6 24,995.2 27,216.4 29,563.6 32,027.5 34,528.3Total 25,573.3 28,036.0 30,601.3 33,254.0 35,976.2 38,748.9Source: Euromonitor International estimates
Travel and Tourism - Singapore
4 Sep 2006
9. TRAVEL RETAIL
9.1 Market Size
2005 headlines
Travel retail value sales up 12%; number of outlets up 8% in 2005Travel agents remained both the largest and the fastest-growing outlet types, numbering 520 in 2005Surge in popularity of adventure/trekking holidays
Sales
The travel retail market in 2005 grew steadily at 12% in value terms and reached S$3 billion, supported by a growing desire for short and long-haul travelling by Singaporeans. The economic recovery and an improving business environment from the previous year also continued to give a boost to this sector, spurring growth in revenue amongst all areas.
One of the main features of the travel retail sector is that it is highly fragmented and competitive. In 2005, the top three players occupied near 28% of total value sales. However, the
Gathered by: Department of Tourism ASEAN Page 91

Travel and Tourism – SINGAPORE MARKET
share of the top players has consistently increased since 2001. Thus the industry is likely to see further consolidation and enhancement in the positioning of the top players.
Outbound tourism is heavily promoted each year by the National Association of Travel Agents (NATAS) through a travel fair held in March and September. The timing of such fairs is to allow families enough time to plan for their holidays usually taken during mid-year or at year end to coincide with the month-long school holidays. The top travel retail service companies, most notably, Chan Bros Travel Pte Ltd, Sino-America Tours Corp Pte Ltd, Ananda Travel (S) Pte Ltd and Commonwealth Travel Services Corp Pte Ltd also organise their own individual fairs once or twice a year prior to the NATAS fairs, so that they have their own individual exposure in addition to their exposure by NATAS. Such travel fairs play an important role in maximising awareness of new destinations and promotional offers in the travel industry.
Different moves by airlines to increase flights to various destinations have also made a positive impact on the growth in the business for travel agencies and tour operators. Outbound travel to Australia is encouraged and in May this year, Singapore Airlines increased flights to Perth from 17 to 19 a week, while Valuair also started daily flights to Perth in December 2004.
Travel retail value sales in Singapore have increasingly benefited year-on-year from the influence of seasonal sales, not only during the standard peak school holiday seasons in June and July, but notably during public holidays such as during Chinese New Year in January, Valentine’s Day in February and Deepavali in November. Ticket sales and package deals to Thailand were particularly strong during Chinese New Year, with travel agents reporting tickets and package deals selling out as early as six months in advance, as families and friends planned their trip for this long weekend. Valentine’s Day saw travel agents capitalise on this by heavily promoting romantic getaways for Singaporean couples during 2005.
Outlets
All three aspects of travel retail experienced positive growth in terms of the number of outlets in 2005. Travel agencies saw highest growth of 11% whilst tour operators saw growth of 5% and exchange services were up by 2% on the previous year. The growth was primarily attributed to an increase in leisure travel as well as business travel, which enhanced the potential business opportunities for existing players as well as new entrants.
Exchange services experienced a less buoyant, but still steady increase of 2% in 2005. Sales of existing outlets continued to develop on the previous year, but stringent requirements set out by the Monetary Authority of Singapore deterred full potential growth in new openings.
Traditional travel agents are facing increasing competition from online retailers; in particular, Zuji. In response, they have invested in developing online arms with the need to offer competitive fares.
The changing landscape of travel retail
Gathered by: Department of Tourism ASEAN Page 92

Travel and Tourism – SINGAPORE MARKET
The lines between travel agencies and tour operators is blurring as both are undertaking the roles of each other. Tour operators are traditionally the product owners or wholesalers and develop products to distribute to the travel agencies for sale to customers. However, increasingly, as competition increases in the market, travel agencies are also developing their own products and retailing them to smaller agencies. Tour operators have also moved on to sell direct to customers. As the market for tour operators and travel agencies is very saturated and competitive, it is difficult for new players to sustain their businesses unless they have a new or unique platform to offer.
Traditional travel agents are also increasingly coming under fierce competition from the online channel, as airlines develop their own online booking systems, and online travel retailers such as Zuji (www.zuji.com.sg) have enjoyed immense growth due to increased internet penetration and cut-price deals. Previous complacent travel agents who relied on sales through outlets across the country will be forced to focus more investment in their own online sites, in order to maintain their strength in this increasingly competitive market.
Towards the end of the review period, the rise of low cost carriers, which offer online bookings and tickets only available to purchase directly from their site, have also begun to cannibalise ticketing sales through travel agents. With further growth expected in budget airline sales, traditional travel agents will have to compete as effectively on price and package deals to prevent any further decline in share over the next few years.
Table 65 Travel Retail Value Sales: 2000-2005S$ million Value % value growth
2000 3,530.3 -2001 3,991.8 13.12002 3,655.8 -8.42003 2,865.8 -21.62004 3,094.7 8.02005 3,473.5 12.2Source: Singapore Tourism Board, Trade interviews, NATAS, Euromonitor International estimatesTable 66 Travel Retail Outlets by Sector: Units 2000-2005Outlets 2000 2001 2002 2003 2004 2005
Travel retail services by outlet 761.0743.0758.0791.0840.0903.0-Exchange services 143.0141.0150.0166.0170.0173.0-Tour operators 180.9167.5182.7189.7200.0210.0-Travel agents 437.1434.5425.3435.3470.0520.0Source: Singapore Tourism Board, Trade interviews, NATAS, Euromonitor International estimates
9.2 Sales by Product
Accommodation only
Gathered by: Department of Tourism ASEAN Page 93

Travel and Tourism – SINGAPORE MARKET
Accommodation sales by travel retailers was recorded at SG$340 million in 2005, accounting for 10% of total travel retail value sales. The main bulk of sales generated from travel agents and tour operators are still derived from package holidays, with few consumers choosing to purchase accommodation only through agents. Travellers either book accommodation as part of the package deal, or if booking separately, will go directly to the accommodation company. Hotels represent the main type of accommodation booked through travel retail, with independent outlets relying on word of mouth or guidebooks for their sales.
Adventure/trekking holiday
Adventure/trekking holidays are becoming increasingly popular, particularly amongst young Singaporeans, who are demanding unique travel experiences and destinations which are not mainstream. Sales increased by 16% on the previous year to SG$142 million, increasing its share to 4% of total travel retail sales in 2005, up from 2% in 2000. Many more travel agencies and tour operators are offering tour packages to adventurous and exotic destinations such as Africa to meet the increasing demand. Outdoor activities such as game drives, helicopter rides and staying at game reserves or safari lodges are also seeing high growth in demand, attracting not only young consumers, but also small groups of retirees. Although demand for adventure holidays is increasing, pure adventure packages still remain a niche market compared to mainstream package deals. Travellers generally prefer variety and hence prefer to spend two or three days in the wilderness and then move on to a city or other destinations. There is strong potential for high growth in the near future, with sales forecast to be up 50% over the forecast period.
City break
Growth of 9% was registered for city breaks in 2005. More travellers are becoming more independent and opting of flexible travelling arrangements such as purchasing individual components of travel, including accommodation only and flight only, rather than package holidays. This emerging trend occurred partly as a result of the rise of low cost carriers and online travel retailers, which gave travellers an additional option of buying online instead of buying traditional travel packages with direct suppliers. Thus, city break tours that include tours to cultural and art attractions, and shopping become popular.
Cruise
Sales of cruises increased by 5% in value terms in 2005. Sales of cruise packages from travel agents and tour operators are declining as more travellers who booked their tours from retailers are requesting packages, which are more value-for-money, and yet offer outdoor itineraries that involves more sightseeing or adventure. On the other hand, Zuji saw the opportunity to tap into the market for cruises and thus partnered with CruiseAgents (CA) to offer more than 200 fly-cruise packages on 13 cruise lines. Known as the Cruise Guru, the destinations covered include Alaska, the Caribbean and Australia’s Great Barrier Reef from suppliers such as Silversea, Princess and NCL.
Flight only
Gathered by: Department of Tourism ASEAN Page 94

Travel and Tourism – SINGAPORE MARKET
Flight only is the second largest segment for sales and increased by a further 6% in 2005. The increase is attributed to the growth in online booking of flights through intermediaries. Zuji; which is a joint venture between US-based Travelocity.com (the online travel site) and 16 leading Asia-Pacific airlines, (including Cathay Pacific, China Airlines, Eva Air, Garuda Indonesia, Malaysia Airlines, Qantas, Silk Air and Singapore Airlines) accounted 80% of it sales from flight bookings in 2005.
Other transport
Other transport includes other forms of transport sold via tour operators and travel agents. This includes rail, ferry and bus/coach tickets. In Singapore, value sales of other transport continued to represent an insignificant share of total travel retail sales, due to the consumer tendency to purchase such tickets directly from the respective company. Unless travel agents and tour operators begin to offer competitive prices or additional value to the consumer, this subsector is unlikely to register any substantial growth in the future.
Fly-drive
The sales for fly-drive in 2005 registered a growth of 5% in value terms over 2004. This constitutes a small percentage of total travel retail business in Singapore due to the limitations in obtaining licenses for driving in different destinations.
Package holiday
Package holidays remain the main focus of most travel agencies and tour operators as it constituted 52% of overall value sales in 2005. Such package holidays are usually targeted at family travellers, newly-weds and leisure travellers. Although travellers still tend to opt for nearby countries such as Thailand, Hong Kong and China, they no longer visit such countries for sightseeing only. Increasing, they are attracted by more lifestyle holidays such as food and spas.
The increase in fuel surcharges, as well as airport and security taxes have resulted in more people opting for short-haul destinations to cut their overall travel costs. While the surcharges increased this year, airfares were reduced, especially for regional destinations, which went down by 30 to 40 per cent. This year’s NATAS Holiday 2005 Travel Fair saw an increase in bookings for South-east and North Asian trips such as Thailand and Hong Kong, together with a slight decline in bookings to North America and Europe.
Free and Easy
The concept of “free and easy” packages, whereby the holidaymaker can obtain a competitive price by purchasing a flight and accommodation package together without a tour package, has continued to maintain popularity in the Singapore market. It remains an alternative to full package holidays, where flight, accommodation and tours are all included, and travellers are more restricted in their holiday arrangements. The younger generation of Singaporeans often prefer to purchase such “free and easy” package deals so that they can obtain a good offer and not be tied down by fixed arrangements once at their holiday destination. This constitutes a
Gathered by: Department of Tourism ASEAN Page 95

Travel and Tourism – SINGAPORE MARKET
major driver of flight and accommodation sales, which continue to compete heavily against package tours.
Travel insurance
Sales of travel insurance in 2005 increased by 10% in value terms over 2004, following the tragedies such as the Bali bombings in 2005. Many Singaporeans have become more cautious and decided to take out travel insurance when going on overseas trips.
Sales of foreign currency registered growth of 6% in value terms over 2004, in line with the growth in movements overseas. Travellers cheques constituted less than 1% of total sales in 2005, as tourists still prefer using credit cards or cash as mode of payments.
Table 67 Travel Retail Sales by Product: Value 2000-2005S$ million 2000 2001 2002 2003 2004 2005
Travel retail services by product 3,530.33,991.83,655.82,865.83,094.73,473.5-Accommodation only 352.0 399.2 360.6 286.6 310.5 340.4-Adventure/trekking holiday 70.6 99.8 93.4 86.0 122.8 142.4-City break 357.0 399.2 366.6 257.9 309.5 338.9-Cruise 70.6 99.8 107.7 100.3 92.8 97.5-Flight only 420.6 479.0 440.7 343.9 402.3 426.5-Other transport 34.3 39.9 35.6 28.7 30.9 34.4-Fly-drive 71.6 79.8 72.1 71.6 61.9 65.0-Package holiday 1,765.21,995.91,795.31,404.21,547.41,794.9-Travel insurance 140.2 139.7 149.2 117.5 108.3 119.1-Foreign currency 213.8 239.5 216.3 157.6 96.7 102.3-Traveller’s cheques 34.3 20.0 18.3 11.5 11.7 12.2-Others - - - - - -Source: Trade interviews, Euromonitor International estimates
9.3 Sales by Destination
Beach holidays remain the most popular holidays in 2005
Beach holidays remained the top choice of destination for 2005 as it contributed 49% of the total sales in 2005. The main reason is that the flexibility and affordability for such travel plans. Often, beaches visited by travellers are located in neighbouring countries such as Thailand, Indonesia and Malaysia, which usually take a short travelling time to reach. Moreover, such holidays can be done over the weekends and thus gives travellers the flexibility to plan for them. Also, the proximity coupled with the increase in budget flights to such destinations make it more affordable to travel.
Culture holidays as a growing sector
Gathered by: Department of Tourism ASEAN Page 96

Travel and Tourism – SINGAPORE MARKET
Culture holidays formed the second most popular choice of destination. It accounted for 30% of the total sales in 2005. Consumers are becoming more sophisticated and do not only opt for predictable destinations, but wish to travel further and see and experience different cultures. North Asian countries such as Taiwan, Japan and South Korea and Europe are also gaining popularity among travellers as they get to taste a different way of life through sight-seeing, shopping and eating. On the rise are also trips taken by travellers to exotic locations such as Turkey, Egypt and India.
Mountain holidays
Mountain holidays accounted for 6% of the total sales in 2005. Such holidays are usually taken from trips to China and Japan. Such holidays are less popular as compared to beach and culture holidays as they are limited to weather conditions and also the fitness of travellers.
Table 68 Travel Retail Sales by Destination: %Value Breakdown 2000-2005% value 2000 2001 2002 2003 2004 2005
Travel retail sales by destination 100.0 100.0 100.0 100.0 100.0 100.0-Beach 47.2 47.7 48.2 51.3 51.5 49.0-Countryside 3.6 3.5 3.1 2.9 2.5 2.0-Mountain 4.6 4.7 4.4 4.2 6.5 6.0-Culture 28.0 30.0 29.2 26.7 27.5 30.0-Other destinations 16.6 14.1 15.1 14.9 12.0 13.0Source: Trade interviews, Euromonitor International estimatesNote: Others include cruise holidays, sporting events and multi-destination package tours
9.4 Travel Agencies: Exchange Services
There are very few travel agents in Singapore which offer exchange services. The presence of so-called money changers; dedicated exchange service operators, is spread all across the country, and has led to intense competition and low profit margins for the travel agents offering exchange services, therefore, resulting in them giving minimal focus to this service. Besides, the legal requirement of obtaining a licence to offer exchange services has also acted as a deterrent for travel agents. In 2005, travel agents accounted for only 1% of the total sales made from exchange services. Travel agents are also unlikely to focus on exchange service in the coming years.
Table 69 Travel Agencies Offering Exchange Services 2000-2005% sites/outlets 2000 2001 2002 2003 2004 2005
Travel agent outlets with exchange services 0.7 0.7 0.5 0.5 0.5 0.6Others 99.3 99.3 99.5 99.5 99.5 99.4Total 100.0100.0100.0100.0100.0100.0Source: Trade interviews, Euromonitor International estimates
9.5 Exchange Services by Outlet and Type
Gathered by: Department of Tourism ASEAN Page 97

Travel and Tourism – SINGAPORE MARKET
Outlet sales
Exchange services constitute a small percentage of sales of travel agents due to small profit margin. Moreover, this industry is also largely dominated by money changers, which accounted for 95% of the total exchange services market in term of value in 2005. Banks occupied 4% of the total market in terms of number of value for exchange services in 2005.
Product type
Foreign currency accounted for 80% of the total sales in 2005. One of the prime reasons that foreign currency constitutes such a high percentage of the market is because money changers are widely available and accessible in Singapore. The growth of tourist arrivals in 2005 also contributed to the growth of the sales of foreign currency.
Traveller’s cheques accounted for 20% of the total sales in 2005. They were the preferred option among transit visitors as well as a small group of risk averse tourists.
Table 70 Exchange Services: Sales by Outlet 2005% retail value rsp 2005
Banks 4.0Bureaux de change 95.0Travel agents 1.0Others 0.0Total 100.0Source: Trade interviews, Euromonitor International estimatesTable 71 Exchange Services: Sales by Type 2005% retail value rsp 2005
Foreign currency 80.0Traveller’s cheques 20.0Total 100.0Source: Trade interviews, Euromonitor International estimates
9.6 Online Sales
Online developments
The Boom for Internet Travel Retail
Online travel retail is becoming popular especially with the emergence of low cost carriers, which offer their services mainly via the internet. As of 2005, internet sales accounted for 7% of the total sales.
The market for internet travel retail is popular with people who required less complicated components of travel such as flight only, accommodation only or short-haul trips. As Singapore
Gathered by: Department of Tourism ASEAN Page 98

Travel and Tourism – SINGAPORE MARKET
has one of the highest internet penetration rates at 65%, according to the figures from Infocomm Development Authority of Singapore, this makes it an attractive market for online travel retailers.
Low cost carriers usually adopted an online-centric sales model in order to maximize their revenue and minimize their operating costs. This form of sales model, together with the media coverage of their entry, attracted travellers to try online booking. These resulted in the growth of online retailers such as Zuji, Priceline and P2P Travel Exchange.
Traditional retailers jumping the bandwagon on online retail
Competing with online intermediaries
The diverse needs of travellers implied that travel agents must adopt different communication channels to address their needs. Thus, travel agents need to adapt their business models to keep up with the changing trends. One way is through working closely with GDS to expand their sales channels.
Partnering with GDS to increase sales channel
Abacus
Traditional retailers are increasingly harnessing the internet to tap into the market of online customers. Global Distribution Services (GDS) such as Abacus provide a fully integrated one-stop service for all travel booking needs, including airline, hotel, car rental, cruise and insurance. Travel agents are able to make real-time reservations with a wide array of travel suppliers. This year, Abacus launched a sophisticated online solution called Abacus TravelNetwork which provides travel consultants with real time access to high-quality leisure travel content with accurate pricing. On top of that, they also launched Web Connect, a technology that enables travel agents to connect their websites to Abacus’ content and functionalities in order to create their own customized look and feel on a website, which provides online travellers with real-time access to search and make bookings.
Abacus also collaborates with technology partners to offer a range of seamless end-to-end solutions. FlightsXML Private Limited is one such technology solutions provider to that uses Abacus’ toolkit to develop FaresWhiz (XML Edition). FaresWhiz (XML Edition) provides travel agents the added flexibility to develop their own high-volume web booking engine for real-time fares, flight schedules, seat availability, and tax information through Abacus, whilst allowing full integration with the agency’s existing fares and customer databases.
Direct suppliers performance
Transiting to a consultancy role
The growth of online agencies may not necessarily pose a threat to traditional agencies as traditional suppliers seek to upgrade their service content and platforms. The general sentiments
Gathered by: Department of Tourism ASEAN Page 99

Travel and Tourism – SINGAPORE MARKET
of traditional retailers over the popularity of online intermediaries remain positive. Traditional retailers feel that the travel retail line is still considered very service-oriented and thus most customers especially those who are planning longer trips and require more complexities in their arrangements will still prefer to purchase from traditional retailers. One of the strengths that lie with the traditional retailers is the knowledge of the travel agents. This has lead to the shifting roles of travel agents. No longer are they seen as a place to book and buy tickets. Increasingly, customers are coming to them for information, feedback and advice for planning their holidays.
Managing and Retaining customers
Traditional retailers are also focusing on customer retention programmes. For instance, CTC launched a CTC Travel Club card. This card allows their customers to enjoy discounts on last-minute bookings and purchases at the destinations. Other perks include priority invitations to travel seminars and workshops, special previews on new itineraries, discounted rates for travel insurance and birthday treats.
Shifting focus in business/New developments
Travel agencies and tour operators also observed a shifting in business focus; obtaining less business on flight bookings, but increasingly more on-the-ground businesses such as organized tours, cars, restaurants and cruises.
Budget carriers are driving the travel agencies transition to travel consultancies. According to CTC Holidays they receive requests from 200 customers who have a set itinerary and travel schedule in mind but would like recommendations from the agency and conduct the necessary bookings.
Niche Marketing
Other travel agents are also looking into more targeted marketing such as reaching out to medical tourists. This is a growing market, as reported by STB there were more than 320,000 medical tourists in 2004, up from about 220,000 in 2002; a rise of 45%. The government also aims to promote Singapore as a regional healthcare hub through initiatives such as the Singapore Medicine initiative - a multi-agency collaboration comprising International Enterprise Singapore, the Economic Development Board and the Singapore Tourism Board. The aim is to attract one million foreign patients by 2012. Seizing the opportunity of such growing market includes travel agents like Commonwealth Travel, which has since set up a new business division and employed medical executives to assist those who seek medical service in Singapore.
Intermediaries performance
As the price of each component of the package is not revealed in total price, online agencies are thus able to offer better prices. The agencies negotiate special rates for the hotels and airfares and pass the savings on to consumers.
Gathered by: Department of Tourism ASEAN Page 100

Travel and Tourism – SINGAPORE MARKET
Zuji’s Sales Model
Zuji is the first online travel agency that offers a comprehensive range of travel products and services from air to hotel bookings, car rentals, travel packages and land tours in the Asia-Pacific region. It is a joint venture between US-based Travelocity.com (the online travel site) and 16 leading Asia-Pacific airlines, including Cathay Pacific, China Airlines, Eva Air, Garuda Indonesia, Malaysia Airlines, Qantas, Silk Air and Singapore Airlines. In 2005, Zuji registered a 200% growth in sales as compared to the previous year. The success of Zuji lies in its unique sales model and product offerings. Unlike Priceline's which is based on an auction model, Zuji’s customers know in advance what hotel and flights they are buying.
Challenges for online retail
The security issues of online payment remain the main challenge for online retailers. The lack of confidence in disclosing credit cards details on the internet, or the lack of a credit card may deter people from buying over the net. The future of intermediaries will be dependent on their range of content, ease of use and reliability.
Sector trends
Dynamic packaging allows consumers to build their own trips by offering a combination of different components such as flight, hotel and car rental at competitive prices. This form of booking appealed especially to the Free and Independent Travellers (FIT) who tend to be tech-savvy and want flexibility in their travel arrangements. Seizing the opportunity in reaching this target segment is online travel company, Zuji. Zuji has launched lifestyle packages based on seven themes – culture, adventure, spa, gourmet, romance, parties and shopping. These packages, unlike the traditional fixed packaged tours, offer more flexibility and allow the traveller to choose the flight, hotel and car rental separately.
Zuji also launched a new feature called World on Sale (WOS) which allows customers to set a budget for travel and view all the airfare and hotel options available for that price. This new feature also provides a fun platform in which customers can take a gamble by using a virtual dart, which will then reveal a destination in the virtual spinning globe.
Traditional retailers also offer dynamic packaging in order to stay competitive. Free and Easy packages are gaining popularity among consumers and thus become one of the key drivers of travel agencies’ businesses. Travel agencies can thus advise and plan on trips tailored to different requirements and preferred budgets from customers.
Table 72 Travel Retail Internet Sales by Direct Suppliers and Intermediaries: Internet Transaction Value 2000-2005S$ million 2000 2001 2002 2003 2004 2005
Internet 88.3 139.7 182.8 157.6 216.6 256.9- Direct suppliers 49.4 64.2 80.2 72.2 86.6 94.4- Intermediaries 38.9 75.5 102.6 85.4 130.0 162.5
Gathered by: Department of Tourism ASEAN Page 101

Travel and Tourism – SINGAPORE MARKET
Table 72 Travel Retail Internet Sales by Direct Suppliers and Intermediaries: Internet Transaction Value 2000-2005S$ million 2000 2001 2002 2003 2004 2005Others 3,442.0 3,852.1 3,473.0 2,708.2 2,878.1 3,216.6Total 3,530.3 3,991.8 3,655.8 2,865.8 3,094.7 3,473.5Source: Trade interviews, Euromonitor International estimatesTable 73 Travel Retail Internet Sales by Broad Sector: Internet Transaction Value 2000-2005S$ million 2000 2001 2002 2003 2004 2005
Travel retail internet transaction sales 88.3 139.7 182.8 157.6 216.6 256.9-Accommodation only 17.1 26.0 32.3 32.4 41.5 42.6-Flight only 18.9 26.2 42.7 40.9 45.0 49.6-Other transport only 5.0 7.7 13.3 12.2 14.0 16.5-Car rental only 0.1 0.1 0.2 0.2 0.3 0.3-Dynamic packaging - - - - - --Traditional package holiday 47.2 79.7 94.3 71.9 115.8 147.9-Others - - - - - -Source: Trade interviews, Euromonitor International estimates
9.7 Key Performance Indicators
Sales
Travel retail service, which is dominated by travel agents, witnessed growth of 12% in 2005 over the previous year. Positive economic growth, which led to higher spending power, ensured growth of tourist traffic. In addition to this, the growing popularity of holidays to long haul destinations as well as exotic destinations, such as Turkey and Egypt, led to high yield per tourist and hence higher value sales. 2005 also witnessed an increase in specialised holiday packages such as spa holidays and golf holidays.
The major players for the travel retail services, put together, accounted for about 50% of the total market in 2005. Most of the top players registered an increase in their value sales over the previous year. This increase is primarily attributed to several promotions offered by the travel agents. In addition to this, the holiday packages sold at NATAS fair, also helped increase the value sales for most of the operators.
Outlets
The total number of outlets in 2005 for travel retail services grew by 8% over the previous year. The travel agents, who accounted for maximum outlets in 2005, also registered the highest increase of 11% over 2004.
The increase in tourist arrivals as well as departures, which contributed significantly to the travel retail business, led to entry of new players in this sector. However, these new outlets were small in terms of their operations as well as sales. Regarding the existing players, there is a greater
Gathered by: Department of Tourism ASEAN Page 102

Travel and Tourism – SINGAPORE MARKET
focus on expanding customer reach through online services. Hence, none of them added new outlets in 2005.
Web platforms
The intense competition in the travel retail market among the traditional travel agents as well as from the online agents has resulted in many traditional agents beginning to offer their own online services. The leading traditional travel agent remains Chan Brothers Travel Pte Ltd, which launched its portal www.chanbrothersflights.com in 2002. In 2004, it supplemented its online services with the launch of www.chanbrothershotels.com, which is a regional hotel-centric portal. The other travel agents in the travel retail sector are also upgrading their websites and simplifying the booking process. Hence the online services offered by traditional travel agents are likely to grow in the coming years.
Table 74 Key Travel Retail Companies Key Performance Indicators 2005Outlets 2005
Chan Bros Travel Pte Ltd 1SH Tours Pte Ltd 1Sino-America Tours Corp Pte Ltd 1Ananda Travel (S) Pte Ltd 3RMG Tours Pte Ltd 1Holiday Tours & Travel Pte Ltd 1Commonwealth Travel Services Corp Pte Ltd 2Dynasty Travel International Pte Ltd 2Source: Trade interviews, Euromonitor International estimates
9.8 Market Shares
The travel retail sector in 2005 saw little change, remaining moderately fragmented with the top three players, Chan Brothers Travel Pte Ltd, SH Tours Pte Ltd and Sino-America Tours Corp Pte Ltd continuing to account for 28% of total value sales. The only main challenge in the market was the 2002 entrance and marked growth of online travel agent, Zuji.com, which grabbed a strong market share in the latter stages of the review period, due to its successful cut-down pricing and attractive deals. Zuji took a share of 3% in 2005, and through further price reductions and strong customer service, is expected to make further inroads against traditional agents and tour operators over the next few years.
Market leader, Chan Brothers, dropped its share by less than one percentage point to 13% in 2005, having felt the growing strain of Zuji’s success that year. Nevertheless, consumer awareness of its name helped it sustain its top position, and it maintained value sales through its wide range of products and services including package and free & easy tours, air tickets, cruises, accommodation, car rental, travel insurance and travel gift vouchers. Specially designed shopping holidays and packaged tours to exotic destinations were amongst those special promotions which particularly attracted consumer demand throughout 2005.
Gathered by: Department of Tourism ASEAN Page 103

Travel and Tourism – SINGAPORE MARKET
To step up its competitiveness more effectively against the likes of Zuji and other online companies, Chan Brothers directed more investment in developing its own online services. In 2005, the company signed an agreement with US-based technology services provider Pegasus Solutions. Through the agreement with Pegasus, Chan Brothers can provide customers with real-time access to hotel information, rates and inventory, and boost its online trading business with other third-party travel distributors and wholesalers
The second leading travel agent in 2005 was SH Tours Pte Ltd. The range of services offered included ground transfers between the airport and hotels, sightseeing tours in Singapore, Malaysia and Indonesia, as well as harbour cruises and hotel reservations. SH Tours sales increased to S$264 million in 2005. Since SH Tours is primarily focussed on inbound travel, the increase in tourist arrivals helped increase sales for 2005.
The third leading player in the travel retail market in 2005 was Sino-America Tours Corp Pte Ltd. SA Tours registered sales worth S$254 million in the same year. The operator focussed on Asian destinations and expanded its reach to new markets such as India, Myanmar and Vietnam in 2005.
Table 75 Travel Retail Market Shares 2001-2005% retail value rsp 2001 2002 2003 2004 2005
Chan Bros Travel Pte Ltd 10.1 10.8 12.0 13.0 12.7SH Tours Pte Ltd 6.0 6.3 7.0 7.7 7.6Sino-America Tours Corp Pte Ltd 5.5 5.9 6.5 7.4 7.3Ananda Travel (S) Pte Ltd 4.9 5.0 5.1 5.5 5.2RMG Tours Pte Ltd 3.9 4.1 4.5 4.9 5.0Holiday Tours & Travel Pte Ltd 3.1 3.3 3.6 3.9 4.0Dynasty Travel International Pte Ltd 2.2 2.5 3.0 3.5 3.6Commonwealth Travel Services Corp Pte Ltd 2.2 2.5 3.1 3.6 2.7
Abacus International - - 1.0 2.0 2.6Others 62.1 59.6 54.2 48.5 49.3Total 100.0100.0100.0100.0100.0Source: Trade interviews, Euromonitor International estimates
9.9 Forecast Sales and Outlets
Sales
The travel retail industry is likely to experience a CAGR of 6% in constant value terms during the forecast period. The forecasted growth in travel retail will be primarily driven by economic growth, which in turn will drive up demand for travel over the next few years. Growth in internet usage and the strong appeal for competitive prices offered by online intermediaries will also help encourage consumers to increasingly opt to purchase holidays over the forecast period.
Outlets
Gathered by: Department of Tourism ASEAN Page 104

Travel and Tourism – SINGAPORE MARKET
Outlets for the travel retail industry are forecast to grow by 27% during the forecast period. Marginal growth is expected for the number of outlets for exchange services as this saturated market also has stringent guidelines set out by the Monetary Authority of Singapore for operators of exchange services. Outbound travel is projected to see a CAGR of 10% and tourist arrivals are estimated to see a CAGR of 6% during the forecast period. As such, this will attract new players into the market to provide retail services for outbound and inbound tours. Higher growth is expected for the number of travel agents as compared to tour operators during the forecast period as tour operators are generally still taking the role of a distributor of retail services as they are in a better position to negotiate rates with suppliers and are also more experienced in logistic management for tours.
Online trends
Online trends are expected to continue developing strongly over the forecast period, with existing players continuing to gain ground and taking share from traditional travel retailers in the overall market. Euromonitor International predicts that Zuji, currently the leading online player in Asia, will grow by a further 30-40%, whilst low cost carriers such as Tiger Airways and AirAsia will continue to enjoy buoyant growth by attracting consumers with bargain deals and new destinations. New entrants to the online business will spur growth even further, not only supporting further increase in share of online sales against traditional players, but also presenting competition to Zuji in the future. Amongst traditional travel agents and tour operators, online bookings will become an essential service needed to maintain their market share, as internet penetration continues to grow and the only way to retain competitiveness will be to invest in web-marketing and web-based activities.
Dynamic packaging online will also be a hot trend in future years. From 2006 onwards, Zuji’s dynamic packaging concept, whereby travellers are able to choose the airline, hotel and car rental separately, is expected to be well received amongst the main consumer base of young and independent travellers. This unique concept will also give Zuji yet another edge over its traditional travel agent competitors, thereby putting it in good stead for significant growth in future years.
Table 76 Forecast Travel Retail Sales: 2005-2010S$ million constant 2005 rspValue % value growth
2005 3,473.5-2006 3,716.67.02007 3,958.26.52008 4,195.76.02009 4,426.55.52010 4,647.85.0Source: Euromonitor International estimatesTable 77 Forecast Travel Retail Outlets by Sector: Units 2005-2010Outlets 2005 2006 2007 2008 2009 2010
Travel retail services by outlet 903.0945.6991.91,041.21,093.01,149.8
Gathered by: Department of Tourism ASEAN Page 105

Travel and Tourism – SINGAPORE MARKET
Table 77 Forecast Travel Retail Outlets by Sector: Units 2005-2010Outlets 2005 2006 2007 2008 2009 2010-Exchange services 173.0177.0181.0184.0 185.0 186.0-Tour operators 210.0222.6234.8246.6 257.7 268.0-Travel agents 520.0546.0576.0610.6 650.3 695.8Source: Euromonitor International estimatesTable 78 Forecast Travel Retail Internet Sales by Direct Suppliers and Intermediaries: Internet Transaction Value 2000-2005S$ million 2005 2006 2007 2008 2009 2010
Internet 256.9 285.2 315.1 346.6 379.6 413.7- Direct suppliers 94.4 101.1 107.6 114.1 120.4 126.4- Intermediaries 162.5 184.1 207.5 232.6 259.2 287.4Others 3,216.6 3,431.5 3,643.1 3,849.1 4,046.9 4,234.1Total 3,473.5 3,716.6 3,958.2 4,195.7 4,426.5 4,647.8Source: Euromonitor International estimatesTable 79 Forecast Travel Retail Internet Sales by Broad Sector: Internet Transaction Value 2005-2010S$ million 2005 2006 2007 2008 2009 2010
Travel retail internet transaction sales 256.9 285.2 315.1 346.6 377.5 413.7-Accommodation only 42.6 45.7 49.4 53.9 59.2 65.5-Flight only 49.6 55.0 61.2 68.2 76.1 85.0-Other transport only 16.5 19.6 23.5 28.5 34.7 42.4-Car rental only 0.3 0.4 0.5 0.5 0.6 0.7-Dynamic packaging - 7.0 14.7 24.0 35.0 48.0-Traditional package holiday 147.9 157.5 165.8 171.6 171.9 172.2-Others - - - - - -Source: Euromonitor International estimates
o ...previous o next...
Travel and Tourism - Singapore
4 Sep 2006
11. DEFINITIONS
11.1 Tourism Parameters
Travel and tourism is an industry encompassing markets as diverse as transportation (airlines, rail and ferry companies), travel retail, travel accommodation, tourist attractions and car rental as well as standard tourism parameters.
Arrivals
Gathered by: Department of Tourism ASEAN Page 106

Travel and Tourism – SINGAPORE MARKET
Refers to international tourists, i.e. any person visiting another country for at least 24 hours, for a period not exceeding 12 months, and staying in collective or private accommodation. Each trip is counted separately and thus includes people travelling more than once a year and people visiting several countries during one holiday. Unless otherwise stated arrival figures exclude same-day visitors and transit and cruise passengers as this can distort arrival figures in important cruise destinations. It also excludes those in paid employment abroad. The country of origin of the inbound arrival is referred to as the source country.
Arrivals are measured in '000 people.
Please note: international arrivals (given in terms of number of people) is not the same as international trips because during the course of one trip abroad, there may be numerous visits to different countries which would then be recorded separately in the international arrivals figures of each country visited. Therefore, one international trip does not equal to one international arrival.
Departures
Refers to the number of trips undertaken by national residents to another country (destination country) for any other reason than to carry out an activity remunerated in the country of destination.
Data includes foreigners residing permanently in the country of departure.
Departures are measured in '000 people.
Incoming tourist receipts
These are classified as payments by international inbound tourists, including fares paid to national carriers for international transport and any other prepayments made for goods or services received in the country of destination. This should also include receipts from day visitors from abroad, although there are exceptional cases that are recorded separately.
Outgoing tourism expenditure
This is expenditure by outbound tourists abroad, including their payments to foreign carriers for international transport. Again, this should also include expenditure on day visits abroad, except in certain cases when these are recorded separately. Data thus excludes international transport fares purchased within the country of origin.
Domestic tourists
This varies from country to country and can refer either to actual tourists (measured in terms of people) spending one night or more away from home within their normal country of residence, or to the number of stays by residents within their normal country or residence. Most national statistics on domestic tourism expenditure exclude that on travel to and from the destination.
Gathered by: Department of Tourism ASEAN Page 107

Travel and Tourism – SINGAPORE MARKET
Domestic trips
The number of trips taken by residents of the country within the country. The definition of the length of a trip varies from country to country.
Trips are measured in terms of '000 trips.
Domestic tourist expenditure
The spending on travel and tourism services by domestic visitors on their trips.
Tourism spending
This analyses tourism spending by foreign and domestic tourists on the following sectors:
Accommodation: includes all forms of travel accommodation namely campsites, hotels, motels, self-catering, chalets, guesthouses, hostels, private accommodation and other.Entertainment: includes evening entertainment and tourist attractions such as casinos.Travel within the country: includes spending on all local transport such as rail, bus/coach, ferry, air, chauffeur driven car, cruise etc.Excursions: within the country; may be for one day or over.Food: spending on retail food as well as foodservice; includes full-service restaurants and other foodservice formats such as cafés/bars, fast food, 100% home delivery/takeaway, street stalls/kiosks and self-service cafeterias.Shopping: includes food and non-food purchases. May also include duty-free purchases.Other: please specify
Outbound tourism spending by sector is reviewed separately.
Method of payment
Cash: money in note or coin form which is used to pay for goods and services at the time of purchase.
Credit card: a card that allows a retail or business consumer to make small purchases using a card and account where there is a predetermined borrowing arrangement up to a fixed monthly level.
Debit card: a card that allows a retail or business consumer to make small purchases using a card that debits from a bank account.
Gathered by: Department of Tourism ASEAN Page 108

Travel and Tourism – SINGAPORE MARKET
Prepaid debit card: a card offered by a service provider that uses a prepaid e-cash card as a payment vehicle.
Traveller's cheques: these are cheques issued by banks, credit card and charge card companies that allow the holder to buy goods and services in a foreign country.
11.2 Travel Accommodation
The travel accommodation market covers the main types of accommodation used by incoming tourists and domestic tourists. The market is broken down into nine principal sectors.
Travel accommodation value is measured in terms of the price paid for accommodation by the consumer; may include foodservice (food and drinks).
Travel accommodation volume is measured in terms of number of outlets and specifically for hotels, in number of rooms, number of beds and bed nights.
Campsites
Covers areas set aside for camping and caravans.
Chalets
Rented accommodation in mountain or country areas; may include meals; includes lodges and inns.
Guesthouses
Rooms within officially-recognised private accommodation, for the purpose of tourism; rented to tourists on a nightly or weekly basis; often with breakfast included.
Hostels
Outlets providing low cost/budget accommodation, often in dormitories; includes youth hostels.
Hotels
Hotel outlets providing lodging and optional meals, includes independent and chained operators as well as all company owned, leased, managed and franchised outlets.
Motels
Roadside hotel accommodation for motorists.
Private accommodation
Gathered by: Department of Tourism ASEAN Page 109

Travel and Tourism – SINGAPORE MARKET
Privately owned houses or individual rooms rented to tourists on an unofficial basis and not always authorised by tourist authorities.
Self-catering apartments
Providing lodging in allocated tourist apartments, not providing meals.
Other
Smaller types of accommodation, such as holiday camps, not listed above but included in country statistics.
Specific data indicators for the travel accommodation market are as follows:
Hotel chains
Hotel operators that run a number of outlets, usually with a degree of specialisation in service or product positioning. The number of branches required to be termed a chain varies from country to country but is usually 10 or more. The chain usually trades with the same fascia, format and identity.
If a hotel forms part of a regional or international chain network and has less than ten outlets in a particular country, it is still counted as a chain.
Hotel independents
Hotel operators that own and operate one or more (but fewer than 10) outlets, but not affiliated to any other business. Mainly relates to family businesses or partnerships.
Number of bed nights
Refers to the total number of beds in travel accommodation occupied over the year.
Occupancy rates
This expresses the relationship between available capacity and the extent to which it is used. It may refer to either the use of rooms or of beds. Occupancy rates are based on the number of nights of both domestic and international tourists. Occupancy rates is at the year end.
RevPAR
This signifies revenue per available room in the travel accommodation market. It is calculated by occupancy multiplied by the average daily room rate per company. RevPAR is based on rooms available for use by domestic and international visitors. Euromonitor International measures system-wide revPAR i.e. for company-owned, company operated, licensed and franchised outlets. RevPAR is at the year end.
Gathered by: Department of Tourism ASEAN Page 110

Travel and Tourism – SINGAPORE MARKET
Number of rooms and beds
The number of rooms and beds per hotel are counted as what is available for use by consumers.
Tourist locations
A client has specified that they would like to know the number of mid to premium hotels in tourist locations, i.e. in tourist resorts such as sea, mountain, lakes & country as well as art & break cities. This therefore excludes all non-tourist locations such as hotels at airports, service stations and non city/art or tourist resort locations.
11.3 Transportation
The transportation market covers the mode of transport used by tourists going to their holiday destination and within the country. It covers sales for outgoing travel by country residents and internal travel by foreign and domestic tourists. Car rental market is analysed separately.
Transportation value is measured in terms of the price paid (fare) for the mode of transport by the consumer. Air is also measured in terms of the number of available seats and seats sold.
The transportation market assesses seven main modes of transport:
Air
Includes schedule, charter and budget airlines; national flag carriers as well as low cost carriers.
Bus/coach
Encompasses overland travel by bus or coach.
Chauffeur-driven car
Passengers driven to their destination by a hired third party. Excludes taxis.
Cruise
Travel by cruise ship.
Ferry
Travel by ferry.
Rail
Travel by passenger train, excluding freight and car transport.
Gathered by: Department of Tourism ASEAN Page 111
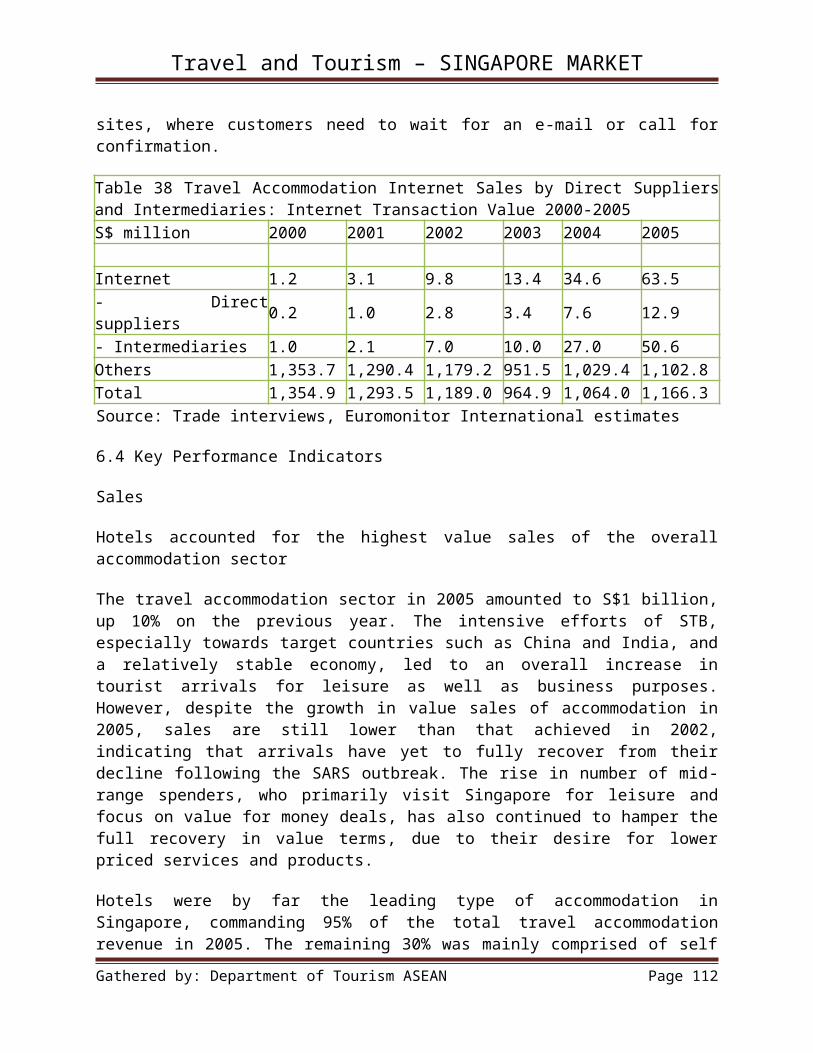
Travel and Tourism – SINGAPORE MARKET
Specific data indicators for the travel accommodation market are as follows:
Airline capacity
Capacity is based on the number of seats available for sale based on the number of potential enplanements.
Airline utilisation
Euromonitor International considers airline capacity and utilization in terms of enplanement over origin-destination, whereby the number of enplanements are based on flights, as defined by the airlines and assigned flight numbers. For example, a passenger whose flight stops mid-route to pick up more passengers but continues with the same aircraft/flight number would be counted as one enplanement. A passenger who switches flights to another airline or aircraft with a new flight number mid-journey would be considered as two enplanements.
11.4 Car Rental
The car rental market covers the hire of passenger vehicles including small vans by both business and leisure users, and whether from the airport or downtown locations, in the context of the total short-term rental fleet. This excludes businesses that hire cars for long term leasing. Car rental covers sales to incoming tourists and domestic users including domestic tourists and general nationals. Car rental also excludes commercial vehicles, trucks and motorbikes.
Car rental value covers the price of car hire to the consumer. Volume of car rental is provided by the number of car hire transactions, fleet size and number of car rental operators.
Sectors
Business: for the purpose of a business trip either arranged on behalf of the customer by work or arranged personally.
Leisure: for personal trip or holiday, visiting friends/family, or any other non-work related activity such as moving house.
Insurance replacement: where domestic residents use a rental car paid for by an insurance company as a replacement vehicle, while their own car is repaired following an accident.
Location
Airport: is defined by car rental POS/counters/offices based at an airport either within the terminal or next to the airport. This includes POS located in close proximity to the airport, i.e. everything that is not counted as downtown.
Gathered by: Department of Tourism ASEAN Page 112

Travel and Tourism – SINGAPORE MARKET
Non-airport: is what the car rental companies refer to as downtown locations so these include high street/retail parks i.e. everything except POS located in or by airports. Internet sales would therefore fall into this category by default.
Transactions
Car rental transactions i.e. rental volume measures the exchange between a rental firm and consumer/business of a rental vehicle for 1-3 days, 4-7 days, 7+ days for the sectors reviewed: business, leisure, insurance replacement, excluding all trucks and commercial vehicles.
Transactions can be booked in advance or on the day of usage; booked direct with the car rental firm or through an intermediary on- or off-line.
Transactions exclude the sale of old cars to consumers.
Fleet size
Fleet size refers to the number of cars at the car rental company's disposal including all operational cars at the annual year end for rentals in the business, leisure and replacement market for passenger vehicles.
This does not reflect any fluctuations in size through down/upsizing the fleet throughout the course of the year.
11.5 Travel Retail
The travel retail market covers companies that put package holidays together for the general public, companies that sell them to the public and those that supply foreign currency. The market for travel retail covers sales to outgoing and domestic tourists and internal use by incoming tourists.
Travel retail value is measured by the price paid by the consumer (leisure and business) for travel retail services online and offline. Seeing as the price is what the consumer pays for a holiday, this includes fare or flight supplements, airport tax, booking fees and commissions paid by the consumer direct to the travel retailer as part of the purchase.
Travel retail volume is given in the number of travel retail outlets including the sectors of travel agents, tour operators and exchange services.
Travel agents
Retail outlets that sell holidays and holiday services. Travel agents sales are based on sales i.e. gross revenue and equal the total transaction value sold to the consumer (i.e. including the price of the product and commission), not on pure agent income, which includes only commissions (i.e. gross margins on gross revenue).
Gathered by: Department of Tourism ASEAN Page 113

Travel and Tourism – SINGAPORE MARKET
Tour operators
Companies that organise holiday packages and sell them either directly to the public, or through travel agencies. Tour operators' sales include direct sales to the consumer. Sales of tour operators' products which are sold through travel agents direct to the consumer are instead included under travel agents.
Exchange services
This term refers to dedicated currency exchange outlets only. It therefore excludes banks and travel agencies.
Due to the difficulty of establishing sales by sector as a result of the overlap of business between the sectors above, value by sector will not be given and will be provided at total market level only.
As mentioned, travel retail total is not the sum of the sectors of travel agents, tour operators and exchange services, rather it reflects the overall sales to the consumer i.e. direct sales to the consumer via travel agents, direct sales to the consumer by tour operators whether online or offline, exchange services excluding tour operator to travel agent dealings.
Travel retail product breakdowns
Accommodation only: sales of accommodation services through tour operators and travel agents including hotels, motels, self-catering, guesthouses and all other forms.
Adventure/trekking holiday: sales of adventure/trekking holidays via tour operators and travel agents.
City break: sales of city breaks through tour operators and travel agents.
Cruise: sales of cruises through tour operators and travel agents.
Flight only: sales of airline tickets only (on their own rather than as part of a package deal or city break) via tour operators and travel agents.
Other transport: other forms of transport excluding airline tickets sold via tour operators and travel agents such as rail, ferry, bus/coach. Car rental is included under "others".
Fly-drive: includes the sales of holiday packages which include the return flights and car rental once arriving in the destination country through tour operators and travel agents.
Package holiday: includes traditional package holidays which are fixed by tour operators and travel agents and include transportation, accommodation along with a choice of food options ranging from B&B, mid to full board. Also includes dynamic package holidays which are sold
Gathered by: Department of Tourism ASEAN Page 114

Travel and Tourism – SINGAPORE MARKET
online by companies such as Expedia which allow the consumer to combine travel components such as transportation and accommodation.
Travel insurance: sales of travel insurance sold via exchange services which may be located within travel agents.
Foreign currency: foreign currency purchases sold via exchange services, which may be located within travel agents.
Traveller's cheques: traveller's cheques sold via exchange services, which may be located within travel agents.
Others: others include tourist attraction entrance fees, car rental hire and such products/services.
By destination
Travel retail sales by destination includes all product sectors of travel retail, excluding the sectors that apply to financial services conducted by exchange providers i.e. excludes travel insurance, foreign currency and traveller's cheques.
Beach: holidays to beach and coastal areas/resorts.
Countryside: holidays to all countryside locations, except mountainous terrain.
Mountain: holidays to mountain areas, particularly mountain ranges.
Culture: includes city breaks and art trips.
Others: such as jungle, rainforest and other locations not covered in the above.
Online booking sites are included under the market value sales for travel retail, however, are not included in the number of outlets, as these do not apply.
Online travel retail refers to the sales of travel retail services over the Internet. It includes the sales of all travel products/services of travel accommodation, hotels, transportation, airlines, car rental, tourist attractions, package holidays and tours, etc via online booking sites as well as travel retailer websites.
There will therefore be double-counting with the intermediaries' sales of travel accommodation, hotels, transportation, air and car rental as these are reviewed in their respective market or sector sections.
11.6 Tourist Attractions
The tourist attractions market covers the sites visited by tourists, covering sales to incoming and domestic tourists.
Gathered by: Department of Tourism ASEAN Page 115

Travel and Tourism – SINGAPORE MARKET
Value sales should as far as possible include all entrance fees, but exclude business to business activities such as hospitality and conferences. Where possible, expenditure on food and drinks is excluded, unless specified. Tourist attractions volumes are measured by the number of visitors.
The market consists of the following sectors:
Art galleries
Includes all forms of art galleries including modern, traditional, national, private and avant-garde as well as contemporary: indoor and outdoor.
Casinos
Includes consumer spending at casinos, not casino revenues.
Circuses
Includes all forms of travelling and permanent circuses.
Historic buildings/sites
Includes palaces, monuments, castles, historic birthplaces, landmarks, temples, religious sites etc.
Industrial tourism
Includes visits to past and present factories and company sites, as well as visits to company headquarters, such as power stations, mines, forestry, factories, businesses etc. Spin-off activities from industrial tourism do not apply egg activity or restoration programmes.
Museums
Includes all national and privately-owned museums.
National parks/areas of natural beauty
National parks as defined by the government; areas of interest include gardens and areas of natural beauty that have not been allocated the title of national parks.
Theatres
Theatres excludes cinemas.
Theme/amusement parks
Gathered by: Department of Tourism ASEAN Page 116

Travel and Tourism – SINGAPORE MARKET
All permanent theme and amusement parks generally found in out-of-town locations. Excludes travelling fairs.
Zoos/aquariums
Includes all national and privately owned zoos and aquariums. Waterparks are included under theme/amusement parks.
Others
Others includes other types such as themed tourist attractions such as wax work museums, Ferris wheels such as the London Eye which do not fit in the above sectors.
11.7 Internet Sales
Direct suppliers
Direct suppliers refer to companies providing a service or product direct to the consumer without the aid of an online travel agent of intermediary.
Travel accommodation direct suppliers (including hotels) includes hotel operators such as Hilton or InterContinental which offer an online payment system for the reservation and booking of hotel rooms over the Internet.
Transportation direct suppliers (including airlines, rail companies, ferry companies etc) encompasses companies such as low cast carriers, scheduled airlines and national carriers along with other transport operators which provide a payment system for consumers to book direct e.g. British Airways online payment provision, Ryanair etc.
Car rental direct suppliers are the car rental companies themselves that provide an online booking (involving payment) website e.g. Avis, Hertz, Europcar.
Travel retailers direct suppliers refers to traditional travel retailers (including travel agents, tour operators along with exchange service providers where applicable) that sell their services direct to consumers via the internet e.g. Thomas Cook and TUI web platforms.
Tourist attractions direct suppliers are attractions that offer a web platform for the purchase of tickets.
Intermediaries
Online intermediaries sell products and services indirectly on behalf of a third party such as a hotel, airline, tour operator, travel agent or car rental company to the consumer via the Internet. Typically, intermediaries are online travel agents, for example, Expedia and Last minute, which have developed the format of dynamic packaging, allowing consumers to customise their
Gathered by: Department of Tourism ASEAN Page 117

Travel and Tourism – SINGAPORE MARKET
holidays. Typically, online intermediaries have not developed from bricks and mortar companies, instead they have developed from Internet start-ups.
11.8 Internet Sales: Dynamic Packaging
This concept was pioneered by Expedia and was originally the domain of online travel agents but now traditional travel retailers (direct suppliers) have launched their own versions of dynamic packaging. Essentially dynamic packaging allows consumers to build their own trips by offering a combination of different travel components such as flight/hotel/car rental etc at different price levels. Therefore it is dynamic and customised, rather than fixed or pre-arranged traditional holiday package.
11.9 Internet Sales: Traditional Package Holiday
Traditional package holidays are a fixed package, usually all-inclusive, combining transportation and accommodation components in a resort or location either pre-selected by the consumer or allocated upon arrival. Traditionally offered by tour operators and travel agents, these are also offered on the Internet by travel retail direct suppliers, although package holidays differ from dynamic packages in that the consumer has no flexibility or customisation in the choice of travel (flight, accommodation) components.
11.10 GDS
GDS (global distribution systems) companies are exemplified by Amadeus, Galileo, Sabre and Worldspan. GDS provide travel reservation systems and technology to the travel trade allowing travel agents and airlines to book airline seats and access to hotels, car rental, cruise and transportation companies etc to make reservations.
11.11 Sustainable Tourism
Sustainable tourism aims to maintain the integrity of local culture and heritage combined with conserving local resources for the benefit of the community in the long run without causing damage to the social fabric and local environment.
Gathered by: Department of Tourism ASEAN Page 118