
TRAVEL AND TOURISM - ICRA Lanka Limited
51
Prepared by And IMaCS Research & Analytics TRAVEL AND TOURISM September 2011 Industry Report on Sri Lanka
Transcript of TRAVEL AND TOURISM - ICRA Lanka Limited

i
Prepared by
And
IMaC
S R
ese
arc
h &
An
aly
tics
TRAVEL AND TOURISM
September 2011
Ind
ustry
Rep
ort o
n S
ri Lan
ka

ii
Contacts:
W Don Barnabas,
Managing Director/CEO
ICRA Lanka Limited,
#10-02, East Tower,
World Trade Center,
Colombo 01,
Sri Lanka
Telephone: +94 11 4339907
Mobile: + 94 773417517
Fax: +94 11 2333307
Email: [email protected]
www.icralanka.com
V Sriram
Chief General Manager
ICRA Management Consulting Services Limited
India
Telephone: +91 44 4596 4329
Mobile: +91 98400 88273
Email: [email protected]
www.imacs.in
Disclaimer This report is a joint initiative of ICRA Lanka and IMaCS. All information contained in this
document has been obtained from sources believed by them to be accurate and reliable.
Although reasonable care has been taken to ensure that the information herein is true, such
information is provided ‘as is’ without any warranty of any kind, and neither ICRA Lanka nor
IMaCS in particular, makes any representation or warranty, express or implied, as to the
accuracy, timeliness or completeness of any such information. All information contained herein
must be construed solely as statements of opinion, and neither ICRA Lanka nor IMaCS or any
other Group ICRA Company shall be liable for any losses incurred by users from any use of this
document or its contents in any manner. Opinions expressed in this document are not the
opinions of our holding company, ICRA, or ICRA Lanka Limited (ICRA Lanka) and should not be
construed as any indication of credit rating or grading of ICRA or ICRA Lanka for any instruments
that have been issued or are to be issued by any entity.

iii
TABLE OF CONTENTS
EXECUTIVE SUMMARY ............................................................................................................... 1
SRI LANKA TRAVEL AND TOURISM—SWOT ANALYSIS.................................................................. 3 GLOBAL SCENARIO ............................................................................................................................ 4 TOURIST ARRIVALS ................................................................................................................................ 4 RECENT TRENDS AND SHORT-TERM OUTLOOK ........................................................................................... 7 MAJOR TOURIST DESTINATIONS .............................................................................................................. 7 WORLD TOURIST RECEIPTS ..................................................................................................................... 9
SRI LANKAN TOURISM INDUSTRY ............................................................................................. 10 OVERVIEW OF TOURIST INFLOWS ........................................................................................................... 13 SEASONALITY ...................................................................................................................................... 15 CONTRIBUTION TO GDP ....................................................................................................................... 16 TOURISM – IMPORTANT SOURCE OF FOREIGN EXCHANGE .......................................................................... 17 EMPLOYMENT IN TOURISM INDUSTRY..................................................................................................... 18 INBOUND TOURISM MARKET ................................................................................................................ 20 TOURIST PROFILE ................................................................................................................................ 23 DURATION OF STAY ............................................................................................................................. 24 TRAVEL AND TOURISM ACCOMMODATION .............................................................................................. 25 KEY MARKET TRENDS .......................................................................................................................... 32 MAJOR PROJECTS PLANNED .................................................................................................................. 33 PLANNED TARGETS .............................................................................................................................. 35 MAHINDA CHINTANA ........................................................................................................................... 35
TRANSPORT INFRASTRUCTURE ................................................................................................. 36 CIVIL AVIATION ................................................................................................................................... 36 RAIL TRANSPORTATION ........................................................................................................................ 39 ROAD TRANSPORTATION ...................................................................................................................... 39
GOVERNMENT AGENCIES ......................................................................................................... 42
ECONOMIC OUTLOOK .............................................................................................................. 42
TRAVEL AND TOURISM OUTLOOK ............................................................................................. 45

iv
TABLE OF EXHIBITS
Exhibit 1: Growth in World GDP and Tourist Arrivals ........................................................................... 5 Exhibit 2: World - International Tourist Arrivals and Growth .............................................................. 5 Exhibit 3: Regional Tourist Flows .......................................................................................................... 6 Exhibit 4: Major Tourist Destinations ................................................................................................... 8 Exhibit 5: Tourist Destinations in Asia and the Pacific ......................................................................... 9 Exhibit 6: World Tourist Receipts ....................................................................................................... 10 Exhibit 7: Sri Lanka - Growth in International Tourist Arrivals ........................................................... 13 Exhibit 8: Sri Lanka - International Tourist Arrivals and Growth ........................................................ 14 Exhibit 10: Share of Tourist Arrivals by Month................................................................................... 15 Exhibit 9: Monthly International Tourist Arrivals into Sri Lanka ........................................................ 15 Exhibit 11: Travel and Tourism Revenues and Contribution to GDP .................................................. 16 Exhibit 12: GDP from Hotels and Restaurants .................................................................................... 16 Exhibit 13: International Tourism Receipts ........................................................................................ 17 Exhibit 14: Domestic Travel and Tourism Spending ........................................................................... 17 Exhibit 15: Sri Lanka - Growth in Real GDP and Domestic Travel and Tourism Spending .................. 18 Exhibit 17: Direct Employment in Sri Lanka’s Tourism Industry ........................................................ 19 Exhibit 16: Sri Lanka - Employment in Tourism Industry .................................................................... 19 Exhibit 18: Share of Direct and Indirect Employment in Travel and Tourism Industry ..................... 20 Exhibit 19: Tourist Arrivals by Region and Major Countries ............................................................... 21 Exhibit 20: Tourist Arrivals by Region and Major Countries - 1st Half ............................................... 22 Exhibit 21: Purpose of Visit (per cent) ................................................................................................ 23 Exhibit 22: Number of Visitors from India for Various Purposes ....................................................... 23 Exhibit 23: Period of Stay (Percentage Distribution) .......................................................................... 24 Exhibit 24: Duration of Stay, Tourist Nights by Major Countries and Regions ................................... 25 Exhibit 25: Accommodation Availability ............................................................................................. 26 Exhibit 26: Trends in Occupancy ........................................................................................................ 26 Exhibit 27: Trends in Guest Nights in Hotels and Supplementary Accommodations ........................ 27 Exhibit 28: Annual Occupancy Rate in Sri Lanka’s Hotels ................................................................... 27 Exhibit 29: Regional Accommodation Capacity .................................................................................. 28 Exhibit 30: Occupancy Rates .............................................................................................................. 28 Exhibit 31: Trends in Guest Nights by Tourist Destinations ............................................................... 29 Exhibit 32: Share of Various Accommodation Categories .................................................................. 30 Exhibit 33: Share of Domestic Travellers in Total Guest Nights of Hotels .......................................... 31 Exhibit 34: Distribution of Domestic and Foreign Travellers in Total Guest Nights .......................... 31 Exhibit 35: Trends in Guest Nights by Hotel Type .............................................................................. 32 Exhibit 36: Percentage Distribution of International Tourist Arrivals ................................................ 37 Exhibit 37: International Tourist Arrivals by Airlines .......................................................................... 38 Exhibit 38: Sri Lanka Airlines - Inbound Passengers Carried from Various Regions .......................... 38 Exhibit 39: Key Surface Transport Statistics of Sri Lanka.................................................................... 40 Exhibit 40: Road Network in Sri Lanka................................................................................................ 40 Exhibit 41: Road Network by Province in Sri Lanka in 2010 ............................................................... 41 Exhibit 42: Summary Economic Data on Sri Lanka’s Economy ........................................................... 43 Exhibit 43: Estimates for Sri Lanka ..................................................................................................... 44 Exhibit 44: World Bank `Doing Business 2011’ Country Table for Sri Lanka ...................................... 45

Travel and Tourism Industry in Sri Lanka 1
EXECUTIVE SUMMARY With over 1,600 km of coastline, Sri Lanka is well known for its tropical beach resorts and related
sports such as water sports, deep-sea fishing, underwater photography, scuba diving at
shipwrecks and coral reefs, and whale watching. Other major tourist attractions include ancient
heritage sites and forest resorts in Wild Life Sanctuaries.
There has been a significant improvement in Sri Lanka’s tourism with the return of peace to the
island nation, following the May 2009 declaration of conclusive victory over insurgent forces.
Since the 1980s, Sri Lanka’s tourism was adversely affected because of the ethnic conflict. Tourist
arrivals shrunk from 407,230 in 19821 to 302,000 in 1996. Since then, the tourism industry picked
up with tourist arrivals increasing to 566,200 in 2004, following the ceasefire between the Sri
Lankan military and the rebel Tamil forces in 2002, but there was a substantial decline in the later
years. In 2005, there was an adverse effect because of decline in global tourists after the Asian
tsunami of December 2004 combined with the break-down of the cease fire agreement reached
in 2002. By 2008, tourist arrivals were down to about 438,000. There was a consequent decline in
employment as well in this sector, from 60,516 in 2007 to 51,306 in 2008.
Over the course of 2010, countries in Europe and North America relaxed their advisories against
travel to Sri Lanka. In 2010, international tourist arrivals to Sri Lanka increased by a significant 46
percent over 2009 to 654,477 and hotel occupancy rates increased from 48.4 percent in 2009 to a
record 70.1 percent. Domestic travel and tourism spending by Sri Lankan citizens increased 6.5
percent, in real terms, contributing to LKR 134.6 billion, compared with a decline of 5.3 percent in
2009. These trends have continued into the first half of 2011 with a 37 percent annual growth in
international tourist arrivals.
Tourism is among the most important source of foreign exchange for Sri Lankan economy. It
accounted for 2.6 percent of foreign exchange receipts in 2009. Foreign exchange earnings from
tourism increased 49.9 percent in 2010 amounting to LKR 56.24 billion, as compared to an
increase of 1.1 percent in 2009. According to the Sri Lanka Tourism Development Agency (SLTDA),
the total number of persons employed directly in the tourism sector increased 1.5 percent, in
2009 to 52,071 persons, compared with a decline of 15.2 percent in 2008.
With the restoration of peace in the country and the promise of global economic growth, the
stage is set for several years of strong growth in Sri Lanka’s tourism arrivals and tourist revenues.
We estimate International tourist arrivals to Sri Lanka to increase 15 percent in 2011 to reach
750,000. Domestic travel and tourism spending is also expected to increase in 2011 by nearly 7
percent. Estimates by the World Travel & Tourism Council (WTTC) indicate that the Sri Lankan
1 In this document, FY means Fiscal year denoting April-March. Thus, FY2011 or 2010-11 means the period April 2010-
March 2011. Statement of year, e.g. 2010 and so on, without a prefix FY means calendar year from January-December.
Thus, 2010 or CY2010 means period January-December 2010, and so on. Q1FY (year) means quarter April-June; and so
on and 1Q (year) means quarter January-March. Thus, Q1FY2011 means April-June 2010, and so on. 1Q2010 means
January-March 2010, and so on. H1FY (year) means period April-September, e.g. H1FY2011 means April-September
2010, and so on. 1H (year) means January-June, e.g. 1H2010 means January-June 2010, and so on.

Travel and Tourism Industry in Sri Lanka 2
travel and tourism industry is expected to generate 210,000 jobs directly in 2011 (2.7 percent of
total employment). By 2015, T&T is forecast to generate 225,000 jobs, an increase of 2.3 percent
per annum over the period from 2011-15.
Sri Lanka primarily attracts tourists from India (19 percent of international tourist arrivals in
2010), UK (16 percent), Germany (7 percent), Maldives (6 percent), and Australia (5 percent).
India’s real gross domestic product (GDP) has increased at an annual average rate of 8.4 percent
during the period, FY2007 to FY2011. With real GDP growth forecast to increase at an annual rate
of over 8 percent during the period, FY2011 to FY2015 and increasing disposable incomes, the
number of Indians travelling overseas is estimated to double every decade creating strong
demand for recreational tourism, meetings, incentives and conferences. Because of its proximity
to India, Sri Lanka is better positioned to compete for this market than many other destinations
in South Asia and South-East Asia. Both the Sri Lankan Government and the country’s private
sector are aware of this strategic advantage and have begun to jointly invest in products and
promotional efforts geared to attract Indian tourists to circuits such as a `Ramayana’ sites
featured in the ancient Hindu epic. Further, with a more secure environment, Sri Lanka is also
expected to attract more tourists from North America, Asia-Pacific and Western Europe.
The Sri Lankan Government is prioritising tourism and has started taking a number of steps to
strengthen the sector. The Ministry of Economic Development in its report titled: `Tourism
Development Strategy 2011-16’, has identified the following key objectives:
Double hotel room capacity from around 23,000 rooms at present to 45,000 by 2016
Accommodate 2.5 million annual arrivals as compared with over 650,000 in 2010
Increase foreign exchange earnings from US$501 million in 2010 to US$2.75 billion in 2016
Increase tourism employment to 500,000 by 2016
Attract US$3 billion in Foreign Direct Investment (FDI) within the next five years
Position the country as one of the most attractive destination in the world
To realise its tourism potential however, Sri Lanka will have to significantly improve its
international air and domestic surface linkages and, invest substantially in improving domestic
transport, energy and telecom infrastructure.
The development of an island-wide road network at national, provincial and rural level is
essential to ensure safe and quick connectivity to the various tourist destinations. Recent Plan
projections indicate that public investment in road sector is expected to gather further
momentum with an investment of LKR 128 billion in 2011. It is planned to be increased to LKR
174 billion by 2013 and, thereafter, to be maintained at LKR 175-200 billion, annually.
The country’s overall investment requirements are not expected to be met through public funds
only. There is also an urgent need to attract both domestic and foreign investment to
substantially improve hotel accommodation capacity and quality. However, there is a perception
that the Government is sending some potentially conflicting signals about the role of the private
sector in economic development.

Travel and Tourism Industry in Sri Lanka 3
Sri Lanka has suffered from overlapping authorities from multiple government agencies, and in
the past projects stalled by litigation despite having government approvals. Investment approval
procedure needs to be accelerated, and speedy approval and procedures will have to be ensured
to accelerate the implementation of proposals and reduce start-up times. The government has
started a comprehensive process to address legal and bureaucratic barriers to investment and
the high cost of doing business in Sri Lanka. Increased transparency and improved governance
could also bolster market confidence and lead to higher investment.
SRI LANKA TRAVEL AND TOURISM—SWOT ANALYSIS
Strengths Long (1600 km) and beautiful coastline along the Indian Ocean and a
tropical climate
Significant long-term government support for the industry
Cultural orientation, religious values, respect for people and traditions,
and sacred sites
Low-cost tourist destination with proximity to Indian sub-continent
and South-East Asia
Weaknesses Limited international air connectivity
Inadequate in transport and tourism infrastructure
Overlapping authorities and excessive regulation from multiple
government agencies
Past projects stalled by litigation despite having government approvals
Economy severely impacted due to years of internal strife
Low competitiveness rankings compared to South East Asian tourism
destinations
Opportunities Focus areas: beach tourism, cultural tourism, tea tourism, Eco-tourism,
religious tourism
Proximity to India and cultural affinity with Southern and Eastern India
Potential to offer quality and exclusivity based packages owing to small
size - an offering not always available in mass-market package
destinations.
Onset of peace to attract greater numbers of tourists
Growing political and economic relationship with China
Planned new and expansion projects by international hotel chains
Major infrastructure investment programs planned for the Eastern and
Northern regions
Recent pledge by the World Bank for US$125 million in funding for
projects promoting: tourism, small and medium-sized enterprise
development, and local authority capabilities in the Northern and
Eastern regions.
Threats High Fiscal deficits (with planned expenditure reduction by the
Government) may constrain infrastructure spending
Limited air connectivity to European and American destinations could

Travel and Tourism Industry in Sri Lanka 4
result in Sri Lanka becoming the place for budget travellers from India
and South Asia
Competition from neighbouring countries
Adverse international publicity if the rehabilitation of the population in
the North is delayed
GLOBAL SCENARIO
Over recent decades, travel and tourism have been large contributors to the world economy.
International tourism has been growing at a slightly faster pace than the world economy and this
seems likely to continue in the long-term. Tourism plays a crucial role in supporting economic
growth and development, sustaining employment and generating foreign currency receipts.
The travel and tourism industry is highly labour intensive and a significant source of employment.
According to the International Labour Organization (ILO), it is among the world‘s top creators of
jobs requiring varying degrees of skills and allows for quick entry into the workforce for youth,
women and migrant workers. With regard to the indirect job creation, one job in the core
industry indirectly generates roughly 1.5 additional jobs in the related economy. In 2010, the
sector is expected to account for more than 235 million jobs, equivalent to about 8 per cent of
the overall number of jobs.
Tourist Arrivals
Over the last 20 years, international tourism – as measured by the number of tourist arrivals –
has mirrored the four downturns in the world economy, measured by global GDP, which occurred
in 1991, 1998, 2001 and 2008. During the past decade, the events of September 11, 2001
accentuated the fall in tourism at the end of that year. Despite the ensuing economic recovery,
global tourism suffered another setback in 2003, because of various factors specific to tourism
such as terrorist threats, the outbreak of the Iraq war, the Severe Acute Respiratory Syndrome
(SARS) crisis, and the spread of the avian flu in Asia and the Pacific. However, the shocks that
tourism experienced over the period had effects that were very short-lived and were rapidly
absorbed. Overall, international tourism growth was far more robust than economic growth. For
the period from 1988 to 2008, the average annual growth rate in tourist arrivals was 4.6 percent,
compared to 3.4 percent for global GDP.

Travel and Tourism Industry in Sri Lanka 5
Sources: World Tourist Organisation (WTO), International Monetary Fund (IMF), IMaCS Analysis
The global economic recession, aggravated by the uncertainty around the H1N1 influenza
pandemic, resulted in world tourist arrivals for business, leisure and other purposes declining 3.8
percent in 2009 to 882 million. Tourist arrivals had previously declined 1.8 percent in 2003,
followed by generally strong growth during the period, 2004-07. This was followed by another
slowdown in 2008.
Sources: WTO, IMaCS Analysis
440 443480 496
520541
575599 617
640687 687
707 695
765798
852
901 917882
940
-6%
-4%
-2%
0%
2%
4%
6%
8%
10%
12%
200
300
400
500
600
700
800
900
1,000
1990 1992 1994 1996 1998 2000 2002 2004 2006 2008 2010
Arrivals-million (LS) Growth (RS)
Exhibit 1: Growth in World GDP and Tourist Arrivals
Exhibit 2: World - International Tourist Arrivals and Growth
-6%
-4%
-2%
0%
2%
4%
6%
8%
10%
12%
1981 1983 1985 1987 1989 1991 1993 1995 1997 1999 2001 2003 2005 2007 2009 2011F
GDP Tourist Arrivals

Travel and Tourism Industry in Sri Lanka 6
World tourism was variably impacted by the financial and economic crisis that hit the world
economy in 2008 and 2009.Tourism flows started to decline in the second half of 2008, and the
decline deepened at the beginning of 2009. International tourism was affected more than
domestic tourism, business tourism more than leisure tourism, hotels more than other types of
accommodation, and air transport more than other types of transport.
Following 14 months of decline, growth returned in the last quarter of 2009. The 2 percent
upswing registered in the last quarter of 2009 contrasted with the annual decline of 10 percent, 7
percent and 2 percent in the first three quarters of 2009. By 2010, worldwide, international
tourist arrivals increased 6.6 percent to 940 million. Asia, the Pacific region and the Middle East
led the recovery and were among the strongest growing regions in 2010.
A vast majority of destinations reported positive and, often, double-digit increases. Growth
varied across regions: at 8.3 percent in emerging economies, but at a lower rate of 5.1 percent in
advanced economies. Tourist arrivals in Africa increased in 2009 and 2010, and the Middle East
returned to double digit growth. Tourist flows to the Americas increased 6.5 percent in 2010,
compared with a decline of 5.6 percent in 2009. Growth in Europe also resumed, albeit at a lower
rate.
Exhibit 3: Regional Tourist Flows
Million No. Growth (percent)
2007 2008 2009 2010
2009 2010 2001-
05
2006-
10
Europe 485.4 485.2 461.5 476.6 -4.9 3.3 2.6 1.6
Northern Europe 58.1 60.8 57.7 58.1 -5.1 0.7 5.6 0.3
Western Europe 153.9 153.2 148.6 153.7 -3.0 3.4 0.3 1.6
Central/Eastern Europe 96.6 100.0 90.2 95.1 -9.8 5.4 -34.3 62.1
Southern/Mediterranean
Europe 176.8 171.2 165.1 169.7 -3.6 2.8 2.8 2.1
Asia and the Pacific 182.0 184.1 180.9 203.8 -1.7 12.7 6.9 5.8
North-East Asia 101.0 100.9 98.0 111.6 -2.9 13.9 8.1 5.4
South-East Asia 59.7 61.8 62.1 69.6 0.5 12.1 6.1 7.5
Oceania 11.2 11.1 10.9 11.6 -1.8 6.4 2.8 1.1
South Asia 10.1 10.3 9.9 11.1 -3.9 12.1 5.8 6.5
Americas 143.9 147.8 140.6 149.8 -4.9 6.5 0.8 2.4
North America 95.3 97.7 92.2 98.2 -5.6 6.5 -0.4 1.8
Caribbean 19.8 20.1 19.5 20.1 -3.0 3.1 1.9 1.3
Central America 7.8 8.2 7.6 7.9 -7.3 3.9 7.9 4.6
South America 21.0 21.8 21.3 23.5 -2.3 10.3 3.6 5.1
Africa 43.1 44.4 46.0 49.4 3.6 7.4 6.0 6.9
North Africa 16.3 17.1 17.6 18.7 2.9 6.2 6.4 6.1
Sub-Saharan Africa 26.9 27.2 28.4 30.7 4.4 8.1 5.8 7.4
Middle East 46.7 55.2 52.9 60.3 -4.2 14.0 8.5 10.7
Advanced economies 496.0 495.0 474.0 498.0 -4.2 5.1 1.7 1.9
Emerging economies 405.0 421.0 408.0 442.0 -3.1 8.3 6.1 5.1
Total 901.0 917.0 882.0 940.0 -3.8 6.6 3.4 3.3
Sources: WTO, IMaCS Analysis

Travel and Tourism Industry in Sri Lanka 7
Recent Trends and Short -Term Out look
Recovering from the recent slowdown in world economic growth, international tourist arrivals
grew by 4.5 percent in the first four months of 2011. According to the latest issue of the UNWTO
World Tourism Barometer, growth was positive in all regions except the Middle East. Some sub-
regions achieved double-digit growth: South America (17 percent), South Asia (14 percent) and
South-East Asia (10 percent).
Between January and April 2011, tourism arrivals increased 4.5 percent to 268 million. April 2011
was the strongest month with an estimated increase of 6 percent after weaker growth in
February and March 2011, both, at around 3 per cent. This reflected upon a late Easter holiday
and contrasted with a weaker April of 2010 when European airspace was closed for nearly a week
due to the ash cloud, following the eruption of a volcano in Iceland.
UNWTO expects demand to recover towards the end of 2011 in destinations currently facing
difficulties. As the peak tourist season gets underway in the Northern hemisphere, short-term
prospects remain positive. This is reflected in the UNWTO Confidence Index, a short-term outlook
based on consultations with over 350 experts worldwide. The index remains largely optimistic for
the period May-August 2011. There are however, marked differences in the confidence levels for
different regions of the world, with experts in the Americas and Europe anticipating the best
outcomes. Confidence remains high in Africa, but lower than that expected in Asia and the Pacific
region. Experts in the Middle East are the least optimistic. UNWTO has forecast international
tourist arrivals to increase 4-5 percent in 2011, slightly above the long-term average and in line
with previous assessments. Recent adverse geo-political developments in the Middle East, North
Africa and Japan are not expected to, significantly, alter the global forecast.
Major Tourist Destinat ions
Of the 940 million international tourist arrivals in 2010, France was the top tourist destination
and accounted for 8.1 percent of world tourist arrivals. The other major destinations were US (2nd
position), China, Spain (4th position) and Italy (5th position). Among the top 10 destinations, five
are in Europe, two in North America and three in Asia (including Turkey). The most significant
change among the top 10 destinations in 2010 was the rise of China to third position, displacing
Spain and having overtaken both the UK and Italy in the past few years.
In terms of receipts also China moved up to fourth position with a growth of over 15 per cent,
overtaking Italy. Hong Kong moved into the top 10 and reached the ninth position. France
continued in the third position, while US ranked first in receipts and second in arrivals. Spain
maintained its position as the second highest earner worldwide and the first in Europe. Italy
ranked fifth, Germany sixth and the UK was seventh. Turkey occupied the tenth position in
receipts.

Travel and Tourism Industry in Sri Lanka 8
Exhibit 4: Major Tourist Destinations Tourist Arrivals
(Million No.)
Receipts
(US$ million)
2007 2008 2009 2010
2007 2008 2009 2010
France 80.9 79.2 76.8 76.8 62.9 67.4 59.4
US 56.0 57.9 54.9 59.7 145.2 166.4 147.6 163.9
China 54.7 53.0 50.9 55.7 41.1 44.1 42.6
Spain 58.7 57.2 52.2 52.7 65.0 70.4 59.5 58.8
Italy 43.7 42.7 43.2 43.6 46.1 48.8 41.9 40.0
UK 30.9 30.1 28.2 28.1 48.2 46.3 38.6 39.8
Turkey 22.2 25.0 25.5 27.0 20.7 25.0 24.6 24.7
Germany 24.4 24.9 24.2 26.9 49.3 53.4 47.5 49.1
Malaysia 21.0 22.1 23.6 24.6 17.9 18.6 17.2
Mexico 21.4 22.6 21.5 22.4 14.0 14.6 12.3 12.5
Sources: WTO, IMaCS Analysis
Countries in the Asia-Pacific attracted 204 million tourists in 2010. The key destinations were in
North-East Asia, South-East Asia and Oceania. The South Asian region attracted 11.1 million
tourists in 2010, with India accounting for 5.58 million, while Sri Lanka attracted less than a
million tourists. Most destinations in the Asia-Pacific posted double-digit growth because of
strong development of local economies. Accordingly, receipts grew by 13 percent in real terms to
US$249 billion.
North-East Asia had the highest growth in tourist arrivals (over 13.9 percent) in 2010, with
double-digit increases for virtually all destinations. At 9.4 per cent, growth in China was below
average, but still represented around a quarter of the additional arrivals in the whole region.
Arrivals in South-East Asia, the only sub-region to show positive results in 2009, were further up
12.1 percent in 2010. Destinations such as Vietnam (35 percent), Singapore (22 percent),
Cambodia (17 percent), Philippines (17 percent), Thailand (12 percent) and Indonesia (11
percent) all recorded double-digit growth after a weak 2009.
International arrivals in South Asia increased 12.1 percent, with particularly strong growth in Sri
Lanka (46 percent) and Maldives (21 percent). At 8 per cent, growth in India’s tourist arrivals was
comparatively moderate.
Arrivals growth in Oceania (6 percent) was just below the world average with leading and more
mature destinations such as Australia (5 percent) and New Zealand (3 percent) showing
moderate growth after a flat 2009.

Travel and Tourism Industry in Sri Lanka 9
Exhibit 5: Tourist Destinations in Asia and the Pacific Tourist Arrivals
(Million No.)
Receipts
(US$ million)
2007 2008 2009 2010
2007 2008 2009 2010
Australia 5.64 5.59 5.58 5.89 22.31 24.76 25.38 30.10
Cambodia 1.87 2.00 2.05 2.40 1.14 1.22 1.19 1.26
China 54.72 53.05 50.88 55.67 37.23 40.84 39.68 45.81
Fiji 0.54 0.59 0.54 0.63 0.50 0.55 0.42 -
Hong Kong (China) 17.15 17.32 16.93 20.09 13.75 15.30 16.45 22.95
India 5.08 5.28 5.17 5.58 10.73 11.83 11.14 14.16
Indonesia 5.51 6.23 6.32 7.00 5.35 7.38 5.60 6.98
Iran 2.22 2.03 - - 1.68 1.91 2.01 -
Japan 8.35 8.35 6.79 8.61 9.33 10.82 10.31 13.20
South Korea 6.45 6.89 7.82 8.80 6.14 9.77 9.82 9.77
Lao 1.14 1.30 1.24 - 0.23 0.28 0.27 -
Macao (China) 12.94 10.61 10.40 11.93 13.08 16.43 17.64 -
Malaysia 20.97 22.05 23.65 24.58 14.04 15.28 15.77 17.82
Maldives 0.68 0.68 0.66 0.79 0.60 0.66 0.61 0.71
New Zealand 2.47 2.46 2.46 2.53 5.44 5.04 4.59 4.86
Nepal 0.53 0.50 0.51 - 0.20 0.34 0.37 0.39
Pakistan 0.84 0.82 0.86 0.91 0.28 0.32 0.27 0.36
Philippines 3.09 3.14 3.02 3.52 4.93 2.50 2.33 2.78
Singapore 7.96 7.78 7.49 9.16 9.07 10.71 9.36 14.12
Sri Lanka 0.49 0.44 0.45 0.65 0.39 0.34 0.35 0.58
Taiwan 3.72 3.85 4.40 5.57 5.21 5.94 6.82 8.65
Thailand 14.46 14.58 14.15 15.84 16.67 18.17 15.66 19.76
Vietnam 4.23 4.24 3.75 5.05 3.75 3.93 3.05 4.45
Total 182.05 184.06 180.94 203.84 186.31 208.60 203.10 248.66
Sources: WTO, IMaCS Analysis
World Tourist Recei pts
International tourism receipts are estimated to have reached US$919 billion in 2010, up from
US$851 billion in 2009. Growth in international tourism receipts was estimated at 4.7 percent in
2010, measured in real terms (i.e., using local currencies at constant prices in order to adjust for
exchange rate fluctuations and inflation). Thus, the recovery in international tourism receipts (4.7
percent) still lags that of international arrivals (6.6 percent). This is typical in periods of recovery
following major shocks, when volume (arrivals) tends to recover faster than income (receipts)
because of higher competition to contain prices. Tourists also tend to travel closer to home and
for shorter periods of time.

Travel and Tourism Industry in Sri Lanka 10
Exhibit 6: World Tourist Receipts Growth in
Local Currency ( percent)
Receipts
(US$ billion)
Per Arrival
(US$)
2008 2009 2010 2009 2010 2009 2010
Europe -0.9 -6.7 -0.4 410.9 406.2 900 850
Northern Europe -2.5 -4.0 -1.3 58.6 59.2 1,150 1.01
Western Europe -2.2 -7.1 1.5 143.8 142.0 980 920
Central/Eastern Europe 4.3 -8.0 -2.8 47.4 47.7 530 500
Southern/Mediterranean Europe -0.6 -6.9 -1.1 161.3 157.4 940 930
Asia and the Pacific 4.6 -0.7 12.8 203.1 248.7 1,120 1,220
North-East Asia 8.2 1.9 15.9 101.2 122.4 1,020 1,100
South-East Asia -0.8 -7.4 14.4 53.5 68.0 870 980
Oceania 3.2 5.3 -0.6 33.5 39.4 3,080 3,400
South Asia 7.7 -4.9 16.5 14.9 18.9 1,550 1,710
Americas 4.9 -9.9 5.0 166.2 182.2 1,170 1,220
North America 6.9 -124 6.2 119.2 131.2 1,290 1,340
Caribbean -3.2 -5.3 2.1 22.6 23.6 1,140 1,180
Central America 0.3 -3.4 4.1 6.1 6.8 770 850
South America 3.1 -0.3 1.2 18.3 20.6 850 880
Africa -2.5 -4.1 4.0 28.8 31.6 630 640
North Africa -3.9 -4.7 3.6 9.9 10.0 570 540
Sub-Saharan Africa -1.8 -3.8 4.2 18.9 21.6 670 710
Middle East 5.5 0.8 14.4 42.0 50.3 780 830
Advanced economies 1.8 -6.5 4.4 547 580 1,160 1,160
Emerging economies 1.5 -3.8 5.1 304 339 740 770
Total 1.7 -5.6 4.7 851 919 970 980
Sources: WTO, IMaCS Analysis
SRI LANKAN TOURISM INDUSTRY
Sri Lanka is an island south of India with a land area of 65,610 square km (sq.km.). It had an
estimated population of 20.65 million in 2010 and annual population growth rate of 1 percent.
The Western Province has the highest population size and density, followed by the Central and
the Southern Provinces. The North Central Province has the biggest land area, followed by the
Eastern and Uva Provinces.
The country’s major tourist attractions include the following: island's beaches located in the
Southern and Eastern parts of the country, ancient heritage sites located in the interior of the
country, and lush green resorts located in the mountainous regions of the country and wild life
sanctuaries in Yala and Wilpathu.
Heritage Tourism
Sri Lanka has 49 sites classified as unique attractions, 91 as rare attractions and eight world
heritage sites. The eight heritage sites are:

Travel and Tourism Industry in Sri Lanka 11
1. Ancient City of Polonnaruwa
2. Ancient City of Sigiriya
3. Golden Temple of Dambulla
4. Old Town of Galle and its Fortifications
5. Sacred City of Anuradhapura
6. Sacred City of Kandy
7. Central Highlands of Sri Lanka
8. Sinharaja Forest Reserve
Source: Compiled by IMaCS
Beach Tourism
With over 1,600 km of coastlines, Sri Lanka is known to most tourists for its tropical beach
resorts. The South Western coast is best visited from November to April and the East coast from
April to September. Some popular beach spots on the South Western coast include
Ambalangoda, Hikkaduwa and Galle. The Eastern coastal region offers numerous opportunities
for water sports, deep-sea fishing, underwater photography, scuba diving at the shipwrecks and
coral reefs off the coast, and whale watching. Popular tourist towns with sandy beaches in East of
Sri Lanka include Trincomalee, Batticaloa, Kalkudah and Nilaveli.

Travel and Tourism Industry in Sri Lanka 12
Cultural Tourism
Sri Lanka has numerous magnificent, century-old monuments and cultural relics in a number of
ancient cities. Kandy, Anuradhapura and Polonnaruwa are known as the points of the `Cultural
Triangle’ of Sri Lanka. Within the triangle, Sigiriya is considered as the base of cultural tourism.
The most important archaeological and cultural site in Sigiriya is the rock fortress built in the 5th
Century AD by King Kasyappa to fend off a feared invasion. Situated atop a 200 metre high rock,
the fortress houses famous frescoes (rock paintings) on its gallery wall.
Other highlights of cultural tours in this area include the following:
Buddhist cave temples dating to the 1st Century AD and a gigantic recumbent image of the
Buddha carved out of rock in the town of Dambulla
A manmade reservoir called, `Parakrama Samudra’ located in the medieval Sri Lankan capital
of Polonnaurwa
Sacred Shri Maha Bodhi Tree in Anuradhapura.
It is claimed that the right branch of the Bodhi tree in Bodh Gaya in India under which the Buddha
attained enlightenment was brought to Sri Lanka in the 3rdcentury BC by Princess Sanghamitta,
the daughter of Emperor Ashoka. It was planted in Anuradhapura and is venerated to this day by
the Buddhists from many countries of the world. This is the oldest recorded tree in the world
whose exact age is known.
Hill and Mountain Tourism (Up Country Tourism)
Kandy is known as Sri Lanka’s hill capital. The focal point of the town is the golden roofed Dalada
Maligawa (Temple of the Tooth), a temple that houses Sri Lanka’s most important religious
relic—the Sacred Tooth of Lord Buddha. The Esala Perahera celebrations are an annual highlight
when a replica of the shrine is carried in a procession accompanied by dancers, drummers, and
over 100 splendidly clothed and decorated elephants.
Another popular tourist destination in the hill country is Nuwara Eliya, a small town, set in the
heart of the tea country. Nuwara Eliya is also known as `Little England'. It is located at an altitude
of 1,868 m (6,128 feet) in the Central Highlands and is considered one of the most important
locations for tea production in Sri Lanka. The town is overlooked by Pidurutalagala, the highest
mountain in Sri Lanka at 2,524 m (8,281 feet). The town was founded by Samuel Baker, the
discoverer of Lake Albert and the explorer of the Nile in 1846. Nuwara-Eliya is known as the
coldest city of Sri Lanka, with a mean annual temperature of 16°C. Because of its climate, the city
became the prime sanctuary of the British civil servants and planters in Ceylon.
The Central Highlands are also home to the Adam's Peak. This is a 2,243 m (7,359 feet) tall conical
mountain located in central Sri Lanka. It is well-known for the Sri Pada `sacred footprint’, a 1.8 m
rock formation near the summit. In the Buddhist tradition it is regarded as footprint of the
Buddha, in Hindu tradition that of Shiva, and in Muslim and Christian traditions that of Adam.

Travel and Tourism Industry in Sri Lanka 13
Overview of Tourist Inf lows
At the time of its independence from British rule in 1948, Sri Lanka’s economy was considered
much more prosperous than most of its Asian neighbours. The country also inherited a highly
competitive pluralistic political system, which was characterised by regular general elections
based on universal franchise. Due to its export of primary crops, Sri Lanka’s national income per
head was also one of the highest in Asia. Along with its high income, the country’s achievements
in health and education were better than most other developing countries.
From the 1970s however, the democratic political system and the territorial integrity of Sri Lanka
came under the threat of growing political conflict. In 1971, there was an insurrection organised
by a youth group of the Sinhala community, known as the Janatha Vimukthi Peramuna (JVP) to
capture state power. The militant youth movements of the LTTE in the northern parts of the
country also started in the mid 1970s. While the Sinhala community accounts for 74 percent of
the total population, the Tamil community is the second largest ethnic group, accounting for 13
percent of the total population. The LTTE gradually entered into a guerrilla war with the aim of
carving out a separate Tamil state in Sri Lanka. Because of the outbreak of two armed conflicts in
the 1980s the island nation got separated into `war zones’ and `peaceful territories’. While the
bloody civil war in the North East resulted in a collapsed of tourism industry there, in large parts
of the `peaceful areas’ of the island, the tourism industry managed to survive.
Source: SLTDA, IMaCS Analysis
Because of the ethnic conflict since the early 1980s, tourism in Sri Lanka has generally operated
at sub-optimal levels. Further compared to other Asian markets, growth rates of international
tourist arrivals had significant yearly and monthly fluctuations. International tourist arrivals into
Sri Lanka shrunk from record levels of 407,230 in 1982 to 184,732 in 1989, a negative CAGR of
about 12 percent.
-30%
-20%
-10%
0%
10%
20%
30%
40%
50%
60%
70%
1980 1982 1984 1986 1988 1990 1992 1994 1996 1998 2000 2002 2004 2006 2008 2010
Exhibit 7: Sri Lanka - Growth in International Tourist Arrivals

Travel and Tourism Industry in Sri Lanka 14
Thereafter, the tourism industry picked up with tourist arrivals increasing to 566,200 in 2004.
However, arrivals shrunk in 2005 because of the tsunami of December 2004 and the break-down
of the cease fire agreement reached in 2002. In FY2009, tourist arrivals declined to 440-450,000
because of the global economic slowdown.
The decline in tourist arrivals also caused a fall in employment in the industry from 60,500 in
2007 to 52,900 in 2008. The Sri Lanka Tourism Development Agency (SLTDA) reported that the
industry provided direct employment to 52,071 persons in 2009 and another to 72,899 indirectly.
Source: SLTDA, IMaCS Analysis
In 2010, international tourist arrivals into Sri Lanka increased 46.1 percent to a record tourist
inflow of 654,477. These trends have continued into the first half of 2011 with a 37 percent (yoy)
growth. The key reason for the dramatic improvement in Sri Lanka’s tourism is the return of
peace following the May 2009 declaration of victory over the LTTE.
In fact, tourism inflows began to recover from mid-2009, a reversal from the double digit year on
year (yoy) declines of January-May 2009. Further, over the course of 2010, tourism markets such
as the US, Japan, the UK and other European countries relaxed their advisories against travel to
Sir Lanka.
298318
394 392408 403
302
366381
400 400
337
393
501
566549 560
494
438 448
655
-30%
-20%
-10%
0%
10%
20%
30%
40%
50%
60%
70%
200
250
300
350
400
450
500
550
600
650
700
1990 1992 1994 1996 1998 2000 2002 2004 2006 2008 2010
Arrivals-thousands (LS) Growth (RS)
Exhibit 8: Sri Lanka - International Tourist Arrivals and Growth

Travel and Tourism Industry in Sri Lanka 15
Source: SLTDA, IMaCS Analysis
Seasonali ty
The peak months for arrivals are November to April. The lowest number of arrivals is usually
recorded in May. There is a secondary peak in July-August, a shoulder period in September-
October and a low season in May-June. The reason is partly the seasons of the West Coast, with
its monsoon period from late May to July, and partly because Sri Lanka has traditionally attracted
Indian and European tourists during their winter seasons. In the recent year, there has been an
increase in summer travel because the short-haul European tourists have been attracted into
taking long-haul holidays.
Exhibit 10: Share of Tourist Arrivals by Month Per cent
Jan Feb Mar Apr May Jun Jul Aug Sep Oct Nov Dec
2005 7.0 6.7 9.2 7.7 7.4 8.3 10.3 9.3 7.9 8.0 8.8 9.3
2006 9.3 9.4 9.8 8.9 7.8 7.9 9.9 9.5 6.9 6.9 6.7 7.0
2007 11.4 8.7 7.1 6.7 5.3 6.2 8.9 9.1 7.5 7.5 9.1 12.4
2008 13.0 9.2 8.7 6.8 7.1 6.4 7.5 7.0 6.7 8.0 8.4 11.2
2009 8.6 7.6 7.6 5.8 5.5 6.8 9.4 9.2 8.5 8.4 9.9 12.7
2010 7.8 8.8 8.0 5.9 5.4 6.8 9.7 8.5 7.2 8.0 11.0 12.9
Source: SLTDA, IMaCS Analysis
-60%
-40%
-20%
0%
20%
40%
60%
80%
100%
120%
10,000
20,000
30,000
40,000
50,000
60,000
70,000
80,000
90,000Ja
n-0
4M
ar-0
4M
ay-0
4Ju
l-0
4Se
p-0
4N
ov-
04
Jan
-05
Mar
-05
May
-05
Jul-
05
Sep
-05
No
v-0
5Ja
n-0
6M
ar-0
6M
ay-0
6Ju
l-0
6Se
p-0
6N
ov-
06
Jan
-07
Mar
-07
May
-07
Jul-
07
Sep
-07
No
v-0
7Ja
n-0
8M
ar-0
8M
ay-0
8Ju
l-0
8Se
p-0
8N
ov-
08
Jan
-09
Mar
-09
May
-09
Jul-
09
Sep
-09
No
v-0
9Ja
n-1
0M
ar-1
0M
ay-1
0Ju
l-1
0Se
p-1
0N
ov-
10
Jan
-11
Mar
-11
May
-11
Arrivals Growth yoy (RS)
Exhibit 9: Monthly International Tourist Arrivals into Sri Lanka

Travel and Tourism Industry in Sri Lanka 16
Contri bution to GDP
According to estimates by the World Travel & Tourism Council (WTTC), Sri Lanka's travel and
tourism industry’s direct contribution to GDP peaked at 4.3 percent in 2004, but declined
substantially to 2.7 percent in 2009. However, its contribution to GDP is estimated to have
increased to 2.9 percent in 2010, primarily, because of strong growth in tourist arrivals and
spending. This primarily reflects on economic activity generated by industries such as hotels,
travel agents, airlines, restaurants and leisure industries and other passenger transportation
services (excluding commuter services). Over the period 2011-15, while travel and tourism
revenues are expected to grow at an annual rate of 12.9 percent in local currency terms (7.9
percent in US$ terms), its share of GDP is expected to increase to 3 percent by 2015.
Exhibit 11: Travel and Tourism Revenues and Contribution to GDP LKR billion Growth
(percent)
US$ million Growth
(percent)
Share of GDP
2000 40.45 19.2 0.53 9.1 3.2
2005 92.13 1.6 0.92 2.3 3.7
2006 103.29 12.1 0.99 8.4 3.5
2007 118.17 14.4 1.07 7.4 3.3
2008 131.32 11.1 1.21 13.5 2.9
2009 134.28 2.3 1.17 -3.6 2.7
2010 161.95 20.6 1.42 21.7 2.9
2011 187.86 16.0 1.56 9.6 3.0
2015 296.60 12.9 (2011-15) 2.08 7.9 (2011-15) 3.0
2020 477.93 10.0 (2016-20) 2.83 6.3 (2016-20) 2.8
Source: WTTC
Data from Sri Lanka’s national accounts statistics indicate that `hotels and restaurants’ accounted
for 0.50 percent of Sri Lanka’s GDP in 2010. Its share has largely remained at 0.50-0.60 percent
during the period, 2003-2010, with a significant increase in 2010. In real terms (at constant 2002
prices), the share of `hotels and restaurants’ declined from 0.58 percent in 2003 to 0.37 percent
in 2008, but has thereafter increased to 0.52 percent in 2010.
Exhibit 12: GDP from Hotels and Restaurants Current Prices Constant (2002) Prices
LKR million Growth
(percent)
Share of
GDP
LKR million Growth
(percent)
Share of
GDP
2005 14,218 20.9 0.58 9,186 -14.1 0.47
2006 16,646 17.1 0.57 9,411 2.4 0.45
2007 18,367 10.3 0.51 9,199 -2.3 0.41
2008 20,611 12.2 0.47 8,741 -5.0 0.37
2009 24,988 21.2 0.52 9,901 13.3 0.40
2010 33,213 32.9 0.59 13,845 39.8 0.52
Source: Department of Census and Statistics, Sri Lanka; IMaCS Analysis

Travel and Tourism Industry in Sri Lanka 17
Tourism – Import ant Source of Foreign Exchange
Tourism is one of the most important sources of foreign exchange for the Sri Lankan economy. In
2009, tourism ranked as the sixth largest foreign exchange earner, after textiles and garments,
tea, transportation services and rubber-based products. Tourism accounted for 2.6 percent of Sri
Lanka’s foreign exchange receipts in 2009. The earnings from tourism increased 1.1 percent in
2009, from LKR 37.09 billion (US$ 319.5 billion) in 2008 to LKR 37.51 billion (US$ 326.3 million) in
2009.
Exhibit 13: International Tourism Receipts
LKR Million Growth
(percent)
US$ million Growth
(percent)
Receipt per
day
(US$)
Growth
(percent)
1999 19,297 29.8 274.9 19.3 61.4 3.2
2000 19,162 -0.7 252.8 -8.0 62.3 1.5
2005 36,377 -14.7 362.3 -12.9 74.6 3.3
2006 42,586 17.1 410.3 13.2 83.4 11.8
2007 42,519 -0.2 384.4 -6.3 79.1 -5.2
2008 37,094 -12.8 319.5 -16.9 76.7 -3.0
2009 37,506 1.1 326.3 2.1 81.8 6.6
Source: SLTDA; IMaCS Analysis
In 2010, foreign exchange earnings from tourism increased 49.9 percent to LKR 56.24 billion
because of a substantial increase in tourist arrivals. In US dollar terms, the earnings increased
52.4 percent to US$497.4 million. Thus, tourism industry became Sri Lanka’s fourth highest
foreign exchange earner in 2010. Also, the average expenditure per-day-per-tourist increased
from US$ 81.8 in 2009 to US$ 85.4 in 2010.
WTTC estimates for domestic spending by Sri Lankan citizens on travel and tourism indicate that
in real terms, expenditure increased 6.5 percent in 2010 to LKR 134.6 billion, compared with a
decline of 5.3 percent in 2009. It is expected to increase 6.5 percent in 2011 to LKR 152.5 billion.
Exhibit 14: Domestic Travel and Tourism Spending
LKR billion Growth
(percent)
US$ billion Growth
(percent)
2000 35.16 15.8 0.46 6.3
2005 72.26 14.7 0.72 15.6
2006 86.52 19.7 0.83 15.9
2007 102.72 18.7 0.93 11.5
2008 119.83 16.7 1.11 19.1
2009 119.82 0.0 1.04 -5.8
2010 134.59 12.3 1.18 13.3
2011 152.53 13.3 1.27 7.1
2015 246.72 12.9 (2011-15) 1.73 7.9 (2011-15)
2020 420.81 11.3 (2016-20) 2.49 7.5 (2011-15) Source: WTTC

Travel and Tourism Industry in Sri Lanka 18
Domestic travel and tourism spending has largely followed real GDP growth trends. Following
slow growth in 2001, it increased at high rates through 2008 and then stagnated in 2009 as real
GDP growth declined from 6 percent in 2008 to 3.5 percent in 2009. Thereafter, it increased 12.3
percent in 2010, primarily, because of strong real GDP growth of 8 percent.
Source: IMaCS Analysis
Employment i n Tourism Indust ry
The tourist industry creates employment opportunities directly in tourism related business
establishments such as hotels and other accommodation units, restaurants, travel agents and
tour operators, recreation and entertainment businesses, souvenir, handicraft and other shops.
Indirect employment is generated in businesses, which sell goods and services to the tourism
sector. In general, it has been found that indirect employment generated as a result of tourism is
much higher than direct employment. WTTC estimates that for every 100 direct jobs created in
the tourism sector in Sri Lanka there will be about 140 indirect jobs generated in the supply
sectors.
Employment in the industry largely increased up to 2007. In 2008, tourism jobs (both direct and
indirect) shrunk by 22,104, as tourist arrivals declined by 55,540. Some of the decline could be
attributed to a substantial expansion in employment during 2006-07, when the Sri Lankan tourist
industry added around 20,000 jobs. However, tourist arrivals declined for most months in 2007.
As this trend continued into 2008, the industry cut jobs and only 1,836 jobs were created in the
industry during 2009, even as arrivals increased by 9,420.
-5%
0%
5%
10%
15%
20%
25%
30%
1990 1992 1994 1996 1998 2000 2002 2004 2006 2008 2010 2012F
Domestic T&T Spending Real GDP
Exhibit 15: Sri Lanka - Growth in Real GDP and Domestic Travel and Tourism Spending

Travel and Tourism Industry in Sri Lanka 19
Source: SLTDA, IMaCS Analysis
Approximately 61 percent of those employed in the tourism industry are in the accommodation
and catering sectors. In 2008, employment in this segment declined at a faster rate than the
overall fall, primarily, because of hotel occupancy rates and discretionary spending by local
residents. Travel agents and tour operators accounted for 13.7 percent of direct employment in
2009, with employment in this segment growing at a faster rate in 2009. Employment in airlines
also declined substantially in 2008 and 2009.
Exhibit 17: Direct Employment in Sri Lanka’s Tourism Industry
Employment Annual Growth
(percent)
2004 2005 2006 2007 2008 2009 2008 2009
Total 53,776 52,085 55,649 60,516 51,306 52,071 -15.2 1.5
Hotels and Restaurants 34,354 33,497 36,017 39,758 31,626 31,891 -20.5 0.8 Travel Agents and Tour Operators 7,092 6,136 6,825 7,538 6,725 7,134 -10.8 6.1 Airlines 4,613 5,907 6,056 5,396 5,251 5,245 -2.7 -0.1 Agencies Providing Recreational Facilities 180 112 132 297 259 291 -12.8 12.4
Tourist Shops 3,029 2,358 2,396 1,585 1,485 1,546 -6.3 4.1
Guides 2,460 1,957 2,010 3,450 3,460 3,477 0.3 0.5
National Tourist Organisation 279 298 303 305 313 327 2.6 4.5
State Sector 1,769 1,820 1,910 2,187 2,187 2,160 0.0 -1.2
Source: SLTDA, IMaCS Analysis
-20%
-15%
-10%
-5%
0%
5%
10%
15%
20%
25%
10,000
30,000
50,000
70,000
90,000
110,000
130,000
150,000
170,000
1990 1992 1994 1996 1998 2000 2002 2004 2006 2008
Indirect
Direct
Growth (RS)
Exhibit 16: Sri Lanka - Employment in Tourism Industry

Travel and Tourism Industry in Sri Lanka 20
The total indirect employment in the sector was estimated at 72,899 in 2009. Thus the combined
direct and indirect employment in tourism increased 1.5 percent in 2009 to 124,970 persons. The
ratio of direct and indirect jobs generated was 3.6 jobs per tourist arrival.
Estimates by WTTC indicate that Sri Lanka’s travel and tourism industry is expected to employ
210,000 persons directly in 2011 (2.7 percent of total employment). This includes employment by
hotels, travel agents, airlines and other passenger transportation services. The industry’s total
contribution to employment including wider effects because of investment, supply chain and
induced income impacts is expected to be 554,000 jobs in 2011 (7.1 percent of total
employment). By 2021, it is expected to support 602,000 jobs (7.4 percent of total employment)
with an increase of 0.5 percent pa.
Exhibit 18: Share of Direct and Indirect Employment in Travel and Tourism Industry
Direct Total
Employment
(‘000 nos)
Growth
(percent)
Share of
Total
(percent)
Employment
(‘000 nos)
Growth
(percent)
Share of
Total
(percent)
2000 196.2 6.1 2.7 328.6 -22.6 4.5
2005 242.6 -12.1 3.2 572.3 -6.7 7.5
2006 237.4 -2.1 3.0 596.6 4.2 7.5
2007 221.9 -6.5 2.8 576.1 -3.4 7.3
2008 201.1 -9.4 2.5 543.7 -5.6 6.9
2009 188.4 -6.3 2.3 521.3 -4.1 6.6
2010 200.8 6.6 2.5 537.3 3.1 6.8
2011 210.1 4.6 2.6 554.2 3.1 7.1
2015 224.7 2.3 (2011-15) 2.7 584.4 1.7 (2011-15) 7.2
2021 243.9 1.4 (2016-21) 3.0 602.2 0.5 (2016-21) 7.4
Source: WTTC, IMaCS Analysis
Inbound Tourism Market
Asia and Western Europe are the largest source market for Sri Lanka, accounting for 37.3 percent
and 39.2 percent of the total arrivals respectively, in 2010. In 2010 however, there was a
decrease in Asia's share when compared with 2008 and 2009. The other markets were Eastern
Europe (5.4 percent), Australasia (5.7 percent), North America (6.1 percent) and Middle East (5.3
percent).
As in previous years, India remained as the major producer of tourist arrivals to Sri Lanka during
2010. Tourist arrivals from India aggregated 126,882 persons, accounting for 19.4 percent of all
international tourist arrivals. However, tourist arrivals from India declined for three successive
years from 2007 to 2009.
In 2010, with the relaxation of the travel warning by many countries, there was an upsurge in the
tourist arrivals in the country, particularly, from the Europe and North America. Tourist inflows
from North America increased 61.2 percent over 2009 accounting for 40,216 tourists. This

Travel and Tourism Industry in Sri Lanka 21
included 21,213 tourists from Canada, accounting for a growth of over 98 percent and 19,093
from the US with over 34 percent growth.
Arrivals from the Western European countries increased 51 percent to 256,861. While tourist
inflow from UK increased 29.3 percent to 105,496, inflows from Germany increased 54.2 percent
to 45,727. There was a significant 97 percent increase in tourists arriving from France with 31,285
tourists.
Arrivals from East Asia have also followed an upward trend with a 41.6 percent increase in 2010.
The majority of East Asian tourists were from Japan amounting to 14,352 tourists (over 31
percent growth). The number of tourists from South Asia increased 39.2 percent to 175,694 with
majority of them being from India. While the number of tourists from India increased 51.7
percent to 126,882, tourists from Maldives increased 12.1 percent to 35,791.
Countries in Australasia have also found Sri Lanka as a popular tourist venue and the number of
tourists from Australasia increased 43 percent to 37,290. Of these, tourist arrivals from Australia
increased 44 percent to 33,456.
Exhibit 19: Tourist Arrivals by Region and Major Countries
Arrivals (thousands) Growth (percent) Share (percent)
2006 2007 2008 2009 2010 2009 2010 2005 2010
North America 35.32 28.36 24.31 24.95 40.22 2.6 61.2 8.5 6.1
Canada 14.62 11.87 10.26 10.71 21.12 4.4 97.3 3.9 3.2 US 20.70 16.49 14.05 14.24 19.09 1.3 34.1 4.6 2.9
Latin America and
Caribbean 0.78 3.96 3.74 0.62 0.62 -83.5 0.5 0.1 0.1
Western Europe 228.45 194.45 167.19 170.12 256.86 1.8 51.0 41.4 39.2
France 22.69 8.09 10.59 15.89 31.29 50.0 96.9 4.9 4.8
Germany 47.40 35.04 30.63 29.65 45.73 -3.2 54.2 8.4 7.0
Italy 12.42 11.45 9.13 7.51 11.42 -17.7 52.0 1.9 1.7
Netherlands 19.36 17.53 13.03 11.29 17.86 -13.3 58.2 2.8 2.7
Switzerland 7.73 4.92 5.33 6.33 9.43 18.9 48.9 1.5 1.4 UK 88.31 94.06 81.33 81.59 105.50 0.3 29.3 16.9 16.1
Eastern Europe 14.22 25.57 29.44 26.31 35.52 -10.6 35.0 1.7 5.4
Russia 7.99 13.62 15.80 11.83 13.28 -25.1 12.2 0.7 2.0
Middle East 10.35 13.55 16.78 23.74 37.54 41.5 58.1 1.9 5.7
Africa 3.24 2.71 2.14 1.55 2.31 -27.7 49.0 0.4 0.4
East Asia 73.35 52.85 44.94 48.33 68.43 7.5 41.6 12.7 10.5
China 16.27 11.95 9.81 8.55 10.43 -12.9 22.0 1.8 1.6
Japan 16.19 14.27 10.08 10.93 14.35 8.4 31.4 3.1 2.2
Singapore 7.01 5.69 5.80 7.81 11.88 34.6 52.1 2.0 1.8
South Asia 168.78 149.63 128.10 126.21 175.69 -1.5 39.2 27.9 26.8
India 128.37 106.07 85.24 83.63 126.88 -1.9 51.7 20.6 19.4 Maldives 24.83 29.54 31.56 31.92 35.79 1.1 12.1 4.5 5.5
Australasia 25.13 22.92 21.84 26.07 37.29 19.4 43.0 5.4 5.7
Australia 21.85 20.24 19.54 23.24 33.46 19.0 44.0 4.7 5.1
Total 559.60 494.01 438.48 447.89 654.48 2.1 46.1 100 100
Source: SLTDA, IMaCS Analysis

Travel and Tourism Industry in Sri Lanka 22
Although tourist arrivals from India declined in 2008 and 2009, they increased to a record
126,882 persons in 2010. During the period January-June 2011, tourist arrivals from India
increased 48.3 percent (yoy) to 81,757 tourists. India’s real GDP has increased at an annual
average rate of 8.4 percent during FY2007-2011. With real GDP growth forecast to increase at an
annual rate of over 8 percent during 2011-15 and greater levels of disposable income, the
number of Indians travelling abroad could double every decade, creating strong demand for
recreational tourism and also for meetings, incentives and conferences. Because of its proximity
to India, Sri Lanka is better positioned to compete for this market than many other destinations
in South Asia and South-East Asia.
Both the Government of Sri Lanka and the private sector are aware of this strategic advantage
and have begun to jointly invest in products and promotional efforts geared to attract Indian
tourists, such as a `Ramayana’ circuit visiting sites featured in the ancient Hindu classic. As a
result, more and more Indian tourists are visiting the Ramayana sites in Sri Lanka. During the
month of January 2011, there were visits by two groups, one consisting of 400 tourists and the
other 150.
Exhibit 20: Tourist Arrivals by Region and Major Countries - 1st Half Arrivals Growth (percent) Share (percent)
1H 2009 2010 2011 2010 2011 2010 2011
NORTH AMERICA 10,765 18,317 22,753 70.2 24.2 6.6 6.0 Canada 4,625 9,913 11,744 114.3 18.5 3.6 3.1 US 6,140 8,404 11,009 36.9 31.0 3.0 2.9 LATIN AMERICA AND CARIBBEAN 418 297 519 -28.9 74.7 0.1 0.1
WESTERN EUROPE 74,536 108,250 143,454 45.2 32.5 38.8 37.6 France 7,394 13,480 24,354 82.3 80.7 4.8 6.4 Germany 12,377 21,500 25,539 73.7 18.8 7.7 6.7 Italy 3,170 4,202 5,622 32.6 33.8 1.5 1.5 Netherlands 5,084 6,527 10,197 28.4 56.2 2.3 2.7 Switzerland 2,893 3,693 4,697 27.7 27.2 1.3 1.2
UK 36,148 44,987 46,662 24.5 3.7 16.1 12.2
EASTERN EUROPE 13,926 16,935 21,189 21.6 25.1 6.1 5.6
Russia 6,494 6,195 7,877 -4.6 27.2 2.2 2.1
AFRICA 708 832 1,493 17.5 79.4 0.3 0.4
MIDDLE EAST 6,755 13,652 20,445 102.1 49.8 4.9 5.4
EAST ASIA 20,523 29,466 41,340 43.6 40.3 10.6 10.8
China 4,107 4,686 8,613 14.1 83.8 1.7 2.3
Japan 4,922 6,145 7,886 24.8 28.3 2.2 2.1
Malaysia 1,735 5,757 7,307 231.8 26.9 2.1 1.9
Singapore 3,055 4,743 6,643 55.3 40.1 1.7 1.7
SOUTH ASIA 50,336 76,816 111,570 52.6 45.2 27.6 29.2
India 30,902 55,138 81,757 78.4 48.3 19.8 21.4
Maldives 14,732 15,894 19,303 7.9 21.4 5.7 5.1
AUSTRALASIA 9,762 14,087 18,775 44.3 33.3 5.1 4.9
Australia 8,783 12,582 16,660 43.3 32.4 4.5 4.4
Total 187,729 278,652 381,538 48.4 36.9 100 100
Source: SLTDA, IMaCS Analysis

Travel and Tourism Industry in Sri Lanka 23
Tourist Profi le
There are two principal reasons for travel: business and leisure. However, classifying the purpose
of travel has become increasingly difficult as travellers tend to combine pleasure with business, in
order to take time and cost advantage. Leisure trips may include elements, characteristics and
motivations of business travel and vice versa.
Based on the declaration made by tourists on arrival, visits for pleasure (holiday, recreation and
sightseeing) accounted for 80 percent of international tourist arrivals into Sri Lanka in 2009.
Combining other purposes, non-business visits accounted for 91.4 percent of tourist arrivals. The
share of business visits peaked at 17.8 percent in 2006, but declined substantially to 8.6 percent
in 2009.
Exhibit 21: Purpose of Visit (per cent)
2000 2001 2002 2003 2004 2005 2006 2007 2008 2009
Pleasure 90.1 89.2 85.4 80.8 78.2 69.6 67.4 67.1 73.2 80.0
Business 4.8 6.7 9.4 9.1 10.6 16.9 17.8 10.5 8.5 8.6
Visiting Friends &
Relatives 2.1 1.8 2.0 6.2 6.4 8.0 7.6 8.3 8.3 5.2
Religious & Cultural 1.7 1.2 1.0 1.2 1.5 1.0 1.7 2.8 2.6 2.0
Others 1.3 1.1 2.2 2.7 3.4 4.5 5.5 11.3 7.4 4.3
Total 100 100 100 100 100 100 100 100 100 100
The largest proportion of business visitors come from Asia, particularly, India. Western Europe
accounts for the largest proportion of visitors for pleasure (40.8 percent), followed by 36 percent
from Asia and 6.4 percent from Australasia.
Around 16.3 percent of visitors from India visit Sri Lanka for business, compared with 83.7
percent for non-business purposes. Visitors from India for business and conventions were
estimated at 18,831 in 2006. There was a substantial decline to 5,163 in 2009. Considering that
visitors from India increased 52 percent in 2010, it is likely that visitors for business and
conventions too, would have recorded a significant increase in 2010.
Exhibit 22: Number of Visitors from India for Various Purposes
2004 2005 2006 2007 2008 2009
Total 105,151 113,323 128,370 106,067 85,238 83,634
Pleasure 27,834 36,222 39,754 18,351 12,495 13,658
Business 7,950 5,343 7,943 2,883 2,129 2,268
Conventions 11,941 8,726 10,888 7,716 6,404 2,895
Visiting Friends & Relatives 6,360 2,490 5,876 7,269 6,181 4,985
Religious & Cultural 968 969 1,432 11,765 6,234 1,503
Others 50,098 59,573 62,477 58,083 51,795 58,325
Share 100 100 100 100 100 100
Pleasure 47.6 52.6 48.7 54.8 60.8 69.7
Business 26.5 32.0 31.0 17.3 14.7 16.3 Conventions 7.6 4.7 6.2 2.7 2.5 2.7 Visiting Friends & Relatives 11.4 7.7 8.5 7.3 7.5 3.5 Religious & Cultural 6.0 2.2 4.6 6.9 7.3 6.0 Others 0.9 0.9 1.1 11.1 7.3 1.8 Source: SLTDA, IMaCS Analysis

Travel and Tourism Industry in Sri Lanka 24
Duration of Stay
The duration of stay (excluding outlying years) has averaged 9-12 days over the past three
decades. In 2009, an estimated 25.7 percent of tourists stayed for 1-3 nights, while another 29.2
percent stayed for 4-7 nights. However, the proportion of tourists staying for 8-14 days,
generally, increased to 34.1 percent in 2009.
Exhibit 23: Period of Stay (Percentage Distribution)
Nights
Average
Stay
(Nights) 1-3 4-7 8-14 15-21 22-30 >31
1990 5.0 12.8 29.5 26.3 13.3 13.1 10.8
1991 4.5 12.2 26.9 23.8 15.2 17.4 11.4
1992 25.2 26.2 27.5 14.1 4.9 2.1 10.3
1993 19.6 30.0 30.6 12.2 4.1 3.5 10.6
1994 18.1 34.5 30.9 11.6 3.4 1.5 10.4
1995 20.4 38.5 27.5 8.2 3.4 2.0 10.0
1996 29.6 24.7 27.7 11.5 4.6 1.9 9.8
1997 26.1 24.4 30.8 13.0 4.5 1.2 10.1
1998 23.7 25.1 33.7 12.6 3.8 1.1 10.4
1999 20.4 27.1 37.8 11.1 2.7 0.9 10.3
2000 21.9 26.4 35.9 12.2 2.6 1.0 10.1
2001 23.3 26.8 34.5 12.0 2.5 0.9 9.9
2002 22.6 27.0 34.7 12.1 2.6 1.0 10.1
2003 23.1 27.3 34.8 11.5 2.3 1.0 10.2
2004 23.8 27.6 34.1 11.8 1.9 0.8 10.1
2005 38.5 24.3 25.3 8.1 2.6 1.2 8.7
2006 28.3 26.4 32.2 10.2 1.8 1.1 10.4
2007 24.2 29.8 33.9 8.8 2.0 1.8 10.0
2008 26.4 28.7 33.2 8.7 1.8 1.2 9.5
2009 25.7 29.2 34.1 8.1 1.5 1.4 9.1
Source: SLTDA, IMaCS Analysis
In general, West Europeans stay longer than the average. North Americans and Australians also
record above average stays. By contrast, Asians make shorter visits to Sri Lanka. The Japanese
have a particularly short average stay. A large proportion of Japanese tourists make one-night
transit stopover in Colombo en-route to and from Maldives. The tendency of Europeans to stay
on for longer also explains why India accounts for the largest number of tourist arrivals and yet
ranks second in number of hotel nights spent in Sri Lanka. Travellers from the UK cumulatively
spend the highest number of tourist nights, followed by Indians.

Travel and Tourism Industry in Sri Lanka 25
Exhibit 24: Duration of Stay, Tourist Nights by Major Countries and Regions Average Duration of Stay
(Nights)
Tourist Nights
(thousands)
2007 2008 2009 2007 2008 2009
North America 10.7 12.0 10.7 301.11 271.75 265.89
Canada 10.8 13.8 11.3 128.11 134.48 121.87
US 10.5 10.2 10.1 173.00 137.27 144.08
Latin America and Caribbean 11.5 9.8 9.9 47.20 36.47 6.59
Western Europe 11.5 10.2 10.0 2,287.65 1,739.86 1,713.46
France 13.0 9.5 9.6 124.02 101.68 155.57
Germany 12.3 10.9 10.2 430.70 331.64 302.57
Italy 10.7 9.8 9.8 122.53 89.54 70.70
Netherlands 12.3 10.3 10.0 215.64 135.75 112.97
Switzerland 12.2 10.6 10.1 56.91 55.77 63.10
UK 11.5 10.5 10.2 1,082.02 846.10 829.71
Eastern Europe 12.0 7.9 8.0 261.57 232.57 200.67
Russia 12.0 8.2 8.5 162.36 129.81 96.82
Africa 9.6 9.1 7.9 28.71 21.42 12.57
Middle East 8.1 7.6 7.5 110.06 126.93 178.66
Asia 7.8 7.9 7.8 1,640.17 1,452.29 1,403.60
China 8.0 7.6 8.0 83.30 76.11 68.59
Japan 8.5 7.7 8.6 121.33 81.45 83.08
Malaysia 8.4 8.2 8.6 55.99 41.17 30.92
Singapore 7.7 7.6 7.5 43.82 43.34 59.82
India 8.1 8.1 7.9 857.84 718.12 657.83
Maldives 9.2 9.4 9.2 271.86 295.71 292.31
Australasia 11.5 11.5 10.2 263.62 284.21 294.35
Australia 11.5 13.6 11.5 232.77 260.37 266.50
Total 10.0 9.5 9.1 4,940.08 4,165.51 4,075.80
Source: SLTDA, IMaCS Analysis
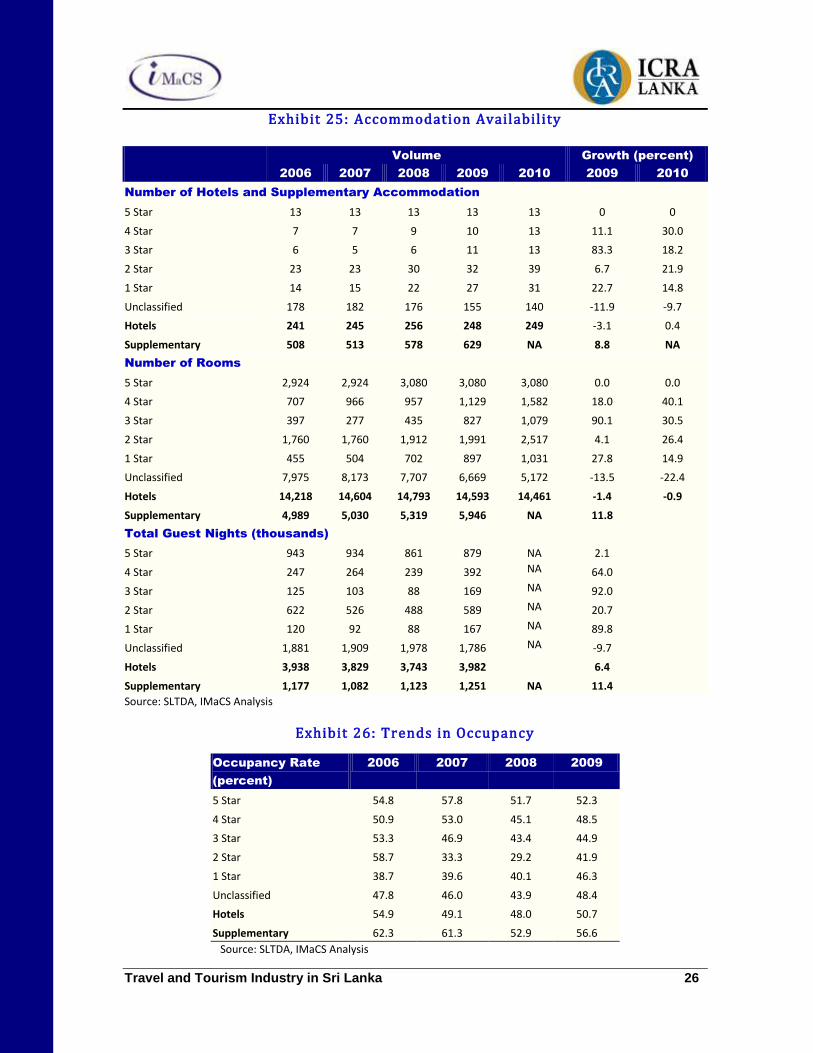
Travel and Tourism Accommodation
Sri Lanka offers a range of accommodation, from hotels and motels to individual guest houses,
self-catering and other forms of private accommodation. According to the SLTDA, at the end of
2010, the country had 249 registered hotels providing a total of 14,461 rooms. During 2009 and
2010, the authorities degraded a number of tourist hotel properties. However, the supply of
supplementary accommodation units such as guest-houses, motels, and inns increased by 51
additional units, from 578 in 2008 to 629 in 2009. Room occupancy rates increased 4.5
percentage points over 2009 to reach 48.4 percent.
Travel and Tourism Industry in Sri Lanka 26
Exhibit 25: Accommodation Availability Volume Growth (percent)
2006 2007 2008 2009 2010 2009 2010
Number of Hotels and Supplementary Accommodation
5 Star 13 13 13 13 13 0 0
4 Star 7 7 9 10 13 11.1 30.0
3 Star 6 5 6 11 13 83.3 18.2
2 Star 23 23 30 32 39 6.7 21.9
1 Star 14 15 22 27 31 22.7 14.8
Unclassified 178 182 176 155 140 -11.9 -9.7
Hotels 241 245 256 248 249 -3.1 0.4
Supplementary 508 513 578 629 NA 8.8 NA
Number of Rooms
5 Star 2,924 2,924 3,080 3,080 3,080 0.0 0.0
4 Star 707 966 957 1,129 1,582 18.0 40.1
3 Star 397 277 435 827 1,079 90.1 30.5
2 Star 1,760 1,760 1,912 1,991 2,517 4.1 26.4
1 Star 455 504 702 897 1,031 27.8 14.9
Unclassified 7,975 8,173 7,707 6,669 5,172 -13.5 -22.4
Hotels 14,218 14,604 14,793 14,593 14,461 -1.4 -0.9
Supplementary 4,989 5,030 5,319 5,946 NA 11.8
Total Guest Nights (thousands)
5 Star 943 934 861 879 NA 2.1
4 Star 247 264 239 392 NA 64.0
3 Star 125 103 88 169 NA 92.0
2 Star 622 526 488 589 NA 20.7
1 Star 120 92 88 167 NA 89.8
Unclassified 1,881 1,909 1,978 1,786 NA -9.7
Hotels 3,938 3,829 3,743 3,982 6.4
Supplementary 1,177 1,082 1,123 1,251 NA 11.4
Source: SLTDA, IMaCS Analysis
Exhibit 26: Trends in Occupancy
Occupancy Rate
(percent)
2006 2007 2008 2009
5 Star 54.8 57.8 51.7 52.3
4 Star 50.9 53.0 45.1 48.5
3 Star 53.3 46.9 43.4 44.9
2 Star 58.7 33.3 29.2 41.9
1 Star 38.7 39.6 40.1 46.3
Unclassified 47.8 46.0 43.9 48.4
Hotels 54.9 49.1 48.0 50.7
Supplementary 62.3 61.3 52.9 56.6
Source: SLTDA, IMaCS Analysis

Travel and Tourism Industry in Sri Lanka 27
Exhibit 27: Trends in Guest Nights in Hotels and
Supplementary Accommodations Foreign Domestic
Hotels Supplementary Total Hotels Supplementary Total
1999 3,837 211 4,047 610 263 874
2004 4,394 350 4,744 969 402 1,372
2005 2,858 392 3,249 818 474 1,292
2006 3,134 681 3,815 806 496 1,302
2007 2,778 599 3,377 1,051 497 1,548
2008 2,763 701 3,464 979 422 1,401
2009 2,818 779 3,598 1,163 472 1,635
Source: SLTDA, IMaCS Analysis
In 2010, the overall annual hotel room occupancy rates increased to a record level of 70.1
percent, representing an increase of 21.7 percentage points. This was due to the unprecedented
demand for hotel rooms, coming from both the domestic as well as foreign tourists.
Exhibit 28: Annual Occupancy Rate in Sri Lanka’s Hotels
Source: SLTDA, IMaCS Analysis
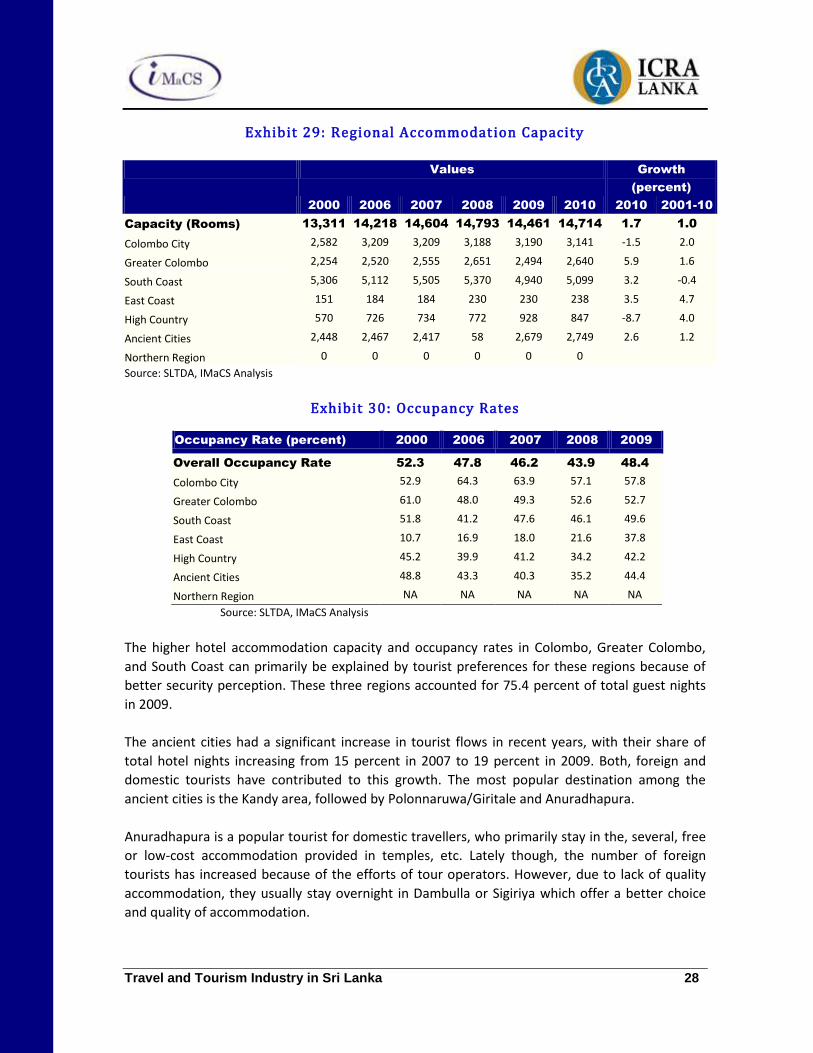
In 2009, the room capacity distribution in graded accommodations was 34.2 percent in the South
Coast region, 22.1 percent in the Colombo City region, 18.5 percent in the Ancient Cities region,
17.2 percent in Greater Colombo region, 6.4 percent in the High Country region, and only 1.6
percent in the East Coast regions. Since the 1980s, tourism in the Eastern, Uva, and North Central
region has languished, without significant investment in tourism.
57.8%
47.2%
48.4%55.3%
57.0%
56.6%
52.6%
40.3%
49.1%
52.8%
57.6%
52.3%
42.1%
43.1%
53.2%
59.3%
45.4%
47.8%
46.2%
43.9%
48.4%
70.1%
20%
30%
40%
50%
60%
70%
80%
1980 1991 1993 1995 1997 1999 2001 2003 2005 2007 2009
Travel and Tourism Industry in Sri Lanka 28
Exhibit 29: Regional Accommodation Capacity Values Growth
(percent)
2000 2006 2007 2008 2009 2010 2010 2001-10
Capacity (Rooms) 13,311 14,218 14,604 14,793 14,461 14,714 1.7 1.0
Colombo City 2,582 3,209 3,209 3,188 3,190 3,141 -1.5 2.0
Greater Colombo 2,254 2,520 2,555 2,651 2,494 2,640 5.9 1.6
South Coast 5,306 5,112 5,505 5,370 4,940 5,099 3.2 -0.4
East Coast 151 184 184 230 230 238 3.5 4.7
High Country 570 726 734 772 928 847 -8.7 4.0
Ancient Cities 2,448 2,467 2,417 58 2,679 2,749 2.6 1.2
Northern Region 0 0 0 0 0 0
Source: SLTDA, IMaCS Analysis
Exhibit 30: Occupancy Rates
Occupancy Rate (percent) 2000 2006 2007 2008 2009
Overall Occupancy Rate 52.3 47.8 46.2 43.9 48.4
Colombo City 52.9 64.3 63.9 57.1 57.8
Greater Colombo 61.0 48.0 49.3 52.6 52.7
South Coast 51.8 41.2 47.6 46.1 49.6
East Coast 10.7 16.9 18.0 21.6 37.8
High Country 45.2 39.9 41.2 34.2 42.2
Ancient Cities 48.8 43.3 40.3 35.2 44.4
Northern Region NA NA NA NA NA
Source: SLTDA, IMaCS Analysis
The higher hotel accommodation capacity and occupancy rates in Colombo, Greater Colombo,
and South Coast can primarily be explained by tourist preferences for these regions because of
better security perception. These three regions accounted for 75.4 percent of total guest nights
in 2009.
The ancient cities had a significant increase in tourist flows in recent years, with their share of
total hotel nights increasing from 15 percent in 2007 to 19 percent in 2009. Both, foreign and
domestic tourists have contributed to this growth. The most popular destination among the
ancient cities is the Kandy area, followed by Polonnaruwa/Giritale and Anuradhapura.
Anuradhapura is a popular tourist for domestic travellers, who primarily stay in the, several, free
or low-cost accommodation provided in temples, etc. Lately though, the number of foreign
tourists has increased because of the efforts of tour operators. However, due to lack of quality
accommodation, they usually stay overnight in Dambulla or Sigiriya which offer a better choice
and quality of accommodation.

Travel and Tourism Industry in Sri Lanka 29
The East Coast tourism has also picked up since 2008. The main tourism location is Trincomalee
with the Nilaveli and Uppuveli beaches. During the ceasefire period of the early-2000s, tourist
visits had recovered on the East Coast, and a number of small guesthouses had opened to cater
to this increase in demand. However, the tsunami of December 2004 destroyed many hotels and
tourism facilities in the area. With the revival in tourism from 2009, many are now being rebuilt.
Exhibit 31: Trends in Guest Nights by Tourist Destinations Nights (thousands) Growth (percent)
2005 2006 2007 2008 2009 2008 2009 2007-09
Total Guest Nights 3,676 3,940 3,829 3,743 3,982 -2.2 6.4 0.3
Colombo City 1,107 1,009 983 889 940 -9.6 5.8 -2.3
Greater Colombo 667 732 811 772 820 -4.8 6.1 3.9
South Coast 869 1,291 1,274 1,323 1,241 3.8 -6.1 -1.3
East Coast 33 18 18 20 53 12.1 160.1 44.1
High Countries 211 188 163 137 179 -15.9 30.7 -1.7
Ancient Cities 788 702 579 601 749 3.8 24.5 2.2
Northern Region 0 0 0 0 0 - - -
Foreign Guest Nights 2,858 3,134 2,778 2,763 2,818 -0.5 2.0 -3.5
Colombo City 966 862 782 709 759 -9.4 7.1 -4.2
Greater Colombo 518 582 589 576 602 -2.3 4.6 1.1
South Coast 666 1,041 994 1,034 916 4.0 -11.4 -4.2
East Coast 21 14 10 12 26 16.8 116.4 24.2
High Countries 141 132 76 73 93 -4.0 26.3 -11.0
Ancient Cities 547 504 325 360 423 10.8 17.6 -5.7
Northern Region 0 0 0 0 0 - - -
Domestic Guest
Nights 818 806 1,051 979 1,163 -6.8 18.8 13.0
Colombo City 141 148 201 180 181 -10.0 0.6 7.1
Greater Colombo 150 149 222 197 218 -11.4 10.5 13.3
South Coast 203 251 280 289 326 3.2 12.8 9.1
East Coast 13 4 8 8 27 6.0 224.0 87.6
High Countries 70 57 86 64 86 -26.4 35.7 15.0
Ancient Cities 241 197 254 241 325 -5.1 34.7 18.1
Northern Region 0 0 0 0 0 - - -
Graded Accommodation Establishments only Sources: SLTDA, IMaCS Analysis
Although foreign tourists generally prefer hotels vis-à-vis supplementary facilities, the share of
hotels in foreign tourist nights declined from 95 percent in 2003 to 78 percent in 2009.
Conversely, the share of supplementary accommodation has increased from 5 percent in 2003 to
22 percent in 2009. Further, because of the global economic slowdown, while 5-star hotels
reported a decline in foreign guest nights, other categories reported higher shares of foreign
guest nights. Unclassified hotels reported a 3.6 percent increase in foreign guest nights in 2008,

Travel and Tourism Industry in Sri Lanka 30
followed by a decline of 9.7 percent in 2009.
Exhibit 32: Share of Various Accommodation Categories 2003 2004 2005 2006 2007 2008 2009
Total Guest Nights 100 100 100 100 100 100 100
Hotels 88.9 87.6 80.9 77.0 78.0 76.9 76.1
5 Star 21.5 20.1 22.9 18.4 19.0 17.7 16.8
4 Star 6.6 5.2 4.8 4.9 5.4 4.9 7.5
3 Star 3.1 3.3 2.8 2.4 2.1 1.8 3.2
2 Star 15.3 13.8 11.9 12.2 10.7 10.0 11.3
1 Star 3.1 2.8 2.4 2.3 1.9 1.8 3.2
Unclassified 39.4 42.4 36.2 36.8 38.9 40.7 34.1
Supplementary 11.1 12.4 19.1 23.0 22.0 23.1 23.9
Foreign Guest Nights 100 100 100 100 100 100 100
Hotels 94.7 92.6 87.9 82.2 82.3 79.8 78.3
5 Star 24.7 23.2 28.4 22.0 23.5 21.5 20.6
4 Star 6.5 5.5 4.8 4.8 5.6 5.0 8.0
3 Star 3.1 3.5 3.0 2.6 2.3 2.0 3.5
2 Star 15.8 14.5 12.7 12.8 10.8 10.1 11.6
1 Star 2.3 2.5 1.8 1.9 1.2 1.3 2.9
Unclassified 42.3 43.5 37.2 37.9 38.9 39.9 31.8
Supplementary 5.3 7.4 12.1 17.8 17.7 20.2 21.7
Domestic Guest Nights 100 100 100 100 100 100 100
Hotels 65.9 70.2 63.3 61.9 68.5 69.9 71.1
5 Star 8.7 9.6 9.0 8.0 9.1 8.3 8.4
4 Star 7.2 4.3 4.9 4.9 4.9 4.8 6.3
3 Star 3.1 2.6 2.2 1.9 1.6 1.3 2.7
2 Star 13.3 11.1 9.7 10.2 10.6 9.9 10.5
1 Star 6.1 3.9 4.0 3.5 3.4 3.0 3.8
Unclassified 27.5 38.7 33.5 33.3 38.9 42.6 39.3
Supplementary 34.1 29.8 36.7 38.1 31.5 30.1 28.9
Source: SLTDA, IMaCS Analysis
While domestic tourists have traditionally preferred to stay with relatives, friends or secondary
homes as the hotel accommodation has improved, a higher proportion of domestic travellers
have started to prefer them vis-à-vis supplementary accommodation. The share of such travellers
in total guest nights at hotels has increased from 18 percent in 2004 to 29 percent in 2009.
Among the hotels, lower category (1- and 2-star) and unclassified hotels accounted for nearly 75
percent of domestic hotel nights in 2009. This proportion was 59 percent for foreign guest nights.

Travel and Tourism Industry in Sri Lanka 31
Exhibit 33: Share of Domestic Travellers in Total Guest Nights of Hotels
Source: SLTDA, IMaCS Analysis
Exhibit 34: Distribution of Domestic and Foreign Travellers in Total Guest Nights
Source: SLTDA, IMaCS Analysis
The trend towards low-cost accommodation has resulted in hotel-guest nights increasing at a 3-
year CAGR of 0.3 percent to 3.98 million nights in 2009. By comparison, guest nights in
supplementary accommodation increased at a 3-year CAGR of 2.1 percent to 1.25 million nights.
However, there was a decline in foreign-guest nights at higher category hotels, especially, the 5-
star hotels. This was compensated by a substantial increase in domestic-guest nights across all
0%
5%
10%
15%
20%
25%
30%
35%
200
400
600
800
1,000
1,200
1,400
1995 1997 1999 2001 2003 2005 2007 2009
Guest Nights at Hotels (thousands)-LS
Share of Total Hotel Guest Nights-RS
60%
65%
70%
75%
80%
85%
90%
95%
100%
1995 1996 1997 1998 1999 2000 2001 2002 2003 2004 2005 2006 2007 2008 2009
Total Foreign
Domestic

Travel and Tourism Industry in Sri Lanka 32
categories of hotels. While domestic guest nights at 5-star hotels increased at a 3-year CAGR of
9.7 percent, the other categories reported higher increases. Consequently, the share of 5-star
and 4-star hotels in domestic guest nights decreased from 15.8 percent in 2003 to 14.8 percent in
2009. Overall, the highest growth in guest nights was reported by 4-star, 3-star, and 1-star hotels.
Unclassified accommodations reported a decline.
Exhibit 35: Trends in Guest Nights by Hotel Type Nights (thousands) Growth (percent)
2005 2006 2007 2008 2009 2008 2009 2007-
09
Total Guest Nights 4,541 5,117 4,911 4,866 5,233 -0.9 7.5 0.7
Hotels 3,676 3,940 3,829 3,743 3,982 -2.2 6.4 0.3
5 Star 1,039 943 934 861 879 -7.8 2.1 -2.3
4 Star 218 249 264 239 392 -9.6 64.1 16.4
3 Star 127 125 103 88 169 -14.7 92.0 10.5
2 Star 538 622 526 488 589 -7.3 20.7 -1.8
1 Star 111 120 92 88 167 -4.5 89.1 11.6
Unclassified 1,643 1,881 1,909 1,978 1,786 3.6 -9.7 -1.7
Supplementary 866 1,177 1,082 1,123 1,251 3.8 11.4 2.1
Foreign Guest Nights 3,249 3,815 3,377 3,464 3,598 2.6 3.8 -1.9
Hotels 2,858 3,134 2,778 2,763 2,818 -0.5 2.0 -3.5
5 Star 922 839 795 745 741 -6.2 -0.6 -4.0
4 Star 154 185 188 172 288 -8.8 67.8 16.0
3 Star 99 100 79 70 125 -10.7 77.7 7.6
2 Star 414 489 363 349 417 -4.0 19.5 -5.2
1 Star 59 74 40 46 104 14.5 127.4 12.0
Unclassified 1,209 1,447 1,313 1,382 1,143 5.3 -17.2 -7.6
Supplementary 392 681 599 701 779 17.1 11.1 4.6
Domestic Guest
Nights 1,292 1,302 1,534 1,401 1,635 -8.7 16.7 7.9
Hotels 818 806 1,051 979 1,163 -6.8 18.8 13.0
5 Star 117 105 139 116 138 -16.7 18.8 9.7
4 Star 63 64 76 67 104 -11.5 54.6 17.5
3 Star 28 25 24 18 44 -27.7 149.1 21.3
2 Star 125 133 163 139 172 -14.4 23.6 8.9
1 Star 52 46 52 42 63 -18.9 47.9 11.1
Unclassified 433 434 596 597 643 0.1 7.7 14.0
Supplementary 474 496 483 422 472 -12.7 11.8 -1.7
Source: SLTDA, IMaCS Analysis
Key Market Trends
Sri Lanka has mixed public and private participation in tourism. The airlines, the railways, and
some hotel facilities are government-owned and operated. A majority of accommodations,
facilities and tourism services in Sri Lanka are owned and operated by the private sector. Further,
Travel and Tourism Industry in Sri Lanka 33
domestically-owned business has thrived even in the face of competition from international
hotel-chain brands such as Hilton, Taj, Holiday Inn, Hyatt and Ramada. Some major international
chains such as Marriott and Intercontinental left Sri Lanka in the wake of rising violence. This
provided Sri Lankan investors with the opportunity and challenge of managing their own lodging
and hospitality enterprises and several firms have successfully evolved into full-service hotel
operators and tourism service providers. Firms such as Aitken Spence, Jetwing Group, John Keells
Holdings and Serendib have created their own hotel chains, served by their own travel agencies,
tour operators and transportation fleets of buses and vans.
In line with an industry goal to `move beyond beaches’ into higher value added and specialised
products, there has been an expansion of lodging services and companies specialising in eco-
adventure and nature-based products. They include larger holding companies such as the Jetwing
Group and John Keells/Walkers Tours who have invested in developing nature-focused hotel
products and tour packages to attract both domestic and international tourists. Walkers Tours
claims to be Sri Lanka’s premier destination management company, handling over 20 percent of
the total organised tourist arrivals to the country. It operates a large tourist transport fleet in the
island, consisting of cars, mini vans, mini and large coaches.
Sri Lanka could also benefit from its bid for the Commonwealth Games in 2018. Two cities are
presently bidding to host the Games - Gold Coast in Australia and Hambantota in Sri Lanka. The
winning bid will be announced in Basseterre, St Kitts on November 11, 2011. Recently, Marriot
and Hyatt have prospected for land in Hambantota to build hotels. The two chains could build
hotels of 200 rooms each in Hambantota which will form part of a 'sports city' if Sri Lanka wins
the Commonwealth Games bid. The sports city is expected to have a requirement of 4,000
rooms. Hambantota is a coastal city and was devastated by the December 2004 tsunami, and is
presently undergoing major reconstruction. The first phase of the Port of Hambantota is nearing
completion and it is funded by the Government of China. The Mattala International Airport is also
being built close to Hambantota.
Major Projects Planned
Given Sri Lanka’s history of civil war and the need for the nation to rebuild a great deal of tourism
infrastructure, including hotels, it is expected witness a steady growth in the accommodation
sector over the medium-term. Sri Lanka is also regarded as a low-cost luxury destination, which
should enable it to attract tourists from India, South Asia, and countries in the Pacific and
Oceania.
More up-market hotels are being planned and built by foreign investors and it is expected that
they will help Sri Lanka regain the competitive position it lost to countries such as Thailand and
Malaysia.
Surveys by the United Nations Conference on Trade and Development (UNCTAD) have indicated
that domestic investors in Sri Lanka claim that the absence of foreign direct investment (FDI) in
recent years explains the lack of investment and renovation of its top hotels. It has been argued

Travel and Tourism Industry in Sri Lanka 34
that the signal created by the presence of well-known international hotel chains would have a
positive spill over effect on other areas of investment. Respondents have stated that if
international companies showed even a slight interest, the industry could be stimulated
tremendously. Increased interest from international hotel chains and foreign investors has also
been reported to have a positive impact on the quality of accommodation services, in addition to
quantity. For example, hotels in Colombo have, typically, lacked capital for reinvestment in
refurbishment, which has led many hotels cutting prices, significantly, and thus earning even less
profits for reinvestment.
Taj Hotels & Resorts has significant plans to expand its operations in Sri Lanka. The Taj Samudra, a
300 room hotel in Colombo, is expected to be upgraded to a 5-star hotel with an investment of
around US$25-30 million. In addition, the Taj Group also manages two hotels in Sri Lanka, one
near the island’s main airport in Katunayake and another on the South West coast. The property
in Katunayake, previously known as `Taj Airport Garden Hotel’ was recently re-launched as a
business hotel, ‘The Gateway Hotel’ brand, making it the brand’s first international hotel. The
hotel on the South West coast is a 160 room resort and was re-branded as 'Taj Vivanta Bentota'
in September 2010.
In January 2011, Hong Kong-based Shangri-La Asia Limited announced the purchase of six acres of
government land facing the Galle Face green promenade, a prominent landmark in Colombo. The
development will be a multi-use complex with high-end retail facilities, deluxe apartments and a
500-key luxury hotel to open in early 2014. This marks the entry of the hotel group into Sri Lanka.
Shangri-La is also planning to develop a second property by 2013, a 300-key city resort on
approximately 100 acres of land in Hambantota.
Local players are also considering fresh investments in hotels. In September 2010, Lanka Business
Online reported that Renuka Holdings was considering the development of property it owns in
the North and East of Sri Lanka into tourist resorts.
In July 2011, it was announced that on a proposal by the Minister of Economic Development, a
large scale integrated tourism city will be built in Katana. The city will be known as `Katana City’
and will be built on a state land of 80 hectares (ha). The project will comprise four 5-star hotels
with a total number of 2,300 rooms, exhibition and convention centre, two shopping malls and
other such facilities. The envisaged foreign direct investment for Phase-1 is US$1.5 billion.
The North and East of the island are expected to receive more investments in hotel properties. In
late 2009, the SLTDA approved the construction of several new hotels along the island’s East
Coast. Three zones are, reportedly, being prioritised for tourism development:
Kuchchaveli, north of the Eastern port of Trincomalee
Kalpitiya on the West Coast
Pasikudah, in Batticaloa district
In August 2010, Sri Lanka’s Board of Investment (BOI) granted approval to Seashells Hotels
Limited of Maldives to refurbish and upgrade their hotel named `Blue Continent’, and establish a

Travel and Tourism Industry in Sri Lanka 35
new resort in Pasikudah. The project representing an investment of US$3.3 million will refurbish
and upgrade the hotel to provide facilities such as spa, an additional pool and conference
facilities. The number of rooms will also increase to 84. In addition, a 150-room tourist resort will
be constructed at Passikudah in Batticaloa, at an investment of US$6 million. The resort is
expected to be open in 2012.
Planned Targets
The Ministry of Economic Development has prepared a report titled, `Tourism Development
Strategy 2011-2016’. According to the report, the private sector is expected to launch an
ambitious programme to double hotel room capacity from around 23,000 rooms at present to
45,000 by 2016 so to accommodate 2.5 million annual arrivals. The other key objectives will be
to:
Increase foreign exchange earnings from US$501 million in 2010 to US$2.75 billion in 2016
Increase international tourist arrivals from 0.65 million to 2010 to 2.5 million by 2016
increase tourism employment to 500,000 by 2016
Attract US$3 billion in FDI within the next five years
Position the country as one of the most attractive destinations in the world
To increase the pace of construction of hotel rooms, the Government plans to set up a `one-stop
shop’, at the SLTDA, for tourism related investment projects with the cooperation of the Board of
Investment, Urban Development Authority, the Coast Conservation Department and other line
agencies. This move is expected to significantly reduce the time required for obtaining
investment approvals.
The SLTDA has also had discussions with Sri Lanka Railways to promote train travel by
modernising the tracks and carriages and laying rail tracks closer to the major tourist attractions.
The report also highlights some of the criteria for attracting high spending tourists. The three
primary areas that need attention are:
Segmenting the market and identifying the target tourists
Enhancing marketing activities through communications
Introducing promotional activities for facilitating the visits
Mahinda Chi ntana
The “Mahinda Chintana” is a socio-economic development policy adopted in Sri Lanka in
November 2005. The policy framework under the “Mahinda Chintana” has been aimed at the
following:
Resolving the prolonged conflict
Implementing large infrastructure development initiatives consisting of electricity generation,
ports, airports, water supply, irrigation, roads, transport
Revitalizing agriculture and domestic enterprises
Strengthening public services and state owned enterprises
Promoting private sector and small and medium enterprises (SME)
Implementing integrated development initiatives for empowering villages (Gama Neguma).

Travel and Tourism Industry in Sri Lanka 36
In 2010, the Sri Lankan Ministry of Finance and Planning and Department of National Planning,
released a new `Mahinda Chintana’: Sri Lanka’s new development strategy for higher economic
growth and better quality in each sector.
TRANSPORT INFRASTRUCTURE
Transportation within Sri Lanka is possible on road, railway, water and domestic air, though road
transport plays a major role. There is also a widespread railway network covering a large portion
of Sri Lanka. However, it is inadequate, in poor condition and not widely used for passenger
transportation. Natural and synthetic sea harbours are, largely, used for transporting cargo.
Inland rivers and lakes are used for tourism and long haul transportation between cities.
Civi l Avi at ion
There are 23 airports in Sri Lanka, with only the Bandaranayake International Airport (BIA) at
Katunayake, 35 Km North of Colombo being of significant size. It is the only international airport
in Sri Lanka. It is administered by Airport and Aviation Services (Sri Lanka) Ltd. It handled 4.24
million passengers in 2009, slightly lower than 4.84 million in 2007. The airport presently provides
connectivity to 36 destinations in 20 countries with over 25 airlines and handles 3,354 monthly
scheduled flights, excluding charter flights. The single runway has a capacity of 42,000 aircraft
movements a year.
In April 2011, the airport announced the acquisition of 100 ha of land to build a parallel runway
required to handle growing aircraft traffic that could soon lead to saturation of existing capacity.
The government has also planned a major expansion programme at the airport to the extent of
US$400 million to cater to 2.5 million tourist arrivals by 2015. The proposed expansion project
would also involve a second terminal to be built with modern facilities that are benchmarked to
the Shanghai International Airport in China. The projects consist of a 300-room transit hotel
inside the airport in addition to the existing 24 rooms.
In addition, a second international airport, The Mattala International Airport, is currently under
construction at Mattala in Hambantota district. Initial plans were to build an international airport
serving the south of Sri Lanka at Weerawila, but these plans were scrapped due to environmental
concerns. The site was then moved to Mattala, a small town located 15 km north of Hambantota.
The airport will be built with funding from China Harbour Engineering Corporation. The new
airport will have 3,500 ft. long runway of 75m width. The airport is expected to handle 1 million
passengers per annum. Anticipated aircraft movement rate is 30,000 per annum.
Construction on the first phase on 800 hectare of land with an estimated investment of US$209
million began in November 2009, and is expected to be complete by the end of 2012. The second
phase will be built on 1,200 ha. Under the first phase the following construction will be
undertaken:

Travel and Tourism Industry in Sri Lanka 37
Runway
Air traffic control tower
Apron
Taxiway passenger and cargo terminals
Access roads
Accommodation for officials
Fuel storage
Sewerage treatment plant
Water supply facilities
Meteorological building
Fire fighting facilities
Buildings for catering facilities
Car park
Under the second phase, construction of airport and aviation related facilities will be undertaken.
This work would include an aircraft servicing and a repairing centre, hotel and recreational
facilities, a pilot training centre, a maintenance hub, a private jet parking hub, technical training
centres, a full length parallel taxiway and other facilities.
In 2009, the Bandaranayake International Airport handled 99.9 percent of total international
arrivals to Sri Lanka. The balance 0.1 percent arrived by passenger ships. This share has remained
constant over the last decade.
Exhibit 36: Percentage Distribution of International Tourist Arrivals 2000 2005 2006 2007 2008 2009
Inter-regional 74.1 77.3 76.1 77.6 78.1 82.5
Intra-regional 18.8 21.6 22.9 20.6 18.8 16.2
Charter 7.1 1.0 0.9 1.7 3.0 1.2
Air 99.9 99.9 99.9 99.9 99.9 99.9
Passenger Ships 0.1 0.1 0.1 0.1 0.1 0.1
Total 100 100 100 100 100 100
Source: SLTDA, IMaCS Analysis
Six airlines - the national Sri Lankan Airlines (SLA), Emirates, Qatar Airways, Singapore Airlines,
Kingfisher, and Cathay Pacific - accounted for 81 percent of all international tourist arrivals by air
in 2009. SLA accounted for 45 percent of all tourist arrivals in 2009. However, the share of SLA
was substantially lower from 54 percent in 2005, primarily, because of higher share of Indian
carriers. The competition has increased in recent years from airlines operating from India and
South East Asian countries.

Travel and Tourism Industry in Sri Lanka 38
Exhibit 37: International Tourist Arrivals by Airlines
Thousands Growth
(percent)
Share
(percent)
2005 2006 2007 2008 2009 2009 2007-
09
2005 2009
Sri Lankan 295.0 311.6 283.0 220.2 200.6 -8.9 -13.6 53.7 44.8
Emirates 48.1 50.4 34.2 56.3 68.3 21.4 10.7 8.8 15.3
SIA 34.9 28.8 29.0 18.4 18.4 0.0 -13.9 6.3 4.1
Malaysian 15.7 7.1 4.5 3.7 10.0 174.2 12.1 2.9 2.2
Kingfisher 0.0 0.0 0.0 0.0 18.0 - - 0.0 4.0
Air Sahara 7.7 9.1 0.0 0.0 0.0 - - 1.4 0.0
Jet Airways 14.9 12.0 11.2 9.3 11.1 19.9 -2.6 2.7 2.5
Jet Lite 0.0 0.0 9.2 8.4 4.8 -42.8 0.0 1.1
Indian /Air India 15.7 16.7 10.7 11.3 14.5 27.7 -4.7 2.9 3.2
Qatar Airways 25.5 27.7 50.0 45.4 39.2 -13.7 12.3 4.6 8.7
Cathay Pacific 0.0 0.0 0.0 13.4 18.7 40.0 0.0 4.2
Thai Airways 11.4 11.0 8.7 7.9 5.2 -33.9 -22.0 2.1 1.2
Others 75.2 80.1 45.1 30.9 33.6 8.8 -25.1 13.7 7.5
Chartered 5.2 5.1 8.5 13.4 5.5 -59.3 2.2 1.0 1.2
Total 549.3 559.6 494.1 438.5 447.9 2.1 -7.2 100 100
Source: SLTDA, IMaCS Analysis
SLA carried 50,713 air travellers from India in 2009, compared with 86,303 in 2006. Its share of air
travellers from India has also decreased from 67 percent in 2005 to 61 percent in 2009.
Exhibit 38: Sri Lanka Airlines - Inbound Passengers Carried from Various Regions
Thousands Growth
(percent)
Share
(percent)
2005 2006 2007 2008 2009 2009 2007-09 2005 2009
North America 27.0 20.4 19.4 16.7 7.9 -53.1 -27.3 58.0 31.5
Latin America and
Caribbean 0.4 0.3 2.2 1.9 0.3 -86.4 -5.5 52.3 41.3
Western Europe 116.2 117.3 103.6 76.5 80.8 5.7 -11.7 51.2 47.5
Eastern Europe 2.5 6.0 8.6 8.0 10.1 25.6 19.0 27.3 38.4
Middle East 3.0 3.2 5.9 6.5 6.0 -6.5 23.3 29.7 25.4
Africa 1.1 1.9 0.9 0.8 0.2 -71.5 -51.1 46.2 13.9
Asia 133.0 151.6 132.6 100.7 85.8 -14.9 -17.3 59.5 49.1
Australasia 11.7 11.0 9.8 9.2 9.6 4.8 -4.3 39.5 36.8
Total 295.0 311.6 283.0 220.2 200.6 -8.9 -13.6 53.7 44.8
From India 76.3 86.3 75.4 54.1 50.7 -6.3 -16.2 67.3 60.6
Source: SLTDA, IMaCS Analysis

Travel and Tourism Industry in Sri Lanka 39
Rail Transport at ion
Sri Lanka’s railway network is largely inadequate to meet the transport needs of the country.
Presently the Sri Lankan Railway network consists of 1,447 kilometres covering 172 main stations
and around 161 minor stations. The railway lines run through some of the most scenic rail routes
in the world. In particular, the Main Line with a length of 291 km covering 78 stations, winds
through waterfalls, natural forest mountains, misty peaks and precipices, estates, pine forests,
bridges and peak level stations.
While Sri Lanka Railways (SLR) played a dominant role in the country’s transport sector until
1928, its share in passenger and freight transportation has decreased since then. The railways
continue to face serious competition from road transportation, and have been adversely affected
by the country’s civil war. Annually, around 7-8 percent of train services are cancelled and only an
estimated 30 percent arrive on time. Average travel speeds are low at 35-40 km/hr. At present,
the bus service, both the state and private, accounts for about 68 percent of total transportation
and carry about 1,728 million passengers per annum. In contrast, SLR carries about 98 million
passengers per annum, accounting for 5 percent of total passenger transportation. The remaining
27 percent is shared between sea, air and other modes of transport, carrying about 686 million
passengers per annum.
Road Transport at ion
Roads are the backbone of the transport sector in Sri Lanka. National roads carry around 68-70
percent of the transport traffic in Sri Lanka. However, uncontrolled roadside development, as
well as neglect and poor road maintenance have resulted in low travel speeds and poor service.
This discourages long distance traffic and hinders the spread of economic activities and
development in regions other than the Colombo Metropolitan Area (CMA).
The Ministry of Highways is the apex organisation in Sri Lanka for the development of the road
sector. It is responsible for the formulation of national policies, implementation strategies and
monitoring of the performance of the road sector, improving and maintaining the national road
network. The Road Development Authority (RDA) is the highway authority in the country and is
responsible for the maintenance and development of the National Highway Network, comprising
the Trunk (A Class) and Main (B Class) roads and the planning, design and construction of new
highways, bridges and expressways to augment the existing network.

Travel and Tourism Industry in Sri Lanka 40
Exhibit 39: Key Surface Transport Statistics of Sri Lanka
Values Growth (percent)
2005 2006 2007 2008 2009 2010 2010 2006-10
Road Kilometres (A&B Class) 11,661 11,773 11,902 11,919 11,919 11,923 0.0 0.4
New Registration of Motor
Vehicles 229,669 300,522 297,892 204,075 204,075 359,243 76.0 9.4
SLTB/Regional Bus Companies
Buses Operated (Daily Average) 3,828 3,801 4,127 4,247 4,482 4,441 -0.9 3.0
Passenger km (million) 12,871 12,871 14,694 15,080 15,131 16,274 7.6 4.8
Private Operator Buses 17,522 17,522 17,731 18,665 18,665 19,805 6.1 2.5
Sri Lanka Railways
Passenger km (million) 4,358 4,311 4,769 4,669 4,568 4,353 -4.7 0.0
Freight ton km (million) 135 138 133 121 113 163 44.2 3.8
Source: Central Bank of Sri Lanka, IMaCS Analysis SLTB: Sri Lanka Transport Board
Sri Lanka’s entire road network comprises National Highways (A & B), Provincial roads (C, D & E),
unclassified Local Authority roads and other roads maintained by several Government
Departments and State Sector Estate Agencies. As per the data available up to September end
2010, the total length of the National Highways maintained by the Central Government is
approximately 12,019 km.
Exhibit 40: Road Network in Sri Lanka
(in Kms)
Class
A
Class
B
Class
C
Class
D & E
Total
1995 4,220 6,908 8,457 5,900 25,485
2000 4,222 7,265 7,315 7160 25,962
2005 4,314 7,706 8,257 8.042 28,319
2006 4,219 7,553 9,565 5,412 26,750
2007 4,219 7,655 9,575 5,418 26,867
2008 4,219 7,670 9,552 5,546 26,988
2009 4,216 7,704 11,231 5,855 29,006
2010 4,219 7,800 11,429 6,185 29,634
Source: Compiled by IMaCS
Road transport network and quality of roads is better in the Western, Central, and Southern
regions. The Northern and Eastern regions have higher share of provincial (C, D, and E) class
roads. Weak transport infrastructure, particularly, outside the Central and Western Provinces,
has prompted most hotel operators to invest in and operate their own fleets of buses, vans and
automobiles. Domestic air transport has potential for development, but is an expensive option.
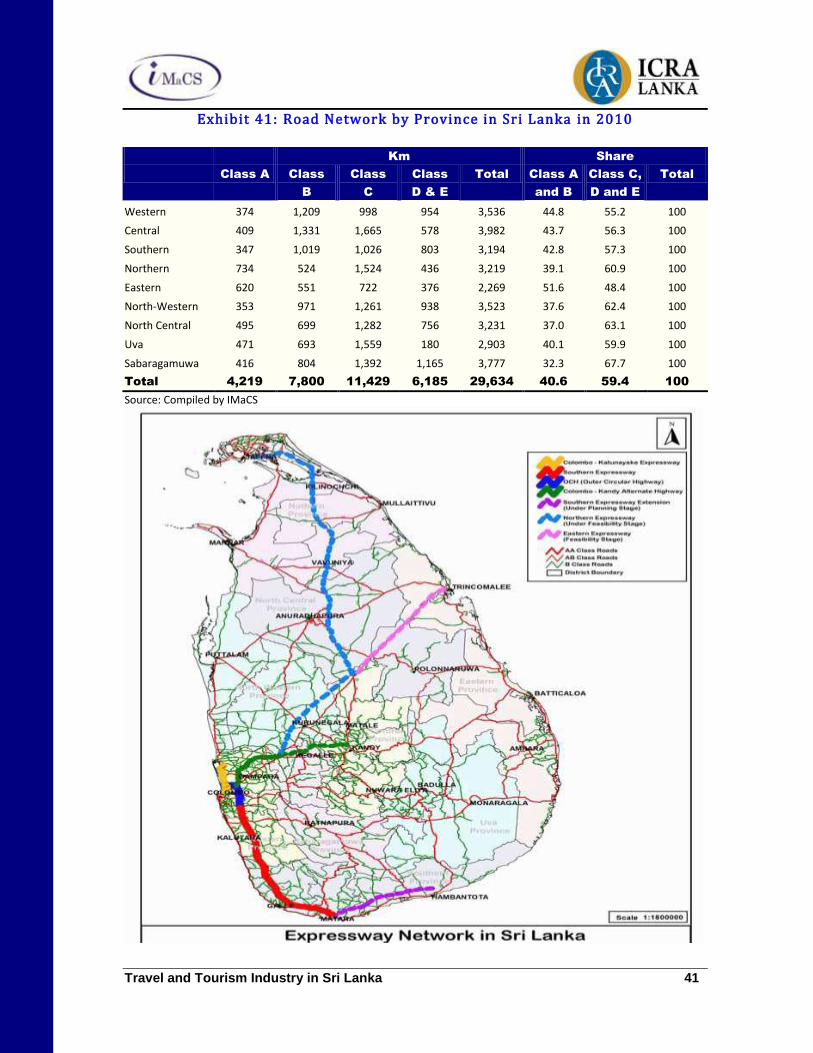
Travel and Tourism Industry in Sri Lanka 41
Exhibit 41: Road Network by Province in Sri Lanka in 2010 Km Share
Class A Class
B
Class
C
Class
D & E
Total Class A
and B
Class C,
D and E
Total
Western 374 1,209 998 954 3,536 44.8 55.2 100
Central 409 1,331 1,665 578 3,982 43.7 56.3 100
Southern 347 1,019 1,026 803 3,194 42.8 57.3 100
Northern 734 524 1,524 436 3,219 39.1 60.9 100
Eastern 620 551 722 376 2,269 51.6 48.4 100
North-Western 353 971 1,261 938 3,523 37.6 62.4 100
North Central 495 699 1,282 756 3,231 37.0 63.1 100
Uva 471 693 1,559 180 2,903 40.1 59.9 100
Sabaragamuwa 416 804 1,392 1,165 3,777 32.3 67.7 100
Total 4,219 7,800 11,429 6,185 29,634 40.6 59.4 100
Source: Compiled by IMaCS

Travel and Tourism Industry in Sri Lanka 42
GOVERNMENT AGENCIES
The government of Sri Lanka has been a strong proponent of tourism development for more than 40 years. The key central government agencies include:
Ministry of Tourism
Sri Lanka Tourism Development Authority (SLTDA)
Sri Lanka Tourism Promotion Bureau (SLTPB)
Sri Lanka Institute of Tourism and Hotel Management (SLITHM)
Sri Lanka Convention Bureau (SLCB) The principal organisation for tourism projects is the SLTDA of the Ministry of Tourism. The SLTDA
was formed as the apex body for Sri Lanka Tourism under Section 2 of the Tourism Act (No. 38 of
2005). The organisation (formerly, Ceylon Tourist Board/Sri Lanka Tourist Board/Sri Lanka
Tourism Board) aims to transform Sri Lanka into Asia’s foremost tourism destination. The SLTDA
seeks to develop diverse, unique and quality tourism services and products that would make Sri
Lanka a unique destination, globally. Some of its major activities include the following:
Identifying and developing tourist specific, unique products and services
Formulating and implementing Tourism Development Guidelines
Facilitating and implementing the legal and administrative process for new product and
service development.
For foreign investors, the key counterpart agency is the Board of Investment (BOI). The BOI had
its origins in the Greater Colombo Economic Commission, which was established in 1978 to
generate development in the outskirts of Colombo. In 1992, the Commission was reconstituted as
the Board of Investment of Sri Lanka (BOI) with its mandate encompassing the entire island. The
BOI is structured to function as a central facilitation point for investors. BOI’s mandate is to
improve the country’s investment climate. The agreements signed remains valid for the life of the
enterprise. Successive Governments cannot change these provisions, ensuring a degree of
stability.
Most of the tourist attractions are owned by the Government of Sri Lanka. They are managed
with the control of several Government ministries such as Cultural Affairs, Tourism and Natural
Resource Management. Additionally, Provincial Councils, Municipal Councils and Pradeshiya
Sabhas also engage in the management of tourism resources in the respective areas, which come
under their purview.
ECONOMIC OUTLOOK
Sri Lanka’s recent economic growth and long-term growth prospects have been boosted
substantially by the ending the civil war and acceleration of real GDP growth from 3.5 percent in
2009 to 8 percent in 2010. The growth was in all the three sectors: agriculture, industry and
services. Benefits derived because of the end of the insurgent conflict in 2009, improved business
and tourist confidence, greater availability of for agriculture and improving global economic
prospects underpin a strong performance in the future.

Travel and Tourism Industry in Sri Lanka 43
Exhibit 42: Summary Economic Data on Sri Lanka’s Economy Values Growth (percent)
2008 2009 2010 2008 2009 2010
Aggregates at Current Prices (LKR Billion)
GNP 4,305.65 4,779.50 5,530.46 21.6 11.0 15.7
GDP 4,410.68 4,835.29 5,602.32 23.2 9.6 15.9
Agriculture 590.11 613.69 716.89 41.1 4.0 16.8
Industry 1,295.47 1,434.70 1,649.14 21.0 10.7 14.9
Services 2,525.10 2,786.90 3,236.29 20.8 10.4 16.1
Aggregates at Constant (2002) Prices (LKR Billion)
GNP 2,309.17 2,420.95 2,611.50 4.6 4.8 7.9
GDP 2,365.50 2,449.21 2,645.43 6.0 3.5 8.0
Agriculture 285.90 295.10 315.64 7.5 3.2 7.0
Industry 672.79 701.13 760.22 5.9 4.2 8.4
Services 1,406.81 1,452.99 1,569.57 5.6 3.3 8.0
Per Capita GDP
Current Prices (LKR) 218,167 236,445 271,259 22.0 8.4 14.7
Current Prices (US$) 2,014 2,057 2,399 23.3 2.1 16.6
Constant (2002) Prices (LKR) 117,006 119,766 128,089 4.9 2.4 6.9
Per Capita GNP
Current Prices (LKR) 212,972 233,716 267,780 20.4 9.7 14.6
Current Prices (US$) 1,966 2,033 2,368 21.7 3.4 16.5
Constant (2002) Prices (LKR) 114,219 118,384 126,447 3.5 3.6 6.8
Selected Components in Current Prices (LKR Billion)
Private final consumption
expenditure 3,085.30 3,116.22 3,684.74 28.4 1.0 18.2
General government
consumption expenditure 713.79 851.55 872.61 30.6 19.3 2.5
Gross domestic fixed capital
formation 1,115.31 1,147.44 1,452.00 26.1 2.9 26.5
Exports of goods and non-
factor services 1,095.68 813.91 937.74 5.2 -25.7 15.2
Imports of goods and non-
factor services 1,699.33 1,172.62 1,528.17 20.2 -31.0 30.3
Annual average price
change (percent) 16.3 5.9 7.3
Exchange Rate (US$) 108 115 113 -1.1 6.1 -1.6
Population(million) 20.22 20.45 20.65 1.0 1.2 1.0
Source: Central Bank of Sri Lanka, IMaCS Analysis
Recent estimates by the International Monetary Fund (IMF) forecast Sri Lanka’s real GDP to grow
at 6.5 percent in 2011, followed by annual average growth of 6.5 percent from 2012 to 2015. The
agricultural sector is likely to be supported by increased cultivation in the formerly war-torn
Northern and Eastern provinces, although floods could impact output in 2011.
The recovery in consumer and business confidence is also expected to spur economic activity.

Travel and Tourism Industry in Sri Lanka 44
Continued and planned infrastructure- and tourism-related building will support construction
growth, while services, especially, hotels and restaurants, will perform well. However, rising
global food and oil prices and a shortfall in domestic supply of agricultural produce due to the
flooding could result in higher inflation.
Private consumption growth will be the main driver of economic expansion, fuelled by rising
incomes and remittances from expatriate Sri Lankans. Investment will be supported by the
following:
Reconstruction efforts in the North and the East.
Public spending on infrastructure, largely neglected during the civil war
Business investment
Competition for market shares
Exhibit 43: Estimates for Sri Lanka
Subject Units 2009 2010 2011 2012
Current account balance US$ billion -0.2 -1.8 -2.4 -2.9
Current account balance Per cent of GDP -0.5 -3.5 -4.1 -4.5
General government revenue LKR billion 701 812 964 1,165
General government revenue Per cent of GDP 14.5 14.5 14.9 15.9
General government total expenditure LKR billion 1,202 1,275 1,420 1,557
General government total expenditure Per cent of GDP 24.9 22.7 21.9 21.2
Population Million persons 20.24 20.40 20.54 20.68
GDP, current prices LKR billion 4,825 5,616 6,470 7,343
GDP, constant prices LKR billion 2,455 2,680 2,866 3,052
GDP, constant prices Per cent change 3.8 9.1 7.0 6.5
GDP, current prices US$ billion 41.98 49.68 58.00 64.05
GDP per capita, current prices US$ 2,074 2,435 2,824 3,097
GDP per capita, current prices LKR 238.4 275.3 315.0 355.1
GDP per capita, constant prices LKR 121.3 131.4 139.5 147.6
Gross national savings Per cent of GDP 24.8 22.3 23.3 23.9
Investment Per cent of GDP 25.3 26.6 27.2 28.0
Inflation, average consumer prices Per cent change 3.4 5.9 7.9 6.2
Import volume of goods and services Per cent change -7.0 24.0 7.7 10.1
Import volume of goods Per cent change -7.0 24.0 7.7 10.1
Export volume of goods and services Per cent change -18.3 17.5 8.6 7.5
Export volume of goods Per cent change -18.3 17.5 8.6 7.5
Source: IMF, IMaCS Analysis
On the investment front, several areas need to improve to secure an investment climate
conducive to large-scale private investments. The 10-year development plan, the Mahinda
Chintana, emphasises the need to improve the business environment more widely.
The World Bank’s Doing Business 2011 report ranks Sri Lanka at 102 out of 183 economies,
suggesting the need to eliminate bureaucratic red tape. It also includes recommendations for
strengthening institutions, building human resources capacity and simplifying procedures.

Travel and Tourism Industry in Sri Lanka 45
However, Sri Lanka ranks 3rd in South Asia, behind Pakistan and Maldives. Overall, while Sri Lanka
ranks 34th in `ease of doing business’, and 43rd in closing a business, it places among the worst in
terms of `dealing with construction permits’, `registering property’, and `paying taxes’. Sri Lanka
also ranks at 137th in `enforcing contracts’.
Exhibit 44: World Bank `Doing Business 2011’ Country Table for Sri Lanka
SRI LANKA South Asia GNI per capita (US$) 1,990 Ease of doing business (rank) 102 Lower Middle Income Population (m) 20.3
Starting a business(rank) 34 Getting Credit (rank) 72 Trading across borders 72
Procedures (number) 4 Strength of legal rights index(0-10) 4 Documents to export (number) 8
Time (days) 35 Depth of credit information index(0-6) 5 Time to export (days) 21
Cost (% of income per Capita) 5.4 Public registry coverage (5 of adults) 0 Cost to export (US$ per container) 715 Minimum capital (% of income per Capita) 0
Private bureau coverage (% of adults)
18.6
Documents to import (number) Time to import (days)
6 19
Cost to import(US$ per container) 745 Dealing with construction permits (rank) 169 Protecting investors (rank) 74
Procedures (number) 22 Extent of disclosure index (0-10) 4 Enforcing contracts (rank) 137
Time (days) 214 Extent of director liability index (0-10) 5 Procedures (number) 40 Cost (% of income per capita)
1,335.2
Ease of Shareholder suits index(0-10) Strength of investor protection index
7
Time (days) Cost (% of Claim)
1,318 22.8
(0-10)
5.3
Registering property (rank) 155
Closing a business (rank) 43
Procedures (number) 8 Paying taxes 166 Time (years) 1.7
Time (days) 83 Payments (number per year) 62 Cost (% of estate) 5
Cost (% of property value) 5.1 Time (hours per year) 256 Recovery rate (cents on the dollar) 47
Total Tax rate (% of profit)
64.7
Source: World Bank
TRAVEL AND TOURISM OUTLOOK
Sri Lanka is bestowed with some of the best natural endowments including a long coastline with
round the year sunshine, scenic hills and historic monuments. Coupled with a society that has a
high level of literacy and enterprise, Sri Lanka has all the necessary ingredients to be an
important destination on the global tourist map. The geographical location of the island nation is
also an added advantage, given its proximity to high growth economies in South Asia and South
East Asia.
The end of the ethnic conflict has already improved tourist inflows with 2010 witnessing a 46
percent increase resulting in a record tourist inflow of 654,477. Hotel occupancy rates also

Travel and Tourism Industry in Sri Lanka 46
increased from to a record 70.1 percent in 2010. These trends have continued into the first half
of 2011 with a 37 percent (yoy) growth in international tourist arrivals. Spending by domestic
tourists has also seen an increase in 2010. International tourist arrivals are forecast to increase by
15 percent and domestic spending on travel and tourism is also expected to increase by 6.5
percent in 2011.
Sri Lanka primarily attracts tourists from Asia and Europe. The largest contingent is from India
followed by the UK. Given the rate of growth of the Indian economy, the rising disposable
incomes, the propensity of Indians to travel abroad and the proximity factor, India is expected
continue as a key market for the Sri Lankan tourism industry. In addition to the leisure traveller,
Sri Lanka is also expected to post strong growth in the meetings, incentives and conferences
segment, which is presently a stronghold of the South East Asian countries.
WTTC estimates that the Sri Lanka tourism industry will generate 210,000 jobs directly in 2011
(2.7 percent of total employment). By 2015, the industry is forecast to generate 225,000 jobs, an
increase of 2.3 percent per annum over the period from 2011-15. Indirect employment will also
increase significantly and has the potential to exceed 350,000 jobs by the year 2015.
Both the government and the private sector are aware of the strategic advantages and have
begun to jointly invest in products and promotional efforts geared to attract tourists. For instance
the `Ramayana’ circuit covering sites featured in the ancient Hindu epic is being developed to
attract Indian tourists.
In order to harness the potential, it is imperative on part of the government and the travel and
tourism industry to focus on a few areas which will help in creating the right ecosystem. Some of
the key measures are:
Improvements are required in international air and domestic surface travel linkages
Significant improvements to energy infrastructure
Development of a island-wide road infrastructure with linkages to provincial and rural
locations
Clear policy on public private partnership and foreign investment participation in tourism
projects
Accelerate investment approval procedures
Streamline the regulatory processes which presently suffers from overlapping
jurisdiction by multiple authorities
Sri Lanka is well poised to exploit the enormous factor advantages that the country possesses by
adopting a pro-active strategy in inviting domestic and foreign investment in the tourism sector
and streamlining and simplifying the regulatory processes.

Travel and Tourism Industry in Sri Lanka 47
Intellectual Property Rights The Intellectual Property Rights of this document vest entirely with ICRA Lanka Limited (ICRA
Lanka) and ICRA Management Consulting Services Limited (IMaCS). None of the information
contained herein may be copied, otherwise reproduced, repackaged, further transmitted,
disseminated, redistributed, or resold, or stored for subsequent use for any purpose, in whole
or in part, in any form or manner or by means whatsoever, by any entity without prior written
permission of IMaCS or ICRA Lanka Media may, however, quote from this publication with
due acknowledgement to IMaCS and ICRA Lanka.