Trash Report Cover - Home Page | California State Water ... Rapid Trash Assessment Method Applied to...
55
A Rapid Trash Assessment Method Applied to Waters of the San Francisco Bay Region: Trash Measurement in Streams April 2007 2007 Final Technical Report
Transcript of Trash Report Cover - Home Page | California State Water ... Rapid Trash Assessment Method Applied to...

A Rapid Trash Assessment Method Applied to Waters of the San Francisco Bay Region: Trash Measurement in Streams
April 2007
2007 Final Technical Report

Table of Contents Introduction......................................................................................................................... 1
Trash and Water Quality Standards ................................................................................ 1 Assessment Method Development.................................................................................. 3 Water Quality Impacts of Trash...................................................................................... 4 Sources and Fate of Trash............................................................................................... 6
Methods............................................................................................................................... 6 Monitoring Design Considerations ................................................................................. 6 SWAMP Trash Monitoring Design ................................................................................ 7 Site Definition................................................................................................................. 7 Trash Data Collection ..................................................................................................... 8 Scoring ............................................................................................................................ 9 Quality Assurance......................................................................................................... 11
Results and Discussion ..................................................................................................... 11 Regional Conditions...................................................................................................... 11 Trash Deposition Rates ................................................................................................. 16
Wet Season Deposition............................................................................................. 16 Dry Season Deposition ............................................................................................. 17 Case Studies- High Trash Deposition Rates ............................................................. 21
1. Booker T. Anderson Park, Baxter Creek .......................................................... 21 2. Dow Wetlands, Kirker Creek............................................................................ 22 3. Washington and McDowell, Washington Creek (Petaluma River) .................. 23 4. Moss Rock, Stevens Creek ............................................................................... 24
Case Studies – Low Trash Deposition Rates ............................................................ 24 1. Dimond Park, Sausal Creek .............................................................................. 24 2. Joaquin Miller Park, Palo Seco Creek (Sausal Creek)...................................... 25
Longitudinal Trends Within Watersheds ...................................................................... 26 1. San Mateo Creek Watershed................................................................................. 26 2. Petaluma River Watershed.................................................................................... 27 3. Baxter Creek Watershed ....................................................................................... 29 4. Sausal Creek Watershed ....................................................................................... 29
Conclusions and Recommendations ................................................................................. 31 Acknowledgements........................................................................................................... 33 References......................................................................................................................... 35
Appendix A – Rapid Trash Assessment, Version 8 Appendix B – Rapid Trash Assessment Method Evaluation, October 2002 Appendix C – Raw RTA Trash Assessment Data Appendix D – Field Visit and Trash Collection Health and Safety SOPs This report was authored by Steven M. Moore, Matthew R. Cover and Anne Senter of the Regional Water Quality Control Board, San Francisco Bay Region, Surface Water Ambient Monitoring Program. Cover Photo of Peralta Creek at Cesar Chavez Park, Oakland, CA, by Anne Senter

A Rapid Trash Assessment Method Applied to Waters of the San Francisco Bay Region: January 20, 2007 Trash Measurement in Streams
Introduction Trash is a term used in water quality control, synonymous with litter, debris, rubbish and refuse. Trash is a regulated water pollutant that has many characteristics of concern to water quality. It accumulates in streams, rivers, bays, and ocean beaches throughout the San Francisco Bay Region of California, particularly in urban areas. Trash in streams can impair beneficial uses such as human health and aesthetic enjoyment (REC-2) and aquatic life. Trash in urban waterways of coastal areas can become “marine debris,” known to harm fish and wildlife and cause adverse economic impacts (Moore and Allen, 2000). Absent numeric guidelines or standard assessment methodologies, assessing trash levels and prioritizing water bodies for trash management remains a challenge for the California Regional Water Quality Control Board, San Francisco Bay Region (Water Board). This report documents a pilot effort conducted by the Surface Water Ambient Monitoring Program (SWAMP) to systematically assess trash levels in streams, which are sources of marine debris to the San Francisco Bay and Pacific Ocean. SWAMP staff developed a Rapid Trash Assessment (RTA) protocol for examining the amount and types of trash present in stream channels, the effects of trash on beneficial uses, and potential sources of trash. The goals of this report are to (1) describe a rapid trash assessment protocol and (2) provide a regional assessment of trash deposition in fresh waters of the San Francisco Bay Region. The objectives are to document (1) dry and wet weather trash deposition rates, (2) longitudinal variability within watersheds, and (3) variability across watersheds in urban settings. The Introduction of the report includes a discussion of the water quality impacts of trash and relevant water quality standards, and describes the impetus for the study. The Methods section describes the RTA methodology, sampling design considerations, and QA issues. In the Results and Discussion sections we present data on site scores, trash abundance, and types of trash, followed by a discussion of likely sources of trash and potential management measures. Results from year-round surveys of 26 sites around the San Francisco Bay Region are presented and discussed (Figure 1). Sites with the highest trash deposition rates in dry and wet weather conditions are presented as case studies in a discussion of sources of trash pollution and potential management actions.
Trash and Water Quality Standards Water quality standards consist of (1) designated beneficial uses for specific water bodies, (2) water quality objectives (narrative and/or numeric) to protect beneficial uses, and (3) the State’s Antidegradation Policy, which mandates the maintenance of high quality waters, preventing degradation to the minimally acceptable standard. Water quality standards for the San Francisco Bay Region are contained in the San Francisco Bay Region Water Quality Control Plan (Basin Plan). Trash adversely affects numerous beneficial uses of waters, particularly recreation and aquatic habitat. Not all litter and debris delivered to streams are of equal concern with
- - 1

A Rapid Trash Assessment Method Applied to Waters of the San Francisco Bay Region: January 20, 2007 Trash Measurement in Streams
regards to water quality. Besides the obvious negative aesthetic effects, most of the harm of trash in surface waters is imparted to wildlife in the form of entanglement or ingestion (Laist and Liffmann, 2000; McCauley and Bjorndahl, 1999). Some elements of trash exhibit significant threats to human health, such as discarded medical waste, human or
Figure 1 – Map of Trash Assessment Sites, San Francisco Bay Region SWAMP Program, 2003-2005
- - 2

A Rapid Trash Assessment Method Applied to Waters of the San Francisco Bay Region: January 20, 2007 Trash Measurement in Streams
pet waste, and broken glass (Sheavly, 2004). Also, some household and industrial wastes may contain toxic substances of concern to human health and wildlife, such as batteries, pesticide containers, and fluorescent light bulbs that contain mercury. Large trash items such as discarded appliances can present physical barriers to natural stream flow, causing physical impacts such as bank erosion. From a management perspective, the persistent accumulation of trash in a water body is of particular concern, and signifies a priority for prevention of trash discharges. Also of concern are trash “hotspots” where illegal dumping, littering, and/or accumulation of trash occur. The narrative water quality objectives applicable to trash are:
• Floating Material (Waters shall not contain floating material, including solids, liquids, foams, and scum, in concentrations that cause nuisance or adversely affect beneficial uses),
• Settleable Material (Waters shall not contain substances in concentrations that result in the deposition of material that cause nuisance or adversely affect beneficial uses), and
• Suspended Material (Waters shall not contain suspended material in concentrations that cause nuisance or adversely affect beneficial uses).
The Basin Plan prohibits discharge of rubbish and refuse to waters of the state (Table 4-1, Discharge Prohibitions, No. 7). This prohibition was adopted by the Water Board in the 1975 Basin Plan, primarily to protect recreational uses such as boating. Several water bodies in California are listed under Section 303(d) of the Clean Water Act (CWA) as impaired by trash, which means they are not meeting water quality standards. The 303(d) List includes Lake Merritt of Oakland as impaired by trash. In 2001, the Los Angeles Regional Water Board began adopting Total Maximum Daily Loads (TMDLs) for trash in its jurisdictional area, which established numeric targets of zero trash items in waterbodies including the Los Angeles River. The San Francisco Bay Regional Water Board keeps an informal “watch” list for impaired water bodies, and has placed trash in all urban creeks, lakes and shorelines on this list. As part of this action in November 2001, the Water Board identified the need for better information on trash assessment in order to discern which water bodies should be included on the 303(d) Impaired Water Bodies List.
Assessment Method Development Recognizing the need for assessment procedures to support 303(d) listing decisions, the staff of the Water Board developed, refined, and implemented a rapid trash assessment method from 2002 through 2005 as part of its Surface Water Ambient Monitoring Program (SWAMP) (Water Board, 2004, Appendix A). The method was refined through field experience and by conferring with representatives from local government and nonprofit groups. The method generates site-specific scores on a scale from 0 to 120, with higher scores indicating cleaner sites. The method also documents the number of pieces of trash per one hundred feet of stream or shoreline, and the rate of return of trash under different hydrologic conditions. This data can be used to identify problem areas
- - 3

A Rapid Trash Assessment Method Applied to Waters of the San Francisco Bay Region: January 20, 2007 Trash Measurement in Streams
where trash accumulates during dry weather due to littering or dumping and in wet weather due to accumulation from upstream sources, and to assess the effectiveness of targeted management measures. Trash assessment includes a visual survey of the water body (e.g., streambed and banks) and adjacent areas from which trash elements can be carried to the water body by wind, water, or gravity. The delineation of these adjacent areas is site-specific and requires some judgment and documentation. The rapid trash assessment worksheet is designed to represent the range of effects that trash has on the physical, biological, and chemical integrity of water bodies, in accordance with the goals of the CWA and the California Water Code. The worksheet also provides a record for evaluation of the management of trash discharges, by documenting sites that receive direct discharges (i.e., dumping or littering) and those that accumulate trash from upstream locations. The specific items on the tally sheet were determined based on common items retrieved during numerous pilot surveys. There is a need to systematically measure trash levels in Bay Area and California water bodies to establish baseline conditions, and evaluate the success of educational, institutional, operational and structural efforts to control trash. In some systems that behave as trash “catchments,” such as Lake Merritt, tons of trash removed may be an appropriate indicator to measure over time to gauge success, as long as it is measured consistently. The Water Board staff developed the rapid trash assessment method to provide such a systematic approach for non-catchment systems such as streams and shorelines, where “tons of trash removed” may not provide an accurate tracking mechanism. Trash weight can be a misleading indicator, since the trash of most concern to beneficial uses is small, buoyant and persistent (U.S. EPA, 2001).
Water Quality Impacts of Trash For aquatic life, buoyant (floatable) elements tend to be more harmful than settleable elements, due to their ability to be transported throughout the water body and ultimately to the marine environment. Persistent elements such as plastics, synthetic rubber and synthetic cloth tend to be more harmful than degradable elements such as paper or organic waste. Glass and metal are less persistent, even though they are not biodegradable, because wave action and rusting can cause them to break into smaller pieces that are less sharp and harmful. Natural rubber and cloth can degrade but not as quickly as paper (U.S. EPA, 2002). Smaller elements such as plastic resin pellets (a by-product of plastic manufacturing) and cigarette butts are often more harmful to aquatic life than larger elements, since they can be ingested by a large number of small organisms which can then suffer malnutrition or internal injuries. Larger plastic elements such as plastic grocery bags are also harmful to larger aquatic life such as sea turtles, which can mistake the trash for floating prey and ingest it, leading to starvation or suffocation. Floating debris that is not trapped and removed will eventually end up on the beaches or in the ocean, repelling visitors and residents from the beaches and degrading coastal and open ocean waters.
- - 4

A Rapid Trash Assessment Method Applied to Waters of the San Francisco Bay Region: January 20, 2007 Trash Measurement in Streams
Trash in water bodies can threaten the health of people who use them for wading or swimming. Of particular concern are the bacteria and viruses associated with diapers, medical waste (e.g., used hypodermic needles and pipettes), and human or pet waste. Additionally, broken glass or sharp metal fragments in streams can cause puncture or laceration injuries. Such injuries can then expose a person’s bloodstream to microbes in the stream’s water that may cause illness. Also, some trash items such as containers or tires can pond water and support mosquito production and associated risks of diseases such as encephalitis and the West Nile virus. Leaf litter is considered trash when there is evidence of intentional dumping. Leaves and pine needles in streams provide a natural source of food for organisms, but excessive levels due to human influence can cause nutrient imbalance and oxygen depletion in streams, to the detriment of the aquatic ecosystem. Other biodegradable trash, such as food waste, also exerts a demand on dissolved oxygen, but aquatic life is unlikely to be adversely affected unless the dumping of food waste is substantial and persistent at a given location. Wildlife impacts due to trash occur in creeks, lakes, estuaries, and ultimately the ocean. The two primary problems that trash poses to wildlife are entanglement and ingestion, with entanglement the more common documented effect (Laist and Liffmann, 2000). Marine mammals, turtles, birds, fish, and crustaceans all have been affected by entanglement in or ingestion of floatable debris. Many of the species most vulnerable to the problems of floatable debris are endangered or threatened by extinction. Entanglement results when an animal becomes encircled or ensnared by debris. It can occur accidentally, or when the animal is attracted to the debris as part of its normal behavior or out of curiosity. Entanglement is harmful to wildlife for several reasons. Not only can it cause wounds that can lead to infections or loss of limbs; it can also cause strangulation or suffocation. In addition, entanglement can impair an animal's ability to swim, which can result in drowning, or in difficulty in moving, finding food, or escaping predators (U.S. EPA, 2001). Ingestion occurs when an animal swallows floatable debris. It sometimes occurs accidentally, but usually animals feed on debris because it looks like food (e.g., plastic bags look like jellyfish, a prey item of sea turtles). Ingestion can lead to starvation or malnutrition if the ingested items block the intestinal tract and prevent digestion, or accumulate in the digestive tract, making the animal feel "full" and lessening its desire to feed. Ingestion of sharp objects can damage the mouth, digestive tract and/or stomach lining and cause infection or pain. Ingested items can also block air passages and prevent breathing, thereby causing death (U.S. EPA, 2001). Common settled debris includes glass, cigarettes, rubber, construction debris and more. Settleables are a problem for bottom feeders and dwellers and can contribute to sediment contamination. Larger settleable items such as automobiles, shopping carts, and furniture can redirect stream flow and destabilize the channel.
- - 5

A Rapid Trash Assessment Method Applied to Waters of the San Francisco Bay Region: January 20, 2007 Trash Measurement in Streams
In conclusion, trash in water bodies can adversely affect humans, fish, and wildlife. Not all water quality effects of trash are equal in severity or duration, thus the trash assessment methodology was designed to reflect a range of trash impacts to aquatic life, public health, and aesthetic enjoyment.
Sources and Fate of Trash Movement and fate of trash in the landscape and waterways varies based on its size, buoyancy, and degradability. Small, buoyant and persistent trash items such as plastic or synthetic rubber may travel from land all the way to mid-ocean locations, whereas other trash items may have a more transient or localized presence in waters. The primary sources of trash to waters of the state are urban runoff in nearshore areas such as creeks and San Francisco Bay, and fishing boats in offshore areas (Moore and Allen, 2000). In most of the region, storm drainage in urban areas had been designed to move water as quickly as possible to surface waters. One unfortunate by-product of this design is that medium to heavy rain events move trash that is deposited on streets and other impervious surfaces directly to waters of the state, unless it is screened out by coarse metal grates in urban gutters. Surveys of the ocean floor of the Southern California Bight for trash and natural debris concluded that land-based trash sources contributed the most to the ocean bottom trash levels near the shoreline, but the trash on the outer continental shelf was dominated by discarded fishing gear and incidental waste from recreational and commercial fishing boats (Moore and Allen, 2000). Surveys of the North Pacific central gyre for floating plastics and plankton suggest that the amount of plastic material in the ocean is increasing over time (Day and Shaw, 1987). Plastic degrades slowly in the ocean (Andrady, 1990; U.S. EPA, 1992). The eddy effects of the gyre probably serve to retain plastics, whereas plastics may wash up on shore in greater numbers in other areas. This is based on the observation that a large fraction of the materials in the central gyre study appeared to be remnants of offshore fishing-related activity and shipping traffic. The survey indicated that the mass of plastics is about six times that of plankton, but the abundance of plankton is still about five times that of plastic pieces (Moore et al., 2001).
Methods In order to generate consistent and comparable results, the methods of site definition, data collection, scoring, and overall monitoring program design are discussed in this section.
Monitoring Design Considerations The rapid trash assessment method can be used for a number of purposes, such as ambient monitoring, evaluation of management actions, determination of trash accumulation rates, or comparing sites with and without public access. In this report, the data collected is used for all of these purposes. Ambient monitoring provides information
- - 6

A Rapid Trash Assessment Method Applied to Waters of the San Francisco Bay Region: January 20, 2007 Trash Measurement in Streams
on the spatial and temporal patterns of trash dynamics. Additionally, the ambient sampling design should document the effects of episodes that affect trash levels such as storms or community cleanup events. Pre- and post-project assessments can assist in evaluating the effectiveness of management practices ranging from public outreach to structural controls, or to document the effects of public access on trash levels in waterbodies (e.g., upstream/downstream). Such evaluations should consider trash levels over time and under different seasonal conditions. Revisiting sites where trash was collected during previous assessments enables the determination of accumulation rates. Alternatively, if a monitoring objective is to characterize trash conditions over time in a stream, it may be more appropriate to revisit different nearby reaches or not pick up trash if the same site is revisited. Ultimately, the monitoring design strongly affects the usefulness of any rapid trash assessment information.
SWAMP Trash Monitoring Design In accordance with the goal of this report, sites were selected to represent the range of conditions found in the tributaries to San Francisco Bay, from rural residential areas in the foothills to dense, urbanized areas in the plains. All sites were near or within city limits, representing areas of public access (e.g., parks) or at the bottom of watersheds. The SWAMP program rotates water quality monitoring through 46 planning watersheds in the San Francisco Bay Region, as budget allows. Trash assessments were conducted at sites where water quality was monitored in the SWAMP program from 2003 to 2005. The 26 sites assessed using the rapid trash assessment methodology are located in five of the nine Bay Area counties (see Figure 1). Two of the 26 sites were surveyed only once, due to dangerous field conditions and extremely high trash levels, while other sites were surveyed three to five times over a year in order to calculate deposition rates of trash during dry and wet weather conditions. Surveys sometimes integrated both dry and wet conditions, but these assessments were classified as “wet weather” due to the observed overwhelming effect of wet weather conditions on trash deposition. Of the 26 sites, 13 were located at the bottom of the watershed (BOTW), representing areas just upstream of the San Francisco Bay intertidal zone. The remainder of the sites were located further upstream, allowing for longitudinal analyses of trash deposition in the San Mateo Creek, Baxter Creek (Richmond), Petaluma River, and Sausal Creek (Oakland) watersheds. This report presents results and discussion for a total of 93 individual site surveys.
Site Definition Defining site-specific characteristics facilitates the comparison of trash assessments conducted at the same site at different times of the year. Upon arrival at a designated monitoring site, a team of two people or more defined or verified a 100-foot section of the stream or shoreline to analyze, associated with a SWAMP water quality sampling location or station. When a site was first established, the 100-foot distance was accurately measured. The length was measured not as a straight line, but as 100 feet of the actual stream or shore length, including sinuous curves. Where possible, the starting and ending points of the survey were easily identified landmarks, such as an oak tree or
- - 7

A Rapid Trash Assessment Method Applied to Waters of the San Francisco Bay Region: January 20, 2007 Trash Measurement in Streams
boulder, and noted on the worksheet (“Upper/Lower Boundaries of Reach”), or documented using a global positioning system (GPS), so that future assessments could be made at the same location. The team conferred and documented the upper boundary of the banks to be surveyed, based on evaluation of whether trash could be carried to the water body by wind or water (e.g., an upper terrace in the stream bank). At each site, the team documented the location of the high water line based on site-specific physical indicators, such as a debris line found in the riparian vegetation along the stream channel. If the high water line could not be determined, bank full height was documented in the field sheets, noting that the high water line could not be determined. Trash located below the high water line can be expected to move into the streambed or be swept downstream during the next significant rain event.
Trash Data Collection The trash assessment protocol involves picking up and tallying all of the trash items found within the defined boundaries of a site. When repeated several times throughout a year, this procedure allows for the assessment of temporal changes in impairment, usage patterns, and trash deposition rates under wet and dry weather conditions. Surveys, including trash collection, note taking, and scoring, typically took one to two hours, depending on how trash-impacted the site was and the number of people on the survey crew. The first time a site was assessed the process generally took longer than on subsequent visits. There are numerous potential human health hazards, such as puncture hazards and pathogens, that could affect field technicians performing trash assessments. We suggest that other entities using the RTA protocol consult the SWAMP program’s health and safety standard operating procedures (SOPs) for general field work and trash assessments (Appendix 1) prior to beginning field work. All surveys are initiated at the downstream end of the selected reach so that trash is not obscured after disturbing the streambed. Tasks are divided according to the number of team members. For a team with two members, both persons, equipped with gloves and garbage bags, pick up trash. A trash grabber, metal kitchen tongs, or a similar tool can also be used to help pick up trash. One team member begins walking along the bank at the edge of the stream or shore, looking for trash on the bank up to the upper bank boundary, above and below the high water line. This person picks up trash and tallies the items on the trash assessment worksheet as either above or below the high water line. The other person walks along the streambed and up and down the opposite bank, picking up and calling out trash items found in the water body and on the opposite bank, both above and below the high water line, for the tally person to mark down appropriately on the trash assessment sheet. A three-member team has one designated note-taker and two trash collectors. To make sure that trash items are not missed from the survey, team members look under bushes, logs, and vegetation to see if trash has accumulated underneath. The ground and substrate is closely inspected to ensure that small items such as cigarette butts and pieces
- - 8
A Rapid Trash Assessment Method Applied to Waters of the San Francisco Bay Region: January 20, 2007 Trash Measurement in Streams
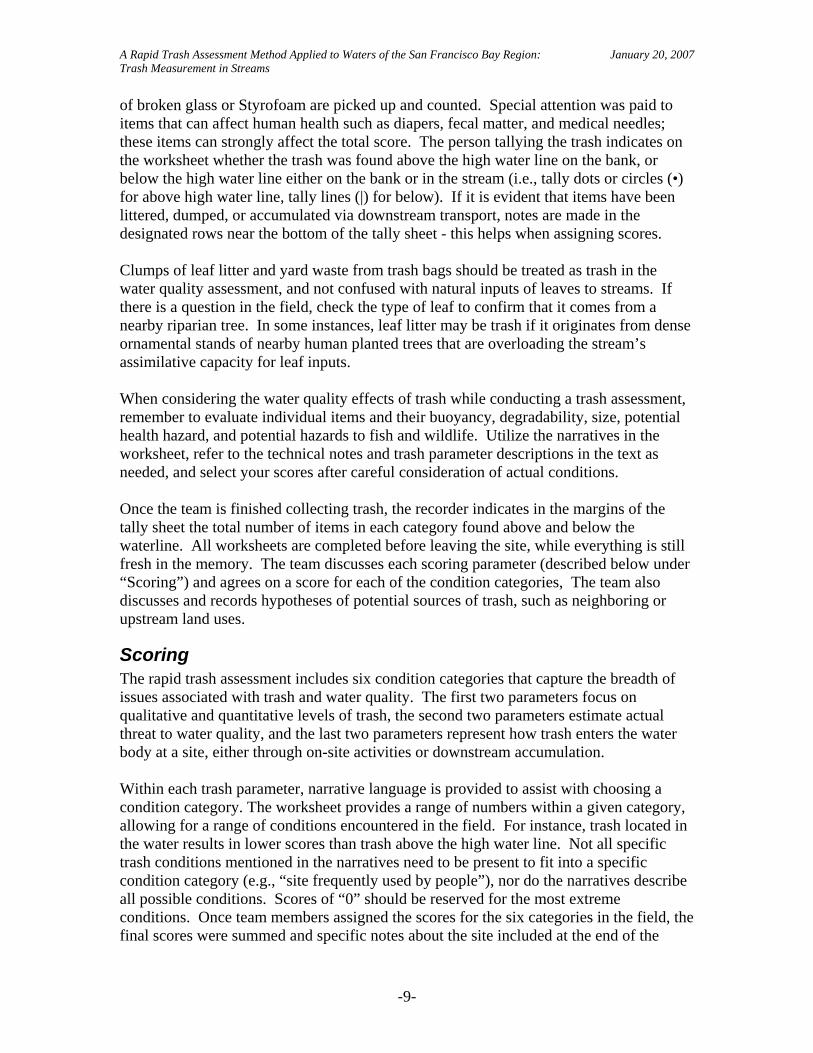
of broken glass or Styrofoam are picked up and counted. Special attention was paid to items that can affect human health such as diapers, fecal matter, and medical needles; these items can strongly affect the total score. The person tallying the trash indicates on the worksheet whether the trash was found above the high water line on the bank, or below the high water line either on the bank or in the stream (i.e., tally dots or circles (•) for above high water line, tally lines (|) for below). If it is evident that items have been littered, dumped, or accumulated via downstream transport, notes are made in the designated rows near the bottom of the tally sheet - this helps when assigning scores. Clumps of leaf litter and yard waste from trash bags should be treated as trash in the water quality assessment, and not confused with natural inputs of leaves to streams. If there is a question in the field, check the type of leaf to confirm that it comes from a nearby riparian tree. In some instances, leaf litter may be trash if it originates from dense ornamental stands of nearby human planted trees that are overloading the stream’s assimilative capacity for leaf inputs. When considering the water quality effects of trash while conducting a trash assessment, remember to evaluate individual items and their buoyancy, degradability, size, potential health hazard, and potential hazards to fish and wildlife. Utilize the narratives in the worksheet, refer to the technical notes and trash parameter descriptions in the text as needed, and select your scores after careful consideration of actual conditions. Once the team is finished collecting trash, the recorder indicates in the margins of the tally sheet the total number of items in each category found above and below the waterline. All worksheets are completed before leaving the site, while everything is still fresh in the memory. The team discusses each scoring parameter (described below under “Scoring”) and agrees on a score for each of the condition categories, The team also discusses and records hypotheses of potential sources of trash, such as neighboring or upstream land uses.
Scoring The rapid trash assessment includes six condition categories that capture the breadth of issues associated with trash and water quality. The first two parameters focus on qualitative and quantitative levels of trash, the second two parameters estimate actual threat to water quality, and the last two parameters represent how trash enters the water body at a site, either through on-site activities or downstream accumulation. Within each trash parameter, narrative language is provided to assist with choosing a condition category. The worksheet provides a range of numbers within a given category, allowing for a range of conditions encountered in the field. For instance, trash located in the water results in lower scores than trash above the high water line. Not all specific trash conditions mentioned in the narratives need to be present to fit into a specific condition category (e.g., “site frequently used by people”), nor do the narratives describe all possible conditions. Scores of “0” should be reserved for the most extreme conditions. Once team members assigned the scores for the six categories in the field, the final scores were summed and specific notes about the site included at the end of the
- - 9

A Rapid Trash Assessment Method Applied to Waters of the San Francisco Bay Region: January 20, 2007 Trash Measurement in Streams
sheet. Each site was assessed three or four times in a given year, during different seasons, to characterize the variability and persistence of trash occurrence for water quality assessment purposes. The scoring categories include:
1. Level of Trash. This assessment parameter is intended to reflect a qualitative “first impression” of the site, after observing the entire length of the reach. Sites scoring in the “poor” range are those where trash is one of the first things noticeable about the water body. No trash should be obviously visible at sites that score in the “optimal” range.
2. Actual Number of Trash Items Found. Based on the tally of trash along the
100-foot stream reach, total the number of items both above and below the high water line, and choose a score within the appropriate condition category based on the number of tallied items. Where more than 100 items have been tallied, assign the following scores: 5: 101-200 items; 4: 201-300 items; 3: 301-400 items; 2: 401-500 items; 1: 501-600 items; 0: over 600 items. Use similar guidelines to assign scores in other condition categories. Sometimes items are broken into many pieces. Fragments with higher threat to aquatic life such as plastics should be individually counted, while paper and broken glass, with lower threat and/or mobility, should be counted based on the parent item(s). Broken glass that is scattered, with no recognizable original shape, should be counted individually. The judgment of whether to count all fragments or just one item also depends on the potential exposure to downstream fish and wildlife, and waders and swimmers at a given site. Concrete is trash when it is dumped, but not when it is placed. Consider tallying only those items that would be removed in a restoration or cleanup effort.
3. Threat to Aquatic Life. As indicated in the technical notes, below, certain
characteristics of trash make it more harmful to aquatic life. If trash items are persistent in the environment, buoyant (floatable), and relatively small, they can be transported long distances and be mistaken by wildlife as food items. Larger items can cause entanglement. Some discarded debris may contain toxic substances. All of these factors are considered in the narrative descriptions in this assessment parameter.
4. Threat to Human Health. This category is concerned with items that are
dangerous to people who wade or swim in the water, and with pollutants that could accumulate in fish in the downstream environment, such as mercury. The worst conditions have the potential for presence of dangerous bacteria or viruses, such as with medical waste, diapers, and human or pet waste.
5. Illegal Dumping and Littering. This assessment category relates to direct
placement of trash items at a site, with “poor” conditions assigned to sites that
- - 10

A Rapid Trash Assessment Method Applied to Waters of the San Francisco Bay Region: January 20, 2007 Trash Measurement in Streams
appear to be dumping or littering locations based on adjacent land use practices or site accessibility.
6. Accumulation of Trash. Trash that accumulates from upstream locations is
distinguished from dumped trash by indications of age and transport. Faded colors, silt marks, trash wrapped around roots, and signs of decay suggest downstream transport, indicating that the local drainage system facilitates conveyance of trash to water bodies.
Quality Assurance To address concerns about observer bias and differences in interpretation of narrative language, SWAMP and Alameda County stormwater staff performed a methods repeatability study in July 2002. Three teams of two members assessed and scored the same two sites in a blind comparison. A summary of the study is included as Appendix B, Rapid Trash Assessment Method Evaluation.
Results and Discussion There are two major mechanisms responsible for trash in streams of the San Francisco Bay Region: direct littering or dumping, and downstream transport and accumulation. Littering and dumping were usually documented in dry weather conditions between sampling events, while downstream transport and accumulation of trash occurred extensively at the bottom of watersheds in wet weather conditions between sampling events. Results confirmed that these two phenomena occur at remarkable rates of deposition and levels of trash per 100-feet of stream in every watershed studied. In this section, the sites with the highest dry and wet weather deposition rates are described, sources of trash are identified, and potential management measures are discussed. In addition, two public access sites with high RTA scores and relatively low trash deposition rates are discussed to identify management efforts that appear to be working to keep trash out of the streams.
Regional Conditions The 93 site visits conducted by Water Board staff and students over three years and multiple seasons confirmed that high levels of trash are present throughout urban streams in the San Francisco Bay Region. On average, across all sites and seasons, 288 pieces of trash were collected per 100 foot reach of stream, equaling 2.88 pieces per linear foot of stream (Figure 2). Over 50% of this total, or 1.56 pieces per linear foot of stream, was composed of plastic items. Glass (19%) and biodegradable items (10%) were also commonly found. Most sites contained less than 500 pieces of trash, while several sites contained many more pieces, up to a maximum of 1133 pieces, or 11.33 pieces per linear foot of stream (Figure 3). Overall, 72% of all trash items were found below the high-water line, while 28% of items were found above the high-water line. Certain types of
- - 11

A Rapid Trash Assessment Method Applied to Waters of the San Francisco Bay Region: January 20, 2007 Trash Measurement in Streams
items were found almost exclusively below the high-water line, including toxic items (87%), construction debris (87%), and glass (82%). Forty-two percent of biodegradable items were found above the high water line, indicative of the frequency with which paper is transported by wind into stream channels. The average total Rapid Trash Assessment (RTA) score was 47, with a range from 8 to 112 (out of a possible 120) (Figure 4). Lower RTA scores reflect higher levels of trash. A high RTA score, overall or in a specific category, represents more desirable, less trashed conditions. Total RTA scores were strongly related to the number of plastic pieces found at sites (Figure 5).
Plastic, 150
Metal, 21
Toxic, 2
Biodegradable, 29
Glass, 56
Fabric/Cloth, 6
Miscellaneous, 16
Large, 0.4
Construction ,6Biohazard, 1
Figure 2: Average number of pieces of trash, by category, per 100 foot reach for all sites and all seasons.
- - 12

A Rapid Trash Assessment Method Applied to Waters of the San Francisco Bay Region: January 20, 2007 Trash Measurement in Streams
0100200300400500600700800900
100011001200
Figure 3: Frequency histogram of the number of pieces of trash found per 100 foot reach (site). A total of 93 site visits were conducted. The diamond indicates the mean and the standard error about the mean. The box indicates the median and the 25th and 75th percentiles, while the whiskers indicate the 5th and 95th percentiles.
0102030405060708090
100110120
Figure 4: Frequency histogram of total RTA trash scores for each site visit. A total of 93 site visits were conducted. Symbols are the same as in Figure 3.
- - 13

A Rapid Trash Assessment Method Applied to Waters of the San Francisco Bay Region: January 20, 2007 Trash Measurement in Streams
Plastic Pieces and Total RTA Score
0
20
40
60
80
100
120
0 200 400 600 800 1000Number of Plastic Pieces
RTA
Sco
re
Figure 5: Total RTA score relative to the total number of plastic pieces collected.
The 26 sites surveyed did not include the worst-case conditions of trash in the region (e.g. Figure 6), where obstructions can cause buildup of floating trash in wet weather conditions. The most trash pieces per 100 feet of stream documented in this report was 1,133 pieces at Baxter Creek at Booker Park in Richmond. For comparison, trash stored behind obstructions may exceed 10,000 pieces per 100 feet (Figure 6). Other problem sites not surveyed include homeless encampments, although some of the sites were downstream of such major sources of trash. There were significant differences in amounts and types of trash found at sites located at the bottom of watersheds and sites located in parks with high public access. Bottom-of-the-watershed (BOTW) sites (Table 2) received very low upstream accumulation scores (average score 3.3) relative to sites located higher in the watershed (average score 8.5). Conversely, littering was more important at sites with high public access (average score 3.9) than at sites without high public access (average score 5.4). Many more pieces of plastic were found below the high water line at BOTW sites (average 192) than at non-BOTW sites (average 52). Glass, however, was much more common at public access sites (average 92) than at non-public access sites (average 14). Overall, BOTW sites tended to most adversely affected by trash, in terms of highest total number of pieces (average 398) and lowest total RTA scores (average 35). Condition category scores within the total RTA score reflected differences in trash deposition between both (1) wet and dry seasons and (2) BOTW and sites further
- - 14

A Rapid Trash Assessment Method Applied to Waters of the San Francisco Bay Region: January 20, 2007 Trash Measurement in Streams
upstream. Bottom of the watershed (BOTW) sites generally scored lower than sites further upstream in the watershed in nearly all trash condition category scores, with the exception of dumping and littering (Figure 7). Qualitative scores were much lower at BOTW sites than upstream sites, indicating the “first impression” of BOTW sites is consistently more negative with respect to trash. Accumulation scores were also much lower at BOTW sites than upstream sites, but wet season scores are much lower for both site locations than dry season scores, reflecting the seasonality of trash accumulation. At BOTW sites, the dry season scores for accumulation were markedly lower than the wet season accumulation scores for upstream sites, shown at the far right of Figure 7. As noted above, at BOTW sites the trash is dominated by plastics. Plastics continue to be delivered to the bottom of watersheds and into the San Francisco Bay during the dry season. Trash can be delivered to streams, the topographic low points in watersheds, by wind and dry season urban runoff (e.g., over-irrigation), and these data suggest it is a significant source. Trash control efforts in the Los Angeles region associated with TMDL implementation tend to focus on runoff events to capture the largest volume of trash, but the observations documented in this report show that dry season delivery of trash is likely significant.
Figure 6: Photo of the trash buildup behind a fallen tree immediately downstream of the Julian Street bridge, Coyote Creek, San Jose, CA, January 27, 2004. Photo by Friends of Coyote Creek.
- - 15

A Rapid Trash Assessment Method Applied to Waters of the San Francisco Bay Region: January 20, 2007 Trash Measurement in Streams
0
2
4
6
8
10
12
Qual. Quant. Aquatic Human Dumping Littering Accum.Condition Category
RTA
Sco
reBOTW- WetBOTW- DryUpstream- WetUpstream-Dry
Figure 7: Average condition category scores from a subset of sites that were sampled during revisits that bracketed both and wet and dry seasons. Data are presented for both wet and dry season surveys from 6 BOTW sites and 10 upstream sites. Maximum RTA scores for all condition categories is 20, except littering and dumping which is 10.
Trash Deposition Rates
The monitoring design provided the opportunity to estimate trash deposition rates because trash was removed from 100-foot survey reaches during the initial site visit. Trash collected in the landmarked reach during subsequent surveys was assumed to have been deposited since the previous survey. Excluding initial site visits, the were a total of 67 site revisits (2-4 per site). A rate of deposition (pieces per reach per day) was calculated for all sites for wet and dry weather conditions, and ranked from highest to lowest (Table 1). Overall, the average trash deposition rate was 2.16 pieces of trash per 100-foot reach per day. Sites with high and low deposition rates are discussed in more detail below. Wet Season Deposition Very high trash deposition rates were generally associated with wet weather (Table 1), particularly at BOTW sites (listed in Table 2). Following the wet season, BOTW sites had a higher number of plastic pieces, indicating that this type of trash is more transportable in runoff events. The average number of plastic pieces found below the water line at BOTW sites, in all weather conditions, was 192 pieces per 100 feet. The
- - 16

A Rapid Trash Assessment Method Applied to Waters of the San Francisco Bay Region: January 20, 2007 Trash Measurement in Streams
average number of plastic pieces found below the water line at non-BOTW sites was 57 pieces per 100 feet. Deposition rates also reflect the importance of upstream accumulation versus littering and dumping. The highest deposition rates tended to occur at sites that received low accumulation scores, indicating that most trash was deposited at these sites via accumulation from upstream transport (Figure 8). Based on condition category scores, littering and dumping was believed to be the dominant process resulting in trash deposition at only a few sites during the wet season. Dry Season Deposition Deposition rates were usually lower in the dry season than the wet season, generally below 1 piece of trash per day (Table 1, Figure 8). Several sites on small urban creeks in or near public parks, however, had some of the highest measured deposition rates in this study during the dry season (Figure 9). The high dry season deposition in these streams is most often associated with localized littering and dumping during the summer months (July-August), although some sites also receive some trash from upstream accumulation during this time period. Management priorities at these sites should focus on encouraging the proper disposal of trash in and around the stream.
- - 17

A Rapid Trash Assessment Method Applied to Waters of the San Francisco Bay Region: January 20, 2007 Trash Measurement in Streams
Date Rank Location Creek City
Season (dry, wet)
Days between surveys
Trash Deposition Rate (pieces/100 ft.-day)
8/23/2005 1 Booker T. Anderson Park Baxter Cr. Richmond d 76 8.6611/19/2004 2 Booker T. Anderson Park Baxter Cr. Richmond w 130 7.4712/10/2004 3 Oak Glen Park Glen Echo Cr. Oakland w 100 7.178/23/2005 4 Baxter Cr. below San Pablo Av. Baxter Cr. Richmond d 76 6.3612/10/2004 5 Strawberry Creek Park Strawberry Cr. Berkeley w 114 5.6111/7/2003 6 Washington @ McDowell Washington Cr. Petaluma d 108 5.192/6/2004 7 Schollenberger Park Petaluma R. Petaluma w 91 5.1411/5/2004 8 Albany Hill/Creekside Park Cerrito Cr. El Cerrito d 116 5.038/23/2005 9 Lower Sausal Cr. Sausal Cr. Oakland d 67 4.966/10/2005 10 Oak Glen Park Glen Echo Cr. Oakland w 182 4.532/20/2004 11 Buchanan Park Kirker Cr. Pittsburg w 210 4.301/27/2004 12 Washington @ McDowell Washington Cr. Petaluma w 81 4.172/20/2004 13 Dow Wetlands Kirker Cr. Pittsburg w 210 4.177/12/2004 14 Albany Hill/Creekside Park Cerrito Cr. El Cerrito d 108 4.112/13/2004 15 Gateway Park San Mateo Cr. San Mateo w 116 4.1012/3/2004 16 Lower Sausal Cr. Sausal Cr. Oakland w 109 3.837/12/2004 17 Lower Codornices Cr. Codornices Cr. Albany d 122 3.406/8/2005 18 Booker T. Anderson Park Baxter Cr. Richmond w 201 2.9211/7/2003 19 Schollenberger Park Petaluma R. Petaluma d 108 2.907/12/2004 20 Booker T. Anderson Park Baxter Cr. Richmond d 115 2.777/25/2003 21 Buchanan Park Kirker Cr. Pittsburg d 128 2.713/12/2004 22 Lower Codornices Cr. Codornices Cr. Albany w 300 2.7011/5/2004 23 Lower Codornices Cr. Codornices Cr. Albany d 116 2.4712/10/2004 24 Lower Glen Echo Cr. Glen Echo Cr. Oakland w 100 2.418/23/2005 25 Oak Glen Park Glen Echo Cr. Oakland d 74 2.011/27/2004 26 Petaluma Factory Outlets Petaluma R. Petaluma w 81 1.963/14/2004 27 Lower Permanente Cr. Permanente Cr. Mountain View w 135 1.857/22/2003 28 Washington @ McDowell Washington Cr. Petaluma d 124 1.858/23/2005 29 Canyon Trail Park Baxter Cr. El Cerrito d 76 1.687/29/2003 30 Lower Permanente Cr. Permanente Cr. Mountain View d 124 1.682/13/2004 31 Lower Polhemus Cr. Polhemus Cr. San Mateo w 116 1.586/8/2005 32 Baxter Cr. below San Pablo Av. Baxter Cr. Richmond w 208 1.526/10/2005 33 Lower Glen Echo Cr. Glen Echo Cr. Oakland w 182 1.436/17/2005 34 Lower Sausal Cr. Sausal Cr. Oakland w 196 1.427/29/2003 35 Moss Rock Stevens Cr. Cupertino d 124 1.388/23/2005 36 Lower Glen Echo Cr. Glen Echo Cr. Oakland d 74 1.3010/31/2003 37 Lower Permanente Cr. Permanente Cr. Mountain View d 94 1.142/13/2004 38 Arroyo Court Park San Mateo Cr. San Mateo w 116 1.116/8/2005 39 Canyon Trail Park Baxter Cr. El Cerrito w 208 1.117/22/2003 40 Schollenberger Park Petaluma R. Petaluma d 124 1.0710/31/2003 41 Moss Rock Stevens Cr. Cupertino d 94 1.038/20/2004 42 Madeiros Pkwy. @ Stanley Arroyo Mocho Livermore d 119 0.9910/20/2003 43 Gateway Park San Mateo Cr. San Mateo d 89 0.943/14/2004 44 Moss Rock Stevens Cr. Cupertino w 135 0.9310/7/2004 45 Gateway Park San Mateo Cr. San Mateo w 237 0.8611/7/2003 46 Petaluma Factory Outlets Petaluma R. Petaluma d 108 0.858/23/2005 47 Dimond Park Sausal Cr. Oakland d 67 0.847/23/2003 48 Gateway Park San Mateo Cr. San Mateo d 124 0.7912/3/2004 49 Dimond Park Sausal Cr. Oakland w 109 0.728/18/2004 50 Strawberry Creek Park Strawberry Cr. Berkeley d 159 0.701/27/2004 51 Penngrove Park Lichau Cr. Petaluma w 81 0.642/13/2004 52 Upper San Mateo Cr. San Mateo Cr. San Mateo w 116 0.536/10/2005 53 Madeiros Pkwy. @ Stanley Arroyo Mocho Livermore w 294 0.537/23/2003 54 Arroyo Court Park San Mateo Cr. San Mateo d 124 0.517/23/2003 55 Lower Polhemus Cr. Polhemus Cr. San Mateo d 124 0.517/25/2003 56 Dow Wetlands Kirker Cr. Pittsburg d 128 0.4511/7/2003 57 Penngrove Park Lichau Cr. Petaluma d 108 0.3710/20/2003 58 Arroyo Court Park San Mateo Cr. San Mateo d 89 0.3110/20/2003 59 Upper San Mateo Cr. San Mateo Cr. San Mateo d 89 0.297/23/2003 60 Upper San Mateo Cr. San Mateo Cr. San Mateo d 124 0.256/17/2005 61 Dimond Park Sausal Cr. Oakland w 196 0.177/22/2003 62 Penngrove Park Lichau Cr. Petaluma d 124 0.157/22/2003 63 Petaluma Factory Outlets Petaluma R. Petaluma d 124 0.1410/20/2003 64 Lower Polhemus Cr. Polhemus Cr. San Mateo d 89 0.138/23/2005 65 Joaquin Miller Park Palo Seco Cr. Oakland d 67 0.0412/3/2004 66 Joaquin Miller Park Palo Seco Cr. Oakland d 109 0.046/17/2005 67 Joaquin Miller Park Palo Seco Cr. Oakland w 196 0.03
TABLE 1
SITES RANKED BY TRASH DEPOSITION RATESAN FRANCISCO BAY REGION TRASH ASSESSMENT STUDY
- - 18

A Rapid Trash Assessment Method Applied to Waters of the San Francisco Bay Region: January 20, 2007 Trash Measurement in Streams
Location Water Body CityBooker T. Anderson
Park Baxter Cr. RichmondAlbany Hill/Creekside
Park Cerrito Cr. El CerritoLower Codornices Cr. Codornices Cr. Albany
Strawberry Creek Park Strawberry Cr. BerkeleyLower Glen Echo Cr. Glen Echo Cr. Oakland
Lower Sausal Cr. Sausal Cr. OaklandCesar Chavez Park Peralta Cr. OaklandArroyo Viejo Rec.
Center Arroyo Viejo OaklandSchollenberger Park Petaluma R. Petaluma
Dow Wetlands Kirker Cr. PittsburgMadeiros Pkwy. @
Stanley Arroyo Mocho LivermoreGateway Park San Mateo Cr. San Mateo
Lower Permanente Cr. Permanente Cr. Mountain View
TABLE 2
BOTTOM OF THE WATERSHED (BOTW)TRASH MEASUREMENT LOCATIONS
- - 19

A Rapid Trash Assessment Method Applied to Waters of the San Francisco Bay Region: January 20, 2007 Trash Measurement in Streams
0
1
2
3
4
5
6
0 2 4 6 8 10Accumulation Score (0-20)
Wet
Sea
son
Dep
ositi
on R
ate
(# p
iece
s/da
y)
12
More Accumulation
Sites where littering is dominant
Figure 8: Wet-season trash deposition rates relative to the RTA accumulation score. As the accumulation score decreases (more accumulation) the deposition rates are higher, except at several sites where littering is responsible for high deposition rates during the wet season.
0
1
2
3
4
5
6
7
8
9
10
0.0 2.0 4.0 6.0 8.0 10.0Littering Score
Dry
Sea
son
Dep
ositi
on R
ate
(# P
iece
s/D
ay)
More Littering
Figure 9: Dry season trash deposition rates relative to the RTA littering score. As the littering score decreases (more littering) the deposition rates are higher.
- - 20

A Rapid Trash Assessment Method Applied to Waters of the San Francisco Bay Region: January 20, 2007 Trash Measurement in Streams
Case Studies- High Trash Deposition Rates 1. Booker T. Anderson Park, Baxter Creek The two highest trash deposition rates recorded in the study occurred at the BOTW site of the Baxter Creek watershed in Richmond and El Cerrito. The initial site survey, prior to trash pickup, yielded the most pieces of trash per 100 feet of any survey conducted (1,133). This site absorbs the impact of trash delivered from upstream during storm events, but there is much evidence of local littering and dumping as well, which combine to result the highest rates of deposition recorded in the regional study. The site is surrounded by residential areas. A stream restoration project several years ago removed concrete channel and planted riparian vegetation that is now well established (though at most 20’ in width). There was evidence of park use during each survey, particularly on the east bank where there is grass, a playground, and a ball field. At the upstream end of the park is a culvert and a large pool. Many dumped items were observed in this pool, but it is not located within the 100-foot survey reach. The pool is at the edge of the park, along a road, with easy dumping access for vehicular traffic. Some of the dumped items were carried downstream, such as mattresses that were observed in the stream at the lower end of the park. Littering is prevalent here also, though trash cans and a dumpster are present. On the west side of the creek is a recreation center and a large parking lot. A street sweeper was observed cleaning the parking lot. The recreation center has a dumpster at the curb which probably prevents some large items from being dumped into the creek. The highest trash deposition rate measured in this study occurred at this site during the dry summer months. Following site cleanup on June 8, 2005, 658 pieces of trash were collected on August 23, yielding a trash accumulation rate of 8.66 pieces of trash per day. Much of this trash was believed to have been directly littered (littering score = 0) in the stream at Booker T. Anderson Park. There was also evidence, however, of significant levels of trash coming from upstream sources (accumulation score = 2), even during summer baseflow conditions. The second highest deposition rate (7.47 pieces/day) was recorded during the survey of November 19, 2004, soon after the first significant rain event of the season. Despite the trash removal associated with the first survey, the site received a lower RTA score during the November survey than the initial site visit. There were 543 plastic pieces of trash located below the high water line, and 33 above. The combination of significant downstream transport, with notable littering and dumping, makes the Booker T. Anderson site particularly unique.
Potential Management Measures Trash is managed at this park, but the management activities are not successfully preventing littering or dumping. Many park patrons simply ignore the trash receptacles that have been made available. A major change in the behavior of park patrons and illegal dumpers is needed to improve the trash issue in Baxter Creek. Downstream transport is also a significant problem at Booker T. Anderson Park, however, so trash
- - 21

A Rapid Trash Assessment Method Applied to Waters of the San Francisco Bay Region: January 20, 2007 Trash Measurement in Streams
management practices need to address the entire watershed. The next site upstream, where the creek runs under San Pablo Avenue, received a lower RTA score on November 12, 2004 than this site, due to extensive littering of food wrappers from nearby fast-food restaurants. The San Pablo Avenue site also had the fourth highest deposition rate measured in this study; 6.36 pieces per day were deposited during the summer dry season. The Baxter Creek watershed appears to be a significant source of floatable trash to the Bay, and warrants special attention. A progressive program of education, warnings, and penalties may be needed in order to achieve behavioral change. Given the ubiquitous nature of trash in this watershed, structural trash removal alternatives should be evaluated as well.
Figure 10: View looking upstream from Booker T. Anderson Park trash survey site (BAX030), showing dumped mattress and low fence above culvert at street crossing, upstream of park. Photo by Steve Moore, August 23, 2005. 2. Dow Wetlands, Kirker Creek The lower portion of Kirker Creek flows in a realigned channel between the Dow Wetlands, a large, restored wetland on the edge of Suisun Bay, and the Dow Chemical industrial facility. The Dow Wetlands is commonly used by bird watchers, hikers, dog walkers, and school groups. Although a dirt road follows the creek along much of its length, the road is not open to public vehicular traffic. Wet season deposition rates were extremely high (4.3 pieces/day), but dry season deposition was among the lowest recorded for BOTW sites (0.45 pieces/day). After the
- - 22

A Rapid Trash Assessment Method Applied to Waters of the San Francisco Bay Region: January 20, 2007 Trash Measurement in Streams
initial trash collection effort, only 58 pieces of trash were deposited during the summer dry season. Even during the dry season, accumulation from upstream sources was judged to be the dominant source of trash, rather than local littering and dumping. During the subsequent wet season, 887 pieces of trash were deposited, all of which was judged to come from upstream sources. In both summer and winter, over 90% of the deposited trash was plastic pieces. Plastic pieces are buoyant, and are easily transported long distances. They accumulate at sites such as this one in low gradient channels near the mouths of watersheds.
Potential Management Measures Although this site is open to public access, little or none of the trash at the site appears to come from littering. Dumping is not possible at this site because vehicular access is limited. Virtually all of the trash deposited at this site is plastic pieces that are efficiently transported from the streets of Pittsburg into the storm drain system. Management actions must focus on this conveyance system in order to remove trash before it enters the stream network. 3. Washington and McDowell, Washington Creek (Petaluma River) The highest dry season trash deposition rate recorded in this study occurred at Washington Creek, at the corner of Washington and McDowell in the City of Petaluma. This is a very heavy vehicle traffic area, with an off-ramp from Highway 101, a busy intersection, a gas station, and a mall next to the creek at this station. A concrete channel encloses the stream, with the top of the ~ 15’ tall southeast wall bordering the sidewalk adjacent to Washington Street. On the opposite bank is a plaza-style shopping mall. Dumpsters are located about 100 feet from the creek, with no enclosure. Directly north of the site, near the intersection, is a gasoline station. One dumpster is located behind the gas station in a concrete block enclosure with a semi-solid gate. A chain link fence separates the creek corridor from the gas station trash enclosure and the mall. The creek is accessible by climbing over the chain link fence (about 4’ high). At the upstream edge of the site the stream flows through a large culvert under a gas station and McDowell Avenue.
The dominant trash at this location was plastic wrappers, cigarette butts, paper, and aluminum foil or cans. An overflowing dumpster at the gas station and wind blown trash from the shopping center parking lot likely contributed most of the plastics and paper, much of which was above the high water line. During the summer survey, 59% of the pieces found above high water line were plastics. 62 of 92 plastic pieces found above the high water line were plastic wrappers. 46 of 157 (29%) pieces above the high water line were paper pieces. 130 of 233 (56%) total pieces were plastic in origin. The winter survey was dominated by plastic (291 of 338 pieces).
Potential Management Measures The overflowing dumpsters and trash blowing off the large shopping mall parking lot combine to create a continuous loading of trash to this site. The implied message to the
- - 23

A Rapid Trash Assessment Method Applied to Waters of the San Francisco Bay Region: January 20, 2007 Trash Measurement in Streams
public, due to the perpetually polluted condition, is that it is okay to dispose of solid waste into the creek. Unless nearby businesses improve their trash management, high rates of trash loading will continue. The public needs to be better educated about the harmful effects of disposing trash near water bodies. Education efforts should be followed up by regulation and enforcement. 4. Moss Rock, Stevens Creek The Moss Rock site (STE100) is located at a roadside pullout in the steep and narrow Stevens Creek Canyon near Stevens Creek County Park. There is minimal upstream human land use, and no adjacent houses or urban land use. Trash levels were fairly high (290 pieces) at the initial site visit in March, 2003. The vast majority of the trash pieces collected was littered beverage containers, including many broken glass bottles. Also collected in the stream were several hypodermic needles. Trash levels were lower during 3 subsequent visits (97-171 pieces), suggesting that some of the trash picked up during the initial visit was old, relict trash. Trash deposition rates were moderately high throughout the year (0.93-1.38 pieces/day), however, and littering scores and overall scores were consistently low. Based on the types of trash collected, the site is likely commonly used throughout the year as a recreation spot. Most of the trash was related to alcoholic beverages or snack food.
Potential Management Measures This site is believed to be located on private property just outside of the County Park boundary, although there are no signs indicating if it is public or private property. Thus, many visitors to this site may unknowingly be trespassing. There are no trash receptacles at or near this pullout. There was evidence, however, that visitors deposited trash in a pile at a location near a fence separating the pullout from the creek, where a trash can was expected to be located. This site is used both for water recreation and picnicking, but the human health hazard posed by broken glass bottles and needles makes these two uses virtually incompatible. Installing and maintaining trash receptacles would encourage visitors to properly dispose of trash, making the site, as well as downstream sites in the County Park, safer for water contact recreation. Case Studies – Low Trash Deposition Rates 1. Dimond Park, Sausal Creek The assessment site is directly adjacent to the Dimond Park Recreation Center and Swimming Pool. The recreation center is frequently full of children using the jungle gym play area just upstream of the survey reach. There are many trash cans at the recreation center. Maintenance workers have been observed picking up trash on the grass lawn, near the creek. Friends of Sausal Creek are an active volunteer group that picked up trash at this site in May 2005, shortly before our June 2005 trash survey. Most of the trash found in the June 2005 survey was located in the vegetation on the bank opposite the recreation center, and not in the stream itself. Although most of the trash found at this
- - 24

A Rapid Trash Assessment Method Applied to Waters of the San Francisco Bay Region: January 20, 2007 Trash Measurement in Streams
site comes from littering, management efforts appear to be adequate at keeping high levels of trash from entering the creek. The combined efforts of the recreation center staff, who actively manage trash on the recreation center property, and Friends of Sausal Creek, keep trash levels here lower than at sites in other public park settings. Although there is urban residential land use in the upstream watershed, very low levels of trash accumulate at this site from upstream sources. 2. Joaquin Miller Park, Palo Seco Creek (Sausal Creek) Juaquin Miller Park is located near the top of the Sausal Creek watershed, upstream of Highway 13. While there is public access to the park, the trailhead is not well-marked. There are two trash cans and plastic bags available for dog waste at the small three-car parking area at the trailhead. This site may have less public use than many parks, which may explain the remarkably low levels of trash in the stream. Still, there is some evidence of littering, probably related to the use of the site by dog walkers and hikers. On one occasion, pet waste was found near the stream.
Figure 11: View of trash survey site on Palo Seco Creek in Joaquin Miller Park, Oakland, CA, showing no trash during dry season survey. Some dog waste was in the creek bed, lowering the RTA score from optimal due to the threat to human health. Photo by Steve Moore, August 23, 2005.
- - 25

A Rapid Trash Assessment Method Applied to Waters of the San Francisco Bay Region: January 20, 2007 Trash Measurement in Streams
Longitudinal Trends Within Watersheds To assess how trash levels varied along a longitudinal gradient (i.e., headwaters to mouth) in watersheds, multiple sites were monitored in four watersheds: San Mateo Creek, Petaluma River, Baxter Creek, and Sausal Creek. Overall, trash levels generally increased (and RTA scores decreased) in a downstream direction. Because trash is removed during the assessments, we would expect RTA scores to increase and trash levels to decrease over successive sampling events. RTA scores tended to improve on subsequent visits at the upstream sites during the dry season, but conditions often worsened following the wet season, due to reintroduction of high levels of trash. BOTW sites exhibited less improvement following cleanup attempts, indicating very high levels of trash deposition throughout the year, though more significant during wet weather. In many cases, even after several assessments had been performed, trash levels returned to pre-assessment conditions following the winter season. These results suggest that picking up trash in streams is not an effective management approach in systems that receive high trash inputs. This also suggests that trash levels may be partly governed by the capture efficiency of channels; once the channel has reached its trash storage capacity, excess trash may be transported downstream. 1. San Mateo Creek Watershed The San Mateo Creek watershed is a relatively narrow, urbanized watershed, with two main tributaries in the hillside portion of the city (Figure 1). Polhemus Creek drains a residential area, while upper San Mateo Creek runs along a roadway downstream of Crystal Springs Dam and minimal urban land use. Two sites were monitored in the urbanized bayshore plain (Arroyo Court Park (SMA060) and the BOTW site Gateway Park (SMA020)), and two sites were monitored upstream of the confluence of the two main tributaries. The Gateway Park site, though not initially having the highest trash levels, had higher deposition rates of trash in subsequent surveys and hence lower RTA scores (Figure 12). Located 2 miles upstream of the Gateway Park site, the Arroyo Court Park site improved slightly following trash cleanup events, but winter flows delivered high levels of trash that lowered RTA scores. Dry season RTA scores were lower at the Gateway and Arroyo Court Park sites, due to direct littering into the stream at these publicly accessible sites. The Polhemus Creek (SMA110) site had the lowest initial score, but following cleanup it had the highest score in the watershed. Winter flows brought large levels of trash from the upstream residential area, however, significantly lowering the RTA score. The upper San Mateo creek site (SMA120) saw less return of trash with wet weather, due to less upstream sources.
- - 26

A Rapid Trash Assessment Method Applied to Waters of the San Francisco Bay Region: January 20, 2007 Trash Measurement in Streams
San Mateo Creek
0
20
40
60
80
100
120
Initial Visit Early Dry Late Dry WinterSampling Season
Tota
l RTA
Sco
reSMA020SMA060SMA110SMA120
Figure 12: RTA Scores at four sampling sites in the San Mateo Creek watershed along a longitudinal gradient.
2. Petaluma River Watershed The Petaluma River watershed is a broad, low gradient watershed with many small tributary creeks that flow into a large tidal slough, the Petaluma River (Figure 1). The land use is mixed urban, rural residential, and rangeland. The BOTW site is Schollenberger Park (PET100), located along a tidal shoreline downstream of the confluence of Petaluma River and Adobe Creek, and downstream of the City of Petaluma. The Petaluma Factory Outlets site (PET310) is the most downstream freshwater site on the Petaluma River. Sites located on small tributaries include Washington Creek (PET220) and Lichau Creek at Penngrove Park (PET400). The Penngrove Park site had relatively low levels trash deposition in both dry and wet seasons, compared to other sites in the watershed. Trash at this site was predominantly legacy trash, as more trash was picked up during the first survey (45 pieces) than during the subsequent three surveys combined (38 pieces). The Factory Outlets site, which is publicly accessible but seldom visited, had low dry season deposition and very high wet season deposition during the winter. The Washington Creek site, discussed above under Trash Deposition Rates, experienced high levels of trash inputs during the dry season. Although some trash accumulated from upstream sources during the wet season, overall this site appears to be a net source of trash to downstream waters. The adjacent shopping plaza, large paved parking lot, and
- - 27

A Rapid Trash Assessment Method Applied to Waters of the San Francisco Bay Region: January 20, 2007 Trash Measurement in Streams
gasoline station with overflowing dumpster contributed high levels of litter to the stream and represents a trash source area that should be targeted in watershed-wide trash reduction efforts. During site surveys, wind was observed carrying plastic trash over a 4-foot cyclone fence separating the commercial land uses from the stream corridor. A similar pattern was seen at the BOTW site in the tidal Petaluma River – indicative of both littering and accumulation in an area characterized by bi-directional flows and deposition on higher tides. The BOTW site in this watershed was unique due to the tidal characteristics and high dry season deposition rates. Management of trash at Schollenberger Park could be improved: trash receptacles are not located in a convenient place for use by the park visitors (trash cans are only located at the parking lot, not at the beach), and there is no evidence that the responsible jurisdiction is cleaning trash from the beach. The Petaluma River watershed sites had lower scores at the end of the survey, following extensive cleanup, than the initial scores (Figure 13), suggesting that trash deposition is pervasive and watershed-wide management efforts are needed.
Petaluma River
0
20
40
60
80
100
120
Initial Visit Spring-Summer Fall WinterSampling Season
Tota
l RTA
Sco
re
PET100PET220PET310PET400
Figure 13: RTA Scores at four sampling sites in the Petaluma River watershed along a longitudinal gradient. PET100 is the lowest site, PET310 is upstream on the main branch, and PET220 and PET400 are the tributary sites. PET220 tributary (Washington Cr.) enters the main branch downstream of PET310. Except for PET400, the final scores are below the initial scores, indicating that trash levels may be getting worse in this watershed.
- - 28

A Rapid Trash Assessment Method Applied to Waters of the San Francisco Bay Region: January 20, 2007 Trash Measurement in Streams
3. Baxter Creek Watershed The Baxter Creek watershed is a small watershed with its headwaters in the hills of El Cerrito. It drains to San Francisco Bay through the City of Richmond, in a densely urbanized area (Figure 1). The downstream site, at Booker T. Anderson Park (BAX030), exhibits extremely high trash inputs in both the dry and wet seasons. The consistently low RTA scores indicate a constant, high level of trash regardless of trash removal efforts and season (Figure 14). Similar problems were documented at the upstream site (BAX040), but there was less wet season deposition than at Booker T. Anderson Park. The site at Canyon Trail Park in the El Cerrito hills (BAX080) had higher RTA scores in both the dry and wet seasons, but the low to moderate scores (50-62) indicate that this site also experiences significant wet-weather and dry-weather trash deposition.
Baxter Creek
0
20
40
60
80
100
120
Initial Spring-Summer
Fall Winter-Spring
Summer
Sampling Season
Tota
l RTA
Sco
re
BAX030
BAX040
BAX080
Figure 14: RTA Scores at three sampling sites in the Baxter Creek watershed along a longitudinal gradient. BAX030 is the downstream site, BAX040 is upstream at San Pablo Avenue, and BAX080 is at Canyon Trail Park, in El Cerrito.
4. Sausal Creek Watershed The Sausal Creek watershed is a small watershed that begins in the hills above Oakland and drains through a dense urban landscape to the Oakland Inner Harbor (Figure 1). The active Friends of Sausal Creek group has elevated the visibility of the creek to the City
- - 29

A Rapid Trash Assessment Method Applied to Waters of the San Francisco Bay Region: January 20, 2007 Trash Measurement in Streams
and the community, and effective cleanup and restoration projects have been implemented in this watershed. The two upper sites in the watershed, Dimond Park (SAU060) and Joaquin Miller Park (SAU130), have the lowest deposition rates in this regional study (discussed above). The City of Oakland’s Parks Department and local volunteers from the Friends of Sausal Creek actively manage and remove trash in Dimond Park. Scores at the Dimond Park site improved with successive site surveys; the highest RTA score was recorded at the last site visit during the summer season. The site on Palo Seco Creek in Joaquin Miller Park (SAU130) is publicly accessible, but upstream of most urban areas and not as frequently visited. This site serves as a regional “reference” site in this study because of the very low trash levels. The downstream Sausal Creek site at East 22nd St. (SAU030) is heavily impacted by trash. The open channel upstream of the site appears to attract illegal dumping and littering, and adjacent landowners were observed dumping their household trash into the stream area. This area could be a focus for progressive education, warning and enforcement of existing littering laws.
Sausal Creek
0
20
40
60
80
100
120
Initial Visit Summer-Fall Winter-Spring SummerSampling Season
Tota
l RTA
Sco
re
SAU030
SAU060
SAU130
Figure 15: RTA scores at three sampling sites in the Sausal Creek watershed along a longitudinal gradient. SAU030 is the downstream site at E. 22nd Street, SAU060 is at Dimond Park, and SAU130 is on Palo Seco Creek in Joaquin Miller Park, all in Oakland, CA.
- - 30

A Rapid Trash Assessment Method Applied to Waters of the San Francisco Bay Region: January 20, 2007 Trash Measurement in Streams
Conclusions and Recommendations Levels of trash in the waters of the San Francisco Bay Region are very high, despite the fact that the Basin Plan prohibits discharge of trash and that littering is illegal with potentially large fines. Based on 93 surveys conducted at 26 sites throughout the Bay Area, we found an average of 2.88 pieces of trash per linear foot of stream channel. Following trash removal, there were very high return rates of trash, even during the dry season. Over the 2003-2005 study, an average of 2.16 pieces of trash were deposited in each study reach each day. There did not appear to be one county or region with higher trash levels, as high and low deposition rates were measured in each county surveyed. Rather, high trash levels were most common at lower watershed sites in urban areas, where both upstream accumulation and local littering was prevalent. Without an assessment method such as the one used in this study, people could draw the wrong conclusion that high trash levels at bottom of the watershed sites are due solely to localized littering. This study shows that these areas, which tend to have lower property values, are polluted cumulatively by the entire watershed. In summary, the trash assessment data collected for this study using the Rapid Trash Assessment methodology confirms that:
• All watersheds studied in the San Francisco Bay region (Figure 1) have high levels of trash.
• Lower watershed sites tend to have higher densities of trash.
• Trash source hotspots near creek channels, usually associated with parks, schools,
roads, or poorly kept commercial facilities, contribute a significant portion of trash that is deposited at lower watershed sites.
• Dry season deposition of trash is primarily associated with localized littering and
dumping, wind-blown trash from nearby sources, and, at certain sites, accumulation from upstream sources due to dry season runoff.
• Wet season deposition of trash is primarily due to accumulation from upstream
sources. This trash is predominantly plastic, especially at lower watershed sites, which suggests that urban runoff is a major source of floatable plastic found in the ocean and on beaches as marine debris.
• Parks that have more evident management of trash by City staff and local
volunteers, including cleanup within the creek channel, have measurably less trash pieces and higher RTA scores. At sites that drain urban areas, however, trash can rapidly accumulate from upstream sources even in the absence of local littering and dumping.
- - 31

A Rapid Trash Assessment Method Applied to Waters of the San Francisco Bay Region: January 20, 2007 Trash Measurement in Streams
The ubiquitous, unacceptable levels of trash in waters of the San Francisco Bay Region warrant a comprehensive and progressive program of education, warning, enforcement, and structural controls. Based on our informal discussions with members of the public, even the well-educated are unaware that storm drain systems are directly connected to streams and the Bay. It seems that the public do not grasp the risks associated with littering on streets that drain to waters, let alone in parks that have running streams. A more aggressive campaign for educating the public about the ultimate fate of litter is overdue. Municipal jurisdictions should implement comprehensive trash management programs. Employees of parks and schools that pick up trash need to be instructed to pick up trash near and within streams, and equipped accordingly. Trash receptacles need to be placed near publicly accessible waters, with educational messages about marine debris and human health risks of trash. These receptacles need to be actively managed so they do not become a source of trash to waters. Curbside trash pickup and recycling can be a source of trash if containers are overflowing or not effectively storing debris. Businesses need to do a better job of keeping trash associated with their operations from waters of the state. Styrofoam pellets were one of the most common and abundant types of trash surveyed and removed in this study, and the literature shows that they are long-lived and harmful to marine life (Marine Mammal Commission, 1996). They are most often used as packing and shipping materials. Businesses should be a target of education and then enforcement with respect to management of packing and shipping materials. Large amounts of these pellets were documented downstream of downtown Berkeley in Strawberry Creek, and this serves as an example of business contribution to the trash problem. This Styrofoam (303 pellets and 125 pieces in December 2004) could be coming from careless handling of packing materials and their allowance to enter the storm drains. Similarly, dumpsters at gasoline stations such as the one at Washington St. and McDowell Blvd. in Petaluma should be identified and regulated as potential sources of trash to waters of the state. The adjacent shopping plaza at that location was an unmanaged, continuous source of litter and trash to waters of the state, regardless of season. These businesses need to be first educated and then regulated, preferably by municipalities as part of the municipal stormwater program, as potential sources of trash to streams, bays and the ocean. Structural controls and treatments may be the most effective options for reducing trash inputs into water bodies in many areas. As with most issues, not every member of the public will follow littering rules, even if better educated about the harm litter can do to people and animals. Certain watersheds with chronic trash problems will warrant structural controls, as has been the case with the 303d-listed Lake Merritt in Oakland. Structural controls in the Los Angeles region have been effective at intercepting large amounts of trash from entering streams, bays and the Pacific Ocean. The results documented in this report suggest that the maintenance of structural controls should not be limited to wet weather loading events.
- - 32

A Rapid Trash Assessment Method Applied to Waters of the San Francisco Bay Region: January 20, 2007 Trash Measurement in Streams
The Rapid Trash Assessment protocol has been shown to be useful in distinguishing trash levels in streams between sites, in determining trash deposition rates, in ranking sites, and determining whether significant deposition of trash occurs in the dry season, wet season or both. The RTA method examines the types of trash that have been deposited at a site, and allows for identification of sources. This approach is most useful for identifying the site-specific management actions that will have the most potential for reducing trash loading to streams. In many cases the results of the assessment confirmed what could be determined by visual observation. The benefits of using this rigorous protocol, however, include: (1) providing a systematic quantification and indexing of sites that can facilitate prioritization for pollution abatement, and (2) providing quantitative data on rates of trash deposition following initial clean-up efforts. The RTA method does not directly measure loading of trash to downstream waterbodies. Given the observed high accumulation rates of trash resulting from winter floods, it is expected that even greater amounts of trash are delivered directly to downstream water bodies, including San Francisco Bay. Future efforts should focus on developing a monitoring approach for measuring transport rates of trash during flood events. The San Francisco Bay Region has a problem with trash in streams and the Bay. This protocol has assisted the Water Board in understanding the sources, management issues, and the overall scope of the problem of trash in waters of the state. It is hoped that the protocol will be as useful in evaluating the success of management efforts yet to come.
Acknowledgements Many staff members and student interns of the San Francisco Bay Regional Water Quality Control Board helped in the collection of trash data, including Carrie Austin, Glynnis Collins, Orrin Cook, Matt Cover, Patrick Evans, Terri Fashing, Kim Harrison, Jeff Kapellas, Alicia Mariscal, Steve Moore, Tom Ro, Daniella Rough, Anne Senter, Shelby Sheehan, Karen Taberski, Arnie Thompson, and Nelia White. Staff and volunteers from other agencies and organizations provided helpful comments on the protocol and helped in sampling, including Paul Randall and Linda Burkeley (EOA, Inc.), the Santa Clara Valley Urban Runoff Program, the Alameda County Clean Water Program, Friends of Five Creeks, and the San Pablo Creek Watershed Awareness Network.
- - 33

A Rapid Trash Assessment Method Applied to Waters of the San Francisco Bay Region: January 20, 2007 Trash Measurement in Streams
Figure 16: Water Board staff remove a shopping cart from the Booker T. Anderson Park site on Baxter Creek. Photo by Kim Harrison, August 23, 2005.
- - 34
A Rapid Trash Assessment Method Applied to Waters of the San Francisco Bay Region: January 20, 2007 Trash Measurement in Streams
References Andrady, A.E. 1990. Environmental degradation of plastics under land and marine exposure conditions. Pp. 848-869 in R. S. Shomura and M.L. Godrey (eds.), Proceedings of the Second International Conference on Marine Debris, April 2-7, 1989. Honolulu, HI. U.S. Department of Commerce, NOAA Technical Memorandum, NMFS, NOAA-TM-NMFS-SWFC-154. Coe, J.M. and D.B. Rogers. 1996. Marine Debris Sources, Impacts and Solutions. Springer-Verlag, New York, NY. 432 p. Day, R.H. and D. G. Shaw. 1987. Patterns in the abundance of pelagic plastic and tar in the North Pacific Ocean: 1976-1985. Mar. Poll. Bull. 18:311-316. Hoagland, P. and H.L. Kite-Powell. 1997. Characterization and mitigation of marine debris in the Gulf of Maine. Report to the U.S. Gulf of Maine Association. Woods Hole Research Consortium, Duxbury, MS. Kirkley, J. and K. McConnell. 1996. Marine debris: benefits, costs and choices. Pp. 161-171 in J.M. Coe and D.B. Rogers (eds.) Marine Debris Sources, Impacts and Solutions, Springer-Verlag, New York, NY. Laist, D.W. 1987. Overview of biological effects of lost and discarded plastic debris in the marine environment. Mar. Poll. Bull. 18:319-326. Laist, D.W., J.M. Coe and K.J. O’Hara. 1999. Marine Debris Pollution. Pgs. 342-366 in J.R. Twiss, Jr. and R.R. Reeves (eds.) Conservation and Management of Marine Mammals, Smithsonian Institution Press. Washington, DC. Laist, D. W. and M. Liffmann. 2000. Impacts of marine debris: research and management needs. Issue papers of the International Marine Debris Conference, Aug. 6-11, 2000. Honolulu, HI, pp. 16-29. Marine Mammal Commission. 1996. Marine Mammal Commission Annual Report to Congress. “Effects of Pollution on Marine Mammals.” Bethesda, MD. 247 p. McCauley, S.J. and K.A. Bjorndahl. 1999. Conservation implications of dietary dilution from debris ingestion: sublethal effects in post-hatchling loggerhead sea turtles. Conserv. Biol. 13(4):925-929. Miller, J. and E. Jones. 1999. A study of shoreline trash: 1989-1998, Padre Island National Seashore. U.S. Department of the Interior, National Parks Service, Denver, CO. Moore, C.J., S.L. Moore, M.K. Leecaster and S.B. Weisberg. 2001. A comparison of plastic and plankton in the North Pacific central gyre. Mar. Poll. Bull. v.42, n.12, Dec. 01.
- - 35

A Rapid Trash Assessment Method Applied to Waters of the San Francisco Bay Region: January 20, 2007 Trash Measurement in Streams
Moore, S.L. and M.J. Allen. 2000. Distribution of anthropogenic and natural debris on the mainland shelf of the Southern California Bight. Mar. Poll. Bull. 40:83-88. Pruter, A.T. 1987. Sources, quantities and distribution of persistent plastics in the marine environment. Mar. Poll. Bull. 18(6B): 305-310. Ribic, C.A., S. W. Johnson, and C.A. Cole. 1997. Distribution, type, accumulation, and source of marine debris in the United States, 1989-1993. Pp 35-47 in Coe, J.M. and D.B. Rogers (eds.) Marine Debris Sources, Impacts and Solutions, Springer-Verlag, New York, NY. Sheavly, S.B. 2004. Marine Debris: an Overview of a Critical Issue for our Oceans. 2004 International Coastal Cleanup Conference, San Juan, Puerto Rico. The Ocean Conservancy. Shomura, R.S. and H.O. Yoshida (eds.). 1985. Proceedings of the workshop on the fate and impact of marine debris 27-29 November 1984, Honolulu, HI. U.S. Department of Commerce. NOAA Technical Memorandum NMFS-SWFSC-154. Vol I. 774 p. Smith, K., X. Zhang, and R. Palmquist. 1996. The economic value of controlling marine debris. Pp. 187-203 in J.M. Coe and D.B. Rogers (eds.) Marine Debris Sources, Impacts and Solutions, Springer-Verlag, New York, NY. U.S. Environmental Protection Agency (U.S. EPA). 1992. Plastic Pellets in the Aquatic Environment: Sources and Recommendations. U.S. EPA 842-B-92-010. Washington, DC. U.S. Environmental Protection Agency (U.S. EPA). 2001. Draft Assessing and Monitoring Floatable Debris. U.S. Environmental Protection Agency (U.S. EPA). 2002. The Definition, Characterization and Sources of Marine Debris. Unit 1 of Turning the Tide on Trash, a Learning Guide on Marine Debris.
- - 36

A Rapid Trash Assessment Method Applied to Waters of the San Francisco Bay Region: January 20, 2007 Trash Measurement in Streams
APPENDIX A
RAPID TRASH ASSESSMENT PROTOCOL

Rapid Trash Assessment Worksheet Surface Water Ambient Monitoring Program, San Francisco Bay Regional Water Quality Control Board
WATERSHED/STREAM: _______________________________ DATE/TIME: _______________ MONITORING GROUP, STAFF: _________________________ SAMPLE ID: _______________ SITE DESCRIPTION (Station Name, Number, etc.): ______________________________________
CONDITION CATEGORY Trash Assessment Parameter
Optimal Sub optimal Marginal Poor
1. Level of Trash
On first glance, no trash visible. Little or no trash (<10 pieces) evident when streambed and stream banks are closely examined for litter and debris, for instance by looking under leaves.
On first glance, little or no trash visible. After close inspection small levels of trash (10-50 pieces) evident in stream bank and streambed.
Trash is evident in low to medium levels (51-100 pieces) on first glance. Stream, bank surfaces, and riparian zone contain litter and debris. Evidence of site being used by people: scattered cans, bottles, food wrappers, blankets, clothing.
Trash distracts the eye on first glance. Stream, bank surfaces, and immediate riparian zone contain substantial levels of litter and debris (>100 pieces). Evidence of site being used frequently by people: many cans, bottles, and food wrappers, blankets, clothing.
SCORE 20 19 18 17 16 15 14 13 12 11 10 9 8 7 6 5 4 3 2 1 0 2. Actual Number of Trash Items Found
0 to 10 trash items found based on a trash assessment of a 100-foot stream reach.
11 to 50 trash items found based on a trash assessment of a 100-foot stream reach.
51 to 100 trash items found based on a trash assessment of a 100-foot stream reach.
Over 100 trash items found based on a trash assessment of a 100-foot stream reach.
SCORE 20 19 18 17 16 15 14 13 12 11 10 9 8 7 6 5 4 3 2 1 0 3. Threat to Aquatic Life
Trash, if any, is mostly paper or wood products or other biodegradable materials. Note: A large amount of rapidly biodegradable material like food waste creates high oxygen demand, and should not be scored as optimal.
Little or no (<10 pieces) transportable, persistent, buoyant litter such as: hard or soft plastics, Styrofoam, balloons, cigarette butts. Presence of settleable, degradable, and non-toxic debris such as glass or metal.
Medium prevalence (10-50 pieces) of transportable, persistent, buoyant litter such as: hard or soft plastics, Styrofoam, balloons, cigarette butts Larger deposits (< 50 pieces) of settleable debris such as glass or metal. Any evidence of clumps of deposited yard waste or leaf litter.
Large amount (>50 pieces) of transportable, persistent, buoyant litter such as: hard or soft plastics, balloons, Styrofoam, cigarette butts; toxic items such as batteries, lighters, or spray cans; large clumps of yard waste or dumped leaf litter; or large amount (>50 pieces) of settleable glass or metal.
SCORE 20 19 18 17 16 15 14 13 12 11 10 9 8 7 6 5 4 3 2 1 0 4. Threat to Human Health
Trash contains no evidence of bacteria or virus hazards such as medical waste, diapers, pet or human waste. No evidence of toxic substances such as chemical containers or batteries. No ponded water for mosquito production. No evidence of puncture and laceration hazards such as broken glass or metal debris.
No bacteria or virus hazards or sources of toxic substances, but small presence (<10 pieces) of puncture and laceration hazards such as broken glass and metal debris. No presence of ponded water in trash items such as tires or containers that could facilitate mosquito production.
Presence of any one of the following: hypodermic needles or other medical waste; used diaper, pet waste, or human feces; any toxic substance such as chemical containers, batteries, or fluorescent light bulbs (mercury). Medium prevalence (10-50 pieces) of puncture hazards.
Presence of more than one of the items described in the marginal condition category, or high prevalence of any one item (e.g. greater than 50 puncture or laceration hazards).
SCORE 20 19 18 17 16 15 14 13 12 11 10 9 8 7 6 5 4 3 2 1 0

Rapid Trash Assessment Worksheet Surface Water Ambient Monitoring Program, San Francisco Bay Regional Water Quality Control Board
CONDITION CATEGORY Trash Assessment Parameter
Optimal Sub optimal Marginal Poor
5. Illegal Dumping Illegal Littering
D: No evidence of illegal dumping. No bags of trash, no yard waste, no household items placed at site to avoid proper disposal, no shopping carts. L: Any trash is incidental litter (< 5 pieces) or carried downstream from another location.
D: Some evidence of illegal dumping. Limited vehicular access limits the amount of potential dumping, or material dumped is diffuse paper-based debris. L: Some evidence of litter within creek and banks originating from adjacent land uses (<10 pieces).
D: Presence of one of the following: furniture, appliances, shopping carts, bags of garbage or yard waste, coupled with vehicular access that facilitates in-and-out dumping of materials to avoid landfill costs. L: Prevalent (10-50 pieces) in-stream or shoreline littering that appears to originate from adjacent land uses.
D: Evidence of chronic dumping, with more than one of the following items: furniture, appliances, shopping carts, bags of garbage, or yard waste. Easy vehicular access for in-and-out dumping of materials to avoid landfill costs. L: Large amount (>50 pieces) of litter within creek and on banks that appears to originate from adjacent land uses.
D-SCORE 10 9 8 7 6 5 4 3 2 1 0 L-SCORE 10 9 8 7 6 5 4 3 2 1 0 6. Accum-ulation of Trash
There does not appear to be a problem with trash accumulation from downstream transport. Trash, if any, appears to have been directly deposited at the stream location.
Some evidence (<10 pieces) that litter and debris have been transported from upstream areas to the location, based on evidence such as silt marks, faded colors or location near high water line.
Evidence that (10 to 50 pieces) trash is carried to the location from upstream, as evidenced by its location near high water line, siltation marks on the debris, or faded colors.
Trash appears to have accumulated in substantial quantities at the location based on delivery from upstream areas, and is in various states of degradation based on its persistence in the waterbody. Over 50 items of trash have been carried to the location from upstream.
SCORE 20 19 18 17 16 15 14 13 12 11 10 9 8 7 6 5 4 3 2 1 0 Total Score _______________ SITE DEFINITION: UPPER/LOWER BOUNDARIES OF REACH: ___________________________________________ HIGH WATER LINE: _______________________________________________________________ UPPER EXTENT OF BANKS OR SHORE: ______________________________________________ __________________________________________________________________________________ NOTES: __________________________________________________________________________________ __________________________________________________________________________________ __________________________________________________________________________________ __________________________________________________________________________________ __________________________________________________________________________________ __________________________________________________________________________________
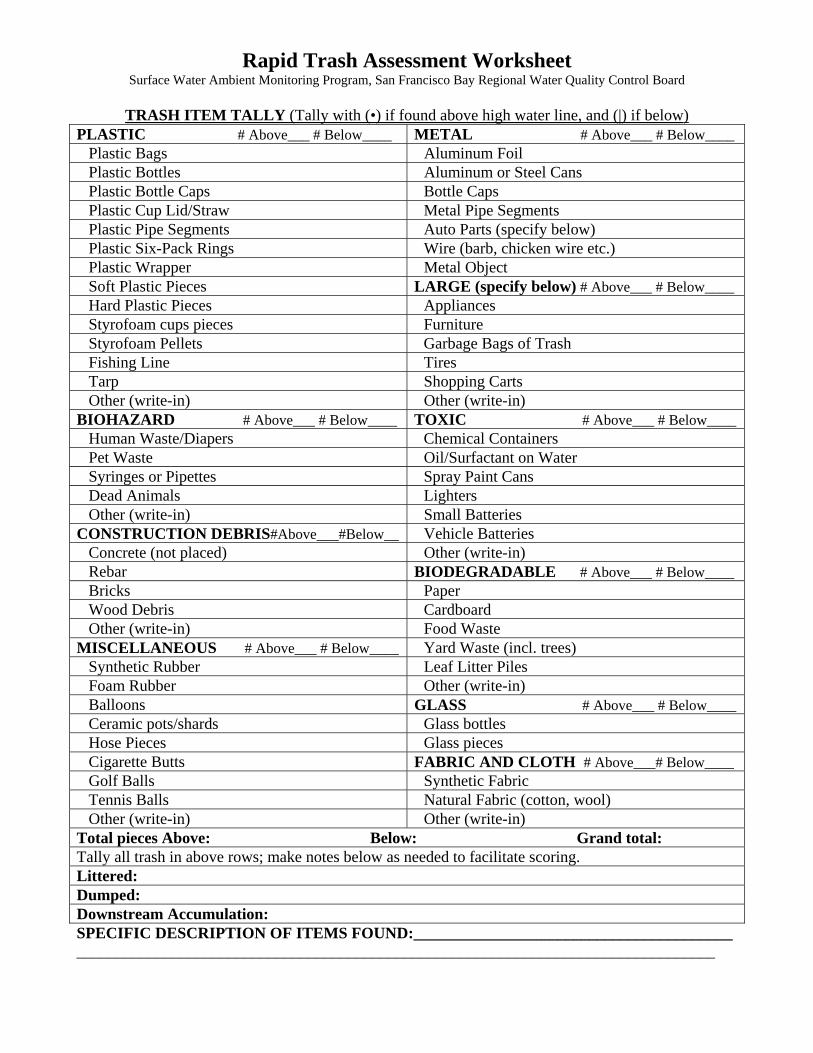
Rapid Trash Assessment Worksheet Surface Water Ambient Monitoring Program, San Francisco Bay Regional Water Quality Control Board
TRASH ITEM TALLY (Tally with (•) if found above high water line, and (|) if below)PLASTIC # Above___ # Below____ METAL # Above___ # Below____
Plastic Bags Aluminum Foil Plastic Bottles Aluminum or Steel Cans Plastic Bottle Caps Bottle Caps Plastic Cup Lid/Straw Metal Pipe Segments Plastic Pipe Segments Auto Parts (specify below) Plastic Six-Pack Rings Wire (barb, chicken wire etc.) Plastic Wrapper Metal Object Soft Plastic Pieces LARGE (specify below) # Above___ # Below____ Hard Plastic Pieces Appliances Styrofoam cups pieces Furniture Styrofoam Pellets Garbage Bags of Trash Fishing Line Tires Tarp Shopping Carts Other (write-in) Other (write-in)
BIOHAZARD # Above___ # Below____ TOXIC # Above___ # Below____ Human Waste/Diapers Chemical Containers Pet Waste Oil/Surfactant on Water Syringes or Pipettes Spray Paint Cans Dead Animals Lighters Other (write-in) Small Batteries
CONSTRUCTION DEBRIS#Above___#Below__ Vehicle Batteries Concrete (not placed) Other (write-in) Rebar BIODEGRADABLE # Above___ # Below____ Bricks Paper Wood Debris Cardboard Other (write-in) Food Waste
MISCELLANEOUS # Above___ # Below____ Yard Waste (incl. trees) Synthetic Rubber Leaf Litter Piles Foam Rubber Other (write-in) Balloons GLASS # Above___ # Below____ Ceramic pots/shards Glass bottles Hose Pieces Glass pieces Cigarette Butts FABRIC AND CLOTH # Above___# Below____ Golf Balls Synthetic Fabric Tennis Balls Natural Fabric (cotton, wool) Other (write-in) Other (write-in)
Total pieces Above: Below: Grand total: Tally all trash in above rows; make notes below as needed to facilitate scoring. Littered: Dumped: Downstream Accumulation: SPECIFIC DESCRIPTION OF ITEMS FOUND:________________________________________ ________________________________________________________________________________

A Rapid Trash Assessment Method Applied to Waters of the San Francisco Bay Region: January 20, 2007 Trash Measurement in Streams
APPENDIX B
RAPID TRASH ASSESSMENT METHOD EVALUATION OCTOBER 2002
Evaluation of the Rapid Trash Assessment Methodology October 20, 2002 The rapid trash assessment methodology was developed by Steve Moore and Matthew Cover of the San Francisco Bay Regional Board’s Surface Water Ambient Monitoring Program. The scoring system is based on the physical habitat evaluation forms associated with the federal and state guidance on rapid bioassessment. This methodology was developed with three goals: to be representative, sensitive, and objective. To be representative, the generated scores need to represent an assessment of impairment of beneficial uses by trash. Beneficial uses affected by trash include aquatic life uses, water contact uses, and aesthetic enjoyment of waters. Also, the assessment methodology needs to consider how trash gets to the water body (direct dumping vs. accumulation in drainage systems) to represent an evaluation of management actions related to controlling dumping, littering, or accumulation of trash. The six trash assessment parameters of the methodology cover this range of issues associated with beneficial uses and management actions related to trash in water bodies. The assessment methodology has been structured to balance these issues in a scoring system, which we believe has achieved the necessary level of representativeness. To be sensitive, the generated scores need to be able to distinguish light, medium, and heavy states of impairment of beneficial uses by trash at different sites and seasons. The overall score range of 0 to 120 should provide this sensitivity, where sites with scores of 60 +/- 15% can be distinguished in threat to beneficial uses from sites with scores of 80 +/- 15%. To be objective, variability needs to be minimized. The generated scores by different teams on the same reach should not range too widely. The scores should not be more than 15% different than one another. To evaluate sensitivity and objectivity of this methodology, three teams were deployed on the same day at four sites located along East Bay creeks. One site was located on Wilkie Creek, a tributary to San Pablo Creek in El Sobrante (next to a high school). Another site was located on Wildcat Creek in Alvarado Park in Richmond. These two sites were surveyed by Regional Board staff on August 14, 2002. Two sites were located on Sausal Creek in Oakland, at Dimond Park and at Barry Street (residential area), surveyed on August 20, 2002 by staff of the Regional Board and the Alameda and Santa Clara urban runoff programs. Of these test sites, the two urban park sites are considered to be more actively “managed” for trash, with nearby trashcans and available park and volunteer personnel. The high school site and the residential site had no evident active management, and these sites had higher trash tallies. Therefore, in evaluating whether the assessment methodology is sufficiently sensitive, we believe the scores generated for the park sites should be statistically higher (more optimal) than the other sites.

TABLE 1
RAPID TRASH ASSESSMENT RESULTS OF METHODOLOGY EVALUATION
Trash Assessment Parameter Scores Trash Item Site Water Date Staff 1 2 3 4 5 6 Total Tally
Body Qual. Quant. Aq. Life Hum. Health Dumping Accum. Score Total Alvarado Park Wildcat Creek 8/14/02 NW, GC 10 5 10 13 15 15 68 55 Alvarado Park Wildcat Creek 8/14/02 SM, PE 14 4 9 10 8 15 60 68 Alvarado Park Wildcat Creek 8/14/02 MC, KT 10 5 6 6 13 16 56 50 Coefficients of Variation: 0.20 0.12 0.25 0.36 0.30 0.04 0.10 0.16 Anza School Wilkie Creek 8/14/02 GC, MC 5 0 3 16 10 2 36 334 Anza School Wilkie Creek 8/14/02 SM, PE 3 1 3 13 14 2 36 140 Anza School Wilkie Creek 8/14/02 KT, NW 6 0 6 13 12 2 39 444 Coefficients of Variation: 0.33 1.73 0.43 0.12 0.17 0.00 0.05 0.50 Dimond Park Sausal Creek 8/20/02 GC, Alej. 13 0 11 20 15 15 74 138 Dimond Park Sausal Creek 8/20/02 MC, PR 10 4 10 15 11 14 64 70 Dimond Park Sausal Creek 8/20/02 SM, NW 8 4 9 10 13 14 58 75 Coefficients of Variation: 0.24 0.87 0.10 0.33 0.15 0.04 0.12 0.40 Barry Street Sausal Creek 8/20/02 MC, PR 2 1 5 10 6 8 32 291 Barry Street Sausal Creek 8/20/02 NW, SM 3 1 3 12 5 9 33 293 Barry Street Sausal Creek 8/20/02 GC, Alej. 4 0 5 11 6 10 36 404 Coefficients of Variation: 0.33 0.87 0.27 0.09 0.10 0.11 0.06 0.20

The tallies and scores from the test assessments are summarized in Table 1. Overall, they demonstrate that the assessment methodology is sufficiently sensitive and objective to be useful in evaluating ambient conditions, trash management actions, and the effect of public access on trash levels. Except for two experienced staff persons, these test assessments were conducted mostly by staff with little or no experience, but some limited training in the use of the methodology. As such, the test assessment is a reasonable representation of what would be expected if a team of municipal employees or interested citizens conducted the assessment. The consistency of the scores in the test assessment underscores the confidence that Regional Board staff have in the methodology. Nevertheless, a few lessons were learned through this exercise and improvements made to create Version 6 of the Rapid Trash Assessment, discussed below. As shown in Table 1, the total scores for the 4 sites were clustered closely, with some variability noted in individual trash assessment parameters. The exception was the Dimond Park site at Sausal Creek, with scores ranging from 58 to 74. During the field exercise, the staff discussed this difference and traced it to the variable human health score (20, 15, and 10). The key to the scoring difference was that one team noted the presence of a used diaper on the stream bank near the water, and others had mis-characterized it as paper or fabric waste. Also, some broken glass on the bank was noted by the team that scored a “15.” This example shows the importance of identifying human health hazards, if any, and how the presence of one or two items can change the score significantly. The instructions have been modified accordingly, emphasizing that tallying can be estimated, but that bio-hazards must be carefully tallied to allow consistent scoring. All field staff agreed that the scores would have been less variable if all the teams had correctly identified the diaper. Despite some variability between teams, the assessment methodology achieved the desired level of sensitivity. As hoped, the urban park sites had significantly higher scores than the unmanaged sites, demonstrating the desired sensitivity of the methodology. Alvarado Park (mean=61, CV=0.10) and Dimond Park (mean=65, CV=0.12) were clearly distinguishable from Anza School (mean=37, CV=0.05) and Barry Street on Sausal Creek (mean=34, CV=0.06). In Table 1, the coefficient of variation (CV), which is the standard deviation divided by the arithmetic mean, expresses the variability of the scores and tallies of the rapid trash assessment. The CV overstates variability at the low end (scores of 0, 1, and 2), so the relatively high CVs associated with these scores for the quantitative level of trash (assessment parameter 2) can be ignored and the scores visually compared. For the overall score, a CV of 0.15 or less is desirable for demonstrating objectivity of the methodology. As discussed above, the only case where significant variability occurred was Dimond Park, and the variability was due to improper field identification of trash. As with the physical habitat evaluation associated with the rapid bioassessment procedures, such skills are expected to be acquired by a field technician through experience, and variability of that technician’s scoring subsequently minimized. The total trash tallies were substantially more variable than the assessment scores, as expected (Table 2). The rapid trash assessment procedure does not emphasize that these tallies be exact, but rather be used to help guide the assessment scoring by characterizing relative levels of different trash items and materials. Much of the variability in the overall tallies in Table 2 is ascribed to different teams’ conventions of counting broken items as individual pieces or just as one item (e.g., a broken glass bottle). Additional guidance is now provided in Version 6 regarding conventions to be used for tallying “broken” trash items, rooted in the principle of exposure to fish, wildlife, or human users of the water body. Tallies less than 50 are expected to be less variable and with the additional guidance, we expect tallies to exhibit less variability than these test assessments.

TABLE 2 RAPID TRASH ASSESSMENT METHODOLOGY EVALUATION
TRASH ITEM TALLY RESULTS Trash Item Tally Site Water Date Staff Plastic Biohaz. Const. Misc. Metal Large Toxic Biodeg. Glass Fabric
Body in* out* in out in out in out in out in out in out in out in out in out TOTAL Alvarado Park Wildcat Creek 8/14/02 NW, GC 21 4 0 0 0 0 7 1 1 1 0 1 0 0 3 7 7 0 1 1 55 Alvarado Park Wildcat Creek 8/14/02 SM, PE 11 19 0 2 1 1 7 3 0 1 0 5 0 0 10 3 2 0 0 3 68 Alvarado Park Wildcat Creek 8/14/02 MC, KT 15 6 0 1 0 0 3 2 5 0 0 0 1 0 7 2 3 3 1 1 50 Coefficients of Variation: 0.1 6
0
Anza School Wilkie Creek 8/14/02 GC, MC 192 87 0 0 3 4 14 0 3 6 0 0 0 0 8 13 1 1 1 1 334 Anza School Wilkie Creek 8/14/02 SM, PE 21 69 0 0 11 4 7 0 3 3 0 0 0 0 3 19 0 0 0 0 140 Anza School Wilkie Creek 8/14/02 KT, NW 200 147 0 0 3 4 1 17 7 8 0 0 0 0 10 46 1 0 0 0 444 Coefficients of Variation: 0.5 Dimond Park Sausal Creek 8/20/02 GC, Alej. 8 88 0 0 0 0 2 2 5 4 0 0 0 3 23 0 0 0 3 0 138 Dimond Park Sausal Creek 8/20/02 MC, PR 20 17 0 0 0 0 1 0 5 3 0 0 0 0 9 8 2 2 3 0 70 Dimond Park Sausal Creek 8/20/02 SM, NW 16 25 0 1 6 0 2 1 2 3 0 0 0 0 6 9 0 0 3 1 75 Coefficients of Variation: 0.40 Barry Street Sausal Creek 8/20/02 MC, PR 59 26 0 0 26 2 35 1 25 1 0 1 1 2 13 9 82 2 5 1 291 Barry Street Sausal Creek 8/20/02 NW, SM 65 42 0 0 49 8 9 2 10 14 0 1 1 1 8 15 57 6 2 3 293 Barry Street Sausal Creek 8/20/02 GC, Alej. 63 50 0 0 84 8 5 4 15 13 0 1 0 0 10 13 73 59 5 1 404 Coefficients of Variation: 0.20
* "in" refers to in-stream, and "out" refers to above high water line, but on banks or shore where transport to water body is probable.

The tallies above 50 do not have a significant effect on the scoring outcome, because the assessment parameter 2, actual number of trash items, allows a small range of 0-5 scoring for sites with more than 50 items. Resolution is not required at these higher levels of trash, but items that can substantially affect the score, such as large appliances or health-related items need to be tallied to ensure consistent and accurate scoring. In applying the methodology, it has been SWAMP staff’s experience that photography does not provide adequate illustration of trash conditions, unless there are large items or the photography is very close-up (but then it only represents a few square feet). Much of the trash that can affect aquatic life or human health is not visible in a digital photograph of a sampling site, due to vegetative cover and reflection of the water surface. Based on evaluations at over 40 sites, we have determined without exception that photography is less effective at documenting trash conditions than the Rapid Trash Assessment scoring methodology. The Rapid Trash Assessment is less sensitive at the low end of the scoring range, corresponding to conditions commonly observed in the lower watersheds of urbanized areas. Based on SWAMP surveys conducted in 2002, many of the urban sites located in the lower portions of watersheds exhibit total scores below 40. It is difficult to distinguish conditions at these “trash hotspots,” since this Rapid Trash Assessment methodology covers the range of conditions from optimal to poor. Since the urban areas that register “poor” scores tend to be of most interest in cleanup programs sponsored by local organizations and agencies, some concern has been expressed that a separate hotspot evaluation methodology may need to be developed, perhaps making more use of photography. A separate methodology may be necessary to demonstrate progress at the most impacted sites, but this methodology evaluation, utilizing independent assessment teams, has shown that the Rapid Trash Assessment can distinguish sites within urban areas that are receiving more trash management from areas that are not. In both examples evaluated, the urban parks had significantly higher scores than the sites that appear to receive little or no trash management.

APPENDIX C RAW RTA TRASH SCORE DATA
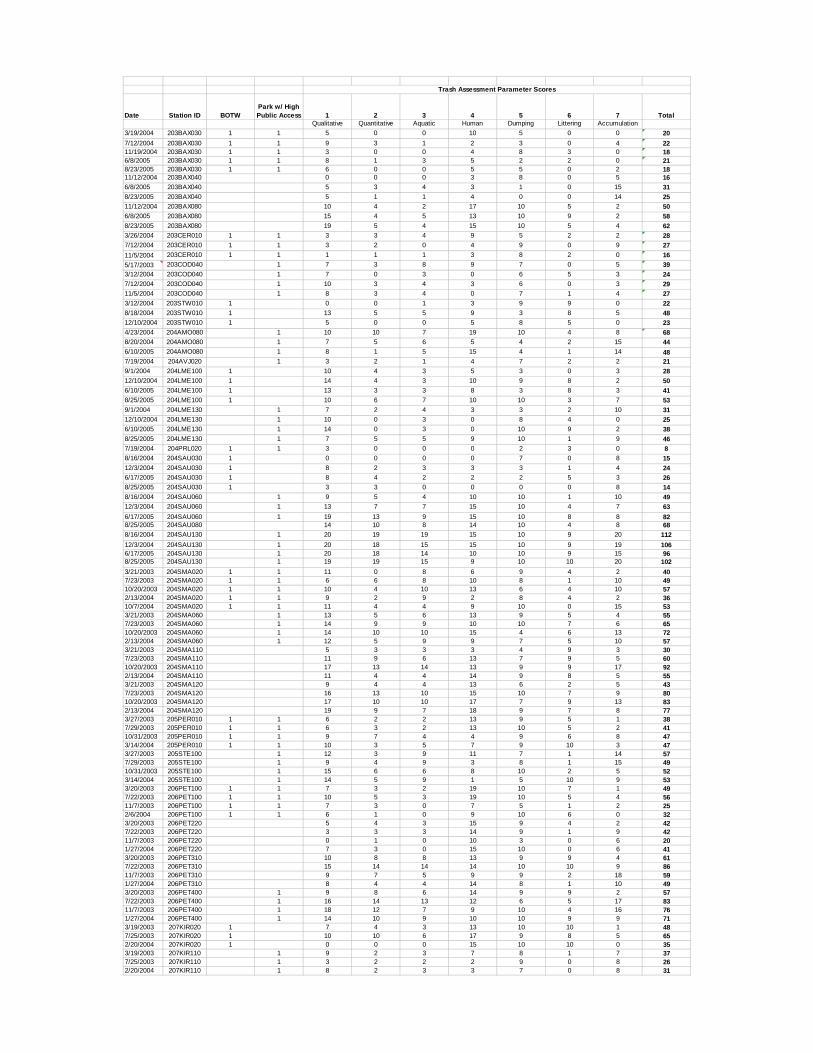
Date Station ID BOTWPark w/ High Public Access 1 2 3 4 5 6 7 Tota
Qualitative Quantitativel
Aquatic Human Dumping Littering Accumulation3/19/2004 203BAX030 1 1 5 0 0 10 5 0 0 207/12/2004 203BAX030 1 1 9 3 1 2 3 0 4 2211/19/2004 203BAX030 1 1 3 0 0 4 8 3 0 186/8/2005 203BAX030 1 1 8 1 3 5 2 2 0 218/23/2005 203BAX030 1 1 6 0 0 5 5 0 2 1811/12/2004 203BAX040 0 0 0 3 8 0 5 166/8/2005 203BAX040 5 3 4 3 1 0 15 318/23/2005 203BAX040 5 1 1 4 0 0 14 2511/12/2004 203BAX080 10 4 2 17 10 5 2 506/8/2005 203BAX080 15 4 5 13 10 9 2 588/23/2005 203BAX080 19 5 4 15 10 5 4 623/26/2004 203CER010 1 1 3 3 4 9 5 2 2 287/12/2004 203CER010 1 1 3 2 0 4 9 0 9 2711/5/2004 203CER010 1 1 1 1 1 3 8 2 0 165/17/2003 203COD040 1 7 3 8 9 7 0 5 393/12/2004 203COD040 1 7 0 3 0 6 5 3 247/12/2004 203COD040 1 10 3 4 3 6 0 3 2911/5/2004 203COD040 1 8 3 4 0 7 1 4 273/12/2004 203STW010 1 0 0 1 3 9 9 0 228/18/2004 203STW010 1 13 5 5 9 3 8 5 4812/10/2004 203STW010 1 5 0 0 5 8 5 0 234/23/2004 204AMO080 1 10 10 7 19 10 4 8 688/20/2004 204AMO080 1 7 5 6 5 4 2 15 446/10/2005 204AMO080 1 8 1 5 15 4 1 14 487/19/2004 204AVJ020 1 3 2 1 4 7 2 2 219/1/2004 204LME100 1 10 4 3 5 3 0 3 2812/10/2004 204LME100 1 14 4 3 10 9 8 2 506/10/2005 204LME100 1 13 3 3 8 3 8 3 418/25/2005 204LME100 1 10 6 7 10 10 3 7 539/1/2004 204LME130 1 7 2 4 3 3 2 10 3112/10/2004 204LME130 1 10 0 3 0 8 4 0 256/10/2005 204LME130 1 14 0 3 0 10 9 2 388/25/2005 204LME130 1 7 5 5 9 10 1 9 467/19/2004 204PRL020 1 1 3 0 0 0 2 3 0 88/16/2004 204SAU030 1 0 0 0 0 7 0 8 1512/3/2004 204SAU030 1 8 2 3 3 3 1 4 246/17/2005 204SAU030 1 8 4 2 2 2 5 3 268/25/2005 204SAU030 1 3 3 0 0 0 0 8 148/16/2004 204SAU060 1 9 5 4 10 10 1 10 4912/3/2004 204SAU060 1 13 7 7 15 10 4 7 636/17/2005 204SAU060 1 19 13 9 15 10 8 8 828/25/2005 204SAU080 14 10 8 14 10 4 8 688/16/2004 204SAU130 1 20 19 19 15 10 9 20 11212/3/2004 204SAU130 1 20 18 15 15 10 9 19 1066/17/2005 204SAU130 1 20 18 14 10 10 9 15 968/25/2005 204SAU130 1 19 19 15 9 10 10 20 1023/21/2003 204SMA020 1 1 11 0 8 6 9 4 2 407/23/2003 204SMA020 1 1 6 6 8 10 8 1 10 4910/20/2003 204SMA020 1 1 10 4 10 13 6 4 10 572/13/2004 204SMA020 1 1 9 2 9 2 8 4 2 3610/7/2004 204SMA020 1 1 11 4 4 9 10 0 15 533/21/2003 204SMA060 1 13 5 6 13 9 5 4 557/23/2003 204SMA060 1 14 9 9 10 10 7 6 6510/20/2003 204SMA060 1 14 10 10 15 4 6 13 722/13/2004 204SMA060 1 12 5 9 9 7 5 10 573/21/2003 204SMA110 5 3 3 3 4 9 3 307/23/2003 204SMA110 11 9 6 13 7 9 5 6010/20/2003 204SMA110 17 13 14 13 9 9 17 922/13/2004 204SMA110 11 4 4 14 9 8 5 553/21/2003 204SMA120 9 4 4 13 6 2 5 437/23/2003 204SMA120 16 13 10 15 10 7 9 8010/20/2003 204SMA120 17 10 10 17 7 9 13 832/13/2004 204SMA120 19 9 7 18 9 7 8 773/27/2003 205PER010 1 1 6 2 2 13 9 5 1 387/29/2003 205PER010 1 1 6 3 2 13 10 5 2 4110/31/2003 205PER010 1 1 9 7 4 4 9 6 8 473/14/2004 205PER010 1 1 10 3 5 7 9 10 3 473/27/2003 205STE100 1 12 3 9 11 7 1 14 577/29/2003 205STE100 1 9 4 9 3 8 1 15 4910/31/2003 205STE100 1 15 6 6 8 10 2 5 523/14/2004 205STE100 1 14 5 9 1 5 10 9 533/20/2003 206PET100 1 1 7 3 2 19 10 7 1 497/22/2003 206PET100 1 1 10 5 3 19 10 5 4 5611/7/2003 206PET100 1 1 7 3 0 7 5 1 2 252/6/2004 206PET100 1 1 6 1 0 9 10 6 0 323/20/2003 206PET220 5 4 3 15 9 4 2 427/22/2003 206PET220 3 3 3 14 9 1 9 4211/7/2003 206PET220 0 1 0 10 3 0 6 201/27/2004 206PET220 7 3 0 15 10 0 6 413/20/2003 206PET310 10 8 8 13 9 9 4 617/22/2003 206PET310 15 14 14 14 10 10 9 8611/7/2003 206PET310 9 7 5 9 9 2 18 591/27/2004 206PET310 8 4 4 14 8 1 10 493/20/2003 206PET400 1 9 8 6 14 9 9 2 577/22/2003 206PET400 1 16 14 13 12 6 5 17 8311/7/2003 206PET400 1 18 12 7 9 10 4 16 761/27/2004 206PET400 1 14 10 9 10 10 9 9 713/19/2003 207KIR020 1 7 4 3 13 10 10 1 487/25/2003 207KIR020 1 10 10 6 17 9 8 5 652/20/2004 207KIR020 1 0 0 0 15 10 10 0 353/19/2003 207KIR110 1 9 2 3 7 8 1 7 377/25/2003 207KIR110 1 3 2 2 2 9 0 8 262/20/2004 207KIR110 1 8 2 3 3 7 0 8 31
Trash Assessment Parameter Scores

APPENDIX D FIELD VISIT AND TRASH COLLECTION HEALTH AND SAFETY SOPs

California Regional Water Quality Control Board, San Francisco Bay Region (Region 2) Surface Water Ambient Monitoring Program (SWAMP)
Field Visit Health and Safety Standard Operating Procedure (SOP)
Version 2.0 2/27/2007 This document describes the health and safety procedures and equipment that SWAMP staff should follow for all field visits. The procedures below are in addition to what is specified in the SWAMP Quality Assurance Management Plan (QAMP) Appendix D and H (Puckett 2002). 1. All SWAMP staff and student technicians must receive, at a minimum, a 4-hour health and
safety training and any appropriate refresher courses given by a certified industrial hygienist within the previous 12 months.
2. It is recommended that all personnel review the SWAMP Field Methods Training CD prior to
any field visit. 3. Prior to visiting a site, permission to access the site should be obtained from the landowner
or manager. Permission should be either in writing or verbal. Written permission documents should be on file at the office. Complete written notes should reference all verbal permissions granted.
4. Prior to visiting a site, a field reconnaissance form should be completed. This form contains
the location and route to the nearest hospital, cell phone coverage information, 911 information, and specific site access information. A copy of this form should accompany the personnel visiting the site.
5. Prior to visiting a site, the field technicians’ planned site visits, contact info, and schedule
should be shared with at least one other staff member who will be working in the office during the site visit. The field crew will establish a time by which they will return to the office. If the crew has not returned by the appointed time nor made phone contact, the staff member in the office should attempt to contact the crew. If unsuccessful, the staff member in the office should notify the appropriate authorities in the area the field crew is working.
6. Site visits should always be performed by a minimum of two persons. 7. The following equipment should be on hand any time SWAMP field technicians perform a
field visit: • First aid kit • Copy of field recon sheet • Information on nearby hospitals • Road maps • Cell phone with charger • Copy of access permission(s)
Reference Puckett, M. 2002. Quality Assurance Management Plan for the State of California’s Surface Water Ambient Monitoring Program (“SWAMP”). California Department of Fish and Game, Monterey, CA. Prepared for the State Water Resources Control Board, Sacramento, CA. 145 pages plus Appendices.

California Regional Water Quality Control Board, San Francisco Bay Region (Region 2)
Surface Water Ambient Monitoring Program (SWAMP)
Rapid Trash Assessment (RTA) Health and Safety Standard Operating Procedures (SOPs) Version 2.0 2/27/2007
This document describes the health and safety procedures and equipment that SWAMP staff should follow for all field work performed during the Rapid Trash Assessment (RTA) methodology. The procedures below are in addition to what is specified in the SWAMP Field Visit SOP, SWAMP Quality Assurance Management Plan (QAMP) Appendix D and H (Puckett 2002). 1. All SWAMP staff and student technicians must receive, at a minimum, a 4-hour health and
safety training and any appropriate refresher courses given by a certified industrial hygienist within the previous 12 months.
2. The following equipment should be on hand, in addition to equipment specified in the Field
Visit SOP: • Nitrile gloves • Heavy duty rubber or neoprene gloves • Puncture resistant gloves • Safety glasses • Hard hat • N-95 face masks • Heavy duty trash bags • Sharps disposal container • Hazardous waste disposal container • Trash litter pick-up tools (e.g. Nifty Nabber©, EZ-Reacher©)
3. Field technicians picking up trash should have current vaccinations for tetanus and hepatitis A
and B. 4. During most RTA field visits sampling technicians are required to remove all trash items found at the site. Some trash items may pose a threat to the health and safety of field technicians. The following precautions should be followed:
a. Appropriate protective gloves and safety glasses should always be worn when handling trash.
b. When possible, trash should be picked up with the litter pick-up tool. c. When picking up uncontaminated sharp objects, such as glass or metal, puncture
resistant gloves should be worn. Sharps should be stored in a sharps disposal container.
d. Do not remove trash objects that are an unsafe weight or size to lift and carry.
e. Trash objects that are obviously hazardous, such as feces (human or other) and hypodermic needles, should only be removed by trained personnel. If an object poses a substantial health risk to people visiting the site, and it can be removed safely, the objects should be picked up using the trash litter pick-up tool and placed into a hazardous waste disposal container.
f. Many common household and construction materials found in trash may be hazardous, and should be disposed of separately as hazardous waste. These include fluorescent and high-intensity light bulbs and lamps (mercury), lighting ballasts (PCBs), thermostats (mercury), old pipes (lead), painted wood (prior to 1978: lead), batteries (heavy metals), transformers (PCBs), smoke detectors (metals), cleaning solutions, electronic equipment, and motor oil.
g. If crystalline material is noted on or in any container, the contents shall be considered to be a shock-sensitive waste and the container shall not be moved.
h. Unlabeled drums and containers shall be considered to contain hazardous substances and handled accordingly until the contents are positively identified and labeled by trained personnel.
i. Drums and containers under pressure, as evidenced by bulging or swelling, shall not be moved.
j. Drums and containers containing packaged laboratory wastes shall be considered to contain shock-sensitive or explosive materials and should not be moved.
k. Drums and containers containing radioactive wastes shall not be handled or moved. l. Report any suspicious, inappropriate or potentially hazardous waste dumping to
appropriate authorities. Reference Puckett, M. 2002. Quality Assurance Management Plan for the State of California’s Surface Water Ambient Monitoring Program (“SWAMP”). California Department of Fish and Game, Monterey, CA. Prepared for the State Water Resources Control Board, Sacramento, CA. 145 pages plus Appendices.