Transporter-Mediated Disposition, Clinical...
11
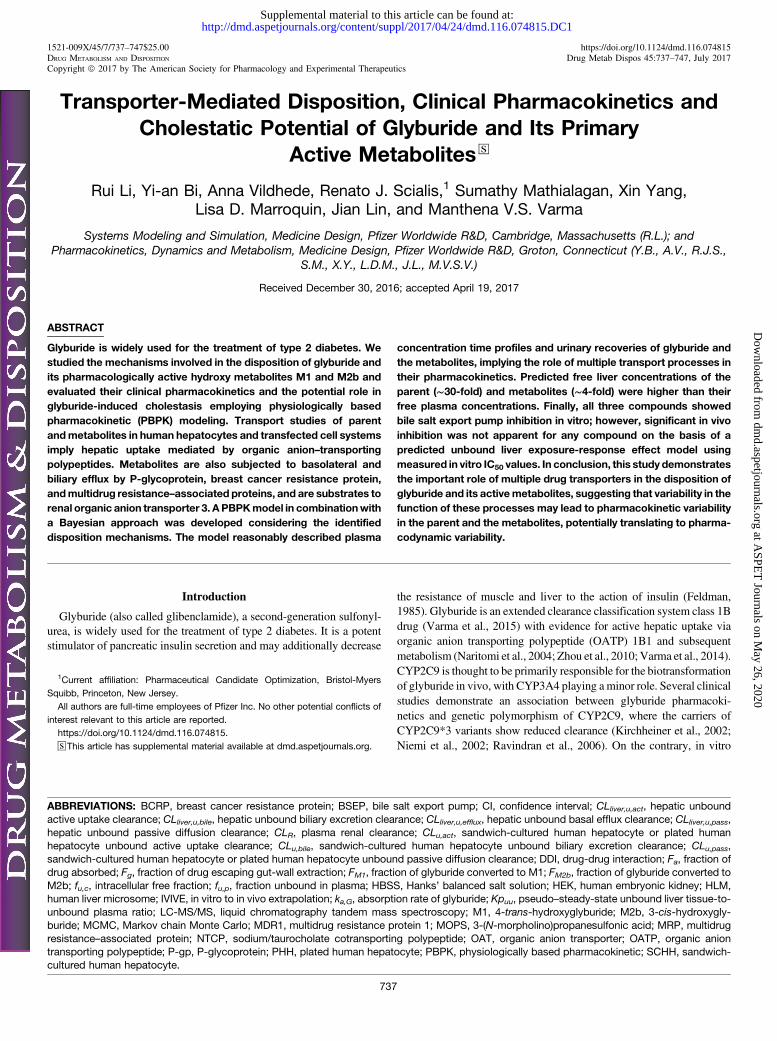
1521-009X/45/7/737–747$25.00 https://doi.org/10.1124/dmd.116.074815 DRUG METABOLISM AND DISPOSITION Drug Metab Dispos 45:737–747, July 2017 Copyright ª 2017 by The American Society for Pharmacology and Experimental Therapeutics Transporter-Mediated Disposition, Clinical Pharmacokinetics and Cholestatic Potential of Glyburide and Its Primary Active Metabolites s Rui Li, Yi-an Bi, Anna Vildhede, Renato J. Scialis, 1 Sumathy Mathialagan, Xin Yang, Lisa D. Marroquin, Jian Lin, and Manthena V.S. Varma Systems Modeling and Simulation, Medicine Design, Pfizer Worldwide R&D, Cambridge, Massachusetts (R.L.); and Pharmacokinetics, Dynamics and Metabolism, Medicine Design, Pfizer Worldwide R&D, Groton, Connecticut (Y.B., A.V., R.J.S., S.M., X.Y., L.D.M., J.L., M.V.S.V.) Received December 30, 2016; accepted April 19, 2017 ABSTRACT Glyburide is widely used for the treatment of type 2 diabetes. We studied the mechanisms involved in the disposition of glyburide and its pharmacologically active hydroxy metabolites M1 and M2b and evaluated their clinical pharmacokinetics and the potential role in glyburide-induced cholestasis employing physiologically based pharmacokinetic (PBPK) modeling. Transport studies of parent and metabolites in human hepatocytes and transfected cell systems imply hepatic uptake mediated by organic anion–transporting polypeptides. Metabolites are also subjected to basolateral and biliary efflux by P-glycoprotein, breast cancer resistance protein, and multidrug resistance–associated proteins, and are substrates to renal organic anion transporter 3. A PBPK model in combination with a Bayesian approach was developed considering the identified disposition mechanisms. The model reasonably described plasma concentration time profiles and urinary recoveries of glyburide and the metabolites, implying the role of multiple transport processes in their pharmacokinetics. Predicted free liver concentrations of the parent (∼30-fold) and metabolites (∼4-fold) were higher than their free plasma concentrations. Finally, all three compounds showed bile salt export pump inhibition in vitro; however, significant in vivo inhibition was not apparent for any compound on the basis of a predicted unbound liver exposure-response effect model using measured in vitro IC 50 values. In conclusion, this study demonstrates the important role of multiple drug transporters in the disposition of glyburide and its active metabolites, suggesting that variability in the function of these processes may lead to pharmacokinetic variability in the parent and the metabolites, potentially translating to pharma- codynamic variability. Introduction Glyburide (also called glibenclamide), a second-generation sulfonyl- urea, is widely used for the treatment of type 2 diabetes. It is a potent stimulator of pancreatic insulin secretion and may additionally decrease the resistance of muscle and liver to the action of insulin (Feldman, 1985). Glyburide is an extended clearance classification system class 1B drug (Varma et al., 2015) with evidence for active hepatic uptake via organic anion transporting polypeptide (OATP) 1B1 and subsequent metabolism (Naritomi et al., 2004; Zhou et al., 2010; Varma et al., 2014). CYP2C9 is thought to be primarily responsible for the biotransformation of glyburide in vivo, with CYP3A4 playing a minor role. Several clinical studies demonstrate an association between glyburide pharmacoki- netics and genetic polymorphism of CYP2C9, where the carriers of CYP2C9*3 variants show reduced clearance (Kirchheiner et al., 2002; Niemi et al., 2002; Ravindran et al., 2006). On the contrary, in vitro 1 Current affiliation: Pharmaceutical Candidate Optimization, Bristol-Myers Squibb, Princeton, New Jersey. All authors are full-time employees of Pfizer Inc. No other potential conflicts of interest relevant to this article are reported. https://doi.org/10.1124/dmd.116.074815. s This article has supplemental material available at dmd.aspetjournals.org. ABBREVIATIONS: BCRP, breast cancer resistance protein; BSEP, bile salt export pump; CI, confidence interval; CL liver,u,act , hepatic unbound active uptake clearance; CL liver,u,bile , hepatic unbound biliary excretion clearance; CL liver,u,efflux , hepatic unbound basal efflux clearance; CL liver,u,pass , hepatic unbound passive diffusion clearance; CL R , plasma renal clearance; CL u,act , sandwich-cultured human hepatocyte or plated human hepatocyte unbound active uptake clearance; CL u,bile , sandwich-cultured human hepatocyte unbound biliary excretion clearance; CL u,pass , sandwich-cultured human hepatocyte or plated human hepatocyte unbound passive diffusion clearance; DDI, drug-drug interaction; F a , fraction of drug absorbed; F g , fraction of drug escaping gut-wall extraction; F M1 , fraction of glyburide converted to M1; F M2b , fraction of glyburide converted to M2b; f u,c , intracellular free fraction; f u,p , fraction unbound in plasma; HBSS, Hanks’ balanced salt solution; HEK, human embryonic kidney; HLM, human liver microsome; IVIVE, in vitro to in vivo extrapolation; k a,G , absorption rate of glyburide; Kp uu , pseudo–steady-state unbound liver tissue-to- unbound plasma ratio; LC-MS/MS, liquid chromatography tandem mass spectroscopy; M1, 4-trans-hydroxyglyburide; M2b, 3-cis-hydroxygly- buride; MCMC, Markov chain Monte Carlo; MDR1, multidrug resistance protein 1; MOPS, 3-(N-morpholino)propanesulfonic acid; MRP, multidrug resistance–associated protein; NTCP, sodium/taurocholate cotransporting polypeptide; OAT, organic anion transporter; OATP, organic anion transporting polypeptide; P-gp, P-glycoprotein; PHH, plated human hepatocyte; PBPK, physiologically based pharmacokinetic; SCHH, sandwich- cultured human hepatocyte. 737 http://dmd.aspetjournals.org/content/suppl/2017/04/24/dmd.116.074815.DC1 Supplemental material to this article can be found at: at ASPET Journals on May 26, 2020 dmd.aspetjournals.org Downloaded from
Transcript of Transporter-Mediated Disposition, Clinical...
1521-009X/45/7/737–747$25.00 https://doi.org/10.1124/dmd.116.074815DRUG METABOLISM AND DISPOSITION Drug Metab Dispos 45:737–747, July 2017Copyright ª 2017 by The American Society for Pharmacology and Experimental Therapeutics
Transporter-Mediated Disposition, Clinical Pharmacokinetics andCholestatic Potential of Glyburide and Its Primary
Active Metabolites s
Rui Li, Yi-an Bi, Anna Vildhede, Renato J. Scialis,1 Sumathy Mathialagan, Xin Yang,Lisa D. Marroquin, Jian Lin, and Manthena V.S. Varma
Systems Modeling and Simulation, Medicine Design, Pfizer Worldwide R&D, Cambridge, Massachusetts (R.L.); andPharmacokinetics, Dynamics and Metabolism, Medicine Design, Pfizer Worldwide R&D, Groton, Connecticut (Y.B., A.V., R.J.S.,
S.M., X.Y., L.D.M., J.L., M.V.S.V.)
Received December 30, 2016; accepted April 19, 2017
ABSTRACT
Glyburide is widely used for the treatment of type 2 diabetes. Westudied the mechanisms involved in the disposition of glyburide andits pharmacologically active hydroxy metabolites M1 and M2b andevaluated their clinical pharmacokinetics and the potential role inglyburide-induced cholestasis employing physiologically basedpharmacokinetic (PBPK) modeling. Transport studies of parentandmetabolites in human hepatocytes and transfected cell systemsimply hepatic uptake mediated by organic anion–transportingpolypeptides. Metabolites are also subjected to basolateral andbiliary efflux by P-glycoprotein, breast cancer resistance protein,andmultidrug resistance–associated proteins, and are substrates torenal organic anion transporter 3. A PBPKmodel in combinationwitha Bayesian approach was developed considering the identifieddisposition mechanisms. The model reasonably described plasma
concentration time profiles and urinary recoveries of glyburide andthe metabolites, implying the role of multiple transport processes intheir pharmacokinetics. Predicted free liver concentrations of theparent (∼30-fold) and metabolites (∼4-fold) were higher than theirfree plasma concentrations. Finally, all three compounds showedbile salt export pump inhibition in vitro; however, significant in vivoinhibition was not apparent for any compound on the basis of apredicted unbound liver exposure-response effect model usingmeasured in vitro IC50 values. In conclusion, this study demonstratesthe important role of multiple drug transporters in the disposition ofglyburide and its activemetabolites, suggesting that variability in thefunction of these processes may lead to pharmacokinetic variabilityin the parent and the metabolites, potentially translating to pharma-codynamic variability.
Introduction
Glyburide (also called glibenclamide), a second-generation sulfonyl-urea, is widely used for the treatment of type 2 diabetes. It is a potentstimulator of pancreatic insulin secretion and may additionally decrease
the resistance of muscle and liver to the action of insulin (Feldman,1985). Glyburide is an extended clearance classification system class 1Bdrug (Varma et al., 2015) with evidence for active hepatic uptake viaorganic anion transporting polypeptide (OATP) 1B1 and subsequentmetabolism (Naritomi et al., 2004; Zhou et al., 2010; Varma et al., 2014).CYP2C9 is thought to be primarily responsible for the biotransformationof glyburide in vivo, with CYP3A4 playing aminor role. Several clinicalstudies demonstrate an association between glyburide pharmacoki-netics and genetic polymorphism of CYP2C9, where the carriers ofCYP2C9*3 variants show reduced clearance (Kirchheiner et al., 2002;Niemi et al., 2002; Ravindran et al., 2006). On the contrary, in vitro
1Current affiliation: Pharmaceutical Candidate Optimization, Bristol-MyersSquibb, Princeton, New Jersey.
All authors are full-time employees of Pfizer Inc. No other potential conflicts ofinterest relevant to this article are reported.
https://doi.org/10.1124/dmd.116.074815.s This article has supplemental material available at dmd.aspetjournals.org.
ABBREVIATIONS: BCRP, breast cancer resistance protein; BSEP, bile salt export pump; CI, confidence interval; CLliver,u,act, hepatic unboundactive uptake clearance; CLliver,u,bile, hepatic unbound biliary excretion clearance; CLliver,u,efflux, hepatic unbound basal efflux clearance; CLliver,u,pass,hepatic unbound passive diffusion clearance; CLR, plasma renal clearance; CLu,act, sandwich-cultured human hepatocyte or plated humanhepatocyte unbound active uptake clearance; CLu,bile, sandwich-cultured human hepatocyte unbound biliary excretion clearance; CLu,pass,sandwich-cultured human hepatocyte or plated human hepatocyte unbound passive diffusion clearance; DDI, drug-drug interaction; Fa, fraction ofdrug absorbed; Fg, fraction of drug escaping gut-wall extraction; FM1, fraction of glyburide converted to M1; FM2b, fraction of glyburide converted toM2b; fu,c, intracellular free fraction; fu,p, fraction unbound in plasma; HBSS, Hanks’ balanced salt solution; HEK, human embryonic kidney; HLM,human liver microsome; IVIVE, in vitro to in vivo extrapolation; ka,G, absorption rate of glyburide; Kpuu, pseudo–steady-state unbound liver tissue-to-unbound plasma ratio; LC-MS/MS, liquid chromatography tandem mass spectroscopy; M1, 4-trans-hydroxyglyburide; M2b, 3-cis-hydroxygly-buride; MCMC, Markov chain Monte Carlo; MDR1, multidrug resistance protein 1; MOPS, 3-(N-morpholino)propanesulfonic acid; MRP, multidrugresistance–associated protein; NTCP, sodium/taurocholate cotransporting polypeptide; OAT, organic anion transporter; OATP, organic aniontransporting polypeptide; P-gp, P-glycoprotein; PHH, plated human hepatocyte; PBPK, physiologically based pharmacokinetic; SCHH, sandwich-cultured human hepatocyte.
737
http://dmd.aspetjournals.org/content/suppl/2017/04/24/dmd.116.074815.DC1Supplemental material to this article can be found at:
at ASPE
T Journals on M
ay 26, 2020dm
d.aspetjournals.orgD
ownloaded from
enzymology studies suggest CYP3A4 to be the major metabolizingenzyme, with CYP2C9 playing a minimal role (Zharikova et al., 2009;Zhou et al., 2010). Based on the in vitro studies and mechanisticmodeling of clinical pharmacokinetics and drug-drug interactions(DDIs) of glyburide as a victim drug, we recently assessed thequantitative role of the transporter-enzyme (OATP1B1-CYP2C9/3A4)interplay in its hepatic clearance (Varma et al., 2014).Glyburide is excreted as hydroxy metabolites with 50% of the dose in
the urine and about 50% of the dose in the bile (Feldman, 1985). The twomajor circulating metabolites, 4-trans-hydroxyglyburide (M1) and3-cis-hydroxyglyburide (M2b), were shown to have ;50–75% of thehypoglycemic activity of the parent due to increased insulin secretion(Rydberg et al., 1994). These two major metabolites are rapidly clearedfrom the bloodstream when dosed intravenously (Rydberg et al., 1995)and may have higher activity at low concentrations with longer effectduration than the parent drug (Rydberg et al., 1997; Jonsson et al., 2001).However, the transport and metabolic processes involved in the dispositionof these metabolites are not characterized.Drug-induced cholestasis is often noted and associated with bile salt
export pump (BSEP) inhibition (Rodrigues et al., 2014). Examples of drugsthat are known to induce cholestasis and cholestatic or mixed hepatitispotentially via inhibition of BSEP include cyclosporine A, rifampicin,bosentan, and glyburide. Bosentan induces a dose-dependent liver injury andincreased serum bile salts and alkaline phosphatase levels in a significantproportion of treated patients (Fattinger et al., 2001). Additionally, thecholestatic potency of bosentan is elevatedwhen combinedwith glyburide inhumans (Mylona and Cleland, 1999; Fattinger et al., 2001). As a result, thiscombination is contraindicated in clinical practice (bosentan product label).Bosentan and its metabolites and glyburide are known to inhibit BSEP,which is believed to be a major cause of the observed cholestatic findings(Fattinger et al., 2001). The contribution of glyburide major metabolites (M1and M2b) to the glyburide-induced liver injury has not been studied.The goals of this study were 1) to evaluate the transport mechanisms
involved in the hepatic and renal disposition of glyburide and its M1 andM2b metabolites, 2) to characterize the clinical pharmacokinetics ofglyburide and the metabolites using a physiologically based pharmaco-kinetic (PBPK) model, and 3) to quantitate the hepatic exposure ofthe parent and metabolites and project their quantitative role in theglyburide-induced cholestasis.
Materials and Methods
Chemicals and Reagents
Glyburide and rifamycin SV were purchased from Sigma-Aldrich (St. Louis,MO). M1 and M2b were obtained from Medical Isotopes (Pelham, NH).InVitroGRO-HT, CP, and HI hepatocyte media were purchased from CelsisIVT (Baltimore, MD). Cryopreserved human hepatocytes from donor HH1025and HH1026 (Caucasian female, 59 years old) were purchased from In VitroADMET Laboratories, LLC (Columbia, MD). Human embryonic kidney (HEK)293 cells stably transfected with human OATP1B1, OATP1B3, or OATP2B1were generated at Pfizer Inc. (Sandwich, UK). HEK293 cells transfected withorganic anion transporter (OAT) 1 and OAT3 were obtained from Dr. KathleenGiacomini (University of California, San Francisco, San Francisco, CA).HEK293 cells stably transfected with NTCP were obtained from Professor PerArtursson (Uppsala University, Uppsala, Sweden). Human multidrug resistance–associated protein (MRP) 2, MRP3, MRP4, and breast cancer resistance protein(BCRP) vesicles were obtained from Corning (Corning, NY). Human BSEP andmultidrug resistance protein 1 (MDR1) vesicles were purchased from SolvoBiotechnology (Budapest, Hungary).
In Vitro Transport Studies
OATPs and OAT Substrate Assay. HEK-OATP1B1, HEK-OATP1B3,HEK-OATP2B1, HEK-OAT1, HEK-OAT2, HEK-OAT3, and HEK-mock cells
were seeded at densities of 60,000–90,000 cells/well in 96-well poly-D-lysine–coated plates (OATP assays) or 300,000 cells/well in 24-well plates (OAT assays)and cultured for 48 hours. For the uptake assays, the cells were washed three timeswith uptake buffer [Hanks’ balanced salt solution (HBSS) with 20 mM HEPES,pH 7.4] and then incubated with uptake buffer containing test compound at 37�Cand 150 rpm. Cellular uptake was terminated by quickly washing the cells threeor four times with ice-cold uptake buffer. The cells were then lysed withmethanol containing internal standard, and the samples were quantified byliquid chromatography tandem mass spectroscopy (LC-MS/MS). The totalcellular protein content was determined by using the Pierce BCA ProteinAssay Kit (ThermoFisher Scientific, Waltham, MA) according to themanufacturer specifications.
MRPs, BCRP, and MDR1 Substrate Assay. M1 and M2b were evaluatedfor ATP-dependent transport by MRP2, MRP3, MRP4, BCRP, and MDR1 at1 and 10 mM concentrations. The assays were conducted in 96-well format usingthe rapid filtration technique. Briefly, 50mg of membrane vesicles were incubatedwith test compound for 5 minutes at 37�C in the presence of 5 mMATP or 5 mMAMP in buffer containing 2.5 mM glutathione, 70 mMKCl, 7.5 mMMgCl2, and50 mM MOPS [3-(N-morpholino)propanesulfonic acid] adjusted to pH 7.4 withTris (MRP2 and MRP3) or 250 mM sucrose, 10 mM MgCl2, and 10 mM Trisadjusted to pH 7.4 with HCl (MRP4, BCRP, and MDR1). The transport reactionwas stopped by the addition of cold stop buffer (70 mM KCl and 40 mMMOPSadjusted to pH 7.4 with Tris for MRP2 and MRP3 and 100 mM NaCl in assaybuffer for MRP4, BCRP, and MDR1). Samples were transferred to 96-well glassfiber filter plates, filtered, and washed four times with cold stop buffer.Accumulation of the test compound in the membrane vesicles was measured byextracting the compound with methanol containing internal standard followed byLC-MS/MS analysis.
BSEP Inhibition Assay. Glyburide, M1, and M2b were evaluated forinhibition of BSEP-mediated ATP-dependent transport of taurocholic acid usingmembrane vesicles. The assay was conducted in a 384-well format at 11 con-centrations per compound. The rapid filtration method was used as describedpreviously with some modifications (Dawson et al., 2012). Briefly, 16 mg ofBSEP vesicles were incubated with 2 mM taurocholic acid and test compound ordimethylsulfoxide for 40 minutes at 25�C in buffer containing 4 mM ATP,100 mMKNO3, 10mMMg (NO3)2, 50mM sucrose, and 50mMHEPES, pH 7.4.The transport reaction was stopped by the addition of cold 0.5 M EDTA and coldstop buffer (10 mMTris, pH 7.4; 100mMKNO3; 10 mMMg(NO3)2; and 50 mMsucrose). The samples were rapidly filtered and washed three times with ice-coldbuffer. After the filter plate was dried, taurocholic acid was extracted from thevesicles by adding methanol and water (80:20 ratio) to the filter plate, and itsconcentration was measured by LC-MS/MS.
NTCP Inhibition Assay. Glyburide, M1, and M2b were evaluated forinhibition of NTCP-mediated transport of taurocholic acid at nine concentrationsper compound. HEK-NTCP cells were seeded at a density of 60,000 cells/well inpoly-D-lysine–coated 96-well plates and cultured for 48 hours. The cells werewashed three times with uptake buffer (HBSS with 20 mM HEPES, pH 7.4) andthen incubated for 4minuteswith uptake buffer containing 0.4mM3H-taurocholicacid and test compound at 37�C and 150 rpm. Uptake was stopped by the removal
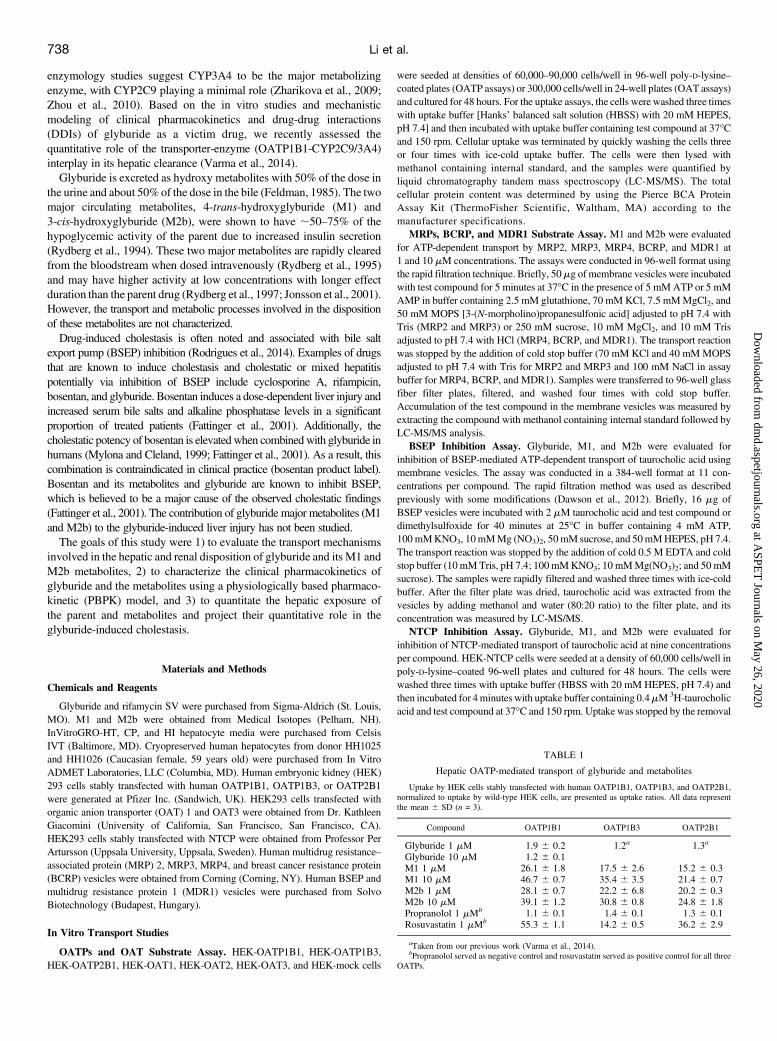
TABLE 1
Hepatic OATP-mediated transport of glyburide and metabolites
Uptake by HEK cells stably transfected with human OATP1B1, OATP1B3, and OATP2B1,normalized to uptake by wild-type HEK cells, are presented as uptake ratios. All data representthe mean 6 SD (n = 3).
Compound OATP1B1 OATP1B3 OATP2B1
Glyburide 1 mM 1.9 6 0.2 1.2a 1.3a
Glyburide 10 mM 1.2 6 0.1M1 1 mM 26.1 6 1.8 17.5 6 2.6 15.2 6 0.3M1 10 mM 46.7 6 0.7 35.4 6 3.5 21.4 6 0.7M2b 1 mM 28.1 6 0.7 22.2 6 6.8 20.2 6 0.3M2b 10 mM 39.1 6 1.2 30.8 6 0.8 24.8 6 1.8Propranolol 1 mMb 1.1 6 0.1 1.4 6 0.1 1.3 6 0.1Rosuvastatin 1 mMb 55.3 6 1.1 14.2 6 0.5 36.2 6 2.9
aTaken from our previous work (Varma et al., 2014).bPropranolol served as negative control and rosuvastatin served as positive control for all three
OATPs.
738 Li et al.
at ASPE
T Journals on M
ay 26, 2020dm
d.aspetjournals.orgD
ownloaded from
of transport buffer followed by three washes with ice-cold buffer. The cells werelysed with 100 ml of 10 mM Tris-HCL (pH 7.5), 75 mM NaCl, 125 mM NaF,2.5 mM EDTA, and 0.5% NP40, and shaken for 45 minutes at room temperature.Accumulated radioactivity was determined by mixing 50 ml of cell lysate with220 ml of scintillation fluid and analyzing the samples on a PerkinElmer(Waltham, MA) MicroBeta TriLux Liquid Scintillation Counter.
Sandwich-Cultured Human Hepatocyte and Plated Human HepatocyteTransport Assays. The sandwich-cultured human hepatocyte (SCHH) method-ology was described previously (Bi et al., 2006). Briefly, cryopreserved humanhepatocytes were thawed and seeded in 24-well collagen-coated plates usingInVitroGRO-HT and InVitroGRO-CP media. The plates were overlaid with0.25 mg/ml Matrigel (Corning) on the second day, and the cultures weremaintained in InVitroGRO-HI medium. On day 5, the cells were preincubated for10 minutes with or without 100 mM rifamycin SV (to determine the rates ofpassive diffusion and total uptake, respectively) in buffer with or without Ca++ (todetermine biliary clearance). The reactions were terminated at specified timepoints by washing the cells three times with ice-cold HBSS. The cells were lysedwith methanol containing internal standard, and intracellular concentrations weredetermined by LC-MS/MS.
The plated human hepatocyte (PHH) uptake study was conducted to determinethe intracellular free fraction (fu,c) with a longer incubation time. The assay wasconducted 6 hours after seeding (without overlaying with matrigel), as describedfor the SCHH assay with the exception of Ca++-free incubations.
LC-MS/MS Analysis. LC-MS/MS analysis was conducted for all in vitrosamples using a SCIEX (Framingham, MA) 5500 or 6500 Triple QuadrupoleTandem Mass Spectrometer in electrospray ionization mode. Other instrumen-tation consisted of Shimadzu (Kyoto, Japan) LC-20AD Solvent Delivery Units(pumps) and ADDA autosampler. Liquid chromatography was performed using aPhenomenex (Torrance, CA) Kinetex C18 or Synergi Polar-RP (30 � 2 mm)column, or a Sprite Echelon C18 column (10 � 2.1 mm) (ANALYTICAL Salesand Serivices, Flanders, NJ). Analytes were eluted with a gradient profile startingwith 0.1% formic acid in water and increasing concentration of 0.1% formic acidin acetonitrile.
Mechanistic Modeling of Hepatocyte Uptake Studies. Mechanistic model-ing of SCHH data to estimate in vitro unbound active uptake clearance (CLu,act),unbound passive diffusion clearance (CLu,pass), unbound basolateral efflux clearance(CLu,efflux), and unbound biliary excretion clearance (CLu,bile) of glyburide andmetabolites M1 and M2b were performed as described previously (Kimoto et al.,2015). The detailedmodel structure is provided in the Supplemental Material. ThePHH data were analyzed using the mechanistic model developed for SCHH,CLu,bile set to 0. The fu,c was estimated along with other parameters during PHHdata fitting. CLu,pass and fu,c were assumed to be the same for the two metabolites(configurational isomers). Parameter estimation was performed using a globaloptimization algorithm (differential evolution) in log10 space, with 95%confidence intervals (CIs) quantified by the residual bootstrap. All models inthis study were implemented in MATLAB (version 2016a; MathWorks, Natick,MA).
PBPK Modeling of Glyburide and Its Active Metabolites. A previouslypublished PBPK model for liver transporter substrates (Li et al., 2014a) was usedto model the human plasma data for glyburide and its two active metabolites.Details about the structural model are provided in the Supplemental Material.Given that the physiochemical properties and in vitro uptake characteristics of thetwo metabolites estimated in SCHH were reasonably close and that the clinicalpharmacokinetic data of the two metabolites are also similar (Rydberg et al.,1995), we assumed that hepatic active uptake (CLliver,u,act), passive diffusion(CLliver,u,pass), and biliary excretion (CLliver,u,bile) were similar for the twometabolites to decrease the number of fitted parameters. Biliary excretion andbasolateral efflux (CLliver,u,efflux) of glyburide, as well as further metabolism of themetabolites, were assumed to be zero based on our in vitro studies. The unboundhepatic clearance processes, the fraction of glyburide converted to M1 (FM1, withthe ratio between FM1 and FM2b fixed at 5 based on clinical observation), and theabsorption rate of glyburide (ka,G) were initially estimated using the globaloptimization (i.e., differential evolution) in log10 space to determine one set ofvalues that best described the pooled clinical data from six independent studieswith healthy participants (Neugebauer et al., 1985; Chalk et al., 1986; Spraul et al.,1989; Rydberg et al., 1995; Niemi et al., 2001; Lilja et al., 2007). Although mostdata are reasonably consistent, the first-hour data reported in the studies by Spraulet al. (1989) and Rydberg et al. (1995), and Neugebauer et al. (1985) can lead todifferent conclusions about glyburide tissue distribution. For this reason, weremoved the first-hour data reported in the studies by Spraul et al., 1989) andRydberg et al. (1995) from fitting [assuming that intravenous infusion data(Neugebauer et al., 1985) better predicts distribution volume]. Data 10 hourspostdose were not simulated to avoid large errors that may incur when digitizingthese extreme low concentrations from non–log-transformed plots. The physio-logic parameters were the same as described previously (Rodgers and Rowland,2006; Li et al., 2014b).
The distributions of nine fitted parameters were estimated using a Bayesianinference where both previous knowledge about in vitro to in vivo extrapola-tion (IVIVE) translation (i.e., prior distribution) and clinical data for glyburide(i.e., likelihood) contributed to parameter estimates (i.e., posterior distribution).Alternatively, parameter estimation during fitting of clinical data for glyburide isconstrained by our best guess about IVIVE learned from other compounds. Withthe “middle-out” approach described previously (Li et al., 2014b), the distribu-tions IVIVE empirical scaling factors (for SCHH, lot HH1025) have been
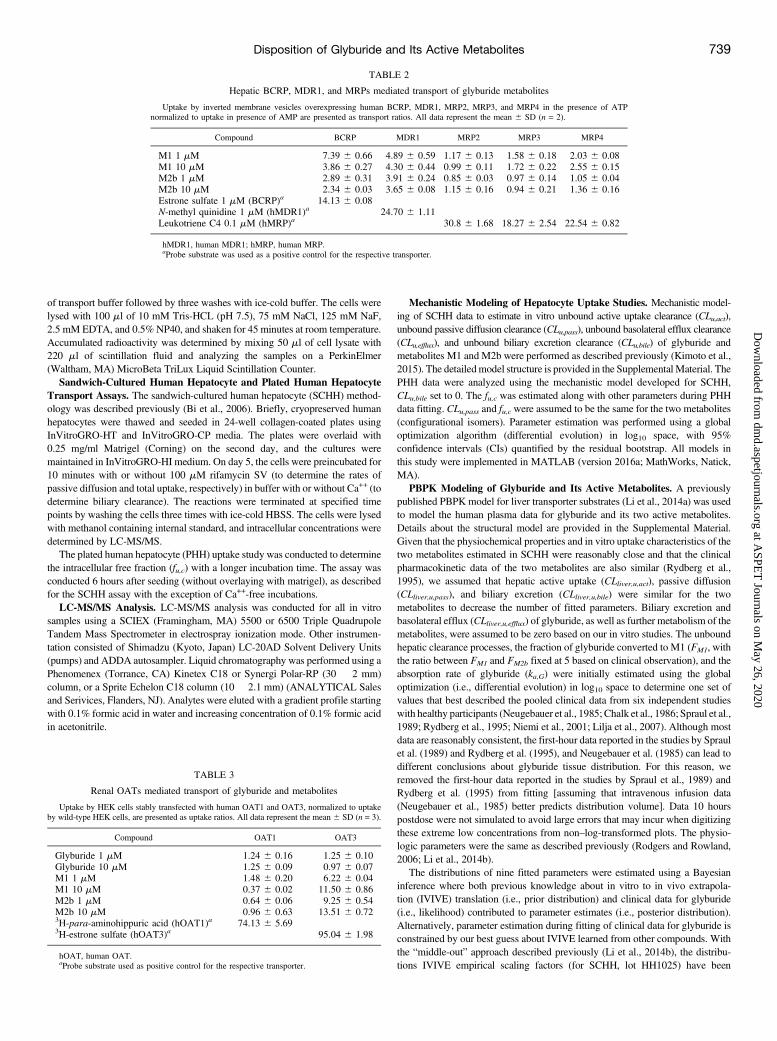
TABLE 2
Hepatic BCRP, MDR1, and MRPs mediated transport of glyburide metabolites
Uptake by inverted membrane vesicles overexpressing human BCRP, MDR1, MRP2, MRP3, and MRP4 in the presence of ATPnormalized to uptake in presence of AMP are presented as transport ratios. All data represent the mean 6 SD (n = 2).
Compound BCRP MDR1 MRP2 MRP3 MRP4
M1 1 mM 7.39 6 0.66 4.89 6 0.59 1.17 6 0.13 1.58 6 0.18 2.03 6 0.08M1 10 mM 3.86 6 0.27 4.30 6 0.44 0.99 6 0.11 1.72 6 0.22 2.55 6 0.15M2b 1 mM 2.89 6 0.31 3.91 6 0.24 0.85 6 0.03 0.97 6 0.14 1.05 6 0.04M2b 10 mM 2.34 6 0.03 3.65 6 0.08 1.15 6 0.16 0.94 6 0.21 1.36 6 0.16Estrone sulfate 1 mM (BCRP)a 14.13 6 0.08N-methyl quinidine 1 mM (hMDR1)a 24.70 6 1.11Leukotriene C4 0.1 mM (hMRP)a 30.8 6 1.68 18.27 6 2.54 22.54 6 0.82
hMDR1, human MDR1; hMRP, human MRP.aProbe substrate was used as a positive control for the respective transporter.
TABLE 3
Renal OATs mediated transport of glyburide and metabolites
Uptake by HEK cells stably transfected with human OAT1 and OAT3, normalized to uptakeby wild-type HEK cells, are presented as uptake ratios. All data represent the mean 6 SD (n = 3).
Compound OAT1 OAT3
Glyburide 1 mM 1.24 6 0.16 1.25 6 0.10Glyburide 10 mM 1.25 6 0.09 0.97 6 0.07M1 1 mM 1.48 6 0.20 6.22 6 0.04M1 10 mM 0.37 6 0.02 11.50 6 0.86M2b 1 mM 0.64 6 0.06 9.25 6 0.54M2b 10 mM 0.96 6 0.63 13.51 6 0.723H-para-aminohippuric acid (hOAT1)a 74.13 6 5.693H-estrone sulfate (hOAT3)a 95.04 6 1.98
hOAT, human OAT.aProbe substrate used as positive control for the respective transporter.
Disposition of Glyburide and Its Active Metabolites 739
at ASPE
T Journals on M
ay 26, 2020dm
d.aspetjournals.orgD
ownloaded from
estimated using six structurally different liver transporter substrates (i.e., 101.5260.31,1020.87560.52, and 1020.85760.27, as means and S.D.s in log10 space for activeuptake, passive diffusion, and metabolism; unpublished internal data). Briefly, theBayesian approach includes three steps. In step 1, we calculated the priordistribution of CLliver,u,act, CLliver,u,pass, and CLliver,u,bile as the products of thepreviously estimated IVIVE empirical scaling factors, the physiologic scalingfactor of 120 million hepatocytes per gram of liver tissue, and the in vitro SCHH(or HLM) clearances (forM1 andM2b, the averaged values of the two compounds
were used). For the metabolites intrinsic biliary and basolateral efflux clearances,CLliver,u,bile,M and CLliver,u,efflux,M, since we had no knowledge about their IVIVE,we assumed that their prior distributions were uniform and bounded by startingvalues divided and multiplied by 1000, whereas ka,G and FM were upper boundedby 10 and 5/(5 + 1), respectively. In step 2, the likelihood is calculated as the sumof the squared error between pooled clinical data and simulations in log10 space.In step 3, the posterior distributions of the estimated parameters (i.e., parametervalues specific for glyburide and its metabolites reported in this study) were
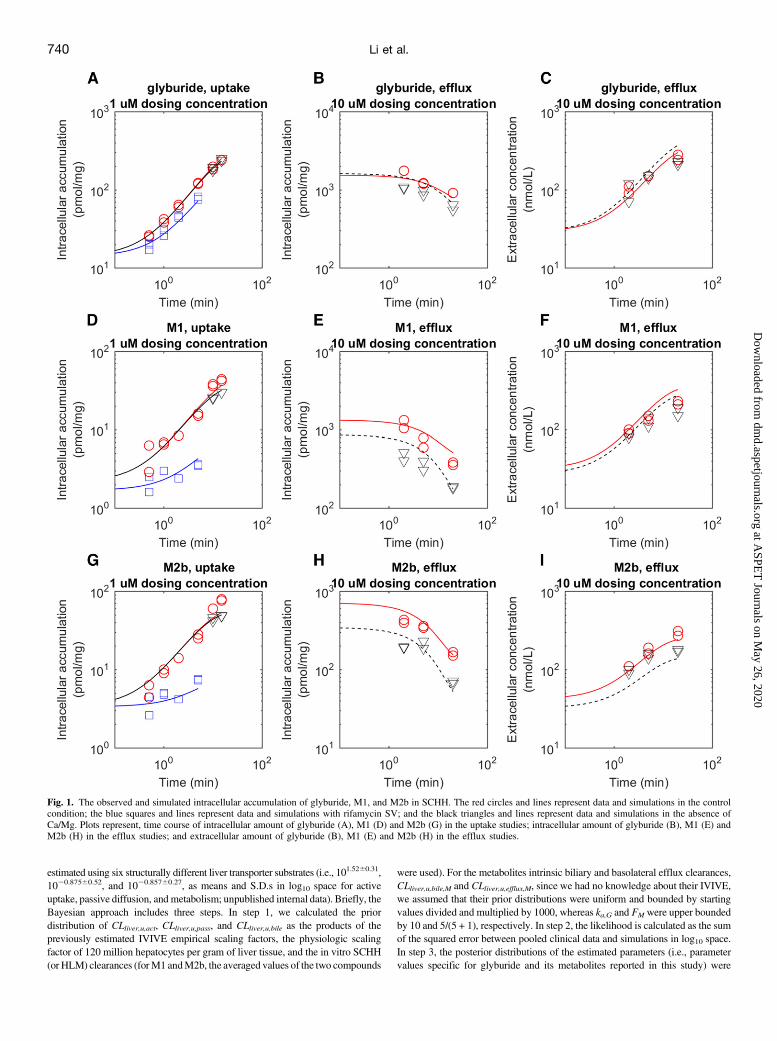
Fig. 1. The observed and simulated intracellular accumulation of glyburide, M1, and M2b in SCHH. The red circles and lines represent data and simulations in the controlcondition; the blue squares and lines represent data and simulations with rifamycin SV; and the black triangles and lines represent data and simulations in the absence ofCa/Mg. Plots represent, time course of intracellular amount of glyburide (A), M1 (D) and M2b (G) in the uptake studies; intracellular amount of glyburide (B), M1 (E) andM2b (H) in the efflux studies; and extracellular amount of glyburide (B), M1 (E) and M2b (H) in the efflux studies.
740 Li et al.
at ASPE
T Journals on M
ay 26, 2020dm
d.aspetjournals.orgD
ownloaded from

generated after combining priors from step 1 and likelihood from step 2 by usingan adaptiveMarkov chainMonte Carlo (MCMC) approach. The adaptiveMCMChas been published previously (Haario et al., 2006) and implemented in theMCMC toolbox for MATLAB (http://helios.fmi.fi/;lainema/mcmc/#sec-4). Thestarting position of MCMC chains and initial error variance were set withthe globally optimized values.
Results
Substrate Affinity of Glyburide and Metabolites to Hepatic andRenal Transporters. Glyburide is transported by OATP1B1, with theuptake by HEK293 cells transfected with OATP1B1 being significantlyhigher (P, 0.05) than by HEK-mock cells (Table 1). The uptake ratio at10 mM is lower than that at 1 mM, indicating saturation at a higherconcentration, which is consistent with our previous results (Michaelis-Menten constant, 2 mM) (Varma et al., 2014). Our previous studies(Varma et al., 2014) suggested that glyburide is not transported byOATP1B3 or OATP2B1. Metabolites M1 and M2b showed substrateaffinity to all three hepatic OATP isoforms with uptake ratios generallyover 20. Both metabolites were identified as substrates of the canalicularefflux transporters BCRP and MDR1, although neither metaboliteshowed affinity to MRP2 (Table 2). M1 was also a substrate of thebasolateral efflux transporters MRP3 and MRP4, with the transport intothe membrane vesicles being significantly higher (P , 0.05) in thepresence of ATP than in the presence of AMP. M2b, on the other hand,was not transported byMRP3 but showed significant transport byMRP4at 10 mM substrate concentration. Neither parent nor the metabolitesshowed substrate affinity to renal OAT1; however, both metaboliteswere transported by OAT3 (Table 3).Hepatic Disposition of Glyburide and Metabolites Using Human
Hepatocyte Assays. Primary human hepatocytes in plated culture wereused to assess the involvement of active uptake in the hepatic dispositionand to determine the hepatobiliary transport kinetics (Fig. 1; Supple-mental Fig. 1). Rifamycin SV significantly inhibited the hepatic uptakeof glyburide, M1, andM2b in both PHH and SCHH studies. SCHH datawere simultaneously fitted to estimate in vitro transport parameters usingmathematical models (Table 4). While statistically significant activeuptake was discerned for the three compounds, due to limited data pointsduring the efflux phase estimated basal efflux and biliary excretion wereassociated with large uncertainties. The metabolic stabilities of M1 andM2b were assessed using HLM and suspension human hepatocytes,wherein, neither metabolite showed any measureable turnover in HLMincubations (up to 1 hour) with and without NADPH and only ;15–30% depletion at the end of 5 hours of incubation in human hepatocytes.M1 and M2b did not convert to each other or to the parent in thesestudies. Based on these findings, we assumed further metabolism of M1and M2b to be negligible for PBPK modeling and simulations.Pharmacokinetic Characterization of Glyburide and Metabo-
lites. The whole-body PBPK model implementing the multiple hepatictransport processes and observed renal clearance (CLR) reasonably
described clinical pharmacokinetics of glyburide and its metabolites(Fig. 2). By combining information from in vitro SCHH data and IVIVEknowledge from other compounds, the Bayesian inference couldprovide reasonably confident parameter estimates (Supplemental Fig.3; Table 5). Due to a lack of prior IVIVE knowledge, CLliver,u,bile,M andCLliver,u,efflux,M were obtained purely from fitting the clinical data. Forboth CLliver,u,bile,M and CLliver,u,efflux,M, a value greater than 10 l/hourseemed to be necessary to describe the clinical data. To show theimportance of prior information in decreasing estimation uncertainty, theestimated (posterior) parameter distributions with and without priorinformation are provided in Supplemental Figs. 3 and 4. To understandthe empirical IVIVE scaling factors required to bridge in vitro data andin vivo data in this study, we calculated the following ratios of posteriormean of hepatic clearance processes to physiologically scaled in vitroclearances: 44.5 for active uptake of glyburide; 0.760 for passivediffusion of glyburide; and 0.192 for metabolism of glyburide; 30.3 foractive uptake of metabolites; and 0.0860 for passive diffusion ofmetabolites. With the posterior distributions of fitted parameters, wesimulated liver concentrations of glyburide,M1, andM2b. The predictedpseudo–steady-state unbound liver-to-unbound plasma ratios (Kpuu)were about 32 (95% CI, 15–53) and 3.7 (95% CI, 0.092–39) forglyburide and metabolites, respectively.Inhibition of BSEP and NTCP by Glyburide and Metabolites.
The uptake of taurocholic acid by humanBSEP and NTCPwas inhibitedin the presence of glyburide andmetabolites in a dose-dependent manner(Fig. 3). Glyburide was a more potent inhibitor against both BSEP andNTCP than its metabolites. Interestingly, although the two metabolitesshowed similar inhibition potencies (IC50) against BSEP, M1 was lesspotent than M2b against NTCP.Predicted Inhibition of BSEP and NTCP in Human Liver. Based
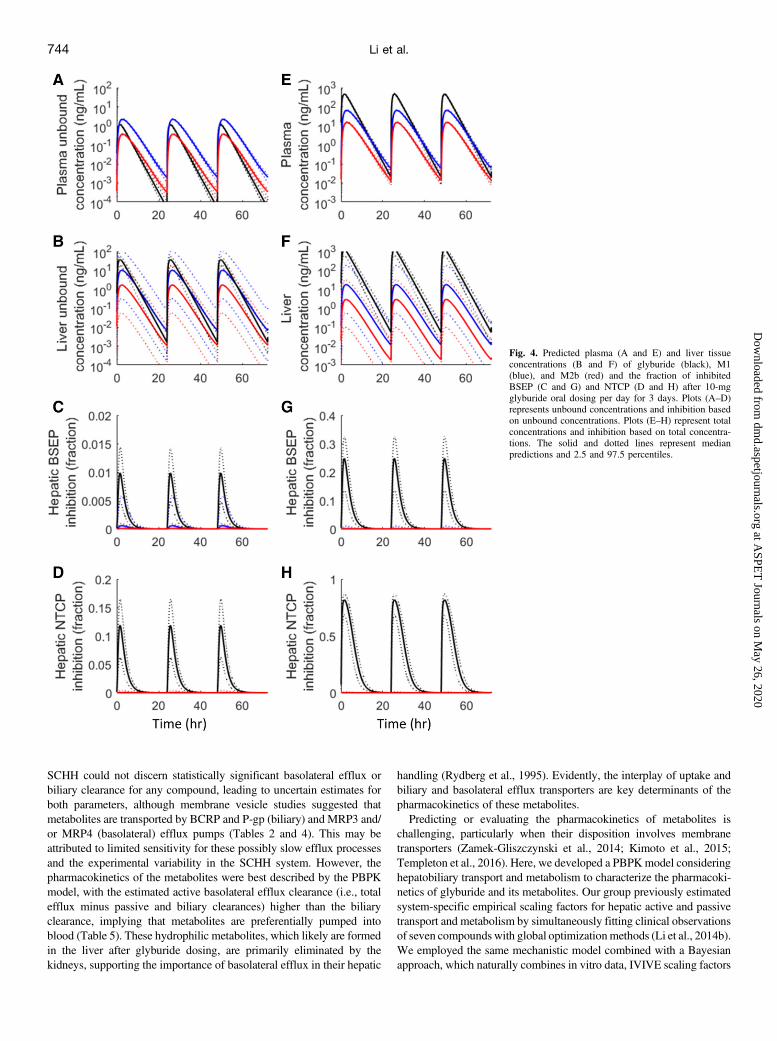
on the PBPK model and the posterior distributions of fitted parameters,we prospectively simulated the liver intracellular free concentrations ofglyburide and metabolites after oral dosing of glyburide 10 mg/day for3 days. Assuming that the inhibition follows a free concentration-directresponse model [i.e., Cliver,free/(Cliver,free + IC50)], we simulated theBSEP and NTCP inhibition in vivo for the parent and metabolites usingmean IC50 values determined in the in vitro assay. The simulations wereperformed individually for each compound without considering theinteractions among inhibitors. The simulation showed that the threecompounds may cause only minimal inhibition of BSEP and NTCPin vivo (,10% inhibition) (Fig. 4, A–D). In addition, we simulated theinhibition based on total liver concentrations, where only glyburideshowed a stronger inhibition—up to 25% BSEP inhibition and 75%NTCP inhibition (Fig. 4, E–H).
Discussion
Collective data from this study depict that glyburide is primarilycleared from the blood compartment by hepatic uptake via OATP1B1and subsequently metabolized, whereas the hepatic disposition of its
TABLE 4
Summary of estimated parameter values for glyburide and metabolites in the SCHH model (mean and 95% CI)
CLu,act CLu,pass CLu,bile CLu,efflux fu,c
ml · min21 · mg protein21
Glyburide 11.8 (9.0–16) 13.8 (9.3–15) 1.9 (1.4 � 1025 to 3.6) 5.5 � 1025 (7.9 � 1027 to 1.7) 0.0301a (fixed)M1 3.61 (2.4–7.2) 0.661b (0.33–2.9) 0.222 (1.9 � 1029 to 0.71) 0.634 (1.9 � 1028 to 3.1) 0.579a,b (fixed)M2b 7.20 (4.6–11) 0.0866 (6.7 � 1028 to 1.5) 1.14 (4.7 � 1029 to 2.7)
afu,c was estimated from PHHs after longer incubations (Supplemental Fig. 1).bAssumed to be the same for both metabolites to minimize overparameterization of the mechanistic model used to estimate in vitro transport kinetics in hepatocyte
systems.
Disposition of Glyburide and Its Active Metabolites 741
at ASPE
T Journals on M
ay 26, 2020dm
d.aspetjournals.orgD
ownloaded from

active hydroxyl metabolites, M1 and M2b, are determined by hepaticuptake transporters (OATP1B1, OATP1B3 and OATP2B1) and biliary[BCRP and P-glycoprotein (P-gp)] and basolateral (MRP3 and MRP4)efflux pumps (Fig. 5). Additionally, the metabolites are substrates to therenal transporter OAT3, which is likelymediating their significant activesecretion (observed human CLR/fu,p.GFR is.25) into urine. These twometabolites of glyburide possess considerable hypoglycemic activity at
their clinically relevant plasma concentrations. After single intravenousdosing of glyburide, M1, and M2b, separately, blood glucose and seruminsulin levels are significantly changed by the parent as well as the twometabolites (Rydberg et al., 1994). At an oral dose of glyburide of about10 mg, metabolite levels are higher than those of glyburide, with highmetabolite levels found at least 10–16 hours after glyburide intake(Jonsson et al., 2001) in patients with type 2 diabetes. This implies that
Fig. 2. Observed (circles) and simulated (lines) plasmaconcentration-time profiles and urinary recoveries ofglyburide (black), M1 (blue), and M2b (red) afterintravenous dosing of glyburide (A and B), oral dosingof glyburide (C and D), intravenous dosing of M1 (Eand F), and intravenous dosing of M2b (G and H).Green and black in (A) indicate infusion and bolusdosing, respectively.
742 Li et al.
at ASPE
T Journals on M
ay 26, 2020dm
d.aspetjournals.orgD
ownloaded from

the metabolites contribute to the hypoglycemic effect with a longereffect duration than the parent itself and that they may be leading to thelong-lasting hypoglycemic events noted with glyburide (Asplund et al.,1983; Rydberg et al., 1997). Overall, this study demonstrates for thefirst time an important role for hepatic and renal transporters in thepharmacokinetics of glyburide-active metabolites, suggesting that thefunctional changes in these processes due to age, sex, disease, geneticvariation, or DDIs could significantly alter the plasma exposure of the
metabolites and consequently modulate hypoglycemic activity, whichmay be of clinical importance.Mathematical modeling was employed for SCHH data to evaluate
hepatocyte vectorial transport and further estimate the intrinsic transportrates to execute mechanistic PBPK modeling. SCHH as well as75-minute plated hepatocyte studies suggested significant active uptakefor all three compounds, which is associated with OATP substrateactivity, as demonstrated using transporter-transfected cells. However,
TABLE 5
Summary of PBPK model parameter estimates and their 95% CIs of glyburide and metabolites
Parameter Unit Value
Glyburide M1 M2bpKaa 5.38 5.08 5.08logD7.4
a 2.1 20.48 20.43fu,p 0.0028 (0.0026–0.0030) 0.034 (0.032–0.036) 0.024 (0.023–0.025)RB/P 0.571 0.437 (0.42–0.45) 0.493 (0.45–0.54)FaF g
b 1 0.5 0.5ka
c,d Hour 1.85 (1.64–2.08) 0.5 0.5CLR
d,e l/hour 0 7.18 7.18CLliver,u,pass
d l/hour 111 (24.9–345) 0.602 (0.136–11.2) 0.602 (0.136–11.2)CLliver,u,act
d l/hour 5560 (2400–11,700) 1730 (723–6620) 1730 (723–6620)CLliver,u,met
d l/hour 71.9 (47.3–159) 0 0CLliver,u,bile
d, f l/hour 0 104 (10.7–4210) 104 (10.7–4210)CLliver,u,efflux
d, f l/hour 0 508 (28.5–12,000) 508 (28.5–12,000)Metabolite FM1
d 0.564 (0.490–0.690)Metabolite FM2b
g 0.113IC50,BSEP mM 7.45 (6.58–8.44) 34.9 (27.1–44.9) 36.7 (29.2–46.2)IC50,NTCP mM 0.5 (0.37–0.66) 771 (314–1892) 8.1 (5.6–11.8)
CLliver,u,met, hepatic unbound metabolism clearance; ka, first-order absorption rate; RB/P, blood-to-plasma ratio.apKa and logD7.4 values are generated in-house for glyburide and are predicted using ACD/Labs (Toronto, Ontario, Canada) for
metabolites.bThe fraction absorbed and escaped from intestinal metabolism (FaFg) is fixed at 1 for glyburide based on clinical observations. Due to
lack of data, The Fa for metabolites is fixed at 0.5 considering their low-to-moderate passive permeability, whereas Fg is assumed to be fortheir low metabolism.
cThe absorption rate of metabolites is fixed at 0.5 arbitrarily due to limited data. This involves reabsorption of metabolites from theintestine after biliary secretion (enterohepatic recycling).
dThe 95% CIs are approximated as 2.5 and 97.5 percentiles of values generated in Bayesian inference. M1 and M2b are assumed toshare the same hepatic uptake characteristics as indicated in the text.
eThe CLR is directly determined from the ratio of amount of urinary execration and plasma exposure. As such, its variability is more ofthe individual variability (not addressed here) than numerical uncertainty.
fCLliver,u,bile and CLliver,u,efflux are correlated by fitting clinical data, whereas there is no prior information about these two parameters, assuch, and the large uncertainty associated with them.
gFM2b is fixed as one-fifth of FM1 based on clinical observations. About 25–30% and 5–6% of M1 and M2b, respectively, are recoveredin the urine after intravenous glyburide or oral dosing, whereas equal mounts (60%) of M1 and M2b are recovered in the urine afterintravenous M1 and M2b dosing (Rydberg et al., 1995).
Fig. 3. Inhibition of BSEP-mediated transport of taurocholic acid (A) and NTCP-mediated transport of taurocholic acid (B) by glyburide (circles), M1 (diamonds), and M2b(triangles). Data points are the mean 6 S.D. (n = 3). The estimated inhibition potencies [IC50 (95% CI)] against BSEP were 7.45 (6.58–8.44) mM, 34.9 (27.1–44.9) mM, and36.7 (29.2–46.2) mM for glyburide, M1, and M2b, respectively. Similarly, the uptake of taurocholic acid by NTCP was inhibited with IC50 values of 0.5 (0.37–0.66) mM,771 (314–1892) mM, and 8.1 (5.6–11.8) mM by glyburide, M1, and M2b, respectively.
Disposition of Glyburide and Its Active Metabolites 743
at ASPE
T Journals on M
ay 26, 2020dm
d.aspetjournals.orgD
ownloaded from
SCHH could not discern statistically significant basolateral efflux orbiliary clearance for any compound, leading to uncertain estimates forboth parameters, although membrane vesicle studies suggested thatmetabolites are transported by BCRP and P-gp (biliary) and MRP3 and/or MRP4 (basolateral) efflux pumps (Tables 2 and 4). This may beattributed to limited sensitivity for these possibly slow efflux processesand the experimental variability in the SCHH system. However, thepharmacokinetics of the metabolites were best described by the PBPKmodel, with the estimated active basolateral efflux clearance (i.e., totalefflux minus passive and biliary clearances) higher than the biliaryclearance, implying that metabolites are preferentially pumped intoblood (Table 5). These hydrophilic metabolites, which likely are formedin the liver after glyburide dosing, are primarily eliminated by thekidneys, supporting the importance of basolateral efflux in their hepatic
handling (Rydberg et al., 1995). Evidently, the interplay of uptake andbiliary and basolateral efflux transporters are key determinants of thepharmacokinetics of these metabolites.Predicting or evaluating the pharmacokinetics of metabolites is
challenging, particularly when their disposition involves membranetransporters (Zamek-Gliszczynski et al., 2014; Kimoto et al., 2015;Templeton et al., 2016). Here, we developed a PBPKmodel consideringhepatobiliary transport and metabolism to characterize the pharmacoki-netics of glyburide and its metabolites. Our group previously estimatedsystem-specific empirical scaling factors for hepatic active and passivetransport and metabolism by simultaneously fitting clinical observationsof seven compounds with global optimizationmethods (Li et al., 2014b).We employed the same mechanistic model combined with a Bayesianapproach, which naturally combines in vitro data, IVIVE scaling factors
Fig. 4. Predicted plasma (A and E) and liver tissueconcentrations (B and F) of glyburide (black), M1(blue), and M2b (red) and the fraction of inhibitedBSEP (C and G) and NTCP (D and H) after 10-mgglyburide oral dosing per day for 3 days. Plots (A–D)represents unbound concentrations and inhibition basedon unbound concentrations. Plots (E–H) represent totalconcentrations and inhibition based on total concentra-tions. The solid and dotted lines represent medianpredictions and 2.5 and 97.5 percentiles.
744 Li et al.
at ASPE
T Journals on M
ay 26, 2020dm
d.aspetjournals.orgD
ownloaded from

determined previously (prior knowledge), and the clinical data (likelihood),to characterize the plasma pharmacokinetics of parent and metabolites andto further effectively decrease the uncertainty in the parameter estimationsand liver concentration predictions. The model described the plasmaconcentration-time profiles of the parent and metabolites and recovered therenal excretion profiles reasonably well (Fig. 3). On the basis of the PBPKmodel simulations, the following mechanistic information can be derived.First, hepatic uptake transporters play a predominant role in the systemicclearance of glyburide and metabolites. Second, due to higher plasmaprotein binding of the parent, our PBPK model simulations suggestedcomparable unbound plasma concentrations and a higher unbound troughconcentration of metabolites, particularly of M1, compared with glyburide(Fig. 4A). These findings signify the potential contribution of metabolitesto the pharmacodynamic activity and, additionally, their larger role in thelong-lasting hypoglycemic effects of glyburide (Asplund et al., 1983;Rydberg et al., 1997; Jonsson et al., 2001).The role of transporter-enzyme interplay in the hepatic clearance of
glyburide can be corroborated by its clinical DDIs. For instance,coadministration of a single intravenous dose of rifampicin (OATPinhibitor) increases the plasma area under the curve of glyburide andconsequently increases hypoglycemic effects, whereas rifampicinmultiple-dose oral treatment (cytochrome P450 induction and OATPinhibition) shows minimal impact on glyburide exposure and pharma-codynamics (Zheng et al., 2009). Using a similar PBPK approach, wepreviously rationalized the magnitude of change in glyburide pharma-cokinetics caused by several cytochrome P450 inhibitors/inducers and/or OATP inhibitors (Varma et al., 2014). The current study suggests thatthe reduced functional activities of hepatic OATPs and/or renal OAT3associated with DDIs, age, and genetic variation could increase, whereasthose of MRP3/4 may decrease systemic exposure of M1 and M2b,leading to variability in pharmacodynamic response.
Glyburide is a relatively safe drug; however, it has beenimplicated in occasional cases of cholestatic jaundice and hepato-cellular disease and in a few cases of granulomatous hepatitis(van Basten et al., 1992; Krivoy et al., 1996; Saw et al., 1996).Additionally, the bosentan-glyburide combination is contraindi-cated as emphasized with a black box warning on the bosentanproduct label. Here, we showed that glyburide major metabolitesinhibit BSEP in vitro, although the inhibition potencies were about5-fold lower compared with the parent (Fig. 3). We further evaluatedthe potential for glyburide and metabolites to inhibit BSEP in vivoconsidering the concentration-response effect on the basis of in vitroinhibition potencies (IC50), and the PBPK model simulated unboundhepatic concentrations (Fig. 4). Although the free liver concentra-tions were projected to be severalfold (;4–30 times) higher thanplasma free concentrations, glyburide and metabolites could notproduce significant inhibition of BSEP, which implies that 1) thereis a potential disconnect between in vitro and in vivo inhibitionpotencies and/or 2) BSEP inhibition is not the major cause ofglyburide-induced cholestasis, with other mechanisms potentiallyinvolved. Generally, BSEP inhibition is one of numerous potentialmechanisms leading to drug-induced cholestasis, and evaluation ofthis liability in isolation may not provide an overall assessmentof toxicity (Rodrigues et al., 2014; Shon and Abernethy, 2014).Alternatively, Woodhead et al. (2014) suggested a relationshipbetween maximum plasma glyburide concentration and the changein bile acids exposure using DILIsym, a mechanistic model of drug-induced liver injury (Woodhead et al., 2014). We therefore evaluatedin vivo BSEP inhibition assuming total hepatic concentration-response effect. Under this assumption, the model predicted up to25% BSEP inhibition by glyburide, whereas the metabolites showedno notable inhibition (Fig. 4C). Moreover, considering the free or
Fig. 5. Schematic diagram of hepatic and renal disposition of glyburide (G) and its hydroxy metabolites. Glyburide is taken up into the hepatocytes across the sinusoidalmembrane by passive diffusion and active uptake via OATP1B1. Glyburide is primarily metabolized by CYP2C9 and CYP3A4 to form M1 and M2b. Both metabolites aresubstrates to all three isoforms of OATP and to biliary transporters P-gp and BCRP. Additionally, M1 is a substrate to basolateral transporters MRP3 and MRP4, whereasM2b is a possible substrate to MRP4. These uptake and efflux transporters regulate the metabolite exposure in the blood and hepatocyte compartment. Additionally, M1 andM2b are actively secreted in the urine via OAT3 on the basolateral membrane of the kidney proximal tubule cells. Parent and metabolites inhibit BSEP- and NTCP-mediatedtransport of bile acids with varying inhibition potencies. The majority of the parent is metabolized to M1, M2b, and other metabolites, whereas M1 and M2b are primarilyexcreted in the urine and bile.
Disposition of Glyburide and Its Active Metabolites 745
at ASPE
T Journals on M
ay 26, 2020dm
d.aspetjournals.orgD
ownloaded from

total concentration-response effect, glyburide, but not the metabo-lites, showed notable inhibition of NTCP, which plays a key role inthe hepatic uptake and regulates systemic exposure of bile acids.The Kpuu of glyburide was predicted to be;32 (95% CI = 15–53).
However, the predicted metabolite Kpuu was low (;3.7) and withlarger variability due to uncertainty in biliary and basolateral effluxparameter estimates. Although it is not easy to verify the humanliver exposure predictions due to limitations in obtaining appropri-ate clinical data (i.e., in vivo liver concentration of parent andmetabolites), our rationale for using the current PBPK approachcomes from a previous study (Li et al., 2016) demonstrating anaccurate (but not necessarily precise) prediction of liver concentra-tions when fitting plasma profile data. Additionally, a Bayesianapproach was applied to improve the precision in this study.However, in Bayesian we cannot rule out the possibility that ourprior IVIVE knowledge is biased, resulting in the underpredictionof liver exposure. As such, we simulated liver exposure, BSEP,and NTCP inhibition again after removing priors from MCMC.Although the new prediction bands are wider (i.e., more likely tocover real exposure) (Supplemental Fig. 4), the conclusion ofminimal inhibition on NTCP and BSEP has not changed (Supple-mental Fig. 5). One could argue whether a different model structureor optimization process could conclude a much more significantinhibition of BESP. Based on simple calculations, we note that, if a10-mg glyburide dose was injected directly into a 1.25-l liverwithout considering transport or metabolism, the unbound glyburideconcentration would be ;0.5mM, leading only to about a 6%competitive inhibition given current IC50 values (;7.5mM). Thestudy did not investigate transinhibition of BSEP by the metabolitesin the bile because of challenges in simulating physiologicallyrelevant concentrations of metabolites in the bile. However, giventhat a significant amount of metabolites is excreted into the bile,their concentrations in bile could be higher than their concentrationsin plasma and liver. Alternatively, glyburide and metabolites mayhave a cooperative effect leading to more severe BSEP inhibitionin vivo. Further understanding in the area concerning disconnect inexposure-response effect with the free drug hypothesis is warrantedto rationalize the role of BSEP inhibition in glyburide-inducedcholestasis.In conclusion, we characterized the mechanisms involved in the
disposition and pharmacokinetics of glyburide as well as its pharmaco-logically active metabolites. Glyburide is actively taken up by hepa-tocytes via OATP1B1, whereas both metabolites were identified assubstrates of multiple hepatic and renal transporters. A PBPK modelwith Bayesian analysis verified the clinical relevance of these multipletransporter processes in determining systemic and tissue exposure ofparent and metabolites with implications for the pharmacodynamicdrug response. Finally, this approach can be applied to other drug-metabolite pairs to predict or better characterize their pharmacokinetics/pharmacodynamics.
Acknowledgments
We thank TristanMaurer, Hugh Barton, David Rodrigues, and Larry Tremainefor valuable inputs during this work.
Authorship ContributionsParticipated in research design: Li, Bi, Vildhede, Scialis and Varma.Conducted experiments: Bi, Vildhede, Scialis, Yang, Marroquin, and Lin.Contributed new reagents or analytic tools: Li.Performed data analysis: Li, Bi, Vildhede, Scialis, and Varma.Wrote or contributed to the writing of the manuscript: Li, Bi, Vildhede,
Scialis, Mathialagan, Yang, Marroquin, Lin, and Varma.
References
Asplund K, Wiholm BE, and Lithner F (1983) Glibenclamide-associated hypoglycaemia: a reporton 57 cases. Diabetologia 24:412–417.
Bi YA, Kazolias D, and Duignan DB (2006) Use of cryopreserved human hepatocytes in sandwichculture to measure hepatobiliary transport. Drug Metab Dispos 34:1658–1665.
Chalk JB, Patterson M, Smith MT, and Eadie MJ (1986) Correlations between in vitro dissolution,in vivo bioavailability and hypoglycaemic effect of oral glibenclamide. Eur J Clin Pharmacol31:177–182.
Dawson S, Stahl S, Paul N, Barber J, and Kenna JG (2012) In vitro inhibition of the bile salt exportpump correlates with risk of cholestatic drug-induced liver injury in humans. Drug Metab Dispos40:130–138.
Fattinger K, Funk C, Pantze M, Weber C, Reichen J, Stieger B, and Meier PJ (2001) The endo-thelin antagonist bosentan inhibits the canalicular bile salt export pump: a potential mechanismfor hepatic adverse reactions. Clin Pharmacol Ther 69:223–231.
Feldman JM (1985) Glyburide: a second-generation sulfonylurea hypoglycemic agent. History,chemistry, metabolism, pharmacokinetics, clinical use and adverse effects. Pharmacotherapy 5:43–62.
Haario H, Laine M, Mira A, and Saksman E (2006) DRAM: efficient adaptive MCMC. StatComput 16:339–354.
Jönsson A, Hallengren B, Rydberg T, and Melander A (2001) Effects and serum levels of gli-benclamide and its active metabolites in patients with type 2 diabetes. Diabetes Obes Metab 3:403–409.
Kimoto E, Li R, Scialis RJ, Lai Y, and Varma MV (2015) Hepatic disposition of gemfibrozil and itsmajor metabolite gemfibrozil 1-O-b-glucuronide. Mol Pharm 12:3943–3952.
Kirchheiner J, Brockmöller J, Meineke I, Bauer S, Rohde W, Meisel C, and Roots I (2002) Impactof CYP2C9 amino acid polymorphisms on glyburide kinetics and on the insulin and glucoseresponse in healthy volunteers. Clin Pharmacol Ther 71:286–296.
Krivoy N, Zaher A, Yaacov B, and Alroy G (1996) Fatal toxic intrahepatic cholestasis secondary toglibenclamide. Diabetes Care 19:385–386.
Li R, Barton HA, and Maurer TS (2014a) Toward prospective prediction of pharmacokinetics inOATP1B1 genetic variant populations. CPT Pharmacometrics Syst Pharmacol 3:e151.
Li R, Barton HA, Yates PD, Ghosh A, Wolford AC, Riccardi KA, and Maurer TS (2014b) A“middle-out” approach to human pharmacokinetic predictions for OATP substrates usingphysiologically-based pharmacokinetic modeling. J Pharmacokinet Pharmacodyn 41:197–209.
Li R, Maurer TS, Sweeney K, and Barton HA (2016) Does the systemic plasma profile inform theliver profile? Analysis using a physiologically based pharmacokinetic model and individualcompounds. AAPS J 18:746–756.
Lilja JJ, Niemi M, Fredrikson H, and Neuvonen PJ (2007) Effects of clarithromycin and grapefruitjuice on the pharmacokinetics of glibenclamide. Br J Clin Pharmacol 63:732–740.
Mylona P and Cleland JG (1999) Update of REACH-1 and MERIT-HF clinical trials in heartfailure. Cardio.net Editorial Team. Eur J Heart Fail 1:197–200.
Naritomi Y, Terashita S, and Kagayama A (2004) Identification and relative contributions ofhuman cytochrome P450 isoforms involved in the metabolism of glibenclamide and lansopra-zole: evaluation of an approach based on the in vitro substrate disappearance rate. Xenobiotica34:415–427.
Neugebauer G, Betzien G, Hrstka V, Kaufmann B, von Möllendorff E, and Abshagen U (1985)Absolute bioavailability and bioequivalence of glibenclamide (Semi-Euglucon N). Int J ClinPharmacol Ther Toxicol 23:453–460.
Niemi M, Backman JT, Neuvonen M, Neuvonen PJ, and Kivistö KT (2001) Effects of rifampin onthe pharmacokinetics and pharmacodynamics of glyburide and glipizide. Clin Pharmacol Ther69:400–406.
Niemi M, Cascorbi I, Timm R, Kroemer HK, Neuvonen PJ, and Kivistö KT (2002) Glyburide andglimepiride pharmacokinetics in subjects with different CYP2C9 genotypes. Clin PharmacolTher 72:326–332.
Ravindran S, Zharikova OL, Hill RA, Nanovskaya TN, Hankins GD, and Ahmed MS (2006)Identification of glyburide metabolites formed by hepatic and placental microsomes of humansand baboons. Biochem Pharmacol 72:1730–1737.
Rodgers T and Rowland M (2006) Physiologically based pharmacokinetic modelling 2: predictingthe tissue distribution of acids, very weak bases, neutrals and zwitterions. J Pharm Sci 95:1238–1257.
Rodrigues AD, Lai Y, Cvijic ME, Elkin LL, Zvyaga T, and Soars MG (2014) Drug-inducedperturbations of the bile acid pool, cholestasis, and hepatotoxicity: mechanistic consider-ations beyond the direct inhibition of the bile salt export pump. Drug Metab Dispos 42:566–574.
Rydberg T, Jönsson A, Karlsson MO, and Melander A (1997) Concentration-effect relations ofglibenclamide and its active metabolites in man: modelling of pharmacokinetics and pharma-codynamics. Br J Clin Pharmacol 43:373–381.
Rydberg T, Jönsson A, and Melander A (1995) Comparison of the kinetics of glyburide and itsactive metabolites in humans. J Clin Pharm Ther 20:283–295.
Rydberg T, Jönsson A, Røder M, and Melander A (1994) Hypoglycemic activity of glyburide(glibenclamide) metabolites in humans. Diabetes Care 17:1026–1030.
Saw D, Pitman E, Maung M, Savasatit P, Wasserman D, and Yeung CK (1996) Granulomatoushepatitis associated with glyburide. Dig Dis Sci 41:322–325.
Shon J and Abernethy DR (2014) Application of systems pharmacology to explore mechanisms ofhepatotoxicity. Clin Pharmacol Ther 96:536–537.
Spraul M, Streeck A, Nieradzik M, and Berger M (1989) Uniform elimination pattern for gli-benclamide in healthy Caucasian males. Arzneimittelforschung 39:1449–1450.
Templeton IE, Chen Y, Mao J, Lin J, Yu H, Peters S, Shebley M, and Varma MV (2016)Quantitative prediction of drug-drug interactions involving inhibitory metabolites in drug de-velopment: how can physiologically based pharmacokinetic modeling help? CPT Pharmaco-metrics Syst Pharmacol 5:505–515.
van Basten JP, van Hoek B, Zeijen R, and Stockbrügger R (1992) Glyburide-induced cholestatichepatitis and liver failure. Case-report and review of the literature. Neth J Med 40:305–307.
Varma MV, Scialis RJ, Lin J, Bi YA, Rotter CJ, Goosen TC, and Yang X (2014) Mechanism-basedpharmacokinetic modeling to evaluate transporter-enzyme interplay in drug interactions andpharmacogenetics of glyburide. AAPS J 16:736–748.
Varma MV, Steyn SJ, Allerton C, and El-Kattan AF (2015) Predicting clearance mechanism indrug discovery: extended clearance classification system (ECCS). Pharm Res 32:3785–3802.
746 Li et al.
at ASPE
T Journals on M
ay 26, 2020dm
d.aspetjournals.orgD
ownloaded from
Woodhead JL, Yang K, Brouwer KL, Siler SQ, Stahl SH, Ambroso JL, Baker D, Watkins PB,and Howell BA (2014) Mechanistic modeling reveals the critical knowledge gaps in bile acid-mediated DILI. CPT Pharmacometrics Syst Pharmacol 3:e123.
Zamek-Gliszczynski MJ, Chu X, Polli JW, Paine MF, and Galetin A (2014) Understanding thetransport properties of metabolites: case studies and considerations for drug development. DrugMetab Dispos 42:650–664.
Zharikova OL, Fokina VM, Nanovskaya TN, Hill RA, Mattison DR, Hankins GD, and Ahmed MS(2009) Identification of the major human hepatic and placental enzymes responsible for thebiotransformation of glyburide. Biochem Pharmacol 78:1483–1490.
Zheng HX, Huang Y, Frassetto LA, and Benet LZ (2009) Elucidating rifampin’s inducing andinhibiting effects on glyburide pharmacokinetics and blood glucose in healthy volunteers:
unmasking the differential effects of enzyme induction and transporter inhibition for a drug andits primary metabolite. Clin Pharmacol Ther 85:78–85.
Zhou L, Naraharisetti SB, Liu L, Wang H, Lin YS, Isoherranen N, Unadkat JD, Hebert MF,and Mao Q (2010) Contributions of human cytochrome P450 enzymes to glyburide metabolism.Biopharm Drug Dispos 31:228–242.
Address correspondence to: Manthena V.S. Varma, Pharmacokinetics, Dynam-ics, and Metabolism, MS 8220-2451, Pfizer Global Research and Development,Pfizer Inc., Groton, CT 06340. E-mail: [email protected]
Disposition of Glyburide and Its Active Metabolites 747
at ASPE
T Journals on M
ay 26, 2020dm
d.aspetjournals.orgD
ownloaded from