Transportation Security and the Role of Resilience: A ... · Transportation security and the role...
12
CREATE Research Archive Published Articles & Papers 2011 Transportation Security and the Role of Resilience: A Foundation for Operational Metrics Andrew Cox Fynnwin Prager University of Southern California Adam Z. Rose University of Southern California, [email protected] Follow this and additional works at: hp://research.create.usc.edu/published_papers Part of the Other Economics Commons is Article is brought to you for free and open access by CREATE Research Archive. It has been accepted for inclusion in Published Articles & Papers by an authorized administrator of CREATE Research Archive. For more information, please contact [email protected]. Recommended Citation Cox, Andrew; Prager, Fynnwin; and Rose, Adam Z., "Transportation Security and the Role of Resilience: A Foundation for Operational Metrics" (2011). Published Articles & Papers. Paper 207. hp://research.create.usc.edu/published_papers/207
Transcript of Transportation Security and the Role of Resilience: A ... · Transportation security and the role...

CREATE Research Archive
Published Articles & Papers
2011
Transportation Security and the Role of Resilience:A Foundation for Operational MetricsAndrew Cox
Fynnwin PragerUniversity of Southern California
Adam Z. RoseUniversity of Southern California, [email protected]
Follow this and additional works at: http://research.create.usc.edu/published_papersPart of the Other Economics Commons
This Article is brought to you for free and open access by CREATE Research Archive. It has been accepted for inclusion in Published Articles & Papersby an authorized administrator of CREATE Research Archive. For more information, please contact [email protected].
Recommended CitationCox, Andrew; Prager, Fynnwin; and Rose, Adam Z., "Transportation Security and the Role of Resilience: A Foundation forOperational Metrics" (2011). Published Articles & Papers. Paper 207.http://research.create.usc.edu/published_papers/207

Transportation security and the role of resilience: A foundation foroperational metrics
Andrew Cox a, Fynnwin Prager b,�, Adam Rose b
a Risk Analysis and Capability Design, Transportation Security Administration, US Department of Homeland Security, 601 South 12th Street, Arlington, VA 22202, United Statesb National Center for Risk and Economic Analysis of Terrorism Events, University of Southern California, 3710 McClintock Avenue, RTH 314, Los Angeles, CA 90089-2902, United States
a r t i c l e i n f o
Available online 14 December 2010
Keywords:
Transportation security
Terrorism
Resilience
Risk perception
London bombings
a b s t r a c t
This paper presents operational metrics to determine a passenger transportation system’s resilience to
terrorism. The metrics range from those specific to the number of trips to more holistic measures that
include the contribution of these trips directly and indirectly to economic activity. These metrics can aid
decision-makers in rendering more informed judgments about resource allocation and how to design a
portfolio of security and recovery strategies.
The paper also provides a framework for evaluating transportation risk, including the important role of
perceptions in potentially amplifying these risks. It provides a range of strategies to promote resilience as
well. Resilience of a transportation system is then quantified using the real-world case of the 2005 London
subway and bus bombings. In terms of ordinary resilience, we find that 77.4 percent of total journey
reductions on attacked modes were offset by increases in substitute modes for the 4 months following the
attacks. We also estimate that 76.9 percent of total journey reductions on attacked modes were the result
of a ‘‘fear factor,’’ as opposed to capacity reductions.
The paper concludes with a set of proposed prospective resilience measures to evaluate the potential
resilience of a transportation system. These metrics are based on the vulnerability, flexibility, and
resource availability to cope with a terrorist attack or natural disaster.
& 2010 Elsevier Ltd. All rights reserved.
1. Introduction
It is not surprising that terrorists have so often targetedtransportation systems in their attacks (Meyer, 2010). Transporta-tion systems are especially vulnerable. In particular, mass transitmodes concentrate large numbers of people in confined and oftenlow-security areas. Moreover, given their network character andfundamental role in advanced regional economies, they are capableof spreading substantial economic losses to the rest of society. Sincethe 9/11 attacks, much government attention has been paid tostrengthening the security of transportation systems. This paperexplores a complementary approach to reducing the economiclosses of terrorism through the role of resilience—essentially, theability of a system to maintain function and to ‘‘bounce back’’quickly from a disturbance.
While traditionally explored in the context of natural disasters, theconcept of resilience is important in the terrorism realm as well.Terrorists adapt their tactics and methods over time to take advantageof new technologies, to shift away from strengthened targets, and tocapitalize on new weaknesses. Yet the transportation systems that
terrorists seek to disrupt, as well as the regional economies whichthey facilitate, are adaptive too. For example, though underempha-sized in the literature, the responsibility for responding to a systemdisturbance extends beyond the public or private provider oftransportation services. Businesses and consumers can contributeto resilience as well by actions that lower their transportation servicedemands without reducing the economic activity levels to whichthese services contribute. While, on the supply side, regional trans-portation systems have limited flexibility, the consumers andbusinesses that use the system are particularly adaptive. Transportuser adaptability is increasingly the case with the emergence andproliferation of telecommunications, which has enabled substitutionsof many journey types in the movement of people, for example onlineshopping, teleconferencing and telecommuting.
This paper presents operational metrics to estimate a transpor-tation system’s resilience. These metrics aid government decision-makers in rendering more informed judgments about resourceallocation and how to design a portfolio of security and recoverystrategies (see also, Lee, 2010). The paper begins by providingdefinitions of economic resilience and transportation systemresilience as well as the relationship between the two. Here, weemphasize the importance of resilience within the risk equation, aswell as the role of public behavioral response in resilience. We thenturn to operational metrics of resilience, first discussing themethod for calculating economic resilience before applying our
Contents lists available at ScienceDirect
journal homepage: www.elsevier.com/locate/tranpol
Transport Policy
0967-070X/$ - see front matter & 2010 Elsevier Ltd. All rights reserved.
doi:10.1016/j.tranpol.2010.09.004
� Corresponding author. Tel.: +1 714 907 5225; fax: +1 213 821 3926.
E-mail addresses: [email protected] (A. Cox), [email protected] (F. Prager),
[email protected] (A. Rose).
Transport Policy 18 (2011) 307–317

measure of transportation system resilience to the case of theLondon subway and bus bombings of 2005. We conclude bybroadening our discussion to prospective resilience measures forgovernment transportation policy makers through taxonomy ofpredictive measures.
2. Transportation system risk from terrorist attacks
Terrorism risk is fundamentally different than natural-disastersor ‘‘traditional’’ risks such as auto accidents or cancer. Terroristsadapt their methods and targets to our security efforts, a phenom-enon known as ‘‘threat shifting’’. The ability of terrorists to adaptand to conceal their capabilities and intentions means it isimpossible to know with any certainty the number of active andviable plots that may be underway (Grabo, 2004). This introduces apotentially paralyzing ‘‘unknown unknown’’ element into any riskanalysis. Such a consideration logically prevents an estimation ofabsolute risk, because there is no way to know the absolute numberof attacks that might be attempted. This is significantly differentthan house fires, or occurrences of cancer, which have a random,knowable empirical character amenable to forecasting. This brandof uncertainty and the proven possibility of terrorist ability toinflict catastrophic damage means we are vulnerable to what riskphilosopher Nassim Taleb (2007) has termed a ‘‘Black Swan’’event—a low probability, high consequence event beyond therealm of normal expectations, which is typically unpredicted andunpredictable.
From a risk-management perspective, the threat-shifting phe-nomenon means that the government could spend significantresources and reduce risk in one specific area only to see ittransferred to another with no overall risk reduction. Worse, ifrisks are managed one-at-a-time, resources may be tied up inspecific programs which, in turn, limit the ability to flexibly deployresources to other emerging threats. The uncertainty introduced bythreat-shifting also puts significant limits on the breadth andeffectiveness of traditional long-range government budget plan-ning methods that pre-suppose certain attacks; not only is pre-diction of which actions terrorists will take an inherently difficult(or impossible) problem, but it is all the more so because terroristscan observe the planning and preparation and simply adjust theirown plans.
The historical record of aviation terrorism provides a concreteexample. The world saw a spike in terrorist hijackings beginning inthe early 1970s. In response, transportation security strategy hascentered on preventing weapons from getting onto planes. Afterthe 1988 Pan-Am Lockerbie bombing, more robust explosivedetection technology was implemented for checked baggage.Then, came 9/11, and the Transportation Security Administrationwas established to professionalize the workforce and accelerate thedevelopment of the most advanced security technologies. But thelitany of threats was just beginning. In the post-9/11 world we sawshoe bombers, bomb vests worn by the Chechen ‘‘Black Widows,’’the liquids plot in 2006, and then the attack on Glasgow’s airportwith a crude vehicle-born improvised explosive device. As a resultof the ability of terrorists to threat-shift over time, a risk manage-ment approach that seeks strategies to lessen our vulnerability touncertainty and assumptions about the risks we face will be morerobust when considering an evolving enemy.
We cannot assume that we will be able to prevent all terroristattacks. By augmenting a security strategy of prevention anddetection with a strategy of encouraging transportation networkresilience, we can reduce the consequences of an unforeseen attackon the transportation system. More importantly, a resiliencestrategy relies on far fewer assumptions about the nature of future
attacks. In most cases, it is also relatively less costly than ordinarymitigation.
3. Resilience and transportation
System resilience to disasters has been emphasized for morethan a decade with progress on its definition stemming from thework of Tierney (1997), Regianni et al. (2002), Bruneau et al. (2003),Shinozuka and Chang (2004), and Rose (2004b, 2007). In all but thework of Bruneau et al. and Rose, it has not been extended beyond asimple definition and a cursory explanation. In the former, eco-nomic resilience is one of four major dimensions of the broaderconcept of resilience. However, beyond providing a few examplesand relating economic resilience to dimensions in related disci-plines, the work offers little that is operational. Moreover, itconfuses some issues, such as including hazard mitigation as asubset of resilience. As our analysis below indicates, it is importantto distinguish actions that are implemented before a disaster(which we place in the broad category of mitigation) from thosethat are implemented afterward (for which we reserve the termresilience). This is not to downplay the role of mitigation but ratherto be able to focus on the post-disaster stages and to highlight timetradeoffs.
Rose (2007) has already identified two types of system resi-lience and a set of strategies that could help improve them. Staticresilience is defined as the capability of an entity or system tomaintain function. An example of how to measure this throughpassenger journey data is provided in the case study of the Londontransportation system’s response to the July 2005 bombings.Dynamic resilience refers to the capability of an entity or systemto recover rapidly from a severe shock to achieve a desired state.
3.1. Holistic vs. specific resilience
Resilience can be defined broadly or narrowly. For example,economic resilience can be all encompassing (Rose, 2007). At themicroeconomic level, it would include both supply and demand(i.e., both the provision of a good or service and its utilization). Atthe mesolevel, it would include the workings of individual marketsand their interactions. At the macrolevel, it would not endat the boundaries of a specific product, service, supply chain ornetwork, but rather extend as far as the indirect impacts of aterrorist attack or other disaster can go, which means the economyas a whole.
Transportation resilience could run a similar course. It couldbegin with consideration of resilient actions by providers oftransportation services and then proceed to the resilience of itscustomers through the alternative modes, telecommuting, greaterreliance on existing inventories (as opposed to new shipments), etc.However, it is not only the number of trips that is important but thecontribution they make to transportation customers’ productionlevels or well-being. Moreover, this extends beyond the directdemand side of the transportation market to the next round ofcustomers of these producers. Of course, the ripples do not endthere but extend to the successive forward rounds of users oftransportation services and of goods and services as direct andindirect inputs to transportation. At this point, transportationresilience becomes equivalent to economic resilience.
One important feature of economic resilience is that it ismeasured in terms of a common denominator—dollars. As such,economic resilience gets at the bottom line of impacts. For example,rather than simply measure transportation resilience in terms ofthe avoidance of loss of business trips, the economic resilienceapproach would examine the contribution of these trips to thevalue of goods and services they produce. This way, telecommuting,
A. Cox et al. / Transport Policy 18 (2011) 307–317308

would be viewed as a resilient strategy, because it maintainsproduction even with fewer trips; otherwise, its contribution mightbe overlooked.
The extent of the linkages involved in this process is daunting, inthat it requires evaluation not only of the demand for transporta-tion services, but also the effects that any interruption has on directand indirect production of goods and services, before resilience(as a baseline or point of reference) and after resilience isimplemented. In this paper, however, we take only a first steptoward this ideal by examining the effects of a terrorist attack onthe supply and demand for transportation services with andwithout resilience.
The capabilities referred to above in both definitions imply alevel of attainment. Hence, the definition is contextual—the level ofsystem function and the speed of recovery have to be compared tothe levels that would have existed had resilience been absent. Thismeans a reference point or type of worst case outcome must beestablished first. Further discussion of this oft-neglected point isprovided below.
3.2. Transportation system resilience strategies
Before discussing resilience strategies in depth, it is firstnecessary to define a transportation system. A transportation
system can be defined as ‘‘the assemblage of components associatedwith a specific means of transport’’ (Tolley and Turton, 1995, p. 42).And yet, ‘‘collectively, all the individual transport systems within acountry are referred to as the national transport system’’ (Tolleyand Turton, 1995, p. 42). In this vein, a regional transportation
system can be defined as the combination of vehicles, infrastruc-ture, and operations that enable the movements – or ‘‘satisfy thetravel demand’’– of people and goods within a defined region(Cascetta, 2001, p. xv; see also Tolley and Turton, 1995, p. 13; Black,2003, p. 3). It is important to note that this study focuses ontransportation systems that move people rather than freight.Goods movement is important only when those modes areattacked, or when mode use changes following an attack impactsgoods movement indirectly, e.g., if road transportation increases tothe point that goods movement on roads is restricted.
There are many ways to achieve and enhance transportationsystem resilience, see Ekern and Crossett (2010) and Meyer (2010).Here, we select and define categories specific to static and dynamictransportation system resilience.
Strategies that mute losses at the microeconomic level include:
� Conservation is maintaining service with fewer inputs (e.g.,railroad cars, employees) on the supply side or doing with lesstransportation on the demand side.� Input substitution is shifting input combinations or transporta-
tion modes to achieve the same function or level of productivity� Inventories include both emergency stockpiles and ordinary
working supplies of production inputs for both the trans-portation system and for economic activities dependent ontransportation.� Excess capacity refers to idle plant and equipment. A special case
is redundancy that refers to back-up systems that do not increaseproductive capacity, but rather compensate for damaged capital(e.g., multiple tracks).� Relocation is changing the site of business activity in terms of
travel routes or end-user sites.� Resource unimportance refers to the portion of business operation
that can continue without a critical input like transportation.� Import substitution is importing resources from other regions.
This might be imports for the transportation system itself or theemployment of the transportation system in doing so.
� Export substitution refers to selling goods to other regions thatcannot be sold otherwise to local customers.� Technological change allows for easier manipulation to restore
function, to increase production, change hours of operation, andto respond to altered service demands.� Production recapture refers to working overtime or extra shifts to
catch up on lost production or service.� Logistics refinement refers to reducing impediments to the
delivery of goods and services.
Dynamic resilience strategies to speed recovery include:
� Removing operating impediments involves debris removal andrelated complications, and streamlining paperwork for insur-ance claims and government assistance.� Management effectiveness refers to skills that promote restora-
tion, repair and reconstruction.� Speeding restoration refers to a range of options such as alter-
native means of access to repair sites and incentive contracts.� Input substitution, import substitution, inventories, as above, also
speed restoration, but pertain to materials and labor needed forrepair activities rather than normal production operations.
These strategies can apply to any decision maker within thissystem, whether suppliers such as mass transit providers and publictransportation authorities, or costumers such as firms and individuals.Supply-side resilience is concerned with delivering outputs tocustomers, and could include the establishment of system redun-dancy (a form of static resilience), but usually requires the repair orconstruction of critical inputs (i.e. dynamic resilience). Repair of thecapital stock, or supply-side efforts, are the domain of the inputprovider and are a completely separate matter from customer-sideresilience. Improving delivery logistics refers to the fact that suppliersmust get their products to customers. Examples include shoring upthe network of wholesale and retail trade, contingency contracts withtransportation companies, and planning exercises. The rubric for prioraction is ‘‘broadening the supply chain.’’ These actions are strong atboth the inherent and adaptive levels. As with most cases of supply-side resilience, they are applicable primarily to output. The majorobstacle in implementing supplier-side resilience is the condition ofthe transportation network.
Customer-side resilience copes with the disruption of thedelivery of goods and services, and pertains to ways to useresources available as effectively as possible by both businessesand households, i.e., it is primarily associated with static resilience.For example, at a given point in time, meaning with a given fixedcapital stock, resilience is completely a demand-side issue in thecontext of transportation. In addition to customer-side resilience,households can be thought to have supply-side resilience con-siderations with respect to providing their own services (e.g., carpooling) or providing labor. However, household activities are notcounted in national income accounts and are difficult to value, sosupply-side resilience is more difficult to measure for households.
3.3. Transportation system resilience and public behavioral responses
Evidence suggests that costumer-side behavioral responses toterrorist attacks play a critical role in transportation systemresilience. Moreover, numerous studies have shown that changingrisk perceptions following terrorist attacks have lead to behavioralresponses, including transportation mode choice (Prager et al.,forthcoming), with significant consequences. The 9/11 attacksresulted in a 2-year drop-off in passengers (Gordon et al., 2007),a major component of the estimated $109 billion economic lossesexperienced (Rose et al., 2009). Evidence from other attacks revealssimilar elements of behavioral response. In both London and
A. Cox et al. / Transport Policy 18 (2011) 307–317 309
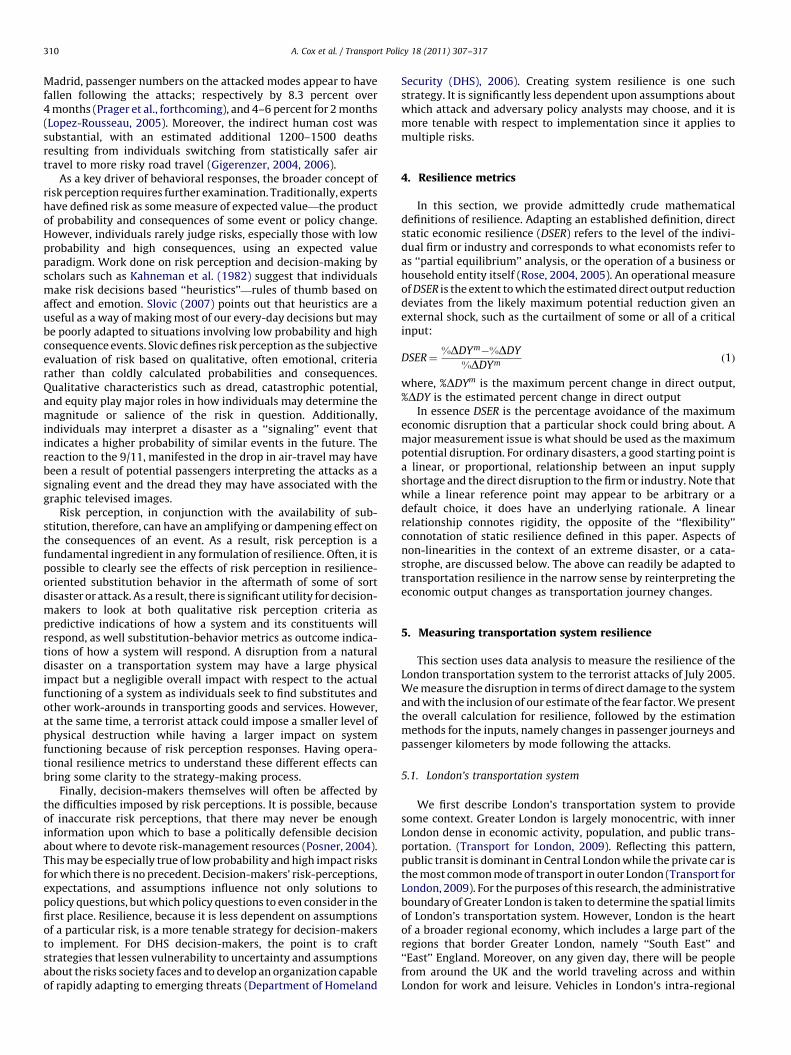
Madrid, passenger numbers on the attacked modes appear to havefallen following the attacks; respectively by 8.3 percent over4 months (Prager et al., forthcoming), and 4–6 percent for 2 months(Lopez-Rousseau, 2005). Moreover, the indirect human cost wassubstantial, with an estimated additional 1200–1500 deathsresulting from individuals switching from statistically safer airtravel to more risky road travel (Gigerenzer, 2004, 2006).
As a key driver of behavioral responses, the broader concept ofrisk perception requires further examination. Traditionally, expertshave defined risk as some measure of expected value—the productof probability and consequences of some event or policy change.However, individuals rarely judge risks, especially those with lowprobability and high consequences, using an expected valueparadigm. Work done on risk perception and decision-making byscholars such as Kahneman et al. (1982) suggest that individualsmake risk decisions based ‘‘heuristics’’—rules of thumb based onaffect and emotion. Slovic (2007) points out that heuristics are auseful as a way of making most of our every-day decisions but maybe poorly adapted to situations involving low probability and highconsequence events. Slovic defines risk perception as the subjectiveevaluation of risk based on qualitative, often emotional, criteriarather than coldly calculated probabilities and consequences.Qualitative characteristics such as dread, catastrophic potential,and equity play major roles in how individuals may determine themagnitude or salience of the risk in question. Additionally,individuals may interpret a disaster as a ‘‘signaling’’ event thatindicates a higher probability of similar events in the future. Thereaction to the 9/11, manifested in the drop in air-travel may havebeen a result of potential passengers interpreting the attacks as asignaling event and the dread they may have associated with thegraphic televised images.
Risk perception, in conjunction with the availability of sub-stitution, therefore, can have an amplifying or dampening effect onthe consequences of an event. As a result, risk perception is afundamental ingredient in any formulation of resilience. Often, it ispossible to clearly see the effects of risk perception in resilience-oriented substitution behavior in the aftermath of some of sortdisaster or attack. As a result, there is significant utility for decision-makers to look at both qualitative risk perception criteria aspredictive indications of how a system and its constituents willrespond, as well substitution-behavior metrics as outcome indica-tions of how a system will respond. A disruption from a naturaldisaster on a transportation system may have a large physicalimpact but a negligible overall impact with respect to the actualfunctioning of a system as individuals seek to find substitutes andother work-arounds in transporting goods and services. However,at the same time, a terrorist attack could impose a smaller level ofphysical destruction while having a larger impact on systemfunctioning because of risk perception responses. Having opera-tional resilience metrics to understand these different effects canbring some clarity to the strategy-making process.
Finally, decision-makers themselves will often be affected bythe difficulties imposed by risk perceptions. It is possible, becauseof inaccurate risk perceptions, that there may never be enoughinformation upon which to base a politically defensible decisionabout where to devote risk-management resources (Posner, 2004).This may be especially true of low probability and high impact risksfor which there is no precedent. Decision-makers’ risk-perceptions,expectations, and assumptions influence not only solutions topolicy questions, but which policy questions to even consider in thefirst place. Resilience, because it is less dependent on assumptionsof a particular risk, is a more tenable strategy for decision-makersto implement. For DHS decision-makers, the point is to craftstrategies that lessen vulnerability to uncertainty and assumptionsabout the risks society faces and to develop an organization capableof rapidly adapting to emerging threats (Department of Homeland
Security (DHS), 2006). Creating system resilience is one suchstrategy. It is significantly less dependent upon assumptions aboutwhich attack and adversary policy analysts may choose, and it ismore tenable with respect to implementation since it applies tomultiple risks.
4. Resilience metrics
In this section, we provide admittedly crude mathematicaldefinitions of resilience. Adapting an established definition, directstatic economic resilience (DSER) refers to the level of the indivi-dual firm or industry and corresponds to what economists refer toas ‘‘partial equilibrium’’ analysis, or the operation of a business orhousehold entity itself (Rose, 2004, 2005). An operational measureof DSER is the extent to which the estimated direct output reductiondeviates from the likely maximum potential reduction given anexternal shock, such as the curtailment of some or all of a criticalinput:
DSER¼%DDYm�%DDY
%DDYmð1Þ
where, %DDYm is the maximum percent change in direct output,%DDY is the estimated percent change in direct output
In essence DSER is the percentage avoidance of the maximumeconomic disruption that a particular shock could bring about. Amajor measurement issue is what should be used as the maximumpotential disruption. For ordinary disasters, a good starting point isa linear, or proportional, relationship between an input supplyshortage and the direct disruption to the firm or industry. Note thatwhile a linear reference point may appear to be arbitrary or adefault choice, it does have an underlying rationale. A linearrelationship connotes rigidity, the opposite of the ‘‘flexibility’’connotation of static resilience defined in this paper. Aspects ofnon-linearities in the context of an extreme disaster, or a cata-strophe, are discussed below. The above can readily be adapted totransportation resilience in the narrow sense by reinterpreting theeconomic output changes as transportation journey changes.
5. Measuring transportation system resilience
This section uses data analysis to measure the resilience of theLondon transportation system to the terrorist attacks of July 2005.We measure the disruption in terms of direct damage to the systemand with the inclusion of our estimate of the fear factor. We presentthe overall calculation for resilience, followed by the estimationmethods for the inputs, namely changes in passenger journeys andpassenger kilometers by mode following the attacks.
5.1. London’s transportation system
We first describe London’s transportation system to providesome context. Greater London is largely monocentric, with innerLondon dense in economic activity, population, and public trans-portation. (Transport for London, 2009). Reflecting this pattern,public transit is dominant in Central London while the private car isthe most common mode of transport in outer London (Transport forLondon, 2009). For the purposes of this research, the administrativeboundary of Greater London is taken to determine the spatial limitsof London’s transportation system. However, London is the heartof a broader regional economy, which includes a large part of theregions that border Greater London, namely ‘‘South East’’ and‘‘East’’ England. Moreover, on any given day, there will be peoplefrom around the UK and the world traveling across and withinLondon for work and leisure. Vehicles in London’s intra-regional
A. Cox et al. / Transport Policy 18 (2011) 307–317310

transportation system include the following modes: Rail, Under-ground and DLR (Docklands Light Rail), bus, tram, taxi, car,motorcycle, cycle, and walking.
On the supply side, London’s transportation system infrastruc-ture is managed by Transport for London, and consists of roads andtraffic management systems, various bus and tram network ele-ments such as bus stops and depots, the London Undergroundnetwork, the ‘‘Overground’’ rail network, and the river transportnetwork. In 2004, the car was the most common vehicle used in theGreater London region (44.0 percent of journeys), while walking isthe second most common (23.2 percent of journeys), and bus thethird most common with 14.1 percent of daily journeys. Railcontributed 7.5 percent of daily journeys.
Policy changes have contributed to a net shift away from privatetransport to public transit between 2000 and 2007. Substantialinvestment in public transit systems over the past decade hasincreased supply significantly. Between the late 1990s and 2005,London Underground operations increased by 15 percent andLondon buses operations increased by 29 percent (Transport forLondon, 2009). There have also been new additions to the railnetwork, not least the new rail track for the route from London tocontinental Europe. This contrasts a reduction in road capacity inthe Central London area (Transport for London, 2009). Moreover,the Congestion Charge road pricing scheme in Central London wasimplemented in February 2003, contributing to already consider-able motor vehicle ownership costs in Central London. Yet otherinfluences have contributed to this shift towards public transport,such as demographic changes, real reductions in public transit fares(Transport for London, 2009), improved safety records (Transportfor London, 2009), improved service quality on buses as roads havebecome less congested, and a cultural shift towards environmentalconcerns.
5.2. Measuring London’s transportation system resilience
To operationalize transportation system resilience, we analyzeempirical data in light of the above metric for transportationresilience: the percentage of maximum disruption avoided byresilience behaviors. Maximum disruption refers to the reductionin passenger journeys for the attacked modes—here we analyzepassenger data for London Underground and buses for a 7 yearperiod surrounding the attacks. Resilience behaviors refer to theincrease in passenger journeys for alternative modes, hence weexamine data for car, motorcycle, bicycle, and walking over thesame period. To test the sensitivity of our unit of measure, we alsolook at passenger miles/kilometers for both sets of modes. In termsof dynamic resilience, we examine the speed of recovery beyond anormal speed. This can also be measured with passenger kilo-meters. A broader definition using a multi-dimensional index willalso be examined.
5.3. Overview of results
The London transportation system’s resilience is estimatedat 77.4 percent for the 4 months following the attacks. In otherwords, individuals switching to substitute modes offset over three-quarters of the reductions in passenger journeys on attacked modes.A 4-month period is used because, as shown by Prager et al.(forthcoming), this was the point at which London Undergroundpassenger levels returned to predicted levels for a sustained period.
As shown in Table 1, the total maximum disruption of 39.4 millionpassenger journeys is made up of 22.7 million London Undergroundjourneys and 16.7 million bus journeys. Of this 39.4 million, about30.3 million was the result of fear as opposed to capacity contractions.For resilience behavior, we estimate an increase of 30.5 million
passenger journeys for alternative modes. Detailed calculations of thisavoided disruption are presented below.
In essence, therefore, we are considering a broad definition ofthe disruption and capturing the effect of resilience in respondingto both the basic disruption and the fear factor. The first representsa more efficient use of resources through modal substitution, whilethe latter represents resilience as an erosion of fear.
5.4. Calculation of resilience
5.4.1. Attacked modes reductions in passenger journeys
Prager et al. (2010) estimate a reduction of 22.7 million LondonUnderground passenger journeys for the 4 months following theLondon July 2005 attacks. This estimation is the difference betweenobserved aggregate daily passenger gate entrance data and thecounter-factual estimation of passenger journeys without anattack, where predicted values are generated from a multivariatetime-series regression model that controls for economic, demo-graphic, seasonal, and system capacity variables.
One issue here is the proportion of total disruption that is theresult of a fear factor as opposed to capacity reductions. Identifyingthese relative proportions is complicated by three key factors. First,there were two sets of attacks, the first on July 7, 2001 and thesecond two weeks later on July 21, 2005. The first attacks causedthe main damage and disruption: 4 suicide bombers blew up 3London Underground trains and 1 bus, killing 52 and injuring 770.The impact of the second attacks on passenger journeys can betreated as purely a ‘‘fear’’ factor, as no deaths, injuries, or furtherstation closures occurred. Moreover, two lines reopened the weekafter the second attacks, and the remaining three within a weekafter that. The second complicating factor is the networked natureof the London Underground system. Following the attack, onlycertain sections of the 5 directly impacted lines were closedfollowing the attack, and other interacting lines were reopenedthe following day. The third complicating factor is the gradualreopening of damaged lines. As shown in Fig. 1, in the week of firstattacks on July 7, 2005, there was an immediate drop of more than2 million passenger journeys. Then in the third week, passengerjourneys picked up again, only to be followed by further reductionsin the next week, probably the result of the second attacks.
Fig. 2 is the basis for our disaggregation of the impacts of supplyside reductions (station closures) and the fear factor on LondonUnderground passenger journeys. Holding all other influencesconstant, we divide the total reduction – the shape of which is asketch of that shown in Fig. 1 – into four segments. The two linesthat establish these divisions are also taken from Fig. 1. The verticaldivision line at July 2 2005 is the week during which full LondonUnderground service was resumed. The curve sloping from bottomleft to top right (based on ‘‘Estimated July 7th Fear Factor Curve’’ inFig. 1) is a logarithmic function that estimates ridership rates
Table 1Changes in passenger journeys for the 4 months following the London July 2005
attacks.
Mode Passenger journey changes (millions)
Capacity Fear factor Total
Attacked modes �9.0 �30.3 �39.4
Underground �9.0 �13.6 �22.7
Bus 0.0 �16.7 �16.7
Alternative modes 30.5
Road (car) 6.0
Cycle 5.1
Motorcycle 2.6
Walk 16.8
A. Cox et al. / Transport Policy 18 (2011) 307–317 311

(including recovery) in the absence of a second bombing on July 212005. It parallels the smoothed line of best fit curve for passengerreductions (‘‘Fitted Total Passenger Journey Reduction Curve’’) andbegins at the point of greatest reduction in passenger journeys, i.e.the week of July 14 2005.
The rationale for disaggregating the total passenger journeyreductions in this manner is as follows. We assume that the impactof station closures (capacity reduction) is equal to all of thepassenger journey reductions for the first week and subsequentdeclines. The rate of this recovery without a second attack isassumed to reflect the rate recovery with both attacks: at alogarithmic rate parallel to the line of best fit for the total passengerjourney reductions curve. As such, we assume the capacity reduc-tion impact continues beyond the date of all stations reopening inthe form of a lag effect. This is based on the idea that not allindividuals would return immediately to their pre-attack trans-portation mode choice (in this case London Underground and bus)once that mode recovered to pre-attack capacity. Even in theabsence of fear, individuals would return gradually to their pre-attack behavior because their response to the attack might carrywith it lasting consequences. For example, individuals mightpurchase a season-ticket for an alternative transport mode, hencemaking the pre-attack mode choice more expensive for that period(Fig. 3).
The calculation of the segments’ proportions is presented inTable 2. Of the 22.7 million passenger journey reductions, about 9million are attributable to station closures, while some 13.6 millionare attributable to fear. A major factor in this estimation is theshape of the curve cutting from bottom left to top right (based on‘‘Estimated July 7th Fear Factor Curve’’ in Fig. 1).
We estimate a reduction of 16.7 million bus passenger journeysfor the 4-month period (which translates to 5 4-week periods)
following the London July 2005 attacks. Aggregate bus passengerjourney data for 2001–2006 was sourced from Transport forLondon in 2007. This data is aggregated into 4-week periods tofacilitate the use of a univariate time-series ARIMA (1,0,1) model.The ARIMA statistical approach analyses characteristics of thetime-series trend, in terms of auto-regressivity, lag, and movingaverage, and enables the prediction beyond a particular point intime. Here we include a 13 period trend feature to captureseasonality. The results presented in Fig. 4 show that the reductions
Fig. 2. Disaggregation of passenger journey reductions for station closures and fear.
90,000
100,000
110,000
120,000
130,000
140,000
150,000
Jan-
01
May
-01
Sep-
01
Jan-
02
May
-02
Sep-
02
Jan-
03
May
-03
Sep-
03
Jan-
04
May
-04
Sep-
04
Jan-
05
May
-05
Sep-
05
Jan-
06
May
-06
Sep-
06
4-week period
ObservedPredictedWeek of July 7th Attacks
Fig. 3. Aggregate bus passenger journeys, 2001–2006.
Table 2Calculation of passenger journey reductions numerical disaggregation between
capacity reduction and stigma impacts.
Key Description Change in passenger
journeys (millions)
Pure station closure impact �8.02
Station closure lag effect �1.00
Stigma effect (before system re-opening) �3.16
Stigma effect (after system re-opening) �10.48
Total �22.66
Fig. 1. Change in weekly London underground passenger journeys following July 2005 bombings.
Source: Based on data from Prager et al. (2010).
A. Cox et al. / Transport Policy 18 (2011) 307–317312

lasted for a similar period to those of the London Underground. Interms of the fear factor, in contrast to the London Underground, thebus system was back at full capacity the day after the attacks. Onlyone bus was damaged and the road infrastructure was notsignificantly impacted. This implies that all of the reductionswere the result of the fear factor rather than supply side reductions.
5.4.2. Identifying disruption avoided on alternative modes
The second element in operationalizing the narrow definition ofstatic resilience is to identify disruption avoided. We estimate thisfor London’s transportation system by estimating the substitutionto alternative modes following the attacks. This estimation is basedon empirical data analysis of transportation mode use. It isimportant to note that our model of transportation mode substitu-tion examines aggregate data and therefore does not captureinteractions between modes, or the possibility that passengerreductions on the attacked mode are subsequently offset by theappeal of lower congestion. We estimate passenger journeychanges following the attacks for non-attacked modes with theexception of rail, which is not an appropriate substitute for theattacked modes in the London transportation system. Supportingevidence is presented in Appendix A below.
5.4.3. Ideal data required for calculations
The above analyses and those in Appendix A are conducted withthe best available data. Data used for the attacked modes is closestto the ideal, as it features daily passenger journey levels and isfurther disaggregated by station (London Underground) and line(bus). However data for the alternative modes are lacking. Ideally,daily or weekly counts of all passenger journeys for a number ofyears surrounding the attack date for the remaining modes wouldenable further and more sophisticated analyses of the interactions
between transportation modes before and following the attacks.The lack of data regarding telecommuting is also limited and wouldbe essential if converting these findings to a study of economicimpacts. Finally, the ability of firms and individuals to recoup lostwork hours at a later date (i.e. ‘‘production recapture’’) should alsobe considered.
Alternatively, transportation mode choice surveys conductedon either side of the attack dates would enable more in-depthanalyses of behavioral choices in response to the event. Householdexpenditure surveys enable a similar level of analysis throughdiscrete choice analysis frameworks. However, the relevant expen-diture survey for the UK was first disaggregated following theattacks, making such analysis impossible.
6. Prospective resilience measures for decision-makers
Thus far the quantification of resilience has been possiblethrough retrospective analysis of events. What measures areavailable for security decision-makers when they try to estimatethe resilience of a system prospectively? How can decision-makerscraft strategies of resilience and have confidence that thosestrategies will work when a disaster strikes? The authors proposea taxonomy of measures which decision-makers and analysts coulduse as a ‘‘Resilience Potential Index’’ when evaluating system risks.The intention is to create a series of interrelated measures that canhelp predict transportation system resilience that complementsprospective performance measures proposed by Lee (2010). Thispaper focuses on transportation systems for the movement ofpeople. Transportation systems for the movement of goods haveimportant divergent qualities, not least the lack of a role forindividual risk perception, which as we have shown plays animportant role in resilience. However, we suggest that the points
Resilience
DynamicStatic
F (Network Topology,
Threat)
System Wealth
(Redundancy)
Economic
Vitality Index
Social Vulnerability
Index
System Vulnerability
(Robustness)Flexibility
(Responsiveness)
F (Risk Perception,
Threat) Index
Dependence on Single Resource Evaluation
Tactical Vulnerability Assessment
Innovation
Capacity
Self-Organizing
Capacity
System Wisdom
(Preparedness)
Macro Meso Micro
Inventories Levels
Excess Capacity
Substitution Capability Evaluation
Management
Effectiveness
Evaluation
Tactical Communications
Evaluation
Regional Communications
Evaluation
Shared Experiences, Values/Expectations
Index
Business Continuity
Plans Evaluation
Impediments to Change
Evaluation
Organizational Incentives to
Innovate Evaluation
Key
(Regulations, etc.)
Fig. 4. Predictive measure taxonomy.
A. Cox et al. / Transport Policy 18 (2011) 307–317 313

raised in this section have application for both types of transporta-tion system.
Holling (2001) has noted that the ability of a system to adapt isrelated to three overarching concepts, which we apply to trans-portation resilience as follows:
1. Vulnerability to unpredictable shocks.2. The resources available to a system to help it change—or
‘‘wealth’’.3. The ‘‘internal controllability’’ of relationships in a system—-
rigidity vs. flexibility.
6.1. Vulnerability
A transportation system was defined above as ‘‘the assemblageof components associated with a specific means of transport’’(Tolley and Turton, 1995; p. 42). Further, the transportation systemserves to support a series of supply chains that deliver goods andservices. Christopher has defined supply chains as ‘‘the network oforganizations that are involved through upstream and downstreamlinkages, in the different processes and activities that produce valuein the form of products and services in the hands of the ultimateconsumer’’ (Christopher, 1998). The key is viewing the transporta-tion system as a network of connections, stocks, and flows. As such,we propose that one of the predictive measures of a transportationsystem’s resilience is a function of network topology and threat.Albert et al. (2000) found that network topology can significantlyaffect a system’s ability to withstand shocks. For randomlyoccurring shocks (e.g. natural disasters, industrial accidents, etc.)‘‘scale-free’’ networks—those with a few highly connected nodeshad higher error tolerance than networks with a more uniformdensity of nodal connections. Albert et al. (2000) found that theodds of a critical node being taken out in a scale-free network weresmall enough that random errors were unlikely to disrupt thenetwork’s functioning compared to more uniformly connectednetworks. On the other hand, targeted attacks, such as those aterrorist might employ, scale-free networks were highly vulnerablesince taking out just a few main nodes caused the functioning of thenetwork to decline rapidly. The topology of the system networkwould provide an indication of the degree of static resiliencedepending on the threat to the system.
Risk perception is an important factor in influencing a system’svulnerability. Jenkin (2006), Flynn (2008), and others have identi-fied how significantly public risk perceptions influence responsesto a system shock. The drop in airline passengers after 9/11 showsthat having a risk-perception index could be highly valuable indetermining the resilience of a system. We propose that a riskperception index is a crucial predictive measure for resilience. Ameasurement process for this is also provided above in the Londonbombings case study.
6.2. Wealth (value of resources)
Simply analyzing the topology of the network and the relevantthreat is not enough. People adjust and, this is yet another aspect ofboth static and dynamic resilience. Holling (1973) states that theinherent ability of a system to adjust internal relationships inresponse to outside shocks can have a large impact on resilience aswell. Spencer (1885: p. 374) defined evolution as ‘‘the adjustmentof internal relations to external relations’’. For a system to survive apossible extinction event, it must be able to adapt. We propose thatan economic vitality index be developed as a predictive measure forresilience.
The ‘‘wealth’’ of a system allows it to marshal resources tomaintain its integrity. Without resources, adaptation and recoveryare difficult. For example, Lee and Hau (2004) pointed to the ‘‘perilsof efficiency’’ in supply chains that had become too lean and tooefficient to be able to respond to sudden shocks in their market.Wealth is obviously correlated to general economic vitality as well.In a study comparing the Loma Prieta Earthquake and HurricaneAndrew, the most salient factor that affected individual businessrecovery was the general business climate (Dahlhammer et al.,1999). Boruff et al. (2003) went further and developed a ‘‘socialvulnerability’’ index defined as ‘‘a measure of societal resistance orresilience to hazards.’’ Their index included a variety of socio-economic factors including per capita income, population density,race, gender, and dependence on a single-sector of the economy.They argue that cultural factors that may influence access to powerand resources are interdependent with wealth and can significantlyaffect a community system’s resilience. This highlights anotherlevel of resilience in which transportation systems play animportant role.
6.3. Flexibility
The flexibility of a system allows it to respond to a shock and adjustits internal mechanisms to thrive under duress. Flexibility is sig-nificantly related to accumulated wisdom, constraints on change (e.g.,maladaptive regulations), innovative capacity (Holling, 2001), abilityto communicate critical information (TDM Encyclopedia, 2008), andthe ability to rapidly coordinate system-wide action.
One example of rapid system-wide coordination occurredshortly after the 2005 London Underground bombings when theBritish government coordinated across agencies and industry tomake a decision to keep airports open. The rapid coordinationhelped to achieve a consensus to avoid a total system shutdown(Segell, 2005). Another example of rapid coordination for system-wide action was the self-organized response of Toyota Group’ssupplier network to respond to the disruption of a key partssupplier. It has been argued that a traditional group problem-solving and communication amongst the various suppliers enabledthem to develop a quick response (Nishiguchi and Beaudet, 1998).The relationships between the supplies were non-hierarchical,which enabled rapid communication (Tierney and Trainor, 2004).However, this net-centric system was bolstered by a shared senseof business culture, expectations, and trust that allowed an agileand precise effort that kept the production lines running (Arquillaand Ronfeldt, 2001).
6.4. Predictive measure taxonomy
The taxonomy shown in Fig. 4 suggests a series of measurableindices, assessments, and evaluations which, taken together, willprovide decision-makers significantly more insight about a targetsystem’s resilience capability. The taxonomy is not meant to beexhaustive or detailed since each system will have its own uniquecharacteristics. However, it is believed that this broadly defined setof measures will provide a much more comprehensive set ofpredictors about a system’s resilience. Such predictions willnecessarily rely on data of past events, following operationalmetrics such as those suggested above. The limits of this approachare highlighted in our discussion of ‘‘Black Swan’’ events.
The authors suggest that these measures should be the focus ofresearch efforts going forward to provide policy makers the abilityto focus resources on those areas with the most risk and leastresilience (DHS, 2006; TISP, 2006). With a set of prospectivemeasures, decision makers will have greater confidence thatthey are allocating their resources in risk-based manner.
A. Cox et al. / Transport Policy 18 (2011) 307–317314

7. Conclusions and further research
Transportation systems are attractive targets to terroristsbecause their networked character makes them highly vulnerableand because their fundamental position in the economy can resultin widespread losses. This paper presents an operational metric oftransportation system resilience. This approach is based upon thecomprehensive economic resilience metric proposed by Rose(2007, 2009) but is modified for the unique aspects of transporta-tion systems. To illustrate the usefulness of this concept, we applythe most basic form of the transportation system resilience metricto a case study of the London July 2005 subway and bus bombings.Resilience is measured in terms of transportation mode shiftsapplied to passenger-journeys. We find transportation systemresilience in this case to be relatively high, about 77.4 percent.Hence, the majority of reductions in attacked mode passenger-journeys were offset by increases in alternative transport modes.
Our study of transportation resilience is only a beginningbecause passenger journeys are not an end in themselves. Theyare important in terms of their contribution to economic produc-tion and personal well-being. That is, a reduction in commuterjourneys from a terrorist attack results in economic losses to therest of society. Therefore, a useful subsequent study would involvethe explicit estimation of the role of transportation as a direct andindirect input to the economy and an evaluation of resilience in thisbroader context. This would ideally enable a dollar figure to beplaced on transportation system resilience, so that the cost ofimplementing it can be compared with other loss reductionstrategies in a risk management framework.
Acknowledgments
This research was supported by U.S. Department of HomelandSecurity through the Center for Risk and Economic Analysis ofTerrorism Events (CREATE) and the National Science Foundationunder grant numbers SES-0728934. Any opinions, findings andconclusions or recommendations in this document are those of theauthors and do not necessarily reflect views of these organizations.The authors acknowledge the funding support of the U.S. Depart-ment of Homeland Security Office of University Programs Inte-grated Network of Center Grant Program. We would like to thankGenevieve Giuliano, Dominick Caridi, Tom Reilly, and especiallyRichard Kraske for their input and ideas in the process of devel-oping this paper. We would also like to thank the editor and twoanonymous referees for their helpful comments. The viewsexpressed herein are those of the authors and do not necessarilyreflect the views of any institutions with which they are affiliated.The authors are solely responsible for any errors and omissions.
Appendix A
London average kilometers per journey by mode, 2004/2005;estimated weekly passenger journey reductions; and aggregatetravel volumes in Greater London (estimated daily average numberof journey stages by mode, 2001–2007) are shown in Tables A1, A2and A3, respectively.
The car is the most used of all the modes in Greater London;however this proportion is lower for the Inner and Central Londonareas that were more affected by the attacks. As shown in Fig. A1and Table A4, we estimate an increase of 6.0 million passengerjourneys in the 4-month period (which translates to 5 4-weekperiods) following the attacks. We use the ARIMA (1,1,1) time-series analysis method described above (including the 13 periodseasonal element) to calculate the change in road traffic data
following the attacks. Road traffic data for 1998–2007 is sourcedfrom Transport for London, which counts the number of vehiclespassing particular checkpoints. Cars are the majority share of theroad traffic passing checkpoints (at least 85 percent) and this data isused for percentage purposes only. Unfortunately many check
Table A1London average kilometers per journey by mode, 2004/2005.
Transport
mode (year)
Passenger kilometers
(millions)
Journeys
(millions)
Average kilometers
per journey
Underground 7605a 976a 7.8
Bus 6755a 1793a 3.8
Dlr 243a 50a 4.9
Rail 7787c 620b 12.6
Tram 113a 22a 5.1
Cars and taxis 78,618c 4015b 19.6d
Motorcycles 1429c 73b 19.6d
Pedal cycles 653c 146b 4.5
Walk 4836c 2044b 2.4
a TfL (2005, pp. 17–24)b TfL (2005, p. 3)c ONS (2001), data adjusted to reflect London population and annual rate of
change between 2000 and 2004 using TfL (2005) data.d These figures are the same due to data limitations of extrapolation.
Table A2Estimated weekly passenger journey reductions.
Source: Prager et al. (2010)
Week commencing Mean estimate Upper bound Lower bound
July 7, 2005 2,100,065 1,663,982 2,536,147
July 14, 2005 2,759,914 2,323,620 3,196,209
July 21, 2005 2,647,242 2,203,473 3,091,011
July 28, 2005 3,673,246 3,204,784 4,141,708
August 4, 2005 2,717,276 2,326,749 3,107,803
August 11, 2005 1,952,764 1,585,964 2,319,563
August 18, 2005 1,495,053 1,092,524 1,897,582
August 25, 2005 1,145,091 728,913 1,561,269
September 1, 2005 1,660,436 1,293,230 2,027,643
September 8, 2005 1,578,797 1,224,218 1,933,376
September 15, 2005 644,243 286,423 1,002,062
September 22, 2005 �31,447 �408,335 345,442
September 29, 2005 �739,982 �1,129,968 �349,997
October 6, 2005 17,452 �346,404 381,308
October 13, 2005 �112,156 �515,210 290,899
October 20, 2005 189,826 �159,310 538,961
October 27, 2005 �248,041 �600,314 104,232
November 3, 2005 120,523 �221,811 462,857
November 10, 2005 609,716 307,140 912,292
November 17, 2005 313,421 18,869 607,974
November 24, 2005 204,917 �95,608 505,441
December 1, 2005 �142,834 �509,659 223,991
December 8, 2005 �1,385,006 �1,884,094 �885,919
December 15, 2005 �1,170,739 �1,687,145 �654,332
Total passenger journeys
until 2 November
21,449,778 14,774,338 28,125,218
Table A3Aggregate travel volumes in Greater London. Estimated daily average number of
journey stages by mode, 2001–2007.
Year Rail Lu Dlr Bus Taxi Car Motorcycle Cycle Walk All modes
2001 1.8 2.6 0.1 3.9 0.2 10.9 0.2 0.3 5.5 25.6
2002 1.9 2.6 0.1 4.2 0.2 10.6 0.2 0.3 5.5 25.7
2003 1.9 2.6 0.1 4.6 0.2 10.3 0.2 0.3 5.5 25.9
2004 2 2.7 0.1 5 0.3 10.1 0.2 0.4 5.6 26.3
2005 2 2.6 0.1 5 0.3 10.3 0.2 0.4 5.6 26.7
2006 2.1 2.7 0.2 5.2 0.3 10.3 0.2 0.5 5.7 27.1
2007 2.3 2.9 0.2 5.4 0.3 10.3 0.2 0.5 5.7 27.8
A. Cox et al. / Transport Policy 18 (2011) 307–317 315

points have substantial numbers of missing values during thisperiod due to road repairs, broken sensors, etc. As such, weeliminated data from numerous checkpoints so that the totalproportion of missing values was less than 10 percent. Thispercentage change for each period is then multiplied by averagecar passenger journey data from Table A3.
Bicycles represent a minor yet rapidly growing share on Londontransportation. As shown in Fig. A2 and Table A5, we estimate that
pedal cycle use increased by around 15 percent for the weeksfollowing the attacks, again using an ARIMA (2,0,1) time-seriesprediction model with a 13 period season element. We acquireddata for the sample from Transport for London’s road trafficcheckpoint monitors. If we assume this reflects broader cycleuse in the form of resilience, we find there was a total increaseof around 5.1 million cyclists weekly during the 4-month period(this calculation accounts for fewer cyclists on weekends) follow-ing the attacks.
Average London resident weekday trips, for years 2005–2008 ispresented in Table A6.
Unfortunately, data on motorcycle use are limited to annualestimations. It is possible to extrapolate finer data from the roadtraffic observations above, though this provides evidence of limiteduse. As shown in Table A7, year on year motorcycle use increased4.5 percent in 2005. From this we may extrapolate that an
Fig. A2. London cycle numbers, observed and predicted.
Table A4London road traffic sample check point, total journeys estimation, 2005.
Four-week
period
Average road
traffic sample
Sample difference
between observed
and predicted
Total
extrapolated
journeys
difference
(‘000s)
Observed Predicted Number %
1 14,862 14,903
2 14,820 15,066
3 14,913 14,950
4 14,912 15,060 �149 �1.00 �2822
5 14,879 14,858 21 0.14 392
6 15,011 14,874 137 0.91 2587
7 15,233 14,994 239 1.57 4439
8 15,035 14,958 77 0.51 1451
9 15,225 14,945 280 1.84 5203
10 14,353 14,134 218 1.52 4302
11 14,993 14,730 262 1.75 4951
12 15,034 14,717 317 2.11 5960
13 15,444 14,679 766 4.96 14,021
Total 5 period post-attack change 6047
Table A5London cycle data, 2005–2006.
Four-week period
commencing
Sample (‘000s) Estimated
total change
in cycle use
(‘000s)
Observed Predicted Difference
between
predicted and
observed
April 4, 2005 151 143 5.8 454
May 2, 2005 171 166 3.3 223
May 30, 2005 183 179 2.0 125
June 27, 2005 207 180 15.1 940
July 25, 2005 201 177 13.4 848
August 22, 2005 200 169 18.5 1226
September 19, 2005 191 164 16.3 1113
October 17, 2005 182 159 14.8 1043
November 14, 2005 165 153 8.0 586
December 12, 2005 125 119 4.9 461
January 9, 2006 160 146 9.7 744
February 6, 2006 148 141 4.7 373
March 6, 2006 149 151 �1.2 �89
Total 5 period post attack change: 5170
Table A6Average London resident weekday trips, for years 2005–2008.
Cycle share
of all
modes (%)
All mode
trips
Cycle trips
(‘000s)
Share of all
cycle trips
(%)
Central London 3.1 1.9 60 18.3
Inner London 2.3 6.1 140 42.7
Outer London 1.2 10.7 128 39.0
Table A7Yearly London traffic volume (in million vehicle kilometers) and interannual
variations (as %).
Source: Department of Transportation, Fasolo et al. (2009).
2002 2003 2004 2005 2006
Pedal cycles 502 542 523 585 630
7.97% �3.51% 11.85% 7.69%
Two-wheeled
motor vehicles
762 864 809 845 823
13.39% �6.37% 4.45% �2.60%
Car and taxi 26,795 26,376 26,269 26,136 26,398
�1.56% �0.41% �0.51% 1.00%
13,000
13,500
14,000
14,500
15,000
15,500
16,000
1 5 9 13 17 21 25 29 33 37 41 49
4-week period
Observed dataPredictedPeriod of Attack
45
Fig. A1. London road traffic sample checkpoint data, 2003–2006.
A. Cox et al. / Transport Policy 18 (2011) 307–317316

additional 3.3 million journeys were taken by motorbike in 2005over 2004; assuming all of these journeys resulted from individualsswitching away from the London Underground this accounts forsome 6.6 percent of the total reduction.
Walking figures are identified through an annual survey, aspresented in Table A3, where no increase in average daily journeysis observed. However, given that the annual figures do not revealchanges in other transport modes identified above, we assume anincrease in walking of similar proportions to other modes. Weestimate a 2.5 percent increase in walking as a result of individualsswitching away from the attacked modes, equivalent to an increasein 16.8 million journeys for that mode. Due to lack of better data,this is based on the assumption that the change would be less thancycling (around 15 percent) and motorcycling (6.6 percent); unlikethese modes, walking is not a sufficient substitute for most LondonUnderground or bus journeys due to their length. The estimation isgreater than the change for the car (0.4 percent) as the costs for carvehicle use far outweigh that of walking. This estimation requiresfurther analysis and due to the large proportion of walking, a smallchange could significantly impact headline calculations. A sensi-tivity analysis of this assumption highlights that walking can play asignificant role in the transportation resilience, especially for arelatively compact city such as London, where walking is already apopular mode choice. An increase in walking of 3.825 percentwould result in a 100 percent resiliency, in terms of our abovemetric. At the other extreme, a 0.4 percent increase in walkingwould result in 41 percent resiliency.
References
Albert, R., Jeong, W., Barabasi, A.-L., 2000. Error and attack tolerance of complexnetworks. Nature 406, 378–382.
Arquilla, J., Ronfeldt, D., 2001. Networks and Netwars; Chapter One: The Advent ofNetwar. Rand Corporation, Santa Monica, CA.
Black, W.J., 2003. Transportation: A Geographical Analysis. The Guildford Press, NewYork.
Bruneau, M., Chang, S., Eguchi, R., Lee, G., O’Rourke, T., Reinhorn, A., Shinozuka, M.,Tierney, K., Wallace, W., von Winterfeldt, D., 2003. A framework to quantita-tively assess and enhance seismic resilience of communities. EarthquakeSpectra 19, 733–752.
Cascetta, E., 2001. Transportation Systems Engineering: Theory and Methods.Springer, Kluwer Academic Publishers, Norwell, MA.
Chang, S.E., & Shinozuka, M., 2004. Measuring improvements in the disasterresilience of communities. Earthquake Spectra, 20, 739–755.
Christopher, M., 1998. Logistics and Supply Chain Management: Strategies forReducing Costs and Improving Service. Financial Times Prentice-Hall.
Dahlhammer, James, Tierney, Kathleen, Webb, Gary, 1999. Predicting Long-TermBusiness Recovery From Disaster: A Comparison of the Loma Prieta Earthquakeand Hurricane Andrew. Preliminary Paper #292.
Department of Homeland Security (DHS), 2006. National Infrastructure ProtectionProgram /http://www.dhs.gov/xprevprot/programs/editorial_0827.shtm#0S.
Ekern, D., Crossett, J., 2010. Roles and implications of transportation systems inhomeland security. In: Voeller, J.G. (Ed.), Handbook of Science and Technologyfor Homeland Security. Wiley, Hoboken, New Jersey.
Flynn, Steven. America the Resilient: Defying Terrorism and Mitigating NaturalDisasters. Foreign Affairs, March/April 2008.
Gigerenzer, G., 2004. Dread risk, September 11, and fatal traffic accidents.Psychological Science, 15, 286–287.
Gigerenzer, G., 2006. Out of the frying pan into the fire: Behavioral reactions toterrorist attacks. Risk Analysis, 26, 347–351.
Gordon, P., Kim, S., Moore, J.E., Park, J., & Richardson, H.W., 2007. The economicimpacts of a terrorist attack on the U.S. commercial aviation system. RiskAnalysis, 27, 505–512.
Grabo, Cynthia, 2004. Anticipating Surprise: Analysis for Strategic Warning.University Press of America.
Holling, C., 1973. Resilience and stability of ecological systems. Annual Review ofEcology and Systematics 4, 1–23.
Holling, C., 2001. Understanding the complexity of economic, ecological, and socialsystems. Ecosystems 4, 390–405.
Jenkin, C., 2006. Risk perception and terrorism: applying the psychometric para-digm. Homeland Security Affairs II (2).
Kahneman, Daniel, Slovic, Paul, Tversky, Amos, 1982. Judgment under Uncertainty:Heuristics and Biases. Cambridge University Press.
Lee, Hau, 2004. The Triple—A Supply Chain. Harvard Business Review. October2004.
Lee, R., 2010. Transportation security performance measures. In: Voeller, J.G. (Ed.),Handbook of Science and Technology for Homeland Security. Wiley, Hoboken,New Jersey.
Lopez-Rousseau, A., 2005. Avoiding the death risk of avoiding a dread risk: Theaftermath of March 11 in Spain. Psychological Science, 16, 426–428.
Meyer, M.D., 2010. Transportation system as a security challenge. In: Voeller, J.G.(Ed.), Handbook of Science and Technology for Homeland Security. Wiley,Hoboken, New Jersey.
Nishiguchi, Toshihiro, Beaudet, Alexandre, 1998. The Toyota Group and Aisin Fire.MIT Sloan Management Review 40 (1).
Posner, Richard, 2004. Catastrophe: Risk and Response. Oxford University Press,New York.
Prager, F., Beeler Asay, G., von Winterfeldt, D., Lee, B. Exploring reductions in LondonUnderground passenger journeys following the July 2005 bombings. RiskAnalysis, forthcoming.
Reggiani, A., De Graaff, T., Nijkamp, P., 2002. Resilience: an evolutionary approach tospatial economic systems. Networks and Spatial Economics 2, 211–229.
Rose, A., 2004. Defining and measuring economic resilience to disasters. DisasterPrevention and Management 13, 307–314.
Rose, A., 2005. Analyzing terrorist threats to the economy: a computable generalequilibrium approach. In: Richardson, H., Gordon, P., Moore, J. (Eds.), EconomicImpacts of Terrorist Attacks. Edward Elgar, Cheltenham, UK.
Rose, A., 2007. Economic resilience to natural and man-made disasters: multi-disciplinary origins and contextual dimensions. Environmental Hazards 7 (4),383–395.
Rose, A., 2009. Economic Resilience to Disasters. Community and Regional Resi-lience Institute Report No. 8.
Rose, A., Oladosu, G., Lee, B., Beeler-Asay, G., 2009. The Economic Impacts of the 2001Terrorist Attacks on the World Trade Center: A Computable General EquilibriumAnalysis, Peace Economics, Peace Science, and Public Policy, 16(2), Article 6.
Segell, Glen, 2005. Terrorism: London Public Transport—July 7, 2005. StrategicInsights IV (8).
Shinozuka, M., & Chang, S., 2004. Evaluating the disaster resilience of powernetworks and grids. Modeling Spatial Economic Impacts of Disasters, Heidel-berg: Springer.
Slovic, Paul, 2007. Risk Perception. Earthscan.Spencer, H., 1855 The Principles of Psychology. London: Longman, Brown, Green,
and Longmans.The Infrastructure Security Partnership (TISP), 2006. Regional Disaster Resilience:
A Guide for Developing an Action Plan. American Society of Civil Engineers/http://www.tisp.org/rdr_guideS.
TDM Encyclopedia, 2008. Evaluating Transportation Resilience: Evaluating theTransportation System’s Ability to Accommodate Diverse, Variable, and Unex-pected Demands with Minimal Risk. Victoria Transport Policy Institute.
Tierney, K., 1997. Impacts of recent disasters on businesses: the 1993 Midwestfloods and the 1994 Northridge earthquake. In: Jones, B. (Ed.), EconomicConsequences of Earthquakes: Preparing for the Unexpected. National Centerfor Earthquake Engineering Research, Buffalo, NY.
Tierney, K., Trainor, J., 2004. Networks and Resilience in the World Trade CenterDisaster. Multidisciplinary Center for Earthquake Engineering Research (MCEER)/http://mceer.buffalo.edu/research/resilience/resilience_archive.aspS.
Tolley, R.S., Turton, B.J., 1995. Transport Systems, Policy and Planning: A Geogra-phical Approach. Longman Scientific & Technical, London.
Transport for London, 2009. Travel in London /http://www.tfl.gov.uk/assets/downloads/corporate/Travel-in-London-report-1.pdfS.
A. Cox et al. / Transport Policy 18 (2011) 307–317 317