
Transportation Research Forum - Oregon Digital
18
Intercept Surveys: Productivity in Collecting Truck Trip Data, A Case Study of Portland, Oregon Author(s): Eric Jessup, Ken Casavant, Catherine Lawson, and Alan Kirk Source: Journal of the Transportation Research Forum, Vol. 45, No. 2 (Summer 2006), pp. 69-85 Published by: Transportation Research Forum Stable URL: http://www.trforum.org/journal The Transportation Research Forum, founded in 1958, is an independent, nonprofit organization of transportation professionals who conduct, use, and benefit from research. Its purpose is to provide an impartial meeting ground for carriers, shippers, government officials, consultants, university researchers, suppliers, and others seeking exchange of information and ideas related to both passenger and freight transportation. More information on the Transportation Research Forum can be found on the Web at www.trforum.org. Transportation Research Forum
Transcript of Transportation Research Forum - Oregon Digital

Intercept Surveys: Productivity in Collecting Truck Trip Data, A Case Study of Portland, Oregon Author(s): Eric Jessup, Ken Casavant, Catherine Lawson, and Alan Kirk Source: Journal of the Transportation Research Forum, Vol. 45, No. 2 (Summer 2006), pp. 69-85 Published by: Transportation Research Forum
Stable URL: http://www.trforum.org/journal
The Transportation Research Forum, founded in 1958, is an independent, nonprofit organization of transportation professionals who conduct, use, and benefit from research. Its purpose is to provide an impartial meeting ground for carriers, shippers, government officials, consultants, university researchers, suppliers, and others seeking exchange of information and ideas related to both passenger and freight transportation. More information on the Transportation Research Forum can be found on the Web at www.trforum.org.
Transportation Research Forum

Intercept Surveys
��
by Eric Jessup, Ken Casavant, Catherine Lawson, and Alan Kirk
This study examines and contrasts the use of intercept surveys at different locations (a highway roadside, a port and a warehouse) to generate details useful to states’ modeling and freight planning needs for truck movements, particularly at the sub-county level. Data collected at roadside locations provides complete trip detail for all inter-regional movements (highway locations) and also trip detail for almost all intra-regional freight movements (warehouse/distribution center locations). Interviews at the warehouse/distribution center and interstate highway weigh station provide the highest commodity type response rates, while the preponderance of container traffic at the port facility yields limited responses on payload information. Different locations yielded differing question response rates.
INTRODUCTION
In recent years, there has been an increasing need for data on specific freight movements as highway congestion and capacity concerns have a greater impact on freight transportation efficiency—and ultimately regional economic health and prosperity. Earlier research efforts have focused on capturing information and data to aid in the design and development of transportation models for passenger automobiles. Research and analysis for freight truck movements were often performed with passenger car models—relating the freight truck activity to variables commonly used for generating passenger car trips, such as square feet of office space and number of employees. As modeling efforts have become more specialized for truck characteristics, the data needs for freight modeling and policy planning have become more specific. Indeed, the recently enacted Safe, Accountable, Flexible, Efficient Transportation Equity Act: A Legacy for Users (SAFETEA-LU) legislation specifically calls for metropolitan planning organizations (MPOs) to include freight planning in their scope of work (SAFETEA-LU 2005).
The limited number of recent studies that focus on the collection of freight data and information are primarily directed at regional or statewide truck movements (Casavant and Jessup 2002). Even fewer studies have concentrated on data collection methodologies for intra-city freight movements that may be implemented within urban centers while also providing the necessary level of data detail for successful policy planning and modeling.
Some combination of each data collection methodology may be applicable when obtaining accurate and complete truck information over large geographical urban areas and freight movement types. Using secondary data sources, such as the Commodity Flow Survey, Vehicle Inventory and Use Survey, or Highway Performance Monitoring System, also can be very beneficial for both designing data collection approaches and narrowing the scope of data collection methodologies.
The overall goal of this study is to identify a reliable data collection method capable of generating sufficiently detailed data useful to the Oregon Department of Transportation’s (ODOT) modeling and freight planning needs for data on truck movements at the metropolitan level. State and national planning agencies and researchers would us the method to measure truck movements. The surveying process is more complex than traditional auto-oriented intercept surveys due to the nature of the detailed data elements (commodity type, total weight, payload, and land use at origin and destination). The process requires knowledge of truck activities and cooperation from business
Intercept Surveys: Productivity in Collecting Truck Trip Data, A Case Study of Portland, Oregon

Intercept Surveys
�0
entities (drivers and firms) that participate in the study. Also, drivers’ knowledge of individual data elements in the freight surveys varies from location to location, adding to the complexity of the surveying process.
A Case Study: Portland, Oregon
Freight movement is a significant transportation issue throughout Oregon and the United States. Much of what ODOT knows about truck movements within the state, particularly in urban/metropolitan areas, comes from observational data via traffic counts. While traffic count information is important, it is inadequate for understanding truck freight movements in sufficient detail for economic analysis, transportation modeling and freight planning. In addition, many states have limited information on truck trips, their origins and destinations, routes traveled and commodities carried.
The need for accurate and detailed freight movement data for modeling and freight planning is not new. State departments of transportation have routinely relied on traffic counts to gather information for modeling and planning. Recent changes in supply-chain distribution systems, such as Just-In-Time or Off-The-Shelf and the growth of significant intracity movements, create an intensified need for data that reflect actual modal movements—rather than portraying the trips as simple origin-destination pairs.
Portland’s distribution is characterized by traffic generation sources that vary by location, time and intensity. The growth in container traffic due to import and export traffic through the Port of Portland, combined with increasing numbers of local distribution/warehouse centers, changing local distribution needs and increasing passenger car volumes, have increased the need for modeling efforts and planning processes. Portland serves both long and short distance movement business and passenger needs; its information needs are evident.
LITERATURE REVIEW
Although a considerable body of research addresses the data needs for passenger transportation models and statewide freight truck movements, historically few studies have focused on methods for collecting the necessary data on urban freight movements. The need to pay attention specifically to truck activities can be traced back to as early as 1970 (Hedges 1971). Transportation researchers and specialists discussed and defined problems and issues related to the movement of urban goods, different types of data collection possibilities, and evaluation of different technological, economic and institutional changes that could affect freight movements in urban areas.
Attention was again focused on freight when the Intermodal Surface Transportation Efficiency Act was passed in 1991. It provided renewed interest in freight transportation research and planning, as DOTs and individual metropolitan planning organizations (MPOs) were required to incorporate freight planning and analysis into transportation plans. However, no standard methodology or “cookbook” was available for implementing truck trip data gathering or modeling, especially as it applied to intracity movements, resulting in a wide variety of study approaches (SAFETEA-LU 2005).
During the past decade studies at both the state and metropolitan levels have been conducted, although they have usually applied to regional and statewide truck movements (Casavant and Jessup 2002). In an attempt to evaluate various survey method approaches, Samuel W. Lau produced the first syntheses of field applications (Lau 1995) for the Metropolitan Transportation Commission. He found that a variety of surveying methods were being used, with roadside intercept surveys of intercity movements for corridor analysis and policy planning. For example, the Ontario Ministry of Transportation conducted a series of studies to develop truck travel and commodity flow information between cities over time (Gorys 1991).
Another synthesis study provided particular information on methods (e.g., vehicle classification counts, roadside interviews, telephone mailout, mailback surveys, and travel diary surveys) and data
Intercept Surveys
��
findings (e.g., advantages and disadvantages of each approach including response rates, costs, and reliability) (Fischer et al. 2002). Lawson (2003) examined the need to match survey methodologies with the type of questions being asked of the freight community. For a full discussion of these and other relevant studies, see Jessup et al. (2004).
Roadside Interview Attributes
As documented in the literature, and in the experience of the authors, there appear to be many advantages to collecting truck and freight shipment information via roadside interviews, especially in regard to sampling control, complete data collection and broad geographic coverage. The statistical reliability for this approach is quite high, given that the total traffic population from which the sampling frame is collected is generally known for the time periods collected. The composition and enumeration of traffic population at each location site is available through observation or use of automated counting and classification equipment. Roadside interviews allow for interaction between survey personnel and respondents to clarify specific questions and misunderstandings.
Roadside interviews can provide excellent data and trip information for shipments in and out of urban centers if interview sites are strategically located near primary entry and exit corridors around urban centers. There are, however, some limitations to consider when implementing roadside interviews. For example, limited parking availability and traffic congestion make implementing roadside interviews within concentrated urban areas somewhat difficult. In addition, roadside interviews require a large number of interviewers, they could disrupt traffic in high volume corridors, and they are limited to designated survey locations. Survey personnel may also be exposed to safety risks and adverse weather while implementing and completing interviews (see Table 1 for a summary of advantages and disadvantages).
Overall Approach and expectations of the Study
The data for these analyses were collected by the authors as part of a study for the Oregon Department of Transportation (Jessup et al. 2004). This research focuses, in large part, on the use of intercept surveys in data generation. No previous studies gave adequate direction on any specific differences needed to successfully gather the various data elements for different locations in an urban area. This research effort uses a three-pronged approach in the design of a pilot study to understand freight movements in an urban setting from three distinct and differing location types: truck traffic on the interstate highway system, freight entering a port, and freight moving from warehouse locations inside the urban area. The objectives of the pilot test for the intercept survey instruments and deployment methodologies are listed below:
• Collect truck travel data (origin and destinations, routes traveled, record of stops, commodity type and quantity, and vehicle classification) to define the data collection advantages and disadvantages of each of the three types of locations.
• Select one or more data collection sites for field testing. Field test the effectiveness of the method in pilot study areas.
• Analyze field test results, identifying constraints, data detail, and reliability achieved using the tested methodology at the different locations.
Truck traffic and flows in an area can be categorized as external-to-internal, internal-to-external, and internal-to-internal. For planning purposes, another flow, called external-to external, captures the in-transit truck traffic flow that does not stop within the region. This data collection strategy breaks the flows into inter-regional movements (external-to-internal, internal-to-external and external-to-external) and the intra-regional movement (internal-to-internal). The former movement relates to flows into and out of an area (e.g., a particular city or urban region), while the latter is designed to capture the high value but seldom identified reloading, distribution, and assembly activities within the city/region.

Intercept Surveys
��
Table 1: Comparison of Roadside Interview Advantages and DisadvantagesAdvantages Disadvantages
Implementation Relatively easy to implement.2 to 6 minute interview.
Relatively high labor requirement, especially for large geographic areas.Potential disruption of traffic.Significant risk to survey personnel.
Investment and Maintenance
If managed properly, investment costs are relatively low.
Must be replicated periodically to maintain current relevance.Higher personnel requirement than phone and mail surveys.
Statistical Reliability / Sampling Frame
Best statistical control since sample is from known traffic population, over a known time period.Highest response rate.
Limited locations where survey may be implemented may bias sampling.
Data Attributes
Excellent ability to obtain all desired data and information, given one-on-one contact with driver.Complete information on O-D, route, trip purpose, commodity, etc.
None.
Geographic Coverage
Provides coverage of truck activity other than at survey locations, but truck must first pass through survey site.Includes vehicles passing through from outside geographical area.
Only captures truck traffic that passes through interview sites.
Surveys were administered at Portland sites that are major generators of movement, including ports, rail loading facilities, and known distribution centers. These locations were expected to provide detail regarding the activities at the generation sites. The movements would also be examined on major highways and known traffic sites, both into and out of the region of interest.
MeTHODS
Roadside Survey Interview Structure
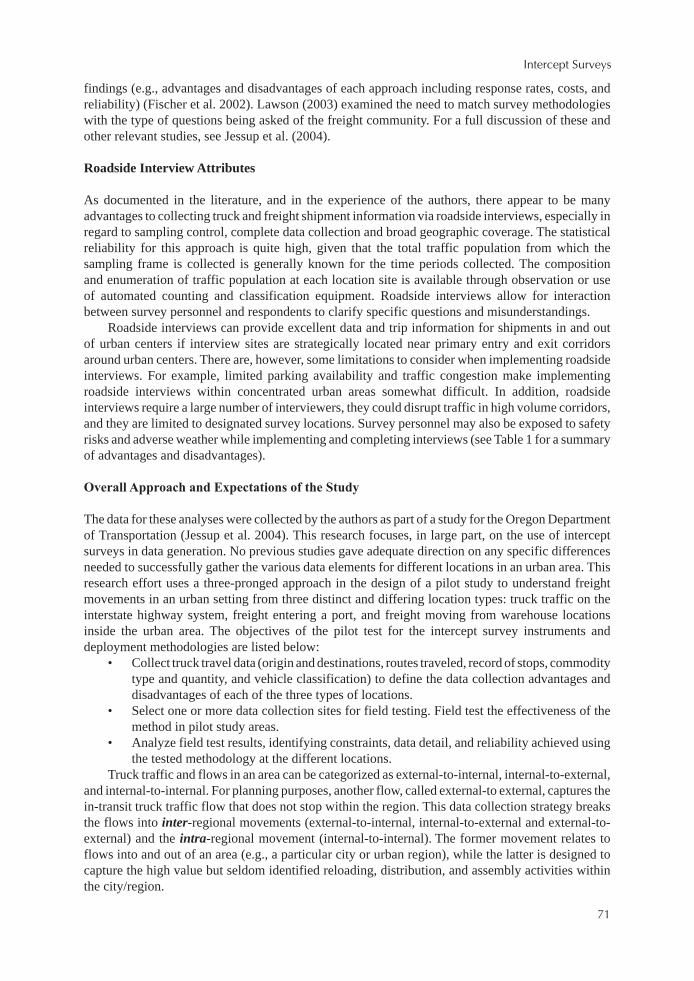
Three separate interviews were conducted at different locations and facility types in the Portland metropolitan area—an interstate highway weigh station, a port location, and a warehouse/distribution facility. In part, specific sites were selected for the pilot study because they were expected to be the most difficult locations to administer surveys due to vehicle volume at each site. Thus, the selected locations included a weigh station on a high-volume interstate (I-84 at Cascade Locks), the container Terminal #6 at the Port of Portland, and a private warehouse/distribution center located among many other distribution centers north of downtown Portland and west of I-5. These locations
Intercept Surveys
��
are provided in Figure 1, which also depicts the primary highway infrastructure supporting the Portland metropolitan region. The two interstate highways are dominant corridors for east-west (I-84) and north-south (I-5) shipments. The Port of Portland and the private warehouse/distribution center are located in the industrial/warehouse section of Portland.
Figure 1: Portland, Oregon, Metropolitan Study Area
Trained service club members (Lions Club) from the Vancouver, Washington, area conducted the interviews. The service club members had experience conducting similar roadside interviews in Washington State with the Strategic Freight Transportation Analysis (SFTA) project and were quite knowledgeable (Casavant and Jessup 2002). In addition, all interview personnel received thorough training and an explanation of the questions on the survey, site set-up, safety, and use of survey equipment prior to conducting roadside interviews.
Each interview was designed to be completed in about two minutes, and respondents were asked questions concerning carrier name, carrier address, vehicle and trailer configuration, number of axles, origin address of shipment, destination address of shipment, commodity, detailed trip route, address of LTL pickups and deliveries, time of day the trip occurred, and hazardous material placard code.
Interstate Highway Weigh Station
Cascade Locks weigh-station at milepost 44.93 on eastbound I-84 was selected for the pilot study. Consultation with officials at the ODOT Motor Carrier Transportation Division indicated that this particular site hosts one of the heaviest traffic volumes for the Portland/Metro area and could thus present challenges in conducting a roadside survey. The traffic is especially heavy for eastbound

Intercept Surveys
��
traffic on Tuesdays, as freight operators have deliveries and freight drops within the Portland area on Mondays and are headed back east with new freight loads on Tuesdays. This roadside survey was conducted on June 17, 2003, during the regularly scheduled hours of operation (7 a.m. to 2 a.m., a total of 19 hours). Successful testing of the instrument and methodology at one of the heaviest traffic sites should ensure successful use of the methodology at similar, but less active, locations.
Teams of four to seven individuals conducted surveys throughout the 19-hour survey period. A quality/support manager from Washington State University trained and supervised the interview teams. The survey operation had the full support of the ODOT Motor Carrier Enforcement Office.
Port Facility
The roadside interview method was also tested at the Port of Portland’s Rivergate Industrial Park, Terminal 6. This site was chosen over other port facilities primarily due to its multi-modal characteristics and the large volume of container and automobile traffic passing through it relative to other port locations. This site also presented significant administrative and security issues for implementing on-site freight surveys, thus providing a better test of the data-collection process. Again, by testing the surveying methodology at an active site, it is presumed that using the same methodology at sites with less activity will have similar or better outcomes.
Surveys at this location were conducted on July 9, 2003, during the regular hours of operation at the Terminal 6 port facilities (8 a.m. to 5 p.m.). This day was selected because of the heavy volume of inbound and outbound container traffic occurring during steamship line unloadings. Between five and eight local service club (Lions) members conducted the surveys at the port facility.
The interview form for the port facility was modified slightly from the weigh station questionnaire to accommodate data collection on two separate freight movements (the ending of one trip and the beginning of another) for those freight operators who delivered a shipment to the port facility and immediately picked up another shipment for delivery. This situation was not relevant for weigh station interviews, since the information was captured during the trip segment and not at the intersection of potentially two trip segments.
Warehouse Distribution Center
The roadside interview method was also tested at a warehouse/distribution center owned by a local transport firm that volunteered to participate in the pilot study. Interviews were conducted at a primary warehouse/distribution center northwest of downtown Portland. This facility handles several inbound and outbound shipment types and represents the heaviest volume facility owned by the transportation firm. Special attention to firm willingness to participate is needed for these locations. Unlike intercepting trucks on a highway or at a port facility, business owners/or truck drivers leaving a place of business may be particularly sensitive to providing information.
These roadside interviews were conducted on July 16, 2003, over a 24-hour period beginning at 7 a.m. Between four and six service club members interviewed truck drivers as they delivered or picked up loads at the warehouse. As with the port facility, the interview form for the warehouse/distribution center was modified slightly from the weigh station questionnaire to accommodate data collection on two separate freight movements (the ending of one trip and the beginning of another) for those freight operators who delivered a shipment to the facility and immediately picked up another shipment.
Data
All completed roadside interview questionnaires were entered into a Microsoft Access relational database, and commodities were classified into Standard Transportation Commodity Classification (STCC) codes at the four-digit level. Assigning specific codes to certain commodities presented

Intercept Surveys
��
some difficulty because many of the STCC codes are quite similar, differing primarily with respect to degree of processing. Therefore, significant care was taken to maintain consistency in commodity code classification for all data.
RESULTS
Interstate Highway (I-84) Weigh Station Results
Of the 2,524 trucks that passed through this survey site during the study period, 262 (based on traffic flow and safety considerations) were interviewed as part of the pilot test sample (see Table 2). From the sample, 249 drivers completed the questionnaires for a questionnaire response rate of 95%. The purpose of the pilot test is to test the survey instrument and methodology for a larger, metropolitan-wide surveying effort. Thus, the overall capture rate (249 responses from a total of 2,524 trucks) of 9.8% is sufficient and can be expected to be substantially higher with a larger sample. This is supported by the fact that the truck drivers who were asked to complete surveys were very cooperative and willing to provide information so the roadside interview and questionnaire response rate (of those stopped, how many agreed to complete the interview) is over 95%.
Table 2: Roadside Survey Test Cell Sample Size and Capture Rate
Roadside Interview Site Truck Population
SampleSize
Number of Responses
ResponseRate (1)
CaptureRate (2)
Highway I-84 2,524 262 249 95% 9.8%
Port of Portland, Terminal 6 641 99 92 93% 14.4%
Warehouse/Distribution Center 134 56 56 100% 41.8.%
1. Response rate is percent of sample size that responded to the survey.2. Capture rate is the percent of truck population that responded to the survey.
The capture rate for a given site is constrained by the amount of available parking, the number of survey personnel available, and their ability to complete interviews with the volume of truck traffic passing through the weigh station. A limited number of drivers can be interviewed at a given time without creating traffic disruptions and safety risks to survey personnel. The proportion of truck traffic captured will therefore undoubtedly vary by roadside interview site. For this reason, special consideration needs to be taken in the choice of sites for a metropolitan-wide surveying effort.
The amount of information and level of detail captured from these roadside interview questionnaires is relatively complete overall, as truck drivers provided answers to most of the survey questions. However, not all questions were answered with identical frequency, which is evident in the frequency of responses by specific question in Figure 2. Vehicle type information (truck configuration, number of axles, and hazardous material placard) from the I-84 weigh station interviews was captured through visual inspection of the vehicle by survey personnel before speaking to the truck driver. This reduced the respondent time burden and is used in conjunction with answers provided by drivers about their vehicles.
Questions regarding carrier information have high responses, with at least 99% response rates for carrier name, city and state. Somewhat fewer responses are provided for the specific carrier street address (80%) and carrier zip code (67%). In many cases, some of this information was available from the truck decal advertising the name and address of the truck carrier. However, truck drivers were less likely to know the specific street address and zip code of the carrier.

Intercept Surveys
��
Figure 2: Roadside Interview Item Response Percentage – I-84 Weight Station (N=249)
Questions concerning payload information also received high responses. All 249 respondents indicate whether the vehicle was loaded or empty; 96% provide the empty weight of the vehicle; 97% note the payload weight; 96% supply the maximum licensed weight; and 88% provide a response for commodity description.

Intercept Surveys
��
Trip origin and destination details are the two topic areas that pose the greatest difficulty for truck operators to answer fully. Origin and destination information is most frequently answered for city (99% and 96% respectively), state (99% and 96% respectively) and facility type (95% and 90% respectively). Considerably fewer responses, however, are provided for the origin name (25%), origin street address (39%), origin zip code (12%), destination name (17%), destination street address (28%), and destination zip code (6%).
Those surveys that provide the exact street address and zip code of the trip origin and destination are generally from long-haul vehicles with printed delivery and driving instructions. Local and regional delivery drivers on routine schedules or those carrying bulk agricultural and natural resource products rarely knew the specific street address or zip code of the trip origin and destination. In addition, drivers at the interstate location were less likely to dig through their paperwork to find specific origin and destination detail than less-hurried drivers at the port and warehouse facilities. Trip route information did, however, generate a large proportion of responses (99%).
Port Facility Results
The second roadside interview tested was at the Port of Portland’s T-6 marine terminal. Both inbound and outbound freight traffic occurs at this large container facility. Ninety-two questionnaires were completed out of a total of 641 freight vehicles entering and exiting through the port facilities (see Table 2). Again, a capture rate of 14.4% (92/641), slightly more than the weigh station interviews on I-84, is judged sufficient to test the instrument and methodology. Higher rates can be gained by increasing the sample size and number of data collection locations.
The response rate (percentage of all truck operators when asked to participate who agreed) for this site is slightly lower than the I-84 site, primarily due to the differences in where and how the survey was initiated between the two sites. Drivers who were asked to park at the highway weigh station were generally relieved to find out that it did not involve an enforcement action and cooperated wholeheartedly. Drivers passing through the port facilities, while still very cooperative, had slightly different expectations when asked by service club members to participate in a survey and occasionally stated they did not have the time.
Evaluation of the frequency of responses by individual survey question (Figure 3) reveals several similarities in certain informational areas and also a few differences when compared to those responses from the highway interviews. Similar to the highway interviews, surveys conducted at the port facilities collected data on vehicle information from most of the sample. Over 89% of survey respondents provide data for truck configuration, trailer style, number of axles and hazardous material. As a percent of the total sample size, this response rate for vehicle information is only slightly lower than the highway interviews.
The response rate for questions about carrier information is slightly higher for interviews conducted at the port facilities, especially for carrier street name and zip code, whereas questions dealing with the payload information generate much fewer responses overall. The specific questions answered with the lowest frequency at the port facilities are outbound unloaded weight (57%), inbound commodity description (40%) and outbound commodity description (35%). This lower response rate is likely due to the preponderance of container traffic at the port facility relative to the highway weigh station site and to the drivers’ lack of knowledge about the containers’ contents or weight.
Responses to trip origin and destination questions are relatively high at the port facility except for the origin and destination zip code (11% and 20% respectively). The name, street address, city, and state for both trip origin and destination are proportionately higher at the port facility than at the weigh station site. This difference could be a result of the relatively smaller types and number of origins and destinations for port facility traffic, as compared to the traffic on an interstate highway. Drivers of vehicles on designated routes between warehouses in the Portland area and the port facility were more likely to know the specific address detail of origins and destinations.

Intercept Surveys
��
Figure 3: Roadside Interview Item Response Percentage – Port Facility (N=92)

Intercept Surveys
��
Warehouse/Distribution Center Results
The final roadside interview was administered at the warehouse/distribution center of a private freight trucking company within the Portland metropolitan area. This warehouse was selected to participate after contacting transportation and logistics firms from a list of customers provided by the Port of Portland. Several calls and contacts were made before reaching a company that was receptive to allowing this survey to be conducted at one of their warehouse facilities. In most all cases, those who declined to participate were concerned about safety, liability, and interference with daily freight operations without any immediate gain from allowing the survey team to conduct the roadside survey. This reluctance to participate may pose a significant challenge when broadening the scope of data collection to the full metropolitan area.
From a purely logistical and safety point of view, this roadside interview site was the easiest to manage and implement due to lower traffic volume (134 trucks) and the more relaxed atmosphere as drivers were interviewed. Since, compared to the other two locations, considerably fewer trucks passed through this site, truck drivers were less hurried and more apt to participate in the survey if time permitted between drops and pickups. As shown in Table 2, this roadside interview generated the largest response rate (100%) and the greatest capture rate (42%), when compared to the other two survey sites. Fifty-six questionnaires were completed from a total vehicle volume of 134.
Questionnaires administered at the warehouse/distribution center generated a large proportion of responses for individual questions, similar to that of the port facility and highway sites. As shown in Figure 4, questions that relate to vehicle information generate a high percentage of responses, especially for outbound truck configuration (95%), number of axles (100%), and hazardous material (100%). But the response rate to questions relating to vehicle information is slightly lower at the warehouse/distribution center when compared to the other two sites.
Responses to carrier information questions are also high for the warehouse/distribution center survey. The interviews capture 100% of responses for carrier name, carrier city address, and carrier state.
Payload information questions were completed over 95% of the time at the warehouse/distribution center, the highest among all roadside interviews. This is likely the result of fewer types and subsets of commodities handled at the warehouse/distribution center, compared to the freight traffic at the port facility and interstate highway, and the lack of container traffic at this site.
Data and information describing trip origin and destination are less complete for the warehouse/distribution center compared to other types of questions on the survey. Sixty-one percent of respondents provide trip origin street addresses, and only 48% provide origin zip codes (Figure 4). However, this represents the largest proportion of responses to the origin zip code question when compared to the respondents at the respondents at the port facility (11%) and interstate highway (12%). Responses to destination zip code are slightly higher at 55%; also the warehouse/distribution site generates the largest proportion of responses to the destination zip code question as compared to the port facility (20%) and interstate highway (6%). Trip route information is very complete for roadside interviews administered at the warehouse, with over 96% of respondents providing a detailed trip route.
Information related to multiple stops of less-than-truck-load carriers (LTL) (shown in Table 3) was also collected at all three roadside interview sites. Generally, these questions generate the least response across all three locations for all survey questions, indicating this methodology will need modification where a preponderance of LTL traffic is seen. For respondents with LTL vehicles, none identify specific zip code and very few have street information of the multiple stops, but the highway interview yields a relatively better response rate on city and state information for multiple stops. Less than 4% of all questionnaires from all three roadside interview locations provide information related to facility name at shipment origin. Respondents provide better detail for the origin city and state (13% highway I-84, 4% port facility, 2% warehouse) but very little information related to the

Intercept Surveys
�0
address of shipment destination. This level of detail provided by respondents follows the pattern of responses of drivers of non-LTL trucks.
Figure 4: Roadside Interview Item Response Percentage – Warehouse/Distribution Center (N=56)

Intercept Surveys
��
Table 3: Survey Item Response Percentage to LTL Origin and Destination Questions
Roadside Interview Site
Origin Destination
FacilityName
StreetAddress City State Facility
NameStreet
Address City State
Highway I-84 2% 2% 13% 13% 1% 2% 10% 10%
Port of Portland, Terminal 6 4% - 4% 4% - - - -
Warehouse/Distribution Center 1% - 2% 2% - - - -
DISCUSSION AND OBSERVATIONS
Overall, the roadside survey pilot tests demonstrate the need for customizing an intercept surveying process, based on location, and determining the best location for particular desired data elements, given the identified variation in respondents’ ability to provide information. The support and cooperation of the ODOT Motor Carrier Transportation Division, the Port of Portland, and the private warehouse/distribution center’s management and operations personnel all contributed to a safe and successful data collection effort; such cooperation is critical to the success of any of these surveys.
The recruitment and training of service club volunteers who conducted the roadside surveys was simplified, given that a previous relationship already existed with the club from prior research activities through the Strategic Freight Transportation Analysis (SFTA) project at Washington State University. Most club members had already participated in four previous roadside interviews and were well experienced. This lessened the need for close supervision and monitoring by quality control officers during the survey. It is expected that significantly greater resources and energy would be required for recruitment, training, supervision and performance monitoring of service club volunteers without prior freight survey experience.
The general capture rate for other highway sites, port sites, and warehouse/distribution locations within the Portland metropolitan area can be expected to be significantly higher overall than those specific sites tested in this pilot study, since the sites were selected because they represented the most difficult locations, primarily due to vehicle volume at each site.
In summarizing the primary findings from the roadside interviews we find that 1) the capture rate (number of vehicles sampled out of the total volume) is dependent upon available parking and survey personnel relative to the total truck traffic volume and undoubtedly will vary by roadside interview site; 2) all three types of roadside interviews produce high response rates related to vehicle and trailer information, carrier information, trip route information, and facility type; 3) roadside interviews at the warehouse/distribution center and interstate highway weigh station provide high response rates related to commodity type, while the preponderance of container traffic at the port facility limits responses on payload information; 4) obtaining specific street addresses and zip codes for trip origin and destination is very difficult for all types of roadside interviews, but the best responses are from warehouse/distribution centers; and 5) finding a large number of private transportation firms to participate in warehouse/ distribution center roadside surveys may prove challenging.
Consideration needs to be given to the possibility of appending missing information using post-processing techniques. For example, if a business name and city are provided, computer programs can generate the zip code, and this information can be appended to the database of survey responses. Further research is needed to ensure the accuracy and reliability of data enhancement techniques.

Intercept Surveys
��
The results of these pilot studies offer valuable information and direction for future freight data collection and research efforts that are designed to serve the modeling and planning needs of agencies and institutions like the Oregon Department of Transportation. Below is a brief summary of these findings as they relate to the 10 data attributes and characteristics defined and prioritized for state modeling and planning needs. These findings are summarized in Table 4.
Origin-Destination Detail
The amount of detail on trip origin and destination varies by site location. Although the roadside interviews generally provide the complete origin-destination information, the three sites differ in the type of detail provided for intra- and inter- regional freight shipments. The interstate highway intercept survey, which contains a larger proportion of inter-regional shipments relative to the warehouse and port surveys, offers excellent city and state information on shipment origins and destinations but incomplete information on street address and zip code for an overall rating of Acceptable (Table 4). Roadside surveys conducted at the warehouse/distribution center and port facility provide much more complete street address and zip code information for an overall rating of Very Good (Table 4). Freight traffic at these types of facilities likely possess a greater proportion of intra-regional movements, thereby providing modelers and planners with necessary address details for shipment origins and destinations within the metropolitan area. Roadside interviews at warehouse/distribution centers and port facilities offer the most complete detail related to street address and zip code of shipment origins and destinations. Roadside interviews at interstate highway locations provide excellent trip origin-destination data for city and state detail, but less complete information for street address and zip code.
Route Identification
All three roadside locations provide excellent detail on the specific route used for each shipment type. Roadside survey questionnaires incorporate both state and city maps for highlighting the entire trip route on different streets and highways, thus capturing both inter- and intra-regional shipment types.
Table 4: Data Collection Locations Performance in Satisfying Planning/Modeling Needs*
Planning / Modeling Data Attributes
Interview Locations
Interstate Port Warehouse/Distribution Center
O & D Detail Acceptable Very Good Very Good
Route Identification Excellent Excellent Excellent
Land Use at Stops Limited Limited Limited
Commodity, Weight, Vehicle Type, and Configuration. Very Good Very Good Very Good
Location of Stops, Location of Trip Generators, and Time of Day Limited Limited Limited
Volume of Shipments Excellent Excellent Excellent
*The continuum of descriptors (Limited, Acceptable, Very Good, Excellent) reflects the relative degree to which each needed planning/modeling data attribute item is obtained from the different roadside interview location. These generally summarize the response percentages by item type in Figures 2, 3 and 4.

Intercept Surveys
��
Facility Type (Land Use) at Stops
The amount of information provided from roadside surveys, while complete and valuable, apply only to the specific facility type (truck terminal, rail terminal, or warehouse). Information about LTL vehicles and those making multiple stops was not obtained in any detail from any roadside survey.
Commodity, Weight, Vehicle Type/Configuration
The roadside interviews provide very good detail and data for the description of commodity, payload weight, and vehicle configuration (Table 4). The specific questions are unique to the current shipment in progress, and recording the information from the vehicle operator yields more accurate trip specific information compared to the pre-truck survey responses with warehouse/distribution center managers, who attempted to characterize all inbound and outbound shipments in summary form. The analysis of inter- and intra-regional shipment information by commodity, weight, and vehicle configuration is possible and interesting, since each interview site contains different proportions of inter- and intra-regional shipment types.
Location of Stops, Trip Generators and Time of Day
The locations of stops and trip generator data are not easily obtained from the roadside interviews. Roadside interviews, while providing the most information on LTL stops, are still considered incomplete because of the low-item response. Identification of the majority of freight warehouse facilities would help inform modelers and planners of LTL movements relative to freight trip generation points and location of stops. Roadside interviews do provide adequate time of day information for shipments, but the overall rating is “limited.”
Volume of Shipments
All three of the data collection sites yield “Excellent” information regarding volume of freight shipments. The volume of shipments attribute is measured by a combination of the ability to record the number of trucks passing through each facility and the payload weight of those sampled. The response rate on these two dimensions “Number of Loaded/Empty” and “Payload Weight” in Figures 2, 3 and 4 are above 90% for each location. The I-84 weigh station and warehouse site generally both produced higher response items for all payload information attributes when compared to the Port of Portland location. This is primarily due to the greater proportion of containerized traffic moving through the port relative to the other locations and the lower likelihood that truck drivers know the contents and weight of the containers.
CONCLUSIONS AND RECOMMENDATIONS
Based on the findings, conclusions and experience from this case study, the authors offer the following recommendation/findings:• Data captured at roadside interview locations can provide trip detail for inter-regional movements
(state and interstate highway locations) and also trip detail for intra- regional freight movements (warehouse/distribution center locations) sufficient for freight modeling and freight planning purposes.
• Given the data requirements and needs for both modeling and planning interests for inter- and intra-regional freight movements, the primary data collection effort should be a combination of roadside interviews on highways (state and interstate), port facilities, and warehouse/distribution centers. This will require the following:◦ Identification of sites that are geographically dispersed.

Intercept Surveys
��
◦ Development of personal/professional relationships with commercial vehicle enforcement officers.
◦ Establishment of contractual/personal relationships with area public service organizations (e.g., Lions).
◦ Public notification and publicity regarding the goals and purpose of the data collection effort.
• The selection and identification of roadside interview sites should include those that are geographically dispersed throughout the metropolitan area and provide complete inter- and intra-regional coverage of the access points within and around the chosen area of study.
• Corridor-level truck activity is extremely specific to the geographic area within an urban area, and it is this specificity that will inform transportation planners and researchers about the nature of the traffic flows, both for regional economic studies and transportation studies. The survey results can only be generalized over those links in the network determined to be consistent with the flow of goods in, through and around an urban area. This study, based on the convenience sample chosen, provides some direction and caution to other researchers and planners as they undertake their own surveys.
• Further research is needed to determine the stability of corridor-specific freight activity as seasonality, economic conditions, and other influences may impact the flow of goods over time. In that effort, a scientific sample would be useful and appropriate.
• The use of traffic counting and classification equipment can provide the total number of vehicles within a particular corridor, but only the use of carefully located roadside intercept surveys can provide the necessary data elements for freight modeling and freight planning.
• Special attention needs to be focused on outreach programs to freight community members to foster an atmosphere of cooperation prior to the deployment of a metropolitan-wide survey. Such an effort would promote and encourage participation by respondents, overall and question specific.
References
Casavant, Ken, and Eric Jessup. Strategic Freight Transportation Analysis Full Scope of Work. SFTA Research Report #1. Washington State University, 2002.
Fischer, M., J. Ang-Olson, and A. La. “External Urban Truck Trips Bases on Commodity Flows: A Model.” Transportation Research Record 1707, (2002): 73-80.
Gorys, Julius. “1988 Ontario Commercial Vehicle Survey.” Transportation Research Record 1313, (1991): 20-26.
Hedges, C.A. Demand Forecasting and Development of a Framework for Evaluation of Urban Commodity Flow: Statement of the Problem. Special Report 120: Urban Commodity Flow. Highway Research Board. Washington DC. 1971.
Jessup, Eric, Ken Casavant, and Catherine Lawson. Truck Trip Data Collection Methods. Final Report. SPR 343. Oregon Department of Transportation, 2004.
Lawson, Catherine T. “Citizen Participation: Freight Community-Style.” Journal of the Transportation Research Forum 57(3), (2003): 131-152.
Lau, Samuel. Truck Travel Surveys: A Review of the Literature and State-of-the-Art. Metropolitan Planning /Commission, Planning Section, 1995.
National Research Council. A Concept for a National Freight Data Program: Special Report 276. Transportation Research Board, 2003.
Safe, Accountable, Flexible, Efficient Transportation Equity Act: A Legacy for Users (SAFETEA-LU), (2005), < http://www.fhwa.dot.gov/safetealu/legis.htm>. (Accessed January 2006).

Intercept Surveys
��
Acknowledgments
The research reported in this paper was funded by the Oregon Department of Transportation and the Federal Highway Administration. The authors recognize the members of the ODOT Research Unit and Technical Advisory Committee for their advice and assistance in this research effort. No statements are ODOT/FHWA policy positions.
Eric Jessup, Ph.D., is an assistant professor in the School of Economic Sciences at Washington State University, Pullman, WA. He is project director for the statewide freight research and implementation study “Strategic Freight Transportation Analysis (SFTA)” in Washington State and conducts research in transportation economics, logistics, and systems modeling.
Kenneth Casavant, Ph.D., is a professor in the School of Economic Sciences at Washington State University, Pullman, WA. He has been actively involved with transportation research for more than 30 years, has authored three textbooks on economics and over 200 publications in the area of transportation and economics. Catherine T. Lawson, Ph.D., is an assistant professor and interim director of the Master’s in Regional Planning Program in the Geography and Plannng Department at the University at Albany, in Albany, NY. Lawson is actively involved in research on travel behavior (passenger and freight), the use of archived Intelligent Transportation Systems(ITS) data in transportation planning, transportation/land use interactions, “healthy” infrastructure planning, microsimulation and GIS applications. Alan R. Kirk is a senior research analyst at the Oregon Department of Transportation Research Unit with an academic and professional background in community development. His work in transportation research focuses on socioeconomic, planning, and policy issues.