TRANSPORTATION ENGINEERING-II GVPCE(A) …gvpce.ac.in/Course...
143
Prepared By: V.M.Naidu; GAYATRI VIDYA PARISHAD COLLEGE OF ENGINEERING; VISAKHAPATNAM TRANSPORTATION ENGINEERING-II GVPCE(A) B.Tech (Civil Engineering, VI Semester)
Transcript of TRANSPORTATION ENGINEERING-II GVPCE(A) …gvpce.ac.in/Course...

Prepared By: V.M.Naidu; GAYATRI VIDYA PARISHAD COLLEGE OF ENGINEERING; VISAKHAPATNAM
TRANSPORTATION ENGINEERING-II
GVPCE(A)
B.Tech (Civil Engineering, VI Semester)

Prepared By: V.M.Naidu; GAYATRI VIDYA PARISHAD COLLEGE OF ENGINEERING; VISAKHAPATNAM

Prepared By: V.M.Naidu; GAYATRI VIDYA PARISHAD COLLEGE OF ENGINEERING; VISAKHAPATNAM
UNIT-I
Pavement: Flexible Pavements
INTRODUCTION:
OBJECTS AND REQUIREMENTS OF PAVEMENTS:
• Surface of road way should be stable and non-yielding to allow heavy wheel loads of traffic.
• Road surface should also be even along the longitudinal profile to enable fast vehicles to move safely at design speeds.
• Earthen roads may not fulfil above requirements especially during varying conditions of traffic loads and weathers.
• At high moisture content soil becomes weaker and starts yielding under heavy wheel loads.
Uneven surface
Vehicle oscillations to fast moving vehicles
Increase in fuel consumption , wear of vehicle components.
Increase of Vehicle operating cost

Prepared By: V.M.Naidu; GAYATRI VIDYA PARISHAD COLLEGE OF ENGINEERING; VISAKHAPATNAM
To provide stable and even surface for traffic, suitable design and constructed pavement surface is required.
Maximum and equal to contact pressure under the wheel
P
Stress reduces with depth
STRESS DISTRIBUTION.
Stress on subgrade soil less than contact pressure on road surface.
The reduction in wheel load stresses depends on pavement thickness and characteristics of pavement layer.
Objective of well-defined and constructed pavement:
To keep the elastic deformation of pavement with in the permissible limits so that the pavement can sustain large number of repeated load applications during the design life.
Types of pavement structure:
1. Flexible pavement 2. Rigid pavement
FLEXIBLE PAVEMENT:
It is that which on the whole have low or negligible flexural strength and rather flexible in their structural action under the loads.
It reflects the deformation of lower layers to the surface layer.
Flexible pavement layer transmits vertical or compressive stresses to lower layers by ‘grain to grain’ transfer through point of contact in granular structure.

Prepared By: V.M.Naidu; GAYATRI VIDYA PARISHAD COLLEGE OF ENGINEERING; VISAKHAPATNAM
Load spreading ability of this layer depend on type of material and mix design factors.
Bitumen concrete is one of the best flexible pavement layer material.
Due to ability to distributed stresses to a larger area in shape of truncated cone, the stress gets decreased at lower layer.
Taking full advantage of stress distribution characteristics of Flexible pavement, the layer system concept was developed.
According to this concept, Flexible pavement may be constructed in no. of layers and the top layer has to be the strongest as the highest compressive stresses are to be sustained in addition to wear and tear during traffic.
Lower layer takes lesser magnitude of stresses, so inferior material with low cost can be used for lower layers.
Flexible pavements are commonly designed using empirical design charts or equations taking into account, some of the design factors. These are also called semi empirical and theoretical methods.
RIGID PAVEMENT:
Rigid pavements are those which possess note-worthy flexural strength or flexural rigidity.
The stresses are not transferred from grain to grain in the lower layer as in the case of Flexible pavement layer.
Rigid pavements are made up of Portland cement concrete, either plain or reinforced or pre-stressed concrete.
The plain cement concrete slabs are expected to take up about 40 kg/cm2Flexural stress.
Rigid pavement has slab action is capable of transmitting wheel loads through wider area below.
In Rigid pavements, the maximum Flexural stress occurring in the slab due to wheel load and temperature changes.
Rigid pavement does not get deformed to the shape of lower surface as it can bridge the minor variations of lower
The cement concrete pavement slab can very well serve as a wearing surface as well as effective base course.

Prepared By: V.M.Naidu; GAYATRI VIDYA PARISHAD COLLEGE OF ENGINEERING; VISAKHAPATNAM
FUNCTIONS OF PAVEMENT COMPONENTS:
i. Sub-grade:
The Sub-grade is a layer of natural soil to receive the layers of pavement materials placed over it.
The loads on the pavement are ultimately received by subgrade for dispersion to earth mass.
It is essential that at no time, the soil sub-grade is over stressed.
It is desirable that at least 50cm layer of sub-grade soil is well compacted under controlled conditions of optimum moisture content and maximum dry density.
The common strength tests for the evaluation of soil sub-grade are:
a. California bearing ratio test, b. California resistance value test, c. Tri axial compression test, d. Plate bearing test.
ii. Sub-base and Base course:
These layers are made up of broken stones bound/unbound aggregate, sometimes in sub base course, a layer of stabilised soil, or selected granular soil is also used.
In some places, boulder stones are also used as sub-base.
Base and sub base courses are used under flexible pavement primarily to improve load carrying capacity by distributing loads through finite thickness.
Base courses are used under rigid pavements for
1. Preventing of pumping 2. Protecting the sub-grade against frost action.
Sub base and Base course material may be evaluated by
1. Plate bearing test, 2. CBR test or Hveem stabilometer.
iii. Wearing course or surface course:

Prepared By: V.M.Naidu; GAYATRI VIDYA PARISHAD COLLEGE OF ENGINEERING; VISAKHAPATNAM
Purpose of wearing course is to give a smooth riding surface. It resists pressure exerted by tyres and takes up wear and tear due to traffic. Wearing course also offers a water tight layer against surface water infiltration.
Wearing course of Flexible pavement is bituminous concrete.
Wearing course of Rigid pavement is cement concrete.
There is no test for evaluating structural stability of wearing course, however other tests like Plate bearing test, Benkelmann beam test are used for other purposes.
DESIGN FACTORS:
Pavement design consists of two parts.
i. Mix design of materials to be used in each pavement component lay ii. Thickness design of the pavement and the component layers.
Factors to be considered for design of pavement:
a. Design wheel load b. Sub grade soil c. Environmental factors d. Climatic factors e. Pavement component materials. f. Special factors in the deign of different types of pavements.
DESIGN WHEEL LOAD:
The various wheel loads factors to be considered in the pavement design are:
• Maximum wheel load
• Contact pressure
• Dual or multiple wheel loads and equivalent single wheel load
• Repetition of load.
a. Maximum wheel load:
Maximum legal axial load as per IRC, 8170 kgMaximum equivalent single wheel load is 4085 kg
Equation for vertical stress computation based on Boussinessq

Prepared By: V.M.Naidu; GAYATRI VIDYA PARISHAD COLLEGE OF ENGINEERING; VISAKHAPATNAM
Theory, is given by: �z=P(1-(z3/(a2+z2)3/2))
�z= vertical stress at depth z
P = surface pressure
z = depth at which �zis computed.
a= radius of load area.
b. Contact pressure:
Contact pressure = load on wheel/ Contact area or area of imprint
Rigidity factor= Contact pressure/Tyre pressure
<1.0 at >7kg/cm2
=1.0 at =7kg/cm2
>1.0 at <7kg/cm2
c. Equivalent single wheel load(ESWL):
Up to the depth of d/2; each wheel load P acts independently and after this point the stresses induced due to each load begins to overlap, at a depth of 2s and above, the stresses induced are due to effect of both wheels, as the area of overlap is considerable.
ESWL may be determined based on either equivalent deflection or equivalent stress criteria.
Multiple wheel loads are converted to ESWL and this value is used in pavement design.
Suppose, a dual wheel load assembly causes certain value of maximum deflection ∆ at a particular depth z as per the deflection criteria, the ESWL is that single wheel load having same contact pressure which produces the same value of maximum deflection at the depth z.
Similarly, by stress criteria the ESWL is the single wheel load producing the same value of maximum stress at a desired depth z as dual.
d. Repetition of load:
The deformation of pavement/ sub grade due to single application of wheel load may be small but due to repeated application of same load, there would be increased magnitude of plastic and elastic deformations and accumulated un recovered or permanent deformations may even result

Prepared By: V.M.Naidu; GAYATRI VIDYA PARISHAD COLLEGE OF ENGINEERING; VISAKHAPATNAM
in pavement failure, so it is required to carry out traffic surveys for accounting the factor of repetition for wheel loads in the design of pavements.
If the pavement structure fails with N1 number of repetitions of P1 Kg load and similarly ifN2
number of repetitions of P2kg load can also cause failure of the same pavement structure, thenP1N1 and P2N2 are considered equivalent.
Equivalent wheel load factors: Wheel load kg Repetition to failure Equivalent to
2268kg Equivalent load factor
2268 105000 1.0 1 2722 50000 2.0 2 3175 22500 4.7 4 3629 13000 8.2 8 4082 6500 16.3 16 4536 3300 32.0 32 4990 1700 62.0 64 5443 1000 105.0 128

Prepared By: V.M.Naidu; GAYATRI VIDYA PARISHAD COLLEGE OF ENGINEERING; VISAKHAPATNAM
Problem: calculate design requirements for 20 years period for various wheel loads equivalent to 2268kg wheel load using the following traffic survey data on the 4-lane road. Wheel load kg Average daily traffic(both
directions) Percentage of total traffic volume
2268 Total 13.17 2722 Volume 15.30 3175 (Considerable 11.76 3629 Traffic 14.11 4082 Growth) 6.21 4536 215 5.84 Solution: Design repetitions for a period of 20 years calculated. Wheel load kg
A.D.T (both direction)
Percentage for each load
Days/years No. of years
Equivalent load factors
Design repetitions equivalent of 2268 kg load
2268 215x 13.17/100 x 365x 20x 1= 206,703 2722 215x 15.30/100 x 365x 20x 2= 480,267 3175 215x 11.76/100 x 365x 20x 4= 738,293 3629 215x 14.11/100 x 365x 20x 8= 1,771,652 4082 215x 6.21/100 x 365x 20x 16= 1,599,455 4536 215x 5.84/100 x 365x 20x 32= 2,933,082 Total Design
Estimated Repetitions
Repetitions equivalents
(2directions) of 2268 kg wheel
Load per lane
= = =
7229,452 7229,452/4 19,32,363
DESIGN OF FLEXIBLE PAVEMENT: Various approaches of flexible pavement design may be classified into three broad groups: a. Empirical methods. b. Semi-Empirical methods. c. Theoretical methods.
Some of theflexible pavement designs are given below are: i. Group index method ii. California bearing ratio method, iii. California resistance method, iv. Tri axial method, v. Mc leod method

Prepared By: V.M.Naidu; GAYATRI VIDYA PARISHAD COLLEGE OF ENGINEERING; VISAKHAPATNAM
vi. Burmister method.
California bearing ratio method:
In 1928, California division of highways in USA developed CBR method of pavement design.
One of the chief advantage of CBR method is the simplicity of the test procedure.
CBR tests were conducted by California state highway department, on existing pavements layers including sub-grade, sub-base and base course.
Based on extensive CBR tests on satisfactory pavements and those which failed an empirical design chart was developed co-relating CBR value and pavement thickness.
California state highway department develops charts for wheel loads of 3175 kg and 5443 kg representing light and heavy traffic, later the design curve for 4082 kg wheel load was obtained by interpolating for medium traffic.
Studies carried out by US corps of engineers have shown that there exists relationship between pavement thickness, wheel load, tyre pressure and CBR value with in the range of 10-12%
t = √P((1.75/CBR)-(1/pπ))1/2
t = ((1.75P/CBR)-(A/π)) 1/2
t = pavement thickness, cm
P = wheel load, kg
CBR = California bearing ratio, %
p= tyre pressure, kg/cm2
A = area of contact, cm2
Above expressions are applicable only when the CBR value of sub grade soil is less than 12%.
Indian road congress has recommended a CBR design chart for tentative use in India.
Different curves A, B, C, D, E, F, and G have been given based on the volume of commercial vehicles.
PAVEMENT THICKNESS DETERMINATION:
In order to design a pavement by CBR method; first the soaked CBR value of the soil sub grade value is to be considered.

Prepared By: V.M.Naidu; GAYATRI VIDYA PARISHAD COLLEGE OF ENGINEERING; VISAKHAPATNAM
Based on the design charts, the total thickness of flexible pavement needed to cover sub grade of known CBR value is obtained.
In case, if there is a material superior than soil sub grade such that it may be used as sub base course, then the thickness of construction over this material could be obtained from design chart – knowing CBR value of the sub base.
Thickness of sub base course is “total thickness-thickness over sub base”
IRC 37:2001, input parameters:
a. Traffic b. CBR value of sub grade.
1. TRAFFIC:
Estimation of design traffic:
a. Initial traffic after construction in terms of number of commercial vehicles/day. b. Traffic growth rate during design life in %. c. Design life in years d. Vehicle damage factor(VDF) e. Distribution of commercial traffic over carriage way.
i. Initial traffic:
Based on 7 days, 24 hour count for existing road, and estimate based on land use for new road.
ii. Traffic growth rate:
It should be estimated based on
1. Studying the past trends of traffic growth 2. By establishing econometric models as per IRC 108 3. If data is inadequate, average annual growth rate of 7.5% may be adopted.
iii. Design life:
NH, SH ways – 15 years.
Express way, arterial – 20 years.
Other roads – 10-15 years.

Prepared By: V.M.Naidu; GAYATRI VIDYA PARISHAD COLLEGE OF ENGINEERING; VISAKHAPATNAM
iv. Vehicle Damage Factor (VDF): It is defined as equivalent number of standard axles per commercial vehicle. It varies with vehicle axle configuration, axle load, terrain, type of road and design. It is arrived from axle load survey.
When sufficient information on axle load is not available and project sixe does not warrant, conducting an axle load survey, following indicative values of VDF may be used.
Initial traffic volume in terms of commercial vehicles/day
Terrain
Rolling/plain Hilly
0-150 1.5 0.5 150-1500 3.5 1.5 >1500 4.5 2.5
v. Distribution of commercial traffic over carriage way:
1. Single-lane roads:
Design should be based on total number of commercial vehicles in both directions.
2. Two-lane Single carriage way roads: Design should be 75% of total number of commercial vehicles in both directions.
3. Four -lane Single carriage way roads: Design should be 40% of total number of commercial vehicles in both directions.
4. Dual-carriage way: Dual –two lane – design: 75% of total number of commercial vehicles in each direction. Dual –three lane – design: 60% of total number of commercial vehicles in each direction. Dual –four lane – design: 45% of total number of commercial vehicles in each direction.
Computation of design traffic:
N = 365 x [(1+r)n-1] x A x D x F/r
Where, N= the cumulative no. of standard axle to be entered
for, in the design terms of msa. A = initial traffic in the year of completion of construction in terms of no. of commercial vehicles/day. D= lane distribution factor F=VDF,

Prepared By: V.M.Naidu; GAYATRI VIDYA PARISHAD COLLEGE OF ENGINEERING; VISAKHAPATNAM
n = design life in years. r = annual growth rate of commercial vehicles (7.5%) P= no. of commercial vehicles as per least count x =no. of years between last count for year of completion of construction.
Problem:
Design pavement for construction of new by pass.
Data: i. Two-lane Single carriage way ii. initial traffic after construction – 400 CV /day (both directions) iii. Traffic growth rate per annum =7.5% iv. Design life =15 years. v. VDF from axle load survey=2.5 vi. Design CBR of sub grade soil =4% vii. Distribution factor=0.75
Solution:
N = 365 x [(1+0.075)15-1] x 0.75x400 x 2.5/0.075
=7149902.34sa
=7.2msa
Thickness =675 mm from, plate no.1 for 4%CBR
As per IRC 37:2001,
From plate no.1, for 4%CBR, 7.2msa
a. Bitumen surfacing = 25mm+70 mm DBM b. Road base= 250mm WBM. c. Sub base= 315 mm granular material.
Problem:
It is proposed that to widen and existing 2 lane NH section two 4- lane divided road, design the pavement for new carriage way with following data:
i) four-lane divided carriage way ii) initial traffic in each direction.–5600 CV /day iii) Design life =10 years/15 years.

Prepared By: V.M.Naidu; GAYATRI VIDYA PARISHAD COLLEGE OF ENGINEERING; VISAKHAPATNAM
iv) Design CBR of sub grade soil =5% v) Traffic growth rate= 8% vi) VDF from axle load survey=4.5 vii) Distribution factor=0.75
Solution:
For n= 10 years,N = 365 x [(1+r)n-1] x A x D x F/r
N = 365 x [(1+0.08)10-1] x 0.75x5600 x 4.5/0.08 =99.93msa =100msa
For n= 15 years,N = 365 x [(1+r)n-1] x A x D x F/r
N = 365 x [(1+0.08)15-1] x 0.75x5600 x 4.5/0.08 =187.3msa As per code if valueexceeds 150msa, value taken as 150msa.
From plate no.2, for 5%CBR, 100msa for n=10 years,
a. Bitumen surfacing = 50mmBC+150 mm DBM b. Road base= 250mm Wet mix Macadam. c. Sub base= 300 mm granular sub base.
From plate no.2, for 5%CBR, 150msa for n=15 years,
a. Bitumen surfacing = 50mmBC+170 mm DBM b. Road base= 250mm Wet mix Macadam. c. Sub base= 300 mm granular sub base
FLEXIBLE PAVEMENT DESIGN (AASHTO METHOD):
AASHTO method (American Association of State Highway and Transport Officials)
Scope for guide-lines:
Applicable for new pavements and overlay
Salient features of AASHTO:
i. Concept of reliability is introduced.

Prepared By: V.M.Naidu; GAYATRI VIDYA PARISHAD COLLEGE OF ENGINEERING; VISAKHAPATNAM
ii. Traffic is considered in terms of equivalent standard axle load 18kips repetitions. iii. Equivalent axle load factors are considered iv. Layer coefficients for different types of materials are also introduced. v. A single index (structural member) is used to represent the pavement structure.
Consideration of pavement performance:
i. Structural and functional performancesare considered by AASHTO. ii. Structural performance deals with the occurrence of cracking, rutting, ravelling and
other factors affecting the load carrying capacity of pavement. iii. The functional performance is about how will the pavement serve the use (ride
quality).
Serviceability performance concept:
i. It is developed at AASHTO – the road that is considered. ii. Roads are for convenience and comfort of road users. iii. Comfort is a matter of subjective response. iv. Serviceability can be measured in terms of rating given by the road users i.e.,
Serviceability rating. v. Certain physical characteristics of the pavement (which can be measured
subjectively) can be correlated to the subjectiveratings. i.e., Serviceability index. vi. Performance of the pavement can be represented by Serviceability history of the
pavement.
Pavement Serviceability:
i. It is expressed as Present ServiceabilityIndex (PSI). ii. PSI at a particular time obtained from measurements of roughness and distress. iii. Roughness is the dominant factor in estimation of PSI. iv. The scale of PSI ranges from 0 to 5. With 5 representing the highest serviceability
condition. v. The initial PSI (Pi) value (soon after construction) is normally considered to be “4.2”.
However, this can be different depending on construction practice.

Prepared By: V.M.Naidu; GAYATRI VIDYA PARISHAD COLLEGE OF ENGINEERING; VISAKHAPATNAM
vi. The terminal Serviceability Index (Pt) is the lowest acceptable level before resurfacing/ reconstruction becomes necessary.
vii. For high volume roads, a Ptof 2.5 or 3 is normally recommended. viii. For minor (low traffic) volume roads, Pt values of 1.5 can be normally recommended.
Factors affecting PSI:
• Traffic
• Age • Environment
AASHO roads test equation for PSI
PSI = 5.03-1.91 log (1+sv)-1.38RD2-0.01(C+P) 1/2
Where , sv=slope varience (×106) ( avg of both wheels)
RD=Rut depth ( inches) over 4ft span-avg for both paths.
C=cracking area (sq.ft/1000 sqft of pavement)
P=patched area (sq.ft/1000 sqft of pavement)
Traffic :
‘slope variance’ represents the variation of pavements, longitudinal slope, measured over 9 inch base with respect to the average slope of the pavement.
‘Traffic’ over the design period estimated by assuming a suitable exponential growth rate.
Analysis/Design period:
� High volume urban – 30-50 yrs. � High volume rural -- 20-50 yrs. � Low volume paved – 15-25 yrs. � Low volume aggregate surface – 10-20 yrs.
Mixed traffic stream consisting of different axle loads and different axle configurations is converted into equivalent repititions of standard axle load.
The load equivalency factors used for this conversion are function of pavement type ( flexivle/rigid), thickness and terminal serviceability index considered.
EQIVALENT AXLE LOAD FACTORED(EALF):
EALF are used to convert different axle loads into equivalent repetitions of standard (18kips) axles.

Prepared By: V.M.Naidu; GAYATRI VIDYA PARISHAD COLLEGE OF ENGINEERING; VISAKHAPATNAM
EALF defines the damage caused to the pavement by one application of axle load under consideration relative to the damage caused be a single application of standard axle.
Design based on the total number of applications of standard axle load during the design period is ‘ESAL’.
ESAL=∑ (�� ∗ ��)
m=no of axle load group
Fi=EALF for the ith – axle load group
Ni=no of applications of the ith group during design period.
AASHTO EAL factors ( flexible pavement):
Structural number Axle load kips
1 2 3 4 5 6
2 0.0002 0.0002 0.0002 0.0002 0.0002 0.0002 12 0.16 0.18 0.19 0.18 0.17 0.17 18 1.00 1.00 1.00 1.00 1.00 1.00 24 3.71 3.62 3.43 3.33 3.40 3.51 36 24.2 23.3 21.16 19.28 19.02 19.93 40 39.57 38.02 34.34 30.92 30.04 31.25
Pt=2.0
ROAD LOAD SOIL/SUB GRADE SOIL:
Resistance modulus MR is the parameter used to characterise the road soil. This is a measurement elastic response of the soil recognising certain non-linear characteristics of soil.
MR is measured as per AASHTO test, method “7274” (repeated triaxial test) alternatively MR of the subgrade soil be estimated from its CBR value.
MR= 1500×CBR
This equation is reasonable for fine grained soil, of CBR <10%.
Performance criterion for flexible pavement:
Log10=ZR×SO+9.36log(SN+1)-0.20+{log10PSI/4.2-1.5)/(0.40+(1094/(SN+1)POWER5.19)}+2.32log10(MR)-8.07
W18 =F(MR,SN,ZR,SO, PSI)
Where,

Prepared By: V.M.Naidu; GAYATRI VIDYA PARISHAD COLLEGE OF ENGINEERING; VISAKHAPATNAM
W18=produced no of 18 kip equivalent single axle load epititions
ZR= standard normal variate.
SO=combined standard error of traffic prediction and performance prediction.
PSI = Pi-Pt
MR= resistant modulus of subgrade (PSI)
SN=pavement structure number
SN=pavement structural number (indicative of layer thickness and layer material)
SN= a1D1+a2m2D2+a3m3D3
Where a1,a2,a3 are layer coefficients for 3 layers.(bituminous surface, base, granular ,sub-base,of pavements) D1,D2,D3 are thickness of 3 layers.
m2 and m3 are the drainage coefficient for the second and third layer.
LAYER COEFFICIENT:
It depends on contribution of individual layer towards total pavement thickness.
These are different for different types of materials.types values suggested by AASHTO road tests are given below.
Bitumen concrete surface – 0.44
Crushed stone granular base – 0.14
Sandy granular sub-base course – 0.11
Layer coefficients – Asphalt concrete layer
0.5
0.4
0.3
0.2
0.1
0 ×10power5 1 2 3 4 5

Prepared By: V.M.Naidu; GAYATRI VIDYA PARISHAD COLLEGE OF ENGINEERING; VISAKHAPATNAM
Elastic modulus (PSI) of asphalt concrete (68®F)
Layer coefficient – Granular base
Layer coefficient – sub-base
DRAINAGE COEFFICIENTS :
These depends on
i. Quality of the drainage. ii. Percentage of time during the year, pavement structure could normally be exposed to
moisture levels. iii. Approaching saturation.(which depends on average rainfall and drainage conditions).
% of time exposed pavement exposed to saturation Quality of drainage
<1% 1-5% 5-25% >25%
Excellent 1.4-1.35 1.35-1.3 1.3-1.2 1.2 Good 1.35-1.25 1.25-1.15 1.15-1.0 1.0 Fair 1.25-1.15 1.15-1.05 1.00-0.80 0.8 Poor 1.15-1.05 1.05-0.8 0.8-0.6 0.6 Very poor 1.05-0.95 0.95-0.75 0.75-0.4 0.4
a2
R-VALUE MR CBR
a3
R-VALUE MR CBR

Prepared By: V.M.Naidu; GAYATRI VIDYA PARISHAD COLLEGE OF ENGINEERING; VISAKHAPATNAM
Reliable suggested values: Recommended level of reliability
Functional calassification Urban Rural Interstate and other express ways
85-99.9 80-99.9
Principal arterial 80-99 75-95 Collector 80-95 75-95 Local 50-80 50-80 Typical value of total standard deviation(s0)=0.45 Reliability (R)
50% 80% 90% 95% 99%
Standard normal dev
0.0 -0.841 -1.282 -1.645 -2.327
DESIGN – INPUT:
� Traffic � Reliability level � Total standard deviation � Design initial PSI(pi) � Design terminal PSI (pt) � Pavement layer type and material properties � Drainage conditions � Resistant modulus of sub-grade soil
Solve the performance equation for structural number SN
� Selection of layer thickness: • Individual layer thickness have to be selected for design structural member.
• Minimum layer thickness to be provided are given in the following table. Traffic (msu) Asphalt concrete(inch) Aggregate base(inch) <0.05 1.0 4.0 0.05-0.15 2.0 4.0 0.15-0.5 2.5 4.0 0.5-2.0 3.0 6.0 2.0-7.0 3.5 6.0 >7.0 4.0 6.0 Use a layered approach:

Prepared By: V.M.Naidu; GAYATRI VIDYA PARISHAD COLLEGE OF ENGINEERING; VISAKHAPATNAM
SN1
SN2
SN3
D1>SN1/a1 :SN*1 = a1D1>=SN1
D2> (SN2-SN*1)/a2m2 ;SN1+SN*2 = SN2
D3>= (SN3-(SN*1+SN*2))/a3m3
Design a 3 layer pavement system for following data using AASTHO method:
Given data,
W18=10,00,000 18 kip standard axle
MR of subgrade soil = 6000 PSI
Elastic modulus of bitumen layer at 68®F = 450,000 PSI
Elastic modulus of granular base at 68®F = 31,000 PSI
Elastic modulus of granular sub-base at 68®F = 16,000 PSI
Design initial PSI, pi=4.4
Design terminal PSI, pt =2.0
Reliability terminal PSI = 95%
Overall standard derivation so=0.35
Drainage coefficient layer 2 =1.10
Drainage coefficient layer 3 = 0.90
a1
a2
a3

Prepared By: V.M.Naidu; GAYATRI VIDYA PARISHAD COLLEGE OF ENGINEERING; VISAKHAPATNAM
DESIGN OF RIGID PAVEMENTS
Westergard’s modulus of sub-grade reaction:
K=p/ =p/0.125 kg/cm3
Where p is pressure sustained in kg/cm3 by a rigid plate of dia 75 cm at a deflection of =0.125 cm
Relative stiffness of slab to subgrade:
A certain degree of resistance to slab deflection is offered by the subgrade, this is dependent upon the stiffness pressure deformation, properties of subgrade materials.
The tendency of the slab to deflect is dependent upon its properties of flexural strength.
Radius of relative stiffness,
L=(Eh3/12k(1-µ2))
where,
µ is the poisson ratio of concrete = 0.15
h is the slab thickness in cm
k is the modulus of subgrade on kg/cm3
l is the radius of relative stiffness in cm
E is the modulus of elasticity of cement concrete in kg/cm2
Problem:
Compute radius of relative stiffness of 15 cm thick cement concrete slab from the following data:
Modulus of elasticity of cement concrete = 2.1×10(power)5 kg/cm3
Poisson ratio of concrete = 0.15
Modulus of subgrade reaction k = (i)3.0 kg/cm3
(ii) 7.5 kg/cm3
For k=3 kg/cm3
l=(eh3/12k(1-µ2))¼

Prepared By: V.M.Naidu; GAYATRI VIDYA PARISHAD COLLEGE OF ENGINEERING; VISAKHAPATNAM
=66.99 cm
For k=7.5 kg/cm3
=53.28 cm
Problem:
A soil subgrade sample was obtained from project site and cbr test was conducted at field density results (it is desired to use following materials
Penetration (mm) Load (kg) Penetration (mm) Load(kg) 0.0 0.0 3.0 56.5 0.5 5.0 4.0 67.5 1.0 16.2 5.0 75.2 1.5 28.1 7.5 89.0 2.0 40.0 10.0 99.5 2.5 48.5 12.5 106.5
It is decided to use the following material at differen layouts
1. Compacted sandy soil with 7% CBR 2. Poorly graded gravel with 20% CBR 3. Well graded gravel with 95% CBR 4. Minimum thickness of bitumen concrete surfacing may be taken as 5 cm
The traffic survey revealed the present ADT of commercial vehicles as 1200. The annual rate of growth in traffic is found to be 8%. The pavement construction to be compleated in 3 yrs after the last traffic count. Design the pavement section of CBR method as recommended by IRC.
Sol:
After correction in concavity of graph,
X 2.5= 55 , X5.0= 78.0
CBR 2.5mm = (55/1370)×100=4
CBR 5.0mm=(78/2055)×100=3.78
Traffic p(1+r)power n+10 = 1200(1+0.08)power 3+10 = 3263 veh/day.
Curve F (1500-4500 veh/day)
Design the load upto 10 years for cbr = 4%
The depth of construction = 55cm.
FLEXIBLE PAVEMENT DESIGN:

Prepared By: V.M.Naidu; GAYATRI VIDYA PARISHAD COLLEGE OF ENGINEERING; VISAKHAPATNAM
AASHTO METHOD ( American association of state Highway and Transport officials)
Scope of guidelines:
• Applicable for new pavement and overlain • Different types of pavement considered are
i. Flexible ii. Rigid
iii. Low volume roads iv. Different types of overlays.
The stresses acting on the rigid pavement are:
I. Wheel load stresses. II. Temperature stresses.
Critical load position:
a. Interior loading. b. Edge loading c. Corner loading
Interior loading: when the load is applied in the interior of the slab surface at any place remote from all the edges.
Edges loading : when the load is applied on edge on the slab at any place remote from the corner.
Corner loading : when the center of the load application is located on the bisector of the corner edge.
EQUIVALENT RADIUS OF RESISTING SECTION:
With the load concentrating on small area of pavement the questions arises as to what sectional area of pavement is effective in resisting the bending moment. According to westergard the equivalent radius of resisting section is
i. When a<1.724h b=sqroot of 1.6a(power2)+h(square)-0.675h
ii. When a>1.724h b=a a=radius of the load b=equivalent radius influence of the section under loading h=slab thickness.
Compute the equivalent radius of resisting section of 20cmslab given the radius of contact area of the wheel load is 15cm
Sol:

Prepared By: V.M.Naidu; GAYATRI VIDYA PARISHAD COLLEGE OF ENGINEERING; VISAKHAPATNAM
1.724h
=1.724(20)
34.48cm>15cm
i. a<1.724h
b=sqrootof 1.6a(sq)+h(sq)-0.675h
b=14.07cm
westergard’s stress equation for wheel loads:
a) Interior laoding: Si=0.316p/h(sq)[4log10(i/b)+1.069]
b) Corner laoding: sc= 3p/h(sq)[1-(a(root2)/l)power0.6]
c) Edge laoding: Se= 0.572p/h (sq)[4log10(l/b)+0.359] Where si,se,sc are max stresses at interior, edge and corner loading respectively in kg/cm2 h is the slab thickness p is the wheel load in kg’s l is the radius of relative stiffness b is theradius of resisting section in cm
warping stresses:
Frictional stresses:
• During the summer season, as the mean temperature of slab increase, the concrete pavement expands towards expansion joint.
• Due to frictional resistance at the interface compressive stress is developed at the bottom of slab as it tends to expand.
Warping stresses:
road road
cold
hot
hot
Cold

Prepared By: V.M.Naidu; GAYATRI VIDYA PARISHAD COLLEGE OF ENGINEERING; VISAKHAPATNAM
• Whenever the top and bottom surface of the concrete pavement simultaneously posses different temp, the slab tends to warp downwards (or) upwards including warping stresses.
• The difference in temp between top and bottom of the slab depends mainly on the slab thickness and climate conditions of the region Average temp, t = t1+t2/2 t1=top;t2=bottom st(i)=Eet/2[ex+µcy/1-µ(sq)] where, st(i)=warping stresses at the interior E=modulus of elasticity of concrete in kg/cm2 e = thermal coefficient of concrete per ◦c t=temp diff between top and bottom of the slab in ◦c cx=coefficient based on Lx/l in design direction cy=coefficient based on Ly/l in right angle to the above direction µ=passion ratio, may be taken as 0.15 lx and ly are the dimensions of slab considering x and y directions along the length and width of the slab. For edge, st(e)=cx.E.e.t/2 = cy.E.e.t/2 For corner, st(c)=E.e.t/3(1-µ)*root(a/l) a=radius of contact l=radius of relative stiffness
pr:
Determine the warping stresses at the interior , edge and a corner region in 25 cm thick, concrete pavement with transverse joint at 11 cm interval and longitudinal joint at 3.6 am interval. The modulus of subgrade reaction k is 6.9kg/cm3.assume temperature difference for day conditions to be 0.6◦c/cm slab thickness. Assume the radius of loading area as 15cm for computing warping at corner. Additional data are given below.
e=10*10power(-6)/◦c, µ=0.15,lx=11cm,ly=3.6cm,E=3*10power 5 kg/cm2
sol:
l=[Ehpower3/12k(1-µ2)]power1/4=87.2cm
lx/l=1100/87.2=12.61;from graph = 1.03
ly/l=360/87.2=4.13;from graph cy=0.55
t=0.6*25=15◦c
a. Interior loading: St(i)=Eet/2[cx+µcy/1-µ(sq)]=25.6 kg/cm2
b. Edge =cx*Eet/2=23.17 kg/cm2

Prepared By: V.M.Naidu; GAYATRI VIDYA PARISHAD COLLEGE OF ENGINEERING; VISAKHAPATNAM
c. Corner=st(c)=7.32 kg/cm2
Frictional stresses :
Due to uniform rise and fall of temperature in the cement concrete slcb, there will be overall expansion and contraction of the slab. As the slab is in contact with soil subgrade, frictional stresses are developed.
Equating,
Total force developed in the cross section of concrete pavement due to movement=frictional resistance due to subgrade resistance in the half length of the slab.
Sf*h*B*100=B*l/2*h/100*W*f
Sf=WLF/2*10power4
Where, sf=unot stress developed in cement concrete pavement in kg/cm2
W=unit weignt if concrete kg/m3
F=coeffeicent of subgreade resistance
L=slab length
B=slab width in m
Combination of stresses:
i. During summer; The critical combination at the interior and edge regions during mid-day occurs when slab tends to warp downwards. During this period max tensile stress is developed at the bottom fibre due to werping and this cumulative with tensile stress due to loading. However , frictional stress is compressive during expansion
Critical combination of stresses= {load stress + werping stress-frictional stress at the edge region}
ii. During winter: During water, the critical combination of stresses at the above region occurs at the bottom fibre when the slab contracts and the slab werps downwards at the midday. The friction stresses are tensile due to constraction. Critical combination of stresses=[loading stresses + warping stresses +frictional stress]at edge
iii. At corner region, the critical combination occurs at the top fibre of the slab, when slab warps downwards during the midright. There is no frictional stress at corner region. Critical combination of stress: =[load stress+warping stress] at corner region.
design of joints in cement concrete pavement:

Prepared By: V.M.Naidu; GAYATRI VIDYA PARISHAD COLLEGE OF ENGINEERING; VISAKHAPATNAM
various types of joints provided in the cement concrete pavement to reduce temperature stresses.
Joints:
• Expansion joints. • Contraction joints.
• Warping joint. • Dowel loads are provided at expansion joints and sometimes at contraction points. Longitudinal
joints in cement pavement are constructed with suitable tie bars.
Spacing of expansion joints:
IRC has recommended that the max spacing between expansion joints, should not exceed 140m for rourh interface layer of ȿ is half the joint width, the spacing of expansion joint Le is given bby the equation
Le=ȿ’/100(T2-T1)
Spacing of contraction joints:
{total frictional resistance upto distance lc/2}=W*b*Lc/2*h/100*f---①
Allowable tension in cement concrete =sc*h*b*100---❷
Euating 1 and 2
Lc=2sc/Wf(*10power4)
Where,
Lc= slab length or spacing between contraction joints in m
h=slab thickness in cm
f=coefficients of friction
W=unit weight of cement concrete in kg/m3
Sc=allowavle stress in tension in cement in kg/cm3
Spacing of contraction joints when reinforcement provided:
Prepared By: V.M.Naidu; GAYATRI VIDYA PARISHAD COLLEGE OF ENGINEERING; VISAKHAPATNAM
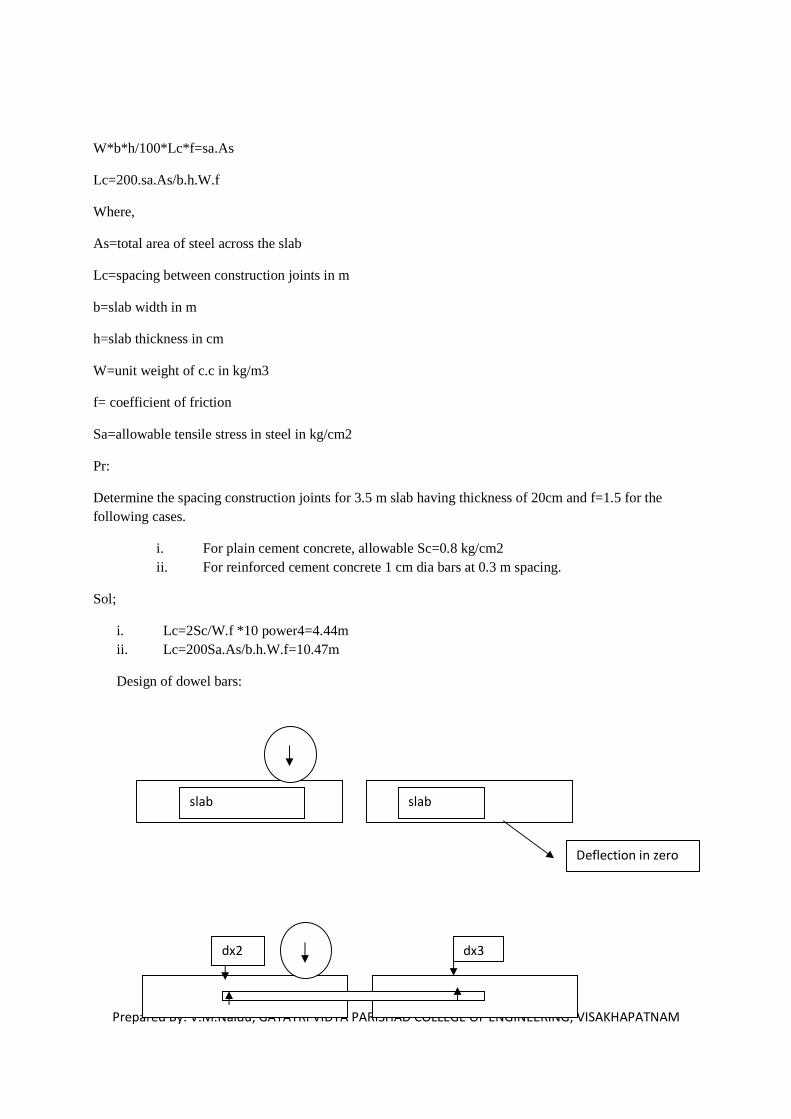
W*b*h/100*Lc*f=sa.As
Lc=200.sa.As/b.h.W.f
Where,
As=total area of steel across the slab
Lc=spacing between construction joints in m
b=slab width in m
h=slab thickness in cm
W=unit weight of c.c in kg/m3
f= coefficient of friction
Sa=allowable tensile stress in steel in kg/cm2
Pr:
Determine the spacing construction joints for 3.5 m slab having thickness of 20cm and f=1.5 for the following cases.
i. For plain cement concrete, allowable Sc=0.8 kg/cm2 ii. For reinforced cement concrete 1 cm dia bars at 0.3 m spacing.
Sol;
i. Lc=2Sc/W.f *10 power4=4.44m ii. Lc=200Sa.As/b.h.W.f=10.47m
Design of dowel bars:
slab slab
Deflection in zero
dx3 dx2

Prepared By: V.M.Naidu; GAYATRI VIDYA PARISHAD COLLEGE OF ENGINEERING; VISAKHAPATNAM
On the basis of Brad buers analysis for load transfer capacity of a single dowel bar in shear, bending and bearingin concrete are;
For shear in bar
P’=∏/4dpowe2*Fs---①
For bending in the bar,
P’=2dpower3Ft/Ld+8.8ȿ---❷
For bearing in concrete,
P’ = fb*Ld2*d/12.5(Ld*1.5ȿ)---③
Where,
P’=load carrying capacity of single dowel bars
d=diameter of the dowel bars in cm
Ld=total length of embankment of dowel bar in cm
ȿ=joint width in cm
Fs=permissible shear stress in dowel bar
Ft=permissible flexural stress in dowel bar
Fb=permissible bearing stress in concrete in kg/cm2
From 2 and3
Ld=5d[Ft/Fb*(Ld+1.5ȿ)/Ld+8.8ȿ)power1/2
Minimum length of dawal bar=Ld+8

Prepared By: V.M.Naidu; GAYATRI VIDYA PARISHAD COLLEGE OF ENGINEERING; VISAKHAPATNAM
Pr:
Design the size and spacing of doel bars at the expansion joints of a c.c pavement with radius of thickness 80cm for a design wheel load of 5000kg. assume load capacity of dowel system as 40%.design wheel load. joint width is 2cm.permissible shear and flexural stresses in the dowel bar are 1000 and 1400 kg/cm2 respectively and permissible bending stress = 100 kg/cm2.
Sol:
Given data:
P=5000kg
h=25cm
ȿ=2cm
Fs=1000kg/cm2
Ft=1400 kg/cm2
Fb=100 kg/cm2
Assume diameter of dowel bar = 2.5 cm
Ld=Ld=5d[Ft/Fb*(Ld+1.5ȿ)/Ld+8.8ȿ)power1/2=40.46cm
Length of dowel bar= Ld+ȿ=40.5+ȿ=42.5cm
Provide dowel bar 2.5 cm Ø of length 45 cms.
P’(shear)=area * shear strength
=∏/4 *dpower2*Fs=4908.7 cm.
Actual Ld=45-2=43 cm
P’(bending)=sdpower3*Ft/Ld+8.8ȿ=722kg
P’(bearing)=Fb.Ld2*d/12.5(Ld+1.5d)=804kg
P’(design) = 722 kg
Required load capacity factor:
Load capacity of dowel group = 40%of p=2000kg.
Requirements acapacity factor of dowel group=2.77
Spacing of dowel bars:
Effective distance upt which there is load transfer =1.8 l=144cm

Prepared By: V.M.Naidu; GAYATRI VIDYA PARISHAD COLLEGE OF ENGINEERING; VISAKHAPATNAM
Assume a trail spacing of 35cms between dowel bars
144/144-35=1/x=0.756
The capacity factor available for the group
=1+144.35/144+144-70/144+144-105/144+144-140/144=2.57
Assume spacing = 30 cms
The capacity factor avaliavle
=1+144-30/144+144-6-/144+144-90/144+144-120/144=2.97
Spacing of 30cm is adequate.
Provide 2.5 cm diameter dowel bars of total length 45cm at spacing of 30cm
DESIGN OF TIE BARS:
Diameter and spacing:
As.Ss=µN=b.1.h/100.w.f
As=bhW/100.Ss
Where,
As=area of steel permetrer length
b=distance between the joints and the necessary in meters
h=thickness of pavement
f=coeffice=ient of friction between pavement subbase
mn
mn

Prepared By: V.M.Naidu; GAYATRI VIDYA PARISHAD COLLEGE OF ENGINEERING; VISAKHAPATNAM
W=unit height of cement concrete un kg/m3
Ss=allowable working stress on tension for steel in kg/cm2
Diameter of the tie bar is in range of 0.8-1.5cm
Length of the tie bar:
As.Ss=Lt/2.p.Sb
Lt=2as.ss/p.sb
Lt=d/2.Ss/Sb
Where,
Lt/2=length of tie bar on side of the slab or half length of tie bars in cm.
Ss=allowable stress in tension in kg/cm2
Sb=allowable bond stress in concrete in kg/cm2
as=cross sectional area of one tie bar in cm2
p=perimeter of the tie bar in cm
d= diameter of bar in cm
prob:
a cement concrete pavement has a thickness of 18cm and has two lanes of 7.2m with a longitudinal joint along the centre line and spacing of tie bar using following data.
Allowable working stress in steel
Ss=1400 kg/cm2 and unit weight of concrete W=2400kg/m3
Coefficient of friction 1.5;allowable bond stress in deformed bars in concrete Sb=24.6kg/cm2
Sol;
Given,h=18cm,b=7.2/2=3.6cm,W=2400 kg/m3,f=1.5,Ss=1400 kg/cm2
As=bhWf/100Ss=1.67cm2/m length.
100� 1.67 cm2
….--> 0.784 cm2
Assume 1 cm dia bar = 0.784 cm2
Lt=d/2 .Ss/Sb

Prepared By: V.M.Naidu; GAYATRI VIDYA PARISHAD COLLEGE OF ENGINEERING; VISAKHAPATNAM
=28.45
The total length of the tie bar, Lt=30cms
Use 1 cm diameter tir bars of length 30 cms spacing of tie bar c/
C is 45 cm

Prepared By: V.M.Naidu; GAYATRI VIDYA PARISHAD COLLEGE OF ENGINEERING; VISAKHAPATNAM
UNIT-III
HIGHWAY CONSTRUCTION, MAINTANANCE AND DRAINAGE
Types of highway constructions:
i. Earth road and gravel road
ii. Soil stabilised roads
iii. Water bound macadam
iv. Bituminous or black top road
v. Cement concrete roads
vi. Construction of earth roads:
i. Material – soil surveys and conducted.
ii. Location
iii. Preparation of subgrade
a. Clearing of site.
b. Excavation and construction of fills to bring the road to desired grade.
c. Shaping the subgrade.
iv. Pavement construction
v. Opening to traffic should not allow the traffic immediately after the
construction
1. Construction of gravel roads:
i. Materials: gravel is used for construction of roads are staged along the
alignment at different places.
ii. Location:
iii. Preparation of subgrade:
iv. Pavement construction: aggregates are spread with greater thickness at
centre and less towards edge, to obtain the desired camber and then
compacted.

Prepared By: V.M.Naidu; GAYATRI VIDYA PARISHAD COLLEGE OF ENGINEERING; VISAKHAPATNAM
2. Construction of WBM roads:
i. Preparation of foundation for receiving the WBC couse
ii. provision of lateral confinement
iii. spreading of coarse aggregate
iv. rolling
v. application of screening
vi. sprinkling and grouting
vii. application of binding materials
viii. setting and drying
ix.
3. construction of bituminous pavements
i. preparation of existing surface
ii. application of track cost
iii. preparation and placing of premix
iv. rolling and finishing
v. surface finish
vi. opening to traffic

Prepared By: V.M.Naidu; GAYATRI VIDYA PARISHAD COLLEGE OF ENGINEERING; VISAKHAPATNAM
4. construction of cement concrete pavement;
i. preparation of subgrade and sub base.
ii. Placing of forms
iii. Batching of materials and mixing
iv. Transportation and placing of concrete
v. Compaction and finishing
vi. Floating and straight egde
vii. Arring of cement concrete.
Construction of joint in cement concrete pavement:
1. Transverse joints :
a. Expansion joint
b. Contraction joint
c. Warping joint
2. Longitudinal joint:
Requirements of good joint:
i. Joint must move freely
ii. Joint must not allow infiltration of rain water and ingress of stone grids
iii. Joint must not protrude out the general level of the slab.
EXPANSION JOINTS:
METAL CRP
SEALER FILLER

Prepared By: V.M.Naidu; GAYATRI VIDYA PARISHAD COLLEGE OF ENGINEERING; VISAKHAPATNAM
CONTRACTIO JOINTS:
SEALER
DOWEL BARS
DUMMY JOINTS:
LONGITUDINAL JOINTS:
PLAN BUTT JOINT
TIE BAR
BUTT JIOINT WITH TIE BAR

Prepared By: V.M.Naidu; GAYATRI VIDYA PARISHAD COLLEGE OF ENGINEERING; VISAKHAPATNAM
FLEXIBLE PAVEMENT FAILURES:
I. ALLIGATOR (MAP) CRACKING:
II. CONSOLIDATION OF PAVEMANT LAYER
III. SHEAR FAILURE CRACKING:
IV. LONGITUDINAL CRACKING:
TONGUE AND GROOVE WARPING JOINTS
FORMATION OF RUTS

Prepared By: V.M.Naidu; GAYATRI VIDYA PARISHAD COLLEGE OF ENGINEERING; VISAKHAPATNAM
V. FROST HEAVING:
VI. LACK OF BINDING WIDTH LAYER
VII.
Rigid pavement failures:
i. Scaling of cement concrete
ii. Shrinking cracks
iii. Spilling of joints
PAVEMENT WIDTH
LOSS OF

Prepared By: V.M.Naidu; GAYATRI VIDYA PARISHAD COLLEGE OF ENGINEERING; VISAKHAPATNAM
iv. Warping cracks
v. Mud pumping
vi. Structural cracks
Maintenance of highway:
1. Routine maintenance
i. Upkeep of carriage way
ii. Maintenance of shoulder and subgrade
iii. Maintenance of side drains
iv. Patch repairs of potholes
2. Period maintenance
3. Special repairs.
Strengthening of existing pavements
For the successful maintenance of pavement, it is essential to that they
have adequate stability to with stand design traffic.
Strengthening may be done by providing additional thickness to the
pavement.
Appling one or more layer over the existing pavement is called overlay.
Types of overlay:
1. Flexible overlay over flexible pavement
2. Rigid overlay over flexible pavement
3. Flexible overlay over cement concrete pavement
4. Rigid over lay over cement concrete pavement
Benkelmann beam deflection(BBD)

Prepared By: V.M.Naidu; GAYATRI VIDYA PARISHAD COLLEGE OF ENGINEERING; VISAKHAPATNAM
Benkelmann beam deflection, is used to estimate the overlay thickness
of the pavement.
a. If Di-Df<=2.5 division of dial gauge
D=2(Do-Df)=0.02(Do-Df)mm
b. If Di-Df>2.5 division
D=0.02(Do-Df)+0.0582(Di-Df)
b=€d/n,①=sqroot(€(D’-D)Sq/n-1
characteristics deflection, Dc is given by
Dc=D’+t①
if t=1;Dc=D’+① covers 84% of cases
if t=2;Dc=D’+2① covers 97.7% of cases
Importance of highway drainage:
• Surface water from carriage way and shoulder should effectively been
drainage off without allowing it to percolate subgrade.
• The surface water from adjoining land should be prevented from
entering the roadway
• Side drain should have sufficient capacity and longitudinal slope in
carrying all surface water collected.
• Flow of should water across the road and shoulders along the slopes
should not cause formation of cross ruts.
• Seepage and other sources of ground water should be drained off by
subgrade drainage system
• Highest level of ground water table should be kept well below the level
of subgrade preferably by atleast 1.2m
• In water logged areas, spectial precautions to be taken especially if salts
are present.
9
M

Prepared By: V.M.Naidu; GAYATRI VIDYA PARISHAD COLLEGE OF ENGINEERING; VISAKHAPATNAM
Surface drainage:
Collection of surface water
Design of surface drainage system
� Hydrological analysis
� Hydraulic design
Q=AV
V=1/n R power2/3S power1/2
Q=CiAd
C=A1C1+A2C2+A3C3………….+AnCn/A1+A2+A3+……An
Q=runoff
I=intensity of rainfall
C=runoff coefficient
Data for drainage system:
� Total length and width of land from where water is expected to flow
from where water is expected to flow from stretch of side drain.
� Run off coefficient of different types of surface in the drainage area.
� Distance from the farthest point in the drainage area to the inlet.
� Types of soil of the drain
� Rainfall data.
Cross drainage:
i. Pipe culvert
ii. Slab culvert
iii. Box culvert
iv. Arch culvert

Prepared By: V.M.Naidu; GAYATRI VIDYA PARISHAD COLLEGE OF ENGINEERING; VISAKHAPATNAM
Sub-surface drainage:
� Lowering of water table.
� Control of seepage flow
� Control of capillary rise.

Prepared By: V.M.Naidu; GAYATRI VIDYA PARISHAD COLLEGE OF ENGINEERING; VISAKHAPATNAM
HIGHWAY ECONOMIC & FINANCE
Better highway system provides varied benefits to the society.
HIGHWAY USER BENEFITS:
Quantifiable benefits:
i. Savings in vehicle operating cost ii. Savings in travel time of commercial vehicle iii. Savings in travel timeof passenger iv. Reduction in accident rate v. Increase in land value vi. Increase in employment opportunities
a. Savings in vehicle operating cost: i. Reduction in fuel and oil consumption ii. Reduction in wear and tear of tyres iii. Reduction in other maintenance cost.
b. Reduction in accident rate: i. Damage of vehicles ii. Injuries iii. Loss of human life iv. Delay of vehicles v. Cost of investigation vi. Legal proceedings
Non quantifiable benefits:
i. Reduction in fatigue ii. Reduction in discomforts iii. Improvement in general amenities iv. Social, educational aspects. v. Development of recreations vi. Improved mobility

Prepared By: V.M.Naidu; GAYATRI VIDYA PARISHAD COLLEGE OF ENGINEERING; VISAKHAPATNAM
vii. Aesthetic values.
HIGHWAY COSTS:
The total cost of each highway engineering improvement proposal is calculated from the following components:
i. Right of way ii. Grading , drainage and minor structures iii. Major structures like bridges. iv. Pavement and appurtenances v. Annual cost of maintenance and operation.
ANNUAL HIGHWAY COSTS:
i. Administration: personal service, building, equipment, operation, office, insurance etc.,
ii. Highway operation: equipment iii. Highway maintenance iv. Highway capital cost: Right of way, Grading, drainage and minor
structures, Major structures like bridges, traffic service, depreciation v. Probable life and salvage value at the end of this period.
The average annual highway cost for a road system is
Ca=H+T+M+Cr
Where, Ca= average annual cost of ownership and operation
H= average cost for administration and management at head quarters.
T = average annual highway operation cost
Cr = average annual capital cost of depreciation.
M= average annual highway maintenance cost
Cr=P(i(1+i)n/((1+i)n-1))=P(CRF)
Where, Cr= receipt in a uniform series for n period to cover p at a rate of interest ‘i’

Prepared By: V.M.Naidu; GAYATRI VIDYA PARISHAD COLLEGE OF ENGINEERING; VISAKHAPATNAM
P= first cost of improvement of an element of highway
i= rate of interest per unit period
h= period of time in number of interest periods
CRF=capital recovery factor=(i(1+i)n/((1+i)n-1))
Cr=(C-Vs)(i(1+i)n/((1+i)n-1)+iVs
Where , C= total investment in construction.
Vs=salvage value at the end of n years.
i= interest rate applicable
n= no. of years expected use of facility
Problem: calculate the annual cost of a stretch of highway from following particulars.
Item Total cost in lakhs Estimated life years
Rate of interest,%
Land 12.0 100 6 Earth work 9.0 40 8 Bridges & culverts
7.5 60 8
Pavement 14.0 15 10 Average annual cost of maintenance of the road is Rs.1.5 lakhs per year
Sol:
Annual cost Cr=P(i(1+i)n/((1+i)n-1))=P(CRF)i,n
Annual cost of land= 12(0.06(1+0.06)100/((1+0.06)100-1))=12(CRF)6%,100=0.72 lakhs
Annual cost of Earth work=9(0.08(1+0.08)40/((1+0.08)40-1)) = 9(CRF)8%,40=0.75 lakhs

Prepared By: V.M.Naidu; GAYATRI VIDYA PARISHAD COLLEGE OF ENGINEERING; VISAKHAPATNAM
Annual cost of Bridges & culverts=7.5(0.08(1+0.08)60/((1+0.08)60-1)) = 7.5(CRF)8%,60=0.6 lakhs
Annual cost of Pavement= 14.0(0.10(1+0.10)15/((1+0.10)15-1)) = 14.0(CRF)10%,15=1.84 lakhs
Average annual cost of maintenance of the road is Rs.1.5 lakhs
Total annual cost =Rs. 5.42 lakhs
Problem: compare the annual costs of 2 types of pavement structures.
i. WBM with thin bituminous surface at overall cost of 2.2 lakhs per km, life of 5 years, interest@ 10%, salvage value of Rs. 0.9 lakhs after 5 years annual average maintenance cost of Rs. 0.35 lakhs per km.
ii. Bituminous macadam base and bituminous concrete surface,at total cost of Rs. 4.2 lakhs, life of 15 years, interest@ 8%, salvage value of Rs. 2 lakhs after 15 years annual average maintenance cost of Rs. 0.25 lakhs per km.
Sol:Average annual cost taking salvage value into consideration
Cr=(C-Vs)(i(1+i)n/((1+i)n-1)+iVs+average annual highway maintenance cost, M
i.
Cr=(2.2-0.9) (0.1(1+0.1)5/((1+0.1)5-1)+(0.1x0.9)+0.35
=0.78294 lakhs
ii.
Cr=(4.2-2) (0.08(1+0.08)15/((1+0.08)15-1)+(0.08x2)+0.25
=0.66703 lakhs
Case ii is economical.Average annual cost of bituminous pavement is less than that of WBM. Bituminous pavement iseconomical.

Prepared By: V.M.Naidu; GAYATRI VIDYA PARISHAD COLLEGE OF ENGINEERING; VISAKHAPATNAM
ECONOMIC ANALYSIS:
This aims at determining the monetary benefits.
Analysis also helps to decide the most economical proposal among various alternatives.
Methods of analysis:
Analysis includes quantification of cost components and the benefits arising out of the project.
There are several methods for economic analysis; some of the common methods are:
i. Annual cost method, ii. Rate of return method, iii. Benefit cost ratio method.
a. Annual cost method: Annual cost Cr=P(i(1+i)n/((1+i)n-1))=P(CRF)i,n
b. Rate of return method: In this rate of return method, the interest rate at which two alternative solutions have equal annual costs is formed. If the rate of return of all proposal projects are known, then the priority for the improvement could be established. Road research laboratory (RRL), London has recommended as simplified procedure of rate of return method, the percentage of rate of return (R) is given by
R=(O+A-M)/P
Where, O= savings in annual road user cost .
A= annual savings in accident cost
M= additional maintenance cost per annum
P= capital cost of improvement

Prepared By: V.M.Naidu; GAYATRI VIDYA PARISHAD COLLEGE OF ENGINEERING; VISAKHAPATNAM
c. Benefit-cost ratio method: Principle- comparing annual benefits with the increase in annual cost. Benefit-cost ratio=(annual benefits from the improvement/annual cost of the improvement) =((R-R1)/(H1-H)) Where, R=total annual road user cost for the existing highway. R1=total annual road user cost for the proposal highway improvement. H=total annual cost of the existing road. H1=total annual cost for the proposal highwayimprovement. In order to justify the proposal improvement, the benefit cost ratio must be greater than one.
Problem:
It is proposed to widen a stretch of single lane road of length 40 km to two lanes at a total cost of 6.5 lakhs per km and the rate of interest 10% per year. The annual cost of maintenance of the existing single road is Rs. 7000 per km; and that of the improved two lane road is Rs. 9000 per km. the average vehicle operating cost on the existing road is Rs. 1.3 km/veh.km; and that on the improved is to be estimated that to be Rs. 1.15 km/veh.km; if the present traffic is 2000 motor vehicles per day and by the end of 15 years design period. The traffic is estimated to be doubled. Determine whether the investment on the improvement of the road is economically viable during the 15 years period.
Sol:
Average traffic during the design period=2000+4000/2 = 3000veh/day.
Average road user cost on existing road /year=1.3x3000x40x365=569.4 lakhs
Average road user cost on improved road /year=1.15x3000x40x365=503.7 lakhs
Total benefit= 569.4-503.7
=Rs. 65.7 lakhs
Total cost of improvement, P=6.5x40= 260 lakhs
(CRF)i=10%,n=15=(0.1(1+0.1)15/((1+0.1)15-1))

Prepared By: V.M.Naidu; GAYATRI VIDYA PARISHAD COLLEGE OF ENGINEERING; VISAKHAPATNAM
=0.131
Present annual cost of improvement, Cr=P x CRF
=260x0.131
=34.1 lakhs
Additional maintenance cost/year= Rs.(9000-7000)x40
=0.80 lakhs
Total cost =34.1+0.8=34.9 lakhs.
Benefit-cost ratio= benefit/cost=65.7/34.9= 1.88>1.0
Hence, proposed project is viable.
HIGHWAY FINANCE:
Principle: funds spent on highway are recovered from the road users.
This recovery is i. direct, ii. indirect
Two general methods of highway financing are
i. Pay- as-you- go method ii. Credit financing method
In pay-as-you-go method, highway improvements and maintenance and operation is made from the central revenue.
In credit financing method, the payment of highway improvement is made from borrowed money. This amount and interest are repaid from the future income.
Distribution of highway:
In India, annual revenue is much greater than expenditure of road development and maintenance.

Prepared By: V.M.Naidu; GAYATRI VIDYA PARISHAD COLLEGE OF ENGINEERING; VISAKHAPATNAM
In India, taxation being considered separately by states and there is no theory followed for distribution of taxes between various classes of vehicles.
SOURCES OF REVENUE:
i. Taxes on motor fuel and lubricants. ii. Duties and taxes on new vehicle and spare parts including tyres. iii. Vehicle registration tax. iv. Special taxes on commercial vehicles. v. Other road user taxes. vi. Property taxes. vii. Toll taxes. viii. Other funds set apart for highways.
HIGHWAY FINANCING IN INDIA:
Financing responsibilities:
• Central government
• State government • Local bodies, including municipalities, panchayats.
Revenue for central government for highway financing are:
i. Duties and taxes on motor fuel. ii. Excise duty on vehicles, spare parts, tyres etc., iii. Excise duty on oils, grease etc.,
Revenue for state government for highway financing
i. Registration fees for vehicles and road tax. ii. Permits for transport vehicles. iii. Passenger tax for buses. iv. Sales tax on the vehicle parts, tyres etc., v. Fees for driving license.
Revenue for local bodies for highway financing are

Prepared By: V.M.Naidu; GAYATRI VIDYA PARISHAD COLLEGE OF ENGINEERING; VISAKHAPATNAM
i. Property tax ii. Toll tax.

Prepared By: V.M.Naidu; GAYATRI VIDYA PARISHAD COLLEGE OF ENGINEERING; VISAKHAPATNAM
RAILWAY ENGINEERING –I
PERMANENT WAY :
The combination of rails fitted on sleepers and resting on ballast and The combination of rails fitted on sleepers and resting on ballast and The combination of rails fitted on sleepers and resting on ballast and The combination of rails fitted on sleepers and resting on ballast and
subsubsubsubgrade is called the permanent way or railway track.grade is called the permanent way or railway track.grade is called the permanent way or railway track.grade is called the permanent way or railway track.
Sometimes, temporary tracks are laid for conveyance Sometimes, temporary tracks are laid for conveyance Sometimes, temporary tracks are laid for conveyance Sometimes, temporary tracks are laid for conveyance
of earth and materials on construction work. The name permanent way is of earth and materials on construction work. The name permanent way is of earth and materials on construction work. The name permanent way is of earth and materials on construction work. The name permanent way is
given to distinguish the final lay out from thegiven to distinguish the final lay out from thegiven to distinguish the final lay out from thegiven to distinguish the final lay out from these temporary tracks.se temporary tracks.se temporary tracks.se temporary tracks.
TYPICAL CROSS-SECTION OF A PERMANENT WAY ON EMBANKMENT.
Ballast cushion
Rails
Guage
Formation width
Ballast shoulder
s l e e p e r
1.5:1 1.5:1
G.L

Prepared By: V.M.Naidu; GAYATRI VIDYA PARISHAD COLLEGE OF ENGINEERING; VISAKHAPATNAM
In a permanent way, the rails are joined in series by fish plates and bolts and then they are fixed to sleepers by different types of fastening. The sleepers are properly spaced, resting on ballast are suitably packed and boxed with ballast.
The layer of ballast rests on prepared subgrade called the formation.
Wheel load
Rail
Sleeper
Ballast
Formation

Prepared By: V.M.Naidu; GAYATRI VIDYA PARISHAD COLLEGE OF ENGINEERING; VISAKHAPATNAM
REQUIREMENTS OF IDEAL PERMENENT WAY :
• Semi-elastic in nature. • Due to moving loads there is a chance of disturbance of permanent way.so, it
needs to constructed and maintained for higher speeds.
I. The gauges should be correct and uniform. II. The rails should be in proper level. on straight track , rails should be at same
level . on curved portions , outer rail should be at higher level. III. The alignment should be correct i.e.,it should be free from Kinks (or)
irregularities. IV. The gradient should be uniform and any change in gradient should be
followed by smooth vertical curve. V. The track should have some elasticity.
VI. The track should have enough lateral strength. VII. The radii and superelevation on curves should be properly designed and
maintained. VIII. Drainage system must be perfect.
IX. Joints, which are regarded to be weakest points of the railway track, should be properly designed and maintained.
X. If there is trouble from creep, the precaution should be taken to prevent it. XI. All the components of track should fulfil their requirements.
XII. There should be adequate provision for easy renewals and replacements.
TRACK CAPACITY :
It is the hourly capacity of the track to handle the trains safely.

Prepared By: V.M.Naidu; GAYATRI VIDYA PARISHAD COLLEGE OF ENGINEERING; VISAKHAPATNAM
Track capacity can be increased by the following two factors.
I. By achieving faster movements of trains on track. II. By decreasing the distance between successive trains.
Measures to overcome the track capacity are
i. Trains should run at same speed for which uniformity of gauges and traction should first be achieved.
ii. Multi-aspect signals should be adopted
Red danger
Yellow caution
Double yellow attention
Green clear
iii. Speed of train should be increased by use of diesel (or) elastic traction.
iv. Speed can be increased by suitable improvements in existing tracks of stoppage of trains.
v. A reduction in time of stoppages of trains. vi. New lines should be constructed for operational and industrial
purposes. vii. Additional operational facilities in the station yard should be
provided. viii. Provisions of proper signal controlling i.e.,electronic system. ix. The traffic control on B.G and M.G should be centralised. x. Safety measures should be taken such as telecommunication facilities.
GAUGES IN RAILWAY TRACK:
It is the clear distance between inner or running faces of two track rails.

Prepared By: V.M.Naidu; GAYATRI VIDYA PARISHAD COLLEGE OF ENGINEERING; VISAKHAPATNAM
The distance between the inner faces of a pair of wheels is called the WHEEL GAUGE.
At present, in India the existing gauges are: Gauge width
i. Broad Gauge(B.G) 1.676m ii. Meter Gauge(M.G) 1.0m iii. Narrow Gauge(N.G) 0.762m iv. Feeder track Gauge or Light Gauge(L.G)0.616m
SELECTION OF GAUGE:
Factors governing the choice of gauge
i. Cost of construction:
Cost is more for wider gauges i.e.,(B.G)
a. Cost of bridges, tunnels. b. Cost of earthwork, ballast, sleeper etc., c. Little increase in acquisition.
ii. Volume and nature of traffic :
Wider gauges are required for heavier loads and heavier speeds.
iii. Development of areas: Narrow gauges can be used to develop the thinly populated areas by joining the poor developed areas with urban areas.
iv. Physical features of the country: Use of narrow gauge is warranted in hilly regions, where broad and meter gauges are not possible due to steep gradients and sharp curves. In plain regions also, where high speed is not required and the traffic is light, N.G is correct choice.
v. Speed of movement:

Prepared By: V.M.Naidu; GAYATRI VIDYA PARISHAD COLLEGE OF ENGINEERING; VISAKHAPATNAM
Speed of a train is almost proportional to the gauge. Speed = f (wheel diameter) = f (gauge) {wheel diameter = 0.75times gauge} Lower speeds discourage the customers, so for maintaining high speeds, Broad gauges are preferred.
UNIFORMITY OF GAUGE: Gauge to be used in a particular country should be uniform. Uniformity has following advantages:
• The delay, cost and hardship in transhipping passengers and goods from vehicle of one gauge to another.
• As transhipping is not required, there is no damage of goods. • Difficulties in loading and unloading are avoided and labour expenses are
saved. • Possibility of thefts and misplacements, while changing from one vehicle to
another, is eliminated. • Large sheds to store goods are not required.
• Labour strikes do not affect the service. • Surplus wagons of one gauge cannot be used on another gauge. This
problem will not arise if gauge is uniform.
CONING OF WHEELS: The distance between the inside edges of wheel flanges is generally kept less than the gauge. So, there is a gap between the flanges and running edges of the rail nearly equal to 1cm on either side. wheels are generally coned at a slope of 1 in 20.

Prepared By: V.M.Naidu; GAYATRI VIDYA PARISHAD COLLEGE OF ENGINEERING; VISAKHAPATNAM
The advantages of coning the wheels are:
i. To reduce the wear and tear of the wheel flanges and rails. ii. To provide a possibility of lateral movement of axle with its wheels. iii. To prevent the wheels from slipping to some extent.
RAIL:
• It can be considered as steel girder carrying axle loads.
• They are made of high carbon steel to withstand wear and tear. • Flat footed rails are mostly used in railway track.
Functions of rails: • Rails provide a hard, smooth and unchanging surface for passage of heavy
moving loads. • It offers minimum friction between the steel rails and steel wheels. • Rails bear the stresses due to heavy vertical load and thermal stresses. • Rail material is such that it gives minimum wear to avoid replacements.
• Rails transmit load to sleeper. Composition of rail steel: Carbon (C) ---------------- 0.55-0.68% Manganese (Mn) -------- 0.65-0.9% Silicon (Si) --------------- 0.05-0.3% Sulphur (S) --------------- <= 0.05% Phosphorous (P) --------- <=0.05% Requirements of rails:
• They should be of proper composition and should be manufactured by open hearth or duplex process.
• The vertical stiffness should be high enough to transmit the load to several sleepers underneath. The height of rail should be adequate.
• Rails should be capable of withstanding lateral forces. • The head must be sufficiently deep to allow for an adequate margin of
vertical wear. • Web should be adequately thick to bear the load coming on to it. • Foot should be wide enough so that rails are stable against overturning.

Prepared By: V.M.Naidu; GAYATRI VIDYA PARISHAD COLLEGE OF ENGINEERING; VISAKHAPATNAM
• Relative distribution of material in head, web and foot of rail must be balanced.
• Centre of gravity of rail must lie approximately at mid height so that maximum tensile and compressive stresses are equal.
• The tensile strength of the rail piece should not be less than 72 kg/mm2. Types of rail sections:
i. Double headed rails (D.H) ii. Bull headed rails (B.H) iii. Flat footed rails (F.F)
Comparison of rail types:
S.No Point of comparison Flat footed rails Bull headed and double headed rails
1. Strength and stiffness More Less 2. Laying and relaying Easily laid Difficult 3. Arrangements at points,
crossings, sharp curves simpler complicated
4. Initial cost and maintenance cost
less More
5. Rigidity More rigid Less rigid 6. Daily Inspection Not necessary Necessary 7. Replacement of rails Difficult Easier
SELECTION OF RAILS:
It is designated by weight/length.
Factors to be considered in deciding the weight of rail to be used:
• Speed of the train. • The gauge of the truck.
• The axle load and the nature of traffic. • Type of rails i.e., D.H, B.H and F.F rails. • Spacing of sleepers or sleeper density.

Prepared By: V.M.Naidu; GAYATRI VIDYA PARISHAD COLLEGE OF ENGINEERING; VISAKHAPATNAM
• Maximum permissible wear on top of rails.(5% of weight of rail is allowed).
Heavy rails are preferred to light rails: • From maintenance point of view, it is desirable to provide heavier rail
section with bigger span between sleepers. • Cost of rail varies with its depth.
Modulus of section measure of strength (depth)2
Stiffness (depth)1.5 • Deflection is less for heavier rail than lighter rail.
• Lower deflection needs lesser pulling power.
CORRUGATED OR ROARING RAILS: In certain places heads of rails are found to be corrugated rather than straight ones. This causes unpleasant sound. Corrugation consists of minute depressions on the surface of the rails. These are created usually at places where brakes applied or train start. Their shape and size is not definite and occur at regular intervals.
a. Some peculiarities of corrugated rail: i. Corrugations develop in any part of the rail and the whole rail gets
corrugated in short time. ii. These occur at any gradient and on any track. iii. When corrugated rails are relaid in other section,the corrugations
sometimes get smoothened. iv. When the new rails are laid where corrugation is prevalent, the
new rails get corrugated. v. Rails carrying empty trains are easily corrugated than rails carrying
loaded trains. b. Conditions for developing corrugations:
i. Where ballast consists of broken bricks. ii. Where brakes are applied to trains for stopping them. iii. Where trains start. iv. Corrugations along the track, in case of long tunnels.
c. Theory of corrugation:

Prepared By: V.M.Naidu; GAYATRI VIDYA PARISHAD COLLEGE OF ENGINEERING; VISAKHAPATNAM
Some explains, corrugations are due to excess of phosphorous in the composition of rail steel.
d. Remedial measures: In Germany, corrugations are removed by grinding a few thousands of a millimetre off the rail heads. For this, grinding trains are used which move 3kmph when the grinders are in action.
HOGGED RAILS: Rails deflected at ends, These are called hogged rails. Measures for hogging:
i. cropping: cut off hogged portion at workshop or site. ii. Replacing: hogged rails are completely removed and new rails are
laid.
iii. Welding: hogged rails are brought to level by welding the worn out. iv. De hogging: straightening by means of jrim crow or de hogging
machine KINKS IN RAILS: When the ends of adjoining rails move slightly out of position. Causes of formation of kinks:
i. Loose packing at joints. ii. Defect in gauge and alignment. iii. Defect in cross level at joints. iv. Uneven wear of rail head.
Kinks produce following undesirable effects: i. These kinks cause unpleasant jerks in vehicles passing over them. ii. Series of kinks are seen at curves due to which defect in gauge alignment
and camber may occur. This involves sometimes a serious risk in turning operation.
Measures to remove kinks:

Prepared By: V.M.Naidu; GAYATRI VIDYA PARISHAD COLLEGE OF ENGINEERING; VISAKHAPATNAM
i. Correct alignment of joints and curves. ii. Proper packing at joints. iii. Proper maintenance of the track periodically.
BUCKLING OF RAILS:
It means the track has gone out of its original position or alignment due to prevention of expansion of rails in hot weather.
Causes of buckling:
i. When expansion gap is not sufficient, the force of expansion throws the track out of position.
ii. Fish plates being bolted so tight, that it does not allow to slip or expand. iii. Due to welded rails on weak track.
Buckling leads to derailment.
Measures of buckling:
i. The ballast section, sleeper density and rail sections must be redesigned. ii. Number of welded rails should not be very large. iii. Provision of steel sleeper or anchoring of welded rails should be done. iv. Proper lubrication of contact surfaces of fish plate and rails at regular
intervals (once in a year or 2 years)is necessary. v. Expansion gap should take into account of the expansion of rails due to
raise in temperature in that region. vi. The fish bolts should not be tightened so much.
RAIL FAILURES:

Prepared By: V.M.Naidu; GAYATRI VIDYA PARISHAD COLLEGE OF ENGINEERING; VISAKHAPATNAM
WEAR ON RAILS:
One of the prominent defects of rails.
Classification of wear:
a. On the basis of location: i. On sharp curves. ii. On gradients. iii. On approaches to the station. iv. In tunnels –
Where sand is used on rails to produce more friction on damp rails but on contrary it gives wear. The gases coming out of engine attacks rails results wear.
v. In coastal areas, due to action of sea breeze. vi. On weak foundations –
sinking of rails due to heavy loads gives uneven surface which results in wear.
b. On the basis of position of wear: i. Wear on top or head of rail. ii. Wear at the ends of rail. iii. Wear on the sides of head.
Methods to reduce wear: i. When the wear exceeds prescribed limit, the rail must be replaced. ii. Use of special alloy steel. iii. Regular tightening of fish bolts and packing of ballast. iv. Reduction in number of joints. v. Welding or de hogging of battered ends at proper time.

Prepared By: V.M.Naidu; GAYATRI VIDYA PARISHAD COLLEGE OF ENGINEERING; VISAKHAPATNAM
vi. Maintenance of track. vii. Maintenance of correct gauge. viii. Correct adzing or use of bearing plates. ix. Lubricating the gauge face of outer rail on curve. x. Interchanging inner and outer rails. xi. At curves, the check rails parallel to the inner rails can be introduced to
check wear.
xii. Application of heavy mineral oil in case of corrosion of rail metal under adverse atmospheric condition.
SLEEPERS:
Sleepers are members generally laid transverse to the rails, on which rails are supported.
Functions of railway sleepers:
i. To hold the rails to proper gauge. ii. To hold the rails in proper level. iii. To interpose elastic medium between rail and ballast. iv. To distribute the load from rail to ballast. v. Sleepers also add to the general stability of permanent track.
Requirements of sleepers:
i. Sleepers to be used should be economical. ii. Fittings should be such that they adjusted easily during maintenance. iii. Weight of sleeper should not too heavy and too light, should be
moderate. iv. Design of sleeper should be such that it can be easily maintained. v. Bearing area should be enough such that it should not crush rail bottom
and ballast.

Prepared By: V.M.Naidu; GAYATRI VIDYA PARISHAD COLLEGE OF ENGINEERING; VISAKHAPATNAM
vi. Sleeper design and spacing should be such that it facilitates easy removal and replacement of ballast.
vii. Sleepers should resist shocks and vibrations. viii. Design sleeper such that they are not damaged during packing. ix. Through sleeper, insulation from rails are possible. x. Design of sleepers should be such that they are not pushed out easily due
to moving trains. Classification of sleepers:
1. Wooden sleepers 2. Metal sleepers
a. cast iron sleepers b. steel sleepers
3. Concrete sleepers a. Reinforced concrete sleepers b. Pre stressed concrete sleepers
Timber or Wooden sleepers:
• Advantages: i. Timber is easily available in all parts of India. ii. Fittings are few and simple. iii. These sleepers are able to resist shock and vibration. iv. These are suitable for all types of ballast. v. These are economical.
• Disadvantages : i. These are subjected to wear, decay, attack by white ants. ii. It is difficult to maintain the gauge in case of wooden sleeper. iii. Track is easily disturbed. iv. Wooden sleepers have got minimum life as compared to other type. v. Maintenance cost is more.
Types of timber for sleepers: i. Hard wood such as sal, teak. ii. Soft wood such as chir, deodar.
Treatment of wooden sleepers: Treatment improves life by 30% - 50%.

Prepared By: V.M.Naidu; GAYATRI VIDYA PARISHAD COLLEGE OF ENGINEERING; VISAKHAPATNAM
Treatment removal of juices in minute cells and filling up with preserving solutions (salt solution Zncl2, Hgcl2 or oil ). Cross section of wooden sleeper: Standard dimensions for sleeper:
Gauge Length Width Depth Bearing area per sleeper
B.G 250cm 25cm 12.5cm 0.465 M.G 180 20 11.25 0.31 N.G 150 17.5 11.25 0.21
Metal sleepers : Requirements :
i. They should bear tensile and compressive stresses. ii. They should provide sufficient area for rails.
iii. Tamping and packing of ballast should not disturb the sleeper. iv. Metal sleepers should be over-all economical. v. Design of sleepers is such that it is easy to fix.
vi. They should provide sufficient grip on rails.
Advantages
1. They are uniform in strength and duration.

Prepared By: V.M.Naidu; GAYATRI VIDYA PARISHAD COLLEGE OF ENGINEERING; VISAKHAPATNAM
2. Their performance of fitting is better.
3 .Metal sleepers are economical as life is longer. 4. Guage can be easily adjusted and maintained.
Disadvantages :
i. More ballast is required than other types of sleeper. ii. Fitting are greater in numbers.
iii. Metal are liable to rust. iv. Metal being good conductor of electricity interferes with track
circuiting. v. Metal sleepers are unsuitable for bridges, level crossings,points.
vi. These are only suitable for stone ballast.
Concrete sleepers :
1.Reinforced concrete sleepers.
2.pre-stressed concrete sleepers.
Advantages :
i. These are free from natural decay and attacks by insects. ii. They have maximum life compared to other sleepers.
iii. This is not affected by moisture, chemical action of ballast. iv. High weight of sleepers helps in minimising joints maintenance. v. They have higher elastic modulus and hence can withstand the stresses.
Disadvantages :
i. Weight is high (wt =2.5-3 times wooden sleeper). ii. These require pads and plugs for spikes.
iii. They damage the bottom edges during packing. iv. The scrap value is almost nil.
Pre stressed concrete sleepers :
Eliminates disadvantages of reinforced concrete sleepers.

Prepared By: V.M.Naidu; GAYATRI VIDYA PARISHAD COLLEGE OF ENGINEERING; VISAKHAPATNAM
Disadvantages :
i. These are heavily damaged in case of derailment. ii. The bed of ballast is specially prepared.
iii. These are uneconomical. iv. Standard of maintenance kept high. v. The design and maintenance is complicated.
Spacing of sleepers and sleeper density :
The space between two adjacent sleepers determines the effective span of the rail over the sleepers.
Spacing is directly propotional to axle load.
More the sleepers more lateral stability.
Sleepers cannot be increased indefinitely as a certain minimum space between sleepers is required for packing of ballast.
In India, minimum distance is 30.5 cm—35.5 cm
In America, minimum distance is 25 cm.
In India number of sleepers per rail varies from n+3 to n+6.
In Britain number of sleepers per rail varies from n+4.
In America, number of sleepers varies from n+9to n+11.
S.NO POINT OF COMPARISION
WOODEN SLEEPERS
METAL SLEEPER
CONCRETE SLEEPERS
1. Cost Low High Depends on design 2. Life 12-15 yr 35-50 yr 40-60 yr 3. Wt/sleeper 54kg 100 kg Depends on design 4. Maintenance
cost Higher Minimum Moderate
5. Handling Not liable to break
Not liable to break
Not liable to break
6. Track fitting Less More Less

Prepared By: V.M.Naidu; GAYATRI VIDYA PARISHAD COLLEGE OF ENGINEERING; VISAKHAPATNAM
7. Elasticity Good Not so good
Not so good
8. Laying and relaying
Easy Different Difficult
9. Scrap value Very little Highest Nil 10. Renewal Easy Difficult Difficult 11. Gauge
adjustments Difficult Easy Easy
Factors governing sleeper density:
• Axle load and speed. • Type and section of rails.
• Type of ballast and ballast cushion.
• Type of sleeper.
Eg:- Find out the expression for sleeper density for a B.G. track if 19 sleepers are used under a rail length. Sol :- Length of rail for B.G track = 12.8m Sleeper density = n+x n = length of rail in metre x=a factor 19 = 12.8(say 13) + x x = 6 The expression for sleeper density is n+6. Eg : using the sleeper density of n+5 , find out the no of sleepers required for constructing a railway track 640 m long. Sol : length of each rail on B.G track = 12.8 m. Total no of rails required will be = 640/12.8 =50 rails. As sleeper density is n+5. No of sleepers under each rail = n+5. = 12.8 +5 =17.8 (say 18).

Prepared By: V.M.Naidu; GAYATRI VIDYA PARISHAD COLLEGE OF ENGINEERING; VISAKHAPATNAM
Total no of sleepers required will be =50*18 = 900 sleepers. BALLAST: It provides a suitable foundation for the sleepers and also holds the sleepers in correct position. Functions of ballast:
i. It transfers the load from the sleeper to the sub-grade and distributes it uniformly.
ii. It holds the sleepers in position and prevents the lateral and longitudinal movement.
iii. It imparts some degree of elasticity. iv. It provides easy means for correcting track alignment. v. It provides good drained foundation.
Requirements of good ballast:
i. It should be able to with stand hard packing without dis integrating.
ii. It shouldn’t make the track dusty. iii. It should allow easy drainage. iv. It should have resistance to abrasion and weathering. v. It should retain its position laterally and longitudinally. vi. It shouldn’t have any chemical action on rail and metal sleepers. vii. It should be of size 5cm for wooden sleepers.
4cm for metal sleepers
2.5cm for turnouts and cross outs.
viii. The material should be easily workable.

Prepared By: V.M.Naidu; GAYATRI VIDYA PARISHAD COLLEGE OF ENGINEERING; VISAKHAPATNAM
ix . The ballast should be available near by quarries, so that it reduces the cost.
Types of ballast:
i. Broken stone. ii. River pebble. iii. Cinder. iv. Sand. v. Moorum. vi. Kankar. vii. Brick ballast.
Minimum depth of ballast section: Lines of equal pressure are in the shape of bulb but, for Simplicity purpose the load dispersion can be assumed at 450
to the vertical.
Sleeper spacing, s = width of sleeper (w) + 2*depth of ballast.
s = w+2*Db
Db= (s-w)/2

Prepared By: V.M.Naidu; GAYATRI VIDYA PARISHAD COLLEGE OF ENGINEERING; VISAKHAPATNAM
Details of ballast section:
Dimensions B.G M.G N.G i. Width of
ballast 3.35m 2.25m 1.83m
ii. Depth of ballast
20-25cm 15-20cm 15cm
iii. Quantity /unit length
1.036m3 0.071m3 0.053m3
RAIL FASTENING:
These are used to keep the rails in proper position.
Types:
1. Fish plates 2. Spikes
i. Dog spike ii. Screw spike iii. Round spike iv. Standard spike v. Elastic spike
3. Bolt i. Dog or hook bolt ii. Fish bolt iii. Rag bolt iv. Fang nut and bolt
4. Chairs i. Cast steel chairs ii. Mild steel and cast iron slide chairs

Prepared By: V.M.Naidu; GAYATRI VIDYA PARISHAD COLLEGE OF ENGINEERING; VISAKHAPATNAM
5. Blocks i. Heel blocks ii. Distance blocks iii. Crossing blocks iv. Check blocks
6. Keys i. Wooden key ii. M.S.key iii. Stuart key iv. Morgan key
7. Plates i. Bearing plates ii. Saddle plates.
FISH PLATES: These plates used in rail joints to maintain the continuity of rails. Requirements:
i. They must support the underside of the rail and top of the foot.
ii. They should allow a free movement of rails for expansion and contraction.
iii. They must bear the stresses due to lateral and vertical bending.
iv. They should hold the ends of rail both laterally in line and vertically in level.

Prepared By: V.M.Naidu; GAYATRI VIDYA PARISHAD COLLEGE OF ENGINEERING; VISAKHAPATNAM
Failures of fish plate: i. Abrasion on top of fish-plate. ii. Reversal of stresses due to large length. iii. Cracking along the section.
SPIKES: Characters of good spike:
i. Spike should be strong enough to hold the rail in position. ii. It should be as deep as possible. iii. It should be easy in fitting and removal. iv. It should properly maintain the gauge.

Prepared By: V.M.Naidu; GAYATRI VIDYA PARISHAD COLLEGE OF ENGINEERING; VISAKHAPATNAM
CREEP OF RAILS: It is the longitudinal movement of rails in a track. Theory of creep:
1. Wave action or Wave theory:
• Rail deflection is the chief cause of creep. • Pitch and depth of wave depend upon
i. Track modulus ii. Stiffness iii. Stability
Wave action can be reduced by i. Angular and heavy ballast ii. Increase stiffness of track iii. Lesser sleeper spacing iv. Bigger section of rail.
2. Percussion theory: • This theory states that the creep is due to impact of wheels at rail
end ahead at joints.

Prepared By: V.M.Naidu; GAYATRI VIDYA PARISHAD COLLEGE OF ENGINEERING; VISAKHAPATNAM
• Horizontal component , P tend to creep
• Vertical component tend to bend the rail vertically. • P , pushes forward rail resulting in creep
• Though the creep is small for single wheel. But, cumulative effect of no. of wheels in quick succession gives sufficient creep.
Creep by this theory will increase due to following factors: i. Due to weak and loose fish bolt ii. Due to worn out fish plate iii. Due to loose packing at joints iv. Due to wide expansion gap v. Due to heavy axle loads moving at fast speed.
3. Drag theory: Backward thrust on driving wheel loads to creep.
4. Starting ,accelerating ,slowing down or stopping of a train: Starting, accelerating leads to backward movement of rail leads to creep. Slowing down, stopping of a train leads to forward movement of rail leads due to creep.
5. Expansion or contraction of rails due to temperature: Creep also occurs due to variation in temperature.
ADZING OF SLEEPERS:
• To provide a cant of 1 in 20 in the rails, wooden sleepers have to cut this slope at rail seat.
• The process of cutting the wooden sleeper at 1 in 20 slope is known as Adzing of sleepers.

Prepared By: V.M.Naidu; GAYATRI VIDYA PARISHAD COLLEGE OF ENGINEERING; VISAKHAPATNAM
Railway engineering – II
Rail joints :
• These are to hold the adjoining ends of rails correct two rail
position.
• Rail joints is weakest part of tracks.
• Strength of rail joint = 50% of strength of a rail.
Requirements of an ideal joints :
i. The two rail ends should remain true in line laterally and vertically.
ii. Rail joints should be as strong and stiff as the rail itself.
iii. Rail joints should provide enough space for free expansion and contraction
due to temperature variations.
iv. A good joint should be easily disconnectable.
v. It should not allow the rail ends to get battered.
vi. It should have minimum initial and maintenance cost.
Types of rail joints :
i. Supported rail joints

Prepared By: V.M.Naidu; GAYATRI VIDYA PARISHAD COLLEGE OF ENGINEERING; VISAKHAPATNAM
ii. Suspended rail joint
iii. Bridge joint
iv. Base joint
v. Welded joint
vi. Staggered or broken joint

Prepared By: V.M.Naidu; GAYATRI VIDYA PARISHAD COLLEGE OF ENGINEERING; VISAKHAPATNAM
vii. Square or even joint
viii. Compromise joint
• Two different sections are joined
ix. Insulted joint
• When insulting medium is inserted in rail joint to stop the flow of
current.
x. Expansion joint
• Provision of gap for expansion and contraction.
Joints should be avoided at following places :

Prepared By: V.M.Naidu; GAYATRI VIDYA PARISHAD COLLEGE OF ENGINEERING; VISAKHAPATNAM
i. At level crossing.
ii. On short bridge spans.
iii. On approaches of bridges.
iv. At ends (or) centre of span of long bridges.
Welding of rails :
Purpose of welding :
i. It increases the life and reduces maintenance cost.
ii. It reduces the creep as length of rail increases.
iii. Expansion effect due to temperature is also reduced.
iv. The discontinuing is sign of weakness, which is reduced in welding.
v. Long rail reduces the intensity of vibrations.
vi. Welding increase the life of rails due to decrease in wear.
vii. Welding facilitates track circuiting on electrified tracks.
viii. Welded rails on long bridges is good.
ix. Cost of track construction may be reduced due to less no of rail joints.
Methods of welding of rails :
1. Electric are welding.
2. Oxy acetelene welding.
3. Flash butt welding.

Prepared By: V.M.Naidu; GAYATRI VIDYA PARISHAD COLLEGE OF ENGINEERING; VISAKHAPATNAM
4. Chemical welding.
Length of welded rails :
Increase in length due to expansion, δl = l *α *t
Turn outs :
It is the simplest combination of points and crossings which enables one track
either a branch line (or) a siding to take off another track.
Following are parts of a turnout :
i. A pair of points (or) switches.
ii. A pair of stock rails.
iii. A vee crossing.
iv. Two check rails.
v. Four lead rails.
vi. Switch tie plate.

Prepared By: V.M.Naidu; GAYATRI VIDYA PARISHAD COLLEGE OF ENGINEERING; VISAKHAPATNAM
vii. Studs or stops.
viii. Bearing plates.
ix. Rods, cranks.
x. For lacking system – locking box.
Line diagram of right-hand turn out
LINE DIAGRAM OF RIGHT – HAND TURNOUT

Prepared By: V.M.Naidu; GAYATRI VIDYA PARISHAD COLLEGE OF ENGINEERING; VISAKHAPATNAM
• If a train from main is diverted to the right of route in the facing
direction is known as right – hand turnout.
• If a train from main track is diverted to the left of the main route in the
facing direction, then the diversion is left – hand turnout.
Working principle of a turnout :
• Turnout provides facilities for safe turning of vehicles from one track to
another.
• One turnout facilitates turning of vehicles from one direction only but not
from both the directions as in the case of roads.
• Turnout works with the combination of points and crossings.
Turnout consists of
i. A pair of points (or) switches (ABCD and EFPQ).
ii. Four load rails ( 2 –straight and 2 – curved load rails)
iii. Two check rails.
iv. A crossing (GHIJ).
A PAIR OF SWITCHES :
• Each consists of a tongue rail and stock rail.
• Tongue rail is tapped having toe at one end and heel at other end.
• This is fixed to regular alignment and can be moved about this point.
• ‘f ‘ position ->train moves straight. ‘L ‘ position -> train moves branch (or) siding track.
A crossing (one-piece) :
GHIJ
POINTS (OR) SWITCHES :
• It consists of a stock rail and a tongue rail.

Prepared By: V.M.Naidu; GAYATRI VIDYA PARISHAD COLLEGE OF ENGINEERING; VISAKHAPATNAM
• These are tapered rails with the thicker end known as toe movable by
means of which the flanged wheels of the train are diverted from one route
to another.
The various component parts of switches are :
i. A pair of stock rails.
ii. A pair of tongue rails.
iii. Heel block (or) distance block.
iv. Stretches bars.
A pair of stock rails :
They are the main rails of the track to which the tongue rails fit closely against
them.
A pair of tongue rails :
• These rails lie between the two stock rails and are tapered to point.
• Pair of tongue rails are connected by stretcher bars near the toe switch.

Prepared By: V.M.Naidu; GAYATRI VIDYA PARISHAD COLLEGE OF ENGINEERING; VISAKHAPATNAM
Heel block (or) distance block :
• These blocks are inserted between the heel of tongue rail and stock rail.
Stretches bars :
The toes of both the tongue rails are connected together by means of stretches
bars.
Types of switches :
• Stub switch
• Split switch->
i. Loose heel type.
ii. Fixed heel type.
iii. Under cut switches.
iv. Under riding switches.
v. Straight cut switches.
Crossings:
It is a device which provides two flangeways through which wheels of the flange
may move, when two rails interest each other at an angle.
Component parts of crossing :
i. A crossing or vee piece.
ii. Point and splice rails.
iii. Wing rails.
iv. Cheek rails.
v. Chairs at crossing, at toe and at heel.
Requirements and characteristics of a good crossing :
i. The assembly of a crossing has to be rigid to stand against severe
vibrations.
ii. Nose should be protected against wear.

Prepared By: V.M.Naidu; GAYATRI VIDYA PARISHAD COLLEGE OF ENGINEERING; VISAKHAPATNAM
iii. A shot crossing body has a tendency to rock due to heavy load at end lifting
of unloaded end.
iv. The nose of crossing should have same thickness.
Types of crossings :
On the basis of shape of crossing
i. Acute angle crossing.
u; GAYATRI VIDYA PARISHAD COLLEGE OF ENGINEERING; VISAKHAPATNAM
A shot crossing body has a tendency to rock due to heavy load at end lifting
The nose of crossing should have same thickness.
of crossing
Acute angle crossing.
u; GAYATRI VIDYA PARISHAD COLLEGE OF ENGINEERING; VISAKHAPATNAM
A shot crossing body has a tendency to rock due to heavy load at end lifting

Prepared By: V.M.Naidu; GAYATRI VIDYA PARISHAD COLLEGE OF ENGINEERING; VISAKHAPATNAM
ii. Obtuse angle crossing
iiiSquare crossing

Prepared By: V.M.Naidu; GAYATRI VIDYA PARISHAD COLLEGE OF ENGINEERING; VISAKHAPATNAM
Design calculations of turnout :
Method 1 :
(i) Curve load (c.l) :

Prepared By: V.M.Naidu; GAYATRI VIDYA PARISHAD COLLEGE OF ENGINEERING; VISAKHAPATNAM
TBC ,
Tan α/2 = BC/TB=G/C.L
C.L = G/tan(α/2) = G cot α/2.
Also ,
C.L2 = G(2R0-G) (from geometry of figure)
= 2R0G-G2
=2R0G. ( neglect G2 which is small compared to 2R0G)
Therefore C.L = root of 2ROG
Also , C.L = BE+ET
= BE+EC = G cotα+GCOSECα
=G Cot α+G root (1+cot2)
=G(N+root (1+N2))
As ‘N’ is big, root 1+N2 =N
Therefore C.L.=2GN. -----------------------------------(I)
(2.)R-radius :
ΔOCD,
Sinα = DC/OC = TB/RO = CL/RO => RO = CL/sinα
R = RO-G/2
Also, RO = TD+DO = G+CL cotα
From (I), therefore CL = 2GN, cotα =N
Ro =G + 2GN.N
=G + 2GN2
Because CL is generally slightly greater than 2GN
Hence, Ro = 1.5G + 2GN2
R =RO –G/ 2
Prepared By: V.M.Naidu; GAYATRI VIDYA PARISHAD COLLEGE OF ENGINEERING; VISAKHAPATNAM
(3) Switch lead (S.L):
SL2 = d(2Ro-d)
=2Rod-d2
SL =√� ��
As d2 is small compared to 2Rod
(4) Lead (or) crossing lead (L)
L = C.L –S.L
= Gcot(α/2) - √� ��
=√� .�
-√� .�
(5) Heel divergence (d)
d = (S.L)2/2RO
EXAMPLE:
Calculate all the necessary elements required to set out a 1 in 8 ½ turnout, taking
off from a straight B.G track with its curve starting from the toe of the switch i.e
tangential to the gauge face of the outer main rail and passes through theoretical
nose of crossing, Given, heel-divergence (d) =11.4cm
Sol:- Given data,
N = 8.5, G = 1.676m, d= 11.4cm = 0.114m
(1) Curve lead(CL)
= 2GN
= 2*1.676*8.5 = 28.49m
(2) Radius, R = RO –G/2
RO = 2GN2 + 1.5G = 2*1.676*8.5
2 + 1.5*1.676
= 244.69m
R = RO – G/2 = 244.69 – 1.676/2 = 243.85m

Prepared By: V.M.Naidu; GAYATRI VIDYA PARISHAD COLLEGE OF ENGINEERING; VISAKHAPATNAM
(3) Switch lead (SL),
=√� ��
= =√�∗���.��∗�.���
= 7.45m
(4) Lead, L = CL –SL
= 28.49-7.45
= 21.04m
Metod-II:-
1) Lead (or) crossing load (L):
ΔTDC,
Tan (α+β)/2 = TD/DC = G-d/L
L = (G-d)cot((α+β)/2)
2) R-Radius:
<COF = (α-β)/2
Therefore sin(α-β)/2 = CF/RO = CT/2RO = TD/sin(α+β)/2 *(1/2RO)
= G-d/(2sin(α+β)/2*sin(α-β)/2) = G-d/(cosβ-cosα)

Prepared By: V.M.Naidu; GAYATRI VIDYA PARISHAD COLLEGE OF ENGINEERING; VISAKHAPATNAM
R = RO – G/2
EXAMPLE:-
Calculate the elements of a turnout, when it is given G = 1.676m, d = 13.cm, angle
of switch i.e β =1˚8’0”
Sol:- When N =12, α = 4˚45’49”
(1) Crossing lead (L)
L = (G-d)cot((α+β)/2) = (1.676-0.133)cot(4˚45’49”+1˚8’0”)/2
= 29.95m
(2) Radius, Ro = G- d/(cosβ-cosα) = 1.676-0.133/(cos4˚45’49”-cos1˚8’0”) =
475m
Therefore R = Ro – G/2 = 475 – 1.675/2 = 474.162m
METHOD(III):-

Prepared By: V.M.Naidu; GAYATRI VIDYA PARISHAD COLLEGE OF ENGINEERING; VISAKHAPATNAM
1) Radius- R:-
ΔTPT’’
SinPT’T = TP/TT’
TT’ = TPcosecPT’T
= TPcosec(α+β)/2
Therefore TF = T’F = ½ TT’ = ½ TPcosec((α+β)/2)
ΔOFT’,
SinT’OF=T’F/OT’=T’F/R0 => RO=T’F/sinT’OF
RO=T’F/sin(α-β)/2=T’Fcosec(α-β)/2
RO=1/2 TP.cosec(α+β)/2cosec(α-β)/2
= TP/(2sin((α+β)/2)sin((α-β)/2))=TP/(cosβ-cosα)=G’/(cosβ-cosα)
RO=G-d-xsinα/(cosβ-cosα) => R=RO-G/2
2) CROSSING LEAD(L):
L=CN+NS=xcosα+TPcot(α+β)/2
Therefore L=xcosα+TPcot(α+β)/2
L=xcosα+G’cot(α+β)/2=xcosα+(G-d-xsinα)cot(α+β)/2

Prepared By: V.M.Naidu; GAYATRI VIDYA PARISHAD COLLEGE OF ENGINEERING; VISAKHAPATNAM
d=xsinα-G-(L-xcosα)/(cot(α+β)/2)
Eg:-on a straight B.G. track, a turn out takes off at an angle of 6˚42’35’’ design the
turn out when it is given angle of switch=1˚34’27’’ the length of switch –rails is
4.73m heel divergence , d=11.43cm and x i.e. straight arm =0.85 m
Sol:-
α=6˚42’35’’, β=1˚34’27’’, G=1.676m,d=11.43 cm=0.1143m
x=0.85m
i. Radius-R:
Ro=G-d-xsinα/(cosβ-cosα)= 229 m
ii. Crossing lead (L):-
L=xcosα+(G-d-xsinα)cot(α+β)/2=21.024 m
Sleepers at points and crossings:-
a) Through sleepers
b) Inter laced sleepers

Prepared By: V.M.Naidu; GAYATRI VIDYA PARISHAD COLLEGE OF ENGINEERING; VISAKHAPATNAM
TRACK JUNCTIONS:-
i. TURN OUT
ii. SYMMETRICAL SPILT
iii. THREE THROW SWIT
u; GAYATRI VIDYA PARISHAD COLLEGE OF ENGINEERING; VISAKHAPATNAM
TURN OUT
SYMMETRICAL SPILT
THREE THROW SWITCHES
u; GAYATRI VIDYA PARISHAD COLLEGE OF ENGINEERING; VISAKHAPATNAM

Prepared By: V.M.Naidu; GAYATRI VIDYA PARISHAD COLLEGE OF ENGINEERING; VISAKHAPATNAM
iv. DOUBLE TURN OUT
v. DIAMOND CROSSING
vi. CROSS OVERS
u; GAYATRI VIDYA PARISHAD COLLEGE OF ENGINEERING; VISAKHAPATNAM
DOUBLE TURN OUT
DIAMOND CROSSING
CROSS OVERS
u; GAYATRI VIDYA PARISHAD COLLEGE OF ENGINEERING; VISAKHAPATNAM

Prepared By: V.M.Naidu; GAYATRI VIDYA PARISHAD COLLEGE OF ENGINEERING; VISAKHAPATNAM
vii. SINGLE SLIP AND DOUBLE SLIP
viii. GOUNTLET TRACK
ix. SCISSOR CROSS- OVER

Prepared By: V.M.Naidu; GAYATRI VIDYA PARISHAD COLLEGE OF ENGINEERING; VISAKHAPATNAM
x. GATHERING LINES OR LADDER
xi. TEMPORARY DIVERSION
xii. TRIANGLE
u; GAYATRI VIDYA PARISHAD COLLEGE OF ENGINEERING; VISAKHAPATNAM
GATHERING LINES OR LADDER
TEMPORARY DIVERSION
TRIANGLE
u; GAYATRI VIDYA PARISHAD COLLEGE OF ENGINEERING; VISAKHAPATNAM

Prepared By: V.M.Naidu; GAYATRI VIDYA PARISHAD COLLEGE OF ENGINEERING; VISAKHAPATNAM
xiii. DOUBLE JUNCTIONS
Station :
Def: It is the selected place on a railway line , where trains halt.
Site selection for railway station :
1. Acquisition of land.
2. Proximity to town or village.
3. Nature of land area.
4. Approach roads to station.
5. Station site diagram.
6. Site drainage.
7. Station amenities.
8. Type of station and yard.
9. Role of authorities.
Requirements of a railway station :
1) Public.

Prepared By: V.M.Naidu; GAYATRI VIDYA PARISHAD COLLEGE OF ENGINEERING; VISAKHAPATNAM
2) Traffic staff and police.
3) Trains.
4) Locomotives.
5) Development of railways.
Classification of railway stations :
1. Operational classification
i. Block stations� class A station
� Class B station
� Class C station
ii. Non- block station� class D station
iii. Special class station
2. Functional classification
i. Non-junction (or) wayside station
a.wayside station on a single line.
b. wayside station (or) a double line

Prepared By: V.M.Naidu; GAYATRI VIDYA PARISHAD COLLEGE OF ENGINEERING; VISAKHAPATNAM
C. wayside station (or) triple line
ii.Junction stations

Prepared By: V.M.Naidu; GAYATRI VIDYA PARISHAD COLLEGE OF ENGINEERING; VISAKHAPATNAM
iii.Terminal station
Platform :
A railsed level surface used for boarding, atighting, loading, unloading takes
place.

Prepared By: V.M.Naidu; GAYATRI VIDYA PARISHAD COLLEGE OF ENGINEERING; VISAKHAPATNAM
I. Passenger platform.
II. Goods platform.
Essentials of passenger platform :
1) Minimum width of 3.66 of platform should be paved.
2) Ends of raised platform should be in form of ramp.
3) Adequate lighting arrangement should be made.
4) Adequate drinking facilities should be provided.
5) Names of station should be written in R.C.C in Hindi, Ennglish and
regional language.
Station yards :
A yard is a system of tracks laid usually on a level within defined, for receiving,
storing. Making up trains, despatch of vehicles.
Types of yards :
1) Passenger bogie yards (for safe movement of passengers and
vehicles).
2) Goods yards 9for receiving, loads, unloading and delivery of
goods).
3) Marshalling yards.
4) Locomotive yards.
Marshalling yards :
Important function
i. Reception
ii. Sorting
iii. Departure.

Prepared By: V.M.Naidu; GAYATRI VIDYA PARISHAD COLLEGE OF ENGINEERING; VISAKHAPATNAM
Types of marshalling yards :-
i. Flat
ii. Gravitational yards
iii. Hump yards
Signalling :-
It consists of the systems, devices and means by which trains are operated
efficiently.
Objectives of signalling :
I. To provide facilities for the efficient movement of trains.
II. To ensure safety between two (or) more trains.
III. To provide facilities for the maximum utility of the track.
IV. To guide the trains during maintenance and the repairs of track.
V. To safeguard the trains at converging junction.
Classification and type of signals :
1. Opearsting characteristics
i. Detonating signals.

Prepared By: V.M.Naidu; GAYATRI VIDYA PARISHAD COLLEGE OF ENGINEERING; VISAKHAPATNAM
ii. Hand signals.
iii. Fixed signals.
2. Functional characteristics
i. Stop signal.
ii. Warner signals.
iii. Shunting signals.
iv. Coloured-light signals.
3. Locational characteristics
Outing signal
i. Reception signal ->
Home signal
Starter signal
ii. Departure signal ->
Advanced starter.
4. Special characteristics
a) Repeating signals.
b) Routing signals.
c) Calling on signals.
d) Point indicator.
e) Miscellaneous signals.

Prepared By: V.M.Naidu; GAYATRI VIDYA PARISHAD COLLEGE OF ENGINEERING; VISAKHAPATNAM
AIRPORT ENGINEERING
DEF:
It is an engineering which deals with air transport.
ADVANTAGES OF AIR TRANSPORT:
1. Rapidity (high speed).
2. Continuous journey (continuous over land and water without loss of time).
3. Accessibility (it has unique ablity to open up in any region that is inaccessible by other means
of transport).
LIMITATIONS OF AIR TRANSPORT:
1. Operating expenses � high
2. Capacity.
3. Weather conditions.
FACTORS AFFECTING SELECTION OF SITE FOR AIRPORT:
a) REGIONAL PLAN:
• Fit well into the regional plan.
• Forming it an integral part of national network of airport.
b) AIRPORT USE:
• Selection depends upon the use of airport i.e., civilian or for military.
c) Promity to other airport
‘d’ is in such a way that movement of aircraft at one airport should not affect the movement at
neighbouring airport.
‘d’ mainly depends on volume of air traffic, the type of aircraft and the air traffic control.
d) GROUND ACCESSIBILY:
The best location is a site adjacent to the main highway.
Airport should be as near as possible to the residential and business centers.
e) TOPOGRAPHY:
Existing New
d

Prepared By: V.M.Naidu; GAYATRI VIDYA PARISHAD COLLEGE OF ENGINEERING; VISAKHAPATNAM
A raised ground e.g. a hill top, is usually considered to be an ideal site for airport.
The reason are
i. Less obstruction.
ii. Natural drainage.
iii. More uniform wind
iv. Better visibility due to less fog.
f) Obstruction
g) VISIBILITY:
• Poor visibility lowers the traffic capacity of the airport.
• Airport should be free from visibility reducing conditions such as fog, smoke etc.
h) WIND:
• Runway is so oriented that landing and take off is done by heading into the wind.
• Wind data, ie, direction , duration and intensity of wind should be collected over a
minimum period of about 5 years.
i) NOISE NUISANCE:
j) GRADING, DRAINAGE AND SOIL CHARACTERISTICS:
• Site with high water tables, which may require costly sub-soil drainage should be
avoided.
• The cost of grading and drainage can often be reduced by selecting a site with
favourable soil characteristics.
Desirable soil type� Gravel, sand of decomposed granite.
k) FUTURE DEVELOPENEMT:
Air traffic volume will continue to increase in future, more number of runways may have to be
provide for an increased traffic.
Future traffic leads to additional ATC, more runway etc.
l) UTILITY:
Facilities like water supply, sewer, telephone, electricity etc has to be provided.
m) ECONOMIC CONSIDERATIONS:
runway Approach area Approach area
Obstructions like
pole
lines,buildingsetc
Heavily
deveoped
area
No developement
in area
Prevailing winds
Preferential runway
Prevailing wind runway

Prepared By: V.M.Naidu; GAYATRI VIDYA PARISHAD COLLEGE OF ENGINEERING; VISAKHAPATNAM
Land cost, clearing and grading of land, drainage, removal of hazard, pavity, turfing, lighting etc
leads to total cost. Among the various alternatives, one which is economical should be prefered.
AIRPORT LAYOUT:
RUNWAY: It is the path through which landing and take-off takes place.
BASIC RUNWAY LENGTH:
It is the length of runway under the following assumed conditions at the airport.
I. Airport altitude is at sea level.
II. Temperature at the airport is standard(15®c)
III. Runway is levelled in longitudinal direction.
IV. No wind is blowing on runway.
V. Aircraft is loaded to its full locading capacity.
VI. Enroute temperature is standard.
Basic runway is determined in following three cases.
i. Normal landing case.

Prepared By: V.M.Naidu; GAYATRI VIDYA PARISHAD COLLEGE OF ENGINEERING; VISAKHAPATNAM
ii. Normal take-off case.
iii. Engine failure case.
60 p.c of landing dist
Landing distance
Normal landing case
Clearing should not be more than half
this dst
Lift off dst
115pc of lift off dst
Dist of 10.5 m
115 pc of dst to 10.5 m ht longitudinal section
Normal take off case

Prepared By: V.M.Naidu; GAYATRI VIDYA PARISHAD COLLEGE OF ENGINEERING; VISAKHAPATNAM
Minimum 150m
PLAN
Engine –Failure case
Clear
way runway
stop Lift off distance
Accelerate stop distance
Distance to 10.5 ht
Clear way
Stop way Runway
Declarate stop dst
Clear way

Prepared By: V.M.Naidu; GAYATRI VIDYA PARISHAD COLLEGE OF ENGINEERING; VISAKHAPATNAM
CORRECTIONS FOR ELEVATION, TEMPERATURE AND GRADING:
i. Corrections for elevations:
Increase in elevation �reduces air density�reduces lift on wings of aircraft�required greater
speed before it can rise�required longer length
• ICAO recommends that the basic runway length should be increased at rate of 7%/300m rise in
elevation above mean sea level.
ii. Correction for temperature
Airport reference temperature = Ta+(Tm-Ta)/3
Ta-avg daily temp
Tm-monthly mean of max daily temp.
1% runway length � 1®c rise of airport reference temp after 15®c
iii. Check for total correction for elevation plus temperature
If total correction for elevation plus temperature is > 35% of basic runway length.,
Then these corrections should be further checked at site by model testes.
iv. Corrections for gradient
steeper gradient � greater consumptions of energy � longer length is required to attain desire
ground speed.
Increase runway 20% for energy 1% of effective gradient effective gradient is defined as the max
difference in elevation between the highest and lowest points of runway by the total length of
runway.
E.G.
The data below refers to the daily temperature for hottest month of the year 1998 for the given
airport site. Determine the airport reference temperature.
Temp ®c Temp ®c Temp ®c
DATE MAX AVG DATE MAX AVG
1 42.5 25.5 15 43.6 26.2
2 42.5 25.5 16 43.7 25.8
3 42.7 25.7 17 43.8 26.3
4 43.0 25.9 18 44.0 26.3

Prepared By: V.M.Naidu; GAYATRI VIDYA PARISHAD COLLEGE OF ENGINEERING; VISAKHAPATNAM
5 43.0 25.9 19 44.8 26.3
6 43.0 25.9 20 44.1 26.5
7 42.8 25.8 21 44.3 26.9
8 43.0 25.9 22 44.3 26.5
9 43.0 25.9 23 44.5 26.5
10 43.1 25.0 24 44.6 26.9
11 43.3 26.3 25 44.6 27.0
12 43.4 26.4 26 44.7 27.0
13 43.3 26.3 27 44.6 27.0
14 43.5 26.4 28 44.7 27.0
29 44.8 26.2
30 45.0 27.2
Sol:
Mean of max daily temperature, Tm=1311.6/30=43.72®c
Mean of average daily temperature, Ta= 789.7/30=26.32®c
Airport reference temperature = Ta+(Tm-Ta)/3=32.12®c
EG:
The monthly mean temperature of the atmosphere at a particular siters where an airport has to be
developed, are given below. Determine the airport reference temperature. If the site is at mean sea
level, determine the actual runway length, the runway assumed to be level.
Month Mean of avg daily Mean value max
daily
Jan 3 5
Feb 15 17
Mar 20 23
Apr 25 32
May 35 47
June 40 50
July 32 37
Aug 30 35
Sept 27 31
Oct 22 28
Nov 12 18
Dec 6 9
Sol:
Tm=50®c Ta=40®c

Prepared By: V.M.Naidu; GAYATRI VIDYA PARISHAD COLLEGE OF ENGINEERING; VISAKHAPATNAM
Airport reference temp=Ta+(Tm-Ta)/3=43.3®c
Runway length is L mts
Rise of temp =43.3-15=28.3
Req correction = L/100×28.33=0.2833
Corrected length = L+0.2833L=1.28332
EG: The following data refers to the proposed longitudinal section
END OF END RUNWAY GRADIENT
0.0-5.0 CHAINS +1.0%
5.0-15.0CHAINS -1.0%
15.0-30.0 CHAINS +0.8%
30.0-40.0 CHAINS +0.2%
It one metric chain is 24m length. Determine the effective gradient of runway
sol:
chainage 0 5 15 30 40
elevation 100.0 101.0 99.0 101.4 101.8
Max different in elevation =101.8-99.0=2.8m
Total runway length=40*20=800m
Effective gradient of runway=2.8/800*100=0.35%
Example: The length of runway under standard conditions is 1620m. The airport site has an
elevation of 270m. its reference temperature is 32.94˚c. If the runway is to be constructed with
an effective gradient of 0.2%, determine the corrected runway length.
Sol:
i) Correction for elevation =(7/100)*1620*(270/300)=102m
Corrected length =1620+102 = 1722m
ii) Determination of std. temp, at given elevation:
= 15˚-(0.0065*270) =13.18˚C
iii) Correction for temperature
Rise of temperature = 32090 – 13.18˚C = 19.72˚C
Correction = (1722/100)*19.72 = 340m
Corrected length = 1722+340 = 2062m
iv) Check for the total correction for elevation plus temp.
Total correction in percentage = (2060-1620)/1620*100 =27.2%
v) Correction for gradient: =(20/100)*2062*0.20=82.48m
Corrected length = 2062+82.48 = 2144.48m = 2150m

Prepared By: V.M.Naidu; GAYATRI VIDYA PARISHAD COLLEGE OF ENGINEERING; VISAKHAPATNAM
Example: The length of a runway under standard conditions is 2100m. The airport is to be
provided at elevation of 410m above mean sea level. The airport reference temperature is 32˚C.
The construction plan provides the following data:
End to end of runway(m) Grade(%)
0-300 +1.00
300-900 -0.50
900-1500 +0.50
1500-1800 +1.00
1800-2100 -0.50
2100-2700 -0.40
2700-3000 -0.10
Determine the length of runway. Apply corrections for elevation and temperature as per ICAO and for
gradient as per FAA specifications.
Sol:
i) Correction for elevation: = (7/100)*2100*(410/300) = 201m
Correction length = 2100+201 = 2301m
ii) Determination of std. atmospheric temperature at the given elevation:
=15-(0.00065*410) =12.34˚C
iii) Correction for temperature
Rise of temp. = 32˚ - 12.34 = 19.66 ˚C
Correction = (2301/100)*19.66 = 454m
Correction length = 2301+454=2755m
iv) Check for the total correction for elevation plus temperature:
Total correction is percentage = (2755-2100)/2100 *100 = 31.2%
According to ICAO , the total correction for (i) and (iii) should not exceed 35%.
v) Correction for gradient
The elevation of different points as per proposed grading plan will be as follows:
Chainage(100)m 0 3 9 15 18 21 27 30
Elevation(m) 100 103 100 103 106 104.5 102.1 101.8
Length after correction for elevation and temp. = 2755m
Max. difference of elevation = 106-100 = 6m
Therefore the effective gradient = (6/2755)*100 = 0.218%

Prepared By: V.M.Naidu; GAYATRI VIDYA PARISHAD COLLEGE OF ENGINEERING; VISAKHAPATNAM
Correction for gradient = (20/100)*2755*0.218 = 120.5m
Corrected length = 2755 + 120.5 = 2875.5m
The revised effective gradient = 0.218*(2755/2875.5) = 0.208%
There revised gradient correction = (120.5/0.218)*0.208 = 115m
The revised correction length = 2755+115 =2870m

Prepared By: V.M.Naidu; GAYATRI VIDYA PARISHAD COLLEGE OF ENGINEERING; VISAKHAPATNAM
Eg: The runway length required for landing at sea level in standard atmospheric conditions is 3000m. Runway length required for take-off at a level site at sea level in atmospheric conditions is 2500m. Aerodrome reference temperature is 250c and that of standard atmosphere at aerodrome elevation of 150m is 14.0250c. If the effective runway gradient is 0.5%, determine the runway length to be provided.
Solution:
a) Corrections to runway take-off length i) Correction for elevation= (7/100)x2500x(150/300)=87m
Corrected length = 2500+87=2587m. ii) Correction for temperature
Rise of temperature =24-14.025=9.9750c Correction = (2587/100)x9.975=258m Corrected temperature = 2587+258=2845m
iii) Check for total correction for elevation plus temperature. Total correction in percentage = ((2845-2500)/2500)x100 =13.8% < 35% ok.
iv) Correction for gradient =(20/100)x2845x0.5 =284m Corrected length =2845+284=3130m (say)
b) Correction to runway landing length i) Correction for elevation=(7/100)x3000x(150/300)
=105m. Corrected runwaylanding length=3000+105 =3105m. No corrections are needed to landing lengthfor temperature and gradient.
c) Actual runway length to be provided would be greater of (a) and (b)above=3130m.

Prepared By: V.M.Naidu; GAYATRI VIDYA PARISHAD COLLEGE OF ENGINEERING; VISAKHAPATNAM
RUNWAY ORIENTATION:
• Runway is usually oriented in the direction of prevailing wind.
• The head wind i.e., direction of wind opposite to the direction if landing and take-off.
• During take-off, air craft rises above the ground much earlier and in a shorter length of runway as it provides greater lift on the wings of air craft.
• During loading, the head wind provides a breaking effect and air craft comes to a stop in a smaller length of runway.
• If loading and take-off operations, if done along the wind direction, would require longer runway.
Cross wind component and wind coverage:
WIND ROSE DIAGRAM:

Prepared By: V.M.Naidu; GAYATRI VIDYA PARISHAD COLLEGE OF ENGINEERING; VISAKHAPATNAM
The wind data i.e., direction, duration, and intensity are graphically represented by a diagram called wind rose diagram.
• Wind data is collected for at least 5 years and preferably of 10 years.
• It helps in analysing the wind data and obtaining the most suitable direction of runway. TOTAL PERCENT = 86.
Total percent = 86.5 WIND COVERAGE:
Wind direction
Duration of wind, percentage Total in each direction percentage
6.4-25 kmph
25-40 kmph
40-60 kmph
N 7.4 2.7 0.2 10.3 NNE 5.7 2.1 0.3 8.1 NE 2.4 0.9 0.6 3.9 ENE 1.2 0.4 0.2 1.8 E 0.8 0.2 0.0 1.0 ESE 0.3 0.1 0.0 1.0 SE 4.3 2.8 0.0 7.1 SSE 5.5 3.2 0.0 8.7 S 9.7 4.6 0.0 14.3 SSW 6.3 3.2 0.5 10.0 SW 3.6 1.8 0.3 5.7 WSW 1.0 0.5 0.1 1.6 W 0.4 0.1 0.0 0.5 WNW 0.2 0.1 0.0 0.3 NW 5.3 1.9 0.0 7.2 NNW 4.0 1.3 0.3 5.6

Prepared By: V.M.Naidu; GAYATRI VIDYA PARISHAD COLLEGE OF ENGINEERING; VISAKHAPATNAM
The percentage of time in year during which the cross wind component remains within the limits as specified (i.e., 35kmph, 25kmph, 15kmph) Wind rose diagrams can be plotted in two types as follows: Type-1: showing direction and duration of wind. Type-2: showing direction, and intensity of wind. TYPE-I:

Prepared By: V.M.Naidu; GAYATRI VIDYA PARISHAD COLLEGE OF ENGINEERING; VISAKHAPATNAM
• This type of wind rose is illustrated in above figure
• The radial line indicates the wind direction and each circle represents the duration of wind.
• It is observed that the total percentage of time in a year during which the wind blows from north direction is 10.3%. This value is plotted along the north direction.
• Similarly, other values are also plotted along respective directions.
• All plotted points are then jointed by straight line as shown in figure.
• The best direction of runway is usually along the direction of longest line of wind rose diagram. So the best direction of runway is N-S direction.
• The percentage of time in a year during which the runway can safely be used for landing and take-off, will be obtained by summing the percentage of time along NNW,N,NNE,SSE,S, and SSW directions. This comes 57.0%
CALM PERIOD:

Prepared By: V.M.Naidu; GAYATRI VIDYA PARISHAD COLLEGE OF ENGINEERING; VISAKHAPATNAM
It is the percentage of time during which wind intensity is less than 6.4kmph.
Total percentage of time =57+13.5(calm period)
=70.5
This type of wind rose does not account for the effect of cross wind component.
TYPE-II:

Prepared By: V.M.Naidu; GAYATRI VIDYA PARISHAD COLLEGE OF ENGINEERING; VISAKHAPATNAM
Each circle represents the wind intensity to some scale. The values entered in each segment represent the percentage of time in a year during which the wind having particular intensity, blows from respective direction.
PROCEDURE:
1. Draw three equi-spaced parallel lines on a transparent paper strip in such a way that the distance between the two nearby parallel lines is equal to the permissible cross wind component. This distance is measured with the same scale with which the wind rose diagram is drawn.
2. Place the transparent paper strip over the wind rose diagram in such a way that the centre line passes through the centre of diagram.
3. With the centre of wind rose, rotate the tracing paper and place it in such a position that the sum of all the values indicating the duration of wind, with in the two outer parallel lines, is maximum. The runway should be thus oriented along the direction indicated by centre line. The wind coverage can

Prepared By: V.M.Naidu; GAYATRI VIDYA PARISHAD COLLEGE OF ENGINEERING; VISAKHAPATNAM
be calculated by summing up all the percentages shown in segment. When outer parallel lines crosses segment, then the fractional part of the percentage is taken for calculation. Fractional areas are determined by judgement to the nearest decimal place.
From figure,
Wind coverage=13.5(calm period)+7.4+5.7+2.4+1.2+0.8+0.3+4.3+5.5+9.7+6.3+3.6+1.0+0.4+0.2+5.3+4.0+2.7+2.1+0.5+0.1+0.03+2.1+3.2+4.6+3.2+1.13+0.3+0.02+1.5+1.3+0.2+0.2+0.0+0.3+0.25=96.5
4. Read the bearing of the runway on outer scale of the wind rose where centre line on transparent paper crosses angular scale. In figure, NS direction.
5. If the coverage provided by a single runway is not sufficient, two or more runways are planned to get required wind coverage.
Problem:
The data given below refers to the direction, duration and intensity of wind at a particular site over a period of 8 years. Draw the two types of wind rose diagrams. Determine the calm period, and orientation of runway from each type. Determine the percentage of time in year during which this runway can be used with satisfactory wind conditions.
% OF TIME WITH VELOCITY IN KMPH
DIRECTION 6.4-25 25-35 35-55 55-80

Prepared By: V.M.Naidu; GAYATRI VIDYA PARISHAD COLLEGE OF ENGINEERING; VISAKHAPATNAM
N 7.8 2.7 1.6 0.2 NNE 5.1 2.1 0.8 0.1 NE 2.4 0.9 0.6 0.0 ENE 1.2 0.4 0.2 0.0 E 0.8 0.2 0.9 0.0 ESE 0.3 0.1 0.0 0.0 SE 2.3 1.8 0.9 0.1 SSE 4.5 3.0 1.0 0.2 S 6.7 5.6 2.9 0.1 SSW 4.8 2.7 1.3 0.1 SW 1.6 0.8 0.3 0.0 WSW 2.2 0.6 0.1 0.0 W 0.4 0.1 0.0 0.0 WNW 0.2 0.1 0.0 0.0 NW 2.3 1.8 0.9 0.2 NNW 4.0 3.2 1.3 0.1

Prepared By: V.M.Naidu; GAYATRI VIDYA PARISHAD COLLEGE OF ENGINEERING; VISAKHAPATNAM
RUNWAY LIGHTING:
i) The runway is so planned that it imparts to the pilot the required guidance on alignment, lateral displacement.
ii) The old practice for night landing was to flood light the entire landing area. But, these days , flood-lighting is restricted only to indicate the preferred direction of landing.
iii) For runway lighting, a more precise design commonly known as narrow –gauge pattern is almost universally used at major air ports.
iv) As the pilot crosses the threshold and is about to touch the runway, he finds the central area of runway is excessively dark.
v) To eliminate this black hole effect, the practice was to increase the intensity of edge lights, but this proved to be ineffective.
vi) The narrow–gauge pattern is an attempt towards lighting up the central portion of the runway.
vii) Group of high intensity lights are placed 18m apart and on either side of the centre line of runway.
Flash with
center line
1080
Runway edge light

Prepared By: V.M.Naidu; GAYATRI VIDYA PARISHAD COLLEGE OF ENGINEERING; VISAKHAPATNAM
viii) These lights are continued up to a distance of 1140m from threshold. Beyond this distance closely spaced lights are placed along centre line up to other end of runway.
ix) All the lights on the runway edges are elevated type and those inside runway are of flush type (one does not protrude more than 1cm (0.4in )above the pavement surface)
TAXIWAYS:
The main function
Factors controlling taxi way lay out:
i) Taxiways are so arranged, that the air crafts landing and taking off should not interfere.
ii) At busy air ports, taxi ways should be located at various points along the runway so that runway is cleared as early as possible.
iii) Route of taxiway is selected in such a way that it provides shortest distance from apron to runway.
iv) As far as possible the intersection of taxiway & runway should be avoided.
v) Exit taxiways should be designed for high turn off speeds. vi) This will increase the airport capacity.
Runway
APRON
HONGER

Prepared By: V.M.Naidu; GAYATRI VIDYA PARISHAD COLLEGE OF ENGINEERING; VISAKHAPATNAM
TAXIWAY GEOMETRICS:
Classification by ICAO
Taxiway width m, ft
Maximum longitudinal gradient %
Minimum transverse gradient %
Maximum rate of change of longitudinal gradient/30m%
A 22.5 75 1.5 1.5 1.0 B 22.5 75 1.5 1.5 1.0 C 15.0 50 3.0 1.5 1.0 D 9.9 33 3.0 2.0 1.2 E 7.5 30 3.0 2.0 1.2
TURNING RADIUS:
R=V2 /127f
R-radius in m; V-speed in kmph.
Horonjeff equation,
R=(0.388W2)/(T/2-S);
Where , R is radius of taxiway in m
W is wheel base of aircraft in m,
T is width of taxiway pavement in m,
S is distance between midway point of the gears and edge of taxi way pavement in m,

Prepared By: V.M.Naidu; GAYATRI VIDYA PARISHAD COLLEGE OF ENGINEERING; VISAKHAPATNAM
APRON:
It is paved area for parking of aircrafts, loading and unloading of passengers and cargo.
It is usually located close to the terminal building or hangers.
Size of apron depends on
• Size of loading area • Number of gate position=(capacity of runway/(60x2))x average
gate occupation time
• Aircraft parking system.
Frontal system Open apron system Finger system Satellite system

Prepared By: V.M.Naidu; GAYATRI VIDYA PARISHAD COLLEGE OF ENGINEERING; VISAKHAPATNAM
TERMINAL BUILDING:
Terminal area is the portion of an airport other than the loading area.
The purpose of airport building is to provide shelter and space for various surface activities related to air transportation.
FACILITIES OF BUILDING:
i) Passengers and baggage handling counter ii) Enquiry counter iii) Space for cargo processing iv) Public telephone v) Waiting hall vi) Toilet vii) Restaurant viii) First aid room ix) Store and gift shop x) Office space for airport staff xi) Weather bureau xii) Post office, banking xiii) Custom control xiv) Passport and health control xv) Control tower
SITE LOCATION:
i) Sufficient area for building & future development ii) Sufficient area for road ways iii) Adequate area for car parking

Prepared By: V.M.Naidu; GAYATRI VIDYA PARISHAD COLLEGE OF ENGINEERING; VISAKHAPATNAM
iv) Convenient access of main high way v) Central location with respect to runway vi) Proximity and easy installation of utilities ,eg: telephone,
electricity, water etc., vii) Favourable orientation with respect to topography, and
prevailing wind viii) Good drainage characteristics.
CONTROL TOWER:
It is the tallest building/tower, where the communication with pilot takes place.

Prepared By: V.M.Naidu; GAYATRI VIDYA PARISHAD COLLEGE OF ENGINEERING; VISAKHAPATNAM
DOCKS & HARBOURS
HARBOUR TYPES:
NATURAL CLASSIFICATION –
• Natural harbour(protected by natural land contours, rocky outcrops. Eg: Mumbai, Kandla, New yorketc;)
• Semi-Natural harbour (it requires man made protection only to entrance. Eg: Visakhapatnam)
• Artificial harbour (protected by break water or is created by dredging. Eg: Paradeep, Mangalore)
FUNCTIONAL CLASSIFICATION-
• Commercial harbour (it is in which facilities are provided for loading and unloading of cargo.) eg: Madras, kandla, okha.
• Military harbour (it is one which is meant for purpose of accommodating naval crafts.) eg: Mumbai, Cochin.
• Harbour of refuge (it is that which is used as a heaven for ships in a storm) eg: Sand bay of USA, Dover in England, Madras, Visakhapatnam.
SITE SELECTION FOR HARBOURS:
• Sea approach & marine conditions • Sea-bed, sub-soil and foundation condition • Transport & communication links • Seaborne traffic potential • Industrial infrastructure • Electrical energy and fresh water supplies • Availability of cheap land and proximity of constructional materials.

Prepared By: V.M.Naidu; GAYATRI VIDYA PARISHAD COLLEGE OF ENGINEERING; VISAKHAPATNAM
PLANNING PRINCIPLES OF HARBOUR / REQUIREMENTS OF GOOD HARBOUR:
• The harbour area required depends on number and size of ships to be accommodated.
• It depends on type of cargo handled.
• Harbour should not be too big to generate waves within.
• It should have sufficient depth at entrance, approach channel.
• It should have proper positioning i.e., locating and alignment of various elements like entrance, approach channel etc. to ensure easy manoeuvrability.
BREAK WATERS:
It is a structure meant to reflect and dissipate the force of wind-generated waves.
Break water are of two types:
1. Vertical wall type 2. Rubble mound type
Vertical wall break waters:
It should be constructed, when
i. Depth of water is sufficiently great to prevent the breaking of waves.
ii. Sea bed is resistant to erosion iii. Foundations are not subject to uneven settlement

Prepared By: V.M.Naidu; GAYATRI VIDYA PARISHAD COLLEGE OF ENGINEERING; VISAKHAPATNAM
Rubber mound break water:
The broad base helps in distributing load on a wider area and thus reducing unit load on base.
GENERAL PLAN

Prepared By: V.M.Naidu; GAYATRI VIDYA PARISHAD COLLEGE OF ENGINEERING; VISAKHAPATNAM
It consists of central portion called the core, and protective layers called the armour.
BREAK WATER FAILURES:
• Pier head failure
• Natural rock or artificial concrete blocks laid on weather side, are removed or even thrown over during unusual storms.
• Rubble mound break water will settle gradually, and its slope tends to flatter with severe wave action, generally, the damage will be comparatively slow.
• In case of vertical break water, the damage is abrupt.
FLOATING BREAK WATER:
These are floating type structure and differ essentially from gravity break waters which are permanently fixed to sea bottom.
Intermediate weight
sinker

Prepared By: V.M.Naidu; GAYATRI VIDYA PARISHAD COLLEGE OF ENGINEERING; VISAKHAPATNAM
DRY DOCK: -(GRAVING DOCK)
As name suggests, the arrangement in a dry dock is to take in a vessel, close the gate, and pump out the water. Sometimes, it is possible to take the advantage of tidal variation so as to reduce the need of pumping.
WHARVES AND QUAY:
• These are usually constructed parallel to share or break water with in the harbour and are meant to permit berthing of vessel alongside for cargo working.
• They have backfill of earth or other material and have wide platform at top.
• It may be sheet pile wall, or gravity wall.
SA
N
D
AN
D
M
ET
AL
FIL
LE
D
W
AT
ER
FIL
ED
1:3:6
Pcc (1:2:4)

Prepared By: V.M.Naidu; GAYATRI VIDYA PARISHAD COLLEGE OF ENGINEERING; VISAKHAPATNAM
TRANSIT SHEDS:
A covered arrangement for temporary storage is called transit sheds or transit godown.
• Cargo can use transit shed for free of cost. Up to a certain period (i.e., 3 to 5days). Beyond this period,” demurrage” is charged.
• Demurrage is charged usually at increasing rates as the period of occupancy increases.
• Factors influencing the size of transit shed: i. Nature of cargo ii. Size of vessels.
WARE HOUSES:
Gavity type warf Monolithic wherf
Quay wall at mormugao
Transit shed consignee
consignor
vessel
vesse

Prepared By: V.M.Naidu; GAYATRI VIDYA PARISHAD COLLEGE OF ENGINEERING; VISAKHAPATNAM
Unlike transit sheds, user, sometimes need to store the cargo for longer period. In such case, facilities are constructed for storage for longer period is called ware houses.
• Unlike transit sheds, these are away from berths.
NAVIGATIONAL AIDS:
• These are meant to guide the ships in their routes and to warn them of hidden dangers.
• These are classified into two categories: i. General lights:
Eg: light houses, light ships
Union government are looking after these general lights.
ii. Local lights:
Eg: floating buoys, leadings on shore
Concerned port authority is responsible to take care.
LIGHT HOUSES:
• These are tall structures with beacon light lantern on the top.
• Constructed with masonry/ concrete.
• Lights are white or coloured powered by electric currents, batteries or acetylene gas.
LIGHT SHIPS:
• These are built, where it is impracticable to build a light house.
• Purpose is same as light house
• Sizes may be of big/small

Prepared By: V.M.Naidu; GAYATRI VIDYA PARISHAD COLLEGE OF ENGINEERING; VISAKHAPATNAM
• Control may be manned / un manned.
BUOYS:
• These are floating markers anchored in their positions.
• These are lighted or unlighted.
• They may also have radar reflectors, bells, or other sound-warning devices.
• Types of buoys: � Unlighted---- spar,can,nun � Unlighted/lighted---sperical

Prepared By: V.M.Naidu; GAYATRI VIDYA PARISHAD COLLEGE OF ENGINEERING; VISAKHAPATNAM

Prepared By: V.M.Naidu; GAYATRI VIDYA PARISHAD COLLEGE OF ENGINEERING; VISAKHAPATNAM