BOLTON RESERVOIR 2012 BOLTON RESERVOIR CLEANING AND INSPECTION.
Upload
vuongthuanCategory
view
215download
1
Transportation Assessment for the Bolton Residential Expansion
Regional Official Plan Amendment
Last update: June 8, 2016 Prepared by: Transportation Division, Public Works, Region of Peel
Table of Contents Executive Summary ...................................................................................................................................... 3 1.0 Introduction ............................................................................................................................................. 6
1.1 Background And Purpose ................................................................................................................... 7 1.2 Peel’s Strategic Plan and Transportation Vision ................................................................................. 8 1.3 Existing Conditions in Bolton .............................................................................................................. 8 1.4 Completed and Ongoing Studies ...................................................................................................... 10 1.5 Climate Change Considerations ....................................................................................................... 12
2.0 Transportation Planning Principles and Criteria ................................................................................... 13 2.1 Planning Principles for Allocating Growth ......................................................................................... 13 2.2 Transportation Planning Principles for Allocating Growth................................................................. 13 2.3 Transportation Criteria ...................................................................................................................... 13
3.0 Assessment and Evaluation .................................................................................................................. 14 3.1 Future Infrastructure Improvement ................................................................................................... 14
3.1.1 Regional Road Capacity ............................................................................................................ 14 3.1.2 Intersection Improvements ......................................................................................................... 16 3.1.3 RegIonal Road Rail Crossings ................................................................................................... 17
3.2 Road/Highway network Efficiency ..................................................................................................... 19 3.3 Transit Opportunities ......................................................................................................................... 20 3.4 Carpool Opportunities ....................................................................................................................... 22 3.5 Active Transportation Opportunities .................................................................................................. 23 3.6 Impacts to Goods Movement ............................................................................................................ 26
4.0 Summary of Assessment ...................................................................................................................... 28 4.1 Future Considerations ................................................................................................................. 29 4.2 Regional Evaluation Themes and Criteria ........................................................................................ 29

Transportation Assessment for the Bolton Residential Expansion Regional Official Plan Amendment Page 2
List of Figures and Tables
Figure 1 - Transportation Network in Bolton ................................................................................................. 6 Figure 2 - Bolton Residential Expansion Options ......................................................................................... 7 Figure 3 - Modal split for trips originating from Bolton, AM Peak .................................................................. 8 Figure 4 - Travel pattern by commuters on all roads in Bolton ..................................................................... 9 Figure 5 - Truck traffic in Bolton .................................................................................................................... 9 Figure 6- Trips From and To Bolton during the AM Peak Period (Source: TTS and BTMP) ...................... 15 Figure 7 - Estimated Exposure Index at the Coleraine Drive and King Street Rail Crossings ................... 18 Figure 8 - Existing and Future Potential Transit Services in Bolton ............................................................ 21 Figure 9 - Existing Active Transportation Network in Bolton ....................................................................... 24 Figure 10 - Truck Route and Restrictions around Bolton ............................................................................ 27
Table 1 - Regional Road Widening Program (2016 - 2031) near Bolton .................................................... 12 Table 2 - Congested Regional Roadway Segments by 2031 in Bolton ...................................................... 15 Table 3 - Evaluation of Regional Road Capacity ........................................................................................ 16 Table 4 - Evaluation of Required Intersection Improvements ..................................................................... 17 Table 5 - Morning Peak Hour Traffic at Coleraine Drive Rail Crossing by 2031 ........................................ 17 Table 6 - Morning Peak Hour Traffic at King Street Rail Crossing by 2031 ............................................... 17 Table 7 - Estimated cost of King Street Rail Crossing for Options 3 and 4 ................................................ 19 Table 8 - Evaluation of Regional Road Rail Crossings ............................................................................... 19 Table 9 - Evaluation of Road/Highway Network Efficiency ......................................................................... 20 Table 10 - Distance to Existing GO Bus Stops ........................................................................................... 22 Table 11 - Evaluation of Transit Opportunities............................................................................................ 22 Table 12 - Evaluation of Carpooling Opportunities ..................................................................................... 23 Table 13 - Minimum Distance between Expansion Option and Active Transportation Facilities ................ 24 Table 14 - Minimum Distance from Expansion Options to Community Destinations in Bolton .................. 25 Table 15 - Evaluation of Active Transportation Opportunities .................................................................... 26 Table 16 - Evaluation of Impacts to Truck Traffic ....................................................................................... 27 Table 17 - Summary of Overall Transportation Evaluation ......................................................................... 28 Table 18. Comparing the Evaluation Themes and Criteria to the Transportation Assessment .................. 29 Table 19. Recommended Evaluation Results ............................................................................................. 30
List of Appendices Appendix A – Evaluation of Regional Road Capacity for Bolton Residential Expansion Appendix B – Intersection Analysis for Bolton Residential Expansion Areas, prepared by CIMA+
Appendices available upon request Appendix C – EMME Modeling for At-Grade Separation Demand Analysis

Transportation Assessment for the Bolton Residential Expansion Regional Official Plan Amendment Page 3
EXECUTIVE SUMMARY
The Town of Caledon has filed a Regional Official Plan Amendment (ROPA) application to expand the Bolton Rural Service Centre for primarily residential uses and to implement the population and employment forecasts per the Growth Plan. The purpose of this report is to summarize the undertaking of the transportation assessment for the Bolton Residential Expansion. Potential expansion options include the six expansion options (Options 1 – 6) and the rounding-out areas (Option 7) identified through the Town’s BRES process, and a triangle-shaped land immediately south of ROPA 28 (Option 8). Information from previous BRES transportation studies as well as all other recent studies have been incorporated as input to this evaluation. Section 1 provides general background information about the overall transportation vision for Peel (s1.2), the existing conditions in Bolton (s1.3), as well as completed and ongoing transportation studies that are relevant to Bolton (s1.4). Finally, some discussion on climate change is provided in section 1.5. Section 2 looks at the recent work around Growth Management to identify a number of transportation principles, including the consideration of the direct/indirect impacts of transportation, optimization of existing infrastructure, collaboration with other technical experts/stakeholders, and the encouragement of sustainable transportation alternatives. Eight transportation criteria were identified in order to assess each of the potential expansion options being considered for the Bolton Residential Expansion. These include Regional Road Capacity, Intersection Improvements, Regional Road – Rail Crossings, Road/Highway Network Efficiency, Transit Opportunities, Carpool Opportunities, Active Transportation Opportunities, and Impacts to Goods Movement.
For every criteria, each expansion option was ranked either “Achieves Least”, “Achieves somewhat”, or “Achieves most” representing the least, somewhat, and most preferred options. 3.1.1 Regional Road Capacity A level of service assessment was completed to determine if any of the eight options would trigger the need for road widening by 2031. Regional Roads under analysis included Highway 50, Coleraine Drive, Emil Kolb Parkway, King Street, and Mayfield Road. Under the base scenario (no expansion options), it was found that approximately 4 km of Regional roadways would become congested. If Options 1, 2, 3, or 4 are selected, approximately 10 – 12 km of roadways would become congested. If Options 5, 6, 7, or 8 are selected, it is estimated that 5 – 8 km of roadways would become congested. The full report can be found in Appendix A. 3.1.2 Intersection Improvements CIMA+ was retained by the Region to undertake a comprehensive traffic impact study to identify any required intersection improvements. This level of intersection analysis is required to effectively compare different expansion options, and has never been done in the past. In general, CIMA found that options in the north require more intersection improvements due to the dominant travel pattern from north to south. Estimated costs generally fall into three groups: Option 1 (~$8 million), Options 2, 3, and 4 (~$4 million), and Options 5, 6, and 7 ($1 – 2 million). Option 8 is not expected to trigger intersection improvements, as Mayfield Road is already scheduled for widening and improvements. The full report can be found in Appendix B.

Transportation Assessment for the Bolton Residential Expansion Regional Official Plan Amendment Page 4
3.1.3 Regional Road – Rail Crossings Travel modelling was completed to identify the amount of vehicular traffic passing at the rail crossings. For the purposes of this study, analysis was scoped to the two existing Regional Road crossings at King Street and Coleraine Drive. It was concluded that the need for the Coleraine rail crossing would be warranted based on the background traffic. None of the expansion options will create any incremental capital costs for the Region at this location. For the King Street rail crossing, grade separation may only be triggered by Options 3 or 4. The incremental cost due to the residential expansion is estimated at $6.7 million. The full report can be found in Appendix C. 3.2 Road/Highway Network Efficiency This section looks at each expansion option and the potential connections to the existing road network, in particular arterial roads and highways. Further, this section considers the impacts of the potential GTA West Corridor. It was found that most options are well connected to the existing road network, with opportunities to connect to multiple arterial roads. Only Option 2 (eastern portion) relies solely on one road connection – Mount Hope Road. Option 6 and 8 remain under the GTA West Focused Analysis Area. Lands are recommended to remain under protection pending a final decision by the MTO on the GTA West Corridor. This will ensure that development does not prejudice the freeway construction. Further analysis may be required concerning appropriate land use designations in proximity to the freeway alignment and interchange locations. In particular, the suitability and demand for industrial or higher density residential land uses should be considered. 3.3 Transit Opportunities This section analyzes each expansion option based on the proximity to existing or future potential transit services. Existing transit services include GO Bus Routes 38 and 38a which have stops along Highway 50. Future transit services include Brampton Transit improvements to northeast Brampton via extensions along Mayfield Road, Clarkway Drive, or Highway 50. GO Bus service may also be reviewed as part of the subway extension to Vaughan or through the update of The Big Move plan. Finally, a potential GO Rail Service has been identified within The Big Move’s 16-25 year capital plan. It was found that Options 1, 2, 6, 7, and 8 are all within walking distance (2km) of existing transit services. Moreover, Options 6 and 8 can benefit from future Brampton Transit service upon the development of Area 47. Options 3, 4, and 5 were all found to be the furthest from existing transit services. However, Options 3 and 4 were found to be superior to Option 5 from a transit perspective due to their proximity to the potential GO Rail service. 3.4 Carpool Opportunities This criteria looks at the proximity and ease of access to the existing carpool lot as well as planned High Occupancy Vehicle (HOV) lanes. In general, existing and planned carpool facilities are located south of Bolton. As such, more southerly options were generally ranked better than northern options. Options 6 and 8 were most preferred from a carpooling perspective, although Options 1 and 2 were also found to have a direct access via Highway 50.

Transportation Assessment for the Bolton Residential Expansion Regional Official Plan Amendment Page 5
3.5 Active Transportation Opportunities This section looks at the proximity to the active transportation network, and the distance to existing community destinations. It was found that all expansion options currently connect to existing or proposed active transportation facilities. However, it was noted that Options 1 and 2 are the closest to the off-road trails associated with the Humber Valley Heritage Trail connecting to Palgrave and Kleinberg. Spatial analysis was completed for the distance to key community services, including elementary and secondary schools, parks, and institutional land uses. Options 1 and 2 appear to offer the greatest access, and almost all community destinations can be accessed in under 3 km. They are followed by Options 3, 4, and 7 which offer some opportunity to encourage active transportation trips. It is noted that this analysis does not take into account planned growth occurring south of Mayfield Road. Based on the adopted land use schedule, neighbourhood retail, service commercial, neighbourhood parks, and an elementary school are anticipated within 1 km of the Mayfield/Humber Station intersection. 3.6 Impacts to Goods Movement This criteria looked at opportunities to minimize the impacts of goods movement on residential communities, and vice versa. Expansion options which can be accessed by non-truck routes are preferred from this perspective. Options 5 and 6 are anticipated to have the least impact to goods movement due to the opportunity to access non-truck routes on Healey Road and Humber Station Road. Options 1, 2, and 7 are somewhat preferred as they are serviced by truck-restricted routes on King Street and Queen Street. Option 3 and 4 are least preferred due to potential impacts on four truck routes – Emil Kolb Parkway, King Street, The Gore Road, and Coleraine Drive. 4.0 Summary of Assessment Section 4 provides an overview of all the individual transportation evaluations that have been presented in this report. It indicates that Options 6 and 8 are most preferred from a transportation standpoint.

Transportation Assessment for the Bolton Residential Expansion Regional Official Plan Amendment Page 6
1.0 INTRODUCTION
Bolton, founded in 1822, is an attractive and character-rich community in the Town of Caledon. It is nested within the natural jewels of the Humber River valley and the cultural gems of Albion. Its historical downtown core is situated at the crossroad of two major arterial roads, Queen Street (a.k.a. Highway 50) and King Street, which connects Bolton to a variety of jobs and services in the Greater Toronto Area. Bolton is 30 km away from Toronto, the largest city in Canada, and 25 km away from the employment lands surrounding the Pearson International Airport in Mississauga which is the second largest concentration of employment in Canada. The two arterial roads also form the core spines for the road system connecting Bolton neighbourhoods within walking and cycling distance to amenities, shops, and restaurants. Figure 1 illustrates the transportation network in Bolton.
Figure 1 - Transportation Network in Bolton

Transportation Assessment for the Bolton Residential Expansion Regional Official Plan Amendment Page 7
The multiple geographic advantages will continue to attract newcomers to Bolton, resulting in a predicted population growth from approximately 25,000 today to 35,000 in the next 15 years, and possibly more growth beyond.
1.1 BACKGROUND AND PURPOSE
The Town of Caledon has filed a Regional Official Plan Amendment (ROPA) application to expand the Bolton Rural Service Centre for primarily residential uses and to implement the population and employment forecasts per the Growth Plan. The Region is considering the Town of Caledon’s Bolton Residential Expansion ROPA application in accordance with the planning process endorsed by Regional Council on November 12, 2015. The potential expansion options being considered for the Bolton residential expansion can be found in Figure 2, and include the following:
six expansion options evaluated through Caledon’s BRES process (Options 1 -6),
three rounding out areas evaluated through Caledon’s BRES process (referred to as Option 7 in this report), and
a triangle-shaped area located immediately south of ROPA 28 - South Albion-Bolton Employment Lands expansion (referred to as Option 8 in this report)
Figure 2 - Bolton Residential Expansion Options

Transportation Assessment for the Bolton Residential Expansion Regional Official Plan Amendment Page 8
The purpose of this report is to summarize the undertaking of a transportation assessment for the Bolton Residential Expansion. The objective of the transportation assessment is to provide an evidence-based analysis based on regional transportation considerations, and to evaluate the opportunities and impacts of a settlement expansion. The findings of the transportation assessment will be consolidated and coordinated with other regional considerations.
1.2 PEEL’S STRATEGIC PLAN AND TRANSPORTATION VISION
Region of Peel’s Strategic Plan was adopted by Regional Council on November 12, 2015, and provides a vision for the next twenty years in Peel (2015-2035). The goals and actions contained in the Strategic Plan will be implemented by a series of Term of Council Priorities. The Strategic Plan identified one transportation related action that focuses on improving goods movement. The Regional Official Plan provides policy guidance regarding the movement of people and goods. Planning for this future state includes specific policy on Peel’s transportation systems including the major road and transit networks, goods movement, and Toronto Pearson International Airport. The Long Range Transportation Plan (LRTP) provides a policy implementation framework for the Regional Official Plan to address transportation challenges. The vision for this document is shaped by the Provincial Policy Statement, the Growth Plan for the Greater Golden Horseshoe (Places to Grow), Metrolinx’s Regional Transportation Plan, Peel’s Strategic Plan and Regional Official Plan. The vision, as defined in the LRTP Update 2012, is as follows:
“Peel Region will have a safe, convenient, efficient, mulit-modal, sustainable and integrated transportation system that supports a vibrant economy, respects the natural and urban environment, meets the diverse needs of residents and contributes to a higher quality of life.”
This vision provides the foundation for this transportation assessment, including the development of the transportation planning principles, evaluation criteria, and assessment of the findings.
1.3 EXISTING CONDITIONS IN BOLTON
The 2011 Census of Canada reported a population of 23,174 people in Bolton. There has been continuous population growth from 2001 (9,408 people) and 2006 (22,719 people). The median age in Bolton is 37, which is lower than the Caledon-wide median age of 40. This suggests that the recent residential growth in Bolton is attracting younger families compared to the Town of Caledon. This may be a result of Bolton’s proximity to Toronto and other major employment nodes in the Greater Toronto Area. Car ownership is approximately 2 cars per household. The travel pattern during a typical morning peak period is predominately by driving a car, which accounts for three quarters of all trips - see Figure 3.
Figure 3 - Modal split for trips originating from Bolton, AM Peak

Transportation Assessment for the Bolton Residential Expansion Regional Official Plan Amendment Page 9
Traffic generated by Bolton residents, however, only accounts for half of the total traffic on the roads in Bolton, with the remaining consisting of outside commuters travelling to and through Bolton. Figure 4 illustrates the travel pattern by the commuters during a typical morning rush hours on all roads in Bolton.
Figure 4 - Travel pattern by commuters on all roads in Bolton
In addition, truck traffic adds burdens to the road system accounting for approximately 10% of the total traffic - Figure 5. Additionally, a steep 5-8% grade exists on Highway 50 when entering the core of Bolton, and residents encounter speeding issues during summer months and slippery conditions during winter. Additional challenges include congestion, truck traffic and safety. Increasing car and heavy truck traffic has been the major transportation concerns that have deteriorated the business prosperity, air quality, and the quality of life in Bolton.
Figure 5 - Truck traffic in Bolton

Transportation Assessment for the Bolton Residential Expansion Regional Official Plan Amendment Page 10
1.4 COMPLETED AND ONGOING STUDIES
There have been a number of transportation studies in order to address short-term and long-term transportation needs in Bolton and Caledon. Town of Caledon: BRES transportation studies As part of the Town’s initiative to consider the Bolton residential expansion, two transportation studies were prepared by Paradigm Consultants. The works were summarized in two memos dated June 18, 2013 and March 17, 2014. The 2013 report took a high level transportation assessment approach that consisted of two criteria: traffic capacity and benefits to residents. The traffic capacity analysis concluded that Option 1 and 2 were the most preferred land option due to direct connections to existing and newly built roadways. Option 3 and 4 were moderately preferred with potential improvement required on King Street and Queen Street. Option 5 and 6 were the least preferred due to poor level of service on Healy Road and Humber Station Road. The criterion on benefits to residents was based on required road improvements mentioned above that would benefit existing and future residents. The 2014 report compared Option 1 and 3 using the similar high level approach. The criteria include road capacity and railway crossing impacts. The road capacity analysis found that more road improvements would be required to accommodate growth from Option 1, as opposed to the 2013 report when none would be required. The report concluded that Option 1 would contribute more significantly to the Coleraine Drive rail crossing than Option 3 would to the King Street rail crossing. With Option 3 being the closest to the potential GO Rail terminal site, the report concluded that Option 3 is the best option. Bolton Transportation Master Plan Region of Peel and the Town of Caledon jointly completed the Bolton Transportation Master Plan (BTMP) in 2015. The BTMP followed a comprehensive and consultative transportation master planning process consistent with a Municipal Class Environmental Assessment. It identifies transportation deficiencies and issues with the road network for the short, medium and long term. The BTMP took previous studies as input, including the BRES analysis that recommended Option 3 as the residential expansion in Bolton. It was concluded that there was no capacity deficiency on King Street and The Gore Road even if there was additional travel demand from Option 3 and from GTA West Corridor. The BTMP suggested a potential realignment of King Street to accommodate a more feasible grade separation with the rail corridor. This realignment of King Street and the grade separation is subject to ongoing discussion. Caledon Transportation Needs Study In 2004, Region of Peel and the Town of Caledon jointly undertook the Caledon Transportation Needs Study. The objective of the study was to determine the existing and future travel demands within Caledon and to recommend improvements to accommodate these demands. Future travel demands were forecasted to the year 2031. The study provided input to the update of the Town and the Regional Official Plans. The Caledon Transportation Needs Study was updated in 2009 to ensure that current travel demands were taken into consideration and to reflect the current conditions and experience.
Peel Region Long Range Transportation Plan The Long Range Transportation Master Plan (LRTP), updated in 2012, addresses the major transportation challenges that the Region of Peel expects to have over the next few decades including road congestion, and the creation of a convenient, efficient multi-modal, sustainable transportation system. The LRTP includes the Region’s current transportation system, future trends, and recommendations of addressing issues through a technical analysis and transportation demand

Transportation Assessment for the Bolton Residential Expansion Regional Official Plan Amendment Page 11
management. The LRTP provides a policy implementation framework for the Regional Official Plan to address these transportation challenges.
GTA West Corridor Environmental Assessment Study The Ministry of Transportation (MTO) initiated the GTA West Transportation Corridor Environmental Assessment (EA) study in February 2007. As an Individual EA, a Terms of Reference was prepared for approval by the Ministry of the Environment in March 2008. Following approval, the first stage of the Individual EA included preparing a transportation network strategy to address needs within the Study area from Highway 400 in the east to the Highway 401/407 interchange in the west. The Corridor is proposed to be a four to six lane freeway with a separate adjacent transitway. Stage 1 of the EA was completed with publication of a Transportation Development Strategy Report in November 2012. Stage 2 of the EA will identify the recommended route, determine interchange locations, complete the preliminary design for the new Corridor and ultimately secure EA approval to protect the Corridor while allowing development to proceed outside the affected lands. On December 2015, the Province announced that the work on the EA was being suspended pending review and that an update will be provided in spring 2016. Peel Region recognizes the importance of the GTA West Corridor as part of the integrated transportation network to manage congestion and accommodate growth. Metrolinx's Bolton Commuter Rail Feasibility Study In 2010, Metrolinx completed the Bolton Commuter Rail Feasibility Study. The study is a comprehensive review of the technical requirements to implement a commuter rail service between Bolton and the City of Toronto. The study determined that implementing rail service between Caledon, Vaughan, and Toronto was feasible, but that ridership would be modest and capital costs would be high. It did not recommend moving forward with the expansion in the short term. In February 2013, Metrolinx approved a technical update to The Big Move and moved commuter rail service to Bolton from the 0-15 year plan to its 16-25 year plan. Metrolinx is currently updating The Big Move, and will review its priority on a network-wide basis. The update is scheduled to complete in 2017. Peel and Caledon continue to advocate for the advancement of the GO Rail service to Bolton. Brampton Secondary Plan 47 Brampton’s Secondary Plan (SP) 47 is situated in northeast Brampton, directly south of Bolton. In September 2014, Brampton Council adopted an Official Plan Amendment to implement the SP 47, which is planned to accommodate 27,000 people and 20,500 jobs at build-out.
Road improvement plans in and around Bolton In the 1980s, the need for a north-south bypass around Bolton was identified. The Emil Kolb Parkway was completed in the summer of 2015 and Coleraine Drive in Caledon was widened to receive the bypass traffic. Coleraine Drive in Brampton is currently under review as part of an Environmental Assessment study jointly undertaken by Brampton and Peel Region. Also included in this study are the A2 Arterial Road, Coleraine Drive, Countryside Road, Clarkway Boulevard, and an East-West Collector.
There are other arterial road improvements including Regional Roads - Mayfield Road, Airport Road and Highway 50 - (see Table 1), as well as Simpson Road and George Bolton Parkway extension. Furthermore, the Province has initiated the detailed design work on the Highway 427 Extension (from Fogal Road to Major Mackenzie Drive), and York Region has started the review on Major Mackenzie Drive for widening, realignment and jog elimination. All of these road and highway improvements are scheduled to be completed in the next 5-10 years. These improvements are essential to accommodate the travel demand from Brampton, Bolton and other nearby communities.

Transportation Assessment for the Bolton Residential Expansion Regional Official Plan Amendment Page 12
Table 1 - Regional Road Widening Program (2016 - 2031) near Bolton
Road From To Description of Work Estimated Year of
Completion
Airport Road King Street 1 km north of Old
Church Road
Widening from 2 to 5
lanes 2021
Airport Road 1 km north of Mayfield
Road King Street
Widening from 2 to 5
lanes 2022
Highway 50 Castlemore Road Mayfield Road Widening from 5 to 7
lanes 2019
Mayfield Road Coleraine Drive Highway 50 Widening from 2 to 4
lanes 2019
Mayfield Road Airport Road Coleraine Drive Widening from 2 to 4
lanes 2020
Mayfield Road Airport Road Humber Station Road Widening from 4 to 6
lanes 2029
1.5 CLIMATE CHANGE CONSIDERATIONS
The Provincial Policy Statement requires planning decisions be made to support the reduction of greenhouse gas emissions and climate change adaptation through compact urban form, active transportation, transit, and through the strategic location of freight-intensive industries. Transportation is acknowledged as a major source of greenhouse gas emissions in Ontario. However, the quantitative prediction of greenhouse gas emissions is outside the scope of this assessment. As such, greenhouse gas emissions will not be specifically evaluated as a criterion in this report. Nevertheless, opportunities to reduce greenhouse gas emissions from transportation-related sources are discussed throughout this report. These include reducing the vehicle-kilometres-travelled (s3.1.1) and enhancing transit services (s3.3), carpooling opportunities (s3.4), and active transportation trips (s3.5).

Transportation Assessment for the Bolton Residential Expansion Regional Official Plan Amendment Page 13
2.0 TRANSPORTATION PLANNING PRINCIPLES AND CRITERIA
From the perspective of regional transportation planning, guiding principles and criteria were established to form a framework for this transportation assessment.
2.1 PLANNING PRINCIPLES FOR ALLOCATING GROWTH
The following are the general principles for planning and allocating growth, as presented at the Growth Management Committee on March 3, 2016:
Efficient utilization of existing and planned Regional infrastructure
Support “growth pays for growth” to minimize financial impacts to residents and businesses
Protection of environmental and agricultural resources
Densities that support transit, affordable housing and complete communities
Planning for a range of employment over the long term to adjust to market cycles
2.2 TRANSPORTATION PLANNING PRINCIPLES FOR ALLOCATING GROWTH
Based on the philosophy from the Region's Strategic Plan, Official Plan, Long Range Transportation Plan and the above planning principles for growth allocation, the following are the specific transportation planning principles being considered in this assessment:
Consider direct and indirect transportation opportunities/impacts to all environments such as road congestion, air/noise pollution due to vehicle emission, cultural/heritage influence, and economic/financial factors;
Optimize existing transportation capacity (i.e. road, highway, transit, carpool facilities, active transportation facilities) before considering any capacity expansions;
Consider the availability of accessing all modes of transportation for all users (i.e. car drivers, transit rider, pedestrian, cyclists, truck drivers, and carpoolers), and consider the interrelationship among all users;
Collaborate with all levels of government, private sectors, members of the public, and other stakeholders;
The allocation of growth, type of development (e.g. mixed use), and density shall provide the opportunity to encourage public transit, active transportation, and carpooling, and the minimization of trip length.
Sustainable transportation measures shall be the prime solution to addressing long-term transportation challenges.
2.3 TRANSPORTATION CRITERIA
The following transportation criteria were identified in order to assess each of the potential expansion options being considered for the Bolton Residential Expansion:
1. Future Infrastructure Improvements a. Regional Road Capacity b. Intersection Improvement c. Regional Road – Rail Crossings
2. Road/Highway network efficiency 3. Transit opportunities 4. Carpool opportunities 5. Active transportation opportunities 6. Impacts to Goods movement

Transportation Assessment for the Bolton Residential Expansion Regional Official Plan Amendment Page 14
3.0 ASSESSMENT AND EVALUATION
The transportation criteria were assessed qualitatively based on the transportation planning principles, and quantitatively based on factual evidence and empirical analysis. All criteria were evaluated equally and objectively. Information from the previous BRES transportation work and all other recent studies have been taken as input to the evaluation. In order to evaluate the potential transportation impacts, it is useful to consider the mobility and accessibility of each expansion option. Mobility is the measure of how easy it is to travel from one point to another, and it is usually interpreted through a volume-to-capacity ratio or the travel time. A conventional remedy to improve mobility in a car-oriented environment is by increasing road and highway capacity, which is discussed in Section 3.1.1 and 3.2. A more sustainable remedy to improve mobility is by enhancing transit services and fostering opportunities for carpooling and active transportation, which are discussed in the Sections 3.3, 3.4, and 3.5. Finally, the potential impacts to truck traffic are considered in Section 3.6. Accessibility is the measure of how easy it is to access or circulate in and out of a certain location, and it is usually quantified by the level of service and time delays. Intersection improvements and rail grade separation are being evaluated to determine the efficiency of the transportation system, and they are discussed in Sections 3.1.2 and 3.1.3 respectively.
3.1 FUTURE INFRASTRUCTURE IMPROVEMENT
This section evaluates the need for future infrastructure improvements that are directly caused by increased travel demand generated through the Bolton Residential Expansion.
3.1.1 REGIONAL ROAD CAPACITY
A level of service (LoS) assessment was completed to analyze the traffic impact of the eight options on existing Regional road capacity. The assessment was completed by forecasting traffic to 2031 during the morning peak hour and determining which segments of roadway would be congested (LoS E or LoS F). The full report can be found in Appendix A. Existing Conditions The Regional road network in Bolton includes Highway 50, King Street, Mayfield Road, Coleraine Drive, and Emil Kolb Parkway.
Highway 50 runs north-south and has a four lane urban cross section with varying right-of-ways (45m –south of Bolton, 20m – in Bolton, 36m – north of Bolton).
Coleraine Drive runs north-south and is a four lane arterial roadway between King Street and Mayfield Road. It has a right-of-way of 36m. North of King Street, Coleraine Drive becomes Emil Kolb Parkway which serves as the designated north-south truck route to by-pass Bolton.
King Street is a two lane arterial road running east-west from Winston Churchill to Caledon-King Townline. The right-of-way is 30m except within Bolton where it is 20m.
Mayfield Road is a two lane Regional Road with a rural cross-section. Mayfield Road runs east-west from Winston Churchill to Highway 50. The right-of-way is 50m.
Planned road improvements were discussed earlier in section 1.4 and detailed in Table 1. Road widenings are expected on Airport Road, Mayfield Road, and Highway 50. Road widening was also recently completed for Coleraine Drive.

Transportation Assessment for the Bolton Residential Expansion Regional Official Plan Amendment Page 15
Existing Travel Behaviour
Based on data from the Transportation Tomorrow Survey and the Bolton Transportation Master Plan, approximately 40% of trips are internal to Bolton as shown on Figure 6. The dominant travel pattern for the remaining trips is to nearby municipalities to the south and east of Bolton, including Brampton, Mississauga, Toronto, and York Region.
Figure 6- Trips From and To Bolton during the AM Peak Period (Source: TTS and BTMP)
Road congestion caused by Expansion Options Table 2 below indicates roadway segments that are projected to become congested by 2031. Under the base scenario (no expansion option selected), it was found that approximately 4 km of Regional roadways would become congested. This includes sections of Highway 50 within the Bolton community. It also indicates that options 1, 2, 3, and 4 are expected to create the greatest amount of congested roadways, including portions of King Street, Highway 50, and Coleraine Drive. Options 5, 6, 7, and 8 are expected to create the least amount of congested roadways. Congestion is expected primarily on Highway 50. This finding is appropriate when considering the dominant travel pattern to and from Brampton, Mississauga, Toronto, and York Region. Table 2 - Congested Regional Roadway Segments by 2031 in Bolton
KM 2011
EXPANSION OPTIONS
1 2 3 4 5 6 7 8
WB King
Street
Harvest Moon
Drive to The
Gore Road
2
WB King
Street
Harvest Moon
Drive to Humber
Station Road
0.85
EB King
Street
The Gore Road
to Harvest Moon
Drive
2
EB King
Street
The Gore Road
to Humber
Station Road
1.5
SB Highway
50
Columbia Way
to King Street 2
SB Highway
50
Ellwood Drive to
Mayfield Road 4

Transportation Assessment for the Bolton Residential Expansion Regional Official Plan Amendment Page 16
SB Highway
50
Wilton Drive to
Mayfield Road 3.5
SB Highway
50
Queensgate
Boulevard to
Parr Boulevard
2
SB Coleraine
Drive
Parr Boulevard
to Mayfield Road 0.8
SB The Gore
Road
King Street to
Healey Road 3
NB Highway
50
King Street to
Columbia Way 2
NB Highway
50
Mayfield Road to
Parr Boulevard 0.7
Congested Regional Roadways (km) 4 10.8 10.7 10 12.5 6.9 6 7.5 5.5
Based on the above, Table 3 provides an evaluation on the utilization of roadway capacity. Table 3 - Evaluation of Regional Road Capacity
Expansion Option
Regional Road Capacity Rationale
Option 1 Achieves least Traffic contributes to congestion on Highway 50 and King Street
Option 2 Achieves least Traffic contributes to congestion on Highway 50 and King Street
Option 3 Achieves least Traffic contributes to congestion on Highway 50 and King Street
Option 4 Achieves least Traffic contributes to congestion on Highway 50, King Street, and The Gore Road.
Option 5 Achieves most Least amount of new congestion along Highway 50.
Option 6 Achieves most Least amount of new congestion along Highway 50.
Option 7 Achieves somewhat Traffic contributes to congestion on King Street.
Option 8 Achieves most Least amount of new congestion along Highway 50.
3.1.2 INTERSECTION IMPROVEMENTS
CIMA+ was retained to undertake a comprehensive traffic impact study to identify intersection improvements. This level of intersection analysis is required to effectively compare different expansion options, and this type of analysis has never been done in the past. The full report can be found in Appendix B which outlines the background, methodology, and findings. In summary, the improvement needs for the residential land options in the north is more than the ones in the south, because of the general flow of commuting traffic during morning peak period from north to south. An opposing traffic flow is expected for the triangle lands (Option 8) but this is expected to be a minimal amount due to the smaller land area, and as there are often excessive capacities in the non-peak direction (e.g. northbound in the morning on Highway 50). The list of improvements for each of the expansion options can be found in Appendix B. It is noted that Option 6 and 8 have frontage onto Mayfield Road which is scheduled for widening and intersection improvement regardless of the BRES development. In summary, Table 4 is the evaluation on utilizing existing intersection capacity, with the scoring representing little, some, and many improvements required respectively. The table also includes the associated cost estimates for the intersection improvements. The cost estimates include design, property acquisition where required, construction, and signals installation.

Transportation Assessment for the Bolton Residential Expansion Regional Official Plan Amendment Page 17
Table 4 - Evaluation of Required Intersection Improvements
Expansion Option
Utilization of Intersection Capacity
Rationale Cost of intersection improvements
Option 1 Achieves least $ 7.7 million
Option 2 Achieves somewhat $ 4.2 million
Option 3 Achieves somewhat $ 4.1 million
Option 4 Achieves somewhat $ 4.0 million
Option 5 Achieves most $ 2.0 million
Option 6 Achieves most $ 1.0 million
Option 7 Achieves most $ 1.0 million
Option 8 Achieves most $ 0.0 million
3.1.3 REGIONAL ROAD RAIL CROSSINGS
The Bolton Transportation Master Plan identifies three at-grade rail crossings in Bolton: King Street or re-aligned King Street, Coleraine Road, and Albion-Vaughan Road. Travel modelling was completed to identify the amount of trips generated by each of the expansion options at the rail crossings. This section summarizes the findings in Appendix C, which analyzes the traffic generated by each expansion option and any resulting need for grade-separated rail crossings. For the purposes of this study, analysis was scoped to the two existing Regional Road crossings at King Street and the Coleraine Drive. Existing Conditions at Rail Crossings Based on EMME modelling, it is anticipated that Options 1, 3, and 4 will have the largest impact on the amount of traffic using the Coleraine Drive rail crossing. As Table 5 indicates, these three options are estimated to generate between 10% - 20% of the total traffic during the morning peak hour. Table 5 - Morning Peak Hour Traffic at Coleraine Drive Rail Crossing by 2031
Expansion Option Traffic Contribution by
Expansion Option (%) Background Traffic (%)
Option 1 15 85
Option 2 0 100
Option 3 20 80
Option 4 10 90
Option 5 0 100
Option 6 0 100
Option 7 0 100
Option 8 0 100
At the King Street crossing, Option 3 and 4 will generate the most traffic – approximately 45% of the total traffic during the morning peak hour (see Table 6). Options 1, 2, and 7 are expected to generate less than 10% of the total traffic, while the remaining options will have a nominal impact on traffic volumes.
Table 6 - Morning Peak Hour Traffic at King Street Rail Crossing by 2031
Expansion Option Traffic Contribution by
Expansion Option (%) Background Traffic (%)
Option 1 10 90
Option 2 10 90
Option 3 45 55
Option 4 45 55

Transportation Assessment for the Bolton Residential Expansion Regional Official Plan Amendment Page 18
Option 5 0 100
Option 6 0 100
Option 7 5 95
Option 8 0 100
Need for Grade Separation Transport Canada encourages the use of an exposure index (average number of vehicles multiplied by the average number of trains) threshold of 200,000 as one of the factors in determining the need for grade separation. The estimated exposure index at both Coleraine and King rail crossings is shown in Figure 7. It is noted that the exposure index is a useful screening tool to objectively measure the amount of train and road traffic at a particular location. Other factors may need to be considered to ultimately decide whether a grade separation is warranted. Based on the exposure index at the Coleraine rail crossing, the background vehicular and rail traffic alone far exceeds the recommended threshold. A grade separated crossing would be recommended regardless of the preferred expansion option. The King rail crossing is projected to be under less pressure for grade separation. Based on the exposure index at the King rail crossing, only Options 3 and 4 would generate enough new vehicular traffic to meet the threshold.
Figure 7 - Estimated Exposure Index at the Coleraine Drive and King Street Rail Crossings
Cost Estimates for Grade Separation A study is being undertaken for grade separation at King Street and Coleraine Drive, including the feasibility of either an overpass or an underpass. The cost for an overpass is estimated to be $20 million, while an underpass is estimated to be $40 million. As a municipally-driven project, an 85-15 cost sharing ratio is expected between the Region and the rail operator. As noted earlier, the need for the Coleraine rail crossing would be warranted based on the background traffic. As such, it is concluded that none of the expansion options will create any incremental capital costs for the Region at this location.

Transportation Assessment for the Bolton Residential Expansion Regional Official Plan Amendment Page 19
For the King Street rail crossing, the grade separation is expected to be triggered by only Options 3 and 4. Of the Regional portion, 55% of the costs can be attributed to the background traffic while 45% is attributable to traffic from Options 3 or 4. As such, it is estimated that $6.7 million would be attributable to the residential expansion. Preliminary estimates on capital costs for the King Street rail crossing are shown below in Table 7. Table 7 - Estimated cost of King Street Rail Crossing for Options 3 and 4
Cost Sharing Party Portion of Cost Cost
Rail Owner Canadian Pacific (15% of
total cost)
15% of total costs 20 x 15% =
$3 million
Municipality –
Region of Peel
Region of Peel –
Background traffic
85% of total costs
multiplied by 55% of total
traffic (background traffic)
20 x 85% x 55% =
$9.3 million
Region of Peel –
Traffic attributable to
Options 3 and 4
85% of total costs
multiplied by 45% of total
traffic (traffic generated
by Option 3 and 4)
20 x 85% x 45% =
$6.7 million
Total Costs $20 Million
Based on the above, Table 4 provides an evaluation on the impacts to rail crossings for Regional Roads. Table 8 - Evaluation of Regional Road Rail Crossings
Expansion option
Regional Road Rail Crossings
Rationale Contribution to King Street Grade Separation
Option 1 Achieves somewhat Traffic contribution = 10% Need for grade separation = Beyond 2031
Option 2 Achieves somewhat Traffic contribution = 10% Need for grade separation = Beyond 2031
Option 3 Achieves least Traffic contribution = 45% Need for grade separation = 2031
Option 4 Achieves least Traffic contribution = 45% Need for grade separation = 2031
Option 5 Achieves most Traffic contribution = 0% Need for grade separation = Beyond 2031
Option 6 Achieves most Traffic contribution = 0% Need for grade separation = Beyond 2031
Option 7 Achieves somewhat Traffic contribution = 5% Need for grade separation = Beyond 2031
Option 8 Achieves most Traffic contribution = 0% Need for grade separation = Beyond 2031
3.2 ROAD/HIGHWAY NETWORK EFFICIENCY
The measure of the transportation network efficiency is based primarily on an expansion option’s connectivity to the overall road network. For the purposes of this evaluation, the layout of internal road systems is recognized to be an exercise of subsequent planning approvals. Therefore, this section looks at each expansion option and the potential connections to the existing road network, in particular to arterial roads and highways. Further, this section also considers the impacts of the potential GTA West Corridor. As described in Section 1.4, the Ministry of Transportation had been studying a potential east-west transportation corridor

Transportation Assessment for the Bolton Residential Expansion Regional Official Plan Amendment Page 20
which is critical to meeting growth targets in Peel. The continued protection of lands for the corridor is important not only for the development of an inter-regional freeway, but also for the provision of an inter-regional transitway and a hydro corridor for Hydro One. Most of the options are well connected to the existing road network, with opportunities to connect to multiple arterial roads. In this regard, Option 2 (eastern portion) is the only area that would rely solely on one road connection – Mount Hope Road. Upgrades to this roadway may be required as the key north-south road. Option 6 and 8 remain under the GTA West Focused Analysis Area for the GTA West Corridor Stage 2 study. Lands are recommended to remain under protection pending a final decision by the MTO on the GTA West Corridor. This will ensure that development does not prejudice the freeway construction. Should the GTA West Corridor continue, it is recommended that land in proximity to the freeway alignment be planned in a manner to best capture the associated transportation benefits. In particular, the suitability and demand for industrial or higher density residential land uses should be considered in locations with superior access to the Provincial Highway system. Table 9 - Evaluation of Road/Highway Network Efficiency
Expansion Option
Road/Highway Network Efficiency
Rationale
Option 1 Achieves most Greatest connectivity with major arterial roads (EKP, Coleraine Drive and King Street) with good mobility and accessibility to destinations
Option 2 Achieves somewhat Somewhat good connectivity with major arterial roads (EKP, Queen St, AVTL) but may require upgrade to Mount Hope as a key N-S connector
Option 3 Achieves most Great connectivity to all directions because of the square shape, will require a grid internal network
Option 4 Achieves most Great connectivity to all directions because of the square shape, will require a grid internal network
Option 5 Achieves most Great connectivity to all directions because of the square shape, will require a grid internal network
Option 6 Achieves least Location is interfered by the potential GTA West Corridor alignment. Opportunity in the long term to integrate development with the alignment and interchange with higher density residential and/or employment land.
Option 7 Achieves somewhat Good connectivity with major arterial roads (EKP, Coleraine Drive and King Street)
Option 8 Achieves least Location is interfered by the potential GTA West Corridor alignment. Opportunity in the long term to integrate development with the alignment and interchange with higher density residential and/or employment land.
3.3 TRANSIT OPPORTUNITIES
According to the observed travel pattern for the current Bolton residents, less than 10 percent of the total trips are made by public transit. This section analyzes each expansion option based on the proximity between each expansion option and existing or future potential transit services. Existing Transit Services Figure 8 illustrates the current GO bus stop location in Bolton. As of April 2016, there are two GO Bus services in Bolton which operate on weekdays:

Transportation Assessment for the Bolton Residential Expansion Regional Official Plan Amendment Page 21
Route 38 travels along Highway 50, with 6 southbound buses from Bolton between 6 a.m. and the early afternoon, and 7 northbound buses from Malton GO station spread throughout the day. Connecting GO Rail and local bus routes provide links to Mississauga, Brampton and Toronto.
Route 38A travels along Highways 27 and 401, with 2 southbound buses from Bolton in the morning and 2 northbound buses from York Mills in the afternoon. Route 38A connects to Nobleton, Kleinberg, Humber College, and North York. There are connecting services to and from Downtown Toronto by train at Etobicoke North GO station and subway at Yorkdale/York Mills station.
In general, GO Bus stops are located along Highway 50 with stops at Columbia Way (Route 38), Wilton Drive (Route 38 & 38A), and Mayfield Road (Route 38).
Figure 8 - Existing and Future Potential Transit Services in Bolton
Future Potential Transit Services In the short to medium timeframe, the potential of increasing transit ridership could be driven by several transit service improvements, such as Brampton Transit service improvement to northeast Brampton (Secondary Plan 47 lands). Extensions may occur along Mayfield Road, Clarkway Drive, or Highway 50, with the existing Mayfield/Highway 50 Commuter Lot serving as a possible western terminus. GO Bus service review may occur as part of the subway extension to Vaughan Metropolitan Centre or through the update of the Regional Transportation Plan. As noted earlier in section 1.4, Metrolinx completed the Bolton Commuter Rail Feasibility Study in 2010. Potential GO Rail service will also be reviewed and prioritized as part of the update of the Regional Transportation Plan, anticipated in 2017. The location of the proposed GO Rail Station Terminal is found on Map 3. In the longer term, an ultimate transportation vision includes transit that provides services to the residents and businesses in Bolton. In the context of this settlement expansion, it is important to consider the ability of expansion areas to be designed in a manner that is transit-supportive. This includes establishing a well-connected road network, encouraging a mix of uses to meet the needs of local residents, ensuring minimum densities are met, and encouraging a robust walking and cycling network. In general, these principles can be applied for all expansion options through subsequent planning exercises. The consideration of these principles can help to ensure that the planned growth will help to promote the creation of an effective and connected transit system in Bolton. Proximity to Existing and Future Potential Transit Services The distance to existing and planned transit services were analyzed for all expansion options. Options 1 and 2 are the closest and within one kilometre of an existing GO Bus stop, followed by Options 6, 7, and 8. The remaining options are all over 3 kilometres away from existing GO Bus service.

Transportation Assessment for the Bolton Residential Expansion Regional Official Plan Amendment Page 22
Table 10 - Distance to Existing GO Bus Stops
Distance Expansion Option
< 1 km Options 1 and 2
1 – 2 km Options 6, 7, and 8
2+ km Options 3, 4, and 5
In terms of future transit services, Option 6 and 8 are the only options in proximity to Mayfield Road which may benefit from future Brampton Transit service improvements to northeast Brampton upon the development of the Secondary Plan 47 lands. Options 3 and 4 are closest to the potential GO Rail Station proposed at King and Humber Station. For longer term consideration, it is recognized that all expansion options can benefit from the potential Bolton GO Rail service. Based on the above, Table 11 is the evaluation on transit opportunities and the associated rationale.
Table 11 - Evaluation of Transit Opportunities
Expansion Option
Transit opportunities
Rationale
Option 1 Achieves most
Closest to the two existing GO bus routes
Option 2 Achieves somewhat
Walkable/bikeable distance from the existing GO bus routes
Option 3 Achieves somewhat
Furthest from any existing transit service, but closest to the longer term GO rail service station
Option 4 Achieves somewhat
Furthest from any existing transit service, but closest to the longer term GO rail service station
Option 5 Achieves least Not in close proximity to any existing and future transit services
Option 6 Achieves most
Bikeable distance to the Commuter Lot at Mayfield Road/Highway 50; leverage from Brampton transit once SP 47 is developed
Option 7 Achieves somewhat
Walkable/bikeable distance from the existing GO bus routes
Option 8 Achieves most
Bikeable distance to the Commuter Lot at Mayfield Road/Highway 50; leverage from Brampton transit once SP 47 is developed
3.4 CARPOOL OPPORTUNITIES
Carpooling initiatives are an important transportation demand management tool to increase vehicle occupancy rates and reduce the amount of vehicles on the road network. This criteria looks at the proximity and ease of access of expansion options to the existing carpool lot at Highway 50/Mayfield Road as well as existing or planned High Occupancy Vehicle (HOV) lanes. Existing and Planned Carpool Facilities In 2010, the Region of Peel constructed the Highway 50/Mayfield Commuter Lot. The facility offers over 200 parking spaces and direct access to GO Bus Route 38 towards Mississauga (Malton GO Station). Future HOV lanes are planned in the vicinity of Bolton which will improve connectivity south towards Mississauga and Toronto, and east towards York Region.
Highway 427 – The Ministry of Transportation is proceeding with the extension of Highway 427 to Major Mackenzie Road. The highway will also be widened south of Highway 7 and approximately 15.5 km of High Occupancy Toll (HOT) lanes are planned from Rutherford Road to south of Highway 409.
Major Mackenzie Road – York Region completed the Western Vaughan Transportation Improvements EA which recommended the widening of Major Mackenzie Road to six lanes and the inclusion of HOV lanes between Highway 50 and Highway 400.

Transportation Assessment for the Bolton Residential Expansion Regional Official Plan Amendment Page 23
Access to Existing and Planned Carpool Facilities
In general, existing and planned carpool facilities are located south of Bolton. Options 6 and 8 provide the closest and most direct access to the Highway 50/Mayfield Commuter Lot and to the HOT/HOV lanes planned for Major Mackenzie Road and Highway 427. They are followed by Options 1 and 2, which have the most access via Highway 50 to the Commuter Lot as well as the HOT/HOV network at Major Mackenzie Road. Options 3, 4, and 5 are least preferred due to their distance and the lack of a direct route to carpooling facilities. Based on the above, Table 12 provides an evaluation on carpooling opportunities and the associated rationale. Table 12 - Evaluation of Carpooling Opportunities
Expansion Option
Carpooling opportunities
Rationale
Option 1 Achieves somewhat
Access via Highway 50 to the HOV network on future Major Mackenzie Drive, Highway 427 (planned widening and extension), and the Mayfield/50 Commuter Lot
Option 2 Achieves somewhat
Access via Highway 50 to the HOV network on future Major Mackenzie Drive, Highway 427 (planned widening and extension), and the Mayfield/50 Commuter Lot
Option 3 Achieves least
Farthest away from any existing and planned HOV network and carpool lot
Option 4 Achieves least
Farthest away from any existing and planned HOV network and carpool lot
Option 5 Achieves least
Farthest away from any existing and planned HOV network and carpool lot
Option 6 Achieves most
Access via Highway 50 to the HOV network on future Major Mackenzie Drive, Highway 427 (planned widening and extension), and the Mayfield/50 Commuter Lot
Option 7 Achieves somewhat
Access via Highway 50 to the HOV network on future Major Mackenzie Drive, Highway 427 (planned widening and extension), and the Mayfield/50 Commuter Lot
Option 8 Achieves most
Access via Highway 50 and Mayfield Road to the HOV network on future Major Mackenzie Drive, Highway 427 (planned widening and extension), and the Mayfield/50 Commuter Lot
3.5 ACTIVE TRANSPORTATION OPPORTUNITIES
Active Transportation initiatives encourage the shift from vehicular-based travel to walking and cycling. For the purposes of this evaluation, it is assumed that each expansion option will implement active transportation facilities within the internal transportation network. As such, to compare the active transportation opportunities of each option, this section looks at the proximity to existing active transportation network, and the distance to existing community destinations. Existing and Proposed Active Transportation Facilities Existing and proposed active transportation facilities were identified through the Bolton Transportation Master Plan. The majority of these facilities are located north of the railroad tracks within the existing residential neighbourhoods. South of the railroad tracks, the active transportation network is largely limited to the sidewalks along local and regional roads. The Bolton Transportation Master Plan also identified issues of connectivity, such as along the Highway 50 railway separation where sidewalks are
Transportation Assessment for the Bolton Residential Expansion Regional Official Plan Amendment Page 24
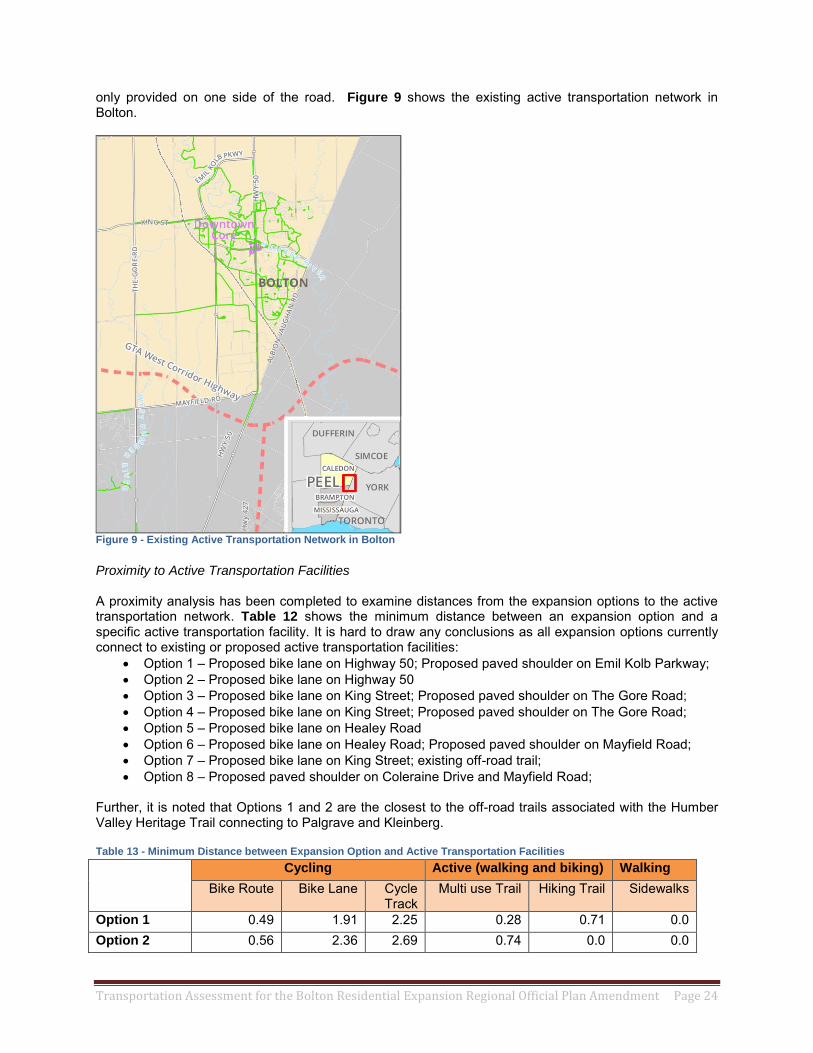
only provided on one side of the road. Figure 9 shows the existing active transportation network in Bolton.
Figure 9 - Existing Active Transportation Network in Bolton
Proximity to Active Transportation Facilities
A proximity analysis has been completed to examine distances from the expansion options to the active transportation network. Table 12 shows the minimum distance between an expansion option and a specific active transportation facility. It is hard to draw any conclusions as all expansion options currently connect to existing or proposed active transportation facilities:
Option 1 – Proposed bike lane on Highway 50; Proposed paved shoulder on Emil Kolb Parkway;
Option 2 – Proposed bike lane on Highway 50
Option 3 – Proposed bike lane on King Street; Proposed paved shoulder on The Gore Road;
Option 4 – Proposed bike lane on King Street; Proposed paved shoulder on The Gore Road;
Option 5 – Proposed bike lane on Healey Road
Option 6 – Proposed bike lane on Healey Road; Proposed paved shoulder on Mayfield Road;
Option 7 – Proposed bike lane on King Street; existing off-road trail;
Option 8 – Proposed paved shoulder on Coleraine Drive and Mayfield Road; Further, it is noted that Options 1 and 2 are the closest to the off-road trails associated with the Humber Valley Heritage Trail connecting to Palgrave and Kleinberg. Table 13 - Minimum Distance between Expansion Option and Active Transportation Facilities
Cycling Active (walking and biking) Walking
Bike Route Bike Lane Cycle Track
Multi use Trail Hiking Trail Sidewalks
Option 1 0.49 1.91 2.25 0.28 0.71 0.0
Option 2 0.56 2.36 2.69 0.74 0.0 0.0

Transportation Assessment for the Bolton Residential Expansion Regional Official Plan Amendment Page 25
Option 3 0.82 2.62 3.63 1.1 1.52 0.0
Option 4 1.22 1.84 4.04 1.51 1.93 0.0
Option 5 2.03 0 3.28 2.32 2.74 1.2
Option 6 2.3 0 3.35 1.62 4.59 0.0
Option 7 Average
0.09 1.52 2.30 0.09 0.22 0.0
Option 8 4.43 3.18 4.56 1.4 6.02 0.0
Proximity to Community Destinations Spatial analysis was completed for the distance to key community services, including elementary and secondary schools, parks, and institutional land uses. Expansion options which are closer to existing community destinations have the opportunity to encourage trips to be made through active transportation. Peel’s Active Transportation Plan considers trips under 2 km to be suitable for walking and trips under 7 km to be suitable for cycling. As can be seen in Table 14, Options 1, 2, and 7 appear to offer the greatest access to most community destinations and almost all community destinations can be accessed in under 3 km. They are followed by Options 3, 4, and 5 which offer some opportunity to encourage trips done through active transportation. Finally, Options 6 and 8 appear to offer the least opportunity to encourage active transportation trips due to the existing distance to services. It is noted that this analysis does not take into account planned growth occurring south of Mayfield Road, in Brampton’s Highway 427 Industrial Secondary Plan – SP 47. Based on the adopted land use schedules, neighbourhood retail, service commercial, neighbourhood parks, and an elementary school are anticipated within one kilometre of the Mayfield/Humber Station intersection, and by extension, Option 6. Table 14 - Minimum Distance from Expansion Options to Community Destinations in Bolton
Minimum Distance to Community Destinations (km)
Public Elementary
Public Secondary
Catholic Elementary
Catholic Secondary
Park Post Office
Library Community Centre
Pharmacy
Option 1 2.82 3.52 2.18 1.84 1.54 3.39 3.66 1.57 3.48
Option 2 2.92 2.89 2.79 2.1 1.62 4.14 4.39 2.74 3.96
Option 3 2.01 6.03 2.58 7.06 2.4 4.6 5.16 5.16 4.99
Option 4 2.08 6.07 2.54 7.03 2.36 4.57 5.13 5.13 4.95
Option 5 4.04 6.96 3.43 7.92 3.25 5.42 5.73 5.73 4.78
Option 6 6.47 7.99 4.24 8.29 3.89 6.32 6.63 6.63 5.52
Option 7 Average 2.60 3.38 1.13 3.16 0.42 2.33 2.80 2.09 2.61
Option 7 A 2.88 3.56 1.4 4.07 0.14 2.06 2.63 2.62 2.44
Option 7 B 3.32 4.31 1.03 4.83 0.85 2.8 3.36 3.36 3.19
Option 7 C 1.59 2.29 0.95 0.6 0.27 2.12 2.39 0.3 2.21
Option 8 6.31 7.79 3.73 7.79 3.39 5.89 6.64 6.64 3.08
Trips under 2 km
2 km to 5 km
More than 5 km

Transportation Assessment for the Bolton Residential Expansion Regional Official Plan Amendment Page 26
Based on the above, Table 15 provides an evaluation on active transportation opportunities and the associated rationale. Table 15 - Evaluation of Active Transportation Opportunities
Expansion Option
Active transportation opportunities
Rationale
Option 1 Achieves most
Great access to Humber Valley Heritage Trail; proximity to key community destinations via a direct AT route (Queen Street)
Option 2 Achieves most
Great access to Humber Valley Heritage Trail; proximity to key community destinations via a direct AT route (Queen Street and Columbia Way)
Option 3 Achieves somewhat
Good access to Humber Valley Heritage Trail via King Street, but relatively further from the downtown core and other community services and destinations
Option 4 Achieves somewhat
Good access to Humber Valley Heritage Trail via King Street, but relatively further from the downtown core and other community services and destinations
Option 5 Achieves somewhat
Access to proposed bike route on Healey Road, but not in close proximity to any off-road routes, or community services and destinations
Option 6 Achieves somewhat
Good access to bike route and paved shoulders via Healey Rd and Mayfield Road, and within walking distance to planned Brampton communities.
Option 7 Achieves most
Good access to Humber Valley Heritage Trail, and in close proximity to downtown via King Street, Glasgow Road, and Queen Street
Option 8 Achieves somewhat
Good access to paved shoulders via Coleraine Drive and Mayfield Road, and within walking distance to planned Brampton communities.
3.6 IMPACTS TO GOODS MOVEMENT
Peel Region endorsed the Strategic Goods Movement Network Study (SGMNS) in 2013 which identified primary truck routes, as shown on Figure 10. In Bolton, truck routes include Emil Kolb Parkway, Coleraine Drive, George Bolton Parkway, Parr Blvd, Albion Vaughan Road, The Gore Road, Mayfield Road, Highway 50 (outside of Bolton core), and King Street (outside of Bolton core). Truck restrictions have been placed on Highway 50 (Bolton core) and King Street (Bolton core). The focus of this section will be to identify opportunities to minimize the impacts of goods movement on residential communities, and vice versa. Minimizing Impacts of Goods Movement on Residential Neighbourhoods The truck routes identified in the SGMNS generate noise and dust pollution. As such, these routes are less suitable to be in proximity to residential neighbourhoods.

Transportation Assessment for the Bolton Residential Expansion Regional Official Plan Amendment Page 27
Figure 10 - Truck Route and Restrictions around Bolton
Minimizing Impacts of New Residential Growth on Existing Truck Routes The Bolton Residential Expansion is not expected to generate large amounts of truck traffic. However, new vehicular traffic may negatively affect existing roadway capacity on current truck routes. This may lead to overall increased congestion and longer delay times for all vehicles. As such, to measure the potential impacts to goods movement, expansion options which can be accessed by non-truck routes are preferred. Option 5 and 6 are anticipated to have the least impact to goods movement due to the opportunity to access non-truck routes on Healey Road and Humber Station Road. Option 1, 2, and 7 are somewhat preferred as they are serviced by truck-restricted routes of King Street and Queen Street. However, commuter traffic is still expected along Emil Kolb Parkway. Options 3 and 4 are least preferred due to potential impacts onto four truck routes – Emil Kolb Parkway, King Street, The Gore Road, and Coleraine Drive. Table 16 - Evaluation of Impacts to Truck Traffic
Expansion Option
Minimize impacts to truck traffic
Rationale
Option 1 Achieves somewhat
Commuters traffic are served by a rural main street with truck restriction (Queen St) and a truck route (Emil Kolb Parkway)
Option 2 Achieves somewhat
Commuters traffic are served by a rural main street with truck restriction (Queen St) and two truck routes (Emil Kolb Parkway and Albion Vaughan Townline)
Option 3 Achieves least Commuters traffic are served by four truck routes (Emil, Kolb Parkway, King St, The Gore Road, and Coleraine Drive)
Option 4 Achieves least Commuters traffic are served by four truck routes (Emil, Kolb Parkway, King St, The Gore Road, and Coleraine Drive)
Option 5 Achieves most Commuters traffic are served by non-truck routes (Healey Rd, Humber Station Rd)
Option 6 Achieves most Commuters traffic are served by non-truck routes (Healey Rd, Humber Station Rd)
Option 7 Achieves somewhat
Commuters traffic are served by a rural main street with truck restriction (Queen St) and a truck route (Emil Kolb Parkway)
Option 8 Achieves somewhat
Commercial traffic are served by a major truck routes (Mayfield Rd)

Transportation Assessment for the Bolton Residential Expansion Regional Official Plan Amendment Page 28
4.0 SUMMARY OF ASSESSMENT
Table 17 provides an overview of all the individual transportation evaluations that have been presented in this report. It indicates that Options 6 and 8 are most preferred from a transportation standpoint. Table 17 - Summary of Overall Transportation Evaluation
Exp
an
sio
n O
pti
on
Reg
ion
al R
oad
cap
acit
y
Inte
rse
cti
on
Im
pro
vem
en
ts
Reg
ion
al R
oad
– R
ail
cro
ssin
g
Ro
ad
/Hig
hw
ay N
etw
ork
eff
icie
ncy
Tra
nsit
Carp
oo
lin
g
Acti
ve t
ran
sp
ort
ati
on
Imp
acts
to
tru
cks
Overa
ll
1 Achieves least
Achieves least
Achieves somewhat
Achieves most
Achieves most
Achieves somewhat
Achieves most
Achieves somewhat
Achieves somewhat
2 Achieves least
Achieves somewhat
Achieves somewhat
Achieves somewhat
Achieves somewhat
Achieves somewhat
Achieves most
Achieves somewhat
Achieves somewhat
3 Achieves least
Achieves somewhat
Achieves least
Achieves most
Achieves somewhat
Achieves least
Achieves somewhat
Achieves least
Achieves somewhat
4 Achieves least
Achieves somewhat
Achieves least
Achieves most
Achieves somewhat
Achieves least
Achieves somewhat
Achieves least
Achieves somewhat
5 Achieves most
Achieves most
Achieves most
Achieves most
Achieves least
Achieves least
Achieves somewhat
Achieves most
Achieves somewhat
6 Achieves most
Achieves most
Achieves most
Achieves least
Achieves most
Achieves most
Achieves somewhat
Achieves most
Achieves most
7 Achieves somewhat
Achieves most
Achieves somewhat
Achieves somewhat
Achieves somewhat
Achieves somewhat
Achieves most
Achieves somewhat
Achieves somewhat
8 Achieves most
Achieves most
Achieves most
Achieves least
Achieves most
Achieves most
Achieves somewhat
Achieves somewhat
Achieves most
Travel data from the Transportation Tomorrow Survey (TTS) indicate that the dominant travel pattern is towards the south and the east to Mississauga, Brampton, Toronto, and York Region. Keeping this in mind, it is logical that southern expansion options will take better advantage of existing road capacity and create less traffic demand on roadways within the existing community. This is in contrast to northern expansion options, such as 1 and 2, where a significant percentage of the traffic is expected to travel through Bolton in order to reach their final destinations to the south and the east. As explained in section 3.2, southern options are expected to require less infrastructure upgrades (intersection improvements, grade separation at rail crossings, road widenings). From a road network perspective, all expansion options are well connected to the existing arterial road network. However, Options 6 and 8 are the weakest option, as lands need to remain protected pending

Transportation Assessment for the Bolton Residential Expansion Regional Official Plan Amendment Page 29
the final outcome of the GTA West Corridor. Further questions concerning the suitability of employment lands should be addressed along interchange points should the GTA West proceed. From a transit perspective, Options 1, 6, and 8 are most preferred due to their proximity to the existing GO Bus service along Highway 50. Although Options 6 and 8 are slightly further than Option 1, Options 6 and 8 are the only options that stand to benefit from future planned transit service to northwest Brampton. The remaining Options (3, 4, 5) are all over 3 km from an existing GO Bus service, however, Options 3 and 4 are recognized as being the closest to the potential GO Rail service. From a carpooling perspective, existing and planned carpooling facilities are generally located to the southeast of Bolton. They include the existing Highway 50/Mayfield Commuter Lot and planned HOV lanes on Highway 427 and Major Mackenzie Road. The closest expansion options are Options 6 and 8. All options have opportunities to connect to the active transportation network. However, it was found that Options 1, 2, 6, and 8 were preferred due to their proximity to existing community destinations either in the Bolton downtown, or in planned communities in northeast Brampton. From a goods movement perspective, Options 5 and 6 are most preferred due to options to take non-truck routes on Healey Road and Humber Station Road.
4.1 FUTURE CONSIDERATIONS
It is recognized that this exercise is to identify an expansion option to accommodate planned Caledon and
Peel growth to 2031. Nevertheless, a broader and longer-term vision would facilitate future transportation
decisions in the area. The surrounding context, including northwest Brampton and Vaughan should be
taken into consideration.
Looking beyond this planning horizon, it is recommended that new boundary expansions continue to be
planned at increasingly higher densities and with a greatest mix of uses in order to enable the greatest
transportation opportunities. Complete communities planned with higher densities and a diverse mix of
uses can help to reduce trip lengths and sustain basic transit services.
Greater population in Bolton will also help to take advantage of existing or planned transportation
improvements in the area including the Bolton GO Bus service, Hwy 427 extension, potential GTA West
Corridor, Hwy 50/Mayfield Commuter Lot and high-occupancy vehicle lanes.
4.2 REGIONAL EVALUATION THEMES AND CRITERIA
In order to translate the analysis of this Report to the Regional Evaluation Themes and Criteria, the following tables have been provided which matches the criteria with the corresponding section in this assessment. Table 18. Comparing the Evaluation Themes and Criteria to the Transportation Assessment
Criteria Corresponding Section in Transportation Assessment
Criteria 2 – Can the development of transportation, water and wastewater infrastructure in the Expansion Option minimize impacts on the environment?
3.1.1 – Regional Road Capacity 3.1.2 – Intersection Improvements 3.3 – Transit 3.4 – Carpooling 3.5 – Active Transportation
Criteria 3 - Will development in the 3.1.1 – Regional Road Capacity

Transportation Assessment for the Bolton Residential Expansion Regional Official Plan Amendment Page 30
Expansion Option make the most efficient use of existing Regional transportation, water and wastewater infrastructure?
3.1.2 – Intersection Improvements 3.1.3 – Reginal Road – Rail Crossings
Criteria 4 - Is a substantial amount of new transportation, water, and wastewater infrastructure required to provide servicing in the Expansion Option?
3.1.2 – Intersection Improvements 3.1.3 – Regional Road – Rail Crossings
Criteria 5 - Can Regional transportation, water, and wastewater infrastructure be provided in a cost effective manner to properly service development in the Expansion Option and potential future Expansion Options?
3.1.2 – Intersection Improvements 3.1.3 – Regional Road – Rail Crossings
Criteria 6 - Can development in the Expansion Option support the establishment of a full range of transportation mobility options including public transit, active transportation and carpooling?
3.2 Road/Highway Network Efficiency 3.3 Transit 3.4 Carpooling 3.5 Active Transportation 3.6 Impacts to Trucks Movements
Table 19. Recommended Evaluation Results
Criteria #
Option 1 Option 2 Option 3 Option 4 Option 5 Option 6
2 Preferred somewhat
Preferred somewhat
Preferred least
Preferred least
Preferred somewhat
Preferred most
3 Preferred least
Preferred least
Preferred least
Preferred least
Preferred most
Preferred most
4 Preferred least
Preferred somewhat
Preferred least
Preferred least
Preferred most
Preferred most
5 Preferred least
Preferred somewhat
Preferred least
Preferred least
Preferred most
Preferred most
6 Preferred most
Preferred somewhat
Preferred least
Preferred least
Preferred somewhat
Preferred most

1.0 INTRODUCTION
Bolton, situated approximately 50 kilometres northwest of Toronto, is the most populated community within the Town of Caledon and is considered Caledon’s major urban centre. Much of the area surrounding Bolton is protected conservation lands and farmlands. The closest major highway is Highway 400 situated 14 km east of Bolton.
Bolton is a community that has seen rapid growth in the past 20 years. Most of Caledon’s population growth from 1996 to 2001 was dominated by Bolton (Town of Caledon, 2006). In 2001, the Bolton population was 29% above that year’s Region of Peel Official Plan projections, almost reaching the 2011 projections. In 2005, the population almost reached that year’s 2021 population forecasts.
There were many issues associated with this rapid growth. Traffic congestion, especially in the downtown area, became a large concern among Bolton residents. Regional Road 50, a major arterial road that runs through Bolton, became busy with truck traffic. Access to community services, which were mostly in the downtown Bolton area, became hindered.
As a consequence of this rapid growth, a review on land use forecasts was completed in the Town of Caledon Population and Employment Forecasts and Allocations Study (2006) and new land use forecasts for 2031 were developed.
These new land use forecasts have implications on future congestion and this report outlines recommendations on mitigating this potential issue for the Bolton Residential Expansion.
2.0 EXISTING CONDITIONS
2.1 Policy Context
2.1.1 Caledon Transportation Needs Study (2004, updated in 2009)
The Caledon Transportation Needs Study was a joint project by the Town of Caledon and the Region of Peel to determine the existing and future travel demands within Caledon and to recommend improvements to accommodate for these demands. Future travel demands were forecasted for the year 2031 and the study area included the entire municipality. The study was intended to provide input to the updating of the Official Plans at the municipal and regional level. The Caledon Transportation Needs Study was updated in 2009 to ensure that current travel demands were taken into consideration and to reflect the current conditions and experience.
2.1.2 Peel Long Range Transportation Master Plan (2012)
The Long Range Transportation Master Plan (LRTP) addresses the major transportation challenges that the Region of Peel expects to have over the next few decades including road congestion due to increased population growth and sustainable planning and protection of the environment. The LRTP documents the Region’s current transportation system, future trends, and provides recommendations to address these issues through technical analysis and transportation demand forecasting. The LRTP provides a policy implementation framework for the Regional Official Plan to address these transportation challenges.
2.1.3 GTA West Corridor Environmental Assessment (2012)
The GTA West study addresses transportation issues regarding the movement of people and goods in the GTA west area along with opportunities and possible solutions to address these
Appendix A - Evaluation of Regional Road Capacity for Bolton Residential Expansion

issues. The study recommends alternate solutions that incorporate an integrated, multi-modal transportation system to improve access between Urban Growth Centres. On December 16, 2015, the Ontario Ministry of Transportation suspended its work on this environmental assessment.
2.1.4 Bolton Residential Expansion Study (2012)
The Bolton Residential Expansion Study (BRES) was completed by the Town of Caledon to accommodate the land use allocations established by the Town’s Official Plan Amendment (OPA) 226. The land use allocations include 10,300 people and 2,600 jobs on 190 hectares of greenfield land.
2.1.5 Bolton Transportation Master Plan (2015)
The Bolton Transportation Master Plan recommends policy and infrastructure improvements to facilitate transportation planning, design and implementation changes within the community to improve quality of life, mobility, and community growth and preservation. The master plan identifies transportation and road network issues and documents potential opportunities for improvements while supporting short, medium, and long term municipal planning goals.
2.2 Regional Road Network
The key roadways in and surrounding Bolton include Highway 50, King Street, Mayfield Road, Coleraine Drive, and the Emil Kolb Parkway. The right-of-way widths can be found in Figure 1.
Highway 50 is a Regional Road running north and south and extending from Highway 407 in the south to Highway 89 in the north. Highway 50 has a four lane urban cross section with varying rights of way. South of Bolton, Highway 50’s right-of-way is 45 m, within Bolton, the right-of-way is 20 m, and north of Bolton the right-of-way is 36 m.
King Street is a two-lane Regional Road running east and west and runs from Winston Churchill Boulevard in the west to Caledon-King Townline in the east. The majority of the right-of-way is 30 m, with the right-of-way within Bolton being 20 m.
Mayfield Road is a two-lane Regional Road with a rural cross-section. Mayfield Road runs from Winston Churchill Boulevard in the west to Highway 50 in the east. The right-of-way for Mayfield Road is 50 m.
Coleraine Drive is a four lane arterial roadway between King Street and Mayfield Road. The right-of-way is 36 m. Emil Kolb Parkway was completed in August 2015. This parkway connects Coleraine Drive at King St to Highway 50. The purpose of this new road is to accommodate for increasing traffic volumes in and through Bolton and to serve as the designated north-south truck route to by-pass Bolton.
Appendix A - Evaluation of Regional Road Capacity for Bolton Residential Expansion

Figure 1: Road Right-of-Way Widths
Source: Town of Caledon, 2015
3.0 FUTURE CONDITIONS
The Region of Peel has an active ongoing program of roadway improvements to accommodate for planned growth occurring in the Region. These projects are reviewed on a regular basis and the timing and details of the projects are subject to change. Examples of planning improvements occurring around the Bolton area are shown in Table 1.
Table 1: Road Program - Planned Improvements
Road From To Description of Work Estimated year of
completion
Airport Road King St 1 km north of Old
Church Road Widening from 2 to 5
lanes 2021
Airport Road 1 km north of Mayfield
Road King St
Widening from 2 to 5 lanes
2022
Highway 50 Castlemore Road Mayfield Road Widening from 5 to 7
lanes 2019
Mayfield Road Coleraine Drive Highway 50 Widening from 2 to 4
lanes 2019
Mayfield Road Airport Rd Coleraine Drive Widening from 2 to 4
lanes 2020
Mayfield Road Airport Rd Humber Station Road Widening from 4 to 6
lanes 2029
Appendix A - Evaluation of Regional Road Capacity for Bolton Residential Expansion

4.0 ANALYSIS
4.1 Level of Service
A level of service assessment (LoS) was completed to determine if any of the eight options would trigger the need for road widening. This assessment was completed for the 2011 base scenario during the morning peak hour and for the eight options by forecasting traffic to 2031 and determining which segments of roadway would be congested (Table 2). When the volume over capacity ratio falls between 0.90 to 1.0, LoS ‘E’, or when it is over 1.0, LoS ‘F’, the roadway segment is considered congested. Volume over capacity figures for all roadway segments are shown in Appendix A.
Table 2: Congested Roadway Segments by Option
KM
OPTIONS
2011 1 2 3 4 5 6 7 8
WB King
Street
Harvest Moon
Drive to The
Gore Road
2
WB King
Street
Harvest Moon
Drive to Humber
Station Road
0.85
EB King
Street
The Gore Road
to Harvest Moon
Drive
2
EB King
Street
The Gore Road
to Humber
Station Road
1.5
SB Highway
50
Columbia Way
to King Street 2
SB Highway
50
Ellwood Drive to
Mayfield Road 4
SB Highway
50
Wilton Drive to
Mayfield Road 3.5
SB Highway
50
Queensgate
Boulevard to
Parr Boulevard
2
SB Coleraine
Drive
Parr Boulevard
to Mayfield Road 0.8
SB The Gore
Road
King Street to
Healey Road 3
NB Highway
50
King Street to
Columbia Way 2
NB Highway
50
Mayfield Road to
Parr Boulevard 0.7
TOTAL KILOMETRES CONGESTED 4 10.8 10.7 10 12.5 6.85 6 7.5 5.5
Appendix A - Evaluation of Regional Road Capacity for Bolton Residential Expansion

4.2 Environmental Constraints
Two provincial policies govern the land use within and surrounding Bolton, the Oak Ridges Moraine Conservation Plan and the Greenbelt Plan. The Oak Ridges Moraine (Figure 1) is a provincially significant landform and is generally located north of Bolton in the Town of Caledon (Town of Caledon, 2015). The Moraine performs essential ecological functions, including the provisions of significant natural habitat, the protection and maintenace of surface and groundwater resources and has a distinctive topographical scenic value. The Greenbelt Plan (Figure 1) identifies where urbanization should not occur in order to provide permanent protection to the agricultural land base and the ecological features and functions occuring on this landscape (Town of Caledon, 2015). The Protected Countryside lands identified in the Greenbelt Plan also improves linkages between these lands and the surrounding major lake systems and watersheds. In addition, Environmental Policy Areas (Figure 2), as identified in the Caledon Official Plan, form part of the Regional Greenlands System and are areas where restrictions exist on the type of infrastructure that is allowed to be erected, altered, enlarged, used, or maintained (Town of Caledon).
Figure 2: Options Plotted on Greenbelt Area and Oak Ridges Moraine Conservation Plan
Source: Town of Caledon, 2015
Appendix A - Evaluation of Regional Road Capacity for Bolton Residential Expansion

Figure 3: Options Plotted on Environmental Policy Areas
Source: Town of Caledon, 2015
5.0 CONCLUSION
Roadway segments are expected to be congested by 2031 after the implementation of the options presented in the Bolton Residential Expansion Study. These roadway segments include parts of The Gore Road, Coleraine Drive, Highway 50, and King Street. There are a few considerations for road widening. Widening of these roadways would have to take into consideration the environmental policy framework (Section 4.2 Environmental Constraints) such as articulated in the Greenbelt Plan, the Oak Ridges Moraine Conservation Plan, and municipal Official Plans. Widening would also have to take into consideration the road right-of-way widths (Section 2.2 Regional Road Network).
In addition, the congestion in some options are localized road widening would only have to be considered for a small roadway segment. For example, a common roadway segment that is congested in all the options is King Street from Harvest Moon Drive to The Gore Road. This two-kilometre segment provides the last-mile trip into the Bolton area, and in most options, the rest of King Street is not congested. Widening may not be the most cost-effective solution as it may provide a poor return on investment. In the long term, widening can induce demand causing further congestion. Based on these considerations, the following recommendations to mitigate the congestion are the following:
Create an effective access control strategy that allows traffic to turn and access major corridors without disrupting the flow of their through traffic;
Coordinate the signal timings in the study area;
Appendix A - Evaluation of Regional Road Capacity for Bolton Residential Expansion

Widen roadways if necessary, but as a final option.
Furthermore, the recommendation for the Bolton Residential Expansion Study is to also follow the preferred alternative documented in the Bolton Transportation Master Plan (BTMP). The projects in this alternative include:
Albion Vaughan Road widening from two to four lanes from Mayfield Road to King Street;
Queen Street narrowing from four to two lanes from Hickman Street to south of King Street in the downtown core (to support the downtown Bolton vision)
King Street realignment;
George Bolton Parkway extension east to Industrial Road.
The road network of this preferred alternative is shown in Appendix B.
According to the BTMP, people and customers of Bolton want the downtown core to be more pedestrian-friendly and to shift the focus away from heavy through traffic (Region of Peel; MMM Group, 2015). The goal is to embrace the concept of “complete streets” so that the street network is designed to embrace all modes of transportation, including walking and cycling, and all transportation system users. The BTMP recommends a mix of transportation demand management strategies and infrastructure improvements in order to achieve this objective. It is recommended that the BRES should also follow this vision for Bolton.
Appendix A - Evaluation of Regional Road Capacity for Bolton Residential Expansion

6.0 WORKS CITED
Region of Peel; MMM Group. (2015). The Bolton Transportation Master Plan.
Town of Caledon. (2006). Population and Employment Forecasts and Allocations.
Town of Caledon. (2015). Caledon Official Plan. Policy & Sustainability Division.
Town of Caledon. (n.d.). Section 11 Environmental Policy Area Zones. Retrieved April 12, 2016, from Town of Caledon Zoning By-law: https://www.caledon.ca/en/townhall/resources/zoning/Section11.pdf
Appendix A - Evaluation of Regional Road Capacity for Bolton Residential Expansion

APPENDIX A
Table 3: Volume/Capacity ratios of all roadway segments
Roadway Segments OPTIONS
Base 1 2 3 4 5 6 7 8
EB The Gore Road
Healey Road to King Street
0.05 0.16 0.19 0.24 0.31 0.10 0.10 0.11 0.10
Mayfield Road to Healey Road
0.06 0.15 0.17 0.23 0.30 0.09 0.09 0.09 0.09
EB King Street
The Gore Road to Humber
Station Road 0.37 0.69 0.73 0.94 0.91 0.57 0.57 0.61 0.57
Humber Station Road to Harvest
Moon Drive 0.37 0.77 0.82 1.06 0.83 0.69 0.65 0.69 0.65
Highway 50 to Humber Lea
Road 0.44 0.63 0.53 0.67 0.61 0.53 0.53 0.57 0.53
Humber Lea Road to Old King Street
0.30 0.50 0.40 0.54 0.48 0.40 0.40 0.45 0.40
Old King Street to Townline
Road 0.37 0.56 0.46 0.61 0.54 0.46 0.46 0.51 0.46
NB Coleraine Drive
Holland Drive to King Street
0.10 0.44 0.27 0.34 0.29 0.27 0.28 0.30 0.28
Healey Road to Holland Drive
0.07 0.37 0.21 0.28 0.23 0.21 0.22 0.24 0.22
George Bolton Parkway to
Healey Road 0.09 0.43 0.26 0.33 0.28 0.30 0.26 0.29 0.27
Parr Boulevard to George
Bolton Parkway 0.16 0.54 0.37 0.44 0.39 0.41 0.37 0.40 0.38
Mayfield Road to Parr
Boulevard 0.18 0.57 0.40 0.47 0.42 0.47 0.40 0.44 0.41
NB Highway 50
Bolton Heights Drive to
Columbia Way 0.57 1.05 1.22 0.63 0.63 0.63 0.63 0.63 0.63
King Street to Bolton Heights
Drive 0.59 1.01 1.18 0.68 0.68 0.68 0.68 0.67 0.68
Allan Drive to Ellwood Drive
0.36 0.50 0.62 0.50 0.50 0.50 0.41 0.41 0.41
Queensgate Boulevard to Allan Drive
0.38 0.43 0.55 0.43 0.43 0.43 0.45 0.43 0.45
Healey Road to Queensgate Boulevard
0.53 0.63 0.74 0.63 0.63 0.63 0.65 0.63 0.64
McEwan Drive to Healey Road
0.57 0.69 0.81 0.69 0.69 0.69 0.69 0.69 0.71
George Bolton Parkway to
McEwan Drive 0.61 0.74 0.85 0.74 0.74 0.74 0.74 0.74 0.76
Parr Boulevard to George
Bolton Parkway 0.67 0.81 0.93 0.81 0.81 0.81 0.81 0.81 0.83
Mayfield Road to Parr
Boulevard 0.64 0.81 0.92 0.81 0.81 0.81 0.81 0.81 0.83
SB The Gore Road
King Street to Healey Road
0.38 0.67 0.72 0.82 0.93 0.57 0.57 0.59 0.57
Healey Road to Mayfield Road
0.35 0.50 0.54 0.64 0.76 0.40 0.40 0.41 0.40
Appendix A - Evaluation of Regional Road Capacity for Bolton Residential Expansion
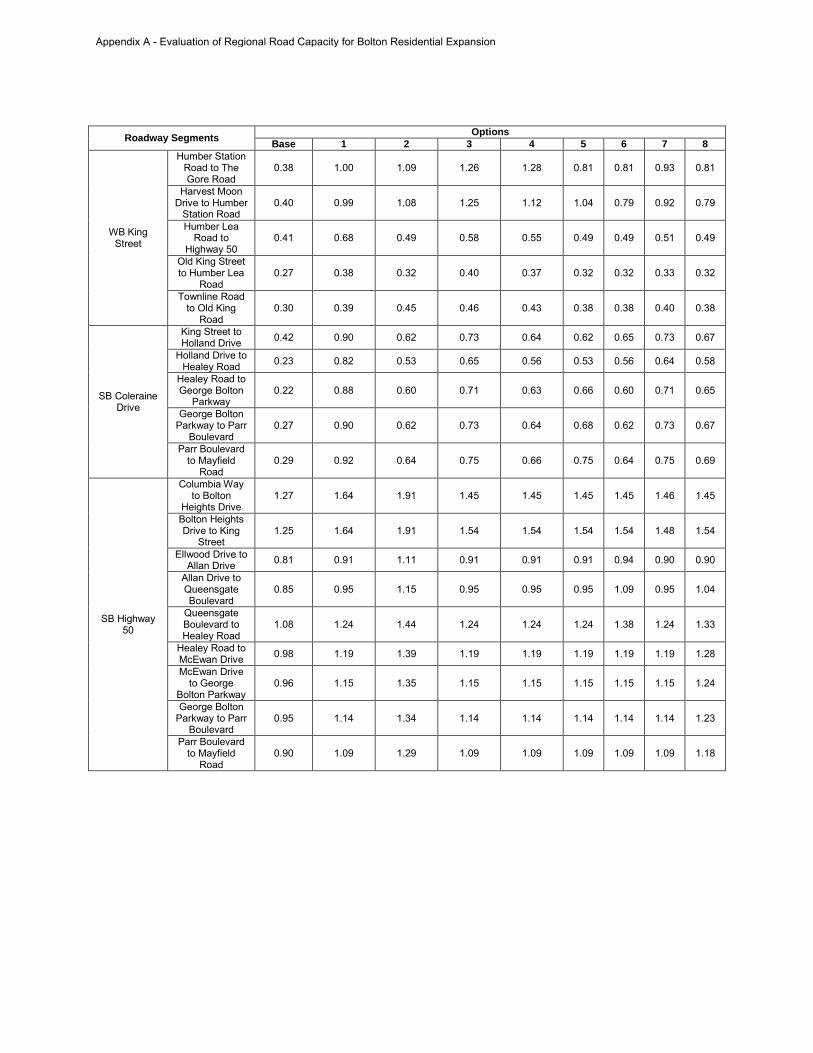
Roadway Segments Options
Base 1 2 3 4 5 6 7 8
WB King Street
Humber Station Road to The Gore Road
0.38 1.00 1.09 1.26 1.28 0.81 0.81 0.93 0.81
Harvest Moon Drive to Humber
Station Road 0.40 0.99 1.08 1.25 1.12 1.04 0.79 0.92 0.79
Humber Lea Road to
Highway 50 0.41 0.68 0.49 0.58 0.55 0.49 0.49 0.51 0.49
Old King Street to Humber Lea
Road 0.27 0.38 0.32 0.40 0.37 0.32 0.32 0.33 0.32
Townline Road to Old King
Road 0.30 0.39 0.45 0.46 0.43 0.38 0.38 0.40 0.38
SB Coleraine Drive
King Street to Holland Drive
0.42 0.90 0.62 0.73 0.64 0.62 0.65 0.73 0.67
Holland Drive to Healey Road
0.23 0.82 0.53 0.65 0.56 0.53 0.56 0.64 0.58
Healey Road to George Bolton
Parkway 0.22 0.88 0.60 0.71 0.63 0.66 0.60 0.71 0.65
George Bolton Parkway to Parr
Boulevard 0.27 0.90 0.62 0.73 0.64 0.68 0.62 0.73 0.67
Parr Boulevard to Mayfield
Road 0.29 0.92 0.64 0.75 0.66 0.75 0.64 0.75 0.69
SB Highway 50
Columbia Way to Bolton
Heights Drive 1.27 1.64 1.91 1.45 1.45 1.45 1.45 1.46 1.45
Bolton Heights Drive to King
Street 1.25 1.64 1.91 1.54 1.54 1.54 1.54 1.48 1.54
Ellwood Drive to Allan Drive
0.81 0.91 1.11 0.91 0.91 0.91 0.94 0.90 0.90
Allan Drive to Queensgate Boulevard
0.85 0.95 1.15 0.95 0.95 0.95 1.09 0.95 1.04
Queensgate Boulevard to Healey Road
1.08 1.24 1.44 1.24 1.24 1.24 1.38 1.24 1.33
Healey Road to McEwan Drive
0.98 1.19 1.39 1.19 1.19 1.19 1.19 1.19 1.28
McEwan Drive to George
Bolton Parkway 0.96 1.15 1.35 1.15 1.15 1.15 1.15 1.15 1.24
George Bolton Parkway to Parr
Boulevard 0.95 1.14 1.34 1.14 1.14 1.14 1.14 1.14 1.23
Parr Boulevard to Mayfield
Road 0.90 1.09 1.29 1.09 1.09 1.09 1.09 1.09 1.18
Appendix A - Evaluation of Regional Road Capacity for Bolton Residential Expansion

APPENDIX B
Figure 4: Preferred Alternative - Bolton Transportation Master Plan
Source: (Region of Peel; MMM Group, 2015)
Appendix A - Evaluation of Regional Road Capacity for Bolton Residential Expansion

Region of Peel
Intersection Analysis for Bolton Residential Expansion Areas Final Report B000623 April 2016

Region of Peel
Intersection Analysis
for Bolton Residential Expansion Areas Final Report B000623 April 2016


Region of Peel Intersection Analysis for Bolton Residential Expansion Areas
| April 2016
Table of Contents
1. Introduction ...................................................................................................... 1
2. Study Area ........................................................................................................ 2
2.1 Geographic Location ...................................................................................................... 2 2.2 Settlement Boundary and Candidate Expansion Areas ................................................ 3 2.3 Roadway Network ........................................................................................................... 3
3. Existing Conditions .......................................................................................... 5
3.1 Traffic Operations Methodology..................................................................................... 5 3.2 Existing Traffic Volumes................................................................................................. 6 3.3 Intersection Traffic Operations ...................................................................................... 8 3.4 Roundabout Analysis ..................................................................................................... 9
3.5 Warranted Signals......................................................................................................... 10
4. Future Background Conditions ..................................................................... 11
4.1 Background Growth ...................................................................................................... 11 4.2 Intersection Traffic Operations .................................................................................... 11 4.3 Roundabout Analysis ................................................................................................... 13 4.4 Warranted Signals......................................................................................................... 13 4.5 Recommended Improvements ..................................................................................... 14
5. Future Conditions with Expansion Areas .................................................... 18
5.1 Trip Generation ............................................................................................................. 18 5.2 Trip Distribution and Assignment ................................................................................ 19
5.2.1 Residential Trips ................................................................................................... 19 5.2.2 Commercial Trips .................................................................................................. 20
5.3 Intersection Traffic Operations – “Do Nothing” .......................................................... 21
5.3.1 Intersection Traffic Operations............................................................................... 21 5.3.2 Roundabout Analysis ............................................................................................ 29 5.3.3 Warranted Signals ................................................................................................ 30
5.4 Intersection Traffic Operations – With Improvements ................................................ 30
5.4.1 Intersection Traffic Operations............................................................................... 30
6. Summary of Findings and Recommendations ............................................ 39

Region of Peel Intersection Analysis for Bolton Residential Expansion Areas | April 2016
ii
6.1 Existing Conditions ...................................................................................................... 39 6.2 2031 Horizon year – Future Background Traffic Only ................................................. 39 6.3 2031 Horizon year – with Expansion Areas ................................................................. 39
6.4 Multiple Account Evaluation ........................................................................................ 40
7. Summary of Assumptions .............................................................................41
7.1 Criteria being used to determine improvement needs................................................ 41 7.2 Background Growth ..................................................................................................... 41 7.3 Expansion Areas .......................................................................................................... 41 7.4 Intersection Operational Analysis ............................................................................... 41
List of Figures Figure 1: Geographic Location of Study Area ................................................................................... 2
Figure 2: Settlement Boundary and Candidate Expansion Areas ...................................................... 3
Figure 3: Improvement Options Hierarchy .......................................................................................14
Figure 4: King Street at Highway 50 ................................................................................................17
Figure 5: Housing Mix .....................................................................................................................18
Figure 6: Trip Distribution Classifications ........................................................................................19
List of Tables Table 1: LOS Criteria for Signalized Intersections ............................................................................ 5
Table 2: LOS Criteria for Two-Way Stop Controlled Intersections ..................................................... 6
Table 3: Traffic Data Source ............................................................................................................ 7
Table 4: Overall Intersection Results for Existing Conditions Operational Analysis ........................... 8
Table 5: Results of ARCADY Roundabout Analysis ......................................................................... 9
Table 6: Results of Future Background Traffic Operational Analysis ................................................11
Table 7: Results of ARCADY Roundabout Analysis ........................................................................13
Table 8: Recommended Improvements for 2031 Future Background Conditions .............................15
Table 9: Results of Improved Future Background Traffic Operational Analysis ................................16
Table 10: Trip Generation Results ..................................................................................................19
Table 11: Option 1 Intersection Operations .....................................................................................22
Table 12: Option 2 Intersection Operations .....................................................................................23
Table 13: Option 3 Intersection Operations .....................................................................................24
Table 14: Option 4 Intersection Operations .....................................................................................25

Region of Peel Intersection Analysis for Bolton Residential Expansion Areas
| April 2016
Table 15: Option 5 Intersection Operations ..................................................................................... 26
Table 16: Option 6 Intersection Operations ..................................................................................... 27
Table 17: Option 7 Intersection Operations ..................................................................................... 28
Table 18: Option 8 Intersection Operations ..................................................................................... 29
Table 19: Results of ARCADY Roundabout Analysis ...................................................................... 29
Table 20: Option 1 Intersection Operations ..................................................................................... 31
Table 21: Option 2 Intersection Operations ..................................................................................... 32
Table 22: Option 3 Intersection Operations ..................................................................................... 33
Table 23: Option 4 Intersection Operations ..................................................................................... 34
Table 24: Option 5 Intersection Operations ..................................................................................... 35
Table 25: Option 6 Intersection Operations ..................................................................................... 36
Table 26: Option 7 Intersection Operations ..................................................................................... 37
Table 27: Option 8 Intersection Operations ..................................................................................... 38
List of Appendices Appendix A: Traffic Volume Data
Appendix B: Signal Timing Plans
Appendix C: Study Area Intersections Map
Appendix D: Existing Synchro Reports
Appendix E: Arcady Reports
Appendix F: Signal Warrants
Appendix G: Emme Model Output Data
Appendix H: Future Background (“Do Nothing”) Synchro Reports
Appendix I: Future Background (‘Improved”) Synchro Reports
Appendix J: Future Total Scenario Trip Generation
Appendix K: Future Total Scenario Trip Distribution
Appendix L: Future Total (“Do Nothing”) Synchro Reports
Appendix M: Option Improvements List
Appendix N: Future Total (“Improved”) Synchro Reports
Appendix O: Multiple Account Evaluation (MAE)


Region of Peel Intersection Analysis for Bolton Residential Expansion Areas
| April 2016
1
1. Introduction The Town of Caledon (Town) has filed a Regional Official Plan Amendment (ROPA) application to expand the Bolton Rural Service Centre for, primarily, residential uses and to implement the population and employment forecasts for 2031. The Region of Peel (Region) has agreed to consider the Town’s Bolton Residential Expansion Study (BRES) ROPA application in accordance with the planning process endorsed by the Regional Council.
As part of the overall transportation assessment in support of the BRES ROPA, CIMA+ was retained by the Region to conduct intersection analysis to recommend intersection improvements on Regional Roads for the following eight land development scenarios: + Six expansion options + Rounding out area which consists of the three areas evaluated through the Caledon BRES process;
and
+ A triangle-shaped area located immediately south of ROPA 28 – South Albion-Bolton Employment Lands expansion.
Synchro 9 is the primary traffic operations analysis tool utilized in the intersection analysis, with Arcady specifically utilized for roundabout analysis. The analysis has culminated in this report which summarizes the methodology, findings, and recommendations, which will be presented to the client project team during a concluding presentation meeting.

Region of Peel Intersection Analysis for Bolton Residential Expansion Areas | April 2016
2
2. Study Area 2.1 Geographic Location As shown in Figure 1, the geographic location of the study area is north-west of the City of Toronto. A band of rural land separates the Bolton Rural Service Centre from the urbanized Greater Toronto-Hamilton Area (GTHA). The City of Brampton is situated to the south-west, the City of Mississauga and City of Toronto to the south and south-east, and the City of Vaughan and York Region generally to the east.
Primary links connecting the Bolton Rural Service Centre with higher order highways include King Street and Mayfield Road providing westward access to Highway 410, Gore Road and Highway 50 providing southward access to Highways 407 and 427, and King Road providing eastward access to Highways 27 and 400.
Figure 1: Geographic Location of Study Area

Region of Peel Intersection Analysis for Bolton Residential Expansion Areas
| April 2016
3
2.2 Settlement Boundary and Candidate Expansion Areas Figure 2 presents the settlement boundary for the Bolton Rural Service Centre and identifies the eight candidate expansion areas under consideration in this analysis. Highway 50 (Queen Street) and King Street provide the central north-south and east-west links within the study area, respectively. Other major regional roadways in the study area include Mayfield Road, Coleraine Drive, Humber Station Road, and The Gore Road.
The candidate expansion areas can be summarized as follows: + Six expansion options accommodating residential and commercial development (Areas 1-6); + “Rounding-out Areas” accommodating residential development only (Area 7); and + A triangle-shaped area located immediately south of ROPA 28 – known as South Albion-Bolton
Employment Lands expansion, which will accommodate commercial development only (Area 8).
Figure 2: Settlement Boundary and Candidate Expansion Areas
2.3 Roadway Network The following is a description of the key roadways that are considered as part of the evaluation of each candidate expansion areas.
Highway 50 is a Regional Road extending from Highway 407 in the south to Highway 89 in the north. South of King Street, Highway 50 has a basic four lane urban cross section. The posted speed is 80 km/h at Mayfield Road, reducing to 60 km/h north of Mayfield Road and further reducing to 50 km/h from Allan Drive through to King Street. Highway 50 has four lanes with parking permitted on alternating sides of the road during peak hours in the core area to accommodate the peak direction of

Region of Peel Intersection Analysis for Bolton Residential Expansion Areas | April 2016
4
traffic in two lanes. At Columbia Way, the highway reduces to a single lane in each direction with auxiliary turn lanes and continues north as a two lane roadway. The surrounding land use is mainly commercial and industrial in nature from Mayfield Road to north of the core area and primarily open space, recreational or residential north of the core area. Highway 50 is a major north south roadway providing access from Bolton and areas north to the GTA.
King Street (Regional Road 9) is a two-lane roadway with auxiliary turn lanes at key intersections. King Street runs from Winston Churchill Boulevard in the west to Caledon-King Townline in the east, at which point it continues eastward into York Region as King Road (Regional Road 9). King Street has a posted speed limit of 50 km/h through the core area and 60 km/hour east and west of the core to the CN Rail Line where it increases to 80km/hr. Surrounding land use is mainly residential in nature east and west of the core area with some industrial uses near Humber Station Road to the west.
Mayfield Road is a two-lane roadway with a rural cross-section, auxiliary turn lanes at its intersection with Highway 50, and expansion to four lanes with auxiliary lanes at its intersection with Coleraine Drive. Mayfield Road runs from Winston Churchill Boulevard in the west to Highway 50. The posted speed limit ranges from 60 km/h east of Pillsworth Road to 80 km/h to the west of this location. The surrounding land use is mainly agricultural in nature with some industrial uses. Mayfield Road functions as a major east-west arterial along the north limit of the City of Brampton linking Georgetown to Brampton, Bolton and the GTA to the south.
Coleraine Drive is a four lane roadway which runs parallel to Highway 50 and may ultimately be expanded to a four-lane cross-section if required. Coleraine Drive currently runs from Highway 50 south of Mayfield Road to King Street in the north. The posted speed is 70 km/h reducing to 60 km/h as it approaches King Street. The surrounding land use is mainly industrial and agricultural in nature. Access to this roadway is limited and auxiliary turning lanes are provided at King Street, Mayfield Road, George Bolton Parkway, and Parr Boulevard. It is expected that the completion of the Emil Kolb Parkway, connecting Coleraine Drive to Highway 50, will provide a by-pass of the core area of Bolton for through traffic.
Humber Station Road is a two-lane rural roadway running from Mayfield Road in the south to Highway 9 in the north and the speed limit is assumed to be 80 km/h. Surrounding land uses are mainly agricultural in nature.
The Gore Road is a two-lane rural roadway running from Mayfield Road in the south to Highway 9 in the north. The speed limit is 60 km/hr to the south increasing to 80km/hr south of King Street. North of King Street the speed limit is 70km/hr increasing to 80km/hr further north. Surrounding land uses are mainly agricultural in nature.
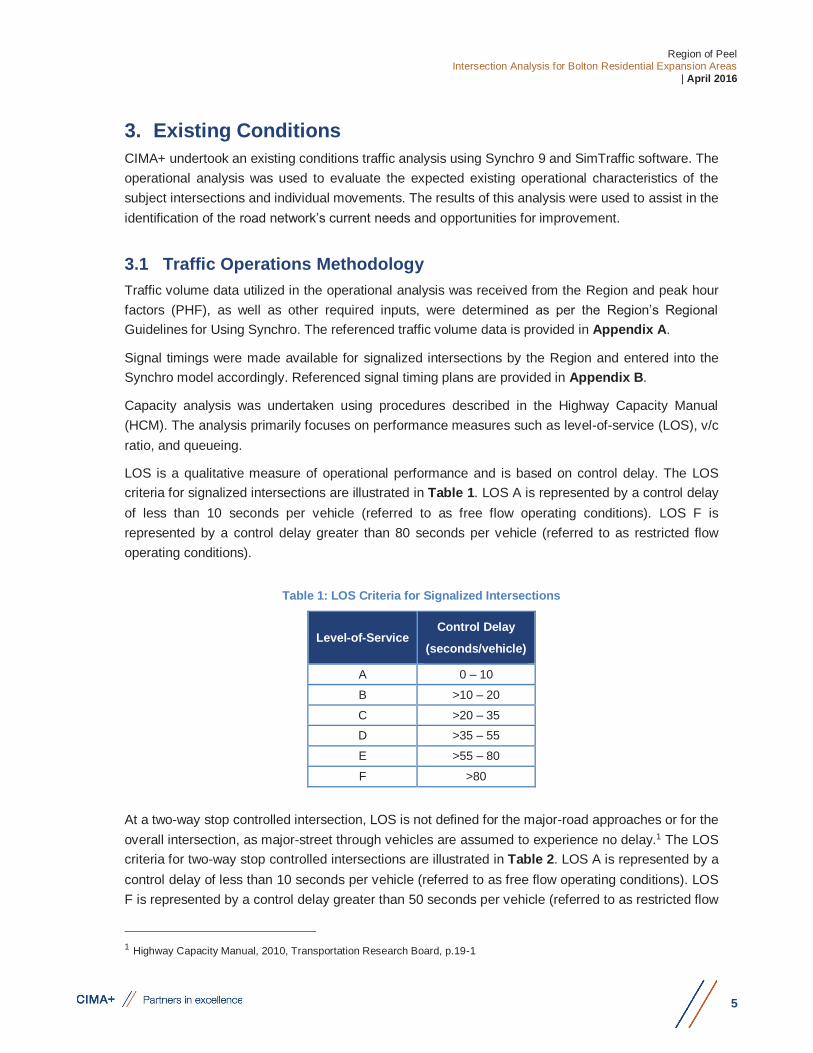
Region of Peel Intersection Analysis for Bolton Residential Expansion Areas
| April 2016
5
3. Existing Conditions CIMA+ undertook an existing conditions traffic analysis using Synchro 9 and SimTraffic software. The operational analysis was used to evaluate the expected existing operational characteristics of the subject intersections and individual movements. The results of this analysis were used to assist in the identification of the road network’s current needs and opportunities for improvement.
3.1 Traffic Operations Methodology Traffic volume data utilized in the operational analysis was received from the Region and peak hour factors (PHF), as well as other required inputs, were determined as per the Region’s Regional Guidelines for Using Synchro. The referenced traffic volume data is provided in Appendix A.
Signal timings were made available for signalized intersections by the Region and entered into the Synchro model accordingly. Referenced signal timing plans are provided in Appendix B.
Capacity analysis was undertaken using procedures described in the Highway Capacity Manual (HCM). The analysis primarily focuses on performance measures such as level-of-service (LOS), v/c ratio, and queueing.
LOS is a qualitative measure of operational performance and is based on control delay. The LOS criteria for signalized intersections are illustrated in Table 1. LOS A is represented by a control delay of less than 10 seconds per vehicle (referred to as free flow operating conditions). LOS F is represented by a control delay greater than 80 seconds per vehicle (referred to as restricted flow operating conditions).
Table 1: LOS Criteria for Signalized Intersections
Level-of-Service Control Delay
(seconds/vehicle)
A 0 – 10 B >10 – 20 C >20 – 35 D >35 – 55 E >55 – 80 F >80
At a two-way stop controlled intersection, LOS is not defined for the major-road approaches or for the overall intersection, as major-street through vehicles are assumed to experience no delay.1 The LOS criteria for two-way stop controlled intersections are illustrated in Table 2. LOS A is represented by a control delay of less than 10 seconds per vehicle (referred to as free flow operating conditions). LOS F is represented by a control delay greater than 50 seconds per vehicle (referred to as restricted flow
1 Highway Capacity Manual, 2010, Transportation Research Board, p.19-1

Region of Peel Intersection Analysis for Bolton Residential Expansion Areas | April 2016
6
operating conditions). LOS F is assigned to a movement if the volume-to-capacity ratio for the movement exceeds 1.0, regardless of the control delay.
Table 2: LOS Criteria for Two-Way Stop Controlled Intersections
Level-of-Service
Control Delay (seconds/vehicle)
A 0 – 10
B >10 – 15
C >15 – 25
D >25 – 35
E >35 – 50
F >50
The v/c ratio is a measure of the capacity sufficiency of an intersection or individual turning movement.
95th Percentile Queue is the queue length that has only a 5 percent probability of being exceeded during the analysis period, which is at least a 95% probability the queue length will be less than the 95th percentile queue. For design and operational analysis purposes it is industry practice and accepted methodology by HCM to evaluate the 95th percentile queue length.
The analysis methodology is consistent with the Region’s Transportation Impact Study (TIS) Guidelines which indicates the following targets to identify where improvements may be required: + v/c ratios for overall intersection operations, through movements or shared through/turning
movements increased to 0.90 or above; + v/c ratios for exclusive movements that will exceed 1.00; and + 95th percentile queue lengths for individual movements that exceed available lane storage.
The Synchro default saturation flow rate of 1900 vehicles/hour/lane was used for the study area.
3.2 Existing Traffic Volumes Weekday a.m. and p.m. peak hour turning movement traffic volumes were provided by the Region. The intersections analyzed in the existing conditions analysis including intersection control are summarized in Table 3 . A map of the study area intersections is provided in Appendix C.

Region of Peel Intersection Analysis for Bolton Residential Expansion Areas
| April 2016
7
Table 3: Traffic Data Source
Intersection Control The Gore Road at King Street Signal The Gore Road at Healey Road TWSC The Gore Road at Mayfield Road Signal Humber Station Road at King Street Signal Clarkway Drive/Humber Station Road at Mayfield Road Signal Harvest Moon Drive at King Street (T-Intersection) OWSC Emil Kolb Parkway/Coleraine Drive at King Street Roundabout Coleraine Drive at Harvest moon Drive/King Street Signal Coleraine Drive at Holland Drive (T-Intersection) OWSC Coleraine Drive at Healey Road Signal Coleraine Drive at George Bolton Parkway(T-Intersection) OWSC Coleraine Drive at Parr Boulevard(T-Intersection) OWSC Coleraine Drive at Mayfield Road Signal Highway 50 at Emil Kolb Parkway Roundabout Highway 50 at Columbia Way Signal Highway 50 at Bolton Heights Drive Signal Highway 50 at King Street Signal Highway 50 at Elwood Drive East/West Signal Highway 50 at Wilton Drive/Allan Drive Signal Highway 50 at Queensgate Boulevard Signal Highway 50 at Healey Road Signal Highway 50 at McEwan Drive East/West Signal Highway 50 at George Bolton Parkway Signal Highway 50 at Parr Boulevard Signal Highway 50 at Mayfield Road/Albion Vaughan Road Signal King Street at Humberlea Road Signal Old King Road at King Street Signal King Street at Caledon-King Townline Road Signal TWSC: Two-way Stop Control AWSC: All-way Stop Control OWSC: One-way Stop Control
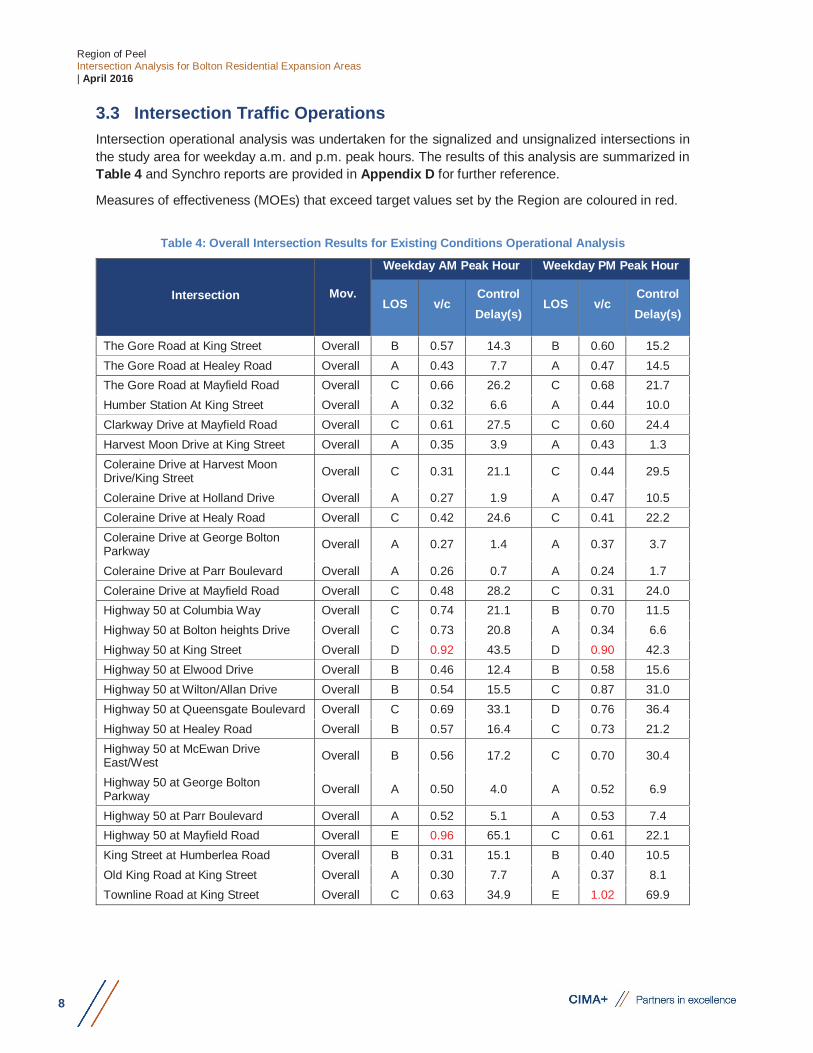
Region of Peel Intersection Analysis for Bolton Residential Expansion Areas | April 2016
8
3.3 Intersection Traffic Operations Intersection operational analysis was undertaken for the signalized and unsignalized intersections in the study area for weekday a.m. and p.m. peak hours. The results of this analysis are summarized in Table 4 and Synchro reports are provided in Appendix D for further reference.
Measures of effectiveness (MOEs) that exceed target values set by the Region are coloured in red.
Table 4: Overall Intersection Results for Existing Conditions Operational Analysis
Intersection Mov.
Weekday AM Peak Hour Weekday PM Peak Hour
LOS v/c Control Delay(s)
LOS v/c Control Delay(s)
The Gore Road at King Street Overall B 0.57 14.3 B 0.60 15.2 The Gore Road at Healey Road Overall A 0.43 7.7 A 0.47 14.5 The Gore Road at Mayfield Road Overall C 0.66 26.2 C 0.68 21.7 Humber Station At King Street Overall A 0.32 6.6 A 0.44 10.0 Clarkway Drive at Mayfield Road Overall C 0.61 27.5 C 0.60 24.4 Harvest Moon Drive at King Street Overall A 0.35 3.9 A 0.43 1.3 Coleraine Drive at Harvest Moon Drive/King Street Overall C 0.31 21.1 C 0.44 29.5
Coleraine Drive at Holland Drive Overall A 0.27 1.9 A 0.47 10.5 Coleraine Drive at Healy Road Overall C 0.42 24.6 C 0.41 22.2 Coleraine Drive at George Bolton Parkway Overall A 0.27 1.4 A 0.37 3.7
Coleraine Drive at Parr Boulevard Overall A 0.26 0.7 A 0.24 1.7 Coleraine Drive at Mayfield Road Overall C 0.48 28.2 C 0.31 24.0 Highway 50 at Columbia Way Overall C 0.74 21.1 B 0.70 11.5 Highway 50 at Bolton heights Drive Overall C 0.73 20.8 A 0.34 6.6 Highway 50 at King Street Overall D 0.92 43.5 D 0.90 42.3 Highway 50 at Elwood Drive Overall B 0.46 12.4 B 0.58 15.6 Highway 50 at Wilton/Allan Drive Overall B 0.54 15.5 C 0.87 31.0 Highway 50 at Queensgate Boulevard Overall C 0.69 33.1 D 0.76 36.4 Highway 50 at Healey Road Overall B 0.57 16.4 C 0.73 21.2 Highway 50 at McEwan Drive East/West Overall B 0.56 17.2 C 0.70 30.4
Highway 50 at George Bolton Parkway Overall A 0.50 4.0 A 0.52 6.9
Highway 50 at Parr Boulevard Overall A 0.52 5.1 A 0.53 7.4 Highway 50 at Mayfield Road Overall E 0.96 65.1 C 0.61 22.1 King Street at Humberlea Road Overall B 0.31 15.1 B 0.40 10.5 Old King Road at King Street Overall A 0.30 7.7 A 0.37 8.1 Townline Road at King Street Overall C 0.63 34.9 E 1.02 69.9

Region of Peel Intersection Analysis for Bolton Residential Expansion Areas
| April 2016
9
Under existing traffic conditions, most intersections and turning movements operate satisfactorily during both the a.m. and p.m. peak hours. Intersections are generally operating with satisfactory levels of delay and additional capacity. However, the following intersections are expected to be nearing or operating at capacity during peak hours: + Highway 50 at King Street: v/c ratio of 0.92 and 0.90 during the a.m. and p.m. peak hours,
respectively; + Highway 50 at Mayfield Road: v/c ratio of 0.96 during the a.m. peak hour; and
+ Townline Road and King Street: v/c ratio of 1.02 during the a.m. peak hour.
3.4 Roundabout Analysis CIMA+ conducted an Arcady roundabout analysis to evaluate the expected existing operational characteristics of the following roundabouts: + Highway 50 at Emil Kolb Parkway; and + King Street East at Emil Kolb Parkway.
Arcady reports are provided in Appendix E.
The results of the Arcady analysis are shown in Table 5. It is evident that the operational performance measures for these intersections under existing conditions are very satisfactory.
Table 5: Results of ARCADY Roundabout Analysis
Intersection Peak Hour Approach V/C
Ratio Delay (sec)
LOS Queue Length (PCE)*
Highway 50 at Emil Kolb Parkway
AM
Overall - 2.88 A - West 0.07 2.79 A 0.09 North 0.16 2.24 A 0.20 South 0.40 3.15 A 0.71
PM
Overall - 2.87 A - West 0.15 2.41 A 0.20 North 0.42 2.37 A 0.73 South 0.17 2.33 A 0.22
King Street East at Emil Kolb Parkway
AM
Overall - 2.27 A - West 0.16 2.28 A 0.20 North 0.13 2.17 A 0.16 South 0.14 2.34 A 0.17
PM
Overall - 2.47 A - West 0.14 2.11 A 0.16 North 0.29 2.62 A 0.43 South 0.04 2.67 A 0.06
*PCE = passenger car equivalents

Region of Peel Intersection Analysis for Bolton Residential Expansion Areas | April 2016
10
3.5 Warranted Signals Ontario Traffic Manual (OTM) Book 12 Traffic control signal warrants were completed for unsignalized study area intersections, which are listed as follows: + Coleraine Drive at George Bolton Parkway; + Coleraine Drive at Holland Drive; + Coleraine Drive at Parr Boulevard; + The Gore Road at Healey Road; and + King Street at Harvest Moon Drive.
As per the OTM Book 12 signal warrants completed for existing conditions, signalization of unsignalized study area intersections is not warranted.
The completed signal warrants are provided in Appendix F.

Region of Peel Intersection Analysis for Bolton Residential Expansion Areas
| April 2016
11
4. Future Background Conditions 4.1 Background Growth To determine appropriate background traffic projections for the 2031 horizon year the following approach was followed: 1. EMME model outputs for the 2011 horizon year (based on Transportation Tomorrow Survey
(TTS) data) and the 2031 horizon year provided by the Region were used to identify the “existing” and future link traffic volumes for all selected corridors under evaluation.
2. Pertinent link volumes were used to calculate the estimated growth in link volumes from 2011 to 2031, providing the 20-year growth for each link. The 20-year growth was then reduced to reflect the anticipated 15-year growth which is consistent with this study’s 2031 horizon year.
3. These link volumes were distributed to adjacent intersections based on existing turning movement volume proportions and summed with existing turning movement volumes to produce the estimated 2031 future background turning movement volumes.
EMME model outputs for the study area are provided in Appendix G.
4.2 Intersection Traffic Operations Future background intersection operational analysis was undertaken for the signalized and unsignalized intersections in the study area for weekday a.m. and p.m. peak hours. The results of this analysis are summarized in Table 6, presenting MOEs for overall intersections and movements that exceed target values set by the region. Synchro reports are provided in Appendix H for further reference.
Under future background conditions, many intersections and turning movements are expected to deteriorate operationally during both the a.m. and p.m. peak hours. These intersections and movements are colored in red.
Table 6: Results of Future Background Traffic Operational Analysis
Intersection Mov.
Weekday AM Peak Hour Weekday PM Peak Hour
LOS v/c Control Delay(s)
LOS v/c Control Delay(s)
The Gore Road at King Street Overall WB TR
D E
0.99 1.04
37.9 59.9
E F
1.10 1.24
63.2 141.9
The Gore Road at Healey Road EB LTR WB LTR
F F
1.61 Err
321.3 Err
F F
Err 2.30
Err 620.0
The Gore Road at Mayfield Road
Overall EB LTR WB LTR NB LTR
C C B D
0.82 0.86 0.74 0.31
25.9 25.1 13.5 38.9
F F F F
2.10 1.23 2.41 1.15
471.7 132.1 655.5 141.3
Humber Station At King Street Overall
WB LTR NB LTR
D D F
1.01 1.01 1.00
38.8 45.9
105.4
D C E
0.97 0.87 0.98
38.4 25.9 70.0

Region of Peel Intersection Analysis for Bolton Residential Expansion Areas | April 2016
12
Intersection Mov.
Weekday AM Peak Hour Weekday PM Peak Hour
LOS v/c Control Delay(s)
LOS v/c Control Delay(s)
Clarkway Drive at Mayfield Road
Overall EB LTR WB LTR NB LTR SB LTR
F F E E F
2.51 3.32 0.98 0.65 1.56
830.8 1075.0 63.6 68.5
319.4
F D F F D
1.13 1.03 1.30 1.22 0.39
125.6 52.0 171.8 174.3 53.6
Harvest Moon Drive at King Street NB LR F 1.78 420.0 F 1.17 195.6 Coleraine Drive at Harvest Moon Drive/King Street SB L C 0.54 27.7 F 1.10 107.2
Coleraine Drive at Healy Road
Overall EB TR WB L
WB TR NB L
NB TR SB L
F C D F F C C
1.30 0.67 0.56 1.35 1.28 0.29 0.55
82.2 33.5 36.1
201.9 224.3 22.9 23.5
F E F B E F F
1.88 1.05 2.28 0.59 0.87 1.08 1.22
84.3 66.6 649.4 18.6 70.6 90.2 219.6
Coleraine Drive at George Bolton Parkway WB LR F 1.34 259.3 F Err Err
Highway 50 at Columbia Way WB L F 1.8 237.4 C 0.57 34.2
Highway 50 at King Street
Overall EB L WB L
WB TR NB
TL/TR SB
TL/TR
D C E D B D
0.95 0.18 0.94 0.70 0.68 0.87
39.1 28.5 68.2 35.7 19.7 36.0
F F F F E C
1.15 1.14 1.18 1.11 1.07 1.03
82.3 162.6 156.3 132.5 75.5 22.7
Highway 50 at Elwood Drive EB LTR E 0.67 55.5 F 0.99 109.7 Highway 50 at Wilton/Allan Drive SB L B 0.20 12.7 F 1.38 283.3
Highway 50 at Queensgate Boulevard
EB TR NB T
E B
0.04 0.33
61.0 16.9
F E
1.11 1.02
164.3 60.4
Highway 50 at Healey Road EB L E 0.63 62.0 F 1.03 111.3
Highway 50 at Mayfield Road WB L NB L
E F
0.88 1.00
61.0 118.1
F B
1.16 0.54
147.8 18.8
Townline Road at King Street
Overall EB T WB L
WB TR NB TR SB T
E F F C D F
1.12 1.02 1.15 0.40 0.75 1.04
77.3 102.9 132.7 24.7 48.6 88.1
F D F F F C
1.31 0.62 1.26 1.20 1.36 0.24
144.4 42.7 177.5 153.9 209.8 23.1
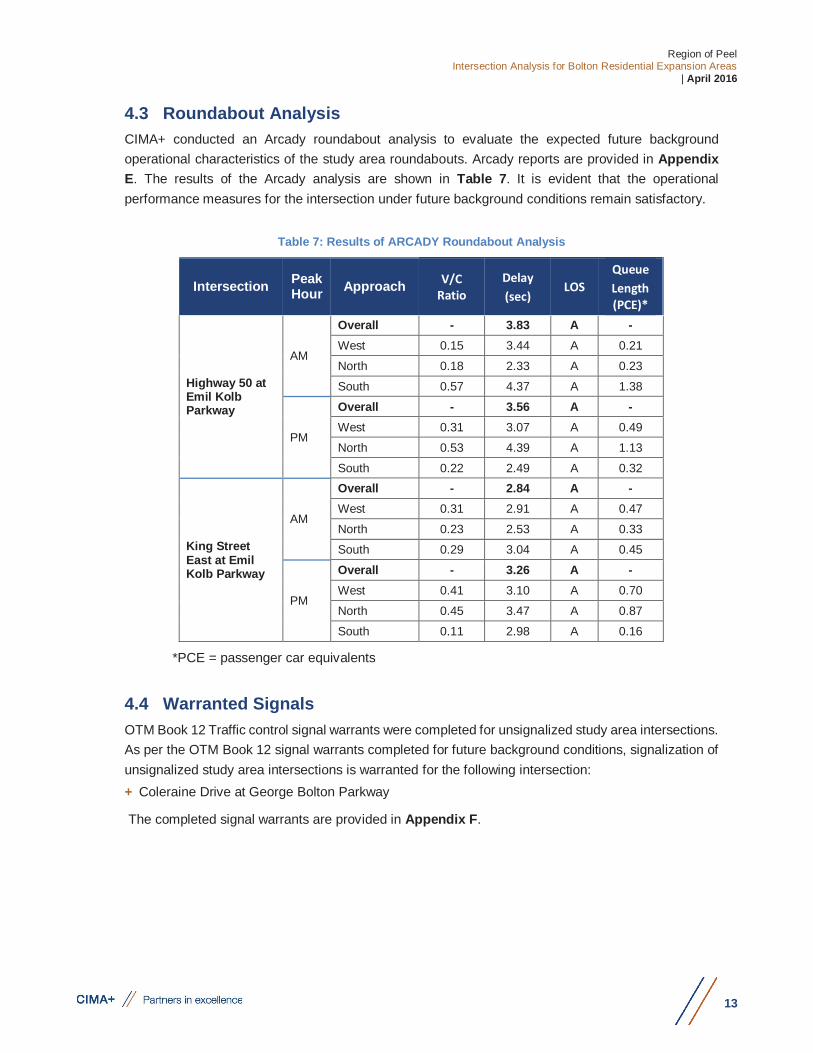
Region of Peel Intersection Analysis for Bolton Residential Expansion Areas
| April 2016
13
4.3 Roundabout Analysis CIMA+ conducted an Arcady roundabout analysis to evaluate the expected future background operational characteristics of the study area roundabouts. Arcady reports are provided in Appendix E. The results of the Arcady analysis are shown in Table 7. It is evident that the operational performance measures for the intersection under future background conditions remain satisfactory.
Table 7: Results of ARCADY Roundabout Analysis
Intersection Peak Hour Approach V/C
Ratio Delay (sec)
LOS Queue Length (PCE)*
Highway 50 at Emil Kolb Parkway
AM
Overall - 3.83 A - West 0.15 3.44 A 0.21
North 0.18 2.33 A 0.23
South 0.57 4.37 A 1.38
PM
Overall - 3.56 A - West 0.31 3.07 A 0.49
North 0.53 4.39 A 1.13
South 0.22 2.49 A 0.32
King Street East at Emil Kolb Parkway
AM
Overall - 2.84 A - West 0.31 2.91 A 0.47
North 0.23 2.53 A 0.33
South 0.29 3.04 A 0.45
PM
Overall - 3.26 A - West 0.41 3.10 A 0.70
North 0.45 3.47 A 0.87
South 0.11 2.98 A 0.16
*PCE = passenger car equivalents
4.4 Warranted Signals OTM Book 12 Traffic control signal warrants were completed for unsignalized study area intersections. As per the OTM Book 12 signal warrants completed for future background conditions, signalization of unsignalized study area intersections is warranted for the following intersection: + Coleraine Drive at George Bolton Parkway
The completed signal warrants are provided in Appendix F.

Region of Peel Intersection Analysis for Bolton Residential Expansion Areas | April 2016
14
4.5 Recommended Improvements As per the results of the 2031 future background operational analysis, several intersections require improvements due to expected background growth in traffic volumes. Therefore sensitivity analysis of feasible improvement measures has been tested in Synchro in order to determine adequate measures recommended for improvement.
A hierarchical approach beginning with consideration for low cost measures (i.e. signal timing improvements) to measures with expected higher costs (i.e. geometric improvements) was employed. Figure 3 illustrates the hierarchical approach employed when considering improvement options for each intersection.
Figure 3: Improvement Options Hierarchy
Recommended improvement measures in response to the results of the 2031 future background operational analysis are presented in Table 8. Improved future background intersection operational analysis was undertaken for the signalized and unsignalized intersections in the study area for weekday a.m. and p.m. peak hours. Synchro reports are provided in Appendix I for further reference.
Signal Timings
Phasing
Lane Configurations
Geometrics
Signalization

Region of Peel Intersection Analysis for Bolton Residential Expansion Areas
| April 2016
15
Table 8: Recommended Improvements for 2031 Future Background Conditions
Intersection Existing
Configuration Recommended Improvements
Recommended Configuration
The Gore at Mayfield Road
Eastbound L/T/R Westbound L/T/R
● Add auxiliary turn lanes and two through lanes for eastbound and westbound directions.
Eastbound L T T T R Westbound L T T T R
King Street at Humber Station Road
Northbound L/T/R Westbound L/T/R
● Add auxiliary left-turn lanes for northbound and westbound directions.
Northbound L T/R Westbound L T/R
Humber Station Road at Mayfield Road
Eastbound L/T/R Westbound L/T/R Northbound L/T/R Southbound L/T/R
● Add auxiliary left-turn lane and two through lanes for eastbound and westbound directions.
● Add auxiliary left-turn lanes for northbound and southbound directions.
Eastbound L T T T/R Westbound L T T T/R Northbound L T/R Southbound L T/R
Coleraine Drive at Healey Road
Eastbound L T/R Westbound L T/R Northbound L/T T/R Southbound L/T T/R
● Add one through lane for eastbound and westbound directions.
● Add auxiliary left-turn lanes for northbound and southbound directions.
Eastbound L T T/R Westbound L T T/R Northbound L T T/R Southbound L T T/R
Highway 50 at Ellwood Drive
Eastbound L/T/R Westbound L/T/R
● Add auxiliary left-turn lanes for eastbound and westbound directions.
Eastbound L T/R Westbound L T/R
Highway 50 at Wilton Drive
Eastbound L/T/R Westbound L/T/R
● Add auxiliary left-turn lanes for eastbound and westbound directions.
Eastbound L T/R Westbound L T/R
Highway 50 at Queensgate Boulevard
Eastbound L T/R Westbound L L/T R
● Add auxiliary right-turn lane for eastbound direction.
● Convert outside left-turn lane (currently dual left configuration) from shared left/through to left-turn only. Convert right-turn lane to shared through/right.
Eastbound L T R Westbound L L T/R
King Street at Townline Road
Northbound L T/R Westbound L T/R
● Add auxiliary right-turn lanes for northbound and westbound directions.
Northbound L T R Westbound L T R
With the introduction of recommended improvement measures, most operational issues identified in future background conditions analysis are expected to be mitigated.
However, as presented in Table 9, despite introducing the recommended improvements, a few intersections and movements are still expected to be nearing or operating at capacity.
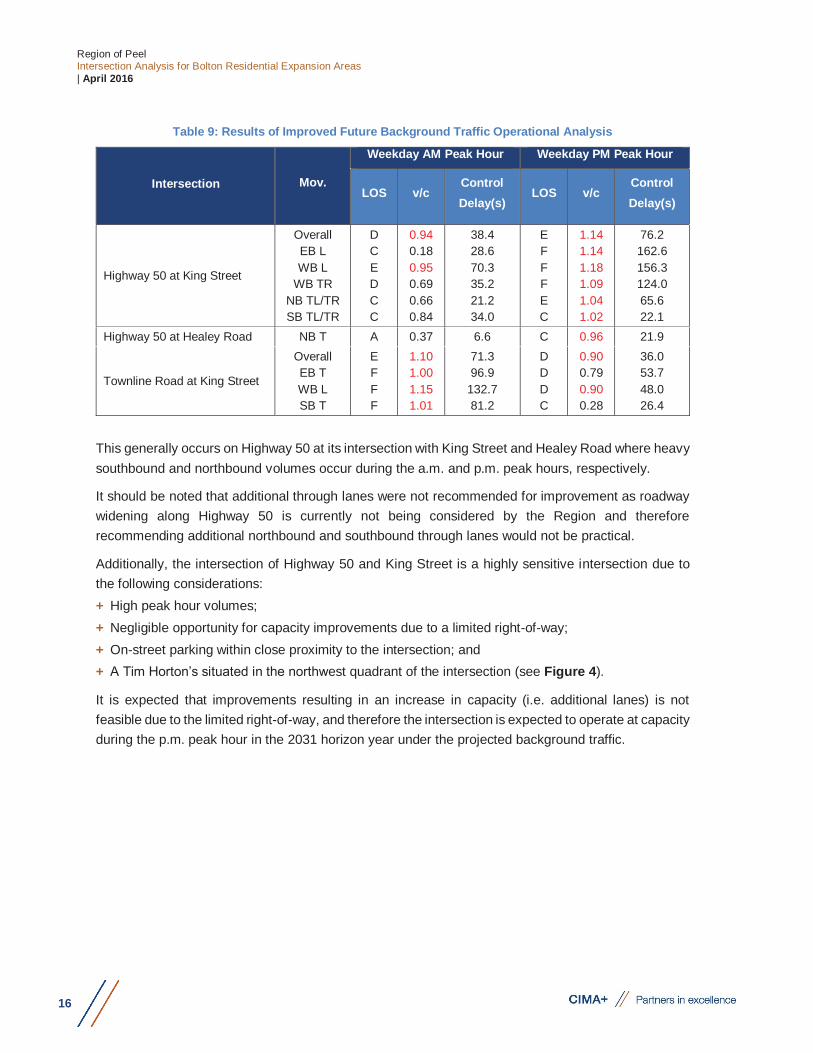
Region of Peel Intersection Analysis for Bolton Residential Expansion Areas | April 2016
16
Table 9: Results of Improved Future Background Traffic Operational Analysis
Intersection Mov.
Weekday AM Peak Hour Weekday PM Peak Hour
LOS v/c Control Delay(s)
LOS v/c Control Delay(s)
Highway 50 at King Street
Overall EB L WB L
WB TR NB TL/TR SB TL/TR
D C E D C C
0.94 0.18 0.95 0.69 0.66 0.84
38.4 28.6 70.3 35.2 21.2 34.0
E F F F E C
1.14 1.14 1.18 1.09 1.04 1.02
76.2 162.6 156.3 124.0 65.6 22.1
Highway 50 at Healey Road NB T A 0.37 6.6 C 0.96 21.9
Townline Road at King Street
Overall EB T WB L SB T
E F F F
1.10 1.00 1.15 1.01
71.3 96.9
132.7 81.2
D D D C
0.90 0.79 0.90 0.28
36.0 53.7 48.0 26.4
This generally occurs on Highway 50 at its intersection with King Street and Healey Road where heavy southbound and northbound volumes occur during the a.m. and p.m. peak hours, respectively.
It should be noted that additional through lanes were not recommended for improvement as roadway widening along Highway 50 is currently not being considered by the Region and therefore recommending additional northbound and southbound through lanes would not be practical.
Additionally, the intersection of Highway 50 and King Street is a highly sensitive intersection due to the following considerations: + High peak hour volumes; + Negligible opportunity for capacity improvements due to a limited right-of-way; + On-street parking within close proximity to the intersection; and + A Tim Horton’s situated in the northwest quadrant of the intersection (see Figure 4).
It is expected that improvements resulting in an increase in capacity (i.e. additional lanes) is not feasible due to the limited right-of-way, and therefore the intersection is expected to operate at capacity during the p.m. peak hour in the 2031 horizon year under the projected background traffic.

Region of Peel Intersection Analysis for Bolton Residential Expansion Areas
| April 2016
17
Figure 4: King Street at Highway 50
Despite improvements at the intersection of King Street and Townline Road, resulting in left-turn and right-turn auxiliary turn lanes for all approaches, the intersection is still expected to operate at capacity during the a.m. peak hour.
Roadway widening on King Street or Townline Road is not expected to be a feasible undertaking and therefore additional through lanes have not been recommended.
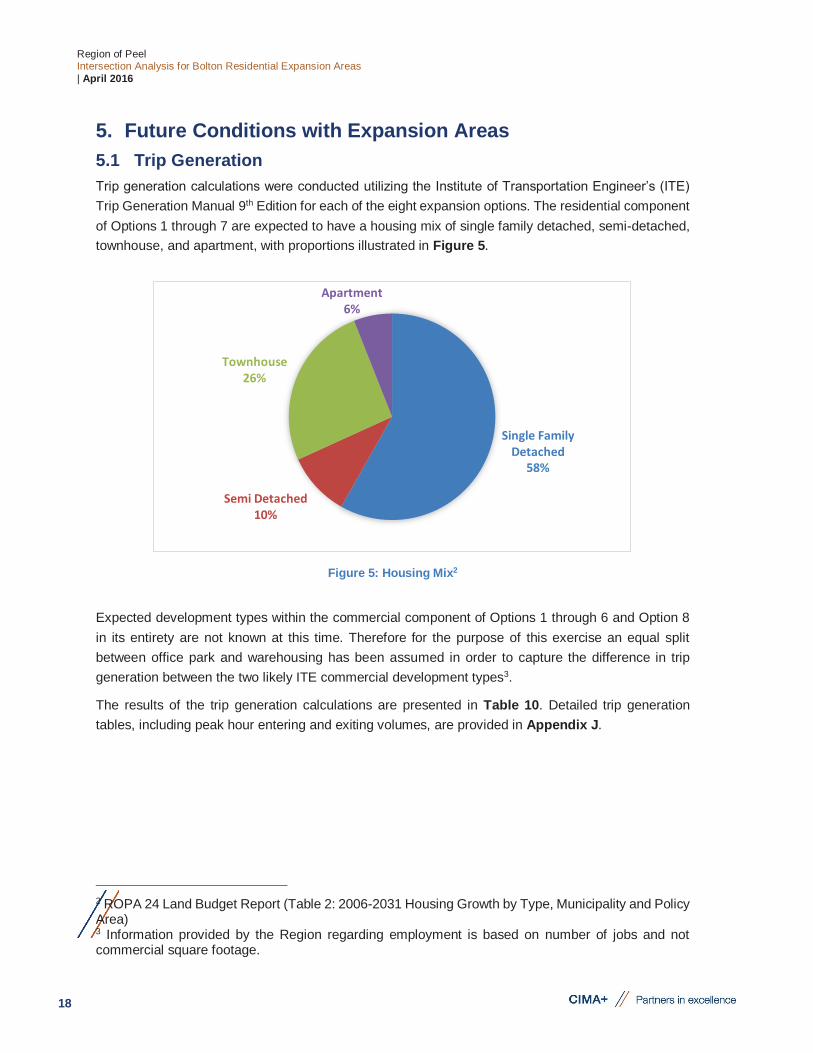
Region of Peel Intersection Analysis for Bolton Residential Expansion Areas | April 2016
18
5. Future Conditions with Expansion Areas 5.1 Trip Generation Trip generation calculations were conducted utilizing the Institute of Transportation Engineer’s (ITE) Trip Generation Manual 9th Edition for each of the eight expansion options. The residential component of Options 1 through 7 are expected to have a housing mix of single family detached, semi-detached, townhouse, and apartment, with proportions illustrated in Figure 5.
Figure 5: Housing Mix2
Expected development types within the commercial component of Options 1 through 6 and Option 8 in its entirety are not known at this time. Therefore for the purpose of this exercise an equal split between office park and warehousing has been assumed in order to capture the difference in trip generation between the two likely ITE commercial development types3.
The results of the trip generation calculations are presented in Table 10. Detailed trip generation tables, including peak hour entering and exiting volumes, are provided in Appendix J.
2 ROPA 24 Land Budget Report (Table 2: 2006-2031 Housing Growth by Type, Municipality and Policy Area) 3 Information provided by the Region regarding employment is based on number of jobs and not commercial square footage.
Single Family Detached
58%
Semi Detached10%
Townhouse26%
Apartment6%

Region of Peel Intersection Analysis for Bolton Residential Expansion Areas
| April 2016
19
Table 10: Trip Generation Results
Options Units Jobs Land-Use Type AM Trips PM Trips
1 – 6 2699 2520 Residential 1635 1912
Commercial 1096 1116
7A 379
0 Residential
266 347
7B 152 124 165
7C 141 118 155
8 n/a 1080 Commercial 270 248
5.2 Trip Distribution and Assignment Subsequent to the calculation of expected generated development trips, residential trips were generally distributed to commercial development within their respective expansion area (internal trips), as well as to zones external of the Bolton Rural Service Centre (external trips). Similarly, commercial trips were distributed to residential development within their respective expansion areas (internal trips), existing residential neighbourhoods in the Bolton Rural Service Centre (Bolton trips), and to zones external of the Bolton Rural Service Centre (external trips). Figure 6 illustrates these trip classifications.
Figure 6: Trip Distribution Classifications
The following sections describe the trip distribution and assignment methodologies employed. Figures illustrating trip distribution and assignment patterns for each expansion area are provided in Appendix K.
5.2.1 Residential Trips An internal trip rate of 33% was adopted for residential trips generated from the candidate expansion areas. This means that 33% of all trips generated from proposed residential development would be distributed internally within the respective expansion area.
Residential Trips
Internal Trips
External Trips
Commercial Trips
Internal Trips
Bolton Trips
External Trips
Region of Peel Intersection Analysis for Bolton Residential Expansion Areas | April 2016
20
The remaining 67% of trips were then distributed equally to zones external of the Bolton Rural Service Centre. As per the relative position of the Bolton Rural Service Centre to the GTHA, external trips were generally distributed as follows: + Eastbound towards York Region; + Southbound towards Toronto; + Westbound towards Brampton; and + No external trips were distributed north of the study area.
Due to the fact that Area 7 does not have internal commercial development, no residential trips were considered to be internal and all trips were distributed external of the Bolton Rural Service Centre as described above.
5.2.2 Commercial Trips The volume of commercial trips assumed to be distributed internally to residential development within the respective expansion area is equal to the previously calculated volume of internal residential trips. For example, based on ITE trip generation calculations, 417 outbound trips (33% of total a.m. outbound trips) during the a.m. peak hour for Options 1 through 6 are expected to be internally captured by commercial development within the respective expansion area. Therefore from the perspective of the commercial development, it is expected the volume of inbound trips generated from internal residential sources during the a.m. peak hour is also 417 trips.
The remaining trips are then distributed equally into two categories: trips destined to existing residential neighbourhoods in the Bolton Rural Service Centre (Bolton trips) and to zones external of the Bolton Rural Service Centre (external trips).
“Bolton Trips” are distributed to four distinct residential zones in the Bolton Rural Service Centre which are generally divided by Highway 50 (north-south) and King Street (east-west). The residential zones are illustrated in Appendix K and based on the following proportions:
+ Residential Zone 1 (25%); + Residential Zone 2 (55%); + Residential Zone 3 (5%); and + Residential Zone 4 (15%).
These proportions are based on a comparative estimation of housing stock within the respective residential zones.
The remaining commercial trips are external meaning they have been distributed equally to zones external of the Bolton Rural Service Centre. Similar to external residential trips, the commercial external trips were generally distributed as follows:
+ Eastbound towards York Region; + Southbound towards Toronto; + Westbound towards Brampton; and + No external trips were distributed north of the study area.

Region of Peel Intersection Analysis for Bolton Residential Expansion Areas
| April 2016
21
Due to the fact that Area 8 does not have residential development, all commercial trips were considered to be external and were only distributed external as described above.
5.3 Intersection Traffic Operations – “Do Nothing”
5.3.1 Intersection Traffic Operations Future conditions traffic analysis was undertaken for a “Do Nothing” scenario. This scenario includes consideration for the future 2031 background growth and 2031 development and resulting trip generation, and applies these volumes to the existing study area intersection configurations. Improvements recommended in response to expected future background growth have been included in the Future Conditions models.
In addition the following changes in the future background lane configuration were included as per discussions with the Region regarding already committed projects: + Dual westbound left turn lanes at the intersection of Highway 50 and Mayfield Road/Albion Vaughan
Road; + Eastbound right turn lane at the intersection of Mayfield Road and the Gore Road; and + Southbound right turn lane at the intersection of Coleraine Drive and Holland Drive4.
This analysis was conducted with eight iterations, each having consideration for a candidate expansion area. For example, Option 1 analyzes traffic conditions with consideration for 2031 background growth and generated trips from expansion area 1. Option 2 analyzes traffic conditions with consideration for 2031 background growth and generated trips from expansion area 2. This process was repeated for all eight expansion areas.
Intersection operational analysis was undertaken for the signalized and unsignalized intersections in the study area for weekday a.m. and p.m. peak hours. Synchro reports are provided in Appendix L for further reference.
The results of this analysis for overall intersections and movements that exceed target values set by the region are summarized in Table 11 to 18.
4 Not included as part of the operational analysis due to the lack of traffic data (non-existing access)

Region of Peel Intersection Analysis for Bolton Residential Expansion Areas | April 2016
22
Table 11: Option 1 Intersection Operations
Intersection Mov.
Weekday AM Peak Hour Weekday PM Peak Hour
LOS v/c Control Delay(s)
LOS v/c Control Delay(s)
The Gore Road at King Street Overall WB TR SB TR
D C F
0.97 0.90 1.08
37.3 27.6 81.3
E F B
1.07 1.21 0.20
57.8 129.1 14.9
The Gore Road at Mayfield Road EB L C 0.35 28.4 F 2.41 697.2
Clarkway Drive at Mayfield Road Overall
EB T/TR SB TR
F F F
1.03 1.18 1.14
103.2 116.4 141.4
C C D
0.47 0.42 0.18
30.3 26.8 44.2
Coleraine Drive at Harvest Moon Drive/King Street SB L C 0.50 23.2 F 1.46 248.9
Highway 50 at King Street
Overall EB L EB T WB L
WB TR NB TL/TR SB TL/TR
D C F F D B C
0.95 0.29 1.10 1.21 0.86 0.53 0.70
51.8 34.5 117.9 161.2 54.0 13.9 22.4
F F E F E F C
1.15 1.14 0.75 1.03 0.95 1.12 1.12
80.3 157.5 57.6 104.6 79.3 99.5 27.4
Highway 50 at Wilton/Allan Drive Overall EB LTR
SB L
C D B
0.64 0.34 0.19
23.4 42.3 14.0
D E F
1.17 0.93 1.38
41.7 76.6 287.2
Highway 50 at Healey Road EB L E 0.63 62.0 F 1.03 111.3 Highway 50 at McEwan Drive East/West EB L D 0.39 48.7 F 1.06 114.8
Townline Road at King Street Overall WB L SB T
E F F
1.15 1.21 1.04
73.6 156.0 89.7
D D C
0.90 0.90 0.29
40.8 45.8 29.7

Region of Peel Intersection Analysis for Bolton Residential Expansion Areas
| April 2016
23
Table 12: Option 2 Intersection Operations
Intersection Mov.
Weekday AM Peak Hour Weekday PM Peak Hour
LOS v/c Control Delay(s)
LOS v/c Control Delay(s)
Humber Station At King Street NB L F 0.97 139.4 D 0.56 38.0
Coleraine Drive at Harvest Moon Drive/King Street
SB L SB TR
D F
0.83 1.27
48.4 165.1
F C
1.10 0.34
107.2 28.5
Coleraine Drive at Parr Boulevard WB L F 2.87 1172.0 F 1.42 272.1
Highway 50 at King Street
Overall EB L EB T WB L
WB TR NB
TL/TR SB
TL/TR
E C F F E B F
1.27 0.85 1.08 1.39 1.08 0.64 1.09
85.0 76.7 112.5 240.3 107.7 15.5 82.5
F F F F F D B
1.19 1.24 0.90 1.44 1.15 1.00 0.88
82.7 203.4 80.0 271.8 148.1 54.3 19.6
Highway 50 at Wilton/Allan Drive EB LTR D 0.29 37.0 F 1.04 109.1 Highway 50 at McEwan Drive East/West EB L D 0.39 49.0 F 1.17 158.1
Townline Road at King Street Overall EB T WB L
F F F
1.11 1.29 1.23
91.8 203.2 165.6
D D F
1.04 0.83 1.15
43.9 51.8 120.2

Region of Peel Intersection Analysis for Bolton Residential Expansion Areas | April 2016
24
Table 13: Option 3 Intersection Operations
Intersection Mov.
Weekday AM Peak Hour Weekday PM Peak Hour
LOS v/c Control Delay(s)
LOS v/c Control Delay(s)
The Gore Road at King Street Overall WB TR
C D
0.97 1.01
34.5 53.3
E F
1.07 1.21
57.8 129.1
Clarkway Drive at Mayfield Road Overall EB T
SB TR
E E F
1.12 1.09 1.29
79.0 78.1 198.9
C C D
0.57 0.46 0.43
34.5 30.9 49.1
Coleraine Drive at Harvest Moon Drive/King Street NB T C 0.31 30.0 F 1.15 118.3
Coleraine Drive at Healy Road
Overall WB L NB L SB L
SB TR
F B F F F
1.38 0.29 2.37 0.98 1.22
95.6 12.9 718.2 92.2 147.5
C F C E B
0.94 1.17 0.54 0.72 0.28
32.9 169.4 27.6 58.0 19.6
Highway 50 at Columbia Way WB L F 1.38 237.4 C 0.57 34.2
Highway 50 at King Street
Overall EB L WB L NB
TL/TR SB
TL/TR
D C F B C
1.03 0.23 1.26 0.58 0.75
46.2 30.3 179.8 17.8 27.1
F F F F C
1.13 1.04 0.97 1.15 1.10
83.0 122.7 88.5 112.3 29.3
Highway 50 at Wilton/Allan Drive Overall SB L
C B
0.64 0.19
23.5 14.1
D F
1.17 1.38
41.7 287.3
Highway 50 at Healey Road EB L E 0.63 62.0 F 1.03 111.3
Townline Road at King Street Overall WB L SB T
E F F
1.18 1.31 1.03
77.5 193.4 85.8
D F C
0.95 1.13 0.25
47.0 119.0 23.4

Region of Peel Intersection Analysis for Bolton Residential Expansion Areas
| April 2016
25
Table 14: Option 4 Intersection Operations
Intersection Mov.
Weekday AM Peak Hour Weekday PM Peak Hour
LOS v/c Control Delay(s)
LOS v/c Control Delay(s)
The Gore Road at King Street Overall WB TR
C D
0.89 1.00
28.7 50.1
E F
1.07 1.21
57.8 129.1
Coleraine Drive at Healy Road Overall WB L SB L
C D B
0.85 0.48 0.43
32.1 39.5 15.2
D F F
1.43 1.59 1.22
51.5 341.8 217.1
Highway 50 at Columbia Way WB L F 1.38 237.4 C 0.57 34.2
Highway 50 at King Street
Overall EB L WB L
WB TR NB TL/TR SB TL/TR
D C F D B C
0.93 0.20 1.29 0.76 0.51 0.69
43.6 27.8 194.0 42.5 14.2 21.4
F F F F F C
1.13 1.05 0.99 0.95 1.14 1.10
81.8 124.9 93.0 79.3 107.9 28.6
Highway 50 at Wilton/Allan Drive
Overall SB L
C B
0.60 0.19
20.3 12.5
D F
1.17 1.38
41.6 287.1
Highway 50 at Healey Road EBL E 0.52 55.4 F 1.03 111.3 Highway 50 at McEwan Drive East/West EB L D 0.26 39.5 F 1.06 114.8
Townline Road at King Street WB L F 1.08 100.0 F 1.17 133.8

Region of Peel Intersection Analysis for Bolton Residential Expansion Areas | April 2016
26
Table 15: Option 5 Intersection Operations
Intersection Mov.
Weekday AM Peak Hour Weekday PM Peak Hour
LOS v/c Control Delay(s)
LOS v/c Control Delay(s)
The Gore Road at King Street Overall WB TR
D E
0.99 1.04
38.4 61.8
E F
1.10 1.24
63.2 141.9
Clarkway Drive at Mayfield Road Overall EB T
SB TR
E F F
1.14 1.11 1.17
75.3 88.0 130.2
E B D
0.97 0.92 0.81
36.3 15.7 47.4
Coleraine Drive at Harvest Moon Drive/King Street SB L D 0.65 36.8 F 1.42 231.5
Highway 50 at Columbia Way WB L F 1.38 237.4 C 0.57 34.2
Highway 50 at King Street
Overall EB L EB T WB L
WB TR NB TL/TR SB TL/TR
D C F E D B C
0.93 0.20 1.02 0.96 0.74 0.64 0.82
42.7 30.9 89.9 76.5 39.0 19.9 31.4
F F E F F F C
1.16 1.14 0.80 1.03 0.99 1.14 1.12
84.6 158.7 63.3 106.2 89.3 104.8 27.5
Highway 50 at Wilton/Allan Drive Overall EB L SB L
C D B
0.65 0.33 0.20
22.5 42.1 11.8
D F F
1.18 0.97 1.38
43.3 86.4 286.9
Highway 50 at Healey Road EB L E 0.63 62.0 F 1.03 111.3 Highway 50 at McEwan Drive East/West EB L D 0.39 48.7 F 1.06 114.8
Townline Road at King Street
Overall EB T WB L SB T
E F F F
1.11 1.02 1.15 1.04
74.0 102.9 132.7 88.1
D D E C
0.90 0.61 0.90 0.29
43.3 40.5 46.0 29.9
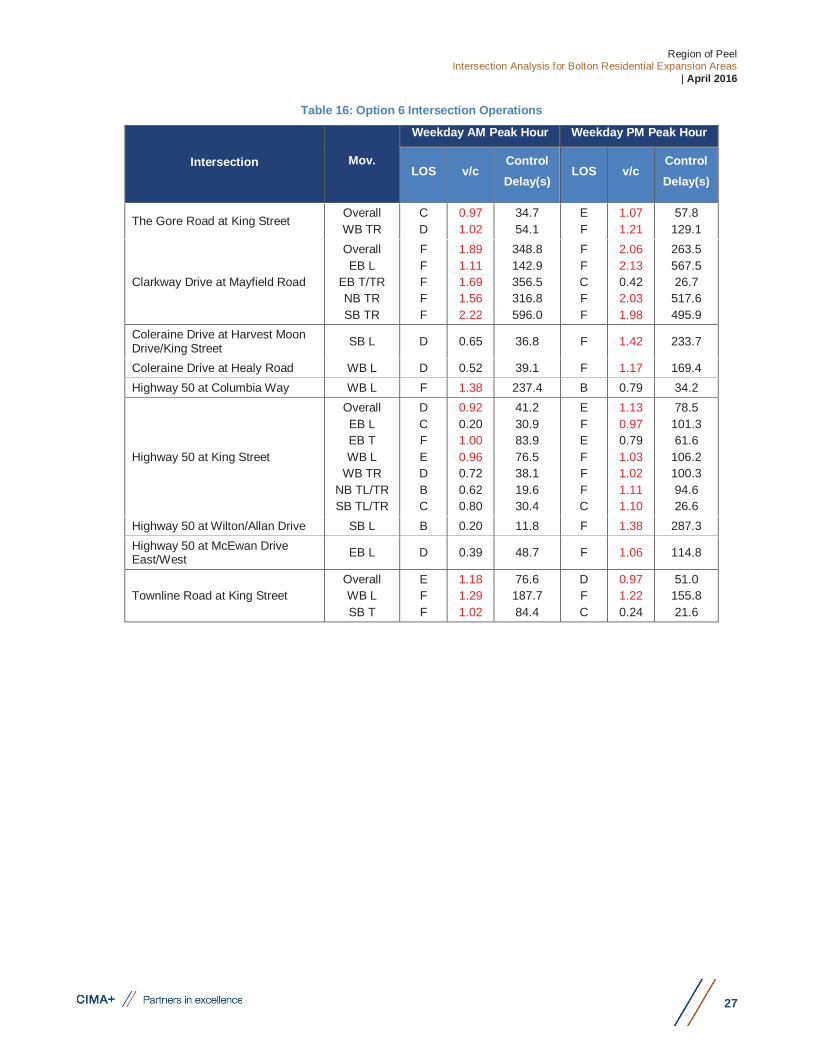
Region of Peel Intersection Analysis for Bolton Residential Expansion Areas
| April 2016
27
Table 16: Option 6 Intersection Operations
Intersection Mov.
Weekday AM Peak Hour Weekday PM Peak Hour
LOS v/c Control Delay(s)
LOS v/c Control Delay(s)
The Gore Road at King Street Overall WB TR
C D
0.97 1.02
34.7 54.1
E F
1.07 1.21
57.8 129.1
Clarkway Drive at Mayfield Road
Overall EB L
EB T/TR NB TR SB TR
F F F F F
1.89 1.11 1.69 1.56 2.22
348.8 142.9 356.5 316.8 596.0
F F C F F
2.06 2.13 0.42 2.03 1.98
263.5 567.5 26.7
517.6 495.9
Coleraine Drive at Harvest Moon Drive/King Street SB L D 0.65 36.8 F 1.42 233.7
Coleraine Drive at Healy Road WB L D 0.52 39.1 F 1.17 169.4 Highway 50 at Columbia Way WB L F 1.38 237.4 B 0.79 34.2
Highway 50 at King Street
Overall EB L EB T WB L
WB TR NB TL/TR SB TL/TR
D C F E D B C
0.92 0.20 1.00 0.96 0.72 0.62 0.80
41.2 30.9 83.9 76.5 38.1 19.6 30.4
E F E F F F C
1.13 0.97 0.79 1.03 1.02 1.11 1.10
78.5 101.3 61.6
106.2 100.3 94.6 26.6
Highway 50 at Wilton/Allan Drive SB L B 0.20 11.8 F 1.38 287.3 Highway 50 at McEwan Drive East/West EB L D 0.39 48.7 F 1.06 114.8
Townline Road at King Street Overall WB L SB T
E F F
1.18 1.29 1.02
76.6 187.7 84.4
D F C
0.97 1.22 0.24
51.0 155.8 21.6

Region of Peel Intersection Analysis for Bolton Residential Expansion Areas | April 2016
28
Table 17: Option 7 Intersection Operations
Intersection Mov.
Weekday AM Peak Hour Weekday PM Peak Hour
LOS v/c Control Delay(s)
LOS v/c Control Delay(s)
The Gore Road at King Street Overall WB TR
C C
0.88 0.88
29.0 31.6
E F
1.07 1.21
57.8 129.1
Clarkway Drive at Mayfield Road Overall EB T
SB TR
D D F
0.94 1.04 1.14
51.5 50.3 141.4
C C D
0.47 0.42 0.18
30.9 27.4 44.3
Coleraine Drive at Harvest Moon Drive/King Street SB L C 0.55 23.4 F 1.42 231.5
Coleraine Drive at Healy Road WB L C 0.50 31.7 F 1.17 169.4 Highway 50 at Columbia Way WB L F 1.36 238.6 C 0.57 34.2
Highway 50 at King Street
Overall EB L EB T WB L NB
TL/TR SB
TL/TR
D C E F C C
0.94 0.20 0.96 0.99 0.63 0.81
44.2 32.7 77.1 89.2 28.0 32.9
F F E F F C
1.15 1.14 0.77 1.01 1.12 1.12
80.2 158.1 60.0 99.3 99.5 27.4
Highway 50 at Wilton/Allan Drive SB L B 0.19 15.0 F 1.38 287.1 Highway 50 at Healey Road EB L E 0.63 62.0 F 1.03 111.3 Highway 50 at McEwan Drive East/West EB L D 0.39 48.7 F 1.06 114.8
Townline Road at King Street Overall WB L SB T
E F F
1.18 1.27 1.03
74.6 179.2 84.1
D F C
0.97 1.21 0.24
50.2 150.2 22.0

Region of Peel Intersection Analysis for Bolton Residential Expansion Areas
| April 2016
29
Table 18: Option 8 Intersection Operations
Intersection Mov.
Weekday AM Peak Hour Weekday PM Peak Hour
LOS v/c Control Delay(s)
LOS v/c Control Delay(s)
Highway 50 at King Street
Overall EB L EB T WB L
WB TR NB TL/TR SB TL/TR
D C F E D B C
0.95 0.20 0.98 0.99 0.72 0.65 0.83
42.7 30.9 89.9 76.5 39.0 19.9 31.4
F F E F F F C
1.17 1.14 0.78 1.00 0.96 1.15 1.12
86.5 113.3 60.8 96.1 82.7
112.5 28.7
5.3.2 Roundabout Analysis CIMA+ conducted an Arcady roundabout analysis to evaluate the expected future operational characteristics of the study area roundabouts with consideration for the candidate expansion options. Based on the completed trip distribution and assignment, both roundabouts are not expected to service development traffic for all eight expansion options. Therefore the results of the Arcady roundabout analysis for expansion options in which development traffic is expected to be service by the subject roundabouts is shown in Table 19. It is evident that the operational performance measures for the intersection under future background conditions remain satisfactory.
Arcady reports are provided in Appendix E.
Table 19: Results of ARCADY Roundabout Analysis
Intersection Peak Hour Approach V/C
Ratio Delay (sec)
LOS Queue Length (PCE)*
Highway 50 at Emil Kolb Parkway
AM
Overall - 2.86 A - West 0.14 2.66 A 0.19
North 0.19 2.00 A 0.25
South 0.49 3.24 A 1.03
PM
Overall - 2.72 A - West 0.45 2.48 A 0.45
North 0.87 3.19 A 0.87
South 0.26 2.07 A 0.26
King Street East at Emil Kolb Parkway
AM
Overall - - West
North
South
PM Overall - 2.90 A - West 0.42 2.70 A 0.74

Region of Peel Intersection Analysis for Bolton Residential Expansion Areas | April 2016
30
Intersection Peak Hour Approach V/C
Ratio Delay (sec)
LOS Queue Length (PCE)*
North 0.49 3.14 A 1.00
South 0.12 2.61 A 0.18
*PCE = passenger car equivalents
5.3.3 Warranted Signals OTM Book 12 Traffic control signal warrants were completed for unsignalized study area intersections. As per the OTM Book 12 signal warrants completed for future total conditions, signalization of unsignalized study area intersections is warranted for the following intersections:
+ King Street at Harvest Moon Drive (Option 7); + The Gore Road at Healey Road (Options 2 to 5); and + Coleraine Drive at George Bolton Parkway (Options 1 to 8).
The completed signal warrants are provided in Appendix F.
5.4 Intersection Traffic Operations – With Improvements Future conditions traffic analysis was undertaken for an improved scenario for each candidate expansion area during both a.m. and p.m. peak hours.
Upon review of the results from 2031 Future Conditions “Do Nothing” scenarios, improvements were considered where required. Each intersection for each of the eight options was reviewed and cost-effective improvements were recommended based on sensitivity analysis conducted in Synchro, as per the methodology previously discussed in Section 4.5.
Recommended improvements for each of the eight options are presented in matrix format which is provided in Appendix M.
5.4.1 Intersection Traffic Operations Intersection operational analysis was undertaken for the signalized and unsignalized intersections in the study area for weekday a.m. and p.m. peak hours. Synchro reports are provided in Appendix N for further reference.
The results of this analysis for overall intersections and movements that exceed target values set by the Region are summarized in Table 20 to 27.
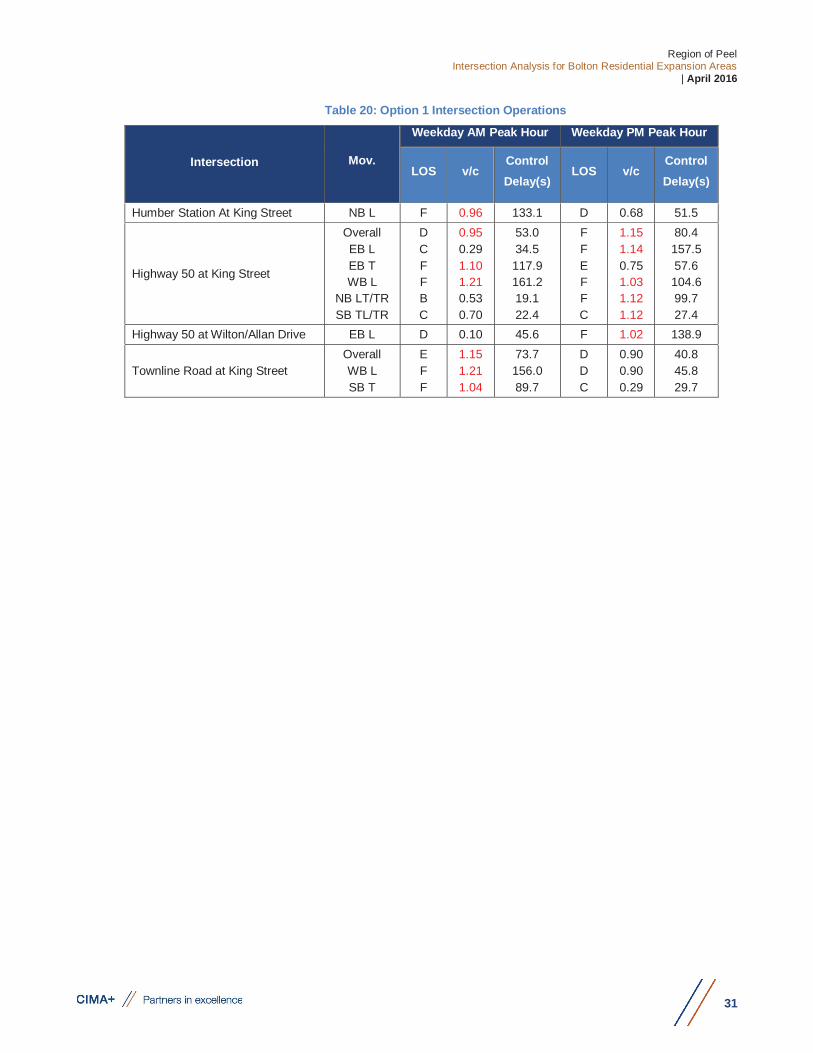
Region of Peel Intersection Analysis for Bolton Residential Expansion Areas
| April 2016
31
Table 20: Option 1 Intersection Operations
Intersection Mov.
Weekday AM Peak Hour Weekday PM Peak Hour
LOS v/c Control Delay(s)
LOS v/c Control Delay(s)
Humber Station At King Street NB L F 0.96 133.1 D 0.68 51.5
Highway 50 at King Street
Overall EB L EB T WB L
NB LT/TR SB TL/TR
D C F F B C
0.95 0.29 1.10 1.21 0.53 0.70
53.0 34.5 117.9 161.2 19.1 22.4
F F E F F C
1.15 1.14 0.75 1.03 1.12 1.12
80.4 157.5 57.6 104.6 99.7 27.4
Highway 50 at Wilton/Allan Drive EB L D 0.10 45.6 F 1.02 138.9
Townline Road at King Street Overall WB L SB T
E F F
1.15 1.21 1.04
73.7 156.0 89.7
D D C
0.90 0.90 0.29
40.8 45.8 29.7

Region of Peel Intersection Analysis for Bolton Residential Expansion Areas | April 2016
32
Table 21: Option 2 Intersection Operations
Intersection Mov.
Weekday AM Peak Hour Weekday PM Peak Hour
LOS v/c Control Delay(s)
LOS v/c Control Delay(s)
Clarkway Drive at Mayfield Road EB T F 0.99 37.5 C 0.44 27.2
Highway 50 at King Street
Overall EB L EB T WB L
WB TR NB TL/TR SB LT/TR
E C F F E C D
1.21 0.84 1.08 1.39 0.93 0.85 0.99
66.0 74.0 112.5 240.3 66.8 27.0 48.4
F F F F F D B
1.19 1.24 0.90 1.44 1.15 1.00 0.88
82.2 203.4 80.0 271.8 148.1 53.2 19.6
Townline Road at King Street
Overall EB T WB L SB T
F F F E
1.21 1.18 1.37 1.03
89.2 161.6 228.1 77.0
D E E C
0.90 0.86 0.96 0.23
41.1 65.1 66.1 22.5

Region of Peel Intersection Analysis for Bolton Residential Expansion Areas
| April 2016
33
Table 22: Option 3 Intersection Operations
Intersection Mov.
Weekday AM Peak Hour Weekday PM Peak Hour
LOS v/c Control Delay(s)
LOS v/c Control Delay(s)
Coleraine Drive at Healy Road EB T/TR D 0.37 36.1 E 0.96 66.5
Highway 50 at King Street
Overall EB L WB L
NB TL/TR SB TL/TR
D C F C C
1.03 0.23 1.26 0.58 0.75
47.5 30.3 179.8 23.5 26.4
F F F F C
1.13 1.04 0.97 1.15 1.10
83.1 122.6 88.5
112.4 29.3
Townline Road at King Street
Overall EB T WB L SB T
E E F F
1.19 0.83 1.34 1.02
78.1 63.4 207.6 83.0
D D D C
0.89 0.57 0.87 0.30
41.9 36.7 39.1 30.9

Region of Peel Intersection Analysis for Bolton Residential Expansion Areas | April 2016
34
Table 23: Option 4 Intersection Operations
Intersection Mov.
Weekday AM Peak Hour Weekday PM Peak Hour
LOS v/c Control Delay(s)
LOS v/c Control Delay(s)
Clarkway Drive at Mayfield Road EB T NB L
E C
1.06 0.14
67.5 23.8
D C
0.58 0.25
35.9 26.4
Highway 50 at King Street
Overall EB L WB L
NB TL/TR SB TL/TR
E C F D C
0.93 0.20 1.29 0.51 0.69
61.4 29.5 194.1 17.2 21.4
F F F F C
1.13 1.05 1.99 1.14 1.10
81.9 124.9 93.0 108.0 28.6
Townline Road at King Street WB L SB T
F E
1.06 0.97
100.0 67.9
D C
0.81 0.30
41.8 30.4

Region of Peel Intersection Analysis for Bolton Residential Expansion Areas
| April 2016
35
Table 24: Option 5 Intersection Operations
Intersection Mov.
Weekday AM Peak Hour Weekday PM Peak Hour
LOS v/c Control Delay(s)
LOS v/c Control Delay(s)
Highway 50 at King Street
Overall EB L EB T WB L
WB TR NB TL/TR SB TL/TR
D D F F C C C
0.95 0.24 1.02 1.21 0.69 0.55 0.73
46.7 36.1 89.6 160.8 34.8 21.0 24.0
E F F F F E C
1.14 1.05 0.93 1.18 1.12 1.05 1.03
76.3 130.6 87.5
156.1 133.9 66.8 22.3
Highway 50 at Healey Road EB L E 0.63 62.0 F 0.97 95.6
Townline Road at King Street
Overall EB T WB L SB T
E F F E
1.09 1.03 1.15 1.00
70.6 107.1 132.6 75.7
D C E C
0.94 0.53 1.00 0.28
40.2 31.4 73.5 26.6

Region of Peel Intersection Analysis for Bolton Residential Expansion Areas | April 2016
36
Table 25: Option 6 Intersection Operations
Intersection Mov.
Weekday AM Peak Hour Weekday PM Peak Hour
LOS v/c Control Delay(s)
LOS v/c Control Delay(s)
Highway 50 at King Street
Overall EB L EB T WB L
WB TR NB TL/TR SB TL/TR
D C F E D B C
0.92 0.20 1.00 0.96 0.72 0.62 0.80
41.2 30.9 73.9 76.5 38.1 19.7 30.4
E F E F F F C
1.13 0.97 0.79 1.03 1.02 1.11 1.10
78.7 101.3 61.6 106.2 100.3 95.1 26.6
Townline Road at King Street
Overall EB T WB L SB T
E F F F
1.10 1.00 1.15 1.01
71.3 96.9 132.7 81.2
D D D C
0.89 0.60 0.90 0.29
42.5 39.9 45.8 29.6

Region of Peel Intersection Analysis for Bolton Residential Expansion Areas
| April 2016
37
Table 26: Option 7 Intersection Operations
Intersection Mov.
Weekday AM Peak Hour Weekday PM Peak Hour
LOS v/c Control Delay(s)
LOS v/c Control Delay(s)
Coleraine Drive at Healy Road Overall
EB T/TR WB L
D D D
0.77 0.36 0.57
37.9 38.0 50.9
D F F
0.81 1.04 1.06
51.3 96.1
134.5
Highway 50 at King Street
Overall EB L EB T WB L
WB TR NB TL/TR SB TL/TR
D C F F D C D
0.94 0.20 0.96 0.99 0.70 0.63 0.81
44.2 32.7 77.1 89.2 39.0 28.0 32.9
F F E F E F C
1.15 1.14 0.77 1.01 0.95 1.12 1.12
80.2 158.1 60.0 99.3 79.3 99.6 27.4
Townline Road at King Street Overall WB L SB T
E F F
1.16 1.23 1.04
73.5 161.4 87.6
D D C
0.89 0.91 0.29
41.7 47.0 29.5

Region of Peel Intersection Analysis for Bolton Residential Expansion Areas | April 2016
38
Table 27: Option 8 Intersection Operations
Intersection Mov.
Weekday AM Peak Hour Weekday PM Peak Hour
LOS v/c Control Delay(s)
LOS v/c Control Delay(s)
Highway 50 at King Street
Overall EB L EB T WB L
WB TR NB TL/TR SB TL/TR
D C F E D B C
0.95 0.20 0.98 0.99 0.72 0.65 0.83
42.7 30.9 89.9 76.5 39.0 19.9 31.4
F F E F F F C
1.17 1.14 0.78 1.00 0.96 1.15 1.12
86.5 113.3 60.8 96.1 82.7 112.5 28.7

Region of Peel Intersection Analysis for Bolton Residential Expansion Areas
| April 2016
39
6. Summary of Findings and Recommendations Based on the findings from the traffic analysis, the following can be concluded:
6.1 Existing Conditions Intersections are expected to generally operate acceptably during a.m. and p.m. peak hours under existing conditions, except the intersections of Highway 50 at King Street and at Mayfield Road, as well as the intersection of King Street and Townline Road, which are expected to be nearing or operating at capacity.
Signalization of study area stop-control intersections is not warranted under existing conditions.
6.2 2031 Horizon year – Future Background Traffic Only Under future traffic background conditions, which includes volume growth as per EMME modelling forecasts, numerous intersections are expected to be nearing or operating at capacity.
With the introduction of recommended improvement measures, most operational issues identified in future background conditions analysis are expected to be mitigated; however several intersections with limited opportunity for improvement are expected to operate with some peak hour deficiencies.
It is therefore recommended that the measures proposed in the background conditions analysis be implemented regardless of the candidate expansion area selected for development. As per the conducted analysis, improvement measures are required in response to background growth alone.
6.3 2031 Horizon year – with Expansion Areas Future Conditions “Do Nothing” analysis identified several additional “sensitive” intersections that are expected to require improvements with the introduction of development traffic from candidate expansion areas.
The intersections requiring improvement highly depend on the trip distribution and assignment patterns of each candidate expansion area:
All expansion areas with employment allocation will affect future traffic conditions along Highway 50 and King Street. This is a direct effect of the lack of connectivity between the current residential areas in Bolton and all expansion areas proposed west of Highway 50. Under all scenarios most of the traffic attracted to the employment areas will travel via Highway 50 to King Street;
Options 2, 3 and 4 will require improvements along King Street West. Expansion areas 3 and 4 are directly connected to King Street West making the roadway the preferred route for generated and attracted traffic. Expansion area 2, although not directly connected with King Street West, utilized Emil Kolb Parkway as main east-west route via King Street West.
“Sensitive” intersections with limited opportunity for improvement are expected to experience operational deficiencies. Despite introducing the recommended improvements, several intersections and movements are still expected to be nearing or operating at capacity.

Region of Peel Intersection Analysis for Bolton Residential Expansion Areas | April 2016
40
Similar to the results of the improved future background operational analysis, this generally occurs on Highway 50 at its intersection with King Street and Healey Road where heavy southbound and northbound volumes occur during the a.m. and p.m. peak hours, respectively. However, additional through lanes are not recommended for improvement as roadway widening along Highway 50 is currently not being considered by the Region and therefore recommending additional northbound and southbound through lanes would not be practical. These findings illustrate that operational deficiencies at the aforementioned intersections are primarily a result of background growth, and not expected to be due to development traffic alone. These issues are expected to arise regardless of the introduction of development traffic.
King Street and the Townline Road will operate at capacity for all Expansion areas using King Street East as preferred route to/from the Region of York. Despite recommended improvements introduced in the future background analysis, the intersection of King Street and Townline Road is expected to operate at capacity. Roadway widening on King Street or Townline Road is not expected to be a feasible undertaking and therefore additional through lanes are not been recommended.
Use of Coleraine Drive as preferred corridor. For all Expansion areas, intersections along Coleraine Drive are expected to be able to better accommodate the additional development traffic compared to the Highway 50 corridor. In a similar way, the two study area roundabouts are expected to operate acceptably under all analyzed future conditions;
Improvements were not recommended for all movements nearing capacity. For example, if a movement is expected to have a v/c ratio of approximately 0.94, this does not necessarily mean the addition of a lane is required or that serious issues exist. Sometimes the capacity of less important movements (i.e. low volume minor streets) can be reduced through green time reduction in order to improve operations for major street approaches. Signal timing, phasing and/or lane configuration adjustments may not be sufficient in improving a movement’s operational performance to the Region’s target thresholds; however it may be impractical to recommend serious geometric improvements (i.e. roadway widening) in all cases.
6.4 Multiple Account Evaluation A Multiple Account Evaluation (MAE) matrix was developed to summarize the expected implications of the candidate expansion areas under various categories (i.e. capital costs, utilities, environmental impacts, etc.) The matrix is presented in Appendix O.

Region of Peel Intersection Analysis for Bolton Residential Expansion Areas
| April 2016
41
7. Summary of Assumptions 7.1 Criteria being used to determine improvement needs Targets used to identify where improvements may be required are consistent with the Region’s Transportation Impact Study (TIS) Guidelines which indicates the following:
+ v/c ratios for overall intersection operations, through movements or shared through/turning movements increased to 0.90 or above;
+ v/c ratios for exclusive movements that will exceed 1.00; and + 95th percentile queue lengths for individual movements that exceed available lane storage.
7.2 Background Growth Projected link volumes for the 2031 horizon year are based on the EMME model outputs and traffic counts provided by the Region as described in Section 4.1.
7.3 Expansion Areas Number of residential units as well as number of jobs allocated to each of the expansion areas were provided by the Region of Peel’s Integrated Planning Division. Since the aforementioned information does not include the expected development types within the commercial components of Options 1 through 6 and Option 8 an equal split between office park and warehousing was assumed.
33% of all trips generated from proposed residential development were assumed to be internal trips. The remaining 67% of trips were distributed equally to zones external of the Bolton Rural Service Centre.
The volume of commercial trips was assumed to (1) be distributed internally to residential development within the respective expansion area, and (2) equal to the previously calculated volume of internal residential trips. The remaining commercial trips were distributed equally into two categories: trips destined to existing residential neighbourhoods in the Bolton Rural Service Centre (Bolton trips) and to zones external of the Bolton Rural Service Centre (external trips).
Due to the fact that Area 8 does not have residential development, all commercial trips were assumed to be external.
7.4 Intersection Operational Analysis It was assumed as part of the operational analysis of future scenarios that the following improvements will be in place in the 2031 horizon year:
+ Dual westbound left turn lanes at the intersection of Highway 50 and Mayfield Road/Albion Vaughan Road;
+ Eastbound right turn lane at the intersection of Mayfield Road and the Gore Road; and + Southbound right turn lane at the intersection of Coleraine Drive and Holland Drive.

Improvement Options
Intersection 1 2 3 4 5 6 7 81. The Gore Road at
King Street WB Right Turn Lane NB Right Turn Lane
EB and WB widened to two lanes (shared Through Left and Through Right EB and WB approaches) NB Right Turn Lane
EB and WB widened to two lanes (shared Through Left and Through Right EB and WB approaches) NB and SB RT Lanes
EB and WB widened to two lanes (shared Through Left and Through Right EB and WB approaches) NB Right Turn Lane
None None None None
2. The Gore Road at Healey Road
None None WB Left Turn Lane None None None None None
3. The Gore Road at Mayfield Road
4. Humber Station Road at King Street
WB Right Turn Lane SB Left Turn Lane
EB and WB widened to two lanes (shared Through Left and Through Right EB and WB approaches) NB Left Turn Lane
EB and WB widened to two lanes (shared Through Left and Through Right EB and WB approaches) NB Left Turn Lane
EB and WB widened to two lanes (shared Through Left and Through Right EB and WB approaches) NB Left Turn Lane
None None None None
5. Clarkway Drive/Humber Station Road at Mayfield Road
6. Harvest Moon Drive at King Street (T-Intersection)
None EB and WB widened to two lanes (shared Through Left and Through Right EB and WB approaches)
EB and WB widened to two lanes (shared Through Left and Through Right EB and WB approaches)
EB and WB widened to two lanes (shared Through Left and Through Right EB and WB approaches)
None None Signalize None
7. Emil Kolb Parkway/Coleraine Drive at King Street
None None None None None None None None
8. Coleraine Drive at Harvest moon Drive/King Street
None None None None None None None None
9. Coleraine Drive at Holland Drive (T-Intersection)
None None None None None None None None
10. Coleraine Drive at Healey Road
Right Turn Lane All Directions
None None None EB Right Turn Lane None None None
11. Coleraine Drive at George Bolton Parkway(T-Intersection)
None None None None None None None None
12. Coleraine Drive at Parr Boulevard(T-Intersection)
None None None None None None None None
13. Highway 50 at Emil Kolb Parkway
None None None None None None None None
14. Coleraine Drive at Mayfield Road

Intersection 1 2 3 4 5 6 7 815. Highway 50 at
Columbia Way None Dual WB Left Turn Lane
Widen NB to two Through Lanes
None None None None None None
16. Highway 50 at Bolton Heights Drive
None Widen SB to two Through Lanes
None None None None None None
17. Highway 50 at King Street
None None None None None None None None
18. Highway 50 at Elwood Drive East/West
None None None None None None None None
19. Highway 50 at Wilton Drive/Allan Drive
EB and WB Left Turn Lanes
EB and WB Left Turn Lanes
EB and WB Left Turn Lanes
EB and WB Left Turn Lanes
EB and WB Left Turn Lanes
EB and WB Left Turn Lanes
EB and WB Left Turn Lanes
None
20. Highway 50 at Queensgate Boulevard
None None None None None None None None
21. Highway 50 at Healey Road
None None None None None None None None
22. Highway 50 at McEwan Drive East/West
None None None None None None None None
23. Highway 50 at George Bolton Parkway
None None None None None None None None
24. Highway 50 at Parr Boulevard
None None None None None None None None
25. Highway 50 at Mayfield Road/Albion Vaughan Road
None None None None None None None None
26. King Street at Humberlea Road
None None None None None None None None
27. Old King Road at King Street
None None None None None None None None
28. King Street at Caledon-KingTownline Road
None None None None None None None None
Summary 7 Right Turn Lanes 5 Left Turn Lanes 1 Through Lane
1 Right Turn Lane 4 Left Turn Lanes 8 Through Lanes (6 due to widening of King Street from Gore Road to Emil Kolb)
7 Right Turn Lanes 6 Left Turn Lanes 6 Through Lanes (due to widening of King Street from Gore Road to Emil Kolb)
6 Right Turn Lanes 5 Left Turn Lanes 6 Through Lanes (due to widening of King Street from Gore Road to Emil Kolb)
5 Right Turn Lanes 2 Left Turn Lanes
5 Right Turn Lanes 2 Left Turn Lanes 1 Through Lane
4 Right Turn Lanes 2 Left Turn lanes 1 Signalization
None

Bolton Residential Expansion Study
EMME Modelling for At-Grade Separation Demand Analysis
The objective of this exercise was to analyze the trip origins and destinations at 1) King Street at
the CP rail crossing and 2) Coleraine Drive at the CP rail crossing. The analysis focused on the
percentage of trips from each of the proposed new development options that use the above
road segments.
The transportation planning software, EMME/4, was used to conduct a “select link analysis”.
This is a partial equilibrium assignment of only those trips that use a particular part of the
network. The results of such an assignment are a demand matrix that contains only those trips
that use the selected facilities.
Individual select link analysis was conducted for each of the at grade separation segments
mentioned above. The results from the analysis are presented in Table 1 and Table 2 below.
Table 1 – Morning peak hour Select Link Analysis Results at King Street
Selected Link on King St at CP
Traffic Contribution %
Option 1 10
Option 2 10
Option 3 45
Option 4 45
Option 5 0
Option 6 0
Option 7 5
Option 8 0
Based on the results in Table 1, during the morning peak hour, among all the proposed BRES
options, Option 3 and 4 generates the most at approximately 45% of the traffic crossing the King
Street followed by Options 1 and 2 at 10%. The remaining demand is from background traffic.
Table 2 – Morning peak hour Select Link Analysis Results at Coleraine Drive
Selected Link on Coleraine Drive at CP
Traffic Contribution %
Option 1 15
Option 2 0
Option 3 18
Option 4 10
Option 5 0
Option 6 0
Option 7 0
Option 8 0
Appendix C - Evaluation of Regional Road - Rail Crossings

Table 2 indicates that the traffic demand at the Coleraine Drive railway crossing is mostly
generated from the background areas. The BRES Option #3 generates only 18% of the
demand at Coleraine Drive and CP crossing.
Volume plots based on the select link analysis results for both the railway crossings are
presented under Exhibit 1 and 2 below.
Exhibit 1: A.M. Peak Hour Select Link Analysis at King Street
Appendix C - Evaluation of Regional Road - Rail Crossings

Exhibit 2: A.M. Peak Hour Select Link Analysis at Coleraine Drive
Determining Railway Crossing Impact
Literature review on Grade-Separation criteria indicates that many jurisdictions employ an
exposure index as a primary screening tool. An exposure index looks at the average number of
trains that cross a specific location along a road each day multiplied by the average daily traffic
that cross the road at the same location. The resulting rate is objective and allows for crossings
to be screened based on volumes of both trains and road vehicles.
For the purpose of this study, a basic exposure index was used, multiplying the number of
vehicles using the King Street at CP and the Coleraine Drive at CP crossings by the volume of
trains at each crossing. The morning peak hour auto volumes at each of the crossings were
obtained from the select link analysis discussed earlier. The peak hour auto volume was
converted to daily volume based on the 2011 Transportation Tomorrow Survey data. Results of
Appendix C - Evaluation of Regional Road - Rail Crossings

the impact analysis at the railway crossings for the eight residential expansion options are
shown in Exhibit 3.
Exhibit 3: Rail Crossing Impacts
Transport Canada encourages the use of an exposure index threshold of 200,000 as one of the
factors in determining if a crossing should be funded for separation. Based on this threshold, it
is apparent that the railway crossing at Coleraine Drive has a significant need for a grade
separation compared to King Street. At the King Street crossing, Option 3 &4 has the highest
impact on the need for grade separation. At Coleraine Drive, the grade separation will be
required even without the proposed residential expansion in place as the background traffic
volume itself pass the threshold for grade separation need.
Cost Estimations for the Rail Grade Separation Structure
The grade separation projects for King Street and Coleraine Drive are currently going through a
feasibility study. Once the study is complete, the recommendations for either an underpass or
an overpass will be provided. The cost estimate to build an overpass is approximately $20M. If
the decision is to build the facility under rail, the cost estimate is in the $40M range. For a
municipally driven structure, such as the grade separation infrastructure, the Region shares
85% of the total cost. The cost sharing structure would be subject to agreement through the EA
Appendix C - Evaluation of Regional Road - Rail Crossings

and design to reflect rail upgrades and might be refined later. At this stage, based on the 15%
cost sharing, the cost figures for an overpass and underpass, and the 45% traffic contribution
from BRES Option 3 and 4, the cost estimates for the King Street and CP crossing is
summarized in Table 3.
Table 3 – Cost Implications for King Street rail grade separation facility based on BRES
Options 3 & 4
Facility Location & Type Overpass
($, millions) Underpass ($, millions)
King St at CP 7.7 15.3
Appendix C - Evaluation of Regional Road - Rail Crossings