Transportation Choices and the Future of the New … · out meaningful consultation with the...
30
Transportation Choices and the Future of the New York City Economy Partnership for New York City 2003 | 2004
Transcript of Transportation Choices and the Future of the New … · out meaningful consultation with the...
Transportation Choices and the Future of the New York City Economy
Partnership for New York City
2003 | 2004

1
INTRODUCTION
The vitality of New York City’s economy is highly dependent on a modern, efficient mass transportationsystem that connects the city’s current and future centers of employment to the regional labor pool. Theavailability and adequacy of mass transit are major factors in business location decisions, driving demandfor commercial real estate and dictating patterns in job growth. Despite their critical importance to businessand economic development, major investment decisions on transportation projects are typically made with-out meaningful consultation with the business community or a careful assessment of long-term contribu-tions of a given project to expansion of the city’s economy.
The Partnership for New York City represents business leaders who are committed to economic develop-ment and job growth in the five boroughs. Future economic growth will require substantial investment innew and improved mass transportation that not only serves commuters but also links the city’s various busi-ness districts to each other and to the airports. Even more important, improved rapid transit will open newareas for development in all boroughs and encourage the development of the city’s underutilized waterfront.The result will be an expanded tax base and additional revenues to support further investment.
Regional transportation experts have suggested a menu of desirable transit investments, which could costmore than $50 billion over the next 10 to 20 years. That amount does not include the money required tomaintain the current transit system in a state of good repair. The most recent projections from theMetropolitan Transportation Authority suggest that it will be hard-pressed to secure the funding required tocomplete the projects that are considered important for the metropolitan region within that time frame.
Clearly, priorities must be set and choices must be made. One important component of the decision-makingprocess should be an assessment of the relative economic development benefits of various projects. Thisrequires an accepted methodology for quantifying and comparing transit and economic development bene-fits – a methodology that has rarely been employed up to this point.
To develop a standard that would enable decision makers to make choices on the basis of comparable data,the Partnership commissioned the Boston Consulting Group (BCG) and the University TransportationResearch Center (UTRC) at the City University of New York. They were asked to examine a variety ofmass transit projects and evaluate them based on their ramifications for the economy. To that end, BCG andUTRC have created a methodology for evaluating and weighing both the transportation and economicdevelopment benefits of transportation projects from the perspective of the private sector. These assessmenttools are intended to help decision makers and the public evaluate the benefits of individual projects andclusters of projects.
In addition to developing analytical tools, BCG conducted interviews with major employers and real estateexperts about seven transportation projects, most of which are proposed or in the conceptual stage andsome of which are partially funded or under construction. The result of this six-month project is a new per-spective on transportation planning – and, more important, some significant findings about how future proj-ects might be planned to maximize their benefits for the local economy.
This study and its methodology should be the opening round of a discussion that leads to the developmentof a widely accepted model for estimating and weighing the transportation and the economic developmentbenefits of transportation projects. This methodology may also be valuable in making the city’s case forfederal transit aid.
2
Findings
New York City’s transportation investment decisions deserve greater scrutiny from a wider
audience of stakeholders. Transportation investment decisions deserve the same degree of analysisand public review as other land use and capital budget decisions. Decisions about capital invest-ment in the city’s transportation system should not be left solely to industry experts, planners andtransportation agencies, which tend to focus on the needs of existing passengers and demands onthe current infrastructure. The application of standardized tools for measuring transportation andeconomic development benefits of proposed projects will allow for informed input from the broad-er community.
The value of transportation benefits of a rapid transit project, expressed in dollars, rarely
justifies its capital cost. Of the seven projects examined in this study, only one, the LowerManhattan Transit Hub (a combination of the Fulton Transit Center and the permanent PATH sta-tion), could generate transportation benefits that exceed its capital costs. When economic develop-ment benefits are factored in, however, most transit projects generate a significant return on publicinvestment.
Transportation hubs produce the greatest benefits. Projects that strengthen transportation hubsare likely to yield the highest levels of transportation and economic development benefits for thecity in this decade and decades to come for three reasons:
Hubs are magnets for workers and other travelers since multiple rapid transit lines convergethere. The number of people who pass through a hub exceeds the carrying capacity of anyone rapid transit line.
Business location decisions are often influenced by hubs. Employers know that a compa-ny’s proximity to a hub increases its access to regional labor pools. Hubs with the capacityto add new rapid transit lines have the potential to give nearby companies greater access tolabor pools.
Jobs near hubs make commuting easier. Workers can exit the hub and walk to work ormake an easy transfer to a transit line that takes them to their destination.
Of the seven projects examined in this study, four would clearly yield significant economic
development benefits for New York City.
Three projects would yield more than five times their capital cost in economic developmentbenefits: the Lower Manhattan Hub, the extension of the No. 7 Subway line and the reloca-tion of Pennsylvania Station to the Farley Post Office.
One project, East Side Access (LIRR to Grand Central Terminal), would yield one-and-a-half times its capital costs in economic development benefits.
Three projects have capital costs that, in their current configuration, exceed the value of their
economic development benefits.
Capital costs for the 2nd Avenue Subway, including debt service, exceed the value of eco-nomic development benefits by nearly $2.7 billion, largely due to the 17 years it is expect-ed to take to complete a full build-out of the line.
The capital costs of two projects - Access to the Region's Core (the Hudson River Tunnelto Midtown project) and the extension of the PATH system to Newark Liberty Airport -would likely exceed the economic development benefits either would generate for NewYork City. However, there would certainly be benefits for New Jersey that are not includedin this analysis.
3
Recommendations
Reconsider the full build-out of the proposed 2nd Avenue Subway and determine the econom-
ic development potential of building the project in phases. The benefits of a phased approach tothe 2nd Avenue project can only be fully evaluated in a comprehensive network analysis.1 Such ananalysis of each segment of the project would identify and assess the synergistic benefits generatedwhen a particular segment is combined with East Side Access, the connections to the N and RSubway lines or the redevelopment strategy for Lower Manhattan.
Develop rapid transit projects that will accelerate economic development in emerging busi-
ness districts in the boroughs beyond Manhattan. The transportation projects discussed in thisstudy are Manhattan-centric, reflecting the current focus of large transit investments. More atten-tion to the mass transit needs of the other boroughs is needed. As the city seeks to diversify its eco-nomic base and encourage the development of emerging business districts in the other boroughs,investment in new transportation projects will likely be required. Among the possibilities:
Using existing rights-of-way for New Jersey Transit and the Long Island Rail Road to cre-ate an east-west express service from New Jersey could accelerate the development ofLong Island City.
The “Super Shuttle” idea, which is not a subject of this study but has been advanced byBrookfield Properties, would improve access from downtown Brooklyn and Jamaica,Queens, to Lower Manhattan, giving downtown employers better access to the labor poolin Brooklyn, Queens and Long Island.
Build the proposed extension of the No. 7 Subway line because it will generate significant eco-
nomic development benefits and is essential to the redevelopment of the Far West Side. Toturn this underutilized section of Manhattan into a vibrant center of commercial, residential andrecreational activity, the neighborhood needs to be connected to the rest of the subway system,which can be accomplished by extending the No. 7 line west from Times Square.
Adopt the best practices from the intergovernmental planning and review processes in use on
the Far West Side and in Lower Manhattan and apply those to all mass transit investment
decisions. Transportation planning should not be conducted in isolation from major development,redevelopment or rezoning efforts. The inclusion of transportation project review in the comprehen-sive plans for the Far West Side and Lower Manhattan is a model for maximizing the economicdevelopment benefits of transit investments.
Create a regional ferry system that would be managed by the Metropolitan Transportation
Authority. New York City will never realize the potential of its waterways to supplement rapidtransit - at a fraction of the cost of underground subway lines - unless the responsibility for plan-ning, financing and operating the ferry system serving the city rests with the MetropolitanTransportation Authority. It is critical to expand ferry routes available to visitors, suburban com-muters and city residents. A truly intermodal public-private system would be best managed by theMetropolitan Transportation Authority.
1 See page 20, footnote 6, for a description of a network analysis.

4
ACKNOWLEDGMENTS
This study was prepared with input and advice from the Metropolitan Transportation Authority, New JerseyTransit, the Port Authority of New York and New Jersey, the New York City Department of Transportation,the Department of City Planning, the Office of the Deputy Mayor for Economic Development andRebuilding and Stephen Berger, Chairman of Odyssey Investment Partners, LLC and former ExecutiveDirector of the Port Authority. This study was partially underwritten by a grant from the Robert SterlingClark Foundation.
BCG's team was led by Sandy Apgar and included W. Edmund Busby, Ranu Dayal, Felix Danziger, JeromeDelhaye, Megan Findley and Jean Friedberg. UTRC’s team was led by Robert Paaswell and JosephBerechman and included Carolyn Clevenger, Todd Goldman and Ross Weiner. Rosemary Scanlon, formerchief economist for the Port Authority, advised the two teams on assumptions and analysis. ThePartnership's Research & Policy Department, which managed the project, is led by Ernest Tollerson andincludes Joshua Chang, Jane Lynch, Ruth Melville, Patty Noonan and Jonathan Schwabish.
Members of the Advisory Committee were Charles Brecher, Executive Vice President and Director ofResearch, Citizens Budget Commission; Michael Lobdell, Managing Director, J.P. Morgan Chase & Co.;Daniel Powell, Associate Partner, McKinsey & Company, Inc.; and Rae Rosen, Senior Economist andAssistant Vice President, Federal Reserve Bank of New York.
PROJECTS EXAMINED AND THE BOUNDARIES OF THESTUDY
This study focuses on rapid transit options. It excludes vehicular projects such as the proposed West StreetTunnel project in Lower Manhattan, the proposed reconstruction of the Gowanus Expressway in Brooklynand the Tappan Zee Bridge project in the northern suburbs. Freight-related proposals such as the Cross-Harbor Freight Tunnel require a different kind of analysis and were thus beyond the scope of this study.
The seven projects examined in this study are in varying stages of planning, which affects the quantity andquality of data available. All of the estimates of capital costs that appear in this study were given to UTRCand BCG by the transportation agencies and other sponsors of these projects. All costs and benefits areexpressed in 2003 (present value) dollars.
In some cases, the information available on projects was limited and assumptions may not reflect finalplans; as a result, these snapshots are by no means definitive. But they do provide a valuable starting pointfor further discussion and refinement of the tools.
It is also important to remember that these transportation proposals are not competitors in a zero-sum game.There are a number of sources of state and federal funds. For example, $4.55 billion of the more than $20billion Washington plans to make available for the city's post-9/11 recovery has been earmarked for LowerManhattan transportation projects. Other rapid transit projects are already eligible for - or have received -funds from other existing federal programs, including the Transportation Equity Act of the 21st Century,known as TEA-21.
Some of the rapid transit projects on the agenda of the city and the region, especially those that will restore
5
the mass transit infrastructure of Lower Manhattan, are already under way. All of the Lower Manhattanprojects under construction or under discussion have been designed to improve, not simply replace, whatwas destroyed on 9/11.
OVERVIEW OF METHODOLOGY
The Partnership sponsored this study as a first step in assessing the impact that rapid transit and relatedprojects will have on economic development in the city over the next 50 years. To frame the issue, thePartnership commissioned BCG and UTRC to perform two tasks:
Develop methodologies and models for evaluating the costs and benefits of proposed transportationprojects now and over the future life of the investment (50 years); and
Provide a first-cut analysis of seven planned transportation projects, using two lenses:
An estimate of the likely transportation benefits; and
An estimate of the potential impact of projects on job growth and economic developmentin New York City.
Formula for the Transportation Benefits
UTRC’s model calculated each project’s transportation benefits by estimating the value of savings in per-sonal travel time, waiting time, walking distances and times, changes in number of transfers and reductionof congestion and overcrowding. These values were then converted into dollars using federal guidelines forcalculating the value of time adjusted for New York City wages and income. The model then computed thenet present value of the project, taking into account the transportation benefits listed above and the capitalcost, the debt service cost during construction, the operating and maintenance costs and the fare box rev-enue.
Formula for the Economic Development Benefits
BCG calculated the value of economic development benefits by estimating appreciation in property valuesgenerated as a result of the transportation projects. These benefits - new commercial development, new res-idential development, value increases to existing residential development, incremental changes in jobs andincome, and increases in sales and tourism - incorporate a core set of assumptions regarding development,market value of land, office space required per job, and proportion of units affected by each project.
For the purposes of this study, the transportation and economic development benefits are expressed as dol-lars to illustrate the relative value of the projects. The discussion of the value of the benefits is separate andapart from how projects are financed, which typically takes the form of bonds, state and federal aid andmoney from other sources.2
2 For a full explanation of the methodology for calculating both sets of benefits, see the Methodology Appendix.
6
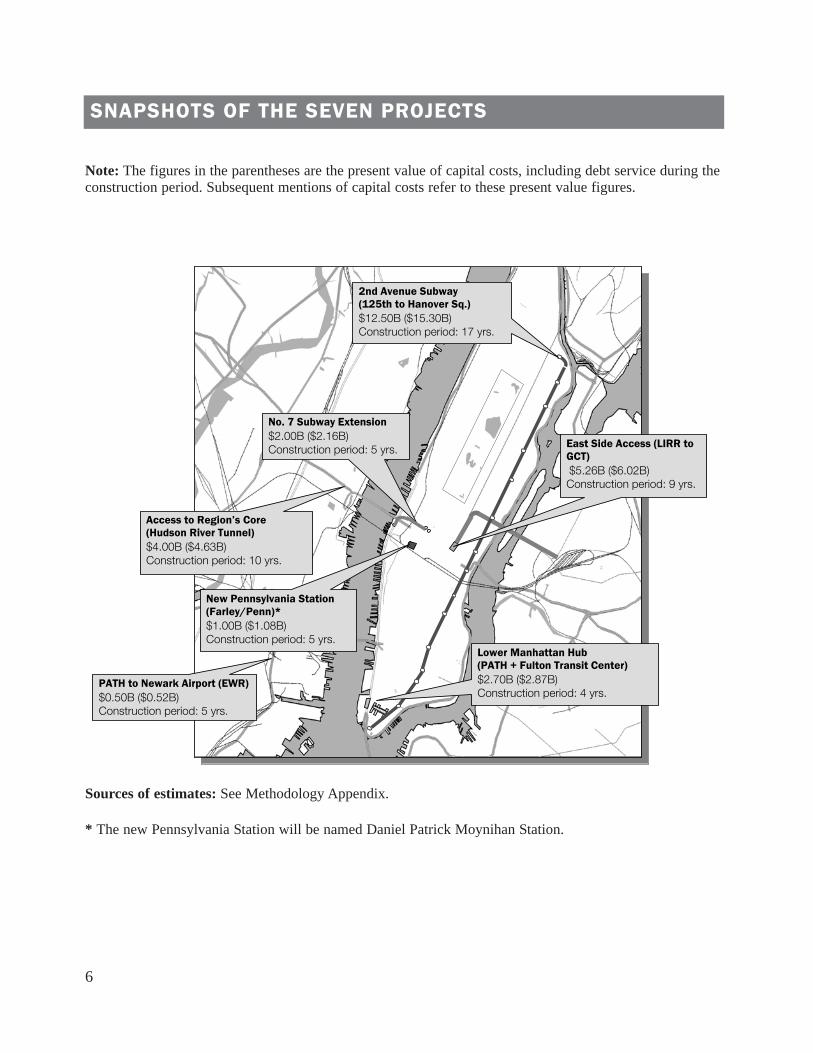
2nd Avenue Subway (125th to Hanover Sq.) $12.50B ($15.30B) Construction period: 17 yrs.
East Side Access (LIRR to GCT) $5.26B ($6.02B) Construction period: 9 yrs.
Lower Manhattan Hub (PATH + Fulton Transit Center) $2.70B ($2.87B) Construction period: 4 yrs.
No. 7 Subway Extension $2.00B ($2.16B) Construction period: 5 yrs.
Access to Region’s Core (Hudson River Tunnel) $4.00B ($4.63B) Construction period: 10 yrs.
New Pennsylvania Station (Farley/Penn)* $1.00B ($1.08B) Construction period: 5 yrs.
PATH to Newark Airport (EWR) $0.50B ($0.52B) Construction period: 5 yrs.
Sources of estimates: See Methodology Appendix.
* The new Pennsylvania Station will be named Daniel Patrick Moynihan Station.
SNAPSHOTS OF THE SEVEN PROJECTS
Note: The figures in the parentheses are the present value of capital costs, including debt service during theconstruction period. Subsequent mentions of capital costs refer to these present value figures.
7
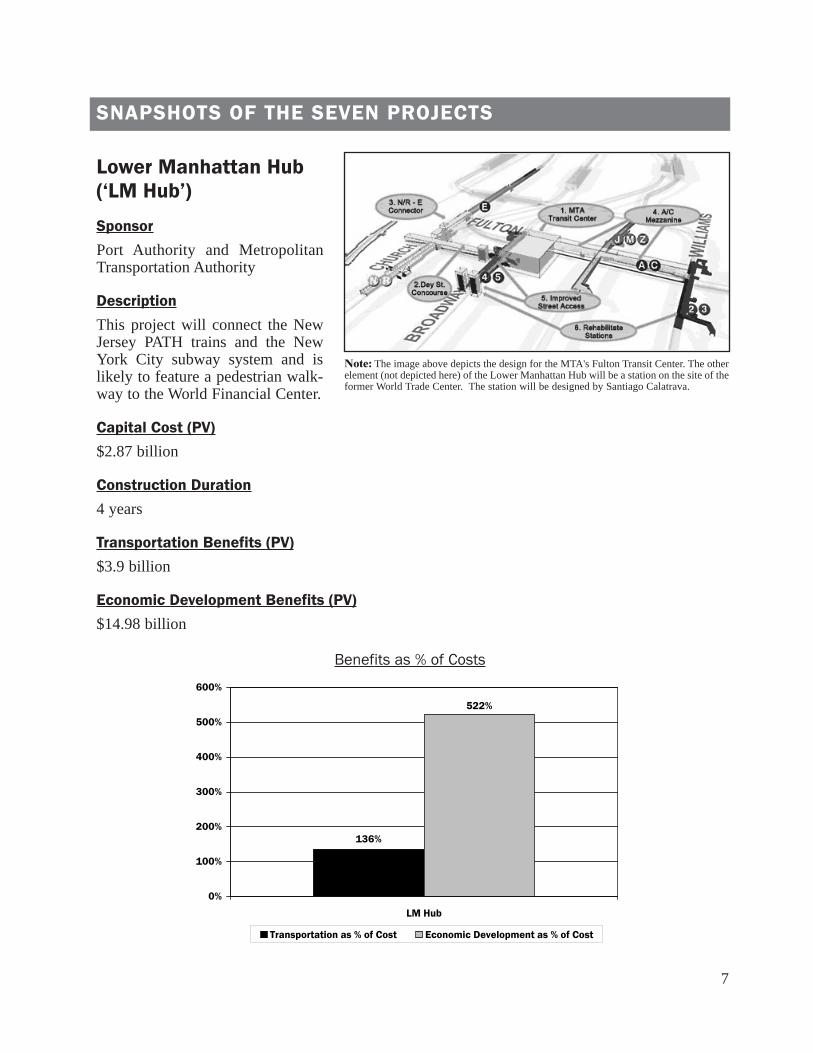
Lower Manhattan Hub
(‘LM Hub’)
Sponsor
Port Authority and MetropolitanTransportation Authority
Description
This project will connect the NewJersey PATH trains and the NewYork City subway system and islikely to feature a pedestrian walk-way to the World Financial Center.
Capital Cost (PV)
$2.87 billion
Construction Duration
4 years
Transportation Benefits (PV)
$3.9 billion
Economic Development Benefits (PV)
$14.98 billion
136%
522%
0%
100%
200%
300%
400%
500%
600%
LM Hub
Transportation as % of Cost Economic Development as % of Cost
SNAPSHOTS OF THE SEVEN PROJECTS
Benefits as % of Costs
Note: The image above depicts the design for the MTA's Fulton Transit Center. The otherelement (not depicted here) of the Lower Manhattan Hub will be a station on the site of theformer World Trade Center. The station will be designed by Santiago Calatrava.
8
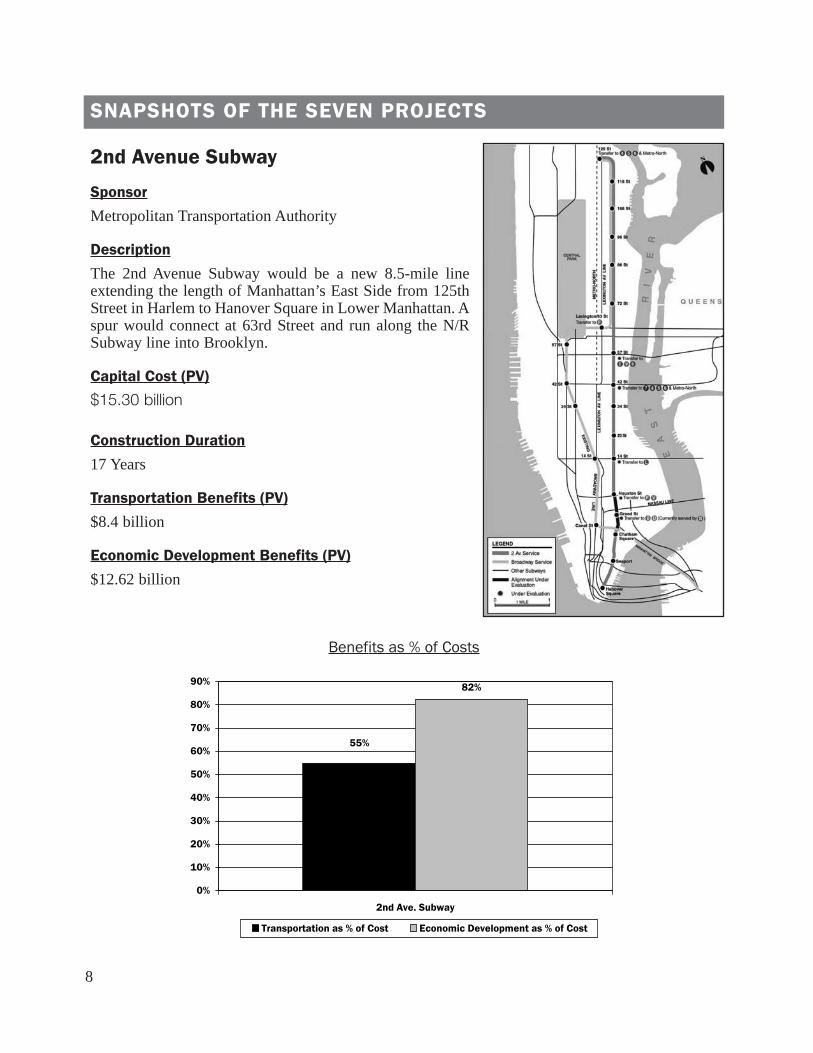
2nd Avenue Subway
Sponsor
Metropolitan Transportation Authority
Description
The 2nd Avenue Subway would be a new 8.5-mile lineextending the length of Manhattan’s East Side from 125thStreet in Harlem to Hanover Square in Lower Manhattan. Aspur would connect at 63rd Street and run along the N/RSubway line into Brooklyn.
Capital Cost (PV)
$15.30 billion
Construction Duration
17 Years
Transportation Benefits (PV)
$8.4 billion
Economic Development Benefits (PV)
$12.62 billion
82%
55%
0%
10%
20%
30%
40%
50%
60%
70%
80%
90%
2nd Ave. Subway
Transportation as % of Cost Economic Development as % of Cost
SNAPSHOTS OF THE SEVEN PROJECTS
Benefits as % of Costs

9
Number 7 Subway Extension
Sponsor
Metropolitan Transportation Authority
Description
The No. 7 Subway would be extendedfrom its current terminus in Times Square,west to 11th Avenue and then south to 33rdStreet.
Capital Cost (PV)
$2.16 billion
Construction Duration
5 years
Transportation Benefits (PV)
$1.4 billion
Economic Development Benefits (PV)
According to a study by Economics ResearchAssociates and Cushman & Wakefield, the full,40-year build-out of Hudson Yards, whichincludes rezoning the Far West Side, the expan-sion of the Jacob Javits Conventions Center andother improvements, would create 28 million
square feet of office space on the Far West Side.The economic development generated fromthese improvements would be $89.68 billion.BCG estimates that the economic developmentimpact of the extension of the No. 7 alonewould be $13.83 billion.
SNAPSHOTS OF THE SEVEN PROJECTS
Benefits as % of Costs
65%
4152%
0%
500%
1000%
1500%
2000%
2500%
3000%
3500%
4000%
4500%
Comprehensive Hudson Yards Plan
Transportation as % of Cost Economic Development as % of Cost
65%
640%
0%
100%
200%
300%
400%
500%
600%
700%
No. 7 Extension
Transportation as % of Cost Economic Development as % of Cost
10
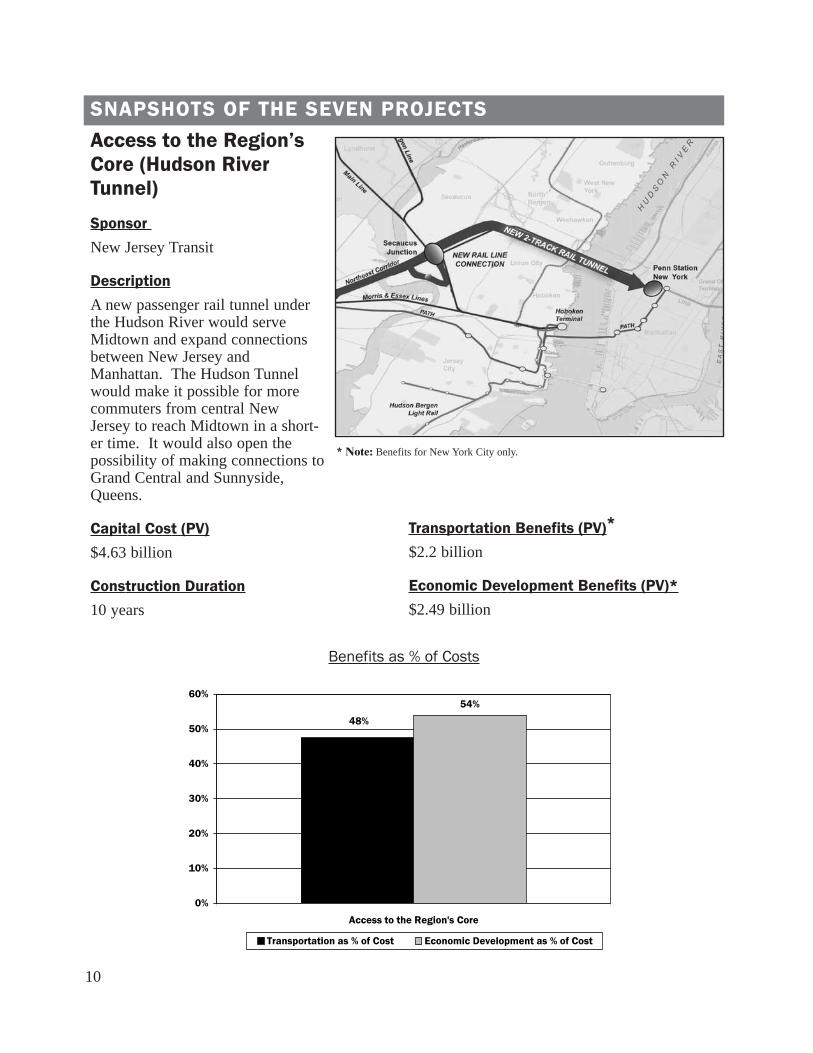
Access to the Region’s
Core (Hudson River
Tunnel)
Sponsor
New Jersey Transit
Description
A new passenger rail tunnel underthe Hudson River would serveMidtown and expand connectionsbetween New Jersey andManhattan. The Hudson Tunnelwould make it possible for morecommuters from central NewJersey to reach Midtown in a short-er time. It would also open thepossibility of making connections toGrand Central and Sunnyside,Queens.
Capital Cost (PV)
$4.63 billion
Construction Duration
10 years
Transportation Benefits (PV)*
$2.2 billion
Economic Development Benefits (PV)*
$2.49 billion
54%
48%
0%
10%
20%
30%
40%
50%
60%
Access to the Region's Core
Transportation as % of Cost Economic Development as % of Cost
SNAPSHOTS OF THE SEVEN PROJECTS
Benefits as % of Costs
* Note: Benefits for New York City only.
11
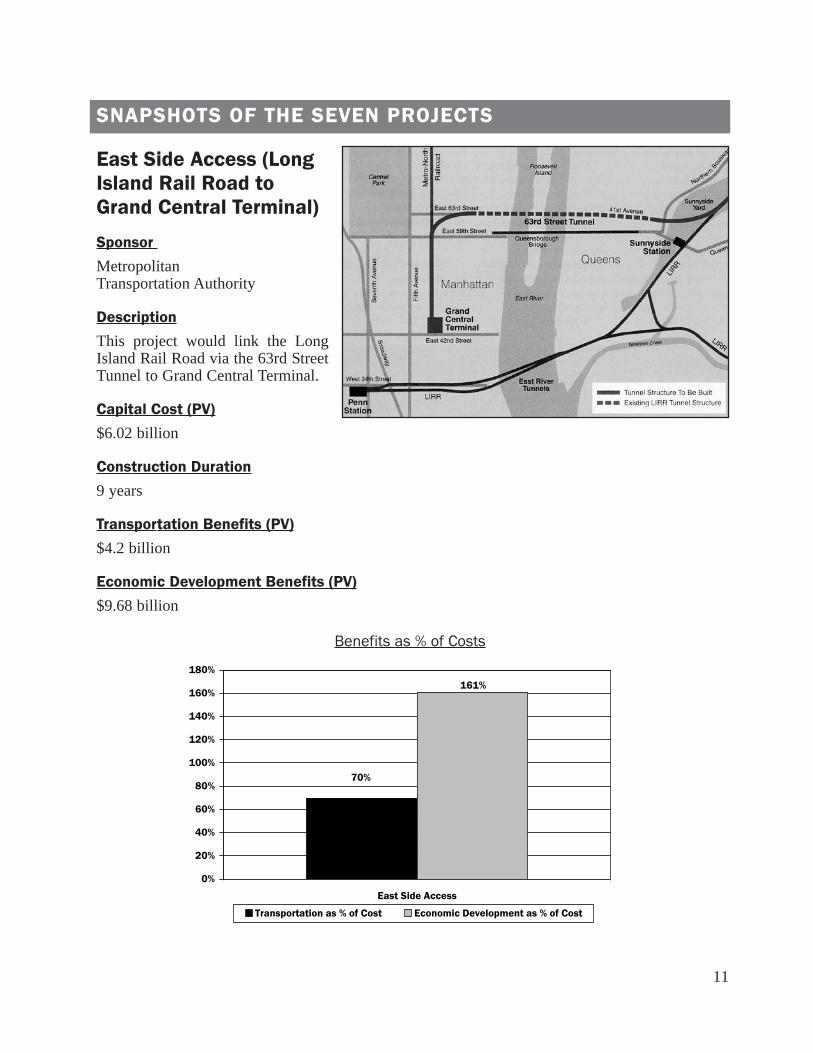
East Side Access (Long
Island Rail Road to
Grand Central Terminal)
Sponsor
MetropolitanTransportation Authority
Description
This project would link the LongIsland Rail Road via the 63rd StreetTunnel to Grand Central Terminal.
Capital Cost (PV)
$6.02 billion
Construction Duration
9 years
Transportation Benefits (PV)
$4.2 billion
Economic Development Benefits (PV)
$9.68 billion
70%
161%
0%
20%
40%
60%
80%
100%
120%
140%
160%
180%
East Side Access
Transportation as % of Cost Economic Development as % of Cost
SNAPSHOTS OF THE SEVEN PROJECTS
Benefits as % of Costs
12
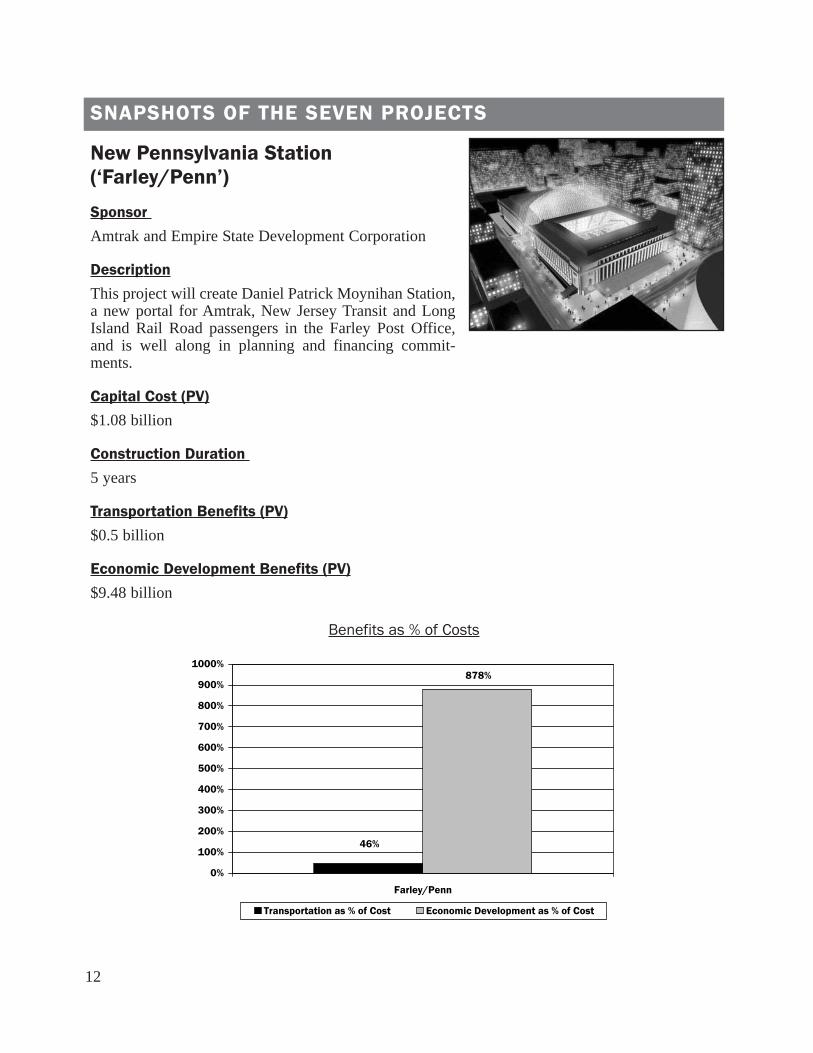
New Pennsylvania Station
(‘Farley/Penn’)
Sponsor
Amtrak and Empire State Development Corporation
Description
This project will create Daniel Patrick Moynihan Station,a new portal for Amtrak, New Jersey Transit and LongIsland Rail Road passengers in the Farley Post Office,and is well along in planning and financing commit-ments.
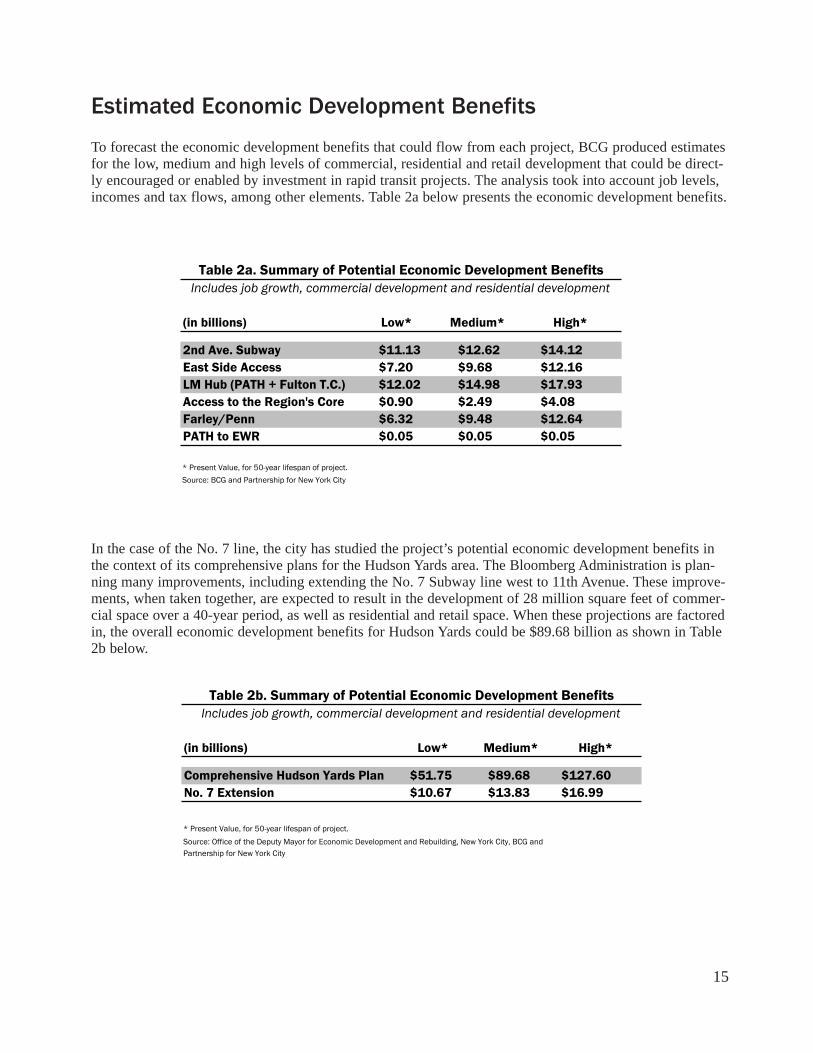
Capital Cost (PV)
$1.08 billion
Construction Duration
5 years
Transportation Benefits (PV)
$0.5 billion
Economic Development Benefits (PV)
$9.48 billion
46%
878%
0%
100%
200%
300%
400%
500%
600%
700%
800%
900%
1000%
Farley/Penn
Transportation as % of Cost Economic Development as % of Cost
SNAPSHOTS OF THE SEVEN PROJECTS
Benefits as % of Costs

13
PATH to Newark Liberty Airport
(‘PATH to EWR’)*
Sponsor
Port Authority
Description
Extending the PATH commuter train system fromDowntown Newark to AirTrain at Newark LibertyAirport would offer easier access from LowerManhattan to Newark airport.
Capital Cost (PV)
$0.52 billion
Construction Duration
5 years
Transportation Benefits (PV)
$0.2 billion
Economic Development Benefits (PV)
$0.05 billion
10%
38%
0%
5%
10%
15%
20%
25%
30%
35%
40%
45%
PATH to EWR
Transportation as % of Cost Economic Development as % of Cost
SNAPSHOTS OF THE SEVEN PROJECTS
Benefits as % of Costs
* Note: Project in very early stage of planning

14
Estimated Transportation Benefits
The transportation benefits resulting from investment in new transit projects were calculated to show boththe direct and indirect value of savings to commuters and other passengers in walking and waiting time, in-vehicle travel time and the reduction of overcrowding. Calculations are based on standard assumptionswidely accepted by the federal government and the academic community; see Methodology Appendix fordetails. These benefits are estimated for the year of project completion (i.e., for the first year the projectbecomes operational), and on the total value of those savings over 50 years, measured in present value.
The present value dollar figures in Table 1 and Figure 1 illustrate the wide range of transportation benefitsthat could result from individual projects - depending on their location and purpose. Clustering projectswould, in all likelihood, yield cumulative benefits that would exceed those created by any single project.Determining the value of these synergies requires a network analysis that is beyond the scope of this study.
Annual Benefits* Expected Completion (Year) Total Benefits**
2nd Ave. Subway $970.8 m. 2020 $8.4 b.East Side Access $337.0 m. 2012 $4.2 b.LM Hub (PATH + Fulton T.C.) $243.0 m. 2007 $3.9 b.Access to the Region's Core $202.1 m. 2013 $2.2 b.No. 7 Extension $87.1 m. 2008 $1.4 b.Farley/Penn $35.3 m. 2008 $0.5 b.PATH to EWR $10.6 m. 2008 $0.2 b.
* Benefits begin to flow in the year the project is complete and in use.
** Present Value, for 50-year lifespan of project.
Source: UTRC
Table 1. Summary of Potential Transportation BenefitsIncludes ridership and savings in personal travel time and congestion relief
Figure 1. Transportation Benefits as % of Costs
55%
136%
48%
65%
46%38%
70%
0%
20%
40%
60%
80%
100%
120%
140%
160%
2nd Ave.Subway
East SideAccess
LM Hub Access tothe Region's
Core
No. 7Extension
Farley/Penn PATH toEWR
Figure 1.
Transportation Benefits as % of Costs
15
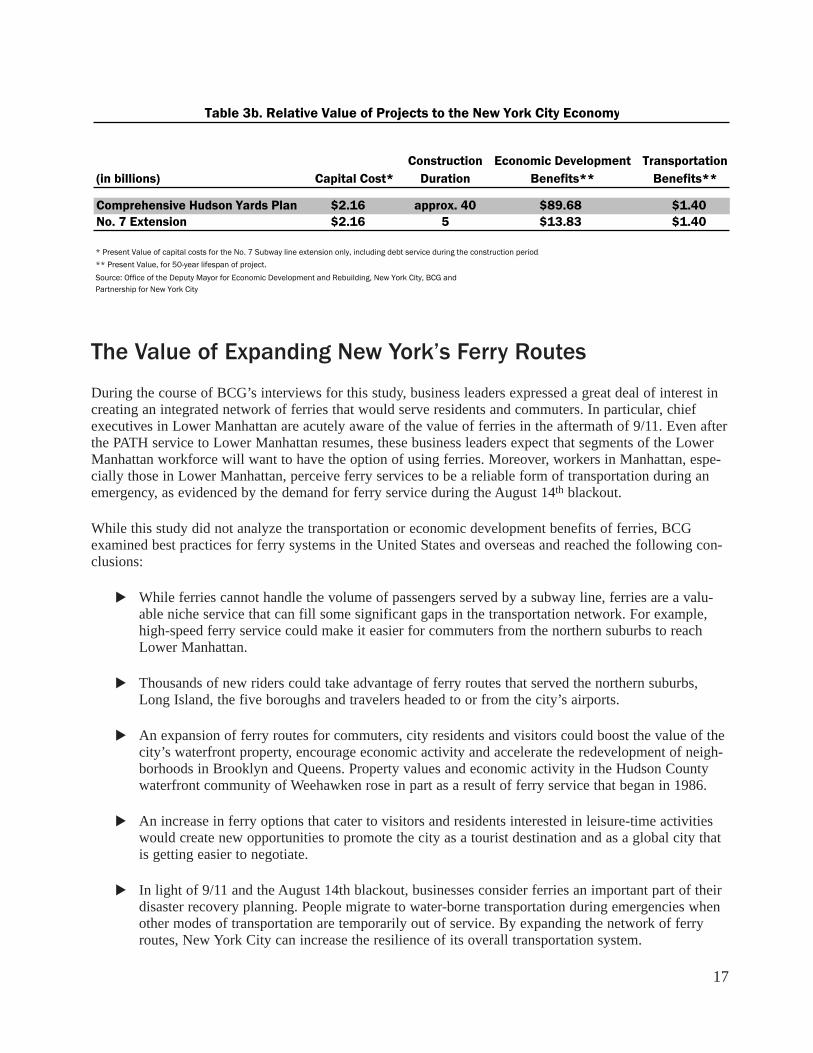
Estimated Economic Development Benefits
To forecast the economic development benefits that could flow from each project, BCG produced estimatesfor the low, medium and high levels of commercial, residential and retail development that could be direct-ly encouraged or enabled by investment in rapid transit projects. The analysis took into account job levels,incomes and tax flows, among other elements. Table 2a below presents the economic development benefits.
In the case of the No. 7 line, the city has studied the project’s potential economic development benefits inthe context of its comprehensive plans for the Hudson Yards area. The Bloomberg Administration is plan-ning many improvements, including extending the No. 7 Subway line west to 11th Avenue. These improve-ments, when taken together, are expected to result in the development of 28 million square feet of commer-cial space over a 40-year period, as well as residential and retail space. When these projections are factoredin, the overall economic development benefits for Hudson Yards could be $89.68 billion as shown in Table2b below.
(in billions) Low* Medium* High*
2nd Ave. Subway $11.13 $12.62 $14.12East Side Access $7.20 $9.68 $12.16LM Hub (PATH + Fulton T.C.) $12.02 $14.98 $17.93Access to the Region's Core $0.90 $2.49 $4.08Farley/Penn $6.32 $9.48 $12.64PATH to EWR $0.05 $0.05 $0.05
* Present Value, for 50-year lifespan of project.
Source: BCG and Partnership for New York City
Table 2a. Summary of Potential Economic Development BenefitsIncludes job growth, commercial development and residential development
(in billions) Low* Medium* High*
Comprehensive Hudson Yards Plan $51.75 $89.68 $127.60No. 7 Extension $10.67 $13.83 $16.99
* Present Value, for 50-year lifespan of project.
Table 2b. Summary of Potential Economic Development BenefitsIncludes job growth, commercial development and residential development
Source: Office of the Deputy Mayor for Economic Development and Rebuilding, New York City, BCG and Partnership for New York City

16
Four of the seven projects could generate substantial job growth and economic development, and could bebuilt within the current decade. They are:
The extension of the No. 7 Subway line;
Relocation of Pennsylvania Station to the Farley building;
Running LIRR trains into Grand Central (East Side Access); and
Creation of the Lower Manhattan Hub (PATH terminal and the MTA’s Fulton Transit Center).
While some projects score lower as drivers of job creation and economic development, they score well intransportation benefits by reducing congestion and improving convenience.4 Transportation and economicdevelopment benefits are presented side by side for six projects in Table 3a below. The EconomicDevelopment Benefits column presents the medium, or midrange, estimate of these benefits.5
(in billions) Capital Cost*
2nd Ave. Subway $15.30 17 $12.62 $8.40East Side Access $6.02 9 $9.68 $4.20LM Hub (PATH + Fulton T.C.) $2.87 4 $14.98 $3.90Access to the Region's Core $4.63 10 $2.49 $2.20Farley/Penn $1.08 5 $9.48 $0.50PATH to EWR $0.52 5 $0.05 $0.20
* Present Value of capital costs, including debt service during the construction period.
** Present Value, for 50-year lifespan of project.
Source: BCG and Partnership for New York City
Economic Development Benefits**
Table 3a. Relative Value of Projects to the New York City Economy
Construction Duration
Transportation Benefits**
4 It should be noted that the PATH extension to Newark is still at an early stage of analysis, and that estimates for both transporta-tion and economic development benefits could change with more developed data generally found in an environmental impact state-ment.
5 The transportation and economic development benefits cannot be added together since they were calculated using differentmethodologies and the calculation of their benefits may overlap to a degree.
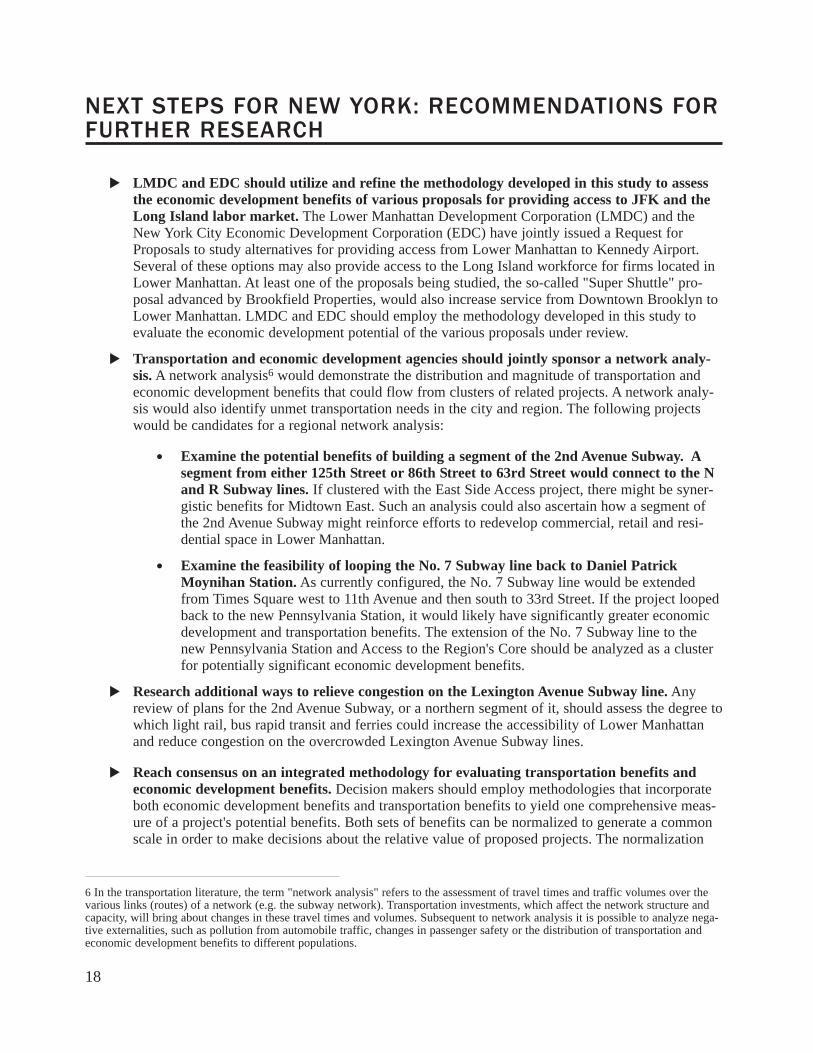
Table 3b on the following page compares the economic development and transportation benefits that wouldflow from the proposed comprehensive plan for the Far West Side to the same set of benefits that would begenerated by one transit project alone, extending the No. 7 Subway line to the Far West Side. As the tableshows, a comprehensive plan that makes a transportation project an integral part of rezoning, redevelop-ment and other improvements is likely to yield a higher level of benefits than those that would flow from astand-alone rapid transit project.
17
The Value of Expanding New York’s Ferry Routes
During the course of BCG’s interviews for this study, business leaders expressed a great deal of interest increating an integrated network of ferries that would serve residents and commuters. In particular, chiefexecutives in Lower Manhattan are acutely aware of the value of ferries in the aftermath of 9/11. Even afterthe PATH service to Lower Manhattan resumes, these business leaders expect that segments of the LowerManhattan workforce will want to have the option of using ferries. Moreover, workers in Manhattan, espe-cially those in Lower Manhattan, perceive ferry services to be a reliable form of transportation during anemergency, as evidenced by the demand for ferry service during the August 14th blackout.
While this study did not analyze the transportation or economic development benefits of ferries, BCGexamined best practices for ferry systems in the United States and overseas and reached the following con-clusions:
While ferries cannot handle the volume of passengers served by a subway line, ferries are a valu-able niche service that can fill some significant gaps in the transportation network. For example,high-speed ferry service could make it easier for commuters from the northern suburbs to reachLower Manhattan.
Thousands of new riders could take advantage of ferry routes that served the northern suburbs,Long Island, the five boroughs and travelers headed to or from the city’s airports.
An expansion of ferry routes for commuters, city residents and visitors could boost the value of thecity’s waterfront property, encourage economic activity and accelerate the redevelopment of neigh-borhoods in Brooklyn and Queens. Property values and economic activity in the Hudson Countywaterfront community of Weehawken rose in part as a result of ferry service that began in 1986.
An increase in ferry options that cater to visitors and residents interested in leisure-time activitieswould create new opportunities to promote the city as a tourist destination and as a global city thatis getting easier to negotiate.
In light of 9/11 and the August 14th blackout, businesses consider ferries an important part of theirdisaster recovery planning. People migrate to water-borne transportation during emergencies whenother modes of transportation are temporarily out of service. By expanding the network of ferryroutes, New York City can increase the resilience of its overall transportation system.
(in billions) Capital Cost*
Comprehensive Hudson Yards Plan $2.16 approx. 40 $89.68 $1.40No. 7 Extension $2.16 5 $13.83 $1.40
* Present Value of capital costs for the No. 7 Subway line extension only, including debt service during the construction period.
** Present Value, for 50-year lifespan of project.
Source: Office of the Deputy Mayor for Economic Development and Rebuilding, New York City, BCG and Partnership for New York City
Economic Development Benefits**
Table 3b. Relative Value of Projects to the New York City Economy
Construction Duration
Transportation Benefits**
18
NEXT STEPS FOR NEW YORK: RECOMMENDATIONS FORFURTHER RESEARCH
LMDC and EDC should utilize and refine the methodology developed in this study to assess
the economic development benefits of various proposals for providing access to JFK and the
Long Island labor market. The Lower Manhattan Development Corporation (LMDC) and theNew York City Economic Development Corporation (EDC) have jointly issued a Request forProposals to study alternatives for providing access from Lower Manhattan to Kennedy Airport.Several of these options may also provide access to the Long Island workforce for firms located inLower Manhattan. At least one of the proposals being studied, the so-called "Super Shuttle" pro-posal advanced by Brookfield Properties, would also increase service from Downtown Brooklyn toLower Manhattan. LMDC and EDC should employ the methodology developed in this study toevaluate the economic development potential of the various proposals under review.
Transportation and economic development agencies should jointly sponsor a network analy-
sis. A network analysis6 would demonstrate the distribution and magnitude of transportation andeconomic development benefits that could flow from clusters of related projects. A network analy-sis would also identify unmet transportation needs in the city and region. The following projectswould be candidates for a regional network analysis:
Examine the potential benefits of building a segment of the 2nd Avenue Subway. A
segment from either 125th Street or 86th Street to 63rd Street would connect to the N
and R Subway lines. If clustered with the East Side Access project, there might be syner-gistic benefits for Midtown East. Such an analysis could also ascertain how a segment ofthe 2nd Avenue Subway might reinforce efforts to redevelop commercial, retail and resi-dential space in Lower Manhattan.
Examine the feasibility of looping the No. 7 Subway line back to Daniel Patrick
Moynihan Station. As currently configured, the No. 7 Subway line would be extendedfrom Times Square west to 11th Avenue and then south to 33rd Street. If the project loopedback to the new Pennsylvania Station, it would likely have significantly greater economicdevelopment and transportation benefits. The extension of the No. 7 Subway line to thenew Pennsylvania Station and Access to the Region's Core should be analyzed as a clusterfor potentially significant economic development benefits.
Research additional ways to relieve congestion on the Lexington Avenue Subway line. Anyreview of plans for the 2nd Avenue Subway, or a northern segment of it, should assess the degree towhich light rail, bus rapid transit and ferries could increase the accessibility of Lower Manhattanand reduce congestion on the overcrowded Lexington Avenue Subway lines.
Reach consensus on an integrated methodology for evaluating transportation benefits and
economic development benefits. Decision makers should employ methodologies that incorporateboth economic development benefits and transportation benefits to yield one comprehensive meas-ure of a project's potential benefits. Both sets of benefits can be normalized to generate a commonscale in order to make decisions about the relative value of proposed projects. The normalization
6 In the transportation literature, the term "network analysis" refers to the assessment of travel times and traffic volumes over thevarious links (routes) of a network (e.g. the subway network). Transportation investments, which affect the network structure andcapacity, will bring about changes in these travel times and volumes. Subsequent to network analysis it is possible to analyze nega-tive externalities, such as pollution from automobile traffic, changes in passenger safety or the distribution of transportation andeconomic development benefits to different populations.
19
tool employed by UTRC, but not reported here, is a Goal Achievement Matrix (GAM), whicheffectively merges both sets of benefits onto one comprehensive scale. This normalization toolshould help inform the public discourse and decision making process for transportation alternatives.
Include universities, hospitals and medical research institutions in the transportation plan-
ning process. Transportation planning agencies should consult with New York's major universitiesand medical institutions, which are among the city's largest employers, about unmet transportationneeds. Issues identified by these institutions during interviews related to this study include the needfor:
Improved rail and bus connections from New Jersey and Westchester to northernManhattan;
More flexible, frequent bus loops on both the Upper West Side and Far East Side; and
Improved east-west transportation, particularly along such major cross-town arteries as34th Street, 59th Street and 125th Street.

20
METHODOLOGY APPENDIX
I. Transportation Benefits
UTRC estimated transportation benefits for the seven projects discussed in the text. For each project,UTRC identified all benefits associated with each project and estimated the scale of the benefits basedmainly on four components, including changes in travel time; changes in waiting times and walking dis-tances to/from the station; changes in the number of transfers a passenger must make; and changes in con-gestion and overcrowding (including on other lines). UTRC also calculated the annual operating and main-tenance costs as well as fare box revenues for each project (see Table A-1). It is important to reiterate thatthese benefits were calculated for each individual project and not for any particular grouping of projects.Certain groupings of projects would generate a different stream of benefits, as riders would be able to con-nect and transport themselves along different paths if projects were built concurrently.
UTRC relied on published ridership forecasts from the Metropolitan Transportation Authority, New JerseyTransit, the Port Authority of New York and New Jersey and others to estimate the number of passengerswho would benefit each day. Passengers who would benefit directly and indirectly from each project werefurther categorized according to whether they would benefit at all times or only during peak hours.
The factors were then converted to annual economic benefits. Using federally established guidelines(adjusted for New York City wages and income) to convert the time savings to dollars, multipliers wereestablished at $24 per hour in-vehicle and $32 per hour out-vehicle. Finally, for reduced overcrowding, theresearchers assumed 5 minutes of productive work time savings.
Additional internal and external benefits were identified by the team for certain projects. For instance,while the proposed extension of the No. 7 Subway would benefit more than 66,000 daily riders throughreduced travel and wait times, the Farley/Penn project would reduce platform access time for more than78,000 passengers. In other projects, such as Access to the Region’s Core, more people would be likely toshift from cars to rail due to better service.
To better understand UTRC’s analysis, it may be useful to look at an example. The Lower Manhattan Hubgroups the creation of the permanent PATH terminal at the World Trade Center site, the reworking of theFulton subway station, and a pedestrian concourse between the Fulton Station and PATH terminal into one.
(in millions)
Annual Operating and Maintanence
CostsAnnual Fare
Box Revenues2nd Ave. Subway $348.6 $319.1East Side Access $546.5 $174.0LM Hub (PATH + Fulton T.C.) $76.7 $99.3Access to the Region's Core $88.5 $212.1No. 7 Extension $59.0 $35.9Farley/Penn $294.9 $0.0PATH to EWR $87.2 $7.5
Source: UTRC
Table A-1. Annual Costs and Revenues
21
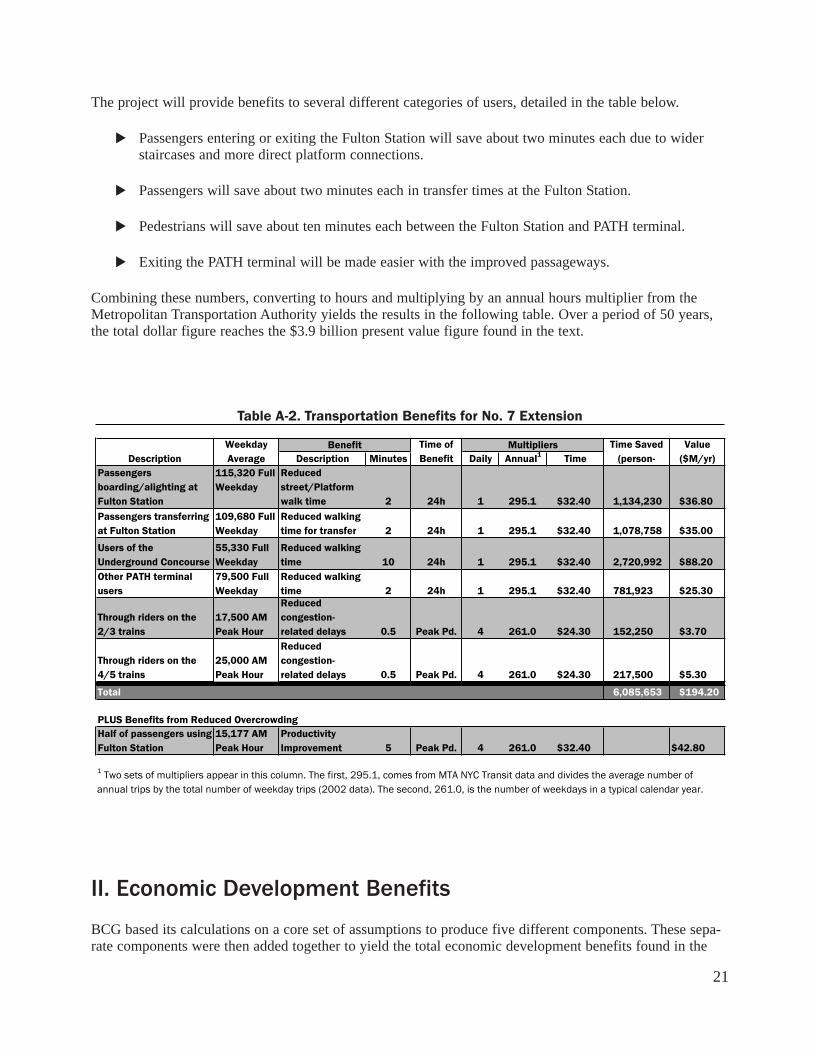
The project will provide benefits to several different categories of users, detailed in the table below.
Passengers entering or exiting the Fulton Station will save about two minutes each due to widerstaircases and more direct platform connections.
Passengers will save about two minutes each in transfer times at the Fulton Station.
Pedestrians will save about ten minutes each between the Fulton Station and PATH terminal.
Exiting the PATH terminal will be made easier with the improved passageways.
Combining these numbers, converting to hours and multiplying by an annual hours multiplier from theMetropolitan Transportation Authority yields the results in the following table. Over a period of 50 years,the total dollar figure reaches the $3.9 billion present value figure found in the text.
II. Economic Development Benefits
BCG based its calculations on a core set of assumptions to produce five different components. These sepa-rate components were then added together to yield the total economic development benefits found in the
Description Description Minutes Daily Annual1 TimePassengers boarding/alighting at Fulton Station
115,320 Full Weekday
Reduced street/Platform walk time 2 24h 1 295.1 $32.40 1,134,230 $36.80
Passengers transferring at Fulton Station
109,680 Full Weekday
Reduced walking time for transfer 2 24h 1 295.1 $32.40 1,078,758 $35.00
Users of the Underground Concourse
55,330 Full Weekday
Reduced walking time 10 24h 1 295.1 $32.40 2,720,992 $88.20
Other PATH terminal users
79,500 Full Weekday
Reduced walking time 2 24h 1 295.1 $32.40 781,923 $25.30
Through riders on the 2/3 trains
17,500 AM Peak Hour
Reduced congestion-related delays 0.5 Peak Pd. 4 261.0 $24.30 152,250 $3.70
Through riders on the 4/5 trains
25,000 AM Peak Hour
Reduced congestion-related delays 0.5 Peak Pd. 4 261.0 $24.30 217,500 $5.30
Total 6,085,653 $194.20
Half of passengers using Fulton Station
15,177 AM Peak Hour
Productivity Improvement 5 Peak Pd. 4 261.0 $32.40 $42.80
1 Two sets of multipliers appear in this column. The first, 295.1, comes from MTA NYC Transit data and divides the average number of annual trips by the total number of weekday trips (2002 data). The second, 261.0, is the number of weekdays in a typical calendar year.
Time Saved (person-
Value ($M/yr)
Weekday Average
PLUS Benefits from Reduced Overcrowding
Benefit MultipliersTime of Benefit
Table A-2. Transportation Benefits for No. 7 Extension
22
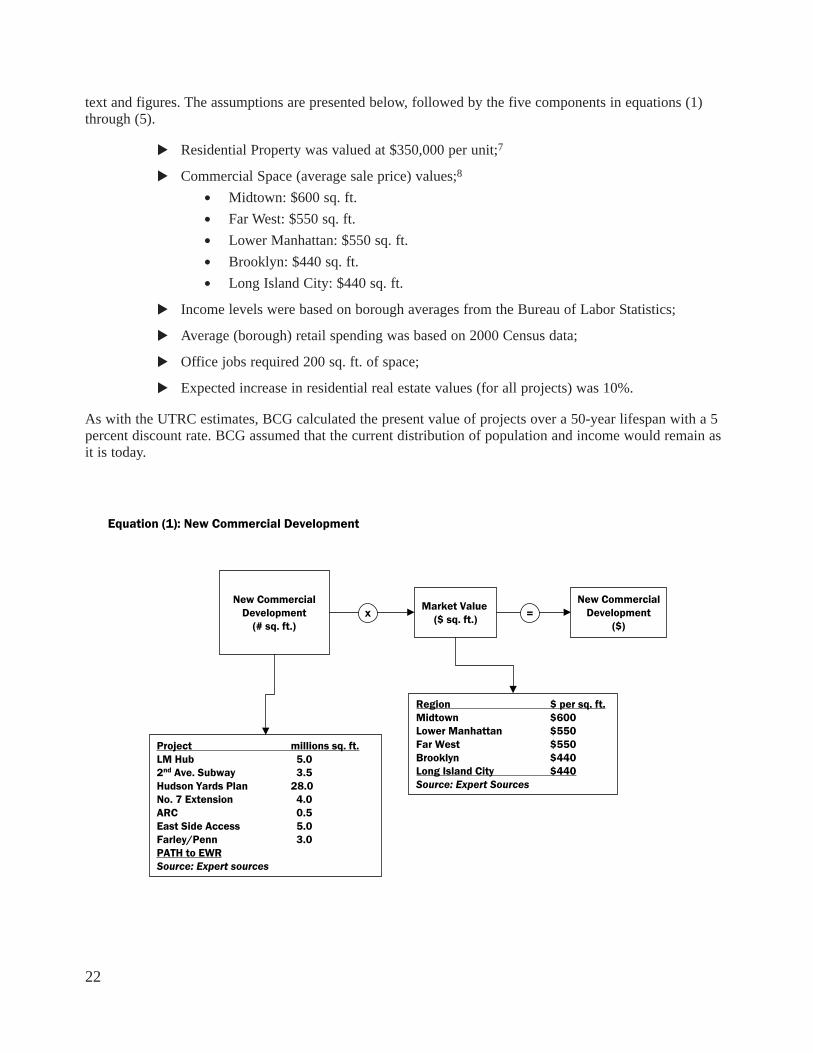
text and figures. The assumptions are presented below, followed by the five components in equations (1)through (5).
Residential Property was valued at $350,000 per unit;7
Commercial Space (average sale price) values;8
Midtown: $600 sq. ft.
Far West: $550 sq. ft.
Lower Manhattan: $550 sq. ft.
Brooklyn: $440 sq. ft.
Long Island City: $440 sq. ft.
Income levels were based on borough averages from the Bureau of Labor Statistics;
Average (borough) retail spending was based on 2000 Census data;
Office jobs required 200 sq. ft. of space;
Expected increase in residential real estate values (for all projects) was 10%.
As with the UTRC estimates, BCG calculated the present value of projects over a 50-year lifespan with a 5percent discount rate. BCG assumed that the current distribution of population and income would remain asit is today.
Equation (1): New Commercial Development
New CommercialDevelopment
(# sq. ft.)
Market Value ($ sq. ft.)
New CommercialDevelopment
($)
Project millions sq. ft.LM Hub 5.02nd Ave. Subway 3.5Hudson Yards Plan 28.0No. 7 Extension 4.0ARC 0.5East Side Access 5.0Farley/Penn 3.0PATH to EWRSource: Expert sources
Region $ per sq. ft.Midtown $600Lower Manhattan $550Far West $550Brooklyn $440Long Island City $440Source: Expert Sources
x =

23
Equation (2): New Residential Development
New Residential Development
($)
Dual earneradjustment
Adjust for Household with two incomes: 27.1%2000 Census data
Douglas Elliman 2003 report
(1 bedroom avg. price: $350,000)
x x x/ =
Midtown 74%Lower Manhattan 74%Far West 74%Brooklyn 89%Long Island City 79%Source: Census data
Source: Expert
testimony
Avg. Market price
% Job HolderLivingin NYC
New CommercialDevelopment
(# sq. ft.)200 SF/Job
Equation (3): Increase in Existing Residential Property Values
Increase in Existing Property Value
($)
ExistingUnits Affected
Avg. Market price
% Increasein value
(10% or 20%)
Number units in zip code (Source:
Census Data)
x% of units affected by project
(typically 50% or 100%)
Douglas Elliman 2003 report
(1 bedroom avg. price: $350,000)
=xx
Source: Broker estimates

24
Equation (5): Increase in Sales and Tourism
Average Taxable Income
Increase in Sales
($)Retail Spending: 35% of incomeBased on US average
% of IncomeSpend on Retail
Increase inTourism
Spending ($)
New CommercialDevelopment
(# sq. ft.)200 SF/Job
Path to EWR and JFK Super Shuttle: $7 m.
+ =
xx/
Salary ($1000s)Midtown 77Downtown 77Far West Midtown 77Brooklyn 31Queens 35Source: Bureau of Labor Statistics
Equation (4): Increase in Jobs and Income
200 SF/JobAverage TaxableIncome
% Job HolderLivingin NYC
New CommercialDevelopment
(# sq. ft.)
Increase in jobs and income
($)
/ =xx
Salary ($1000s)Midtown 77Downtown 77Far West Midtown 77Brooklyn 31Queens 35Source: Bureau of Labor Statistics
Midtown 74%Lower Manhattan 74%Far West 74%Brooklyn 89%Long Island City 79%Source: Census data
25
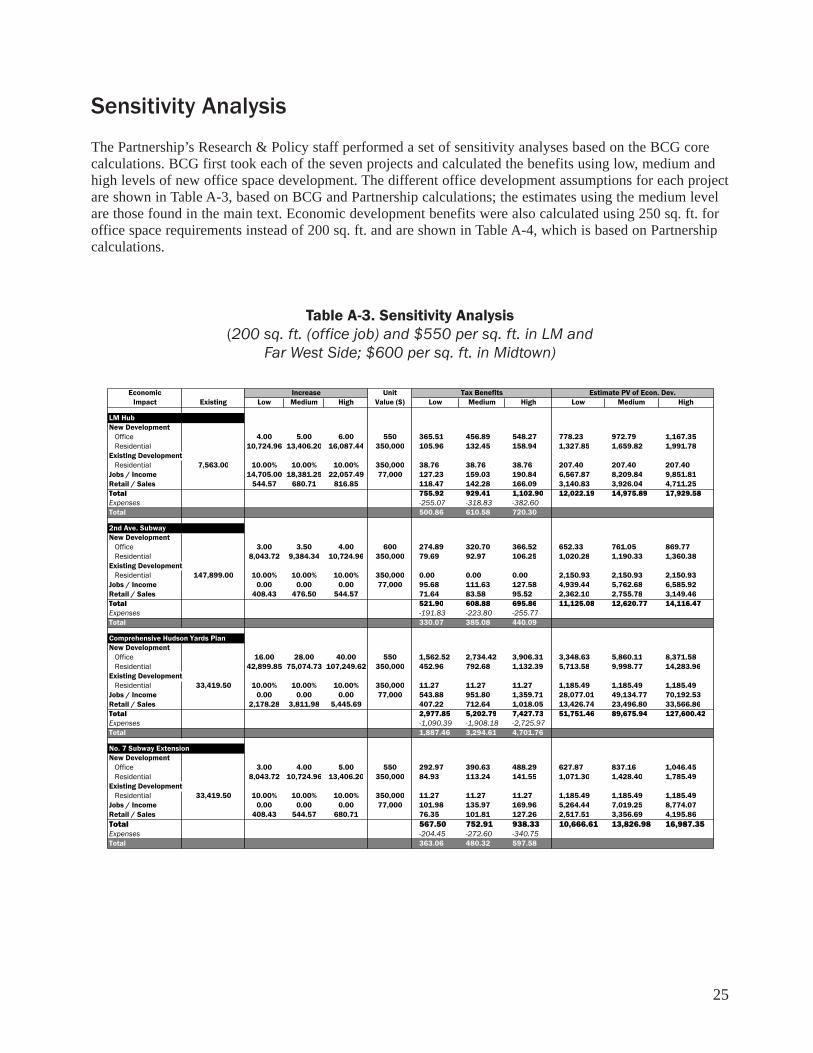
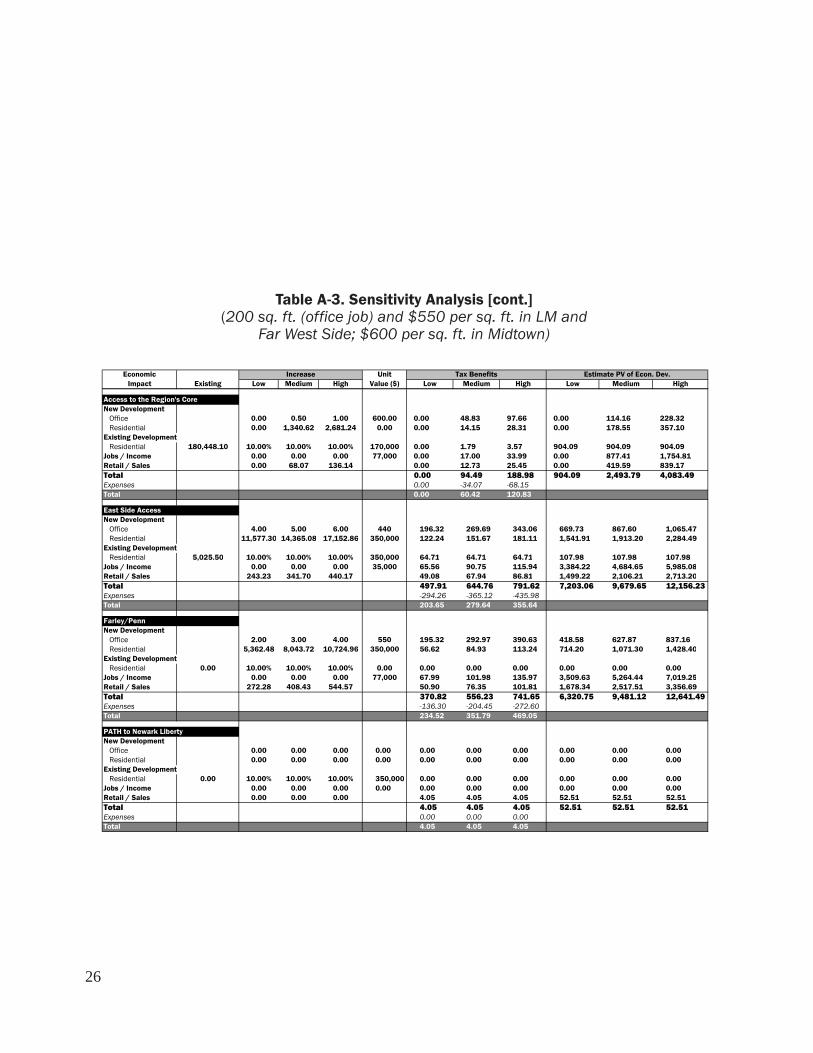
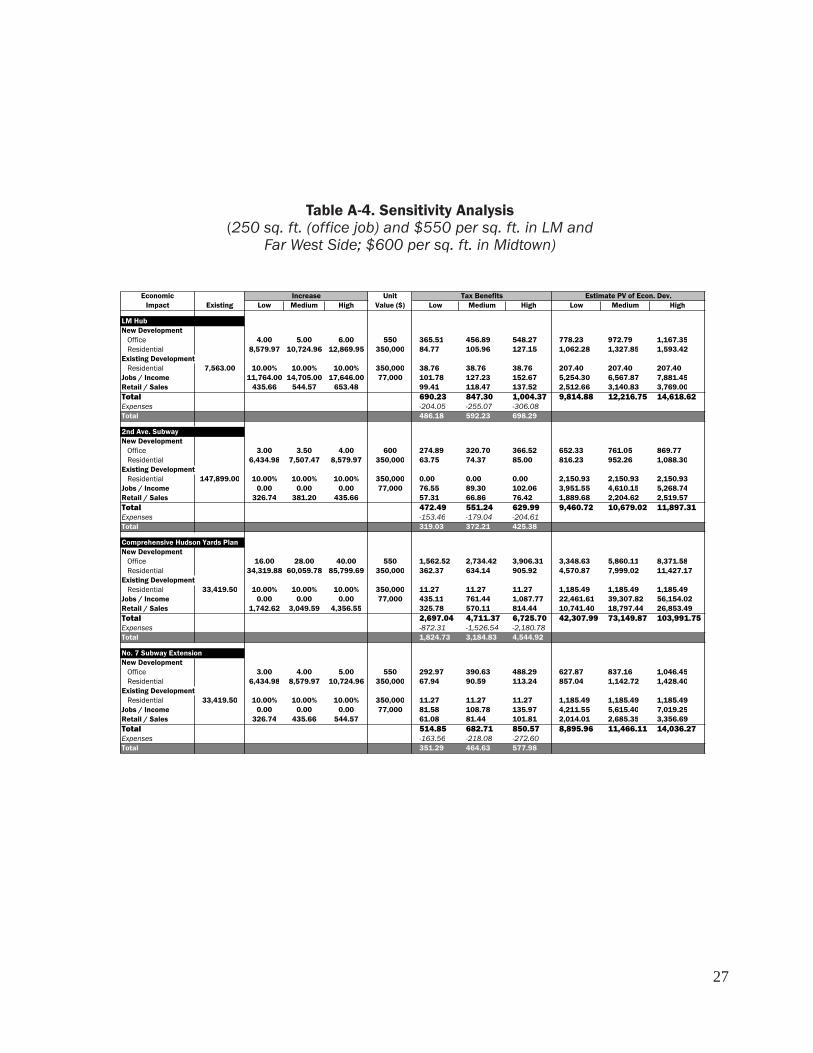
Sensitivity Analysis
The Partnership’s Research & Policy staff performed a set of sensitivity analyses based on the BCG corecalculations. BCG first took each of the seven projects and calculated the benefits using low, medium andhigh levels of new office space development. The different office development assumptions for each projectare shown in Table A-3, based on BCG and Partnership calculations; the estimates using the medium levelare those found in the main text. Economic development benefits were also calculated using 250 sq. ft. foroffice space requirements instead of 200 sq. ft. and are shown in Table A-4, which is based on Partnershipcalculations.
Table A-3. Sensitivity Analysis
(200 sq. ft. (office job) and $550 per sq. ft. in LM and
Far West Side; $600 per sq. ft. in Midtown)
Economic UnitImpact Existing Low Medium High Value ($) Low Medium High Low Medium High
New Development Office 4.00 5.00 6.00 550 365.51 456.89 548.27 778.23 972.79 1,167.35 Residential 10,724.96 13,406.20 16,087.44 350,000 105.96 132.45 158.94 1,327.85 1,659.82 1,991.78Existing Development Residential 7,563.00 10.00% 10.00% 10.00% 350,000 38.76 38.76 38.76 207.40 207.40 207.40Jobs / Income 14,705.00 18,381.25 22,057.49 77,000 127.23 159.03 190.84 6,567.87 8,209.84 9,851.81Retail / Sales 544.57 680.71 816.85 118.47 142.28 166.09 3,140.83 3,926.04 4,711.25Total 755.92 929.41 1,102.90 12,022.19 14,975.89 17,929.58Expenses -255.07 -318.83 -382.60
Total 500.86 610.58 720.30
New Development Office 3.00 3.50 4.00 600 274.89 320.70 366.52 652.33 761.05 869.77 Residential 8,043.72 9,384.34 10,724.96 350,000 79.69 92.97 106.25 1,020.28 1,190.33 1,360.38Existing Development Residential 147,899.00 10.00% 10.00% 10.00% 350,000 0.00 0.00 0.00 2,150.93 2,150.93 2,150.93Jobs / Income 0.00 0.00 0.00 77,000 95.68 111.63 127.58 4,939.44 5,762.68 6,585.92Retail / Sales 408.43 476.50 544.57 71.64 83.58 95.52 2,362.10 2,755.78 3,149.46Total 521.90 608.88 695.86 11,125.08 12,620.77 14,116.47Expenses -191.83 -223.80 -255.77
Total 330.07 385.08 440.09
New Development Office 16.00 28.00 40.00 550 1,562.52 2,734.42 3,906.31 3,348.63 5,860.11 8,371.58 Residential 42,899.85 75,074.73 107,249.62 350,000 452.96 792.68 1,132.39 5,713.58 9,998.77 14,283.96Existing Development Residential 33,419.50 10.00% 10.00% 10.00% 350,000 11.27 11.27 11.27 1,185.49 1,185.49 1,185.49Jobs / Income 0.00 0.00 0.00 77,000 543.88 951.80 1,359.71 28,077.01 49,134.77 70,192.53Retail / Sales 2,178.28 3,811.98 5,445.69 407.22 712.64 1,018.05 13,426.74 23,496.80 33,566.86Total 2,977.85 5,202.79 7,427.73 51,751.46 89,675.94 127,600.42Expenses -1,090.39 -1,908.18 -2,725.97
Total 1,887.46 3,294.61 4,701.76
New Development Office 3.00 4.00 5.00 550 292.97 390.63 488.29 627.87 837.16 1,046.45 Residential 8,043.72 10,724.96 13,406.20 350,000 84.93 113.24 141.55 1,071.30 1,428.40 1,785.49Existing Development Residential 33,419.50 10.00% 10.00% 10.00% 350,000 11.27 11.27 11.27 1,185.49 1,185.49 1,185.49Jobs / Income 0.00 0.00 0.00 77,000 101.98 135.97 169.96 5,264.44 7,019.25 8,774.07Retail / Sales 408.43 544.57 680.71 76.35 101.81 127.26 2,517.51 3,356.69 4,195.86Total 567.50 752.91 938.33 10,666.61 13,826.98 16,987.35Expenses -204.45 -272.60 -340.75
Total 363.06 480.32 597.58
2nd Ave. Subway
LM Hub
Increase Tax Benefits Estimate PV of Econ. Dev.
Comprehensive Hudson Yards Plan
No. 7 Subway Extension
26
Economic UnitImpact Existing Low Medium High Value ($) Low Medium High Low Medium High
Increase Tax Benefits Estimate PV of Econ. Dev.
New Development Office 0.00 0.50 1.00 600.00 0.00 48.83 97.66 0.00 114.16 228.32 Residential 0.00 1,340.62 2,681.24 0.00 0.00 14.15 28.31 0.00 178.55 357.10Existing Development Residential 180,448.10 10.00% 10.00% 10.00% 170,000 0.00 1.79 3.57 904.09 904.09 904.09Jobs / Income 0.00 0.00 0.00 77,000 0.00 17.00 33.99 0.00 877.41 1,754.81Retail / Sales 0.00 68.07 136.14 0.00 12.73 25.45 0.00 419.59 839.17Total 0.00 94.49 188.98 904.09 2,493.79 4,083.49Expenses 0.00 -34.07 -68.15
Total 0.00 60.42 120.83
New Development Office 4.00 5.00 6.00 440 196.32 269.69 343.06 669.73 867.60 1,065.47 Residential 11,577.30 14,365.08 17,152.86 350,000 122.24 151.67 181.11 1,541.91 1,913.20 2,284.49Existing Development Residential 5,025.50 10.00% 10.00% 10.00% 350,000 64.71 64.71 64.71 107.98 107.98 107.98Jobs / Income 0.00 0.00 0.00 35,000 65.56 90.75 115.94 3,384.22 4,684.65 5,985.08Retail / Sales 243.23 341.70 440.17 49.08 67.94 86.81 1,499.22 2,106.21 2,713.20Total 497.91 644.76 791.62 7,203.06 9,679.65 12,156.23Expenses -294.26 -365.12 -435.98
Total 203.65 279.64 355.64
New Development Office 2.00 3.00 4.00 550 195.32 292.97 390.63 418.58 627.87 837.16 Residential 5,362.48 8,043.72 10,724.96 350,000 56.62 84.93 113.24 714.20 1,071.30 1,428.40Existing Development Residential 0.00 10.00% 10.00% 10.00% 0.00 0.00 0.00 0.00 0.00 0.00 0.00Jobs / Income 0.00 0.00 0.00 77,000 67.99 101.98 135.97 3,509.63 5,264.44 7,019.25Retail / Sales 272.28 408.43 544.57 50.90 76.35 101.81 1,678.34 2,517.51 3,356.69Total 370.82 556.23 741.65 6,320.75 9,481.12 12,641.49Expenses -136.30 -204.45 -272.60
Total 234.52 351.79 469.05
New Development Office 0.00 0.00 0.00 0.00 0.00 0.00 0.00 0.00 0.00 0.00 Residential 0.00 0.00 0.00 0.00 0.00 0.00 0.00 0.00 0.00 0.00Existing Development Residential 0.00 10.00% 10.00% 10.00% 350,000 0.00 0.00 0.00 0.00 0.00 0.00Jobs / Income 0.00 0.00 0.00 0.00 0.00 0.00 0.00 0.00 0.00 0.00Retail / Sales 0.00 0.00 0.00 4.05 4.05 4.05 52.51 52.51 52.51Total 4.05 4.05 4.05 52.51 52.51 52.51Expenses 0.00 0.00 0.00
Total 4.05 4.05 4.05
Access to the Region's Core
PATH to Newark Liberty
East Side Access
Farley/Penn
Table A-3. Sensitivity Analysis [cont.](200 sq. ft. (office job) and $550 per sq. ft. in LM and
Far West Side; $600 per sq. ft. in Midtown)
27
Table A-4. Sensitivity Analysis(250 sq. ft. (office job) and $550 per sq. ft. in LM and
Far West Side; $600 per sq. ft. in Midtown)
Economic UnitImpact Existing Low Medium High Value ($) Low Medium High Low Medium High
New Development Office 4.00 5.00 6.00 550 365.51 456.89 548.27 778.23 972.79 1,167.35 Residential 8,579.97 10,724.96 12,869.95 350,000 84.77 105.96 127.15 1,062.28 1,327.85 1,593.42Existing Development Residential 7,563.00 10.00% 10.00% 10.00% 350,000 38.76 38.76 38.76 207.40 207.40 207.40Jobs / Income 11,764.00 14,705.00 17,646.00 77,000 101.78 127.23 152.67 5,254.30 6,567.87 7,881.45Retail / Sales 435.66 544.57 653.48 99.41 118.47 137.52 2,512.66 3,140.83 3,769.00Total 690.23 847.30 1,004.37 9,814.88 12,216.75 14,618.62Expenses -204.05 -255.07 -306.08
Total 486.18 592.23 698.29
New Development Office 3.00 3.50 4.00 600 274.89 320.70 366.52 652.33 761.05 869.77 Residential 6,434.98 7,507.47 8,579.97 350,000 63.75 74.37 85.00 816.23 952.26 1,088.30Existing Development Residential 147,899.00 10.00% 10.00% 10.00% 350,000 0.00 0.00 0.00 2,150.93 2,150.93 2,150.93Jobs / Income 0.00 0.00 0.00 77,000 76.55 89.30 102.06 3,951.55 4,610.15 5,268.74Retail / Sales 326.74 381.20 435.66 57.31 66.86 76.42 1,889.68 2,204.62 2,519.57Total 472.49 551.24 629.99 9,460.72 10,679.02 11,897.31Expenses -153.46 -179.04 -204.61
Total 319.03 372.21 425.38
New Development Office 16.00 28.00 40.00 550 1,562.52 2,734.42 3,906.31 3,348.63 5,860.11 8,371.58 Residential 34,319.88 60,059.78 85,799.69 350,000 362.37 634.14 905.92 4,570.87 7,999.02 11,427.17Existing Development Residential 33,419.50 10.00% 10.00% 10.00% 350,000 11.27 11.27 11.27 1,185.49 1,185.49 1,185.49Jobs / Income 0.00 0.00 0.00 77,000 435.11 761.44 1,087.77 22,461.61 39,307.82 56,154.02Retail / Sales 1,742.62 3,049.59 4,356.55 325.78 570.11 814.44 10,741.40 18,797.44 26,853.49Total 2,697.04 4,711.37 6,725.70 42,307.99 73,149.87 103,991.75Expenses -872.31 -1,526.54 -2,180.78
Total 1,824.73 3,184.83 4,544.92
New Development Office 3.00 4.00 5.00 550 292.97 390.63 488.29 627.87 837.16 1,046.45 Residential 6,434.98 8,579.97 10,724.96 350,000 67.94 90.59 113.24 857.04 1,142.72 1,428.40Existing Development Residential 33,419.50 10.00% 10.00% 10.00% 350,000 11.27 11.27 11.27 1,185.49 1,185.49 1,185.49Jobs / Income 0.00 0.00 0.00 77,000 81.58 108.78 135.97 4,211.55 5,615.40 7,019.25Retail / Sales 326.74 435.66 544.57 61.08 81.44 101.81 2,014.01 2,685.35 3,356.69Total 514.85 682.71 850.57 8,895.96 11,466.11 14,036.27Expenses -163.56 -218.08 -272.60
Total 351.29 464.63 577.98
LM Hub
2nd Ave. Subway
Comprehensive Hudson Yards Plan
No. 7 Subway Extension
Increase Tax Benefits Estimate PV of Econ. Dev.

28
Table A-4. Sensitivity Analysis [cont.](250 sq. ft. (office job) and $550 per sq. ft. in LM and
Far West Side; $600 per sq. ft. in Midtown)
Economic UnitImpact Existing Low Medium High Value ($) Low Medium High Low Medium High
Increase Tax Benefits Estimate PV of Econ. Dev.
New Development Office 0.00 0.50 1.00 600.00 0.00 48.83 97.66 0.00 114.16 228.32 Residential 0.00 1,072.50 2,144.99 0.00 0.00 11.32 22.65 0.00 142.84 285.68Existing Development Residential 180,448.10 10.00% 10.00% 10.00% 170,000 0.00 1.43 2.86 904.09 904.09 904.09Jobs / Income 0.00 0.00 0.00 77,000 0.00 13.60 27.19 0.00 701.93 1,403.85Retail / Sales 0.00 54.46 108.91 0.00 10.18 20.36 0.00 335.67 671.34Total 0.00 85.36 170.72 904.09 2,198.69 3,493.28Expenses 0.00 -27.26 -54.52
Total 0.00 58.10 116.20
New Development Office 4.00 5.00 6.00 440 196.32 269.69 343.06 669.73 867.60 1,065.47 Residential 9,261.84 11,492.06 13,722.29 350,000 97.79 121.34 144.89 1,233.53 1,530.56 1,827.59Existing Development Residential 5,025.50 10.00% 10.00% 10.00% 350,000 64.71 64.71 64.71 107.98 107.98 107.98Jobs / Income 0.00 0.00 0.00 35,000 52.44 72.60 92.75 2,707.37 3,747.72 4,788.07Retail / Sales 194.58 273.36 352.14 39.27 54.36 69.44 1,199.38 1,684.97 2,170.56Total 450.53 582.69 714.85 5,917.99 7,938.84 9,959.68Expenses -235.41 -292.09 -348.78
Total 215.12 290.59 366.07
New Development Office 2.00 3.00 4.00 550 195.32 292.97 390.63 418.58 627.87 837.16 Residential 4,289.98 6,434.98 8,579.97 350,000 45.30 67.94 90.59 571.36 857.04 1,142.72Existing Development Residential 0.00 10.00% 10.00% 10.00% 0.00 0.00 0.00 0.00 0.00 0.00 0.00Jobs / Income 0.00 0.00 0.00 77,000 54.39 81.58 108.78 2,807.70 4,211.55 5,615.40Retail / Sales 217.83 326.74 435.66 40.72 61.08 81.44 1,342.67 2,014.01 2,685.35Total 335.72 503.58 671.44 5,140.31 7,710.47 10,280.63Expenses -109.04 -163.56 -218.08
Total 226.68 340.02 453.37
New Development Office 0.00 0.00 0.00 0.00 0.00 0.00 0.00 0.00 0.00 0.00 Residential 0.00 0.00 0.00 0.00 0.00 0.00 0.00 0.00 0.00 0.00Existing Development Residential 0.00 10.00% 10.00% 10.00% 350,000 0.00 0.00 0.00 0.00 0.00 0.00Jobs / Income 0.00 0.00 0.00 0.00 0.00 0.00 0.00 0.00 0.00 0.00Retail / Sales 0.00 0.00 0.00 4.05 4.05 4.05 52.51 52.51 52.51Total 4.05 4.05 4.05 52.51 52.51 52.51Expenses 0.00 0.00 0.00
Total 4.05 4.05 4.05
Access to the Region's Core
PATH to Newark Liberty
East Side Access
Farley/Penn
© 2003 Partnership for New York City.
Cover image: © 2003 Arthur S. Aubry and Photodisc.
Inside images: pg 8 - BCG; pg 9 - Metropolitan Transportation Authority; pg 10 - Metropolitan Transportation Authority; pg 11 - Metropolitan Transportation Authority;pg 12 - New Jersey Transit; pg 13 - Metropolitan Transportation Authority; pg 14 - Center of Contemporary Architecture; pg 15 - “Lower Manhattan TransportationStrategies.”

One Battery Park Plaza New York, NY 10004-1479 T 212 493 7400 F 212 344 3344 www.partnershipfornyc.org