Short-Term Prediction of Demand for Ride-Hailing Services ...

Decarbonization, Transportation and the Changing Oil Market: The Role of Politics and Policies in the Peak Demand Debate
Robert Johnston
CEO, Director, Global Energy & Natural Resources
IEEJ:July 2018 © IEEJ2018
2
Table of contents
Exploring key drivers of changes in the oil/transportation system: are these structural changes to global oil demand?
• Role of public policy
• Headwinds for policymakers
• What other factors should be explored?
IEEJ:July 2018 © IEEJ2018

Role of public policy: ambitious or unrealistic?
IEEJ:July 2018 © IEEJ2018
Confidential & Proprietary © 2017 Eurasia Group | 4
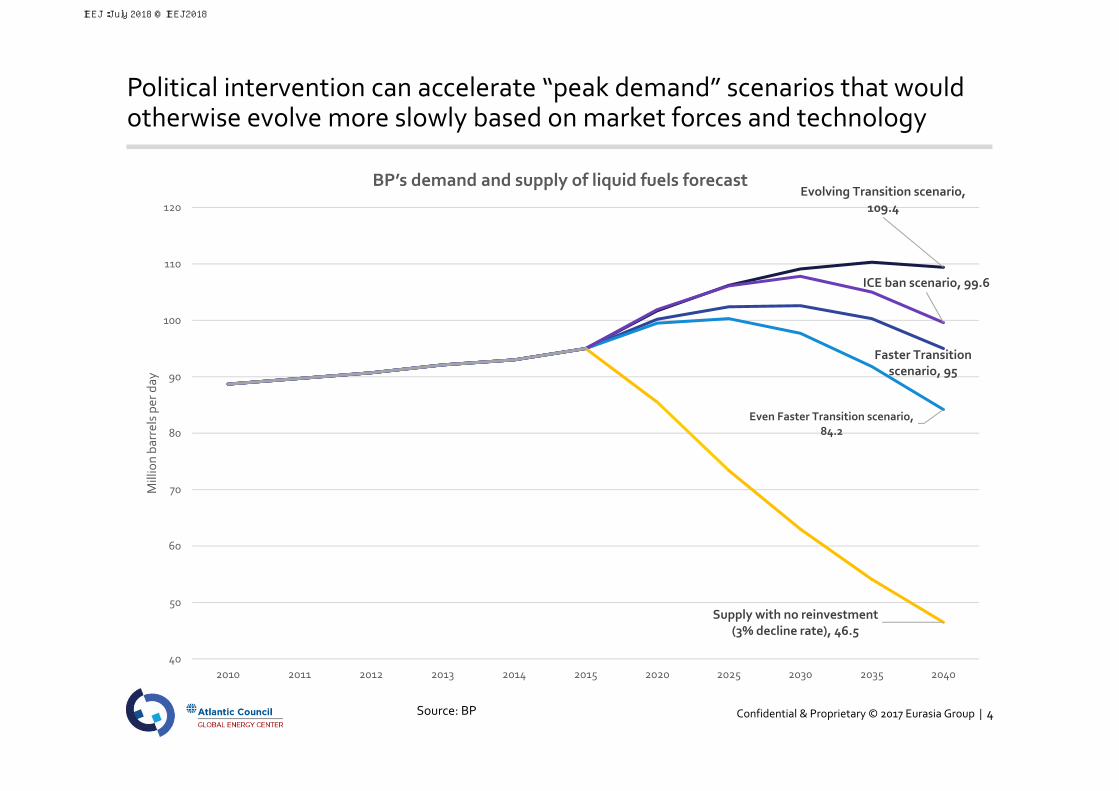
Political intervention can accelerate “peak demand” scenarios that would otherwise evolve more slowly based on market forces and technology
Source: BP
Evolving Transition scenario, 109.4
Faster Transition scenario, 95
Even Faster Transition scenario, 84.2
ICE ban scenario, 99.6
Supply with no reinvestment (3% decline rate), 46.5
40
50
60
70
80
90
100
110
120
2010 2011 2012 2013 2014 2015 2020 2025 2030 2035 2040
Million ba
rrels pe
r day
BP’s demand and supply of liquid fuels forecast
IEEJ:July 2018 © IEEJ2018

Confidential & Proprietary © 2017 Eurasia Group | 5
Ambitious transportation sector polices could have important consequences for oil demand destruction
Source: BPNote: Non‐transportation includes industry, non‐combusted, buildings, and power. Transportation includes non‐road (aviation, marine, rail), trucks (most SUVs in North America), cars (includes 2‐and‐3‐wheelers)
2018 Eurasia Group
0
20
40
60
80
100
120
2000 2005 2010 2015 2020 2025 2030 2035 2040
Million ba
rrels pe
r day
Liquids demand forecast
Non‐transportation Transportation
IEEJ:July 2018 © IEEJ2018

Confidential & Proprietary © 2017 Eurasia Group | 6
Clean transportation policies likely to be more effective when accounting for and influenced by a “national interest approach”
Stronger political imperative on climate change
Rising air‐quality problems from diesel
Industrial policy to motivate advanced domestic manufacturing of
Energy security
2018 Eurasia Group
Major drivers of decarbonization in the transportation sector include:
IEEJ:July 2018 © IEEJ2018
Confidential & Proprietary © 2017 Eurasia Group | 7
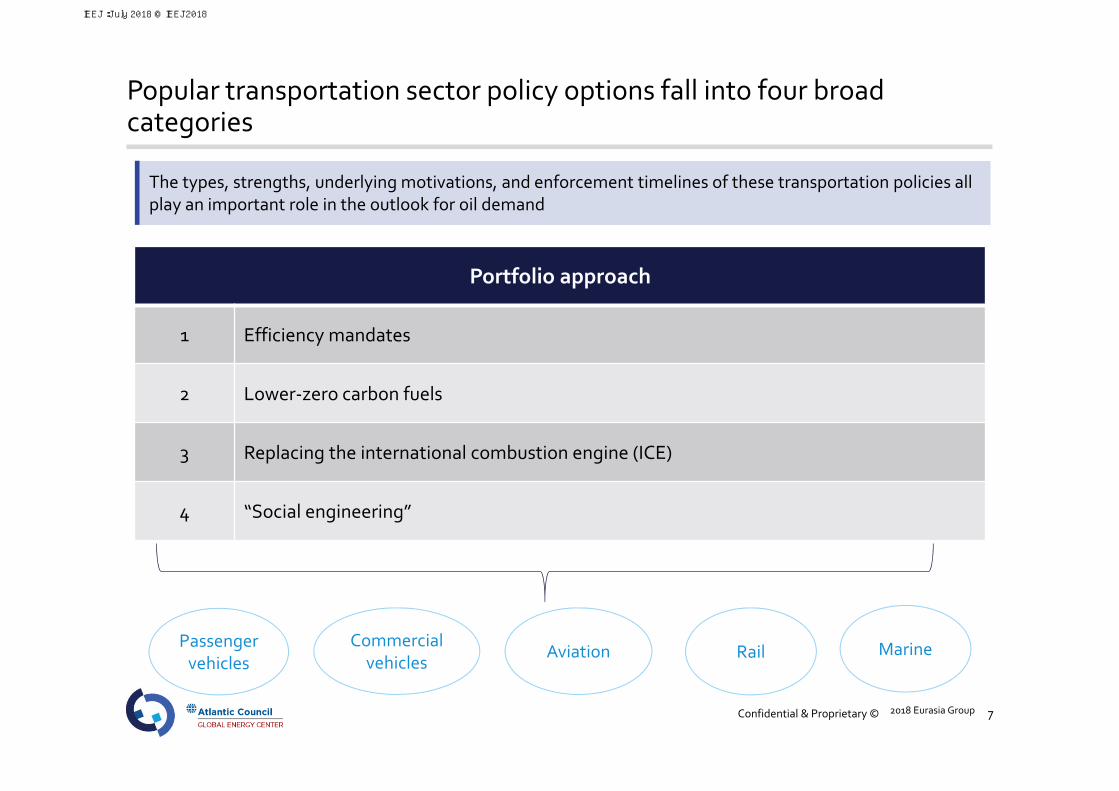
Popular transportation sector policy options fall into four broad categories
2018 Eurasia Group
Portfolio approach
1 Efficiency mandates
2 Lower‐zero carbon fuels
3 Replacing the international combustion engine (ICE)
4 “Social engineering”
The types, strengths, underlying motivations, and enforcement timelines of these transportation policies all play an important role in the outlook for oil demand
Passenger vehicles
Commercial vehicles
Aviation Rail Marine
IEEJ:July 2018 © IEEJ2018

Confidential & Proprietary © 2017 Eurasia Group | 8
Policies that promote electric vehicles (EVs) are getting the most attention
Source: IEA, Clean Technica, FleetCarma, Quartz 2018 Eurasia Group
0
50,000
100,000
150,000
200,000
250,000
300,000
350,000
400,000
2010 2011 2012 2013 2014 2015 2016
Number of new EV registrations
IEEJ:July 2018 © IEEJ2018

Confidential & Proprietary © 2017 Eurasia Group | 9
Europe is pushing the envelope on electric and hybrid vehicles
0
10
20
30
40
50
60
1990 1991 1992 1993 1994 1995 1996 1997 1998 1999 2000 2001 2002 2003 2004 2005 2006 2007 2008 2009 2010 2011 2012 2013 2014 2015 2016 2017
%
Share of diesel in new passenger cars in Western Europe
Source: European Automobile Manufacturers Association (ACEA)2018 Eurasia Group
IEEJ:July 2018 © IEEJ2018
Confidential & Proprietary © 2017 Eurasia Group | 10
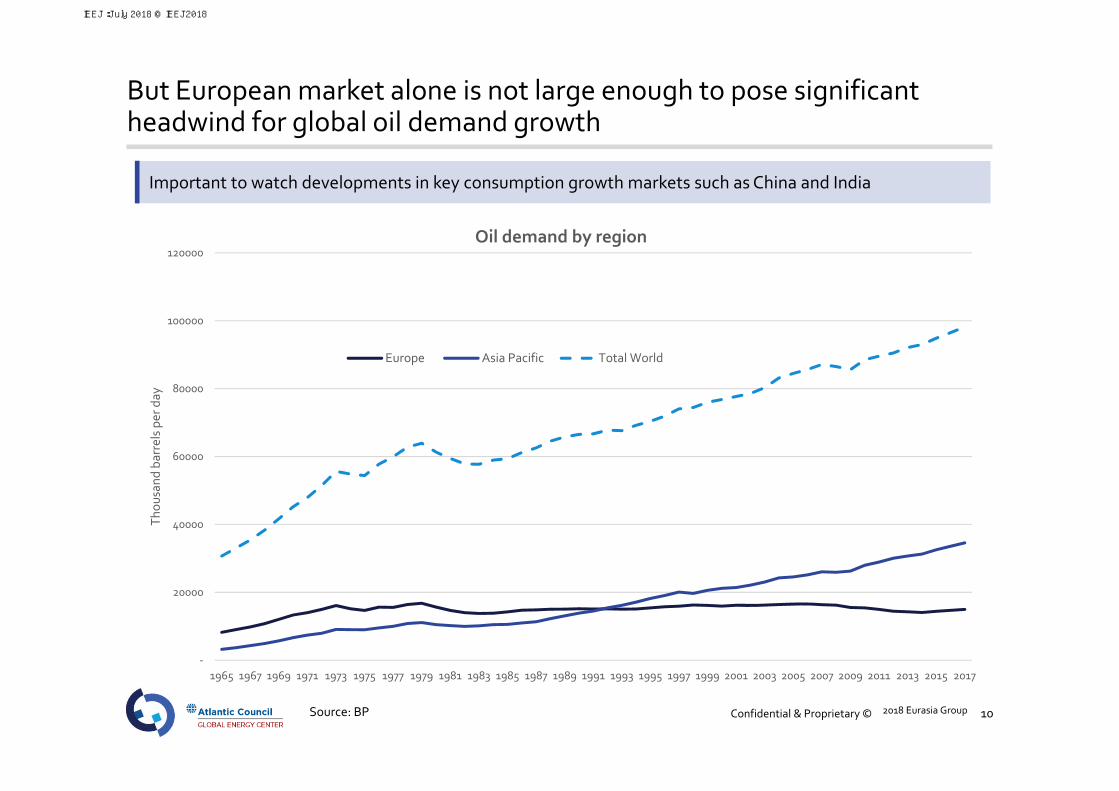
But European market alone is not large enough to pose significant headwind for global oil demand growth
Important to watch developments in key consumption growth markets such as China and India
2018 Eurasia Group
‐
20000
40000
60000
80000
100000
120000
1965 1967 1969 1971 1973 1975 1977 1979 1981 1983 1985 1987 1989 1991 1993 1995 1997 1999 2001 2003 2005 2007 2009 2011 2013 2015 2017
Thou
sand barrels per day
Oil demand by region
Europe Asia Pacific Total World
Source: BP
IEEJ:July 2018 © IEEJ2018

Confidential & Proprietary © 2017 Eurasia Group | 11
The Chinese government’s generous EV incentives have proven effective in driving sales—how much more upside is there?
Source: CEIA, hybrid cars.com, EAFO, Macquarie Research, Business Insider
2018 Eurasia Group
72%
33%
33%
108%
75%
0%
20%
40%
60%
80%
100%
120%
0.0%
0.5%
1.0%
1.5%
2.0%
2.5%
China Europe US Japan Canada
Share of nationa
l marke
t (% cha
nge ye
ar‐on‐ye
ar)
EV and PHEV sales in select markets in 2017
EV PHEV Total sales YoY
IEEJ:July 2018 © IEEJ2018

Confidential & Proprietary © 2017 Eurasia Group | 12
More attention needs to be paid to the broader transportation sector (trucks, marine, aviation, alternative fuels and smart cities), especially in Asia
China, Japan, and Korea are the world’s 1st, 4th, and 5th largest crude oil importers
“Made in China 2025” program
China‐ Bicycles, rail electrification
China Belt and Road Initiative‐ Super‐grid
Japanese zero‐emissions and hydrogen fuel cellprogram
Korean National Green Growth Strategy
Smart Cities for emerging Asia‐ India, ASEAN
Ride‐sharing and fleet utilization
Industrial policy and government coordination
Energy insecurity and import dependence
Air quality concerns and climate policy
IEEJ:July 2018 © IEEJ2018

Confidential & Proprietary © 2017 Eurasia Group | 13
The role of transportation is shifting owing to developments in “micro‐mobility”
Autonomous vehicles, ride‐sharing, and “micro‐mobility” developments continue to demonstrate technological progress and declining costs in addition to being the subject of rising government interest
The future of fleet ownership and the influence of market design on how consumers own, rent, or lease vehicles is also an important dynamic
0 0.2 0.4 0.6 0.8 1 1.2 1.4
ICE
EV
Ride‐hailing EV
Ride‐hailing autonomous vehicle
Light‐duty vehicle cost per mile (USD per mile)
2030 2017
Total miles (p.a.)
70,000
70,000
13,500
13,500
Source: Bain, World Economic ForumNote: Cost per mile based on compact ICE and compact EV in the US, the figures exclude upfront cost
IEEJ:July 2018 © IEEJ2018

Confidential & Proprietary © 2017 Eurasia Group | 14
All of these factors pose a threat to oil’s supreme role in transportation—key question is by how much and when?
Within the clean transportation and peak oil demand debate there is little consensus about the exact recipe of policy measures and implementation timeframes
There remains a significant level of uncertainty in the analysis and forecasting on this issue particularly outside of the electric passenger vehicle domain.
Decarbonization scenarios and transportation sector policies
Scenario Peak demand forecast
IEA’s Sustainable Development Scenario Around 2020
IEA’s Faster Transition ScenarioAround 2020 (and falls thereafter at a faster rate
than SDS)
IEEJ Peak Oil Demand Case Around 2030
Rocky Mountain Institute’s Reinventing Fire Scenario
China’s oil demand peaks by 2030
Exxon Mobil’s 2D Scenarios Doesn’t forecast exact peak date
Shell’s New Lens Scenarios Varies by scenario
BP’s Evolving Transition scenarioDemand for oil does not plateau and peak until the
end of the 2040‐outlook
IEEJ:July 2018 © IEEJ2018
Challenges for policy makers: are they a deal breaker?
IEEJ:July 2018 © IEEJ2018

Confidential & Proprietary © 2017 Eurasia Group | 16
Lawmakers face key risks and challenges that undermine the transportation decarbonization effort
Will governments be willing to put more political capital behind expensive initiatives that encourage EV sales or implement politically tricky ICE bans/limit sales of fossil‐fueled power vehicles? What about broader carbon policies like economy‐wide carbon taxes?
2018 Eurasia Group
Infrastructure constraints
Higher costs (esp. for EVs compared to ICEs or retrofitting to cleaner fuels for marine shipping)
Political constraints including elections and legal challenges
Questions about the regulation of emerging technologies
Resource availability and environmental concerns for critical minerals
Resistance from politically important groups such as domestic auto industry in India or agriculture/farm lobby in the United States
Overly ambitious EV targets
IEEJ:July 2018 © IEEJ2018

Confidential & Proprietary © 2017 Eurasia Group | 17
Do governments instead prefer a more cautious approach that would signal a less disruptive outlook for global oil demand?
In US, EVs remain very small share of total auto sales: At the federal level, Trump administration’s attempt to weaken fuel efficiency standards will deal a setback to EV uptake
In India, officials have walked back on ambitious EV target
2018 Eurasia Group
There is a risk that overly ambitious or unrealistic policies could have a “snap‐back” effect and unintentionally harm the development of a clean transportation sector
Passenger vehicles, 13%
Commercial vehicles, 3%
Three wheelers, 3%
Two wheelers, 81%
India’s domestic automobile market share (2017‐2018)
Source: US Energy Information Administration, Society of Indian Automobile Manufacturers
IEEJ:July 2018 © IEEJ2018

Conclusions and Discussion
IEEJ:July 2018 © IEEJ2018
Confidential & Proprietary © 2017 Eurasia Group | 19
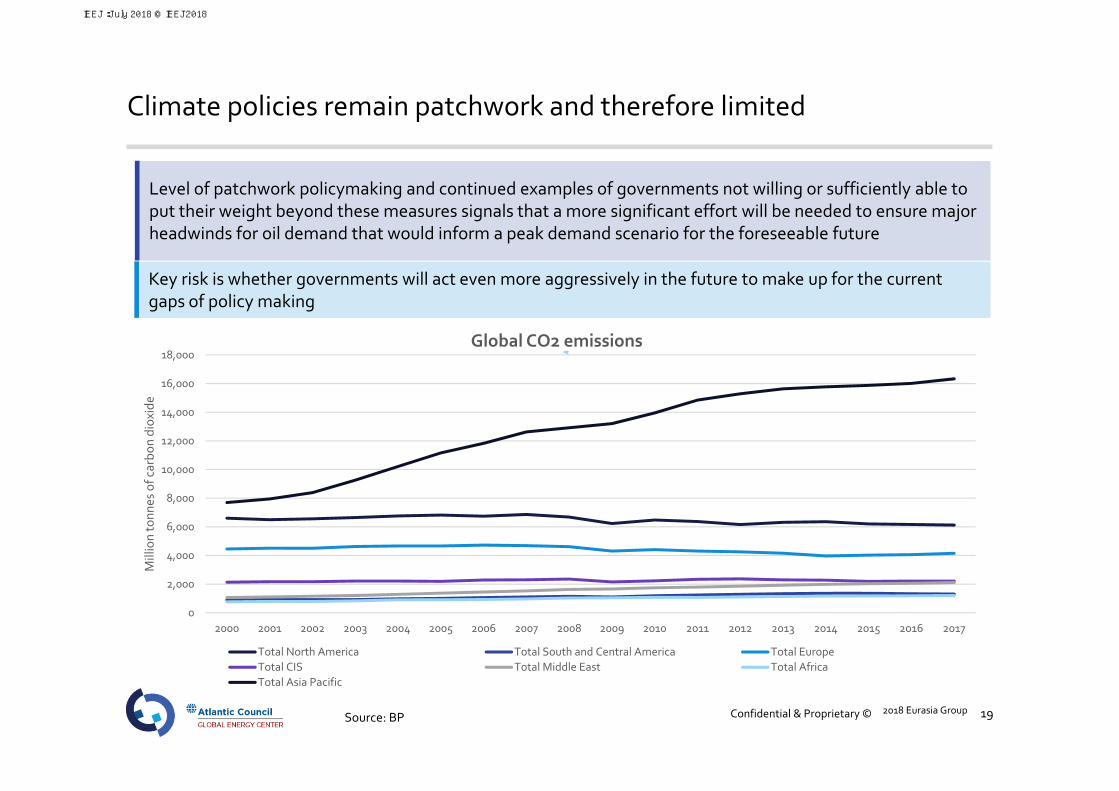
Climate policies remain patchwork and therefore limited
Level of patchwork policymaking and continued examples of governments not willing or sufficiently able to put their weight beyond these measures signals that a more significant effort will be needed to ensure major headwinds for oil demand that would inform a peak demand scenario for the foreseeable future
2018 Eurasia Group
Key risk is whether governments will act even more aggressively in the future to make up for the current gaps of policy making
0
2,000
4,000
6,000
8,000
10,000
12,000
14,000
16,000
18,000
2000 2001 2002 2003 2004 2005 2006 2007 2008 2009 2010 2011 2012 2013 2014 2015 2016 2017
Million tonn
es of c
arbo
n diox
ide
Global CO2 emissions
Total North America Total South and Central America Total EuropeTotal CIS Total Middle East Total AfricaTotal Asia Pacific
Source: BP
IEEJ:July 2018 © IEEJ2018

Confidential & Proprietary © 2017 Eurasia Group | 20
However, the peak demand debate is already complicating investment outlook for long‐cycle upstream projects
2018 Eurasia Group
IEA New Policies Scenario
IEA Sustainable Development Scenario
IEA Current Policies Scenario
OPEC Reference Case
IEEJ Reference Scenario
IEEJ Peak Oil Demand Scenario
0
20
40
60
80
100
120
140
Varying long‐term oil demand forecasts
Source: International Energy Agency, the Institute for Energy Economics, OPEC
IEEJ:July 2018 © IEEJ2018

Confidential & Proprietary © 2017 Eurasia Group | 21
In the short‐term, a shift to short‐cycle plays such as US shale is underway
Companies and investors are looking to minimize risk in this environment (US shale is the big initial winner)
Source: International Energy Agency
‐20%
‐10%
0%
10%
20%
30%
40%
50%
60%
Africa Latin America Middle East Russia US Shale
Upstream oil and gas investment (2017 vs. 2016)
2018 Eurasia Group
IEEJ:July 2018 © IEEJ2018

Confidential & Proprietary © 2017 Eurasia Group | 22
What do governments do with stranded assets?
Stranded assets could add financial strain to government and company budgets, as well as logistical challenges from issues such as restructuring
2018 Eurasia GroupPhoto credit: Carbon Tracker report
IEEJ:July 2018 © IEEJ2018
Confidential & Proprietary © 2017 Eurasia Group | 23
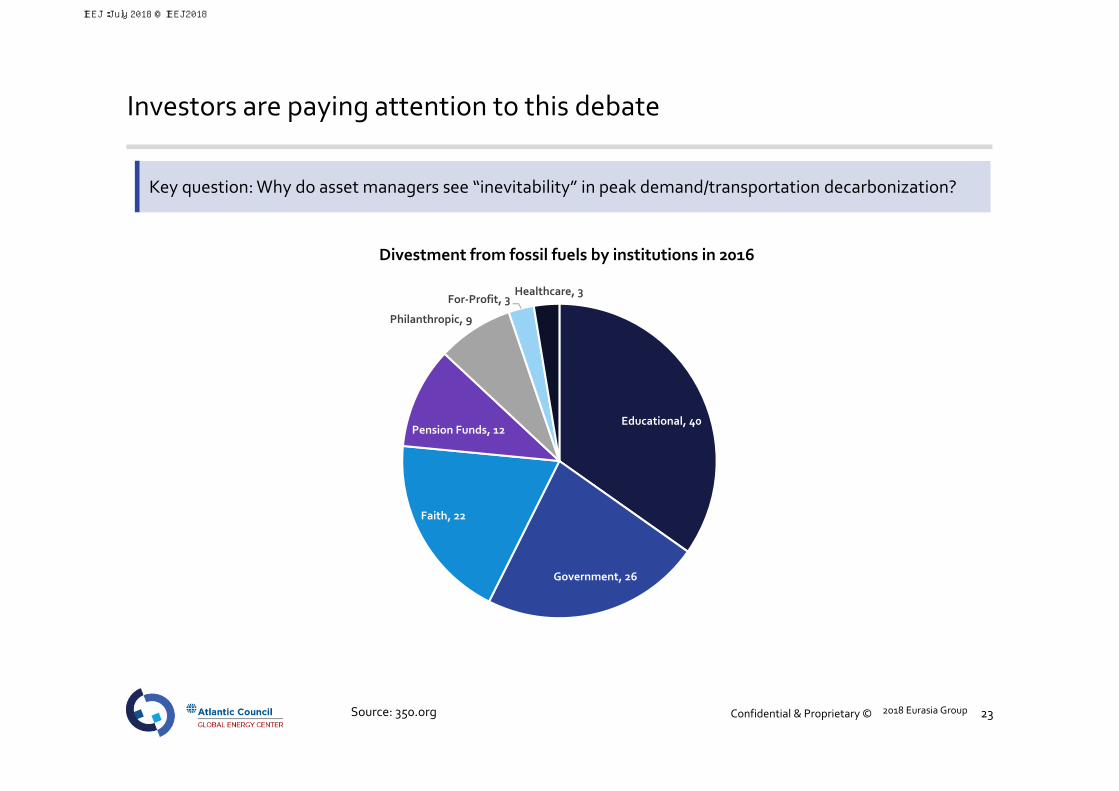
Investors are paying attention to this debate
Key question: Why do asset managers see “inevitability” in peak demand/transportation decarbonization?
2018 Eurasia Group
Educational, 40
Government, 26
Faith, 22
Pension Funds, 12
Philanthropic, 9
For‐Profit, 3Healthcare, 3
Divestment from fossil fuels by institutions in 2016
Source: 350.org
IEEJ:July 2018 © IEEJ2018
Confidential & Proprietary © 2017 Eurasia Group | 24
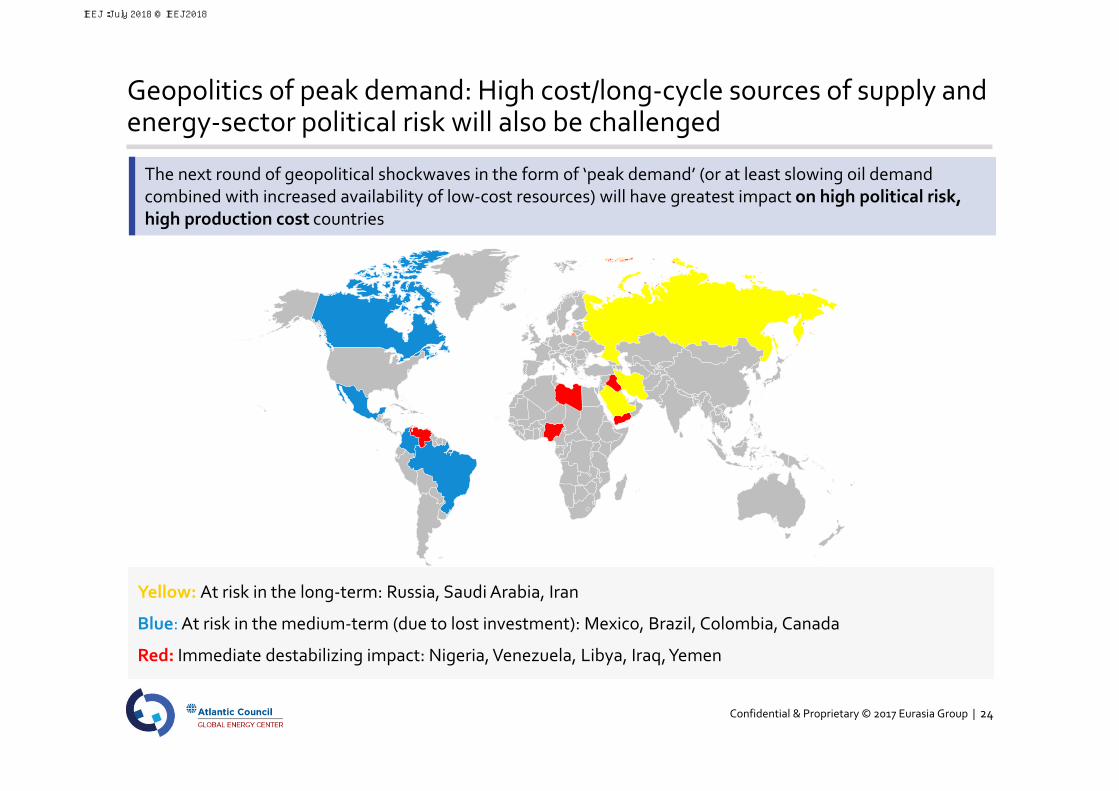
Geopolitics of peak demand: High cost/long‐cycle sources of supply and energy‐sector political risk will also be challenged
Yellow: At risk in the long‐term: Russia, Saudi Arabia, Iran
Blue: At risk in the medium‐term (due to lost investment): Mexico, Brazil, Colombia, Canada
Red: Immediate destabilizing impact: Nigeria, Venezuela, Libya, Iraq, Yemen
The next round of geopolitical shockwaves in the form of ‘peak demand’ (or at least slowing oil demand combined with increased availability of low‐cost resources) will have greatest impact on high political risk, high production cost countries
IEEJ:July 2018 © IEEJ2018

Eurasia Group is the world’s leading global political risk research and consulting firm. This presentation is intended solely for internal use by the recipient and is based on the opinions of Eurasia Group analysts and various in‐country
specialists. This presentation is not intended to serve as investment advice, and it makes no representations concerning the credit worthiness of any company. This presentation does not constitute an offer, or an invitation to offer, or a recommendation to enter into any transaction. Eurasia Group maintains no affiliations with government
or political parties.
© 2017 Eurasia Group | www.eurasiagroup.net
London New York San Francisco São Paulo Singapore Tokyo Washington DC
Eurasia Group is the world’s leading global political risk research and consulting firm. This presentation is intended solely for internal use by the recipient and is based on the opinions of Eurasia Group analysts and various in‐country
specialists. This presentation is not intended to serve as investment advice, and it makes no representations concerning the credit worthiness of any company. This presentation does not constitute an offer, or an invitation to offer, or a recommendation to enter into any transaction. Eurasia Group maintains no affiliations with government
or political parties.
© 2017 Eurasia Group | www.eurasiagroup.net
IEEJ:July 2018 © IEEJ2018
Contact :[email protected]