Transport Trends An Overview of Ireland's Transport Sector ... · 2 Transport Trends 2018 Transport...
36
An Overview of Ireland's Transport Sector 2018 Transport Trends
Transcript of Transport Trends An Overview of Ireland's Transport Sector ... · 2 Transport Trends 2018 Transport...

An Overview of Ireland's Transport Sector2018
Transport Trends

Transport Trends 2018 1
Transport Trends 2018 July 2018
Transport Trends 2018 was produced by the Department of Transport, Tourism and Sport’s Strategic
Research and Analysis Division, a constituent unit of the Irish Government Economic and Evaluation
Service. The report is available at both http://dttas.gov.ie and http://igees.gov.ie/.
Disclaimer and Terms of Use
This document was produced by the Strategic Research and Analysis Division (SRA) of the Department
of Transport, Tourism and Sport (DTTaS) and does not necessarily represent any views of the Minister or
the Government.
The data utilised in this report has been primarily collected from published external sources. As such the
Department does not hold any responsibility for the accuracy or robustness of the underlying data.
References to data highlighted in this document should cite the original source as appropriate. Issues in
relation to the source data should be addressed to the relevant cited body. Any errors in transposition,
analysis or interpretation are the responsibility of SRA. Given the variety of sources utilised, differences
in definitions and methodologies may exist between sources. Percentages may be rounded. Data cited
as provisional may be subject to change.
The data underlying this report were collated by SRA between January and July 2018 and were the most
up-to-date published data available at that time. As such, users of the document should check with the
data sources as to whether more up-to-date data is available. Due to the variety of sources, data may
refer to different years i.e. the most recent data for a certain indicator may be from 2015 or 2016 rather
than 2017.
2 Transport Trends 2018
Transport Trends seeks to provide a concise overview of the key developments that are evident
from the latest Irish transport data.
The publication is produced annually by the Department of Transport, Tourism and Sport’s Strategic
Research and Analysis Division (SRA); a constituent unit of the Irish Government Economic and
Evaluation Service (IGEES).
The contents of this publication are based primarily on data gathered from external sources.
Information provided here should be used for reference purposes and citation should remain with
the original source as stated. The ‘Notes and References’ section (pp.31-34) should be consulted
when interpreting this document.
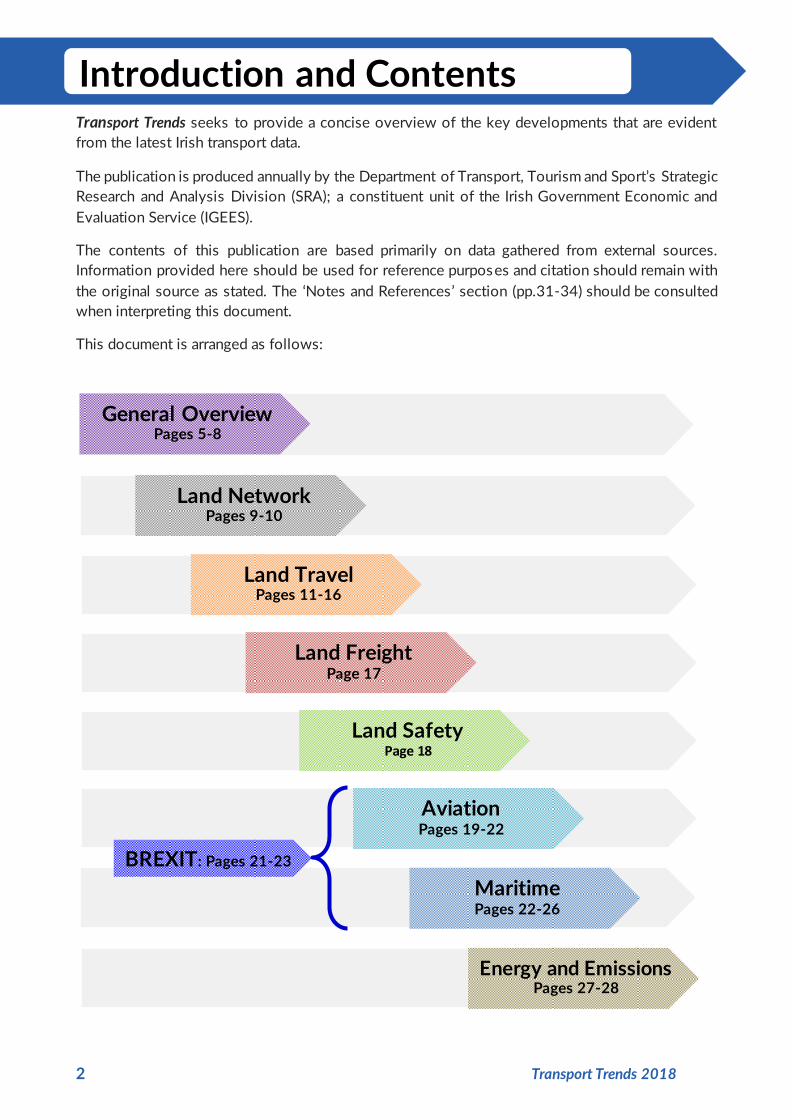
This document is arranged as follows:
Introduction and Contents
General Overview Pages 5-8
Land Network Pages 9-10
Land Travel Pages 11-16
Land Freight Page 17
Land Safety Page 18
Maritime Pages 22-26
Energy and Emissions Pages 27-28
Aviation Pages 19-22
BREXIT: Pages 21-23

Transport Trends 2018 3
This year’s edition of Transport Trends highlights continued growth across many transport domains
in Ireland. This included increases in the number of passengers carried by public transport, the
amount of freight being moved by road, sea or air, the number of people moving through our
airports and the number of kilometres driven on Irish roads. A clear correlation between transport
demand and wider economic activity remains evident.
Land Transport: There was a 53 km increase in the length of Ireland’s road network classified
as motorway to 969 km in 2017 (around 18% of national-level roads). The
level of public transport services by bus and rail increased in 2016 and 2017.
Travel demand for land transport showed continued strong growth in many
areas in 2016/17. Total kilometres driven on Irish roads increased by 6% in
2016, and there were an extra 16.3 million public transport passenger
journeys on the four main state operators in 2017, a rise of 7%. Use of active
modes (walking and cycling) has grown more in Dublin than the rest of the
country. The number of new vehicles registered fell by 10.7% in 2017 but
the total number of vehicles licensed rose 1.9% to 2.68 million. Road freight
activity continued to show strong growth in 2016 but remains well below its
pre-recession peak.
The number of road fatalities fell to 157 in 2017, the lowest since records
began, but cyclist deaths increased to 14, up from 10 in 2016 and an average
of 9 a year in the previous decade.
Aviation: Irish aviation activity continued to show pronounced growth across a range
of measures in 2017. A record 34.5 million passengers travelled through Irish
airports, up 5%, with Dublin Airport handling 29.5 million of them. The
amount of freight handled at Irish airports and total flights handled by Irish
air traffic control also grew.
Maritime: Ireland’s ports experienced further growth in activity in 2017. Although the
number of vessels arriving at Irish ports fell slightly, the gross tonnage of
these ships and the volume of goods handled through Irish ports all
increased. The number of maritime passengers on scheduled services rose
slightly, and there was a marked increase in the number of cruise ships and
passengers visiting Ireland.
Energy & Emissions: The level of emissions from the transport sector grew again in 2016 to
12.29m tonnes of CO2 (up 3.9%), despite a further decrease in the average
emissions of new vehicles. Continued growth in transport activity will create
increasingly challenging conditions in which to meet climate-related targets.
Several challenges are evident for transport policy, notably the continued dominance of private car
use (three out of every four journeys in 2016), continued expenditure constraints and the potential
impact of Brexit. In summary, Transport Trends 2018 shows continued growth in transport activity in
Ireland across a wide range of measures .
Snapshot


Transport Trends 2018 5
This section provides an overview of the transport sector in Ireland. This includes details on how we travel, historical developments, travel costs and employment, recent headline expenditure trends, revenue associated with the transport sector and the wider international context.
The performance of the wider economy is a primary influence on trends within the transport sector. Economic growth both results in and is driven by more commuters, goods and tourists moving around Ireland.
The growth of the economy between 1995 and 2008, measured by GNP and employment, was associated with huge growth in cars licensed, passenger km travelled by car and public transport, and energy use & emissions in the transport sector. The recovery in GNP and employment and measures of transport activity since 2012 has continued in 2016/17 – the most recent figures available show increases in all of the selected indicators.
Transport is a major element of consumer spending costing the average Irish household €2,300 a year in 2015. This is higher than the EU average of €2,000 a year, though it accounts for an identical share of household costs at 13%. Transport prices rose by 1.3% in 2017 compared to general inflation of 0.4%.
Some 95,200 people were employed in Ireland in Transportation and Storage in Q4 2017, with 50,600 of these in land transport, CSO figures show. A more detailed Census breakdown for 2016 shows there were over 10,000 in taxi operation, 10,600 in other land passenger transport, 14,900 in road freight, 1,800 in water transport, and 8,200 in air transport.
The graph on the left shows the ratio of total exports plus total imports to GDP for various countries and country groups. World Bank data shows that Ireland is a particularly open economy, and that this openness has grown over time. In 2016, Irish exports and imports combined to an amount over twice the size of Irish GDP (221%). Only Luxembourg (407%), Hong Kong (373%), and Malta (268%) recorded higher levels of trade openness, while the OECD average was 55%.
Clearly, Ireland’s economy is heavily dependent on the movement of goods and services into and out of the country, and therefore on efficient domestic and international transport networks.
80
130
180
230
280
1995
1996
1997
1998
1999
2000
2001
2002
2003
2004
2005
2006
2007
2008
2009
2010
2011
2012
2013
2014
2015
2016
2017
Ind
ex
(10
0 =
19
95)
Economy and Transport Indicators, Ireland 1995-2017
Transport Emissions Fuel Use by TransportCar pkm Public Transport pkmCars Under Licence Total EmploymentGNP (Gross National Product)
Source: CSO, EU Commission, EPA,
€560 €759
€1,000 €897
€440 €644
€0
€500
€1,000
€1,500
€2,000
€2,500
EU 28 Ireland
Average Annual Household Transport Costs, 2015
Vehicle purchases Vehicle running costs Transport ServicesSource: European Commission
0
50
100
150
200
250
199
5
199
6
199
7
199
8
199
9
200
0
200
1
200
2
200
3
200
4
200
5
200
6
200
7
200
8
200
9
201
0
201
1
201
2
201
3
201
4
201
5
201
6
Exports + Imports as a % of GDP, 1995-2016
OECD members WorldPortugal JapanIreland United Kingdom
Source: World Bank
General Overview

6 Transport Trends 2018
The number of people commuting to work reached 1.88m in 2016, 5% more than in 2006, Census data shows.
The use of private cars for work commuting grew from 55% of the total in 1986 to 65.6% in 2016 (1.23m), but is down from 67.1% in 2011. Almost 175,000 people commuted to work by public transport in 2016, and their share of the total rose to 9.3%. 175,080 people walked to work in 2016 but their share fell from 10.1% in 2011 to 9.3% in 2016. The numbers cycling to work grew by 43% to 56,837 in 2016 and their share increased to 3% of the total.
The total number of people travelling to work, school or college grew by 9% to 2.96m.
Census data shows an increase in the national average work commute to 28.2 minutes in 2016, up from 27.5 minutes in 2011. Commuters living in counties bordering Dublin had the longest journeys averaging nearly 35 minutes in Meath and Wicklow and 34 minutes in Kildare. Those living in Galway City, Donegal, Sligo and Cork City had the shortest commutes, averaging around 22 minutes. National Travel Survey data for all types of journeys, also shows an upward trend, with the average trip length rising to 14.7km and duration up to 23.6 minutes in 2016. Trips in Dublin tend to be shorter in distance but take longer.
The National Travel Survey examines transport use by adults for all types of journey. It shows work and education are still the major reason for making journeys, with their share increasing from 27.8% in 2012 to 33.3% in 2016. Shopping trips were the second biggest category accounting for 21.9% of the total, with leisure trips at 11.6%.
Private car remains the dominant mode of transport at 74.3%, virtually unchanged since 2014, while the share of public transport journeys fell from 5.8% in 2014 to 5.5% in 2016. Walking/cycling trips are also virtually unchanged at 16.3% of the total.
The transport of people and goods across various modes continues to increase following a number of years of decline. This increase is both a result and further signal of wider economic growth in Ireland. People are making more trips for the purpose of work and education and journeys are becoming longer in both duration and distance.
9.3% 3.0%
9.3%
65.6%
7.8%
0%
10%
20%
30%
40%
50%
60%
70%
80%
Walk Cycle PublicTransport
Car Other
Work Commute Journeys by Mode, 2006-2016
2006 2011 2016Source: CSO Census. Mode share calculated from commuter total including unstated
28.2
0
5
10
15
20
25
30
35
40Travel time to work selected counties, 2016
Source: CSO Census
Transport Trends 2018 7
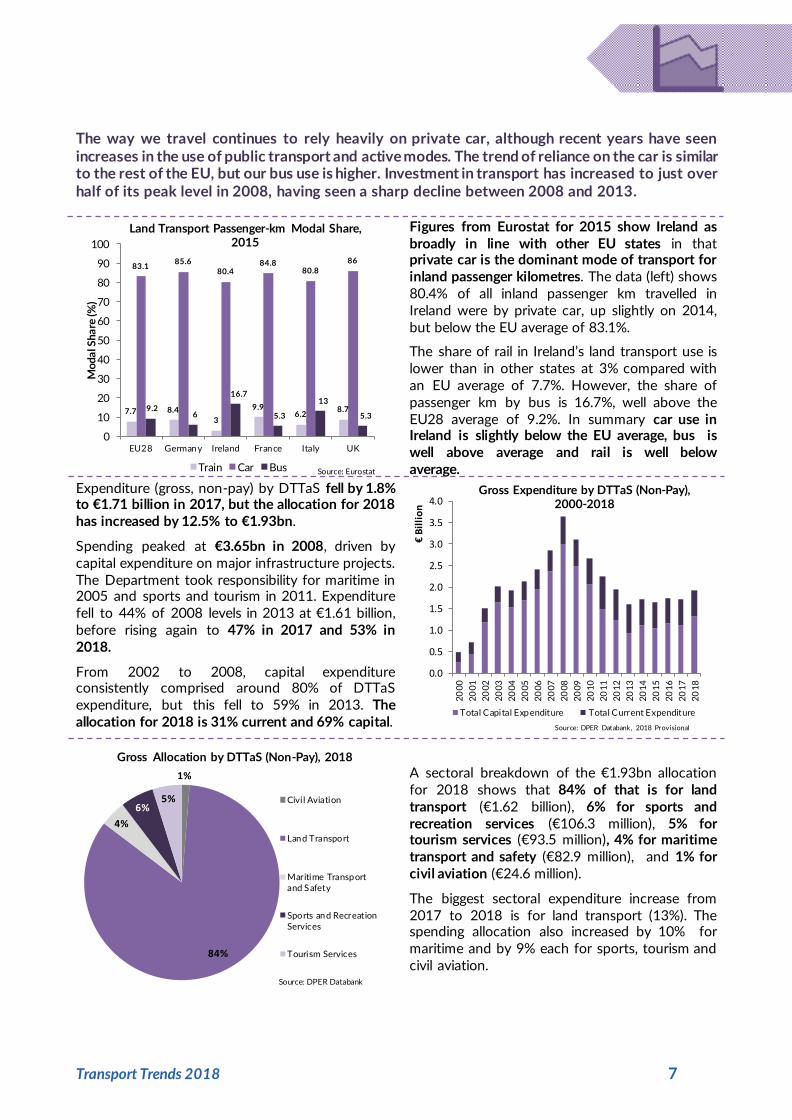
The way we travel continues to rely heavily on private car, although recent years have seen increases in the use of public transport and active modes. The trend of reliance on the car is similar to the rest of the EU, but our bus use is higher. Investment in transport has increased to just over half of its peak level in 2008, having seen a sharp decline between 2008 and 2013.
Figures from Eurostat for 2015 show Ireland as broadly in line with other EU states in that private car is the dominant mode of transport for inland passenger kilometres. The data (left) shows 80.4% of all inland passenger km travelled in Ireland were by private car, up slightly on 2014, but below the EU average of 83.1%.
The share of rail in Ireland’s land transport use is lower than in other states at 3% compared with an EU average of 7.7%. However, the share of passenger km by bus is 16.7%, well above the EU28 average of 9.2%. In summary car use in Ireland is slightly below the EU average, bus is well above average and rail is well below average.
Expenditure (gross, non-pay) by DTTaS fell by 1.8% to €1.71 billion in 2017, but the allocation for 2018 has increased by 12.5% to €1.93bn.
Spending peaked at €3.65bn in 2008, driven by capital expenditure on major infrastructure projects. The Department took responsibility for maritime in 2005 and sports and tourism in 2011. Expenditure fell to 44% of 2008 levels in 2013 at €1.61 billion, before rising again to 47% in 2017 and 53% in 2018.
From 2002 to 2008, capital expenditure consistently comprised around 80% of DTTaS expenditure, but this fell to 59% in 2013. The allocation for 2018 is 31% current and 69% capital.
A sectoral breakdown of the €1.93bn allocation for 2018 shows that 84% of that is for land transport (€1.62 billion), 6% for sports and recreation services (€106.3 million), 5% for tourism services (€93.5 million), 4% for maritime transport and safety (€82.9 million), and 1% for civil aviation (€24.6 million).
The biggest sectoral expenditure increase from 2017 to 2018 is for land transport (13%). The spending allocation also increased by 10% for maritime and by 9% each for sports, tourism and civil aviation.
7.7 8.4
3
9.9 6.2
8.7
83.1 85.6
80.4 84.8
80.8
86
9.2 6
16.7
5.3
13
5.3
0
10
20
30
40
50
60
70
80
90
100
EU28 Germany Ireland France Italy UK
Mo
da
l Sh
are
(%)
Land Transport Passenger-km Modal Share, 2015
Train Car Bus Source: Eurostat
0.0
0.5
1.0
1.5
2.0
2.5
3.0
3.5
4.0
20
00
20
01
20
02
20
03
20
04
20
05
20
06
20
07
20
08
20
09
20
10
20
11
20
12
20
13
20
14
20
15
20
16
20
17
20
18
€ B
illi
on
Gross Expenditure by DTTaS (Non-Pay), 2000-2018
Total Capital Expenditure Total Current Expenditure
Source: DPER Databank, 2018 Provisional
1%
84%
4%
6% 5%
Gross Allocation by DTTaS (Non-Pay), 2018
Civi l Aviation
Land Transport
Maritime Transportand Safety
Sports and RecreationServices
Tourism Services
Source: DPER Databank

8 Transport Trends 2018
The largest expenditure item within DTTaS is land transport which is made up of roads, public transport and sustainable transport. Between 2002 and 2013, roads received an average of 64% of land transport expenditure and public transport 36%.
In recent years this gap has narrowed– expenditure in 2017 was 55% on roads and 45% on public transport. The spending allocation for 2018 is 56% for roads and 44% for public transport with 0.3% for sustainable transport. Expenditure areas are not entirely distinct: some spending on sustainable transport measures may be included under public transport, while bus users also benefit from an improved road network.
Ireland’s investment in inland transport infrastructure as a percentage of GDP (left) is estimated at 0.3% in 2014, below the OECD average of 0.8%. A marked decline can be seen relative to previous years, particularly since 2010 when the Irish figure was 0.8%.
DTTaS analysis using GNI* indicates that despite an increase in capital expenditure on transport since 2014, the level of investment in land transport is still below our long-run average and below the necessary amount to maintain the current network. Under the National Development Plan, the annual ‘steady state’ requirement is expected to be substantially met by 2021, although there will continue to be some impact due to the backlog of required investment.
Taxation revenue associated with the transport sector has consistently outstripped expenditure. Provisional data for 2017 shows that revenue reached €4.5 billion, down 2% on 2016 but significantly above DTTaS exchequer expenditure of €1.7 billion in 2017.
Associated taxation revenue fell sharply after 2007 when it peaked at €5 billion. The primary driver of this was a fall in vehicle registration tax (VRT) which went from €1.4 billion in 2007 to €379 million in 2012, before recovering to €841 million in 2017. Other associated tax streams, including the carbon tax which was introduced in 2010, have remained relatively constant over the time period.
Transport investment has decreased significantly since 2008. It remains the case that Ireland is investing less than it historically has, less as a proportion of GDP than other OECD states, and less than the estimated level to maintain the current system. As transport demand continues to grow in line with resurgent economic growth, there has been a renewed focus on investment in the sector as part of the Government’s National Development Plan.
0%
10%
20%
30%
40%
50%
60%
70%
80%
20
02
20
03
20
04
20
05
20
06
20
07
20
08
20
09
20
10
20
11
20
12
20
13
20
14
20
15
20
16
20
17
20
18
% Share of Gross DTTaS Land Transport Expenditure, 2002-2018
Roads Public Transport
Sustainable Travel Other Source: DPER Databank
0
0.2
0.4
0.6
0.8
1
1.2
19
96
19
97
19
98
19
99
20
00
20
01
20
02
20
03
20
04
20
05
20
06
20
07
20
08
20
09
20
10
20
11
20
12
20
13
20
14
20
15
Inv
est
me
nt
as
% o
f G
DP
Investment in Inland Transport Infrastructure as % of GDP, 1996-2015
Ireland OECD Average
Source: OECD. Some estimated values including Ireland's rail data from 2008 on
0
1
2
3
4
5
6
2001 2003 2005 2007 2009 2011 2013 2015 2017
€ B
illi
on
Taxation Revenue Associated with Transport, 2001-2017
Fuel Excise VRT Fuel VAT Motor Tax Carbon TaxSource: Revenue/DHPLG/DTTaS. 2017 figures provisional

Transport Trends 2018 9
This section of Transport Trends discusses the provision of land transport infrastructure and services. The road network facilitates both passenger and freight transport, and both public and private transport, and is broken down into national, regional, and local classifications. Public transport also relies on rail infrastructure, both light rail (in Dublin) and heavy rail (nationwide).
Road Infrastructure, 2017
National Road: 5,332 km
Of Which Motorway: 969 km
Regional Roads: 13,120 km
Local Roads: 80,472 km
Total Road: 98,924 km
Source: CSO/TII
The Irish road network consists of 98,924 km of road according to statistics from the CSO and TII. National roads, the primary links between cities and towns, account for 5,332 km or 5% of all roads. Of these, 969 km are motorway, an increase of 53 kilometres in 2017 due to the opening of the M17/M18 motorway from Gort to Tuam. Motorways accounted for 5% of national roads in 2017, while 301km or 16% of national roads are dual carriageway, and 4,062km or 77% are single carriageway.
The regional road network in 2012 comprised 13,120 km (13% of all roads) and local roads accounted for 80,472 km (81% of all roads).
The figure presented (right) details the geographical breakdown of the Irish road network by local authority area in 2016. The areas containing the highest proportion of the Irish road network are Cork County (12,362 km or 12.5%), Galway County (6,706 km or 6.8%), Mayo (6,485 km or 6.6%) and Donegal (6,429 km or 6.5%).
The distribution of the Irish road network is necessarily a function of geography and demography and gives an indication of the road asset levels being managed across the country and the relative breakdown of road classifications.
The latest data published by the European Commission (2015) allows for a comparison of the level of road density across EU Member States. This is measured as the number of road km per 1,000 inhabitants.
As can be seen in the figure (left), Ireland’s road density is high by European comparison. With 20.9 km per 1000 inhabitants Ireland has the 5th highest density in the EU and has more than twice the EU28 average of 9.6 km per 1,000 people. Ireland can also be seen to have more than three times the road density of the UK (6.4 km per 1000 inhabitants).
-
2
4
6
8
10
12
14
Km
s o
f R
oa
d (T
ho
usa
nd
)
Total Road km by Local Authority, 2016
Local Regional National
Source: CSO and DTTaS.
2.8
14.4
16.3
20.9
4.3
8.2
6.4
9.6
0
5
10
15
20
25
Ro
ad
Km
s
Estimated Road km Per 1000 Inhabitants, 2015
Road Kms per 1000 Inhabitants Source: EU Commission
Land Transport – Network

10 Transport Trends 2018
Data from the NTA provides a picture of the level of bus service provision in Ireland. The total vehicle km operated increased 1.2% from 183.1 million km in 2016 to 185.2 million km in 2017. The 2017 data shows vehicle km rising 1.3% (to 56m) for Dublin Bus and by 3.4% (to 36.9m) for Bus Eireann, while vehicle seat km rose by 2.2% (to 3.5 billion) and 5.5% (to 2.5 billion) respectively. For other commercial bus services, vehicle km rose by 0.2% (to 92.3m).
Based on other NTA data, there were 2,609 buses providing services in 2016, up 8% from 2,412 in 2015. 37% or 967 of the buses operating in 2016 were for Dublin Bus PSO services, 20% or 517 were for Bus Éireann PSO services and 43% or 1,125 were for other licensed bus services.
Luas: Key Facts (2017) Red Line Length: 20.8 km
Green Line Length: 22.2 km Trams in Operation: 66
Tram Capacity: 291-319 People Vehicle Km: 3.9 million
Passenger Km: 183.5 million (2016)
Heavy Rail: Key Facts (2016) Passenger Lines: 1,679 km
Passenger Stations: 144
Source: NTA/CSO Transport Omnibus
Dublin’s light-rail system,the Luas, underwent major expansion in December 2017 with the opening of Luas Cross City, a 5.9 km extension linking the network’s green and red lines and continuing to Broombridge. At the end of 2017, there were 66 trams operating on 43 km of track. During 2018, Transport Infrastructure Ireland plans to deploy 8 new trams and lengthen others on the green line to increase capacity to 369 people per tram. In operational terms, there were 3.9 million vehicle km provided by Luas in 2017 (up 12%) while 184 million passenger km were travelled in 2016.
The heavy rail passenger network consists of 1,679 km of line tracks linking areas and regions. The network has 144 passenger stations.
The number of in-service vehicle kilometres operated on heavy rail services fell by 5.7% from 15.96 million km in 2016 to 15.01 million km in 2017.
The number of operated vehicle seat kilometres had decreased steadily from 7.1 billion in 2010 to 5.7 billion in 2014, but after two years of growth to 6.2 billion in 2016, during which extra carriages were added to meet rising demand, it fell by 4% in 2017 to 5.96 billion. The reduction in vehicle km and vehicle seat km operated in 2017 was mainly due to a number of days disruption caused by industrial action and by service stoppages during Storm Ophelia.
The Phoenix Park Rail Tunnel opened in late 2016 improving rail connections between Kildare and South Dublin, while the opening of the Luas Cross City extension in December 2017 was a major infrastructural development for light rail passengers. The combined volume of bus and rail services available to the public in terms of vehicle km increased in 2016 and 2017.
50.3 54.7 55.3 55.3 56.0
33.3 32.9 33.8 35.7 36.9
80.1 82.2 86.3
92.1 92.3
0
20
40
60
80
100
120
140
160
180
200
2013 2014 2015 2016 2017
Ve
hic
le K
ms
(Mil
lion
)
Annual Operated Bus Vehicle km, 2013-2017
Dublin Bus (PSO) Bus Eireann (PSO) Other Licenced Service
Source: NTA.
0
1
2
3
4
5
6
7
8
0
2
4
6
8
10
12
14
16
18
2011 2012 2013 2014 2015 2016 2017
Ve
hic
le S
ea
t K
ms
(Bill
ion
)
Ve
hic
le K
ms
(Mill
ion
)
Heavy Rail Service Provision, 2011-2017
In Service Vehicle km OperatedVehicle Seat km Operated Source: NTA
Transport Trends 2018 11
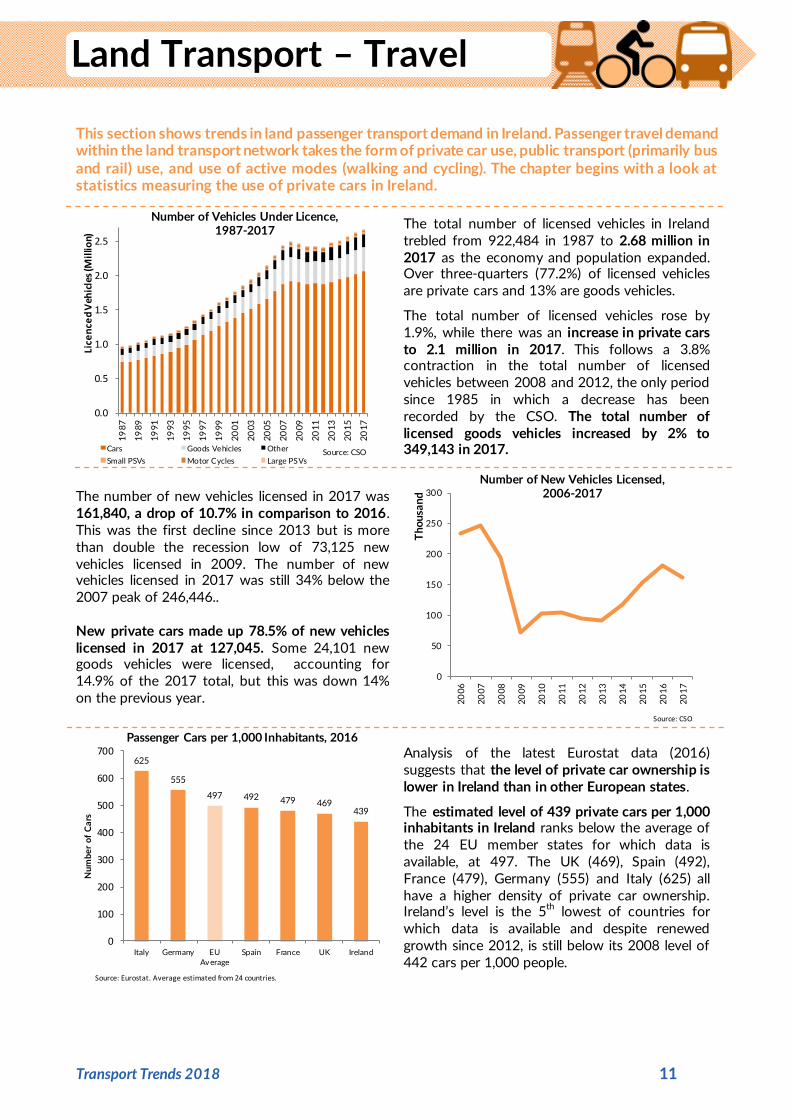
This section shows trends in land passenger transport demand in Ireland. Passenger travel demand within the land transport network takes the form of private car use, public transport (primarily bus and rail) use, and use of active modes (walking and cycling). The chapter begins with a look at statistics measuring the use of private cars in Ireland.
The total number of licensed vehicles in Ireland trebled from 922,484 in 1987 to 2.68 million in 2017 as the economy and population expanded. Over three-quarters (77.2%) of licensed vehicles are private cars and 13% are goods vehicles.
The total number of licensed vehicles rose by 1.9%, while there was an increase in private cars to 2.1 million in 2017. This follows a 3.8% contraction in the total number of licensed vehicles between 2008 and 2012, the only period since 1985 in which a decrease has been recorded by the CSO. The total number of licensed goods vehicles increased by 2% to 349,143 in 2017.
The number of new vehicles licensed in 2017 was 161,840, a drop of 10.7% in comparison to 2016. This was the first decline since 2013 but is more than double the recession low of 73,125 new vehicles licensed in 2009. The number of new vehicles licensed in 2017 was still 34% below the 2007 peak of 246,446.. New private cars made up 78.5% of new vehicles licensed in 2017 at 127,045. Some 24,101 new goods vehicles were licensed, accounting for 14.9% of the 2017 total, but this was down 14% on the previous year.
Analysis of the latest Eurostat data (2016) suggests that the level of private car ownership is lower in Ireland than in other European states.
The estimated level of 439 private cars per 1,000 inhabitants in Ireland ranks below the average of the 24 EU member states for which data is available, at 497. The UK (469), Spain (492), France (479), Germany (555) and Italy (625) all have a higher density of private car ownership. Ireland’s level is the 5th lowest of countries for which data is available and despite renewed growth since 2012, is still below its 2008 level of 442 cars per 1,000 people.
0.0
0.5
1.0
1.5
2.0
2.5
19
87
19
89
19
91
19
93
19
95
19
97
19
99
20
01
20
03
20
05
20
07
20
09
20
11
20
13
20
15
20
17
Lice
nce
d V
ehic
les
(Mil
lion)
Number of Vehicles Under Licence, 1987-2017
Cars Goods Vehicles Other
Small PSVs Motor Cycles Large PSVsSource: CSO
0
50
100
150
200
250
300
20
06
20
07
20
08
20
09
20
10
20
11
20
12
20
13
20
14
20
15
20
16
20
17
Th
ou
san
d
Number of New Vehicles Licensed, 2006-2017
Source: CSO
625
555
497 492 479 469 439
0
100
200
300
400
500
600
700
Italy Germany EUAverage
Spain France UK Ireland
Nu
mb
er
of
Ca
rs
Passenger Cars per 1,000 Inhabitants, 2016
Source: Eurostat. Average estimated from 24 countries.
Land Transport – Travel
12 Transport Trends 2018
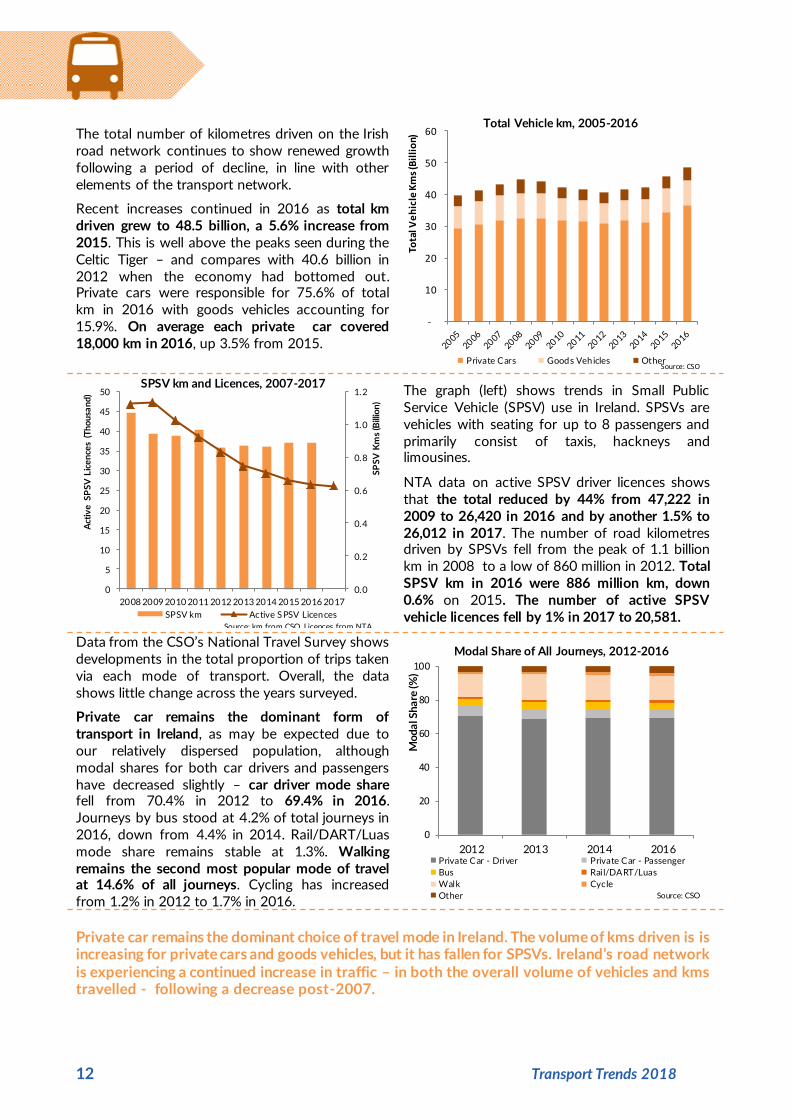
The total number of kilometres driven on the Irish road network continues to show renewed growth following a period of decline, in line with other elements of the transport network.
Recent increases continued in 2016 as total km driven grew to 48.5 billion, a 5.6% increase from 2015. This is well above the peaks seen during the Celtic Tiger – and compares with 40.6 billion in 2012 when the economy had bottomed out. Private cars were responsible for 75.6% of total km in 2016 with goods vehicles accounting for 15.9%. On average each private car covered 18,000 km in 2016, up 3.5% from 2015.
The graph (left) shows trends in Small Public Service Vehicle (SPSV) use in Ireland. SPSVs are vehicles with seating for up to 8 passengers and primarily consist of taxis, hackneys and limousines.
NTA data on active SPSV driver licences shows that the total reduced by 44% from 47,222 in 2009 to 26,420 in 2016 and by another 1.5% to 26,012 in 2017. The number of road kilometres driven by SPSVs fell from the peak of 1.1 billion km in 2008 to a low of 860 million in 2012. Total SPSV km in 2016 were 886 million km, down 0.6% on 2015. The number of active SPSV vehicle licences fell by 1% in 2017 to 20,581.
Data from the CSO’s National Travel Survey shows developments in the total proportion of trips taken via each mode of transport. Overall, the data shows little change across the years surveyed.
Private car remains the dominant form of transport in Ireland, as may be expected due to our relatively dispersed population, although modal shares for both car drivers and passengers have decreased slightly – car driver mode share fell from 70.4% in 2012 to 69.4% in 2016. Journeys by bus stood at 4.2% of total journeys in 2016, down from 4.4% in 2014. Rail/DART/Luas mode share remains stable at 1.3%. Walking remains the second most popular mode of travel at 14.6% of all journeys. Cycling has increased from 1.2% in 2012 to 1.7% in 2016.
Private car remains the dominant choice of travel mode in Ireland. The volume of kms driven is is increasing for private cars and goods vehicles, but it has fallen for SPSVs. Ireland’s road network is experiencing a continued increase in traffic – in both the overall volume of vehicles and kms travelled - following a decrease post-2007.
-
10
20
30
40
50
60
Tota
l Ve
hic
le K
ms
(Bil
lio
n)
Total Vehicle km, 2005-2016
Private Cars Goods Vehicles OtherSource: CSO
0.0
0.2
0.4
0.6
0.8
1.0
1.2
0
5
10
15
20
25
30
35
40
45
50
2008 2009 2010 2011 2012 2013 2014 2015 2016 2017
SP
SV
Km
s (B
illio
n)
Act
ive
SP
SV
Lic
en
ces
(Th
ou
san
d)
SPSV km and Licences, 2007-2017
SPSV km Active SPSV Licences
Source: km from CSO. Licences from NTA
0
20
40
60
80
100
2012 2013 2014 2016
Mo
da
l Sh
are
(%)
Modal Share of All Journeys, 2012-2016
Private Car - Driver Private Car - Passenger
Bus Rail/DART/Luas
Walk Cycle
Other Source: CSO

Transport Trends 2018 13
This section explores trends in passenger travel by modes other than private car. Census data for 2016 shows continued downward trends in the share of journeys made by foot, whereas the share of journeys by bus, train, and bicycle all rose. In recent years, passenger numbers on public transport, both publicly-funded and commercial, have generally risen, particularly in Dublin.
Census data reveals trends in how people get to work. The proportion of workers commuting by bus rose from 5.4% in 2011 to 5.9% in 2016, while the number using train/Luas rose from 3.1% to 3.4%. However in Dublin the number using public transport to commute is 21% compared to 2% in rural areas.
Walking to work has fallen steadily from 15.2% in 1986 to 9.3% in 2016, while the proportion cycling fell to just 2% in 2006, but has risen to 3% in 2016. (Absolute numbers have increased for walking and fallen slightly for cycling.) NTA Canal Cordon Count data meanwhile shows over half of people entering Dublin City Centre on a typical November morning in 2017 used public transport (107,160 out of 211,416).
The number of passengers on public transport has continued to grow. NTA data for 2017 (excluding school transport) shows a 6.5% rise in passenger journeys to 278.3 million in total, with 252.4 million journeys on the four main state-supported operators. There were 25.8 million passenger journeys on commercial bus routes in 2017 (up 2.4%) and 1.9 million passenger journeys on the Rural Transport Programme (up 5.6%). CSO data (which includes school transport, but not commercial or RTP journeys) indicates a 2.6% rise in passenger journeys to 282 million in 2016.
The Luas has seen consistent growth since 2009 and the preliminary estimate from the NTA is that the Luas Cross City extension boosted numbers using the Green Line by around 24% in January 2018 compared to January 2017. This is based on the difference between Green Line growth in passenger numbers of 28% compared to Red Line growth of 4.8% in the same period.
NTA data shows there were an extra 3.7 million passenger journeys on the Luas in 2017 compared to 2016, a rise of 10.6% to 37.7m journeys – of these, 58% were on the Red Line. Overall, 3.67m journeys were made on the Free Travel Scheme in 2017.
0%
2%
4%
6%
8%
10%
12%
14%
16%
1986 1991 1996 2002 2006 2011 2016
Work Commute by Public Transport, Walking and Cycling 1986-2016
On foot Bicycle Bus Train
Source: CSO
0
50
100
150
200
250
300
2011 2012 2013 2014 2015 2016 2017
Pa
sse
ng
ers
(Mil
lion
)
Public Transport Passenger Journeys, 2011-2017
Dublin Bus Bus ÉireannIrish Rai l LuasComm'rcial Bus Services Rural Transport/ Local Link
Source: NTA. Dublin Bus/Bus Eireann PSO only. Commercial data only available 2013-17.
-
5
10
15
20
25
30
35
40
2007 2008 2009 2010 2011 2012 2013 2014 2015 2016 2017
Pas
sen
ger
Jou
rne
ys (M
illio
n) Luas Passenger Numbers,
2007-2017
Red Line Green Line
Source: 2007-2016 CSO. 2017 from NTA
14 Transport Trends 2018
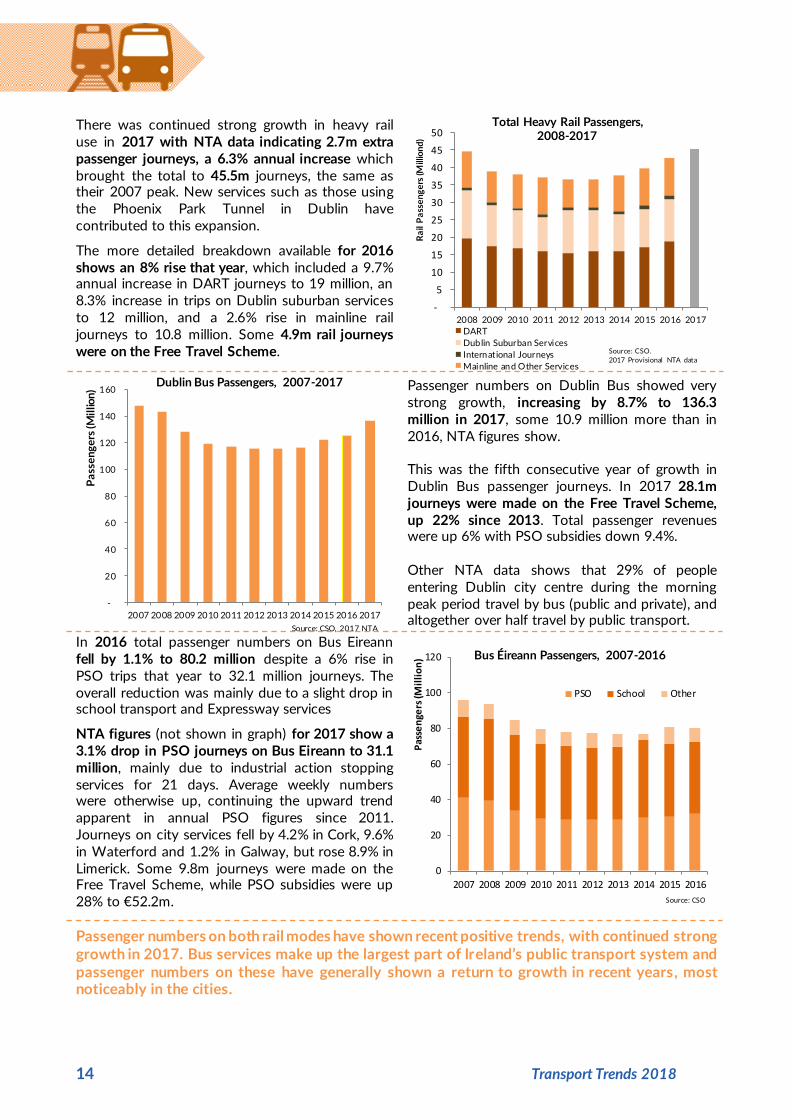
There was continued strong growth in heavy rail use in 2017 with NTA data indicating 2.7m extra passenger journeys, a 6.3% annual increase which brought the total to 45.5m journeys, the same as their 2007 peak. New services such as those using the Phoenix Park Tunnel in Dublin have contributed to this expansion.
The more detailed breakdown available for 2016 shows an 8% rise that year, which included a 9.7% annual increase in DART journeys to 19 million, an 8.3% increase in trips on Dublin suburban services to 12 million, and a 2.6% rise in mainline rail journeys to 10.8 million. Some 4.9m rail journeys were on the Free Travel Scheme.
Passenger numbers on Dublin Bus showed very strong growth, increasing by 8.7% to 136.3 million in 2017, some 10.9 million more than in 2016, NTA figures show. This was the fifth consecutive year of growth in Dublin Bus passenger journeys. In 2017 28.1m journeys were made on the Free Travel Scheme, up 22% since 2013. Total passenger revenues were up 6% with PSO subsidies down 9.4%. Other NTA data shows that 29% of people entering Dublin city centre during the morning peak period travel by bus (public and private), and altogether over half travel by public transport.
In 2016 total passenger numbers on Bus Eireann fell by 1.1% to 80.2 million despite a 6% rise in PSO trips that year to 32.1 million journeys. The overall reduction was mainly due to a slight drop in school transport and Expressway services
NTA figures (not shown in graph) for 2017 show a 3.1% drop in PSO journeys on Bus Eireann to 31.1 million, mainly due to industrial action stopping services for 21 days. Average weekly numbers were otherwise up, continuing the upward trend apparent in annual PSO figures since 2011. Journeys on city services fell by 4.2% in Cork, 9.6% in Waterford and 1.2% in Galway, but rose 8.9% in Limerick. Some 9.8m journeys were made on the Free Travel Scheme, while PSO subsidies were up 28% to €52.2m.
Passenger numbers on both rail modes have shown recent positive trends, with continued strong growth in 2017. Bus services make up the largest part of Ireland’s public transport system and passenger numbers on these have generally shown a return to growth in recent years, most noticeably in the cities.
-
5
10
15
20
25
30
35
40
45
50
2008 2009 2010 2011 2012 2013 2014 2015 2016 2017
Ra
il P
ass
en
ge
rs (M
illio
nd
)
Total Heavy Rail Passengers, 2008-2017
DART
Dublin Suburban Services
International Journeys
Mainline and Other Services
Source: CSO.
2017 Provisional NTA data
-
20
40
60
80
100
120
140
160
2007 2008 2009 2010 2011 2012 2013 2014 2015 2016 2017
Pa
sse
ng
ers
(Mil
lion
)
Dublin Bus Passengers, 2007-2017
Source: CSO, 2017 NTA
0
20
40
60
80
100
120
2007 2008 2009 2010 2011 2012 2013 2014 2015 2016
Pas
sen
gers
(Mil
lio
n) Bus Éireann Passengers, 2007-2016
PSO School Other
Source: CSO
Transport Trends 2018 15
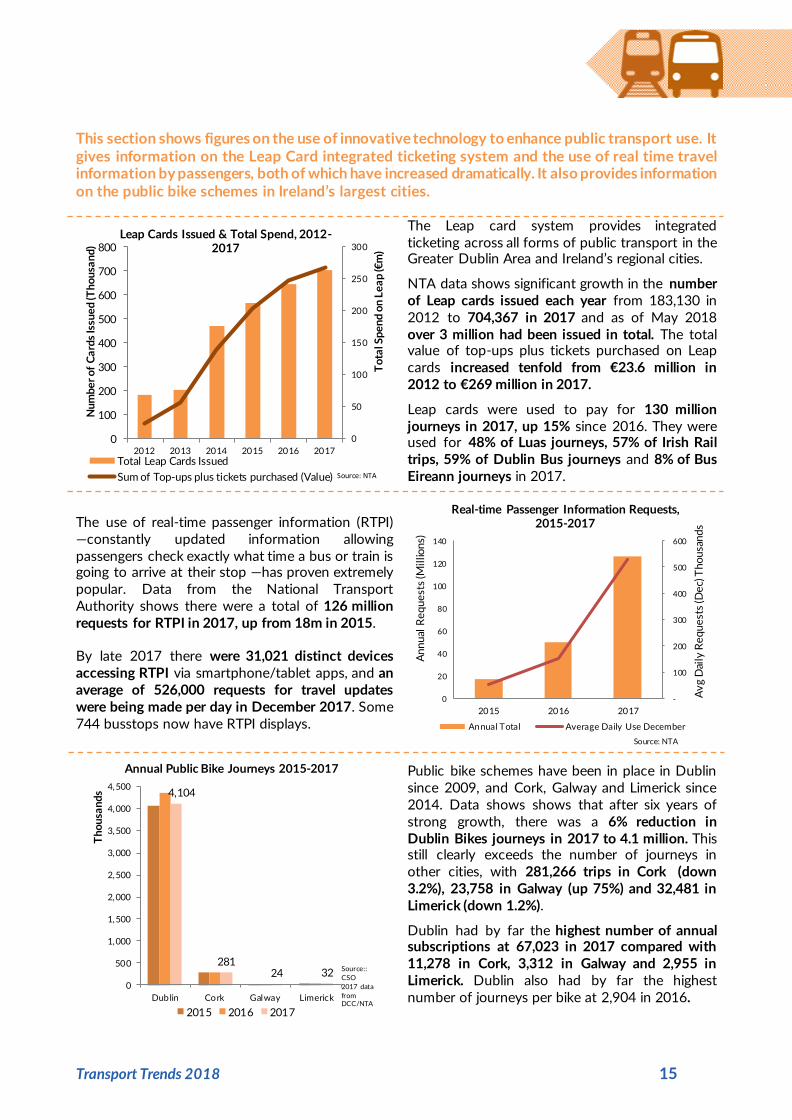
This section shows figures on the use of innovative technology to enhance public transport use. It gives information on the Leap Card integrated ticketing system and the use of real time travel information by passengers, both of which have increased dramatically. It also provides information on the public bike schemes in Ireland’s largest cities.
The Leap card system provides integrated ticketing across all forms of public transport in the Greater Dublin Area and Ireland’s regional cities.
NTA data shows significant growth in the number of Leap cards issued each year from 183,130 in 2012 to 704,367 in 2017 and as of May 2018 over 3 million had been issued in total. The total value of top-ups plus tickets purchased on Leap cards increased tenfold from €23.6 million in 2012 to €269 million in 2017.
Leap cards were used to pay for 130 million journeys in 2017, up 15% since 2016. They were used for 48% of Luas journeys, 57% of Irish Rail trips, 59% of Dublin Bus journeys and 8% of Bus Eireann journeys in 2017.
The use of real-time passenger information (RTPI) —constantly updated information allowing passengers check exactly what time a bus or train is going to arrive at their stop —has proven extremely popular. Data from the National Transport Authority shows there were a total of 126 million requests for RTPI in 2017, up from 18m in 2015. By late 2017 there were 31,021 distinct devices accessing RTPI via smartphone/tablet apps, and an average of 526,000 requests for travel updates were being made per day in December 2017. Some 744 busstops now have RTPI displays.
Public bike schemes have been in place in Dublin since 2009, and Cork, Galway and Limerick since 2014. Data shows shows that after six years of strong growth, there was a 6% reduction in Dublin Bikes journeys in 2017 to 4.1 million. This still clearly exceeds the number of journeys in other cities, with 281,266 trips in Cork (down 3.2%), 23,758 in Galway (up 75%) and 32,481 in Limerick (down 1.2%).
Dublin had by far the highest number of annual subscriptions at 67,023 in 2017 compared with 11,278 in Cork, 3,312 in Galway and 2,955 in Limerick. Dublin also had by far the highest number of journeys per bike at 2,904 in 2016.
0
50
100
150
200
250
300
0
100
200
300
400
500
600
700
800
2012 2013 2014 2015 2016 2017
To
tal S
pe
nd
on
Le
ap
(€m
)
Nu
mb
er
of
Ca
rds
Issu
ed
(Th
ou
san
d)
Leap Cards Issued & Total Spend, 2012-2017
Total Leap Cards Issued
Sum of Top-ups plus tickets purchased (Value) Source: NTA
-
100
200
300
400
500
600
0
20
40
60
80
100
120
140
2015 2016 2017
Av
g D
aily
Re
qu
est
s (D
ec)
Th
ou
san
ds
An
nu
al R
eq
ue
sts
(Mil
lion
s)
Real-time Passenger Information Requests, 2015-2017
Annual Total Average Daily Use December
Source: NTA
4,104
281 24 32
0
500
1,000
1,500
2,000
2,500
3,000
3,500
4,000
4,500
Dublin Cork Galway Limerick
Th
ou
san
ds
Annual Public Bike Journeys 2015-2017
2015 2016 2017
Source::
CSO
2017 data
from DCC/NTA
16 Transport Trends 2018
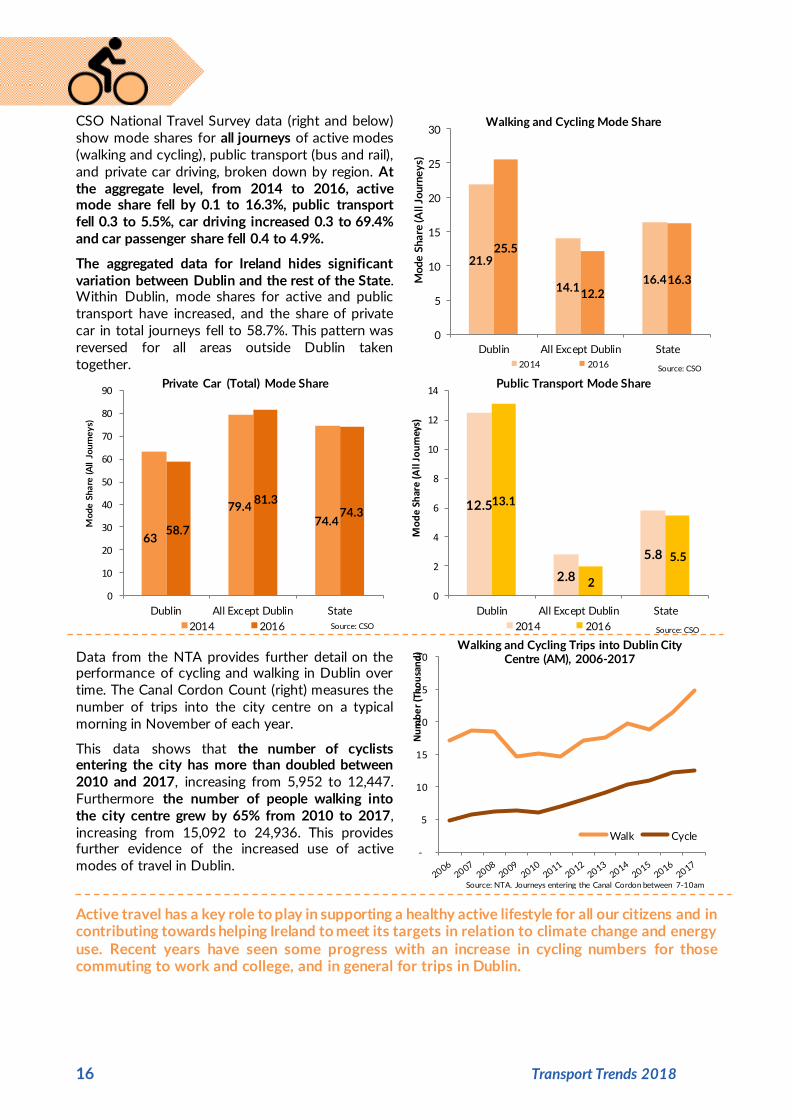
CSO National Travel Survey data (right and below) show mode shares for all journeys of active modes (walking and cycling), public transport (bus and rail), and private car driving, broken down by region. At the aggregate level, from 2014 to 2016, active mode share fell by 0.1 to 16.3%, public transport fell 0.3 to 5.5%, car driving increased 0.3 to 69.4% and car passenger share fell 0.4 to 4.9%.
The aggregated data for Ireland hides significant variation between Dublin and the rest of the State. Within Dublin, mode shares for active and public transport have increased, and the share of private car in total journeys fell to 58.7%. This pattern was reversed for all areas outside Dublin taken together.
Data from the NTA provides further detail on the performance of cycling and walking in Dublin over time. The Canal Cordon Count (right) measures the number of trips into the city centre on a typical morning in November of each year.
This data shows that the number of cyclists entering the city has more than doubled between 2010 and 2017, increasing from 5,952 to 12,447. Furthermore the number of people walking into the city centre grew by 65% from 2010 to 2017, increasing from 15,092 to 24,936. This provides further evidence of the increased use of active modes of travel in Dublin.
Active travel has a key role to play in supporting a healthy active lifestyle for all our citizens and in contributing towards helping Ireland to meet its targets in relation to climate change and energy use. Recent years have seen some progress with an increase in cycling numbers for those commuting to work and college, and in general for trips in Dublin.
21.9
14.1 16.4
25.5
12.2 16.3
0
5
10
15
20
25
30
Dublin All Except Dublin State
Mo
de
Sh
are
(All
Jo
urn
ey
s)
Walking and Cycling Mode Share
2014 2016 Source: CSO
63
79.4 74.4
58.7
81.3 74.3
0
10
20
30
40
50
60
70
80
90
Dublin All Except Dublin State
Mo
de
Sh
are
(A
ll Jo
urn
ey
s)
Private Car (Total) Mode Share
2014 2016 Source: CSO
12.5
2.8
5.8
13.1
2
5.5
0
2
4
6
8
10
12
14
Dublin All Except Dublin State
Mo
de
Sh
are
(All
Jo
urn
eys)
Public Transport Mode Share
2014 2016 Source: CSO
-
5
10
15
20
25
30
Nu
mb
er
(Th
ou
san
d)
Walking and Cycling Trips into Dublin City Centre (AM), 2006-2017
Walk Cycle
Source: NTA. Journeys entering the Canal Cordon between 7-10am

Transport Trends 2018 17
Ireland’s road and rail networks also play a vital role for economic activity by facilitating the movement of goods around the country. Road freight activity grew strongly in 2016, but despite a marginal increase in 2016, the rail freight sector remains at a low level, carrying less than 1% of all freight.
The most recent Irish road freight data shows very strong growth in 2016 and continued recovery from the low activity levels of the recession. Road freight activity (measured by total road freight tonne-kilometres) peaked at 18.7 billion tonne-km in 2007 before facing a marked decline to 9.1 billion tonne-km, in 2013. Road freight tonne-km grew by 17% from 9.8 billion in 2015 to 11.6 billion in 2016. However it remains 38% below the Celtic Tiger peak.
The total volume of freight transported by road increased by 20% to 141.7 million tonnes in 2016, but it remains less than half the peak of 299.3 million tonnes in 2007.
The distribution by type of freight carried on the Irish road network showed some significant changes in 2016.
The elements of road freight measured in tonne-km which saw the biggest increases in 2016 were deliveries to road works or building sites which rose 53% to 1.5 billion tonne-kms and deliveries to factories which rose 41% to 1.6 billion tonne-kms.
The primary elements of road freight activity remain deliveries to retail/wholesale outlets (27% or 3.2 billion tonne-km) and import/export work (21% or 2.4 billion tonne-km.
Some Irish freight is also carried in Ireland on the heavy rail network, although rail freight quantities are very small (0.4% of total freight tonnage in Ireland) and have declined sharply over recent decades, as a direct result of substantially reduced journey times on Ireland’s roads following Government investment in motorways and national roads around the turn of this century. Data from the CSO shows that the total tonnage of goods carried by rail marginally increased in 2016 to 581,000 tonnes.
In terms of tonne-kms - i.e. total tonnage of Irish freight multiplied by distance travelled - the data shows that rail now accounts for less than 1% of Ireland’s total land freight (11.7bn tonne-km). This compares with an average of 4.8% in the EU.
-
2
4
6
8
10
12
14
16
18
20
19
99
20
00
20
01
20
02
20
03
20
04
20
05
20
06
20
07
20
08
20
09
20
10
20
11
20
12
20
13
20
14
20
15
20
16
To
tal T
on
ne
-Km
s (B
illi
on
)
Total Road Freight Tonne km, 1999-2016
Road Freight Tonne-Kms Source: CSO
21%
8%
13%
27%
14%
2% 15%
Road Freight Tonne km by main use, 2016
Import/export work
Agricultural goods
Delivery to roadworks/ build ingsitesDelivery toretai lers/wholesalersDelivery ofmaterials/ fuels tofactoriesDelivery tohouseholds
Other
Source: CSO
0.0
0.5
1.0
1.5
2.0
2.5
3.0
3.5
19
86
19
88
19
90
19
92
19
94
19
96
19
98
20
00
20
02
20
04
20
06
20
08
20
10
20
12
20
14
20
16
Fri
eg
ht
(Mil
lio
n T
on
ne
s) Total Rail Freight Carried,
1986-2016
Rail Freight Source: CSO
Land Transport – Freight
18 Transport Trends 2018
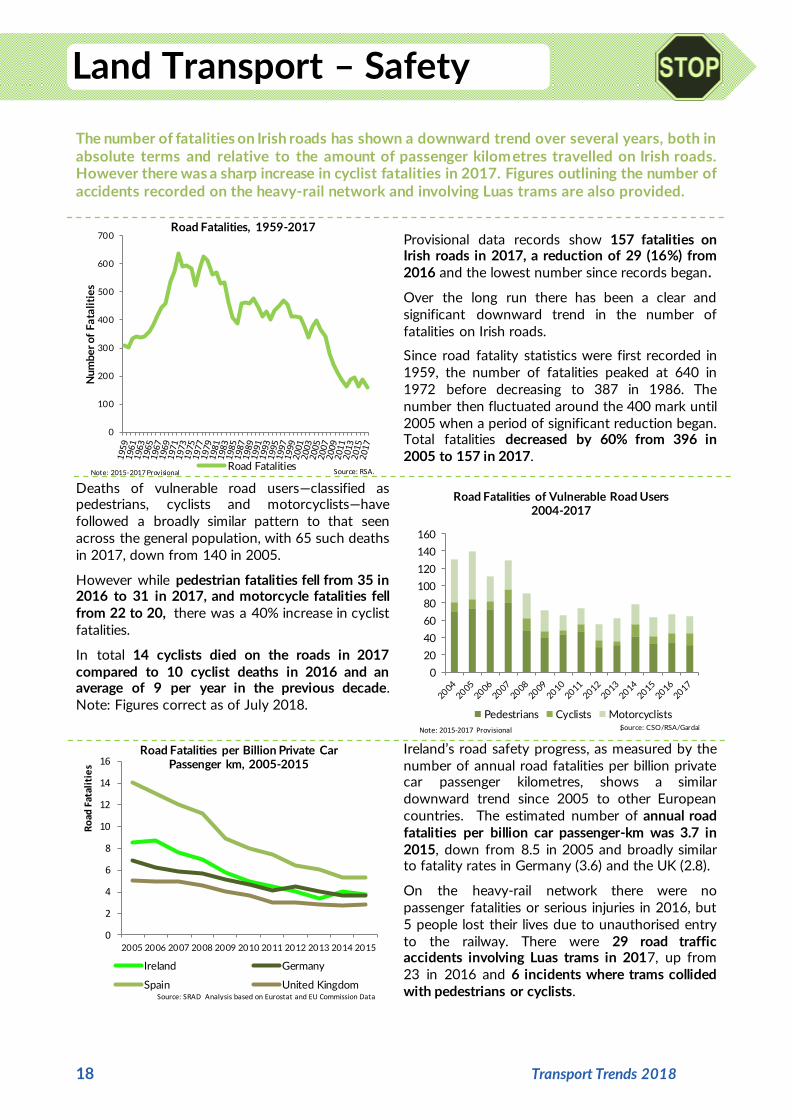
The number of fatalities on Irish roads has shown a downward trend over several years, both in absolute terms and relative to the amount of passenger kilometres travelled on Irish roads. However there was a sharp increase in cyclist fatalities in 2017. Figures outlining the number of accidents recorded on the heavy-rail network and involving Luas trams are also provided.
Provisional data records show 157 fatalities on Irish roads in 2017, a reduction of 29 (16%) from 2016 and the lowest number since records began.
Over the long run there has been a clear and significant downward trend in the number of fatalities on Irish roads.
Since road fatality statistics were first recorded in 1959, the number of fatalities peaked at 640 in 1972 before decreasing to 387 in 1986. The number then fluctuated around the 400 mark until 2005 when a period of significant reduction began. Total fatalities decreased by 60% from 396 in 2005 to 157 in 2017.
Deaths of vulnerable road users—classified as pedestrians, cyclists and motorcyclists—have followed a broadly similar pattern to that seen across the general population, with 65 such deaths in 2017, down from 140 in 2005.
However while pedestrian fatalities fell from 35 in 2016 to 31 in 2017, and motorcycle fatalities fell from 22 to 20, there was a 40% increase in cyclist fatalities.
In total 14 cyclists died on the roads in 2017 compared to 10 cyclist deaths in 2016 and an average of 9 per year in the previous decade. Note: Figures correct as of July 2018.
Ireland’s road safety progress, as measured by the number of annual road fatalities per billion private car passenger kilometres, shows a similar downward trend since 2005 to other European countries. The estimated number of annual road fatalities per billion car passenger-km was 3.7 in 2015, down from 8.5 in 2005 and broadly similar to fatality rates in Germany (3.6) and the UK (2.8).
On the heavy-rail network there were no passenger fatalities or serious injuries in 2016, but 5 people lost their lives due to unauthorised entry to the railway. There were 29 road traffic accidents involving Luas trams in 2017, up from 23 in 2016 and 6 incidents where trams collided with pedestrians or cyclists.
0
100
200
300
400
500
600
700
Nu
mb
er
of
Fa
tali
tie
s
Road Fatalities, 1959-2017
Road FatalitiesSource: RSA. Note: 2015-2017 Provisional
0
20
40
60
80
100
120
140
160
Road Fatalities of Vulnerable Road Users 2004-2017
Pedestrians Cyclists MotorcyclistsSource: CSO/RSA/Gardai Note: 2015-2017 Provisional i Note: 2015-2017 Provisional
0
2
4
6
8
10
12
14
16
2005 2006 2007 2008 2009 2010 2011 2012 2013 2014 2015
Ro
ad F
atal
itie
s
Road Fatalities per Billion Private Car Passenger km, 2005-2015
Ireland Germany
Spain United KingdomSource: SRAD Analysis based on Eurostat and EU Commission Data
Land Transport – Safety

Transport Trends 2018 19
The aviation sector is critical to Ireland’s connectivity to the rest of the world for travel, business and tourism. This section reviews the primary data and describes the overarching trends and dynamics in relation to airport infrastructure, passenger and flight traffic trends, and movement of freight by air.
Total Passengers Handled at State and Regional Airports, 2017
State Airports Dublin: 29.5 million
Cork: 2.3 million
Shannon: 1.6 million
Regional Airports Knock: 748,505
Kerry: 335,480
Donegal: 46,514
Source: CSO
Ireland’s aviation infrastructure is divided into two distinct categories of airports, as set out by the National Aviation Policy published in August 2015. State Airports – Dublin, Cork and Shannon – are the primary gateways through which air traffic accesses Ireland. Regional Airports – Ireland West Airport Knock, Kerry and Donegal– are important for improving connectivity to their areas. Commercial flights to Waterford ceased in June 2016.
With the exception of Shannon which saw a 4.5% drop, all of these airports saw increases in passenger traffic from 2016 to 2017, with Dublin reporting the highest growth of 6%.
Ireland has one of the highest levels of air traffic per inhabitant in the EU, Eurostat data shows. There were 6.9 passengers carried per inhabitant in Ireland in 2016 compared to an average of 1.9 in the EU. This is behind only Malta and Cyprus and considerably higher than the UK (3.8), Germany (2.4) and France (2.2).
A comparison of Ireland’s airport infrastructure internationally shows that Ireland has a similar number of airports to other European countries with a comparable population. Eurostat data for 2015 shows Ireland has 5 airports with more than 150,000 annual passenger movements, similar to Denmark and Croatia which have 5 airports each, Finland has 9, and Slovakia has only 2.
Having fallen from a peak of 283,500 in 2007 to 202,300 in 2012, the total number of commercial flights handled has now rebounded to 254,400 in 2017. This is an increase of 2.9% on 2016 levels.
Dublin Airport handled 212,248 flights in 2017, which was 3.7% higher than in 2016, while Cork handled 19,705 flights, down 1%. Shannon handled 13,229 flights, down 2.2%, and Kerry and Knock both saw small declines to 3,200 and 5,989 flights respectively. Thus Dublin increased its share of total flights to 83.4%, Cork’s dipped slightly to 7.7% and Shannon’s share fell to 5.2%.
0
2
4
6
8
10
12
Pa
sse
mg
ers
pe
r ca
pit
a
Air passengers per inhabitant in EU, 2016
Source: Eurostat
0
50
100
150
200
250
300
2007 2008 2009 2010 2011 2012 2013 2014 2015 2016 2017
Flig
hts
(T
ho
usa
nd
)
Commercial Flights at Main Irish Airports, 2007-2017
Dublin Cork Shannon OtherSource: CSO. Other: Kerry, Knock and Galway
Aviation

20 Transport Trends 2018
The total number of passengers handled at Irish airports continues to grow. In 2017, total passengers handled reached 34.5 million, a 5.1% annual increase. Growth has been such that from a low of 23.7 million in 2011, total numbers have now exceeded the 2007 peak of 31.5 million.
Dublin Airport accounted for 85.4% of all passengers in 2017 at 29.5 million, up 6% on 2016, with numbers now exceeding the previous peak of 23.5 million in 2008. Passenger numbers at other airports have generally shown less marked increases, with Shannon seeing a 4.5% drop to 1.6m passengers in 2017. Eurostat figures show Dublin Airport was the 12th busiest in the EU in 2016 and the 10th busiest for international journeys.
Strong renewed growth can also be seen in the total amount of freight handled at Ireland’s main airports, which increased by 11.7% from 146,800 tonnes in 2016 to 164,000 in 2017. This follows a decline from 145,500 in 2006 to 117,200 tonnes in 2009, and a staggered return to growth. Air freight accounts for a tiny share by weight of all freight exported or imported from Ireland but includes much high-value merchandise such as pharmaceuticals.
Dublin Airport handled 144,900 tonnes of air freight in 2017, up 8% and accounting for 88.4% of total air freight in Ireland. Cork handled 28,000 tonnes, up from 0 in 2016 and Shannon handled 19,000 tonnes.
Data from the Irish Aviation Authority (right) shows that only 26% of air traffic handled in Ireland in 2017 were flights into or out of terminals at Irish airports. Flights through Irish airspace (overflights) make up 29% of the total, with North Atlantic Communications (NAC) flights (over oceanic airspace) constituting the remaining 44%. All overflights are handled by Shannon Area Control Centre.
Flights handled by Irish air traffic control increased by 2.5% from 2016 to 2017, with the total number increasing to over 1.14 million. The largest increase was in NAC flights at 5%.
Whether measured by commercial flights handled, passengers handled or air freight tonnes handled, it is clear that Ireland’s aviation sector is exhibiting strong and co ntinued aggregate growth. This pattern is dominated by activity at Dublin Airport, which is responsible for over four-fifths of activity in Ireland on the above measures.
-
5
10
15
20
25
30
35
40
2008 2009 2010 2011 2012 2013 2014 2015 2016 2017
Pas
sen
gers
(Mil
lio
n)
Total Passengers Handled (Million), 2008-2017
Dublin Cork Shannon Other Source: CSO
0
50
100
150
200
250
2007 2008 2009 2010 2011 2012 2013 2014 2015 2016 2017
Air
Fre
igh
t (T
ho
usa
nd
To
nn
es)
Total Air Freight Handled at Main Airports, 2007-2017
Dublin Cork Shannon Source: CSO
290,388 291,184
341,082 343,977
476,790 500,684
0
200,000
400,000
600,000
800,000
1,000,000
1,200,000
2016 2017
Fli
gh
ts
Flights Handled by Irish Air Traffic Control, 2016-2017
Terminal Overflights NAC Source: IAA

Transport Trends 2018 21
Although the details of the final outcome have yet to be determined, the exit of the United Kingdom from the European Union is likely to have some impact on Ireland, including in the transport sector. This section aims to highlight some of the key connections between Ireland, the UK and the EU, beginning with analysis of passenger movements between Irish airports and international destinations, and the prominence of UK traffic at Irish airports.
Though air traffic to and from the UK remains vital for Ireland, more passengers are moving between the EU27 and Irish airports than are moving between the UK and Ireland. This has been the case for the last decade and the gap between EU27 and UK passengers to/from Ireland’s main airports widened to almost 4 million in 2017. The number of EU27 passengers grew from 15.7 million to 16.8 million, an increase of 7.4%, while UK passenger numbers increased by 0.5% to 12.8 million.
Elsewhere the number of passengers moving between Irish airports and the USA increased by 18% to 3.3 million in 2017. Passenger numbers to other regions fell by 2% in 2017 to 1.3 million.
Ireland’s aviation sector is the most heavily dependent on UK traffic of any EU country, according to 2016 data. Over 39% of Irish passenger traffic was to or from the UK, compared with just 6.9% of passenger traffic in Germany and 7.9% in France. Cyprus was the country with the next highest dependency on UK traffic at 30.6%. The EU27 average was 15.7%.
CSO data for 2017 indicates that Ireland’s dependency on UK traffic has fallen slightly to 37.5% due to higher growth in passenger numbers to/from the EU27 and the USA, but it still remains by far the biggest country source of aviation traffic to/from Ireland.
Dublin, Top Routes and % of Passengers 2017
London-Heathrow 1,804,020 6.1%
London-Gatwick 1,367,593 4.6%
Amsterdam Schiphol 1,087,324 3.7%
Manchester 979,625 3.3%
Birmingham 912,049 3.1%
London-Stansted 891,229 3.0%
Paris- Charles de Gaulle 713,939 2.4%
Edinburgh 618,427 2.1%
New York – JFK 595,745 2.0%
Barcelona 572,331 1.9%
All passengers 29,454,474 100%
In 2017, the busiest routes to and from Dublin Airport continued to be centred on the UK which accounted for 6 of the top 10 routes, transporting 6.6 million passengers, over 60% of whom travelled between Dublin and London. Heathrow continued to be by far the busiest route for Dublin Airport, serving 1.8 million passengers in 2017, a rise of 3%. Eurostat figures for 2016 show Dublin/Heathrow is in the top 10 busiest airport pairs within the EU and the only non-domestic route on that list. Gatwick and Edinburgh had increased passenger traffic to/from Dublin in 2017, but there were slight declines to/from Manchester, Birmingham and Stansted.
-
2
4
6
8
10
12
14
16
18
2006 2007 2008 2009 2010 2011 2012 2013 2014 2015 2016 2017
Pa
sse
ng
ers
Ha
nd
led
(Mil
lion
)
Total Passengers Handled by Region 2006-2017
United Kingdom USA EU27 Other
Source: CSO
0%
5%
10%
15%
20%
25%
30%
35%
40%
45%
Aviation Sector Dependency Rate on UK Passenger Traffic, 2016
Source: Eurostat/SRA
BREXIT
22 Transport Trends 2018
The importance of the UK to Cork Airport is also clear with six British airports accounting for 1.17 million passengers, i.e. over 50% of its passenger traffic in 2017.
Links between London and Cork were particularly important as Heathrow, Stansted and Gatwick comprised 3 of its top 4 routes, accounting for 891,474 passengers or 38.7% of the total. Manchester was the fastest growing of the UK routes to/from Cork in 2017 with passenger numbers up 26.2%. Traffic with Gatwick rose by 13.6% and the numbers travelling between Cork and Liverpool rose by 12.8%. Traffic with Heathrow rose 2.8% and with Stansted by 4%.
Cork, Top Routes and % of Passengers 2017
London-Heathrow 401,315 17.4%
London-Stansted 353,001 15.3%
Amsterdam Schipol 168,146 7.3%
London-Gatwick 137,158 6.0%
Malaga 125,585 5.5%
Manchester 114,610 5.0%
Lanzarote 105,886 4.6%
Paris – Charles de Gaulle 105,542 4.6%
Liverpool – John Lennon 90,620, 3.9%
Birmingham 77,545 3.4%
All destinations 2,301,450 100%
Shannon, Top Routes and % of Passengers, 2017
London-Heathrow 271,203 17.0%
London-Stansted 198,817 12.4%
New York –JFK 130,662 8.1%
Knock, Top Routes and % of Passengers, 2017
London-Stansted 158,854 21.2%
London-Luton 130,118 17.4%
Liverpool – John Lennon 85,416 11.4%
Kerry, Top Routes and % of Passengers, 2017
London-Luton 111,713 33.3%
London-Stansted 77,963 23.2%
Frankfurt-Hahn 54,745 16.3%
Shannon Airport’s main routes in 2017 were with the UK and the USA. Four of its top 10 routes were located in the UK accounting for 660,468 or 41.2% of all passenger traffic. Its 4 main US routes delivered 349,184 passengers or 21.8% of the total. Routes to the UK dominated Knock Airport’s passenger traffic in 2017, accounting for 9 of the top 10 routes and over 85% of traffic. At Kerry Airport meanwhile the routes to/from Luton and Stansted continued to dominate accounting for 56.5% of passenger traffic in 2017.
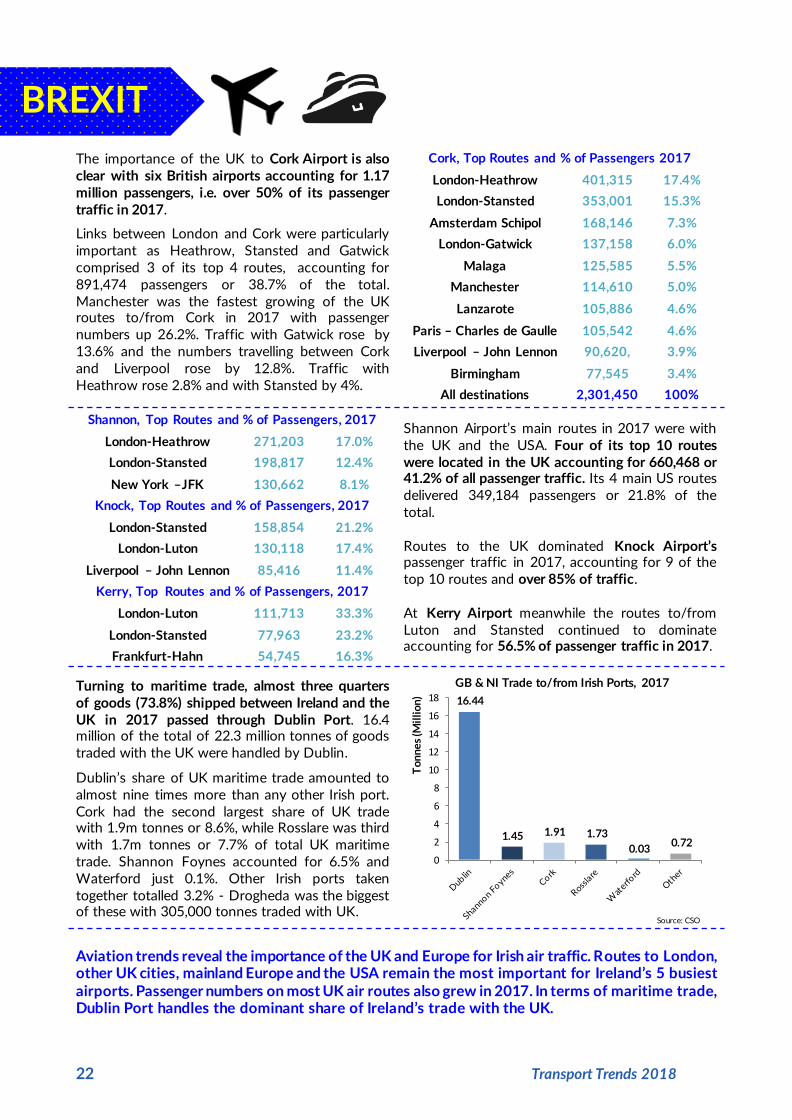
Turning to maritime trade, almost three quarters of goods (73.8%) shipped between Ireland and the UK in 2017 passed through Dublin Port. 16.4 million of the total of 22.3 million tonnes of goods traded with the UK were handled by Dublin.
Dublin’s share of UK maritime trade amounted to almost nine times more than any other Irish port. Cork had the second largest share of UK trade with 1.9m tonnes or 8.6%, while Rosslare was third with 1.7m tonnes or 7.7% of total UK maritime trade. Shannon Foynes accounted for 6.5% and Waterford just 0.1%. Other Irish ports taken together totalled 3.2% - Drogheda was the biggest of these with 305,000 tonnes traded with UK.
Aviation trends reveal the importance of the UK and Europe for Irish air traffic. Routes to London, other UK cities, mainland Europe and the USA remain the most important for Ireland’s 5 busiest airports. Passenger numbers on most UK air routes also grew in 2017. In terms of maritime trade, Dublin Port handles the dominant share of Ireland’s trade with the UK.
16.44
1.45 1.91 1.73
0.03 0.72
0
2
4
6
8
10
12
14
16
18
To
nn
es
(Mil
lio
n)
GB & NI Trade to/from Irish Ports, 2017
Source: CSO
BREXIT
Transport Trends 2018 23
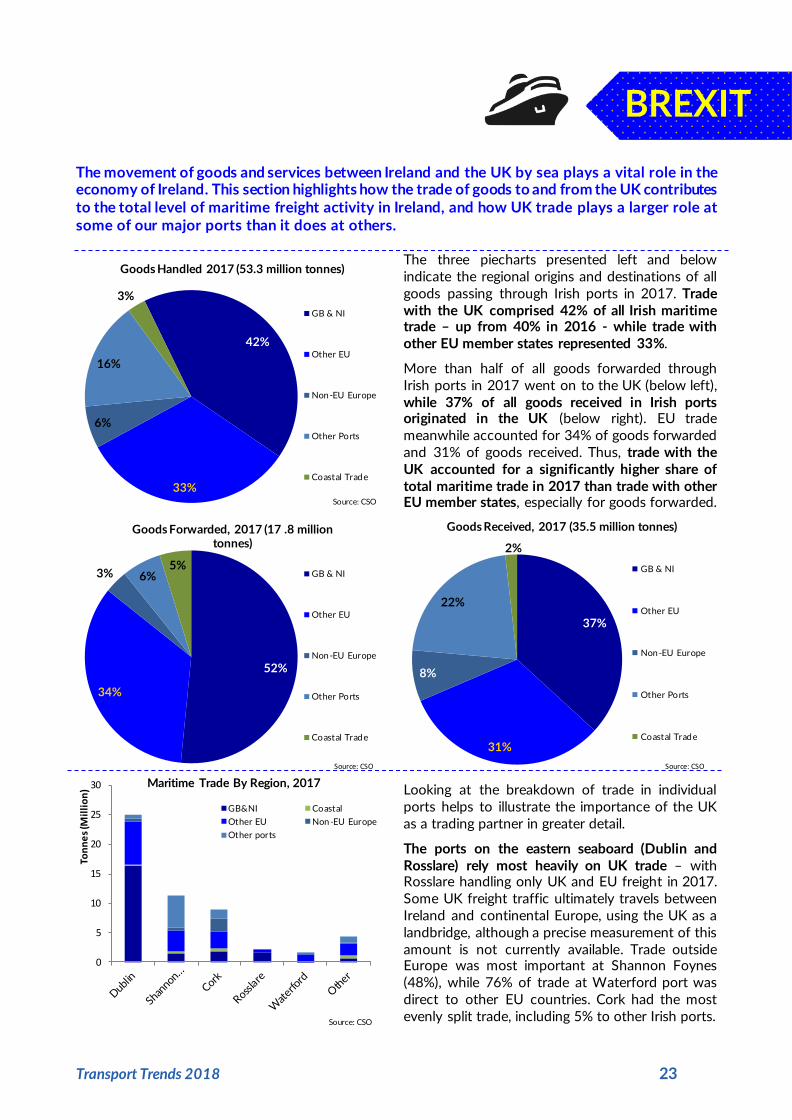
The movement of goods and services between Ireland and the UK by sea plays a vital role in the economy of Ireland. This section highlights how the trade of goods to and from the UK contributes to the total level of maritime freight activity in Ireland, and how UK trade plays a larger role at some of our major ports than it does at others.
The three piecharts presented left and below indicate the regional origins and destinations of all goods passing through Irish ports in 2017. Trade with the UK comprised 42% of all Irish maritime trade – up from 40% in 2016 - while trade with other EU member states represented 33%.
More than half of all goods forwarded through Irish ports in 2017 went on to the UK (below left), while 37% of all goods received in Irish ports originated in the UK (below right). EU trade meanwhile accounted for 34% of goods forwarded and 31% of goods received. Thus, trade with the UK accounted for a significantly higher share of total maritime trade in 2017 than trade with other EU member states, especially for goods forwarded.
Looking at the breakdown of trade in individual ports helps to illustrate the importance of the UK as a trading partner in greater detail.
The ports on the eastern seaboard (Dublin and Rosslare) rely most heavily on UK trade – with Rosslare handling only UK and EU freight in 2017. Some UK freight traffic ultimately travels between Ireland and continental Europe, using the UK as a landbridge, although a precise measurement of this amount is not currently available. Trade outside Europe was most important at Shannon Foynes (48%), while 76% of trade at Waterford port was direct to other EU countries. Cork had the most evenly split trade, including 5% to other Irish ports.
42%
33%
6%
16%
3%
Goods Handled 2017 (53.3 million tonnes)
GB & NI
Other EU
Non-EU Europe
Other Ports
Coastal Trade
Source: CSO
52%
34%
3% 6% 5%
Goods Forwarded, 2017 (17 .8 million tonnes)
GB & NI
Other EU
Non-EU Europe
Other Ports
Coastal Trade
Source: CSO
37%
31%
8%
22%
2%
Goods Received, 2017 (35.5 million tonnes)
GB & NI
Other EU
Non-EU Europe
Other Ports
Coastal Trade
Source: CSO
0
5
10
15
20
25
30
Ton
ne
s (M
illi
on
)
Maritime Trade By Region, 2017
GB&NI Coastal
Other EU Non-EU Europe
Other ports
Source: CSO
BREXIT

24 Transport Trends 2018
Irish ports provide the infrastructure which allows the movement of goods and people between Ireland and other countries by sea. This section provides an overview on the maritime sector in Ireland including details on port and vessel infrastructure, maritime freight statistics and maritime passenger trends.
Total Freight Handled at Tier 1 and Tier 2 Ports, 2017
Tier 1 Ports
Dublin Port: 25.0 million tonnes
Shannon Foynes: 11.3 million tonnes
Port of Cork: 9.0 million tonnes
Tier 2 Ports
Rosslare Europort: 2.2 million tonnes
Port of Waterford: 1.6 million tonnes
Source: CSO
Ireland’s National Ports Policy classifies three ports as ‘Tier 1 Ports of National Significance’: Dublin Port, Port of Cork and Shannon Foynes. There are two ports classified as ‘Tier 2 Ports of National Significance’: the Port of Waterford and Rosslare Europort. Other commercial ports are classified as ‘Ports of Regional Significance’ with the largest in freight terms (based on 2017 data) being Drogheda, Bantry Bay, Greenore, Galway and New Ross.
There are 11 other ports nationwide where statistics for the carriage of goods and passengers are reported to the CSO.
The number of vessels arriving at Irish ports fell by 0.6% in 2017 to 12,829 vessels, while the gross tonnage of vessels rose 1.7% to 243 million tonnes, the highest it has ever been.
In general, there has been a pattern of fewer, but larger vessels arriving at Irish ports since 2000. Despite a modest increase in the number of vessels arriving since 2012, the 2017 figure is still 29% below the high of just under 18,000 vessels in 2000. However, gross tonnage increased by 24% in that period despite a pronounced dip during the recession, indicating an overall trend of markedly bigger ships over the last two decades.
The large majority (72%) of the 12,829 ships arriving at Irish ports in 2017 was a general-type vessel, with container and liquid bulk vessels the next most common types, accounting for 10% and 8% respectively. Dry bulk vessels accounted for 6% of the total, and specialised vessels 2%. There were 217 passenger ship arrivals in 2017, also accounting for 2% of total arrivals.
There were 38 vessels (over 500 gross tonnage) in the internationally trading Irish merchant shipping fleet in June 2018, while the number of ships registered under the Irish flag stood at 3,347 (though not all are necessarily operating). Ireland’s ports receive ships registered to countries all across the globe.
-
2
4
6
8
10
12
14
16
18
20
-
50
100
150
200
250
300
20
01
20
02
20
03
20
04
20
05
20
06
20
07
20
08
20
09
20
10
20
11
20
12
20
13
20
14
20
15
20
16
20
17
Nu
mb
er
of
Arr
iva
ls (
Th
ou
san
d)
Gro
ss T
on
na
ge
of
Ve
sse
ls (
Mill
ion
)
Arrivals at Irish Ports, 2001-2017
Gross Tonnage of Arrivals Number of ArrivalsSource: CSO
1,054
789
1,240
210
9,271
217
Arrivals at Irish Ports by Vessel Type, 2017
Liquid bulk Dry bulk ContainerSpecialised General Passenger
Source: CSO Maritime Statistics
Maritime

Transport Trends 2018 25
2017 saw a 5.2% annual increase in the amount of freight handled to 53.3 million tonnes. This was the fourth consecutive year of growth but freight levels are still below the 2007 peak of 54.1 million. The data indicate that the drop in maritime freight after 2007 was largely driven by lower imports rather than lower exports: goods received decreased sharply and have still not fully recovered, whereas goods forwarded declined until 2009 but recovered quickly and are now well above their 2007 peak.
Dublin Port accounted for nearly half (46.9%) of all goods handled in 2017 (25 million tonnes). Shannon Foynes and Port of Cork handled 21.2% and 16.8% (11.3 and 9.0 million tonnes) respectively.
The types of maritime freight handled in 2017 remain similar to those in 2016. The largest element remains dry bulk at 31% of the total, with roll-on/roll-off (29%) and liquid bulk (23%) the next biggest. Lift-on/lift-off (14%) and break bulk/other (3%) make up the remainder.
Of the Tier 1 ports in 2016, Dublin handled the vast majority of both ro-ro (84%) and lo-lo (73%) freight that passed through Irish ports. Shannon Foynes handled a majority of dry bulk (59%), while Cork handled the biggest share of liquid bulk freight (45%). Most break bulk and other types of freight were handled at the other Irish ports.
International comparative data on maritime freight activity in 2016 shows little change on the previous year. Ireland’s freight tonnes handled per capita in 2016 was 10.7, down 0.9% from 2015, and still well below the peak of over 12 tonnes per capita each year from 2005 to 2007.
Ireland still ranks well above the EU28 average of 7.6 tonnes per capita in 2016, and remains above Spain (9.7), Portugal (8.8), the UK (7.4), and Italy (7.6). The most maritime freight per capita in 2016 was in the Netherlands (34.6 tonnes), Latvia (31.1) and Estonia (25.5) while outside the EU, Norway handled 38.2 tonnes per capita.
It is clear that the maritime sector holds a key role within the economy as an important gateway for the movement of freight between Ireland and its trading partners. The amount of freight handled in Irish ports grew by 5% in 2017. Ireland also remains above the European Union average for levels of maritime freight handled per capita (2016 figures).
0
10
20
30
40
50
60
Fre
igh
t (M
illi
on T
on
nes
)
Total Maritime Freight, 1997-2017
Goods Received Goods ForwardedSource: CSO
29%
14%
23%
31%
3%
Total Maritime Freight by Type, 2017
Roll-On/Roll-Off Traffic
Lift-On/Lift-OffTraffic
Liquid Bulk
Dry Bulk
Break Bulk andOther
Source: CSO
0 10 20 30 40
Poland
Romania
Germany
Bulgaria
France
Croatia
UK
EU 28
Italy
Malta
Portugal
Spain
Slovenia
Ireland
Cyprus
Lithuania
Greece
Denmark
Sweden
Finland
Belgium
Estonia
Latvia
Netherlands
Maritime Freight Tonnes Per Capita, 2016
Source: Eurostat

26 Transport Trends 2018
In addition to its role as an international gateway for imports and exports, the maritime sector is also an important facilitator of people travelling to and from Ireland. Our port network caters for travellers through both scheduled ferry services and cruise ship visits.
Ireland’s network of ports is a key gateway for international tourism and the movement of people. Data from the CSO shows the number of maritime passengers (excluding cruise passengers on excursion) handled at all Irish ports rose by 2.1% to 2.8 million between 2016 and 2017.
Eurostat figures (left) which include all cruise passengers handled at Irish ports indicate total Irish maritime passenger traffic fell 15% between 2007 and 2016, while total EU maritime passenger traffic fell 10% in that period. The CSO figures for 2017 are also shown in the graph for reference, but are not precisely comparable to the 2007-2016 Eurostat figures depicted.
The cruise ship sector is an increasingly important element of Irish maritime activity. The number of cruise ship visits grew by 12% from 209 in 2016 to 234 in 2017, while the number of cruise ship passengers rose by 19% to 264,763 in 2017. Cruise passenger numbers have more than doubled since 2007 when 130 ships visited, bringing 105,725 passengers.
Dublin and Cork dominated the cruise ship market in 2017, hosting 83% of ship visits and 93% of passengers between them, CSO data shows. With 127 cruise ships visits (up from 109 in 2016), Dublin accommodated over half the cruise vessels visiting the Republic of Ireland.
Dublin Port’s share of cruise ship traffic increased to 55% of all passengers in 2017, with its numbers rising by 33% to 146,429 passengers. Cork had a 19% increase in ship visits to 68 and 10.7% growth in passenger numbers to 99,263. Bantry Bay also saw strong growth with 2,388 cruise passengers visiting, up from 174 the year before, and Galway saw passengers numbers more than double to 3,691. Killybegs meanwhile had 16% growth to 7,209 visitors on 12 ships. However Dun Laoghaire had an 83% decline in cruise passenger visits to 1,083, despite having just one ship fewer than in 2016. Waterford had 37% fewer cruise passengers than in 2016 at 4,710.
0.0
0.5
1.0
1.5
2.0
2.5
3.0
3.5
To
tal
Ma
riti
me
Pa
sse
ng
ers
(M
illio
n)
Total Maritime Passengers Handled, 2007-2017
Inwards OutwardsSource: Eurostat,
*2017 CSO
0
50
100
150
200
250
300
0
50
100
150
200
250
Cru
sie
Sh
ip V
isit
s
Cru
ise
Pa
sse
ng
ers
(Th
ou
san
d)
Cruise Ship and Passenger Visits, All Ports 2007-2017
Cruise Ships Visits Passenger VisitsSource: CSO
55%
38%
1% 2%
3% 0% 1%
Regional Breakdown of Cruise Passenger Visits, 2017
Dublin
Cork
Galway
Waterford
Killybegs
DunLaoghaire
Bantry Bay
Source: CSO

Transport Trends 2018 27
The transport sector is a large consumer of energy and as a result contributes signficantly towards national greenhouse gas emissions. This section profiles the role of transport in relation to climate change and highlights key trends and measures aimed at reducing emissions.
The transport sector emitted 12.29 million tonnes of CO2 equivalent in 2016. This was a 3.9% increase on 2015 levels and the fourth consecutive annual increase since 2012. The sector is the third largest contributor to national greenhouse gas emissions at 20% after agriculture (32.3%) and energy (20.4%).
By 2020 the EPA estimates that the transport sector will emit 14.56 Mt CO2eq with current policy measures. Transport sector emissions are projected to increase by 2.1% between 2020 and 2035, as a rising population, employment growth and increased transport use offsets mitigation measures. It projects that additional measures could reduce that emissions growth to 0.14%.
The majority of transport CO2 emissions arise from road transport. Of this, private car use accounted for 52% in 2016 with goods vehicles contributing 26%. The other main component is fuel tourism at 10% (i.e. fuel purchased for use in another jurisdiction, mainly Northern Ireland).
There is a clear divide in transport emissions before and after 2007, mainly due to the economic recession. HGV road freight grew by 229% between 1990 and 2007 followed by a sharp contraction between 2007 and 2016 (-37%). Private car CO2 emissions grew by 127% from 1990-2007, and despite a shortlived fall, grew by 2% between 2007 and 2016.
The share of greenhouse gas emissions contributed by transport is broadly similar in Ireland at 19.8% compared to 21% in the EU28 (2015 figures). whereas agriculture has a higher share in Ireland (32% versus 10%), but energy and industry contribute less than the EU average The breakdown of emissions within transport is also similar with road contributing slightly more in Ireland at 76% compared with 73% in the EU28. Aviation contributed more in Ireland than the EU average (17% to 13%) and maritime contributed less (5% to 13%). These latter figures for emissions include international aviation and maritime, which are not counted under national totals.
0
2
4
6
8
10
12
14
16
18
19
90
19
95
20
00
20
05
20
07
20
08
20
09
20
10
20
11
20
12
20
13
20
14
20
15
20
16
20
17
20
20
20
25
20
30
20
35
MT
CO
2e
q
Transport Sector Emissions Profile, 1990-2035
Historical Current Policy Additional Measures
Source: EPA
0
5
10
15
Mt
CO
2
Transport CO2 Emissions by Mode, 1990-2016
HGV Private car Public Passenger
Rail Dom. Aviation Fuel Tourism
Navigation Unspecified LGV
Source: SEAI
76% 73%
17% 13%
5%
13%
1% 1% 1% 0%
0%
10%
20%
30%
40%
50%
60%
70%
80%
Ireland EU28
Emissions share by transport sector, Ireland and EU28, 2015
Road Aviation Maritime Rail Other Transport
Source: Eurostat/UNFCCC. Includes international aviation/maritime
Energy and Emissions

28 Transport Trends 2018
The system of linking VRT and Motor Tax to the CO2 emissions ratings of new cars has had a huge impact on buyer behaviour since its introduction in 2008. In 2017 the share of new cars in the A and B emission bands was 95.6%, down slightly from 96.2% in 2016. Over three-quarters (76.7%) of new cars were in the A emission band in 2017, down from 78.1% in 2016 but up from 1.5% in 2007.
Provisional figures show the average emissions of new cars purchased in Ireland continued to fall in 2017, to 112.7g CO2/km. Irish emissions were 5% below the EU average in 2016. A more stringent new EU testing regime currently being phased in is expected to result in higher emissions readings.
Ireland has a target of ensuring 50,000 of its passenger and light commercial vehicles are electric vehicles (EVs) by 2020. Sales of EVs have been slow to catch on, though 2017 recorded the highest number of new registrations to date at 914, comprising 882 cars and 32 goods vehicles. These figures are comprised of 655 electric vehicles and 259 plug-in petrol or diesel hybrids.
The total number of EVs licensed rose by 47% in 2017 to 2,841. A nationwide programme to roll out EV charging points has begun with 1,200 having been installed to date in the Republic of Ireland, including 79 fast chargers, and discounted toll charges have been introduced for EV drivers.
The biofuels share of road transport energy has increased significantly over recent years from a very low base. Under the Biofuels Obligation Scheme (BOS) mineral oil suppliers are required to ensure that 8.695% (by volume) of the motor fuels they place on the market in Ireland is produced from renewable sources. A weighting system allows biofuels produced from wastes and residues qualify for 2 BOS certs per litre.
The weighted share of biofuels in transport energy (RES-T) in 2016 was 5%, down from 5.7% in 2015. It is halfway towards meeting the national 2020 target of 10%.
The economic downturn saw Ireland’s transport emissions decrease, but a return to growth has seen emissions rise again since 2012. Measures have been introduced which are having an impact in decarbonising transport, but much more remains to be done in order to meet emission reduction targets while supporting continued economic growth.
0%
20%
40%
60%
80%
100%
Shares of New Private Cars in Each Emissions Band, 2000-2017
A (<=120) B (121-140) C (141-155) D (156-170)
E (171-190) F (191-225) G (>225)Source: SEAI/CSO Statbank. Bands are grams of C02 Emissions per km
0
500
1000
1500
2000
2500
3000
0
100
200
300
400
500
600
700
800
900
1000
2007 2009 2011 2013 2015 2017
To
tal E
Vs
An
nu
all
y L
ice
nse
d E
Vs
EVs Licensed for the First Time, 2007-2017
Annual New Evs Total EVsSource:
CSO
0%
1%
2%
3%
4%
5%
6%
2006 2007 2008 2009 2010 2011 2012 2013 2014 2015 2016
Biofuels as a Proportion of Transport Energy, 2006-2016
Biofuel Penetration Weighted Biofuels ShareSource: SEAI

Transport Trends 2018 29
The following section lists a number of resources for transport related data and statistics.
This is not exhaustive of all sources but gives an indication of where information which
relates to transport can be found. Click each logo for direct link. Conditions of use as stated
with source.
Annual Publication of ‘Bulletin of Vehicle and
Driver Statistics’ Data and Information
provided in policy documentation
Annual Publication of Transport Omnibus, Various
Sectoral Surveys and Bulletins (Maritime, Freight, Aviation, Vehicle Licencing),
National Travel Survey every 2-3 years, Census
every 5 years
Publicly Available Expenditure Data at DPER
Databank
Government Open Data Portal
National Statistics Portal
On-Going Release and Publication of Transport
Statistics
TraTnsportTransport Data
Map Data Map
Transport Data Map

30 Transport Trends 2018
Annual Publication of ‘Statistical Pocketbook’ of Europe-Wide Transport
Indicators
Whole-of-Government Performance Data
Traffic Count Data Publicly Available. Number of Data-
Focused Publications
On-Going Publication of Statistical Reports and
Bulletins
Annual Publication of the ‘Irish Maritime Transport
Economist’
Data Portal for Energy Production, Transformation
and End Use in Ireland
Open Data for Dublin
Produces and Publishes a Number of Statistical Bulletins and Reports

Transport Trends 2018 31
This section provides relevant notes and references for the analysis contained with Transport
Trends 2018. Each individual section is directly hyperlinked to the original source where relevant.
This section should be used when interpreting the rest of this document’s contents. Any queries on
this analysis should be forwarded to [email protected].
Section One: General Overview
Economy and Transport Indicators: Transport passenger km from EU Commission. GNP and total
employment from the CSO. Transport emissions in Thousand Tonnes of CO2 equivalent from the EPA.
Fuel consumption by the transport sector in Thousand Tonnes of Oil Equivalent from SEAI. Private cars
under current license from the CSO.
Recent Sectoral Trends: From cited data from other sections of Transport Trends.
Exports plus Imports as a Percentage of GDP: Data from World Bank.
Percentage of Journeys by Mode of Travel: Data from CSO National Travel Survey.
Average Journey Distance and Duration: Data from CSO National Travel Survey.
Journeys by Main Purpose: Data from CSO National Travel Survey.
Mode Share of Land Transport Passenger Kilometres: Data from Eurostat. All data relates to 2015 and
represents the split between car, train and bus use.
Gross Expenditure by DTTaS (Non-Pay): Data from DPER Databank. All expenditure is gross and does
not include any pay or pensions. All expenditure is as reported on DPER Databank and includes only
expenditure as and when it was assigned to the Department (Maritime after 2005 and sports/tourism
after 2011). Gross expenditure refers to the overall Departmental spend as distinct from net expenditure
which refers to the overall drawdown from the Exchequer (this is lower than gross spend, because it
takes account of “appropriations-in-aid”, i.e. fees, levies and other receipts which Departments and
agencies may retain and use).
Investment in Inland Transport Infrastructure as a % of GDP: Data from the OECD. Due to the lack of
common definitions and accounting practices it is not possible to make defin itive comparisons between
countries. Thus, only consistent trends within the series are discussed. The figures for Ireland include an
OECD estimate for rail investment from 2008 as data incomplete. Full metadata information available at
original source. OECD average excludes Chile.
Taxation Revenue Associated with Transport: Estimation of revenue associated with the transport
sector provided by Department of Finance and Department of Housing, Planning, Community and Local
Government. Data for 2017 is provisional. Other potential sources of revenue that accrue to
government such as tolling, vat on car purchases and maintenance and Local Authority parking revenues
are not considered here.
Section Two: Land Transport – Network
Total Road km: National road data from the CSO. Regional and Local road estimate from DTTaS for
2016, motorway total for 2017 from TII.
Notes and References

32 Transport Trends 2018
Road km Per 1000 Inhabitants: Road length data from European Commission for 2015. Population data
also from European Commission. The data is not definitively comparable and are indicative only as some
road length data are Commission estimates and there is a variety of definitions.
Bus Operated Vehicle-km: Data for Dublin Bus and Bus Eireann from NTA Bus Statistics. Data for other
commercial services from NTA Commercial Bus Statistics.
Number of Buses Providing Services: Data from NTA. The format for collecting data on fleet size and
age changed between 2013 and 2014 and some discrepancies may have occurred. Rural transport
services are excluded because, in general, the buses used are mini buses.
Heavy Rail Service Provision: Data from NTA. Irish Rail figures do not include rail freight operations.
Section Three: Land Transport – Travel
Number of Vehicles Under License: Data from CSO and refers to 31st December of each year. 2017
total vehicles licensed is provisional from DTTaS. 2013 data for tractors and others were inflated by the
three month transition period for motor tax gapping provided for in the Non-Use of Motor Vehicles Act
2013.
Number of New Vehicles Licensed: Data from CSO Transport Omnibus. 2017 data from CSO release,
12 January 2018.
Passenger Cars Per 1000 Inhabitants: Data from Eurostat for 2016. Estimated European average
represents the 24 countries with available data in 2016.
Total Vehicle km: Data from CSO Transport Omnibus.
Small Public Service Vehicle Kilometres and Licenses: Vehicle km from CSO Transport Omnibus.
Number of active SPSV licenses from NTA Taxi Statistics.
Modal Share of All Journeys: Data from CSO National Travel Survey.
Commuting Trips by Public Transport: Data from CSO Census Place of Work, School or College.
Public Transport Passenger Journeys: Data for Bus Éireann, Dublin Bus, Irish Rail and Luas from CSO up
to 2016. 2017 data from NTA. Specific sources for each operator are listed below. Data on commercial
bus services and Rural Transport Programme from NTA Commercial Bus Statistics.
Leap Cards Issued and Total Spend: Data from NTA (by request).
Leap Card Journeys (as a Percentage of Total Passenger Journeys): Data from NTA (by request).
Real Time Passenger Information: Data from NTA (by request)
Luas Passenger Numbers: Data for 2007-2016 from CSO Transport Omnibus (including previous
editions). 2017 data is from the NTA.
Total Heavy Rail Passengers: Data for 2008-2016 from the CSO Transport Omnibus. 2017 data is from
the NTA. Decrease in passengers in mainline and other services and resultant increase in passengers in
Dublin suburban services in 2012 due to reclassification of Kildare, Navan and Wicklow previously
included in mainline services now included in Dublin suburban.
Dublin Bus Passengers: Data for 2007-2016 from CSO Transport Omnibus (and previous editions).
2017 total is provisional from NTA.

Transport Trends 2018 33
Bus Éireann Passengers: Data for 2007-2016 from CSO Transport Omnibus (and previous editions).
2017 PSO services is from NTA.
Public Bike Schemes: Data on numbers of bikes provided by NTA and DCC (by request). Data on
journeys and annual subscribers for Dublin and regional bike schemes available from CSO Transport
Omnibus.
Mode Shares – Dublin, non-Dublin and State: Data from CSO National Travel Survey.
Walking and Cycling Trips into Dublin City Centre: Data from NTA Canal Cordon Count
Section Four: Land Transport – Freight
Road Freight: Data from CSO Transport Omnibus.
Heavy Rail Freight Traffic: Rail freight data from the CSO Transport Omnibus.
Section Five: Land Transport – Safety
Road Fatalities: Data from the RSA for long run and for recent data. 2015, 2016 and 2017 data is
provisional and may be subject to revision.
Road Fatalities per Billion Private Car Passenger km: Data from Eurostat and European Commission.
Estimation of road fatalities per billion passenger km is compiled by SRA based on Eurostat road safety
data and European Commission road use data.
Section Six: Aviation
Airport Infrastructure Definition: From DTTaS National Aviation Policy (2015).
Number of Airports: Data is from Eurostat and airports are classified as being larger than 150,000
passenger movements annually.
Commercial Flights Handled: Data is from CSO Aviation Statistics. Main Airports is defined by CSO as
an airport through which in excess of 150,000 passengers fly per annum. The five main airports in
Ireland are Dublin, Cork, Shannon, Knock and Kerry.
Aviation Passengers Handled, Region and Routes: Data is from the CSO Aviation Statistics. CSO
Aviation Statistics are compiled from data supplied by all Irish airports with more than 15,000
passengers handled per year. The following Irish airports provide data to the CSO: Dublin, Cork,
Shannon, Kerry, Knock, Connemara, Donegal and Inishmore.
Air Freight: Data is from CSO Aviation Statistics.
Flights Handled by Irish Air Traffic Control: Data from IAA (by request).
Share of Aviation Traffic to/from UK: Eurostat
Section Seven: Maritime
GB & NI Trade To/From Irish Ports, 2017: Data is from CSO Maritime Statistics.
Goods Handled, Forwarded and Received at Irish Ports, 2017: Data from CSO Maritime Statistics.
Maritime Trade by Region, 2017: Data from CSO Maritime Statistics.

34 Transport Trends 2018
Port Infrastructure Definition: From DTTaS National Ports Policy (2013).
Total Freight Handled at Tier 1 and 2 Ports, 2017: Data from CSO Maritime Statistics.
Arrivals at Irish Ports 2017: Data from CSO Maritime Statistics.
Number of Ships Registered Under Irish Flag: DTTaS data as of June 2018.
Total Maritime Freight & Total Maritime Freight by Type 2017: Data from CSO Maritime Statistics.
Maritime Freight Handled Per Capita: Data from Eurostat.
Maritime Passengers: Data from Eurostat. A main port is a statistical port which has annual movements
of no less than 200,000 passengers or recording more than one million tonnes of cargo.
Cruise Ships and Passenger Visits 2017: Data from CSO Maritime Statistics.
Section Eight: Energy and Emissions
Transport Sector Emissions Profile: Data from EPA Greenhouse Gas Emissions Projections. The ‘With
Measures’ scenario includes the impact of VRT and Motor Tax changes, public transport efficiencies,
carbon tax, improved fuel economy of cars, 5.5% of transport energy demand coming from biofuels by
2020. The ‘With Additional Measures’ scenario assumes 8% of transport energy demand coming from
biofuels by 2020. It also includes the provisions of the Biofuels Obligation Scheme 2010 and the roll out
of electric vehicles (10,000 by 2020).
Shares of New Private Cars in Each Emissions Band: Data from SEAI Energy in Ireland (2017) and CSO
(2017).
Biofuels as a Proportion of Transport Energy: Data from SEAI Energy in Ireland (2017).
EVs Licensed for the First Time: Data from CSO. EV charging stations data provided by ESB.
Transport CO2 Emissions by Mode: Data from SEAI Energy in Transport (2014) with update supplied
directly from EPSSU.
Specific CO2 Emissions of New Cars: Data from SEAI Energy in Ireland (2016).