Statistics on waste managed by local authorities 2019 - GOV.UK

TABLE OF CONTENTSDepartment for Transport statistics
2012 TSGB web table number
Alternate DfT Statistics table
numberPage
number
Introduction 7
Transport Statistics Great Britain Statistics Release 9
Modal ComparisonsModal Comparisons Summary 21
Passenger transport
TSGB0101 Passenger transport: by mode 25
TSGB0102 Passenger journeys on public transport vehicles 26
TSGB0103 Average distance by mode NTS0305 27
TSGB0104 Average number of trips by purpose and main mode NTS0409 28
TSGB0105 Average distance travelled by purpose and main mode NTS0410 29
TSGB0106 People entering central London during the morning peak 30
TSGB0107 Passenger casualty rates by mode RAS53001 31
TSGB0108 Usual method of travel to work by region of residence 32
TSGB0109 Usual method of travel to work by region of workplace 33
TSGB0110 Time taken to travel to work by region of workplace 34
TSGB0111 Usual time taken to travel to work by region of workplace, usual method 35
TSGB0112 How workers usually travel to work by car by region of workplace 36
TSGB0113 Overseas travel: visits to and from the United Kingdom 37
TSGB0114 Overseas travel by air: visits to and from the UK: by area and purpose 38
TSGB0115 Overseas travel by sea and Channel Tunnel: visits to and from the UK by area, purpose and type of vehicle on board 39
Transport related employment
TSGB0116 All in employment in transport related occupations and industries 40
Transport expenditure and costs
TSGB0117 Public expenditure on transport by country and spending authority 41
TSGB0118 Public expenditure on transport by function 43
TSGB0119 Total UK public corporation capital expenditure on transport 44
TSGB0120 Public expenditure on specific transport areas: Great Britain 45
TSGB0121 Household expenditure on transport: 46
TSGB0122 Retail and consumer prices indices: motoring costs 47
TSGB0123 Retail Prices Index: transport components 48
TSGB0124 Gross domestic product and retail prices index deflators 49
TSGB0125 Fuel and vehicle excise duty 50
AviationAviation Summary 51
Activity at United Kingdom airports
TSGB0201 Traffic at UK airports AVI0101 55
TSGB0202 Air traffic by type of service, operator and airport AVI0102 56
TSGB0203 Punctuality at selected UK airports AVI0103 59
TSGB0204 Forecasts of terminal passengers at UK airports AVI0104 60
TSGB0205 International passenger movements at UK airports by country of embarkation or landing AVI0105 61
TSGB0206 Proportion of transfer passengers at selected UK airports AVI0106 62
TSGB0207 Mode of transport to selected UK airports AVI0107 63
TSGB0208 Purpose of travel at selected UK airports AVI0108 64
Activity of United Kingdom airlines
TSGB0209 UK airports (map) AVI0109 65
TSGB0210 Main outputs for UK airlines by type of service AVI0201 66
Major airports and airlines
TSGB0211 Worldwide employment by UK airlines AVI0203 67
TSGB0212 Traffic at major airports, worldwide AVI0301 68
TSGB0213 Passenger traffic on major airlines, worldwide AVI0302 69
Casualties and incidents
TSGB0214 Casualties caused by aviation accidents AVI0401 70
TSGB0215 Aircraft proximity (AIRPROX) number of incidents AVI0402 71
Energy and EnvironmentEnergy and Environment Summary 73
Transport energy consumption
TSGB0301 Petroleum consumption by transport mode and fuel type: United Kingdom ENV0101 76
TSGB0302 Energy consumption by transport mode and energy source: United Kingdom ENV0102 77
TSGB0303 Average new car fuel consumption: Great Britain ENV0103 78
TSGB0304 Average heavy goods vehicle fuel consumption: Great Britain ENV0104 79
TSGB0305 Petrol and diesel prices and duties in April, United Kingdom ENV0105 80
Greenhouse gas emissions fron transport
TSGB0306 Greenhouse gas emissions by transport mode: United Kingdom ENV0201 81
TSGB0307 Carbon dioxide emissions by transport mode: United Kingdom ENV0202 82
Local pollution from transport
TSGB0308 Air pollutant emissions by transport mode: United Kingdom ENV0301 83
TSGB0309 Average emissions from road vehicles in urban conditions ENV0302 85
TSGB0310 Aircraft noise: population affected by noise around major airports ENV0303 86
Transport Statistics Great Britain
Table of Contents 3

2012 TSGB web table number
Alternate DfT Statistics table
numberPage
number
FreightFreight Summary 89
Overall freight by mode
TSGB0401 Domestic freight transport: by mode: 1953 onwards 93
TSGB0402 Domestic freight moved: by commodity 94
TSGB0403 Domestic freight transport: by mode: 2000 onwards 95
Domestic and international road freight activity
TSGB0404 Goods lifted by type and weight of vehicle: annual 2004-2010, quarterly 2004-2011; by GB HGVs in UK RFS0106 96
TSGB0405 Goods moved by type and weight of vehicle: annual 1990-2010 and quarterly 2004-2011; by GB HGVs in the UK RFS0107 97
TSGB0407 Goods lifted and goods moved by mode of working: annual 1990-2010 and quarterly 2004-2011; by GB HGVs in the UK RFS0108 98
TSGB0411 International road haulage by UK-registered vehicles: goods lifted by country of unloading, 2000 onwards RFS0202 99
TSGB0412 International road haulage by UK-registered vehicles: goods lifted by country of loading, 2000 onwards RFS0203 100
TSGB0413 International road haulage by UK-registered vehicles: goods moved by country of unloading, 2000 onwards RFS0204 101
TSGB0414 International road haulage by UK-registered vehicles: goods moved by country of loading, 2000 onwards RFS0205 102
TSGB0415 International road haulage by UK-registered vehicles: tonnes lifted by commodity group, 2004 onwards RFS0206 103
TSGB0416 International road haulage by UK-registered vehicles: tonnes moved by commodity group, 2004 onwards RFS0207 104
TSGB0417 Goods lifted from the UK by foreign-registered HGVs, by vehicle registration country, 2002 onwards RFS0208 105
TSGB0418 Goods lifted to the UK by foreign-registered HGVs, by vehicle registration country, 2002 onwards RFS0209 106
TSGB0419 Goods moved from the UK by foreign-registered HGVs, by vehicle registration country, 2002 onwards RFS0210 107
TSGB0420 Goods moved to the UK by foreign-registered HGVs, by vehicle registration country, 2002 onwards RFS0211 108
TSGB0421 Cabotage within the UK by country of registration of vehicle, 2004 onwards RFS0212 109
TSGB0429 Average length of haul by type of vehicle: annual 1990-2010 and quarterly 2004-2011; by GB HGVs in the UK RFS0105 110
TSGB0430 Goods lifted by commodity grouping: annual 1990-2004 and quarterly 2004-2011; by GB HGVs in the UK RFS0103 111
TSGB0431 Goods moved by commodity: annual 1990-2010 and quarterly 2004-2011; by GB HGVs in the UK RFS0104 112
TSGB0432 Goods moved and goods lifted: annual 1990-2010 and quarterly 2004-2011; by GB HGVs in the UK RFS0101 113
TSGB0433 Summary of domestic and international road freight by UK HGVs: annual 2004-2010 and quarterly 2004-2011 RFS0144 114
Rail freight activity
TSGB0422 National Railways freight moved by commodity: 1996/97 onwards RAI0401 115
TSGB0423 National Railways freight lifted by commodity: 1996/97 onwards RAI0402 116
TSGB0424 Number of freight train movements, impacts on road haulage and Freight Performance Measure: 2005/06 onwards RAI0403 117
Road goods vehicles travelling to mainland Europe
TSGB0434 Road goods vehicles travelling to mainland Europe: 1990 onwards RORO0201 118
TSGB0435 Powered goods vehicles by country of registration: 1990 onwards RORO0301 119
MaritimeMaritime Summary 121
Ports
TSGB0501 All UK port freight traffic, foreign, coastwise and one-port by direction: from 1965 PORT0104 126
TSGB0502 All UK major port freight traffic by cargo type and direction: from 1994 PORT0106 127
TSGB0503 All UK port freight traffic by region and country: from 2000 PORT0103 129
TSGB0504 All UK ports unitised freight traffic, by type of freight unit: from 1970 PORT0203 130
TSGB0505 UK major port unitised traffic, including non-freight units, foreign and domestic by unit type PORT0205 131
TSGB0506 Accompanied passenger vehicles by port: from 1999 SPAS0401 132
TSGB0507 Accompanied passenger vehicles by route: from 1999 SPAS0402 133
Inland and coastal waters
TSGB0508 Waterborne transport within the United Kingdom: from 2001 134
TSGB0509 Map of principal ports, port groups and freight waterways 135
TSGB0510 Traffic on major rivers and other inland waterway routes: from 1994 136
Passengers
TSGB0511 UK international short sea passengers by overseas country: from 1950 SPAS0103 137
TSGB0512 UK international sea passengers by port and port area: from 1950 SPAS0101 138
Shipping
TSGB0513 UK and Crown Dependency registered trading vessels of 500gt and over: from 1950 139
TSGB0514 UK and Crown Dependency registered trading vessels of 500gt and over by type: from 1986 140
TSGB0515 United Kingdom owned trading vessels of 500gt and over by type number and tonnage: from 1986 141
TSGB0516 United Kingdom shipping industry: international revenue and expenditure: from 1997 142
TSGB0517 Marine accident fatalities and injuries reported: from 1999 143
TSGB0518 UK HM Coastguard statistics, search and rescue operations: from 1999 144
Table of Contents 4
2012 TSGB web table number
Alternate DfT Statistics table
numberPage
number
Public TransportPublic Transport Summary 145
Rail
TSGB0601 Length of national railway route at year end, and passenger travel by national railway and London Underground: from 1900 RAI0101 150
TSGB0602 National railways: passenger revenue: from 2000/01 RAI0301 152
TSGB0603 Passenger kilometres and timetabled train kilometres on national railways: from 2000/01 RAI0103 153
TSGB0604 National railways: route and stations open for traffic at end of year, annual from 2000/01 RAI0104 154
TSGB0605 National railways: Public Performance Measure, annual from 2002/03 RAI0105 155
TSGB0606 Average age of national rail rolling stock: from 2000/01 RAI0106 156
TSGB0607 Passengers in excess of capacity (PiXC) on a typical autumn weekday on London & South East train operators' services: annual from 1990 RAI0210 157
TSGB0608 Channel Tunnel: traffic to and from Europe, annual from 2000 RAI0108 158
TSGB0625 Government support to the rail industry: annual from 1985/86 RAI0302 159
TSGB0626 Private investment in the rail industry: annual from 2006/07 RAI0303 160
Light rail and underground
TSGB0609 London Underground statistics, annual from 2000/01 LRT9901 161
TSGB0610 Glasgow Underground statistics, annual from 1982/83 LRT9902 163
TSGB0611 Passenger journeys on light rail and trams by system, England: annual from 1983/84 LRT0101 165
TSGB0612 Passenger miles on light rail and trams by system: England, annual from 1983/84 LRT0104 166
TSGB0613 Vehicle miles on light rail and trams by system: England, annual from 1983/84 LRT0106 167
TSGB0614 Number of stations or stops on light rail and trams by system: England, annual from 1995/96 LRT0201 168
TSGB0615 Passenger carriages or tramcars on light rail and trams by system: England, annual from 1983/84 LRT0202 169
TSGB0616 Route miles open for passenger traffic on light rail and trams by system: England, annual from 1995/96 LRT0204 170
TSGB0617 Passenger revenue at 2011/12 prices on light rail and trams by system: England, annual from 1983/84 LRT0301 171
Buses
TSGB0618 Passenger journeys on local bus services by metropolitan area status and country: Great Britain, annual from 1970 BUS0103 172
TSGB0619 Vehicle distance travelled (miles and kilometres) on local bus services by metropolitan area status and country: Great Britain, annual from 1970 BUS0203 173
TSGB0620 Vehicle distance travelled (miles and kilometres) on local bus services by service type and metropolitan area status and country: Great Britain BUS0205 175
TSGB0621 Local Bus Fares Index by metropolitan area status and country: Great Britain, annual from 1995 BUS0405 177
TSGB0622 Estimated operating revenue for local bus services by revenue type and metropolitan area status: England, annual from 2004/05 BUS0501 179
TSGB0623 Net government support for local bus services and concessionary travel by metropolitan area status and country: England, annual from 1996/97 BUS0502 181
TSGB0624 Public service vehicle stock by type of vehicle: Great Britain, annual from 1997/98 BUS0601 185TSGB0627 Older and disabled concessionary travel passes, concessionary bus journeys and bus journeys per pass by metropolitan area status: England, annual from
2010/11
BUS0821 186
TSGB0628 Taxis, Private Hire Vehicles (PHVs) and their drivers: England and Wales, from 2005 TAXI0102 187
Roads and TrafficRoad Traffic Summary 189
Road traffic
TSGB0701 Road traffic (vehicle miles) by vehicle type in Great Britain, annual from 1949 TRA0101 193
TSGB0702 Road traffic (vehicle kilometres) by vehicle type in Great Britain, annual from 1949 TRA0201 195
TSGB0703 Motor vehicle traffic (vehicle miles) by road class in Great Britain, from 1950 to 1993 TRA0102 197
TSGB0704 Motor vehicle traffic (vehicle kilometres) by road class in Great Britain, 1950 to 1993 TRA0202 199
TSGB0705 Road traffic (vehicle miles) by vehicle type and road class in Great Britain, annual TRA0104 201
TSGB0706 Road traffic (vehicle kilometres) by vehicle type and road class in Great Britain, annual TRA0204 202
TSGB0707 Forecasts of road traffic in England and vehicles in Great Britain TRA9905 203
Road lengths
TSGB0708 Road lengths (kilometres) by road type in Great Britain, annual from 1914 RDL0203 204
TSGB0709 Road lengths (miles) by road type in Great Britain, annual from 1914 RDL0103 205
TSGB0710 Road lengths (kilometres) by road type and region and country in Great Britain, annual RDL0201 206
TSGB0711 Road lengths (miles) by road type and region and country in Great Britain, annual RDL0101 207
TSGB0712 Road lengths (kilometres) by road type and local authority in Great Britain, annual RDL0202 208
TSGB0713 Road lengths (miles) by road type and local authority in Great Britain, annual RDL0102 212
Free flow speeds
TSGB0714 Vehicle speeds on non-built-up roads by road type and vehicle type in Great Britain SPE0101 216
TSGB0715 Vehicle speeds on built-up roads by speed limit and vehicle type in Great Britain SPE0102 217
TSGB0716 Average vehicle speeds (flow-weighted) during the weekday morning peak on locally managed ‘A’ roads: by local authority in England, annually from 2006/07 CGN0201 218
Expenditure and road condition
TSGB0717 Regional expenditure on roads RDE0101 224
TSGB0718 Road construction tender price index RDE0102 225
TSGB0719 Road taxation revenue, United Kingdom RDE0103 226
TSGB0720 New road construction and improvement: motorways and all purpose trunk roads RDE0104 227
Traffic Accidents and CasualtiesTraffic Accidents and Casualties Summary 229
Casualties by type
TSGB0801 Reported road accidents and casualties: 1950 — latest year available RAS40007 233
TSGB0802 Reported road accident casualties by road user type and severity RAS30069 234
TSGB0803 Reported accidents and accident rates by road class and severity, Great Britain, annual comparison of 1994-1998 average up to latest year RAS10002 235
TSGB0804 Reported road accidents: breath tests performed on car drivers and motorcycle riders involved in injury accidents: Great Britain RAS51014 236
TSGB0805 Railway accidents: casualties: by type of accident RAI0501 237
TSGB0806 Railway movement accidents: passenger casualties and casualty rates RAI0502 238
TSGB0807 Railway accidents: train accidents RAI0503 239
TSGB0808 Signals Passed At Danger (SPADs) on Network Rail controlled infrastructure RAI0504 240
Table of Contents 5

2012 TSGB web table number
Alternate DfT Statistics table
numberPage
number
Traffic Accidents and Casualties (continued)International comparisons of road deaths
TSGB0809 International comparisons of road deaths for selected OECD countries RAS52002 241
Motor vehicle offences
TSGB0810 Reported roadside screening breath tests and breath test failures: England and Wales RAS51016 242
TSGB0811 Motor vehicle offences: findings of guilt at all courts fixed penalty notices and written warnings: by type of offence: England and Wales RAS61001 243
VehiclesVehicles Summary 245
Vehicles licenced
TSGB0901 Licensed vehicles by tax class, Great Britain, annually from 1909 VEH0103 251
TSGB0902 Vehicles registered for the first time by tax class, Great Britain, annually from 1954 VEH0153 252
TSGB0903 Licensed vehicles by body type, Great Britain, annually from 1994 VEH0102 253
TSGB0904 Vehicles registered for the first time by body type, Great Britain, annually from 2001 VEH0152 254
TSGB0905 Licensed cars by propulsion/fuel type, Great Britain, annually from 2000 VEH0203 255
TSGB0906 Licensed cars, by region, Great Britain, annually from 2000 VEH0204 256
TSGB0907 Licensed heavy goods vehicles by weight (tonnes), Great Britain, annually from 2000 VEH0506 258
MOT Testing schemes
TSGB0908 Road vehicle testing scheme (MOT) test results, Great Britain, annually from 2000/01 259
TSGB0909 Road vehicle testing scheme (MOT): percentage of vehicles failing by type of defect, Great Britain, annually from 2007/08 260
TSGB0910 Road passenger service vehicle testing scheme (PSV tests), Great Britain, annually from 1999/00 261
TSGB0911 Goods vehicles over 3.5 tonnes testing scheme (HGV Motor vehicles and Trailers), Great Britain, annually from 1999/00 262
TSGB0912 Trailer tests by axle type, Great Britain, annually from 1999/00 263
Private motoring
TSGB0913 Household car availability, Great Britain, from 1951 NTS0205 264
TSGB0914 Household car ownership by region and area type, Great Britain, from 1995/97 NTS9902 265
TSGB0915 Full car driving licence holders by age and gender: Great Britain, from 1975/76 NTS0201 266
TSGB0916 Annual mileage of 4-wheeled cars by type and trip purpose: Great Britain, from 1995/97 NTS0901 267
TSGB0917 Car driving tests, Great Britain, annually from 1999/00 268
TSGB0918 Valid Blue Badges held by disabled people by category in England, annual from 1997 DIS0101 269
TSGB0919 Valid Blue Badges held and population measures: England, annual from 1997 DIS0102 270
Olympics SpecialOlympics Summary 271
TSGB1001 Sea Passenger statistics at United Kingdom ports, July - September, 2011 and 2012 288
TSGB1002 Air traffic at United Kingdom airports, July-September, 2011 and 2012 289
TSGB1003 Punctuality at selected United Kingdom airports, July-August, 2011 and 2012 290
TSGB1004 National Rail Games Tickets (NRGT) revenue and sales 291
TSGB1005 Average week day speed (miles per hour) on local 'A' roads in the six London Host Boroughs 292
Table of Contents 6

TSGB: 2012
Introduction
n of Transport Statistics Great Britain published
ate, comprehensive and meaningful picture
at (and g users to manipulate the
al tables, usually historical data, which are
Welcome to the 38th editiothon 13 December 2012.
Transport Statistics Great Britain (TSGB) is a major publication within the scope of National Statistics and provides an accurof transport patronage in Great Britain.
All individual tables that make up TSGB are on the web-site in EXCEL formdownloadable in both EXCEL and CSV), enablininformation to produce further tables or charts.
There are also a number of additionavailable on the DfT web site, see https://www.gov.uk/government/organisations/department-for-transport/series/transport-statistics-great-britain#statistical-data-sets
The Notes and Definitions are also available as a separate PDF on the DfT web site at: https://www.gov.uk/government/publications/transport-statistics-great-britain-2012
s
hus TSGB is a snapshot of the latest data
mments you may have ase e-mail these to
The website also contains a great deal of other published statistical material produced by Transport Statistics. It also includes a list of forthcoming publicationand their publication dates. In many cases, the information produced during the course of the year provides the first release of data and these are subsequently consolidated into the TSGB tables. Tavailable at the time of publication.
I hope you find this publication useful and interesting. Any coon the contents would be welcome. Ple
Paul McEvoy
December 2012
2/29 Great Minster House
33 Horseferry Road
London, SW1P 4DR
Introduction 7

8

Highlights 1
Modal comparisons 2
Aviation 3
Energy and Environment
4
Freight 5
Maritime 6
Public transport 7
Roads and traffic 8
Transport accidents and casualties
9
Vehicles
Olympics
10 11
Transport Statistics Great Britain: 2012 Transport Statistics Great Britain (TSGB) is a major publication within the scope of National Statistics and provides an accurate, comprehensive and meaningful picture of transport patronage in Great Britain. TSGB 2012 contains information on modal comparisons, aviation, energy and the environment, freight, maritime, public transport, roads and traffic, transport accidents, casualties and vehicles.
Highlights from TSGB 2012 include:
Over the long term there has been an increase in total passenger distance travelled driven mainly by an increase in the distance travelled by road, and in particular by cars, vans and taxis, although there have been small falls since 2007.
There were 219 million terminal passengers (arrivals and departures) at UK airports in 2011, 4% more than in 2010 but 9% lower than the peak in 2007. Freight handled at UK airports fell by 1% to 2.3 million tonnes, following a marked increase in 2010.
Between 1990 and 2010 greenhouse gas (GHG) emissions from transport have increased by 11% whilst total GHG emissions have fallen by 21% over the same period.
In 2010, the level of domestic freight moved was at broadly the same level as in 1990, at around 222 billion tonnes kilometres.
UK sea ports handled 519 million tonnes (Mt) of freight traffic in 2011, an increase of 1 per cent on 2010, but 11 per cent lower than in the peak in 2005.
Since privatisation (1994/95), the number of journeys made by national rail has doubled from 0.7 billion to 1.5 billion in 2011/12 (52% increase since 2001/02).
In 2011, the overall motor vehicle traffic volume in Great Britain was 303.8 billion vehicle miles. This is similar to traffic volume in 2010 (303.2 billion vehicle miles) and follows three consecutive years of decreases.
In 2011, the number of reported road casualties of all severities was 35 per cent lower than in 2001. Traffic has grown by 3.2 per cent over the same period.
The number of licensed motor vehicles in Great Britain has increased from about 4 million in 1950 to over 34 million in 2011.
Transport Statistics GreatBritain Statistical Release 13 December 2012
FURTHER INFORMATION Media Enquiries: 020 7944 3066 Public Enquiries: Paul McEvoy 020 7944 5235 [email protected]
https://www.gov.uk/government/publications/transport-statistics-great-britain-2012 9

1. Modal comparisons
Passenger Transport by Mode, 1952 to 2011p (Table TSGB0101)
0
100
200
300
400
500
600
700
800
900
1951 1956 1961 1966 1971 1976 1981 1986 1991 1996 2001 2006 2011P
Bill
ion
pas
sen
ger
kilo
met
res
All modes All road Cars, vans and taxis Bus and Coach Rail
P = Provisional
Over the long term there has been an increase in the total passenger distance travelled driven mainly by an increase in the distance travelled by road, and in particular by cars, vans and taxis, although there have been small falls since 2007.
Detailed statistics can be found on the Transport Statistics Great Britain Modal Comparisons web page.
https://www.gov.uk/government/publications/transport-statistics-great-britain-2012 10
2. Aviation
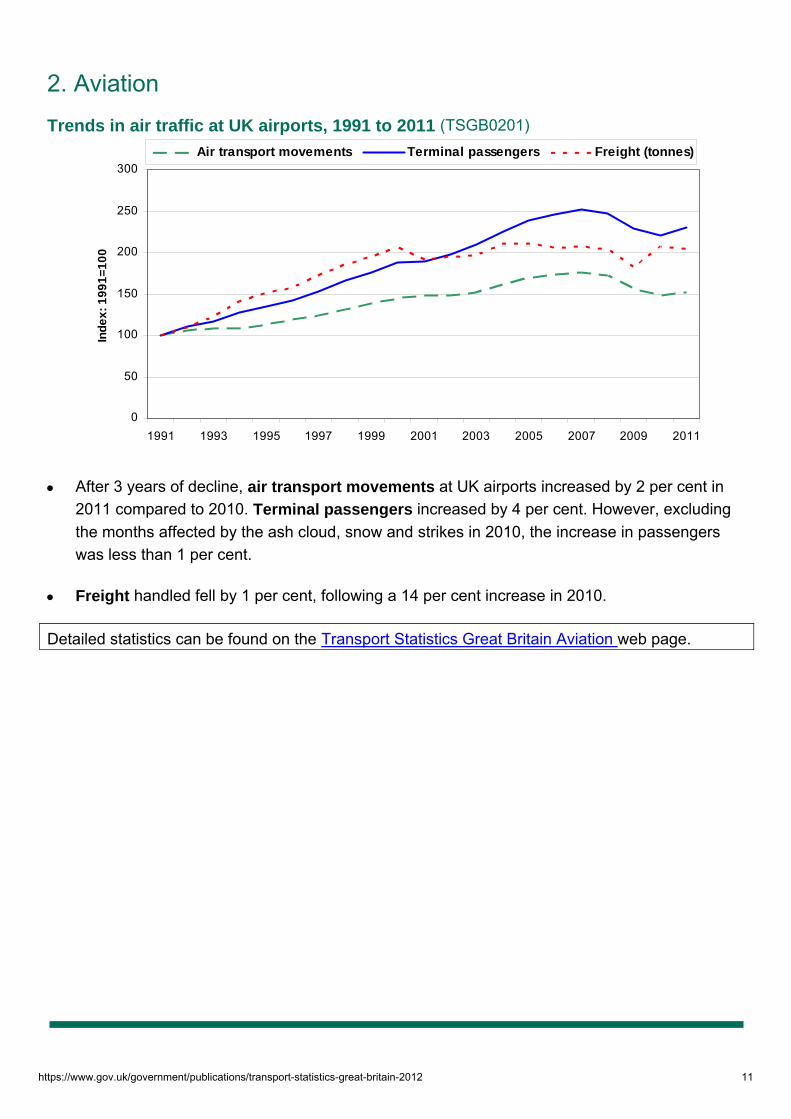
Trends in air traffic at UK airports, 1991 to 2011 (TSGB0201)
0
50
100
150
200
250
300
1991 1993 1995 1997 1999 2001 2003 2005 2007 2009 2011
Ind
ex
: 1
99
1=
10
0
Air transport movements Terminal passengers Freight (tonnes)
After 3 years of decline, air transport movements at UK airports increased by 2 per cent in 2011 compared to 2010. Terminal passengers increased by 4 per cent. However, excluding the months affected by the ash cloud, snow and strikes in 2010, the increase in passengers was less than 1 per cent.
Freight handled fell by 1 per cent, following a 14 per cent increase in 2010.
Detailed statistics can be found on the Transport Statistics Great Britain Aviation web page.
https://www.gov.uk/government/publications/transport-statistics-great-britain-2012 11

3. Energy and Environment
UK transport greenhouse gas emissions 1990-2010 (Table TSGB0306(a))
0
20
40
60
80
100
120
140
160
180
200
1990 1992 1994 1996 1998 2000 2002 2004 2006 2008 2010
Mill
ion
to
nn
es o
f ca
rbo
n d
ioxi
de
equ
ival
ent
Internationalshipping
Internationalaviation
Domestic excroad transport
Road transportexc car & taxis
Car & taxis
Between 1990 and 2010 greenhouse gas (GHG) emissions from transport have increased by 11% whilst total GHG emissions have fallen by 21% over the same period. As a result, as a proportion of total GHG emissions, transport emissions have risen from 18% in 1990 to 26% in 2010.
Road transport made up 69% of total GHG emissions from transport in 2010. However most of the growth in total transport GHG emissions since 1990 is attributable to growth in international air travel. Emissions from international aviation in 2010 were more than double 1990 levels (a 102% increase). Emissions from international aviation made up a fifth (20%) of total transport GHG emissions in 2010.
The falls in road traffic volumes during the recession are likely to have been the main driver of the 8% fall in domestic transport GHG emissions between 2007 and 2010. Another key factor was improvements in car fuel economy.
Detailed statistics can be found in the Transport Statistics Great Britain Energy and environment tables.
https://www.gov.uk/government/publications/transport-statistics-great-britain-2012 12
4. Freight
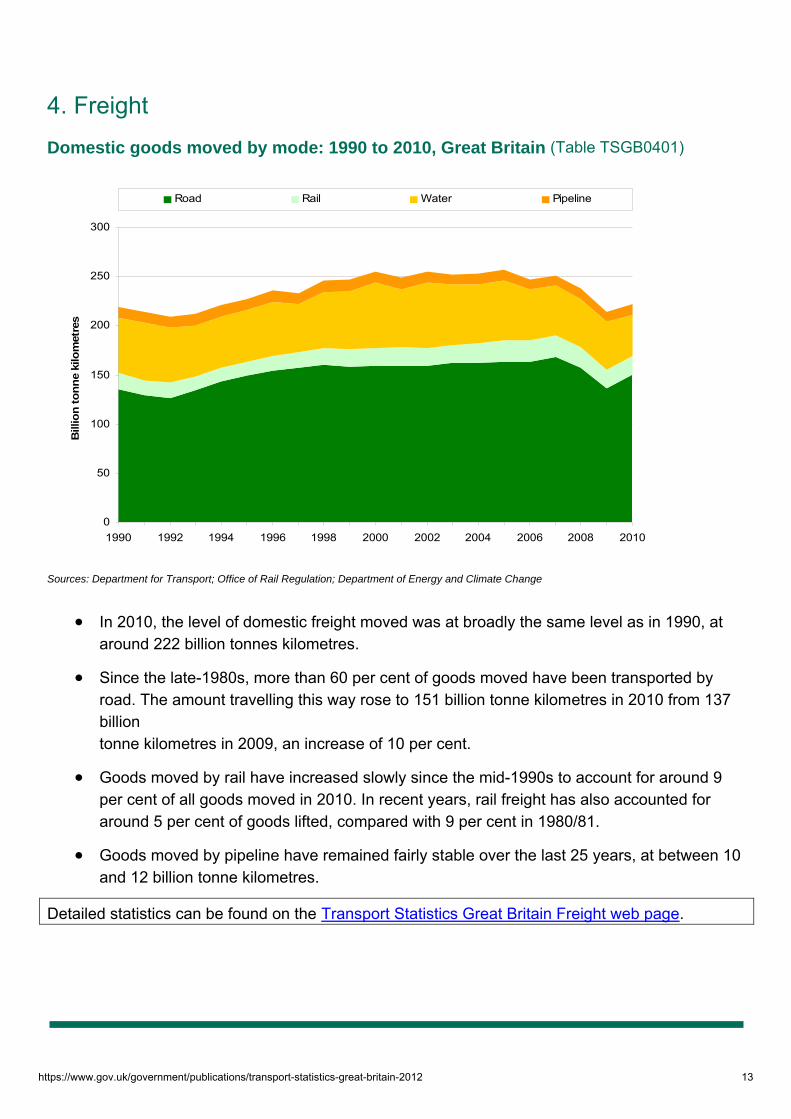
Domestic goods moved by mode: 1990 to 2010, Great Britain (Table TSGB0401)
0
50
100
150
200
250
300
1990 1992 1994 1996 1998 2000 2002 2004 2006 2008 2010
Bill
ion
to
nn
e ki
lom
etre
s
Road Rail Water Pipeline
Sources: Department for Transport; Office of Rail Regulation; Department of Energy and Climate Change
In 2010, the level of domestic freight moved was at broadly the same level as in 1990, at around 222 billion tonnes kilometres.
Since the late-1980s, more than 60 per cent of goods moved have been transported by road. The amount travelling this way rose to 151 billion tonne kilometres in 2010 from 137 billion tonne kilometres in 2009, an increase of 10 per cent.
Goods moved by rail have increased slowly since the mid-1990s to account for around 9 per cent of all goods moved in 2010. In recent years, rail freight has also accounted for around 5 per cent of goods lifted, compared with 9 per cent in 1980/81.
Goods moved by pipeline have remained fairly stable over the last 25 years, at between 10 and 12 billion tonne kilometres.
Detailed statistics can be found on the Transport Statistics Great Britain Freight web page.
https://www.gov.uk/government/publications/transport-statistics-great-britain-2012 13

5. Maritime
Freight traffic handled at UK sea ports 2000 to 2011 (Table TSGB0501)
0
100
200
300
400
500
600
700
1980
1982
1984
1986
1988
1990
1992
1994
1996
1998
2000
2002
2004
2006
2008
2010
Mil
lio
n t
on
nes
Imports Exports Domestic
UK sea ports handled 519 million tonnes (Mt) of freight traffic in 2011, an increase of 1 per cent on 2010, but 11 per cent lower than in the peak in 2005. Over the ten years since 2001, imports have increased by 9 per cent where as exports have decreased by 23 per cent and domestic traffic has fallen by 18 per cent.
International sea passenger journeys to and from the UK in 2011 decreased by 0.7 million people to 22.6 million. Of these, 21.1 million were short-sea ferry passengers and 1.6 million were cruise and other long sea journey passengers, which has risen from 0.5 million in the last decade.
The deadweight tonnage (dwt) of UK and Crown Dependency registered vessels over 500gt has increased by 190 per cent since 2001, from 13.6 million dwt to 39.6 million dwt in 2009. Ships on the UK register need not be owned by UK interests, and vice versa. UK owned trading vessel deadweight tonnage has nearly doubled over the previous ten years, from 12 million in 2001 to 22.5 million in 2011
Detailed statistics can be found on the Transport Statistics Great Britain Maritime web page and on
the Ports web page of the Transport Statistics website.
https://www.gov.uk/government/publications/transport-statistics-great-britain-2012 14

6. Public Transport
Passenger kilometres on national railways, by ticket type: Great Britain annual from 2000/01 (Table RAI0103)
0
10
20
30
40
50
60
2000/01 2001/02 2002/03 2003/04 2004/05 2005/06 2006/07 2007/08 2008/09 2009/10 2010/11 2011/12
Bill
ion
pa
ss
en
ge
r k
ilom
etr
es
Ordinary fare Season ticket All tickets
Since privatisation (1994/95), the number of journeys made by national rail has doubled from 0.7 billion to 1.5 billion in 2011/12 (52% increase since 2001/02).
There were 4.7 billion bus passenger journeys in England in 2011/12. This is a 0.5% increase from the 2010/11 level.
Detailed statistics on public transport can be found on the Transport Statistics Great Britain Public Transport web page and on the Rail, Buses, and Light Rail pages of the Transport Statistics website.
https://www.gov.uk/government/publications/transport-statistics-great-britain-2012 15

7. Roads and Traffic
Road traffic by vehicle type (cars and all motor vehicles): 1951 - 2011 (TRA0101)
0
50
100
150
200
250
300
350
1951 1956 1961 1966 1971 1976 1981 1986 1991 1996 2001 2006 2011Year
Bill
ion
veh
icle
mile
s
Cars and taxis Other motor vehicles
Source: National Road Traffic Survey, DfT
In 2011, the overall motor vehicle traffic volume in Great Britain was 303.8 billion vehicle miles, this is similar to traffic volume in 2010, 303.2 billion vehicle miles.
Car traffic increased slightly (0.4 percent) between 2010 and 2011, from 239.8 to 240.7 billion vehicle miles. This follows a decline for three consecutive years between 2008 and 2010. Longer term, car traffic increased by around 1.6 per cent between 2001 and 2011.
The average speed achieved on local authority managed ‘A’ roads during the morning peak in 2011/12 was 25.3 mph. This is 0.8 per cent faster than the average speed observed during 2010/11 (25.1 mph) and 1.8 per cent faster than that observed during 2006/7 (24.6 mph).
Detailed statistics can be found on the Transport Statistics Great Britain Roads and traffic web
page.
https://www.gov.uk/government/publications/transport-statistics-great-britain-2012 16

8. Transport Accidents and Casualties
Traffic and reported casualties by severity: Great Britain 1990 – 2011: Index 1990 =100 (Tables TSGB0801 to TSGB0803)
0
20
40
60
80
100
120
2001 2002 2003 2004 2005 2006 2007 2008 2009 2010 2011
Ind
ex (
2001
= 1
00)
Traffic (vehicle miles) Killed Seriously injured Slighlty injured
In 2011 there were a total of 203,950 reported casualties of all severities, 35 per cent lower than a decade earlier in 2001. A total of 1,901 people were killed, 49 per cent lower than in 2001, 23,122 were seriously injured (down 38 per cent) and 178,927 were slightly injured (down 34 per cent). Between 2001 and 2011 traffic grew by 3.2 per cent.
Excluding suicides, in 2011/12 there were 66 fatalities on the National Rail network. This was 50 per cent higher than in 2010/11 when there were 44, but this number is in line with previous figures over the last decade. This increase was mainly due to a rise in the number of trespassers killed, 53 of whom were killed in 2011/12 following a large drop to 29 the year before. The remaining 13 fatalities were 4 passengers, 1 member of the workforce and 8 members of the public (excluding trespassers).
Excluding attempted suicides, there were 419 major injuries in 2011/12 compared to 411 the previous year. This number has fallen by 17 per cent since 2001/02. Overall casualties rose by 4 per cent from 12,974 in 2010/11 to 13,466 in 2011/12. This is the second consecutive rise, following six consecutive years of falls. Passenger kilometres rose by 5 per cent from 2010/11 to 2011/12, and have risen by 47 per cent since 2001/02.
Detailed statistics can be found on the Transport Statistics Great Britain Transport accidents and casualties web page.
https://www.gov.uk/government/publications/transport-statistics-great-britain-2012 17
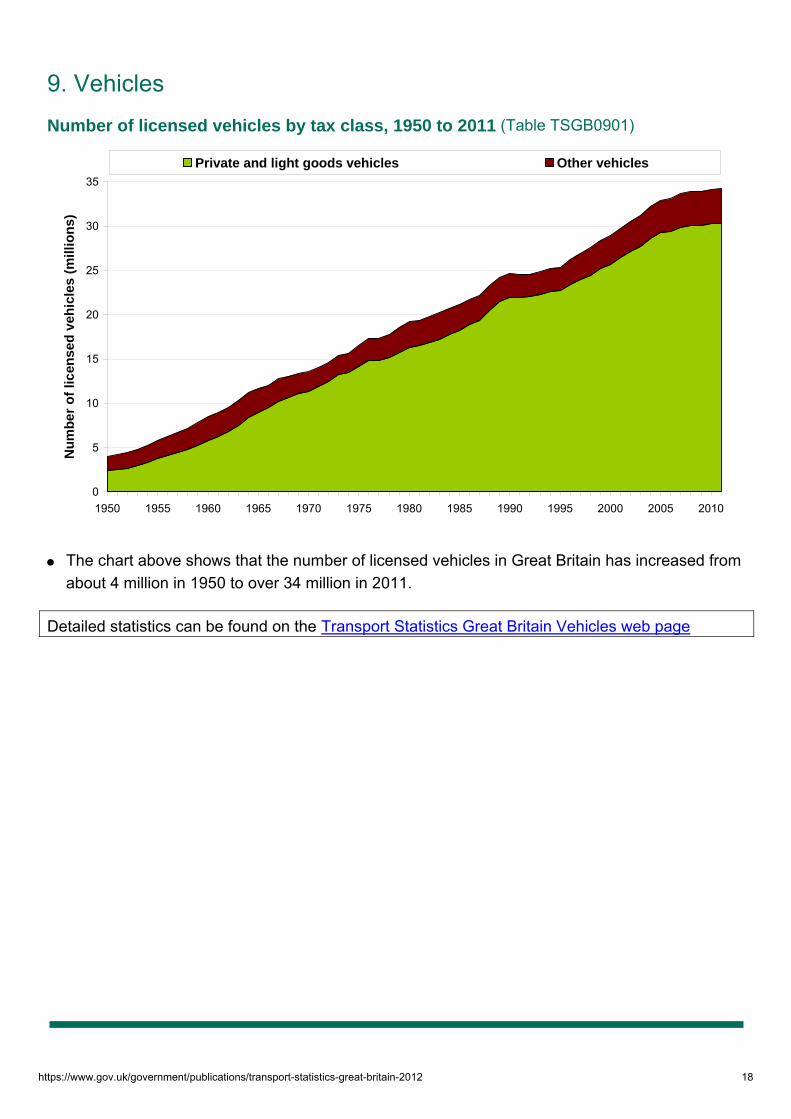
9. Vehicles
Number of licensed vehicles by tax class, 1950 to 2011 (Table TSGB0901)
0
5
10
15
20
25
30
35
1950 1955 1960 1965 1970 1975 1980 1985 1990 1995 2000 2005 2010
Nu
mb
er
of
licen
sed
veh
icle
s (m
illio
ns)
Private and light goods vehicles Other vehicles
The chart above shows that the number of licensed vehicles in Great Britain has increased from
about 4 million in 1950 to over 34 million in 2011.
Detailed statistics can be found on the Transport Statistics Great Britain Vehicles web page
https://www.gov.uk/government/publications/transport-statistics-great-britain-2012 18
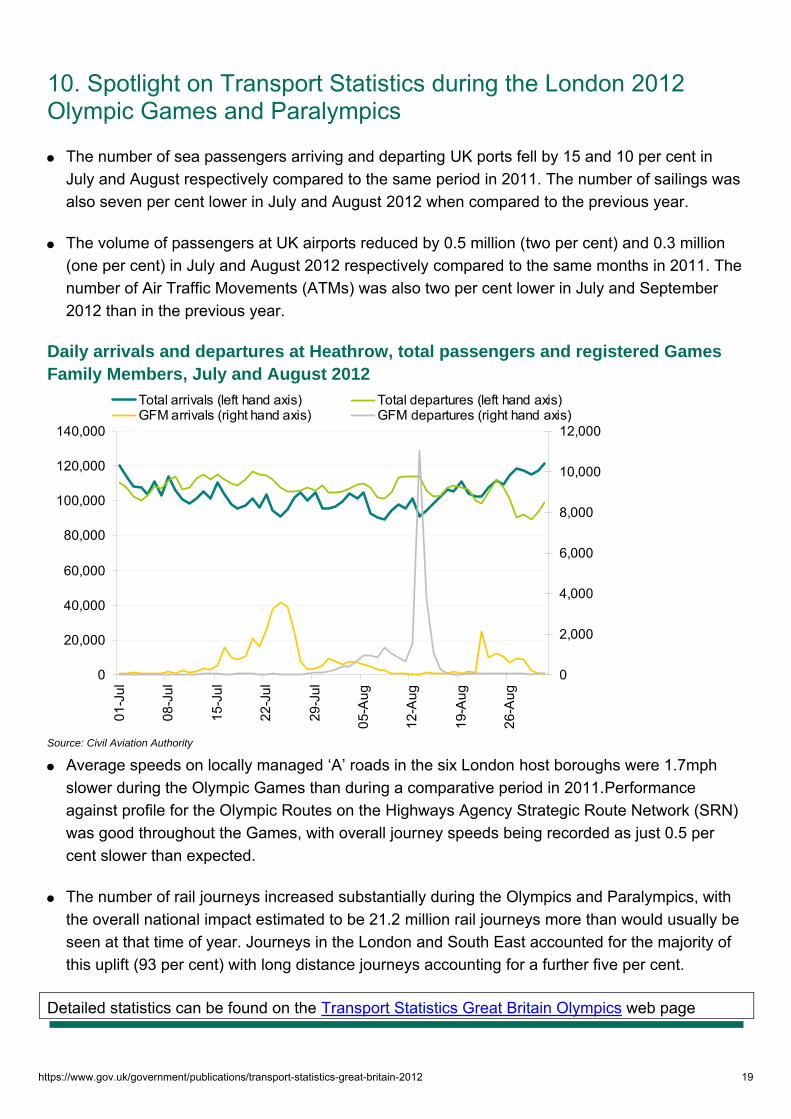
10. Spotlight on Transport Statistics during the London 2012 Olympic Games and Paralympics
The number of sea passengers arriving and departing UK ports fell by 15 and 10 per cent in July and August respectively compared to the same period in 2011. The number of sailings was also seven per cent lower in July and August 2012 when compared to the previous year.
The volume of passengers at UK airports reduced by 0.5 million (two per cent) and 0.3 million (one per cent) in July and August 2012 respectively compared to the same months in 2011. The number of Air Traffic Movements (ATMs) was also two per cent lower in July and September 2012 than in the previous year.
Daily arrivals and departures at Heathrow, total passengers and registered Games Family Members, July and August 2012
0
20,000
40,000
60,000
80,000
100,000
120,000
140,000
01-J
ul
08-J
ul
15-J
ul
22-J
ul
29-J
ul
05-A
ug
12-A
ug
19-A
ug
26-A
ug
0
2,000
4,000
6,000
8,000
10,000
12,000
Total arrivals (left hand axis) Total departures (left hand axis)GFM arrivals (right hand axis) GFM departures (right hand axis)
Source: Civil Aviation Authority
Average speeds on locally managed ‘A’ roads in the six London host boroughs were 1.7mph slower during the Olympic Games than during a comparative period in 2011.Performance against profile for the Olympic Routes on the Highways Agency Strategic Route Network (SRN) was good throughout the Games, with overall journey speeds being recorded as just 0.5 per cent slower than expected.
The number of rail journeys increased substantially during the Olympics and Paralympics, with the overall national impact estimated to be 21.2 million rail journeys more than would usually be seen at that time of year. Journeys in the London and South East accounted for the majority of this uplift (93 per cent) with long distance journeys accounting for a further five per cent.
Detailed statistics can be found on the Transport Statistics Great Britain Olympics web page
https://www.gov.uk/government/publications/transport-statistics-great-britain-2012 19

TSGB: 2012
Symbols and conventions
Unless otherwise stated, tables refer to Great Britain.
Metric units are generally used.
Conversion factors: 1 kilometre = 0.6214 mile 1 kilogram = 2.2 lb 1 tonne (1,000kg) = 0.9842 ton 1 tonne-km = 0.6116 ton-mile 1 billion = 1,000 million 1 (imperial) Gallon = 4.546 litres 1 litre = 0.220 (imperial) gallons
Rounding of figures. In tables where figures have been rounded to the nearest final digit, there may be an apparent slight discrepancy between the sum of the constituent items and the total as shown.
Symbols. Symbols used throughout are defined below:
.. = not available
. = not applicable - = Negligible (less than half the final digit shown) 0 = Nil * = Sample size too small for reliable estimates ow = of which { = subsequent data is disaggregated } = subsequent data is aggregated | = break in the series P = provisional data F = forecast expenditure e = estimated outturn n.e.s. = not elsewhere specified R = Revised data
Symbols and conventions 20

Transport Statistics Great Britain 2012
Modal Comparisons Summary
This section looks at the use people make of the different modes of transport when travelling to, from and within Great Britain.
Modal Comparisons includes:
Passenger Transport including a range of tables on modes of travel, mileage travelled, journeys, casualty rates and overseas travel.
Employment in transport and transport related industries.
Household and Government expenditure on transport.
General information on transport costs based on the Retail and Consumer Prices Indices
Passenger Transport
Passenger Transport by Mode: 1952 to 2011
(Web table TSGB0101)
0
100
200
300
400
500
600
700
800
900
1951 1956 1961 1966 1971 1976 1981 1986 1991 1996 2001 2006 2011P
Bill
ion
pas
sen
ger
kilo
met
res
All modes All road Cars, vans and taxis Bus and Coach Rail
Over the long term there has been an increase in the total distance travelled driven mainly by an increase in the distance travelled by road, and in particular by cars, vans and taxis although there have been small falls since 2007.
https://www.gov.uk/government/statistical-data-sets/tsgb01-modal-comparisons 21
In addition, the proportion of travel by cars, vans and taxis rose from just over a quarter from 1952 to a peak of nearly ninety per cent in the early 1990s and has remained almost at those levels since then.
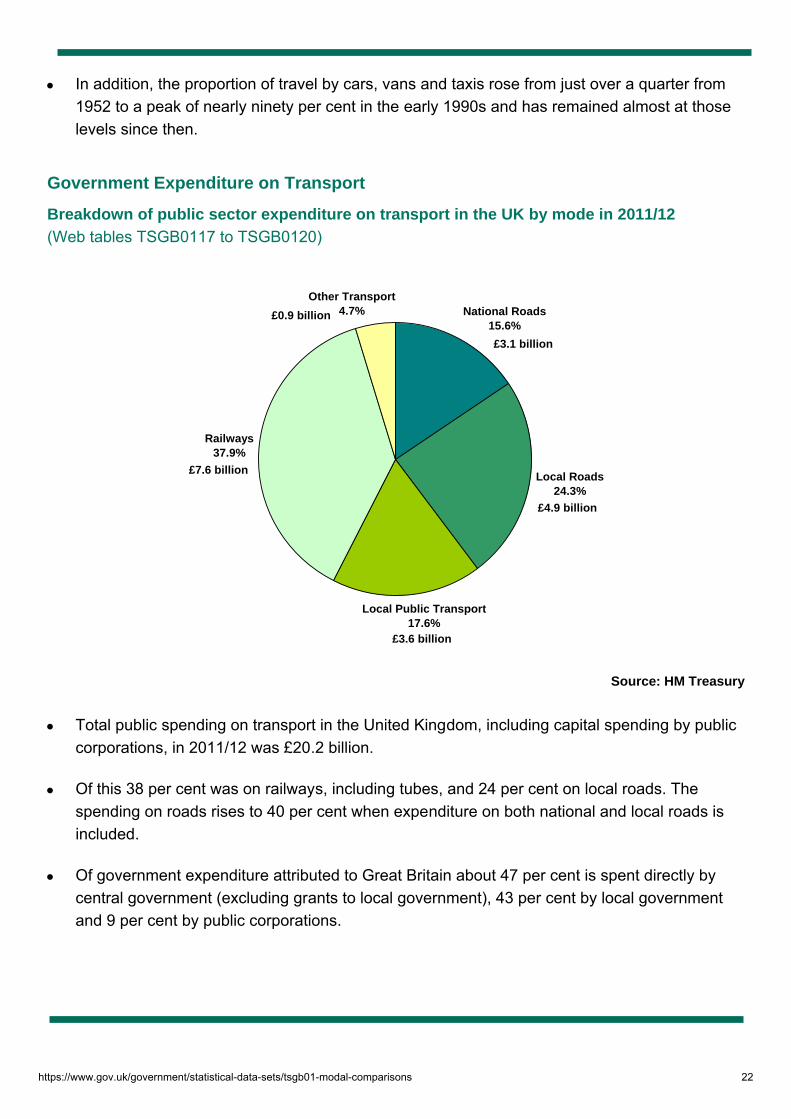
Government Expenditure on Transport
Breakdown of public sector expenditure on transport in the UK by mode in 2011/12
(Web tables TSGB0117 to TSGB0120)
National Roads15.6%
Local Roads24.3%
Local Public Transport17.6%
Railways37.9%
Other Transport4.7%
£4.9 billion
£3.1 billion
£0.9 billion
£7.6 billion
£3.6 billion
Source: HM Treasury
Total public spending on transport in the United Kingdom, including capital spending by public corporations, in 2011/12 was £20.2 billion.
Of this 38 per cent was on railways, including tubes, and 24 per cent on local roads. The spending on roads rises to 40 per cent when expenditure on both national and local roads is included.
Of government expenditure attributed to Great Britain about 47 per cent is spent directly by central government (excluding grants to local government), 43 per cent by local government and 9 per cent by public corporations.
https://www.gov.uk/government/statistical-data-sets/tsgb01-modal-comparisons 22
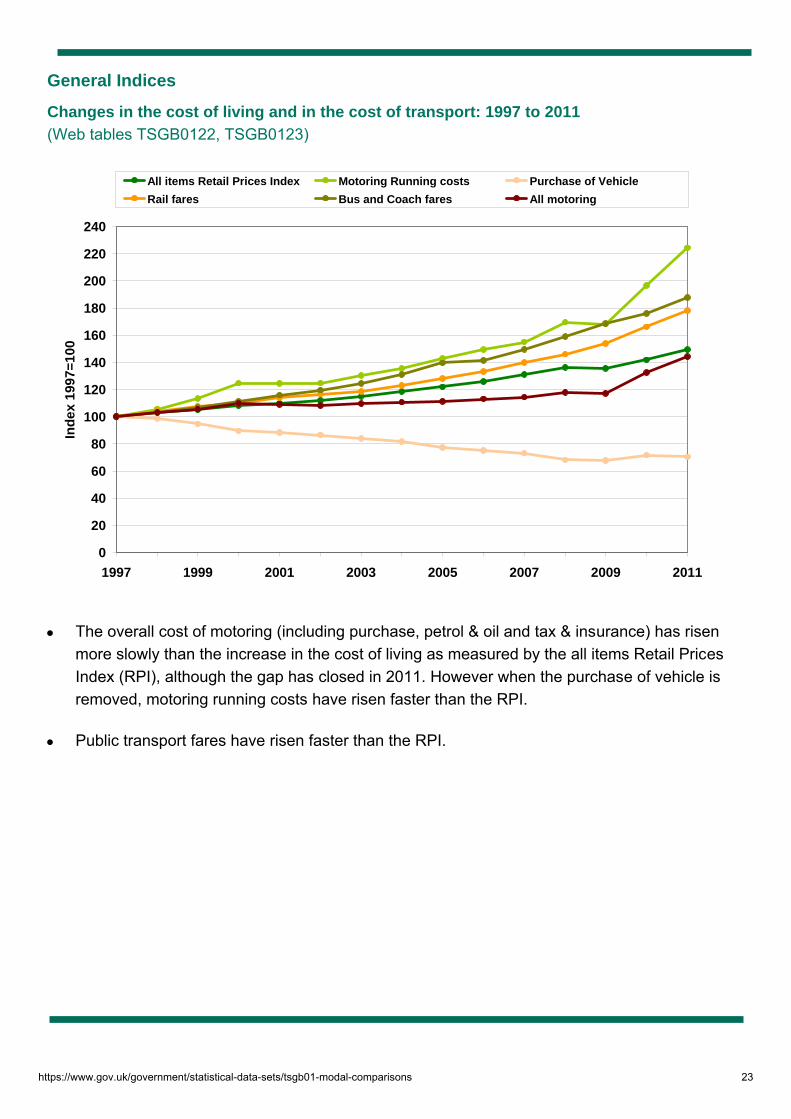
General Indices
Changes in the cost of living and in the cost of transport: 1997 to 2011
(Web tables TSGB0122, TSGB0123)
0
20
40
60
80
100
120
140
160
180
200
220
240
1997 1999 2001 2003 2005 2007 2009 2011
Ind
ex
199
7=10
0
All items Retail Prices Index Motoring Running costs Purchase of Vehicle
Rail fares Bus and Coach fares All motoring
The overall cost of motoring (including purchase, petrol & oil and tax & insurance) has risen
more slowly than the increase in the cost of living as measured by the all items Retail Prices Index (RPI), although the gap has closed in 2011. However when the purchase of vehicle is removed, motoring running costs have risen faster than the RPI.
Public transport fares have risen faster than the RPI.
https://www.gov.uk/government/statistical-data-sets/tsgb01-modal-comparisons 23

Government Revenues from Vehicle Excise Duty and Fuel Duty: 1987 to 2011
(Web table TSGB0125)
0
5,000
10,000
15,000
20,000
25,000
30,000
1987 1989 1991 1993 1995 1997 1999 2001 2003 2005 2007 2009 2011
£ m
illi
on
Fuel duty
Vehicle excise duty
Vehicle Excise Duty revenues have almost doubled between 1987 and 2011 whereas the increase in the revenue from fuel duty has more than tripled.
As well as the £26.9 billion collected in fuel duty in 2011, there was an additional £5.4 billion collected in VAT on fuel duty.
Over the same period the RPI has more than doubled.
Detailed statistics (tables and charts) on “modal comparisons” can be found on the Modal Comparisons chapter of the DfT Transport Statistics Great Britain web page.
Background notes 1. Full guidance on the methods used to compile these statistics and their sources can be found on the TSGB Chapter 1 - Modal Comparisons page.
https://www.gov.uk/government/statistical-data-sets/tsgb01-modal-comparisons 24

Department for Tranport statisticsModal comparisons
Table TSGB0101
Passenger transport: by mode, annual from 1952
Billion passenger kilometres/percentage
Road
YearBuses & coaches %
Cars, vans & taxis %
Motor cycles %
Pedal cycles % All Road % Rail1 %
Air
(UK)2 % All modes 3 %1952 92 42 58 27 7 3 23 11 180 82 38 18 0 0.1 218 1001953 93 41 64 29 7 3 21 9 185 83 39 17 0 0.1 225 1001954 92 40 72 31 8 3 19 8 191 83 39 17 0 0.1 230 1001955 91 38 83 35 8 3 18 8 200 84 38 16 0 0.1 239 1001956 89 36 91 37 8 3 16 7 204 83 40 16 1 0.2 245 1001957 84 34 92 38 9 4 16 7 201 83 42 17 1 0.2 244 1001958 80 31 113 44 9 4 14 5 216 84 41 16 1 0.2 258 1001959 81 30 126 46 11 4 14 5 232 85 41 15 1 0.2 273 1001960 79 28 139 49 11 4 12 4 241 86 40 14 1 0.3 282 1001961 76 26 157 53 11 4 11 4 255 86 39 13 1 0.3 295 1001962 74 25 171 57 10 3 9 3 264 87 37 12 1 0.4 302 1001963 73 23 185 59 8 3 8 3 274 88 36 12 1 0.4 312 1001964 71 21 214 63 8 2 8 2 301 89 37 11 2 0.4 340 1001965 67 19 231 66 7 2 7 2 312 89 35 10 2 0.5 349 1001966 67 18 252 68 7 2 6 2 332 90 35 9 2 0.5 369 1001967 66 17 267 70 6 2 6 2 345 91 34 9 2 0.5 381 1001968 64 16 279 72 5 1 5 1 353 91 33 9 2 0.5 389 1001969 63 16 286 72 5 1 5 1 359 91 35 9 2 0.5 395 1001970 60 15 297 74 4 1 4 1 365 91 36 9 2 0.5 403 1001971 60 14 313 75 4 1 4 1 381 91 35 9 2 0.5 419 1001972 60 14 327 76 4 1 4 1 395 91 34 8 2 0.5 431 1001973 61 14 345 76 4 1 4 1 414 92 35 8 2 0.5 452 1001974 61 14 333 76 5 1 4 1 403 91 36 8 2 0.5 441 1001975 60 14 331 76 6 1 4 1 401 92 36 8 2 0.5 438 1001976 58 13 348 77 7 2 5 1 418 92 33 7 2 0.5 452 1001977 58 13 354 77 7 1 6 1 425 92 34 7 2 0.5 461 1001978 56 12 368 78 7 1 5 1 436 92 35 7 3 0.6 474 1001979 56 12 365 77 7 2 5 1 433 92 35 7 3 0.6 471 1001980 52 11 388 79 8 2 5 1 453 92 35 7 3 0.6 491 1001981 48 10 394 80 10 2 5 1 458 93 34 7 3 0.6 495 1001982 48 10 406 81 10 2 6 1 470 93 31 6 3 0.6 504 1001983 48 9 411 80 9 2 6 1 474 93 34 7 3 0.6 511 1001984 48 9 432 81 9 2 6 1 495 93 35 7 3 0.6 533 1001985 49 9 441 81 8 1 6 1 504 93 36 7 4 0.7 543 1001986 47 8 465 82 8 1 6 1 525 93 37 7 4 0.7 566 1001987 47 8 500 83 7 1 6 1 560 93 39 6 4 0.7 603 1001988 46 8 536 84 6 1 5 1 595 93 41 6 5 0.7 640 1001989 47 7 581 85 6 1 5 1 640 93 40 6 5 0.7 685 1001990 46 7 588 85 6 1 5 1 645 93 40 6 5 0.8 690 1001991 44 6 582 86 6 1 5 1 637 94 39 6 5 0.7 681 1001992 43 6 583 86 5 1 5 1 635 94 38 6 5 0.7 678 1001993 44 6 584 86 4 1 4 1 636 94 37 5 5 0.8 678 1001993 44 6 607 87 4 1 4 1 659 94 37 5 5 0.7 701 1001994 44 6 614 87 4 1 4 1 666 94 36 5 5 0.8 707 1001995 43 6 618 87 4 1 4 1 669 94 37 5 6 0.8 712 1001996 43 6 622 87 4 1 4 1 674 94 39 5 6 0.9 719 1001997 44 6 632 86 4 1 4 1 685 93 42 6 7 0.9 734 1001998 45 6 636 86 4 1 4 1 689 93 44 6 7 1.0 740 1001999 46 6 642 85 5 1 4 1 697 93 47 6 7 1.0 751 1002000R 47 6 639 85 5 1 4 1 694 93 47 6 8 1.0 749 1002001R 47 6 651 85 5 1 4 1 707 93 48 6 8 1.0 763 1002002R 47 6 673 86 5 1 4 1 730 93 48 6 8 1.1 786 1002003R 47 6 669 85 6 1 5 1 726 93 50 6 9 1.2 785 1002004R 45 6 673 85 6 1 4 1 728 92 50 6 10 1.2 788 1002005R 45 6 667 85 6 1 4 1 722 92 52 7 10 1.3 784 1002006R 43 5 673 85 6 1 5 1 726 92 55 7 10 1.2 791 1002007R 45 6 675 85 6 1 4 1 730 91 59 7 10 1.2 798 1002008R 44 6 667 84 5 1 5 1 721 91 61 8 9 1.1 790 1002009R 45 6 662 84 5 1 5 1 717 91 61 8 8 1.1 787 1002010R 45 6 656 84 5 1 5 1 710 91 65 8 8 1.0 783 1002011P 43 6 655 83 5 1 5 1 708 90 68 9 8 1.0 785 100
1 Financial years. National Rail (franchised operators only to 2008, franchised and non-franchised operators from 2009), urban metros and modern trams.2 UK airlines, domestic passengers uplifted on scheduled and non-scheduled flights.3 Excluding travel by water.
r Road figures have been revised for 1996 to 2010 due to revisions to road traffic estimates from the planned benchmarking exercise. Rail figures revised for 2009 and 2010 due to inclusion of figures for non-franchised operators.
See Notes and Definitions in Sections 1 and 7 for details of discontinuity in road passengers figures from 1993 and 1996 onwards.
Telephone: Sources: Road - DfT Traffic Estimates, National Travel Survey; Rail - ORR; Air - CAARoad: 020-7944 3097Rail: 020-7944 2419 Last updated: December 2012Air: 020-7944 3088 Next update: December 2013
Email: [email protected] and definitionsThe Rail and Air figures in this table are outside the scope of National Statistics.
https://www.gov.uk/government/statistical-data-sets/tsgb01-modal-comparisons 25

Department for Transport statisticsModal comparisons
Table TSGB0102
Passenger journeys on public transport vehicles, annual from 1950Millions
Rail and Underground systems Light Rail and Tram Systems Street running public transport Air (UK) 5
Year
National
Rail network 1
London Under-ground
Glasgow
Subway 2First Generation
Trams 3Light rail and
modern Trams 4Trolley buses
Local bus service
Non-local bus or coach
Passengers on domestic flights
1950 1,010 695 .. 1,750 .. 1,961 12,734 260 ..1951 1,030 702 .. 1,479 .. 1,876 12,985 282 ..1952 1,017 670 .. 1,207 .. 1,783 13,049 297 0.71953 1,015 672 .. 1,013 .. 1,726 13,026 318 0.81954 1,020 671 .. 875 .. 1,663 13,059 293 1.01955 994 676 .. 769 .. 1,598 13,225 337 1.21956 1,029 678 .. 607 .. 1,503 13,059 341 1.41957 1,101 666 .. 476 .. 1,437 12,491 332 1.61958 1,090 692 .. 377 .. 1,257 11,879 337 1.51959 1,069 669 .. 247 .. 1,193 12,152 345 1.71960 1,037 674 .. 157 .. 990 12,166 367 2.21961 1,025 675 .. 104 .. 756 12,159 384 2.81962 965 668 .. 46 .. 557 12,045 382 3.31963 938 673 .. 16 .. 476 11,860 381 3.71964 928 674 .. 16 .. 368 11,497 386 4.21965 865 657 .. 15 .. 286 10,938 413 4.71966 835 667 .. 14 .. 188 10,407 419 5.11967 837 661 .. 13 .. 106 10,047 450 5.31968 831 655 .. 12 .. 68 9,699 455 5.01969 806 676 .. 12 .. 50 9,303 458 5.21970 824 672 .. 10 .. 34 8,643 467 5.41971 816 654 .. 10 .. 15 8,128 486 5.41972 754 655 .. 10 .. 1 7,901 512 5.91973 728 644 .. 11 .. . 7,866 577 6.51974 733 636 .. 10 .. . 7,706 597 6.11975 730 601 .. 9 .. . 7,524 635 5.81976 702 546 .. 8 .. . 7,141 648 6.11977 702 545 .. 8 .. . 6,856 641 5.51978 724 568 .. 8 .. . 6,617 680 6.41979 748 594 .. 9 .. . 6,463 628 7.21980 760 559 10 8 .. . 6,216 559 7.21981 719 541 11 6 .. . 5,688 584 6.61982 630 498 12 6 .. . 5,512 579 7.01983 694 563 12 6 50 . 5,581 622 7.01984 702 672 13 6 57 . 5,644 587 8.01985/86 686 732 13 6 59 . 5,813 537 8.61986/87 738 769 14 6 46 . 5,494 572 9.31987/88 798 798 14 5 45 . 5,434 592 10.31988/89 822 815 14 5 52 . 5,352 563 11.61989/90 812 765 13 6 54 . 5,208 594 12.61990/91 810 775 14 6 52 . 4,974 619 13.11991/92 792 751 14 5 49 . 4,785 .. 12.01992/93 770 728 14 5 54 . 4,594 .. 12.01993/94 740 735 14 6 58 . 4,494 .. 12.41994/95 735 764 15 5 63 . 4,528 .. 13.31995/96 761 784 14 5 68 . 4,489 .. 14.31996/97 801 772 14 5 73 . 4,455 .. 15.31997/98 846 832 14 5 79 . 4,430 .. 16.21998/99 892 866 15 4 85 . 4,350 .. 16.91999/00 931 927 15 4 94 . 4,376 .. 17.42000/01 957 970 14 4 120 . 4,420 .. 18.22001/02 960 953 14 5 127 . 4,455 .. 18.52002/03 976 942 13 5 136 . 4,550 .. 20.22003/04 1,012 948 13 4 143 . 4,681 .. 21.02004/05 R 1,040 976 13 4 155 . 4,631 .. 22.72005/06 R 1,076 970 13 4 160 . 4,721 .. 23.32006/07 R 1,145 1,040 14 3 175 . 4,915 .. 23.02007/08 R 1,218 1,096 15 3 183 . 5,165 .. 22.32008/09 R 1,266 1,089 14 2 186 . 5,272 .. 21.02009/10 R 1,259 1,059 13 2 184 . 5,214 .. 19.72010/11 R 1,356 1,107 13 2 195 . 5,203 .. 18.42011/12 1,462 1,171 13 1 203 . 5,233 .. 19.3
1 Figures prior to 2009/10 exclude non-franchised operators. From 1994/95 National Rail passenger journeys figures include an element of inflation as the figures represent the number of different trains used in the course of all journeys.2 Glasgow Subway was closed for refurbishment in 1978 and 1979.3 Only Blackpool Tramway still operates from this category.4 Light rail and modern trams includes Tyne and Wear Metro (opened 1980), Docklands Light Railway (1987), Manchester Metrolink (1992), Sheffield Supertram (1994), West Midlands Metro (1999), Croydon Tramlink (2000) and Nottingham NET (2004). 5 UK airlines, domestic passengers uplifted on scheduled and non-scheduled flights. Figures are for calendar years.
R National Rail passenger journeys have been revised for 2009/10 and 2010/11. Local bus passenger journeys revised for years 2004/05 to 2010/11.
Telephone: 020 7944 3094 Sources: bus, coach, tram and rail operators; ORR; CAAEmail: [email protected] and definitions Last updated: December 2012The Rail and Air figures in this table are outside the scope of National Statistics. Next update: December 2013
https://www.gov.uk/government/statistical-data-sets/tsgb01-modal-comparisons 26
Department for Transport statisticsNational Travel Survey
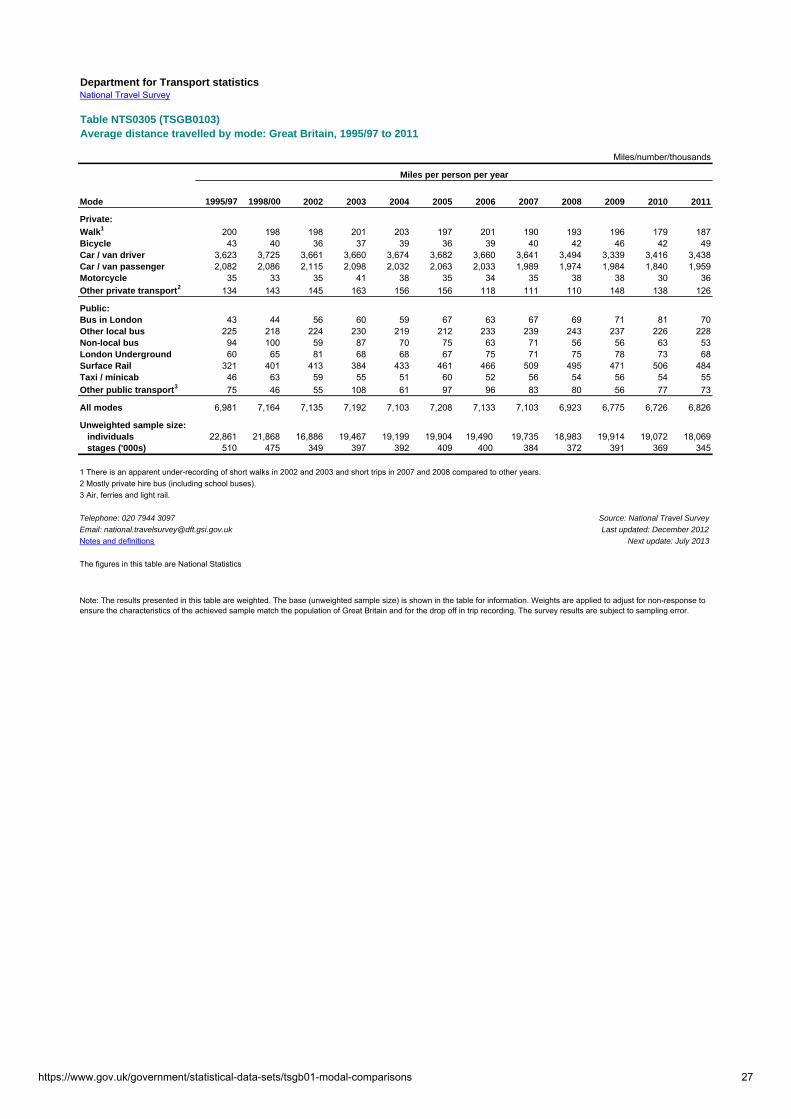
Table NTS0305 (TSGB0103)Average distance travelled by mode: Great Britain, 1995/97 to 2011
Miles/number/thousands
Miles per person per year
Mode 1995/97 1998/00 2002 2003 2004 2005 2006 2007 2008 2009 2010 2011
Private:
Walk1 200 198 198 201 203 197 201 190 193 196 179 187Bicycle 43 40 36 37 39 36 39 40 42 46 42 49Car / van driver 3,623 3,725 3,661 3,660 3,674 3,682 3,660 3,641 3,494 3,339 3,416 3,438Car / van passenger 2,082 2,086 2,115 2,098 2,032 2,063 2,033 1,989 1,974 1,984 1,840 1,959Motorcycle 35 33 35 41 38 35 34 35 38 38 30 36Other private transport2 134 143 145 163 156 156 118 111 110 148 138 126
Public:Bus in London 43 44 56 60 59 67 63 67 69 71 81 70Other local bus 225 218 224 230 219 212 233 239 243 237 226 228Non-local bus 94 100 59 87 70 75 63 71 56 56 63 53London Underground 60 65 81 68 68 67 75 71 75 78 73 68Surface Rail 321 401 413 384 433 461 466 509 495 471 506 484Taxi / minicab 46 63 59 55 51 60 52 56 54 56 54 55Other public transport3 75 46 55 108 61 97 96 83 80 56 77 73
All modes 6,981 7,164 7,135 7,192 7,103 7,208 7,133 7,103 6,923 6,775 6,726 6,826
Unweighted sample size: individuals 22,861 21,868 16,886 19,467 19,199 19,904 19,490 19,735 18,983 19,914 19,072 18,069 stages ('000s) 510 475 349 397 392 409 400 384 372 391 369 345
1 There is an apparent under-recording of short walks in 2002 and 2003 and short trips in 2007 and 2008 compared to other years.2 Mostly private hire bus (including school buses).3 Air, ferries and light rail.
Telephone: 020 7944 3097 Source: National Travel Survey
Email: [email protected] Last updated: December 2012
Notes and definitions Next update: July 2013
The figures in this table are National Statistics
Note: The results presented in this table are weighted. The base (unweighted sample size) is shown in the table for information. Weights are applied to adjust for non-response to ensure the characteristics of the achieved sample match the population of Great Britain and for the drop off in trip recording. The survey results are subject to sampling error.
https://www.gov.uk/government/statistical-data-sets/tsgb01-modal-comparisons 27

Department for Transport statisticsNational Travel Survey
Table NTS0409 (TSGB0104)Average number of trips (trip rates) by purpose and main mode: Great Britain, 2011
Trips/thousands
Trips per person per year
Purpose Walk BicycleCar / van
driverCar / van
passenger Motorcycle
Other private
transport1 Local bus Rail2Other public
transport3 All modesCommuting 15 6 85 14 2 - 12 11 2 147Business 2 - 21 2 - - 1 2 - 29Education / escort education 41 2 22 23 - 3 11 2 1 104Shopping 45 1 85 38 - 1 17 2 2 192Other escort 12 - 50 28 - - 2 - 1 94Personal business 22 1 41 21 - 1 7 1 1 94Leisure4 41 6 93 85 1 2 13 7 7 255Other including just walk 43 0 - - 0 0 0 0 0 44
All purposes 222 16 398 211 4 7 64 25 13 958
Unweighted sample size: trips ('000s) 74 5 131 70 1 2 20 8 4 316
1 Mostly private hire bus (including school buses).2 Surface rail and London underground.3 Non-local bus, taxi/minicab and other public transport (air, ferries, light rail).4 Visit friends at home and elsewhere, entertainment, sport, holiday and day trip.
Telephone: 020 7944 3097 Source: National Travel Survey
Email: [email protected] Last updated: December 2012
Notes and definitions Next update: July 2013
The figures in this table are National Statistics
Note: The results presented in this table are weighted. The base (unweighted sample size) is shown in the table for information. Weights are applied to adjust for non-response to ensure the characteristics of the achieved sample match the population of Great Britain and for the drop off in trip recording. The survey results are subject to sampling error.
https://www.gov.uk/government/statistical-data-sets/tsgb01-modal-comparisons 28

Department for Transport statisticsNational Travel Survey
Table NTS0410 (TSGB0105)Average distance travelled by purpose and main mode: Great Britain, 2011
Miles/thousands
Miles per person per year
Purpose Walk BicycleCar / van
driverCar / van
passenger Motorcycle
Other private
transport1 Local bus Rail2Other public
transport3 All modesCommuting 14 18 867 107 19 1 62 207 13 1,308Business 1 1 400 53 1 5 6 78 21 566Education / escort education 27 3 93 74 1 32 52 22 6 309Shopping 26 3 440 264 3 2 72 31 10 849Other escort 7 - 292 183 - 3 9 8 3 506Personal business 13 1 268 144 2 5 27 25 8 493Leisure4 30 21 1,069 1,123 11 80 67 223 126 2,750Other including just walk 41 0 4 - 0 0 0 0 0 45
All purposes 159 47 3,432 1,949 36 128 294 594 187 6,826
Unweighted sample size: trips ('000s) 74 5 131 70 1 2 20 8 4 316
1 Mostly private hire bus (including school buses).2 Surface rail and London underground.3 Non-local bus, taxi/minicab and other public transport (air, ferries, light rail). Source: National Travel Survey
4 Visit friends at home and elsewhere, entertainment, sport, holiday and day trip Last updated: December 2012
Next update: July 2013
Telephone: 020 7944 3097
Email: [email protected]
Notes and definitions
The figures in this table are National Statistics
Note: The results presented in this table are weighted. The base (unweighted sample size) is shown in the table for information. Weights are applied to adjust for non-response to ensure the characteristics of the achieved sample match the population of Great Britain and for the drop off in trip recording. The survey results are subject to sampling error.
https://www.gov.uk/government/statistical-data-sets/tsgb01-modal-comparisons 29

Dep
artm
ent
for
Tra
nsp
ort
sta
tist
ics
Tran
spor
t Sta
tistic
s G
reat
Brit
ain
Tab
le T
SG
B01
06
Peo
ple
en
teri
ng
cen
tral
Lo
nd
on
du
rin
g t
he
mo
rnin
g p
eak:
119
96-2
010
Peo
ple
(thou
sand
s)
1996
1997
1998
1999
2000
2001
2002
2003
2004
2005
2006
2007
2008
2009
2010
Pu
blic
tra
nsp
ort
:
Sur
face
rail
239
943
544
846
046
546
845
145
545
246
548
351
151
049
0
510
Lond
on U
nder
grou
nd &
DLR
3,4
333
341
360
362
383
377
380
339
344
344
379
397
405
379
37
5
B
us68
6868
6873
8188
104
116
115
116
113
114
115
11
4
C
oach
/min
ibus
520
2017
1515
1010
109
98
911
11
10
All
pu
blic
tra
nsp
ort
819
863
892
905
935
935
929
909
921
933
994
1,03
01,
040
995
1,
009
Per
son
al t
ran
spo
rt:
Priv
ate
car
143
142
140
135
137
122
105
8686
8478
7570
70
67
Mot
or c
ycle
1111
1315
1716
1516
1616
1515
1515
14
P
edal
cyc
le10
1010
1212
1212
1214
1718
1923
27
28
Taxi
99
88
87
77
78
76
76
6
All
per
son
al t
ran
spo
rt 6
173
172
171
169
173
157
139
120
122
125
118
116
115
118
11
5
All
tran
spo
rt 6
992
1,03
51,
063
1,07
41,
108
1,09
31,
068
1,02
91,
043
1,05
81,
105
1,14
61,
155
1,11
21,
124
1 0
700-
1000
hou
rs.
Sur
veys
are
con
duct
ed in
Oct
ober
/Nov
embe
r.2
Dat
a fro
m 2
007
to 2
009
have
bee
n re
vise
d si
nce
TSG
B 2
011.
3 D
LR =
Doc
klan
d Li
ght R
ailw
ay.
4 E
xclu
des
pass
enge
rs tr
ansf
errin
g fro
m s
urfa
ce ra
il se
rvic
es. P
asse
nger
s tra
nsfe
rrin
g fro
m s
urfa
ce ra
il se
rvic
es h
ave
been
ded
ucte
d fro
m th
e
gro
ss U
nder
grou
nd c
ount
s.
5 In
clud
es c
omm
uter
and
tour
ist c
oach
es.
6 E
xclu
des
com
mer
cial
veh
icle
s.
Tel
epho
ne: 0
20 7
126
4610
Sou
rce:
Tra
nspo
rt fo
r Lo
ndon
(T
fL)
Em
ail:
publ
icat
iong
ener
al.e
nq@
dft.g
si.g
ov.u
kw
ww
.tfl.g
ov.u
k/co
rpor
ate/
abou
t-tfl
/pub
licat
ions
/148
2.as
pxN
otes
and
def
initi
ons
Last
upd
ated
: Oct
ober
201
2Tr
ansp
ort f
or L
ondo
n is
out
side
the
scop
e of
Nat
iona
l Sta
tistic
s.N
ext u
pdat
e: D
ecem
ber
2013
https://www.gov.uk/government/statistical-data-sets/tsgb01-modal-comparisons 30

Department for Transport statisticshttps://www.gov.uk/government/organisations/department-for-transport/series/road-accidents-and-safety-statistics
Table: RAS53001 (TSGB0107)
Passenger casualty rates by mode: 2002-20111
Per billion passenger kilometres
2002 2003 2004 2005 2006 2007 2008 2009 2010 20112002-2011
average
Air 2
Killed 0.00 0.00 0.00 0.00 0.00 0.00 0.00 0.00 0.00 0.00 0.00KSI 3 0.00 0.00 0.01 0.00 0.00 0.00 0.01 0.00 0.00 0.00 0.00All 4 0.00 0.00 0.01 0.00 0.01 0.00 0.04 0.01 0.00 0.00 0.01
Rail 5,6
Killed 0.2 0.0 0.1 0.0 0.0 0.0 0.0 0.0 0.0 0.0 0.0All 35.2 32.5 31.2 26.0 26.3 23.2 24.5 25.9 26.5 25.2 27.3
Water 7
Killed 0.0 0.0 0.0 0.3 0.3 0.0 0.9 0.4 0.8 0.5 0.3KSI 50 61 44 36 39 45 74 52 39 51 49
Bus or coach 8
Killed 0.4 0.2 0.4 0.2 0.4 0.3 0.1 0.3 0.2 0.2 0.3KSI 11 10 10 7 9 10 10 8 9 7 9All 173 175 178 158 152 159 157 139 136 139 157
Car 9
Killed 2.7 2.8 2.6 2.6 2.5 2.2 1.9 1.6 1.3 1.4 2.2KSI 29 27 25 23 22 20 18 17 15 14 21All 306 294 284 277 263 251 228 221 209 195 253
Van 9
Killed 1.0 0.9 0.8 0.7 0.6 0.6 0.5 0.4 0.4 0.4 0.6KSI 11 10 8 7 7 5 5 5 4 4 6All 96 90 77 73 69 59 55 54 51 51 67
Motorcycles 9
Killed 112 116 106 99 109 100 91 85 81 72 98KSI 1,377 1,276 1,209 1,127 1,175 1,141 1,113 1,054 1,044 1,119 1,166All 5,206 4,739 4,663 4,299 4,227 3,972 3,966 3,749 3,764 4,019 4,269
Pedal cycle Killed 30 26 33 34 32 33 25 22 23 22 28KSI 562 544 561 547 542 561 561 568 573 646 573All 3,927 3,841 4,043 3,839 3,598 3,945 3,566 3,575 3,555 3,889 3,771
Pedestrian Killed 42 41 35 36 36 36 31 26 23 26 33KSI 471 424 394 384 371 382 358 319 322 337 377All 2,117 1,944 1,836 1,794 1,631 1,665 1,536 1,420 1,486 1,495 1,694
1 Figures have been revised from those published in previous years. See Notes and Definitions for more details2 Passenger casualties in accidents involving UK registered airline aircraft in UK and foreign airspace. 3 KSI =Killed or seriously injured4 All = Killed, seriously and slightly injured5 Financial years and National Rail only. 6 Passenger casualties involved in train accidents and accidents occuring through movement of railway vehicles. 7 Passenger casualties on UK registered merchant vessels.
9 Driver and passenger casualties.
Telephone: 020 7944 6595 Last updated: 27 September 2012
Email: [email protected] Next update:September 2013
The figures for Air, Rail and Water modes
are outside the scope of National Statistics
Notes and Definitions
8 Financial year passenger kilometres data revised from 2004/05. A break in the local bus series (outside London) due to changes in the estimation methodology from 2004/05 mean figures before 2004/05 are not comparable.
https://www.gov.uk/government/statistical-data-sets/tsgb01-modal-comparisons 31

Department for Transport statisticsTransport Statistics Great Britain
Table TSGB0108Usual method of travel to work by region of residence, GOR, FMC and country: October to December 2011
Percentage/thousands
Region Car Motorcycle Bicycle Bus/ coach National rail Other rail1 All rail Walk
Other
modes2
Number in employment
('000s)3
North East 74 * 1 9 1 2 3 11 * 1,157 Tyne and Wear 67 * * 14 * 3 5 11 * 508 Rest of North East 80 * * 5 * * * 11 * 650
North West 71 1 3 8 3 1 3 12 1 3,149 Greater Manchester 68 * 3 12 2 1 4 12 * 1,225 Merseyside 66 * 3 11 6 * 6 11 * 561 Rest of North West 77 1 3 4 1 * 1 13 * 1,363
Yorkshire and Humberside 73 1 3 9 2 * 3 12 1 2,419 South Yorkshire 75 * * 10 * * 3 9 * 584 West Yorkshire 70 * * 11 3 * 3 13 * 1,009 Rest of Yorkshire and Humberside 75 * 6 4 * * 2 12 * 826
East Midlands 78 * 3 5 1 * 2 11 * 2,118
West Midlands 77 1 2 7 2 * 2 10 1 2,420 West Midlands and Met. 74 * * 11 3 * 4 9 * 1,105 Rest of West Midlands 80 1 3 3 1 * 1 11 * 1,316
East of England 70 1 3 3 8 1 10 12 1 2,874
London 33 1 6 15 14 21 35 9 1 3,738 Inner London 16 * 10 17 12 30 43 11 2 1,503 Outer London 43 1 3 13 15 16 30 8 1 2,235
South East 71 1 4 4 8 - 8 11 1 4,179
South West 74 1 4 5 2 * 2 13 1 2,540
England 67 1 3 7 5 4 9 11 1 24,595 Wales 81 * 1 4 2 * 2 10 * 1,345
Scotland 68 * 2 12 3 * 4 12 2 2,465
Great Britain 68 1 3 8 5 3 8 11 1 28,405
1. Includes underground, light railway systems and trams. Source: Office for National Statistics, Labour Force Survey2. Includes taxis. Tel: 020 7944 25193. Includes all in employment, including those who did not answer the question on usual method of travel to work. Email: [email protected]
Last updated: August 2012 (revised to accommodate 2011 reweighting)Next update: May 2013
GOR = Government Office RegionFMC = Former Metropolitan County
The figures in this table are National StatisticsNotes and definitions
Rail
* Data for some cells are not shown because they fall below the LFS reliability threshold.
https://www.gov.uk/government/statistical-data-sets/tsgb01-modal-comparisons 32

Department for Transport statisticsTransport Statistics Great Britain
Table TSGB0109Usual method of travel to work by region of workplace, GOR, FMC and Country: October to December 2011
Percentage/thousands
Region Car Motorcycle Bicycle Bus/ coachNational
rail Other rail1 All rail Walk
Other
modes2
Number in employment
('000s)3
North East 74 * 2 9 * 2 3 12 * 1,125 Tyne and Wear 68 * * 14 * 3 4 11 * 536 Rest of North East 80 * * 5 * * * 13 * 589
North West 71 1 3 8 3 1 3 12 1 3,155 Greater Manchester 69 * 3 12 3 1 4 12 * 1,234 Merseyside 63 * 3 12 7 * 7 11 * 521 Rest of North West 77 1 3 4 1 * 1 13 * 1,400
Yorkshire and Humberside 73 1 3 9 2 * 3 12 * 2,403 South Yorkshire 75 * * 10 * * 3 10 * 563 West Yorkshire 70 * * 11 3 * 3 13 * 1,022 Rest of Yorkshire and Humberside 76 * 5 4 2 * 2 11 * 819
East Midlands 78 * 3 6 1 * 1 12 * 2,026
West Midlands 77 1 2 7 2 * 2 10 1 2,409 West Midlands and Met. 75 * 1 10 4 * 4 8 * 1,186 Rest of West Midlands 80 * 3 3 * * * 12 * 1,222
East of England 76 1 4 4 3 * 3 13 - 2,624
London 32 1 5 12 21 19 40 8 1 4,228 Central London 9 * 6 9 37 32 69 5 1 1,464 Rest of Inner London 26 2 7 14 20 21 41 8 1 1,142 Outer London 58 1 4 14 7 5 12 10 1 1,621
South East 74 1 4 4 4 * 4 12 1 3,952
South West 74 2 4 5 1 * 1 14 * 2,519
England 67 1 3 7 5 4 9 11 1 24,442 Wales 81 * 1 4 2 * 2 11 * 1,306 Scotland 69 * 2 12 4 * 4 12 1 2,464
Great Britain 68 1 3 8 5 3 8 11 1 28,212
1. Includes underground, light railway systems and trams. Source: Office for National Statistics, Labour Force Survey2. Includes taxis. 020 7944 25193. Includes all in employment, including those who did not answer the question on usual method of travel to work. Email: [email protected] updated: August 2012 (revised following 2011 reweighting)Next update: May 2013
GOR = Government Office RegionFMC = Former Metropolitan County
The figures in this table are National StatisticsNotes and definitions
Rail
* Data for some cells are not shown because they fall below the LFS reliability threshold.
https://www.gov.uk/government/statistical-data-sets/tsgb01-modal-comparisons 33

Department for Transport statisticsTransport Statistics Great Britain
Table TSGB0110Time taken to travel to work by region of workplace, GOR, FMC and country: October to December 2011
Percentage/minutes
Area of Workplace <20 minutes <40 minutes <60 minutes <90 minutes Men Women All people
North East 48 85 95 99 23 21 22 Tyne and Wear 43 82 93 99 24 23 24 Rest of North East 53 89 96 99 22 18 20
North West 42 81 92 98 27 23 25 Greater Manchester 36 78 91 98 28 25 27 Merseyside 38 81 92 98 26 25 25 Rest of North West 50 83 94 98 25 20 23
Yorkshire and Humberside 44 81 92 98 26 22 24 South Yorkshire 43 82 94 99 24 23 23 West Yorkshire 42 78 91 98 27 23 25 Rest of Yorkshire and Humberside 48 86 93 98 26 19 23
East Midlands 48 85 94 98 25 20 22
West Midlands 44 81 92 98 27 22 25 West Midlands and Met. 36 76 91 97 30 25 28 Rest of West Midlands 53 86 94 98 23 20 22
East of England 47 81 92 97 27 22 24
London 18 47 67 90 47 40 44 Central London 6 28 54 85 56 52 55 Rest of Inner London 17 44 65 90 47 43 45 Outer London 32 68 83 95 36 28 32
South East 45 80 90 97 29 22 25
South West 48 84 94 98 24 20 22
England 41 76 88 97 30 25 28 Wales 51 85 95 99 23 20 21 Scotland 46 81 92 98 28 22 25
Great Britain 42 77 89 97 30 24 27
Last updated: August 2012 (revised following 2011 reweighting)Next update: May 2013
Source: Office for National Statistics, Labour Force Survey
GOR=Government Office Region 020 7944 2519FMC=Former Metropolitan County Email: [email protected]
The figures in this table are National StatisticsNotes and definitions
Cumulative percentage Mean time
https://www.gov.uk/government/statistical-data-sets/tsgb01-modal-comparisons 34
Department for Transport statisticsTransport Statistics Great Britain
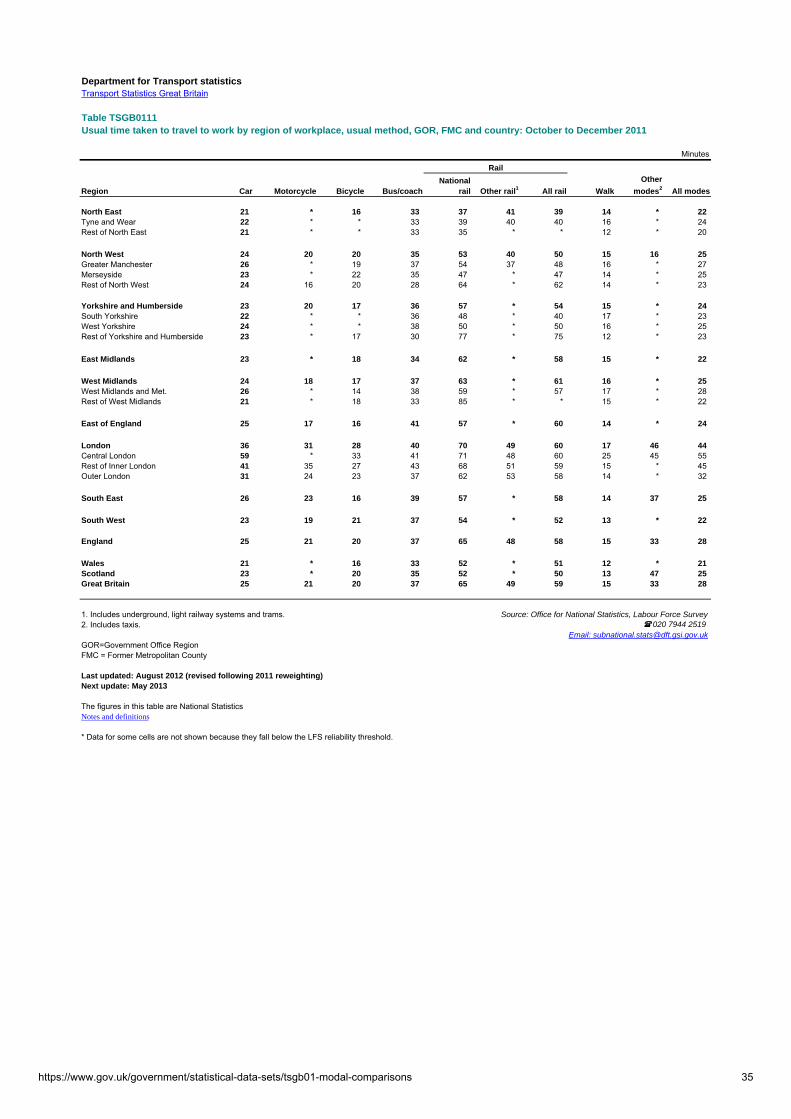
Table TSGB0111Usual time taken to travel to work by region of workplace, usual method, GOR, FMC and country: October to December 2011
Minutes
Region Car Motorcycle Bicycle Bus/coachNational
rail Other rail1 All rail Walk
Other
modes2 All modes
North East 21 * 16 33 37 41 39 14 * 22 Tyne and Wear 22 * * 33 39 40 40 16 * 24 Rest of North East 21 * * 33 35 * * 12 * 20
North West 24 20 20 35 53 40 50 15 16 25 Greater Manchester 26 * 19 37 54 37 48 16 * 27 Merseyside 23 * 22 35 47 * 47 14 * 25 Rest of North West 24 16 20 28 64 * 62 14 * 23
Yorkshire and Humberside 23 20 17 36 57 * 54 15 * 24 South Yorkshire 22 * * 36 48 * 40 17 * 23 West Yorkshire 24 * * 38 50 * 50 16 * 25 Rest of Yorkshire and Humberside 23 * 17 30 77 * 75 12 * 23
East Midlands 23 * 18 34 62 * 58 15 * 22
West Midlands 24 18 17 37 63 * 61 16 * 25 West Midlands and Met. 26 * 14 38 59 * 57 17 * 28 Rest of West Midlands 21 * 18 33 85 * * 15 * 22
East of England 25 17 16 41 57 * 60 14 * 24
London 36 31 28 40 70 49 60 17 46 44 Central London 59 * 33 41 71 48 60 25 45 55 Rest of Inner London 41 35 27 43 68 51 59 15 * 45 Outer London 31 24 23 37 62 53 58 14 * 32
South East 26 23 16 39 57 * 58 14 37 25
South West 23 19 21 37 54 * 52 13 * 22
England 25 21 20 37 65 48 58 15 33 28
Wales 21 * 16 33 52 * 51 12 * 21 Scotland 23 * 20 35 52 * 50 13 47 25 Great Britain 25 21 20 37 65 49 59 15 33 28
1. Includes underground, light railway systems and trams. Source: Office for National Statistics, Labour Force Survey2. Includes taxis. 020 7944 2519
Email: [email protected]=Government Office RegionFMC = Former Metropolitan County
Last updated: August 2012 (revised following 2011 reweighting)Next update: May 2013
The figures in this table are National StatisticsNotes and definitions
Rail
* Data for some cells are not shown because they fall below the LFS reliability threshold.
https://www.gov.uk/government/statistical-data-sets/tsgb01-modal-comparisons 35
Department for Transport statisticsTransport Statistics Great Britain
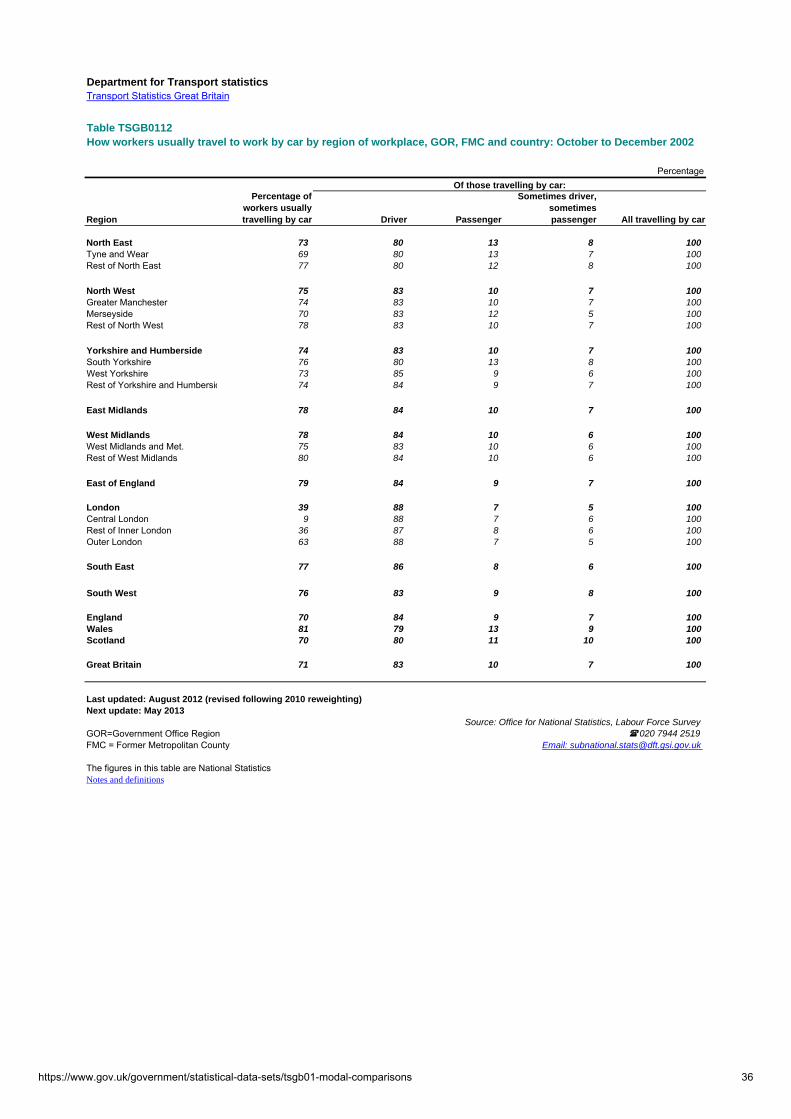
Table TSGB0112How workers usually travel to work by car by region of workplace, GOR, FMC and country: October to December 2002
Percentage
Region
Percentage of workers usually travelling by car Driver Passenger
Sometimes driver, sometimes passenger All travelling by car
North East 73 80 13 8 100 Tyne and Wear 69 80 13 7 100 Rest of North East 77 80 12 8 100
North West 75 83 10 7 100 Greater Manchester 74 83 10 7 100 Merseyside 70 83 12 5 100 Rest of North West 78 83 10 7 100
Yorkshire and Humberside 74 83 10 7 100 South Yorkshire 76 80 13 8 100 West Yorkshire 73 85 9 6 100 Rest of Yorkshire and Humbersid 74 84 9 7 100
East Midlands 78 84 10 7 100
West Midlands 78 84 10 6 100 West Midlands and Met. 75 83 10 6 100 Rest of West Midlands 80 84 10 6 100
East of England 79 84 9 7 100
London 39 88 7 5 100 Central London 9 88 7 6 100 Rest of Inner London 36 87 8 6 100 Outer London 63 88 7 5 100
South East 77 86 8 6 100
South West 76 83 9 8 100
England 70 84 9 7 100 Wales 81 79 13 9 100 Scotland 70 80 11 10 100
Great Britain 71 83 10 7 100
Last updated: August 2012 (revised following 2010 reweighting)Next update: May 2013
Source: Office for National Statistics, Labour Force SurveyGOR=Government Office Region 020 7944 2519FMC = Former Metropolitan County Email: [email protected]
The figures in this table are National StatisticsNotes and definitions
Of those travelling by car:
https://www.gov.uk/government/statistical-data-sets/tsgb01-modal-comparisons 36

Department for Transport statisticsModal comparisons
Table TSGB0113Overseas travel: visits to and from the United Kingdom by mode: 2001-2011
Thousands/percentage
2001 2002 2003 2004 2005 2006 2007 2008 2009 2010 2011% of total
in 2011
Visits to the United Kingdom by overseas residents 1
Air 16,054 17,098 17,635 20,002 22,043 24,588 25,089 24,024 22,080 21,430 22,631 73%
Sea 4,002 4,405 4,369 4,770 4,675 4,858 4,459 4,495 4,462 4,531 4,496 15%
Channel Tunnel 2,779 2,677 2,711 2,983 3,252 3,267 3,230 3,369 3,347 3,842 3,670 12%
Total 22,835 24,180 24,715 27,755 29,970 32,713 32,778 31,888 29,889 29,803 30,798 100%
Unweighted sample size (numbers) 40,124 39,571 38,099 41,848 44,574 45,246 41,740 36,683 47,304 46,740 42,785
Visits abroad by United Kingdom Residents 2
Air 43,011 43,990 47,101 50,435 53,626 56,460 56,329 56,041 46,657 43,239 44,723 79%
Sea 9,651 10,038 9,200 8,950 8,102 8,411 8,473 8,145 7,559 8,056 7,857 14%
Channel Tunnel 5,619 5,349 5,123 4,809 4,713 4,665 4,649 4,825 4,398 4,267 4,255 7%
Total 58,281 59,377 61,424 64,194 66,441 69,536 69,450 69,011 58,614 55,562 56,836 100%
Unweighted sample size (numbers) 53,438 54,952 55,298 57,686 63,427 63,715 57,558 57,312 66,935 65,953 62,646
1 Mode shown is that for departure from the United Kingdom.2 Mode shown is that for return to the United Kingdom.
Telephone: 020 7944 3088 Source - International Passenger Survey, ONSEmail: [email protected] Last updated December 2012
Next updated December 2013The figures in this table are National Statistics
https://www.gov.uk/government/statistical-data-sets/tsgb01-modal-comparisons 37

Department for Transport statisticsModal comparisons
Table TSGB0114
Overseas travel: visits to and from the United Kingdom by purpose and area; all modes 2001-2011
Thousands/percentage
2001 2002 2003 2004 2005 2006 2007 2008 2009 2010 2011% of total
in 2011
Visits to the United Kingdom by overseas residents 1
North America 4,228 4,272 3,997 4,356 4,234 4,764 4,403 3,806 3,564 3,397 3,586 12%
EU 27 13,602 14,866 15,783 17,818 19,714 21,287 21,824 21,627 20,331 20,266 20,348 66%
Other Europe 1,255 1,351 1,424 1,606 1,851 2,090 2,063 2,039 1,752 1,780 2,090 7%
Other Countries 3,751 3,691 3,511 3,975 4,171 4,572 4,488 4,416 4,242 4,360 4,774 16%
Total 22,835 24,180 24,715 27,755 29,970 32,713 32,778 31,888 29,889 29,803 30,798 100%
Holiday 7,585 7,735 7,973 9,275 9,713 10,566 10,758 10,923 11,424 11,668 12,008 39%
Business 6,778 7,158 6,967 7,470 8,168 9,019 8,845 8,124 6,579 6,793 7,238 24%
Visiting Friends or relatives 5,898 6,398 6,978 7,861 8,687 9,406 9,720 9,727 8,783 8,408 8,841 29%
Miscellaneous 2,574 2,888 2,797 3,149 3,401 3,722 3,456 3,113 3,103 2,935 2,710 9%
Total 22,835 24,180 24,715 27,755 29,970 32,713 32,778 31,888 29,889 29,803 30,798 100%
Unweighted sample size (number) 40,124 39,571 38,099 41,848 44,574 45,246 41,740 36,683 47,304 46,740 42,785
Visits abroad by United Kingdom Residents 2
North America 4,656 4,211 4,142 4,780 4,869 4,702 4,587 4,629 3,652 3,653 3,668 6%
EU 27 45,334 46,499 48,066 48,583 49,390 51,314 51,186 50,081 42,396 38,925 40,487 71%
Other Europe 2,239 2,380 2,601 2,942 3,448 3,856 4,002 4,343 3,548 3,640 3,579 6%
Other Countries 6,052 6,287 6,615 7,889 8,734 9,664 9,675 9,958 9,018 9,344 9,103 16%
Total 58,281 59,377 61,424 64,194 66,441 69,536 69,450 69,011 58,614 55,562 56,836 100%
Holiday 38,670 39,902 41,197 42,912 44,175 45,287 45,437 45,531 38,492 36,422 36,819 65%
Business 8,220 8,073 7,892 8,140 8,556 9,102 9,018 8,920 6,887 6,639 6,846 12%
Visiting Friends or relatives 7,727 7,870 8,527 9,799 10,648 11,963 12,214 12,392 11,592 10,850 11,594 20%
Miscellaneous 3,664 3,532 3,807 3,343 3,063 3,184 2,781 2,166 1,643 1,652 1,576 3%
Total 58,281 59,377 61,424 64,194 66,441 69,536 69,450 69,011 58,614 55,562 56,836 100%
Unweighted sample size (number) 53,438 54,952 55,298 57,686 63,427 63,715 57,558 57,312 66,935 65,953 62,646
1 Area shown is that for the country of residence2 Area shown is that for the main country of visit
Telephone: 020 7944 3088 Source - International Passenger Survey, ONSEmail: [email protected] Last updated December 2012
Next updated December 2013The figures in this table are National Statistics
https://www.gov.uk/government/statistical-data-sets/tsgb01-modal-comparisons 38

Department for Transport statisticsModal comparisons
Table TSGB0115
Overseas travel: visits and spending by mode, area and purpose of visit, 2011
Unweighted sample size
visits spending visits spending visits spending visits spending
(thousands) (£ million) (thousands) (£ million) (thousands) (£ million) (thousands) (£ million)
Visits to and spending in the United Kingdom by overseas residents 1
North America 3,157 2,648 141 53 288 173 3,586 2,874 6,474
EU27 13,529 6,118 3,974 1,308 2,844 831 20,348 8,257 24,791
Other Europe 1,974 1,512 80 39 * * 2,090 1,575 2,849
Other Countries 3,971 4,854 300 182 502 257 4,774 5,292 8,671
Total 22,631 15,132 4,496 1,582 3,670 1,285 30,798 17,998 42,785
Holiday 7,951 5,479 2,050 873 2,006 692 12,008 7,043 15,624
of which inclusive tour 720 534 818 300 500 173 2,038 1,007 2,642
Business 5,400 3,926 1,056 186 782 279 7,238 4,390 10,562
Visiting friends or relatives 7,137 3,444 1,045 313 660 205 8,841 3,963 12,649
Miscellaneous 2,143 2,254 345 208 222 107 2,710 2,569 3,950
Total 22,631 15,132 4,496 1,582 3,670 1,285 30,798 17,998 42,785
Visits and spending abroad by United Kingdom Residents 2
North America 3,663 3,795 * * . . 3,668 3,802 5,057
EU27 29,402 13,235 6,896 2,423 4,188 1,487 40,487 17,145 42,873
Other Europe 3,433 1,852 * * 60 43 3,579 1,956 3,758
Other Countries 8,226 7,673 870 1,118 * * 9,103 8,798 10,958
Total 44,723 26,555 7,857 3,610 4,255 1,537 56,836 31,701 62,646
Holiday 28,827 17,606 5,288 2,847 2,705 1,088 36,819 21,541 38,492
of which inclusive tour 12,028 7,960 2,059 1,638 653 268 14,740 9,866 14,656
Business 5,590 4,085 536 211 720 236 6,846 4,532 8,382
Visiting friends or relatives 9,474 4,009 1,513 437 608 142 11,594 4,588 14,108
Miscellaneous 832 855 521 114 223 72 1,576 1,041 1,664
Total 44,723 26,555 7,857 3,610 4,255 1,537 56,836 31,701 62,646
1 Mode shown is that for departure from the United Kingdom; area shown is that for the country of residence.2 Mode shown is that for return to the United Kingdom; area shown is that for the main country of visit
Telephone: 020 7944 3088 Source - International Passenger Survey, ONSEmail: [email protected] Last updated December 2012
Next updated December 2013The figures in this table are National Statistics
Air Sea Channel Tunnel Total
https://www.gov.uk/government/statistical-data-sets/tsgb01-modal-comparisons 39

Department for Transport statisticsTransport Statistics Great Britain
Table TSGB0116a
All in employment in transport related occupations1 and industries2,3 : April - June 2012
Thousands (GB)
SOC2010 unit group Occupation
Transportation and
storage industry
Other industry sections
All industries
1161 41 28 694134 28 39 671252 * 31 321226, 6212, 6219 11 69 813511, 3512, 8233 24 8 323513, 8232 15 5 206214 30 * 346215, 8234, 8231 53 6 598213 92 12 1048211 151 128 2808212 64 122 1878214 184 21 2055231 18 167 1865232, 5234 * 33 338135 * 13 148215 * 29 308239 6 11 17
719 726 1,449658 26,241 27,017
1,3794 26,979 28,620
Table TSGB0116b
All in employment in transport related occupations1 and industries2,3 : April - June 2012
Thousands (GB)
OccupationRail
transportOther land
transportWater
transportAir transport
Warehousing, storage, support
activities for transportation
Postal and courier
activities
All transportation
and storage
All transport related occupations 43 474 19 37 80 67 719Other occupations 33 145 25 23 214 218 658All jobs 76 619 44 61 294 286 1,3794
1 Main job only Source: Office for National Statistics, Labour Force Survey
2 Totals include jobs not allocated an occupation or industry3 Based on Standard Industrial Classification 2007 (SIC2007) 020 7944 2519
Section H Transportation and storage: Email: [email protected] - Land transport and transport via pipelines50 - Water transport51 - Air transport52 - Warehousing and support activities for transportation53 - Postal and courier activities
4 Includes some non-transport related occupations in transport industries* Data for some cells are not shown because they fall below the LFS reliability threshold.
Last updated: September 2012Next update: September 2013
The figures in this table are National StatisticsNotes and definitions
Air traffic controllers, pilots, operatives, etc.Ships officers, marine and waterway operativesAir travel assistants
Transport and logistic managersTransport and distribution clerksGarage managers and proprietorsTravel agents and service occupations
Rail travel assistants, operatives, train and tram driversBus and coach driversHeavy goods vehicle driversVan driversTaxi and cab drivers and chauffeursVehicle technicians, mechanics and electriciansVehicle body builders, repairers and paintersTyre, exhaust and windscreen fitters
All jobs
Driving instructorsOther drivers and transport operativesAll transport related occupationsOther occupations
https://www.gov.uk/government/statistical-data-sets/tsgb01-modal-comparisons 40

Department for Transport statisticsModal comparisons
Table TSGB0117
UK Public Expenditure on Transport by Country and Spending Authority:1 from 2005/06
£ million (outturn prices)
2005/06 2006/07 2007/08 2008/09 2009/10 2010/11 2011/12
England 13,621 15,555 15,940 16,409 18,052 16,593 15,532
Central government expenditure 2 5,239 7,154 7,314 7,372 8,336 7,295 6,796
Capital 2,535 4,110 4,233 5,131 5,720 5,194 4,798Strategic roads 3 767 1,154 1,090 1,151 1,968 1,626 1,311Local roads 4 0 0 42 100 217 134 104Local public transport 0 0 0 0 6 6 18Railways 5 1,752 2,927 3,049 3,875 3,522 3,419 3,361Other transport 16 29 53 5 8 8 3
Current / resource 2,703 3,044 3,081 2,241 2,616 2,101 1,998Strategic roads 3 1,379 1,471 1,473 1,643 1,361 1,113 1,109Local public transport 364 448 517 431 449 418 422Railways 5 702 824 782 -133 474 301 272Other transport 258 301 309 299 331 269 195
Local government expenditure 6,779 6,797 7,130 7,529 8,289 7,870 7,001
Capital 2,834 2,697 2,803 3,247 3,650 3,763 3,072Local roads 2,244 2,170 2,299 2,673 2,607 2,803 2,065Local public transport 580 518 471 508 1,013 938 988Other transport 9 9 33 65 30 21 18
Current / resource 3,946 4,100 4,327 4,282 4,638 4,107 3,929National roads 40 40 0 0 0 0 0Local roads 1,556 1,551 1,572 1,546 1,759 1,396 1,338Local public transport 1,403 1,534 1,698 2,157 1,992 1,784 1,727Railways 5 947 974 1,008 481 769 812 770Other transport 0 0 49 99 118 115 93
Public Corporation expenditure 1,603 1,604 1,495 1,509 1,427 1,428 1,735Capital: National roads 15 22 22 15 9 0 0Capital: Railways 1,588 1,583 1,473 1,494 1,419 1,428 1,735
Scotland 1,827 2,706 2,838 2,727 2,923 2,727 2,722
Central government expenditure 2 971 1,753 1,858 1,783 1,931 1,802 1,747
Capital 505 763 803 771 934 764 760National roads 209 266 205 272 422 322 299Railways 290 497 583 493 506 435 452Other transport 5 1 14 5 6 7 9
Current / resource 466 990 1,055 1,012 997 1,038 987National roads 164 199 233 216 174 230 150Local public transport 59 224 227 247 257 240 245Railways 122 457 481 412 419 429 437Other transport 121 110 114 136 146 139 155
Local government expenditure 825 912 967 930 981 915 964
Capital 369 466 501 443 483 391 495Local roads 256 314 280 288 300 285 368Railways 28 108 88 6 8 6 7Other transport 85 44 133 149 175 100 120
Current / resource 456 445 466 487 498 524 469National roads 15 16 16 16 16 15 16Local roads 342 336 345 366 384 405 342Local public transport 20 16 20 18 18 18 23Other transport 78 78 85 87 80 85 88
Public Corporation expenditure 31 41 12 14 11 10 11Capital: National roads 1 3 2 2 1 0 0Capital: Railways 12 9 3 4 5 5 6Capital: Other transport 18 29 7 8 6 6 6
Wales 855 888 934 1,029 1,153 1,169 1,074
Central government expenditure 2 457 469 484 564 725 730 633
Capital 159 225 222 265 353 384 334National roads 91 113 129 116 161 200 125Local roads 0 3 1 2 3 0 0Railways 64 109 92 147 189 184 208Other transport 4 1 0 0 0 0 0
Current / resource 298 244 262 299 371 346 300National roads 64 71 62 74 79 97 109Local roads 0 0 0 0 0 0 0Local public transport 21 20 23 23 28 21 0Railways 202 147 170 195 256 223 187Other transport 12 6 7 7 9 6 4
Local government expenditure 392 412 445 461 425 436 438
Capital 195 210 233 227 198 206 221Local roads 163 185 171 192 176 181 194Local public transport 29 20 61 33 22 25 27Other transport 4 4 1 2 0 0 0
Current / resource 196 202 212 234 226 230 217Local roads 148 149 156 164 155 165 164Local public transport 28 29 30 36 34 33 33Other transport 20 24 25 34 37 32 20
Public Corporation expenditure 7 8 6 4 4 3 4Capital: National roads 1 3 1 1 0 0 0Capital: Railways 6 5 4 3 3 3 4
https://www.gov.uk/government/statistical-data-sets/tsgb01-modal-comparisons 41

Table TSGB0117 (continued)UK Public Expenditure on Transport:1 from 2005/06 (continued)
£ million (outturn prices)
2005/06 2006/07 2007/08 2008/09 2009/10 2010/11 2011/12
Great Britain 16,303 19,149 19,712 20,165 22,128 20,489 19,328
Central government expenditure 2 6,667 9,376 9,656 9,718 10,992 9,827 9,176
Capital 3,199 5,098 5,259 6,166 7,008 6,342 5,891National roads 1,068 1,533 1,424 1,539 2,551 2,148 1,735Local roads 0 3 43 102 220 134 104Local public transport 0 0 0 0 6 6 18Railways 2,107 3,532 3,724 4,515 4,217 4,038 4,021Other transport 25 31 68 10 14 15 12
Current / resource 3,467 4,278 4,398 3,552 3,984 3,486 3,284National roads 1,608 1,741 1,768 1,934 1,615 1,440 1,368Local roads 0 0 0 0 0 0 0Local public transport 444 692 767 701 733 679 668Railways 1,026 1,428 1,433 475 1,149 953 896Other transport 390 417 429 442 486 414 353
Local government expenditure 7,996 8,120 8,542 8,920 9,694 9,221 8,402
Capital 3,398 3,373 3,537 3,916 4,332 4,359 3,788Local roads 2,663 2,670 2,751 3,153 3,084 3,270 2,628Local public transport 609 538 532 541 1,035 963 1,015Railways 28 108 88 6 8 6 7Other transport 98 58 167 216 205 121 138
Current / resource 4,598 4,747 5,005 5,004 5,362 4,861 4,614National roads 55 56 16 16 16 15 16Local roads 2,046 2,037 2,074 2,077 2,297 1,966 1,844Local public transport 1,452 1,579 1,748 2,211 2,045 1,835 1,782Railways 947 974 1,008 481 769 812 770Other transport 99 101 159 220 235 233 202
GB Public Corporations 1,640 1,653 1,513 1,527 1,442 1,441 1,750
Capital 1,640 1,653 1,513 1,527 1,442 1,441 1,750Capital: National roads 17 27 26 18 10 0 0Capital: Railways 1,605 1,597 1,480 1,501 1,426 1,436 1,744Capital: Other transport 18 29 7 8 6 6 6
Northern Ireland 357 386 541 562 591 701 598
Outside UK 6 211 188 179 133 96 99 114
Not Identifiable by country 7 168 161 173 182 189 166 164
UK Total 17,039 19,885 20,605 21,042 23,003 21,456 20,205
1. Figures taken from Country and Regional Analysis, HMT for 2007/08 onwards see http://www.hm-treasury.gov.uk/9802.htm earlier figures were published in the similar exercises in 2011, see for example http://www.hm-treasury.gov.uk/pespb_natstats_oct2011.htm Includes revisions for previous years.2. Figures exclude grants to local authorities. Net expenditure includes EU grants treated as receipts.3. In England, funding to Highways Agency, excluding the cost of capital.4. Local Roads capital expenditure in England was in London.5. The railway category covers both National Rail and the London Underground. It also includes those companies considered to be in public ownership, such as London and Continental Railways and GNER.6. Expenditure attributed to "outside the UK" is largely capital expenditure attributed to public corporations for spend on railways, with a small amount to Central Government railway spend.7. Expenditure in the not identifiable by country is "other transport" and consists largely of expenditure on areas such as Civil Aviation Authority, Transport Security, Civil aviation services, Accident and Investigation work and others which are deemed to benefit the whole country.
Telephone: 020 7944 4442 Source: HM TreasuryEmail: [email protected] Last updated: November 2012
Next update: November 2013The figures in this table are National Statistics
https://www.gov.uk/government/statistical-data-sets/tsgb01-modal-comparisons 42

Department for Transport statisticsModal comparisons
Table TSGB0118UK Public Expenditure on Transport by function1: from 2005/06
£ million (outturn prices)
2005/06 2006/07 2007/08 2008/09 2009/10 2010/11 2011/12
National Roads 2,760 3,370 3,260 3,539 4,215 3,633 3,148Capital 1,085 1,560 1,450 1,558 2,561 2,148 1,736Current 1,675 1,810 1,810 1,981 1,653 1,484 1,412
Local Roads 4,963 4,946 5,156 5,669 5,995 5,868 4,904Capital 2,766 2,763 2,931 3,430 3,557 3,736 2,889Current 2,197 2,183 2,226 2,239 2,438 2,133 2,015
Local Public Transport 2,573 2,909 3,150 3,514 3,894 3,603 3,557Capital 616 571 587 553 1,062 1,033 1,052Current 1,957 2,338 2,563 2,961 2,832 2,570 2,506
Railways 5,921 7,826 7,943 7,159 7,705 7,348 7,650Capital 3,937 5,413 5,460 6,150 5,775 5,572 5,974Current 1,984 2,413 2,484 1,009 1,930 1,776 1,676
Other Transport 822 834 1,096 1,160 1,195 1,003 946Capital 176 161 311 290 257 158 197Current 646 673 785 870 938 846 749
UK total 17,039 19,885 20,605 21,042 23,003 21,456 20,205Capital 8,580 10,467 10,739 11,981 13,211 12,647 11,848Current 8,459 9,417 9,867 9,061 9,792 8,808 8,357
1. Figures taken from Country and Regional Analysis, HMT for 2007/08 onwards see http://www.hm-treasury.gov.uk/9802.htm earlier figures were published in the similar exercises in 2011, see for example http://www.hm-treasury.gov.uk/pespb_natstats_oct2011.htm These include public spending by central and local government as well as capital spending by public corporations in the UK. There may be some slight differences between these figures and those from the downloadable HMT tables referenced in other tables due to differences in the timing of the data collections.
Telephone: 020 7944 4442 Source: HM TreasuryEmail: [email protected]
Last updated: November 2012The figures in this table are National Statistics Next update: November 2013
https://www.gov.uk/government/statistical-data-sets/tsgb01-modal-comparisons 43
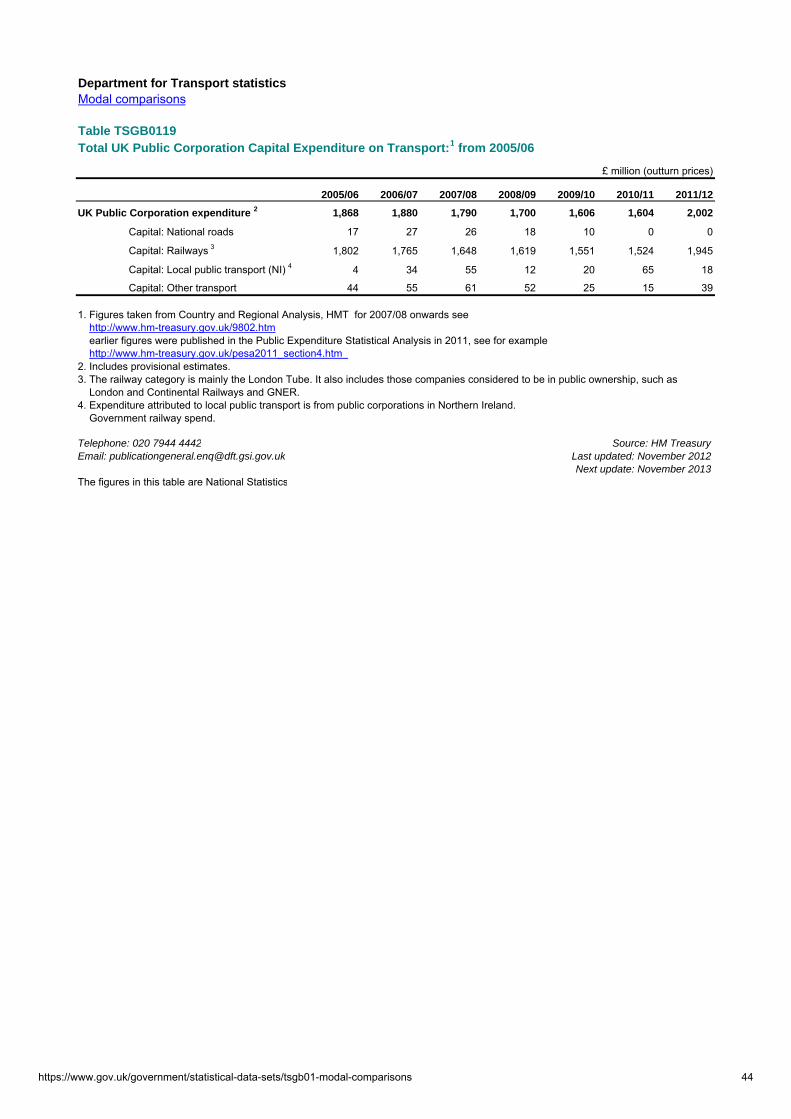
Department for Transport statisticsModal comparisons
Table TSGB0119Total UK Public Corporation Capital Expenditure on Transport:1 from 2005/06
£ million (outturn prices)
2005/06 2006/07 2007/08 2008/09 2009/10 2010/11 2011/12
UK Public Corporation expenditure 2 1,868 1,880 1,790 1,700 1,606 1,604 2,002
Capital: National roads 17 27 26 18 10 0 0
Capital: Railways 3 1,802 1,765 1,648 1,619 1,551 1,524 1,945
Capital: Local public transport (NI) 4 4 34 55 12 20 65 18
Capital: Other transport 44 55 61 52 25 15 39
1. Figures taken from Country and Regional Analysis, HMT for 2007/08 onwards see http://www.hm-treasury.gov.uk/9802.htm earlier figures were published in the Public Expenditure Statistical Analysis in 2011, see for example http://www.hm-treasury.gov.uk/pesa2011_section4.htm 2. Includes provisional estimates.3. The railway category is mainly the London Tube. It also includes those companies considered to be in public ownership, such as London and Continental Railways and GNER.4. Expenditure attributed to local public transport is from public corporations in Northern Ireland. Government railway spend.
Telephone: 020 7944 4442 Source: HM TreasuryEmail: [email protected] Last updated: November 2012
Next update: November 2013The figures in this table are National Statistics
https://www.gov.uk/government/statistical-data-sets/tsgb01-modal-comparisons 44

Dep
artm
ent
for
Tra
nsp
ort
sta
tist
ics
Mod
al c
ompa
rison
s
Tab
le T
SG
B01
20P
ub
lic e
xpen
dit
ure
on
sp
ecif
ic t
ran
spo
rt a
reas
: G
reat
Bri
tain
1
£ m
illio
n (o
uttu
rn p
rices
)
2005
/06
2006
/07
2007
/08
2008
/09
2009
/10
2010
/11
2011
/12
Str
eet
Lig
hti
ng
46
350
652
058
757
158
659
1
Bu
s S
ervi
ce O
per
ato
rs G
ran
t243
544
147
250
451
550
551
2
Co
nce
ssio
nar
y F
ares
367
41,
002
1,10
21,
251
1,26
81,
322
1,36
2
Par
kin
g (
net
of
rece
ipts
) 4-2
7644
7-2
96-2
67-2
52-3
32
1. F
igur
es fo
r Stre
et L
ight
ing
take
n fro
m C
ount
ry a
nd R
egio
nal A
naly
sis,
HM
T fo
r 200
7/08
onw
ards
see
h
ttp://
ww
w.h
m-tr
easu
ry.g
ov.u
k/98
02.h
tm
ear
lier f
igur
es w
ere
publ
ishe
d in
the
sim
ilar e
xerc
ises
in 2
011,
see
for e
xam
ple
h
ttp://
ww
w.h
m-tr
easu
ry.g
ov.u
k/pe
spb_
nats
tats
_oct
2011
.htm
In
clud
es re
visi
ons
for p
revi
ous
year
s.
Oth
er fi
gure
s m
ainl
y fro
m L
ocal
Gov
ernm
ent F
inan
ce S
tatis
tics.
2.
Exc
lude
s co
ach
conc
essi
on3.
For
201
1/12
figu
res
for S
cotla
nd o
nly
incl
ude
bus
conc
essi
onar
y fa
res
(like
ly to
be
over
90%
of t
he to
tal)
4. N
egat
ive
are
gain
s. R
even
ue is
offs
et b
y ca
pita
l cha
rges
and
cap
ital c
osts
whe
re id
entif
ied.
Tel
epho
ne: 0
20 7
944
4442
Sou
rces
: Sco
ttish
Gov
ernm
ent;
Wel
sh L
ocal
Gov
ernm
ent F
inan
ce;
Em
ail:
publ
icat
iong
ener
al.e
nq@
dft.g
si.g
ov.u
kLo
cal A
utho
rity
Fin
ance
Sta
tistic
s (E
ngla
nd)
Last
upd
ated
: D
ecem
ber
2012
Nex
t upd
ate:
Dec
embe
r 20
13
https://www.gov.uk/government/statistical-data-sets/tsgb01-modal-comparisons 45

Department for Transport statisticsModal comparisons
Table TSGB0121
Household expenditure on transport: United Kingdom: 2001/02 - 2010
£ per week/percentage
Transport (COICOP categories) 1 2000/01 2001/02 2002/03 2003/04 2004/05 2005/06 2006 2006 2007 2008 2009 2010
(a) Motoring and bicycle costs
Purchase of vehicles 23.20 25.80 26.60 28.10 25.10 23.90 23.40 22.90 22.80 21.10 19.50 19.50New cars and vans 10.60 10.70 11.30 11.40 10.10 9.60 8.30 8.00 7.80 6.60 6.50 6.50Second-hand cars and vans 11.80 14.40 14.50 16.00 14.10 14.00 14.50 14.20 14.40 13.60 12.40 12.20Motorcycles and scooters 0.60 0.50 0.70 0.60 0.50 .. 0.30 0.30 0.40 0.60 0.40 0.40Other vehicles (mainly bicycles) .. 0.20 0.20 0.20 0.30 0.20 0.30 0.30 0.20 0.40 0.20 0.40Bicycle purchase 0.20 .. .. .. .. .. .. .. .. .. .. ..
Spares, accessories, repairs and servicing 6.40 7.00 7.30 6.90 7.80 8.00 8.00 7.80 8.10 8.60 7.90 9.10Car or van 6.00 6.80 6.90 6.60 7.50 7.70 7.70 7.50 7.80 8.30 7.60 8.70Motorcycle 0.20 0.10 0.20 0.20 0.10 0.20 0.20 0.20 0.20 0.00 0.20 0.10Bicycle 0.10 0.10 0.20 0.10 0.10 0.20 0.20 0.20 0.10 0.20 0.20 0.20
Petrol, diesel and other motor oils: 15.80 14.80 14.80 15.00 16.20 17.50 18.20 17.90 18.30 21.00 19.20 21.60Petrol 14.00 12.70 12.70 12.40 13.40 14.30 14.50 14.30 14.10 15.70 14.70 15.60Diesel 1.80 2.00 2.10 2.50 2.80 3.10 3.70 3.60 4.10 5.30 4.50 5.90Other motor oils 0.10 0.10 0.10 0.10 0.10 0.10 0.10 0.10 0.10 0.10 0.10 0.10
Other motoring costs 1.80 1.80 1.90 1.90 2.40 2.30 2.40 2.30 2.40 2.10 2.20 2.60
All motoring and bicycle costs 47.20 49.40 50.70 51.90 51.40 51.80 52.10 50.90 51.60 52.90 48.80 52.80
(b) Transport services
Rail and tube fares: 2.00 1.90 1.80 1.90 2.00 2.10 2.20 2.10 2.50 2.40 2.50 2.80Season tickets 0.60 0.60 0.60 0.70 0.70 0.70 0.80 0.70 0.80 1.00 0.80 1.00Other tickets 1.40 1.30 1.20 1.20 1.30 1.40 1.40 1.40 1.70 1.50 1.60 1.70
Bus and coach fares: 1.40 1.50 1.40 1.40 1.50 1.50 1.30 1.30 1.20 1.40 1.30 1.50Season tickets 0.30 0.30 0.40 0.40 0.40 0.40 0.40 0.40 0.40 0.50 0.40 1.50Other tickets 1.10 1.10 1.10 1.10 1.10 1.10 0.90 0.90 0.90 0.90 0.90 1.00
Combined tickets: 0.90 1.00 0.80 0.70 0.80 1.00 1.00 1.00 1.30 1.20 1.10 1.20Season tickets 0.70 0.80 0.60 0.50 0.60 0.80 0.80 0.80 0.90 0.90 0.90 0.90Other tickets 0.20 0.20 0.20 0.10 0.20 0.20 0.20 0.20 0.40 0.30 0.30 0.30
Air and other travel and transport: 4.30 4.10 4.50 4.80 3.80 5.40 5.50 5.50 5.10 5.40 4.80 6.60Air fares 2 1.30 1.20 1.50 1.90 1.00 2.50 2.20 2.20 1.80 1.80 1.20 2.70Other transport and travel 3.00 2.90 3.00 2.80 2.90 2.90 3.30 3.30 3.30 3.40 3.60 3.90
All transport services 8.60 8.40 8.50 8.80 8.10 9.90 10.00 9.90 10.10 10.50 9.60 12.10
55.90 57.80 59.20 60.70 59.60 61.70 62.00 60.80 61.70 63.40 58.40 64.90
All household expenditure 385.70 398.30 406.20 418.10 434.40 443.40 455.90 449.00 459.20 471.00 455.00 473.60
Percentage of household expenditure on transport 14.5 14.5 14.6 14.5 13.7 13.9 13.6 13.5 13.5 13.5 12.8 13.7
Key transport expenditure totals3:Motoring costs 55.10 58.50 61.70 62.40 62.60 63.80 62.40 61.40 62.00 63.60 60.00 63.50Fares and other travel costs 9.50 9.50 9.70 9.60 9.50 11.10 11.10 10.90 10.90 14.20 11.00 13.60All transport and travel 64.50 68.00 71.40 72.00 72.10 74.90 73.50 72.30 72.90 77.80 71.00 77.10
Adjusted for general inflation 2010 prices: Motoring costs 71.90 75.20 77.70 76.40 74.40 73.90 70.40 69.30 67.10 66.20 62.80 63.50Fares and other travel costs 12.40 12.20 12.20 11.80 11.30 12.90 12.50 12.30 11.80 14.80 11.50 13.60All transport and travel 84.20 87.40 89.90 88.20 85.70 86.70 82.90 81.60 78.90 81.00 74.30 77.10
Note: For further details see Family Spending: A Report on the 2010 Loving Costs and Food Survey available at: http://www.ons.gov.uk/ons/rel/family-spending/family-spending/family-spending-2011-edition/index.html
1 Data for 2000/01 are based on old Family Expenditure Survey categories which include some items excluded under COICOP, eg motor caravans audio equipment, helmets (see Notes and Definitions). Additional changes were made in 2006, see the link above for details.2 Excludes air fare component of package holidays abroad.3 Using Family Expenditure Survey classification, includes expenditure on motorcycles, bicycles, boats and vehicle taxation and insurance.
Telephone: 020 7944 4442 Source: Living Costs and Food Survey, ONSEmail: [email protected] and definitions Last updated: November 2011
Next update: 2013The figures in this table are National Statistics
All transport (excluding motor vehicle insurance and taxation and boat purchase and repairs)
https://www.gov.uk/government/statistical-data-sets/tsgb01-modal-comparisons 46

Department for Transport statisticsModal comparisons
Table TSGB0122
Retail and Consumer Prices Indices: Motoring Costs: 1997-2011
Index: 1997=100
Retail Prices Index
All items CPI
Operation of personal
transport equipment1All items
RPI
All
motor2
Motoring
running costs3
ONS Code D7BT D7CP CHAW CHBKYear
1997 100.0 100.0 100.0 100.0 100.01998 101.6 104.3 103.4 103.1 105.71999 102.9 110.9 105.0 105.6 113.32000 103.8 120.7 108.1 109.7 124.72001 105.0 120.3 110.0 109.1 124.62002 106.4 121.1 111.9 108.2 124.82003 107.8 127.2 115.1 109.6 130.42004 109.3 134.2 118.5 110.7 135.72005 111.5 143.7 121.9 111.4 143.02006 114.0 151.6 125.8 113.1 149.32007 116.7 157.2 131.2 114.5 155.02008 121.0 172.4 136.4 118.0 169.62009 123.5 168.0 135.7 117.2 168.32010 127.6 185.5 141.9 132.5 196.82011 133.3 203.6 149.3 144.2 224.3
1. Operation of personal transport equipment, covering motor running costs, includes spare parts and accessories, fuels and lubricants, maintenance and repairs and other services. It excludes the purchase of a vehicle, unlike the RPI all motoring index (CHAW) given here and in TSGB0123, and there are some other exclusions such as car insurance and
vehicle excise duty, which are also included in the RPI.2. The RPI all motor index includes purchase of a vehicle, maintenance, petrol and oil and tax and insurance. 3. The RPI motoring costs index excludes the purchase of a vehicle, but includes tax, such as Vehicle Excise Duty, and insurance.
Telephone: 020 7944 4442 Source: Consumer Prices and Inflation Division, ONSEmail: [email protected]
Last updated: July 2012Notes and Definitions Next update: Nov 2013The figures in this table are National Statistics.
Consumer Prices Index
https://www.gov.uk/government/statistical-data-sets/tsgb01-modal-comparisons 47

Department for Transport statisticsModal comparisons
Table TSGB0123
Retail Prices Index: transport components: 1997-2011
Index 1997=100
All items
RPIPurchase of
vehicleMainten
-tancePetrol
& oilTax &
Insurance
All
motor1 Rail fares
Bus & Coach
fares
ONS Code CHAW DOCS DOCT DOCU DOCV CHBK DOCW DOCX
Year
1997 100.0 100.0 100.0 100.0 100.0 100.0 100.0 100.01998 103.4 98.9 104.1 105.0 108.8 103.1 104.1 103.31999 105.0 94.7 108.2 113.8 117.6 105.6 107.9 107.02000 108.1 89.6 112.7 128.8 130.2 109.7 109.8 111.32001 110.0 88.3 118.2 122.2 137.0 109.1 114.0 116.02002 111.9 86.6 124.3 118.3 139.1 108.2 116.6 119.62003 115.1 84.1 131.7 122.6 145.1 109.6 118.6 124.62004 118.5 81.5 139.7 129.4 145.8 110.7 123.1 131.02005 121.9 77.3 148.2 140.8 143.9 111.4 128.1 139.62006 125.8 75.2 157.2 148.5 145.7 113.1 133.2 141.62007 131.2 73.2 165.3 152.6 152.4 114.5 140.0 149.72008 136.4 68.2 175.1 175.5 157.2 118.0 146.1 158.92009 135.7 67.7 182.3 161.6 175.2 117.2 153.9 168.52010 141.9 71.7 190.8 188.8 219.8 132.5 166.2 176.12011 149.3 70.4 200.2 216.1 265.2 144.2 178.0 187.8
1 The RPI all motor index includes purchase of a vehicle, maintenance, petrol and oil and tax and insurance. See Notes and definitions for further details.
Telephone: 020 7944 4442 Source: Consumer Prices and Inflation Division, ONSEmail: [email protected] Last updated: July 2012
Next update: Nov 2013
The figures in this table are National Statistics.
Notes and Definitions
Motor vehicles
https://www.gov.uk/government/statistical-data-sets/tsgb01-modal-comparisons 48

Department for Transport statisticsModal comparisons
Table TSGB0124
Gross Domestic Product, Retail Prices Index
and Consumer Prices Index deflators: 2000-2011/12
(a) Calendar years to 2011 price level
Year RPI Factor CPI Factor GDP factor
2000 1.381 1.285 1.2952001 1.357 1.270 1.2752002 1.335 1.254 1.2462003 1.297 1.237 1.2162004 1.260 1.221 1.1862005 1.225 1.196 1.1582006 1.187 1.169 1.1252007 1.138 1.142 1.1012008 1.095 1.103 1.0682009 1.101 1.079 1.0552010 1.052 1.045 1.0262011 1.000 1.000 1.000
(b) Fiscal years to 2011/12
Year RPI Factor CPI Factor GDP factor
2000/01 1.385 1.294 1.2992001/02 1.365 1.276 1.2752002/03 1.337 1.260 1.2442003/04 1.301 1.244 1.2172004/05 1.261 1.226 1.1822005/06 1.229 1.201 1.1562006/07 1.185 1.171 1.1262007/08 1.138 1.145 1.0982008/09 1.105 1.104 1.0692009/10 1.100 1.080 1.0532010/11 1.048 1.043 1.0242011/12 1.000 1.000 1.000
Note: GDP is revised so deflators may change whereas the CPI and RPI are not revised.
Telephone: 020 7944 4442 Source: Consumer Prices and Inflation Division, ONSEmail: [email protected]
Last updated: August 2012Next update: Nov 2013
The figures in this table are National Statistics.
Notes and Definitions
https://www.gov.uk/government/statistical-data-sets/tsgb01-modal-comparisons 49

Dep
artm
ent
for
Tra
nsp
ort
sta
tist
ics
Mod
al c
ompa
rison
s
Tab
le T
SG
B01
25
Fu
el d
uty
an
d V
ehic
le e
xcis
e d
uty
fro
m 1
987
£ m
illio
n
Fu
el D
uty
Lea
ded
p
etro
l/LR
PU
nle
aded
p
etro
lD
iese
l
Ult
ra lo
w
sulp
hu
r p
etro
l
Ult
ra lo
w
sulp
hu
r d
iese
lT
ota
l du
ty o
n
hyd
roca
rbo
n o
ilsH
ou
seh
old
sB
usi
nes
sT
ota
l
ON
S C
od
e 1
GB
HL
GB
HE
GB
HH
ZX
TK
GB
HI
GT
AP
2C
DD
ZE
KE
DC
MX
ZY
ear
1987
7,67
31,
612
991
2,60
319
888,
501
1,69
31,
065
2,75
819
898,
723
1,79
31,
122
2,91
519
904,
381
2,31
42,
217
9,46
61,
837
1,13
42,
971
1991
4,80
52,
870
2,69
810
,555
1,87
91,
093
2,97
219
924,
661
3,47
62,
947
11,2
811,
963
1,15
03,
113
1993
4,50
24,
242
3,48
412
,497
2,30
11,
181
3,48
219
944,
349
5,10
14,
257
13,9
842,
546
1,30
23,
848
1995
4,08
85,
901
5,12
715
,360
2,64
11,
313
3,95
419
963,
716
7,04
35,
888
16,8
952,
781
1,36
84,
149
1997
3,39
38,
073
6,52
814
618
,357
2,97
21,
362
4,33
419
982,
984
9,89
77,
088
806
20,9
963,
122
1,50
94,
631
1999
1,63
011
,952
1,27
47,
338
22,3
913,
308
1,56
54,
873
2000
1,10
511
,481
2396
89,
014
23,0
413,
191
1,41
54,
606
2001
650
1,90
665
10,1
178,
492
22,0
463,
324
778
4,10
220
0210
312
,624
9,02
922
,070
3,57
072
44,
294
2003
7012
,098
9,45
722
,476
3,92
379
74,
720
2004
6712
,160
10,1
6823
,412
3,95
580
84,
763
2005
2011
,688
10,8
2923
,346
3,95
380
94,
762
2006
1511
,274
11,2
0323
,448
4,14
586
55,
010
2007
1311
,313
12,1
4624
,512
4,50
687
85,
384
2008
1011
,114
12,2
8424
,790
4,63
988
55,
524
2009
911
,175
12,6
8325
,894
4,72
290
85,
630
2010
1011
,001
13,9
2327
,013
4,90
393
75,
840
2011
1110
,642
14,3
4626
,923
5,82
0
1. O
NS
Blu
e B
ook
code
s. T
he c
odes
use
d in
the
Env
ironm
enta
l Acc
ount
s ar
e di
ffere
nt.
2. D
uty
excl
udes
Val
ue A
dded
Tax
but
incl
udes
som
e du
ty fr
om o
ther
sou
rces
incl
udin
g oi
l and
gas
, as
wel
l as
duty
on
bioe
than
ol a
nd b
iodi
esel
use
d in
fuel
N
ote:
Incl
udes
revi
sion
s fro
m la
st y
ear's
tabl
e
Tel
epho
ne: 0
20 7
944
4442
S
ourc
es: T
able
11.
1 B
lue
Boo
k 20
11 E
ditio
n, O
NS
Em
ail:
publ
icat
iong
ener
al.e
nq@
dft.g
si.g
ov.u
kF
or u
pdat
es a
nd 2
011,
Env
ironm
enta
l Acc
ount
s 20
12, O
NS
The
figur
es in
this
tabl
e ar
e N
atio
nal S
tatis
tics.
Last
upd
ated
: Nov
embe
r 20
12N
otes
and
Def
initi
ons
Nex
t upd
ate:
Nov
201
3
Veh
icle
Exc
ise
Du
ty
https://www.gov.uk/government/statistical-data-sets/tsgb01-modal-comparisons 50

Transport Statistics Great Britain: 2012
Aviation
Key trends
After 3 years of decline, air transport movements at UK airports increased by 2 per cent in 2011 compared to 2010. Terminal passengers increased by 4 per cent. However, excluding the months affected by the ash cloud, snow and strikes in 2010, the increase in passengers was less than 1 per cent.
Aviation includes information on:
Activity at UK airports
Activity of UK airlines
Major international airports and airlines
Casualties and incidents
Freight handled fell by 1 per cent, following a 14 per cent increase in 2010. The fall in 2011 was due to a 3 per cent fall in freight ‘set down’ (essentially imports); freight ‘picked up’ (exports) rose by 1 per cent.
Trends in air traffic at UK airports, 1991 to 2011
0
50
100
150
200
250
300
1991 1993 1995 1997 1999 2001 2003 2005 2007 2009 2011
Ind
ex
: 1
99
1=
10
0
Air transport movements Terminal passengers Freight (tonnes)
The number of terminal passengers on domestic services peaked in 2005 at 24.7 million and has since fallen by 24 per cent to 19 million in 2011 (excluding double counting at domestic airports). The number of terminal passengers on international services peaked two years later, at 192 million in 2007. The number then fell for 3 consecutive years before increasing again by 5 per cent to 181 million in 2011.
https://www.gov.uk/government/statistical-data-sets/tsgb02 51

UK Airports
Terminal passengers by airport, 2011 Heathrow is the UK’s busiest airport.
In 2011 it handled 23 per cent of air transport movements, 32 per cent of terminal passengers and 65 per cent of freight tonnes.
113 117 120 129 133 137 140 137 130 127 134
67 71 7986 94 98 100 99
88 83 86
0
50
100
150
200
250
300
2001 2002 2003 2004 2005 2006 2007 2008 2009 2010 2011
Ter
min
al p
asse
ng
ers
(mill
ion
s)
London airports Regional airports
Worldwide, Heathrow had the largest number of terminal passengers on international flights in 2011 at 65 million. In terms of total terminal passengers (domestic and international), Heathrow was the third largest airport in 2011 after Atlanta and Beijing.
In 2011, the five London airports accounted for 61 per cent of all
terminal passengers at UK airports, down from 63 per cent in 2001.
Gatw ick15%
Birmingham4%
Other regional
22%
Edinburgh4%
Luton4%
London City1%
Manchester9%
Stansted8%
Heathrow32%
Between 2001 and 2011, overall terminal passenger numbers increased by 28 per cent at the airports outside London compared with 18 per cent at the five London airports. However, non-London airports experienced a proportionally larger fall since the peak in 2007 at 15 per cent compared with a 4 per cent fall at the London airports.
Number of terminal passengers at London and non-London airports1, 2001 to 2011
1 ‘London airports’ covers Heathrow, Gatwick, Stansted, Luton and London City; ‘regional airports’ covers all other UK airports.
https://www.gov.uk/government/statistical-data-sets/tsgb02 52
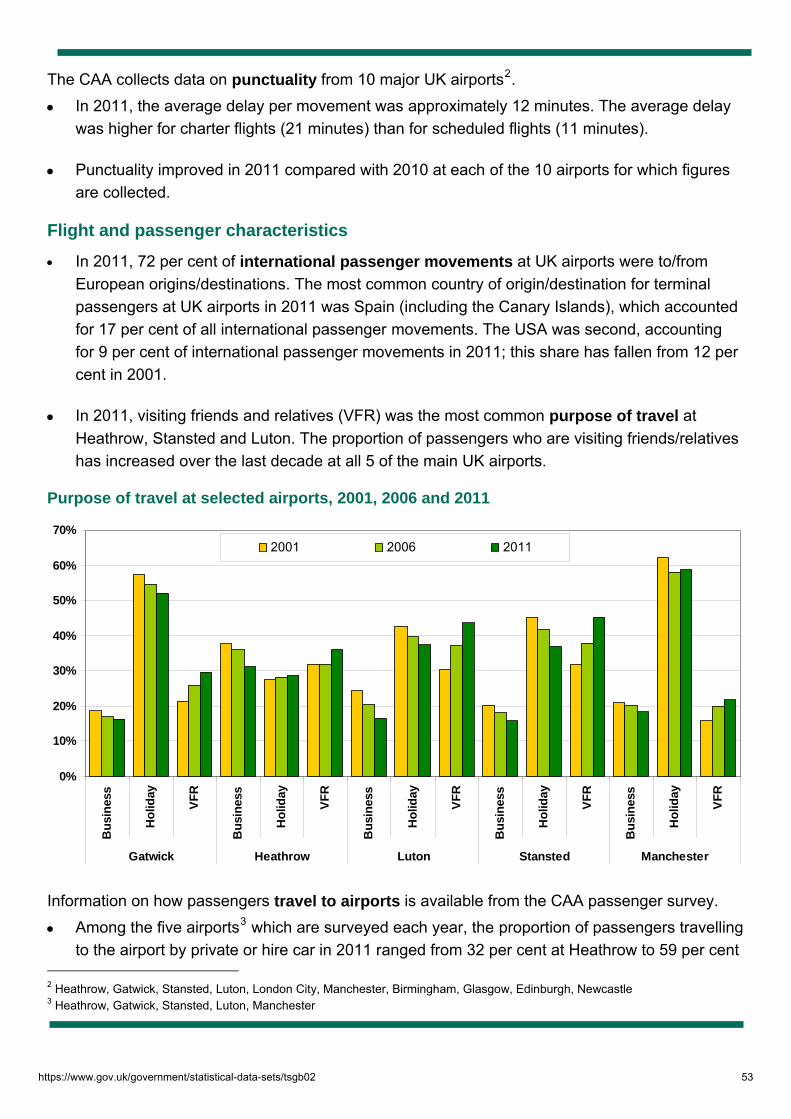
The CAA collects data on punctuality from 10 major UK airports2.
In 2011, the average delay per movement was approximately 12 minutes. The average delay was higher for charter flights (21 minutes) than for scheduled flights (11 minutes).
Punctuality improved in 2011 compared with 2010 at each of the 10 airports for which figures are collected.
Flight and passenger characteristics
In 2011, 72 per cent of international passenger movements at UK airports were to/from European origins/destinations. The most common country of origin/destination for terminal passengers at UK airports in 2011 was Spain (including the Canary Islands), which accounted for 17 per cent of all international passenger movements. The USA was second, accounting for 9 per cent of international passenger movements in 2011; this share has fallen from 12 per cent in 2001.
In 2011, visiting friends and relatives (VFR) was the most common purpose of travel at Heathrow, Stansted and Luton. The proportion of passengers who are visiting friends/relatives has increased over the last decade at all 5 of the main UK airports.
Purpose of travel at selected airports, 2001, 2006 and 2011
0%
10%
20%
30%
40%
50%
60%
70%
Bu
sin
ess
Ho
liday
VF
R
Bu
sin
ess
Ho
liday
VF
R
Bu
sin
ess
Ho
liday
VF
R
Bu
sin
ess
Ho
liday
VF
R
Bu
sin
ess
Ho
liday
VF
R
Gatwick Heathrow Luton Stansted Manchester
2001 2006 2011
Information on how passengers travel to airports is available from the CAA passenger survey.
Among the five airports3 which are surveyed each year, the proportion of passengers travelling to the airport by private or hire car in 2011 ranged from 32 per cent at Heathrow to 59 per cent
2 Heathrow, Gatwick, Stansted, Luton, London City, Manchester, Birmingham, Glasgow, Edinburgh, Newcastle 3 Heathrow, Gatwick, Stansted, Luton, Manchester
https://www.gov.uk/government/statistical-data-sets/tsgb02 53

at Manchester. Between 2001 and 2011, the proportion travelling by private/hire car fell at all five airports surveyed.
Use of taxi/minicab is relatively high at Heathrow (27 per cent) and Manchester (26 per cent) while travel by rail is relatively high at Gatwick (35 per cent) and Stansted (25 per cent).
Mode of transport to selected airports, 2011
59
42
50
44
32
26
9
18
13
27
12
25
15
35
12
2
24
16
7
12 17
0% 10% 20% 30% 40% 50% 60% 70% 80% 90% 100%
Manchester
Stansted
Luton
Gatwick
Heathrow
Private/Hire car Taxi/Minicab Rail Bus/Coach Tram/Tube Other
UK Airlines
In 2011, Easyjet uplifted more passengers than British Airways (48 million and 33 million respectively) but British Airways accounted for more than twice as many passenger km as Easyjet (116 billion and 54 billion respectively).
In 2011, around 75,000 people were employed by UK airlines worldwide. This is a fall of 20 per cent since 2001 and a slight increase (1 per cent) since 2010.
Accidents and incidents
There were 46 casualties caused by accidents involving UK aircraft in UK airspace in 2011. This is nearly 40 per cent less than in 2001, although the time series is volatile due to the small numbers involved. Of these casualties, 8 (17 per cent) were fatal.
There were 161 aircraft proximity incidents in 2011. Of these, 14 per cent involved commercial air transport compared with 43 per cent in 2001.
Detailed statistics on “Aviation” can be found on the Transport Statistics Great Britain Aviation web page, table numbers AVI01 to AVI04.
Background notes 1. Full guidance on the methods used to compile these statistics and their sources can be found on the TSGB Chapter 2 – Aviation page
https://www.gov.uk/government/statistical-data-sets/tsgb02 54

Department for Transport statisticsAviation
Table AVI0101 (TSGB0201)
For greater detail of the years 2001-2011 see Table AVI0102
Year
Air transport movements:aircraft landings and take-offs
(thousands)
Terminal passengers:arrivals and departures
(thousands)
Freight handled:
set down and picked up3
(thousand tonnes)
1950 195 2,133 31
1951 187 2,471 44
1952 195 2,776 40
1953 214 3,419 64
1954 232 4,004 84
1955 259 4,831 113
1956 293 5,617 121
1957 329 6,600 139
1958 340 6,761 167
1959 358 7,867 226
1960 402 10,075 279
1961 447 12,249 313
1962 449 13,793 344
1963 458 15,506 360
1964 480 17,649 399
1965 508 19,918 418
1966 556 22,582 517
1967 566 24,003 488
1968 560 24,845 524
1969 591 28,064 585
1970 607 31,606 580
1971 630 34,934 532
1972 669 39,125 649
1973 719 43,125 699
1974 710 40,082 717
1975 701 41,846 638
1976 740 44,666 659
1977 759 45,927 705
1978 862 52,829 748
1979 924 56,992 797
1980 954 57,823 744
1981 927 57,771 724
1982 973 58,778 693
1983 1,019 61,109 726
1984 1,079 67,572 861
1985 1,097 70,434 850
1986 1,125 75,161 881
1987 1,193 86,041 976
1988 1,280 93,162 1,088
1989 1,375 98,913 1,151
1990 1,420 102,418 1,1931991 4 1,353 95,297 1,122
1992 1,432 105,663 1,235
1993 1,468 111,786 1,373
1994 1,469 121,659 1,585
1995 1,534 128,857 1,700
1996 1,611 135,226 1,767
1997 1,682 145,989 1,938
1998 1,785 158,163 2,076
1999 1,877 167,695 2,186
2000 1,962 179,187 2,311
2001 2,005 180,534 2,143
2002 1,998 188,043 2,193
2003 2,059 199,211 2,206
2004 2,176 214,926 2,369
2005 2,301 227,416 2,361
2006 2,344 234,416 2,315
2007 2,379 239,968 2,325
2008 2,327 235,361 2,282
2009 2,124 218,126 2,048
2010 2,002 210,656 2,325
2011 2,046 219,289 2,298
1. Excludes the Channel Islands Source - Civil Aviation Authority 2. Includes double counting of domestic traffic, unlike Table AVI0102. Last updated: July 20123. Excludes mail and passengers' luggage. Next update: July 20134. Excludes air-taxi operations and the Isle of Man from 1991.
Telephone: 020 7944 3088Email: [email protected] Notes and definitions
The figures in this table are outside the scope of National Statistics
Air traffic: United Kingdom airports1, 2, 1950-2011
https://www.gov.uk/government/statistical-data-sets/tsgb02 55
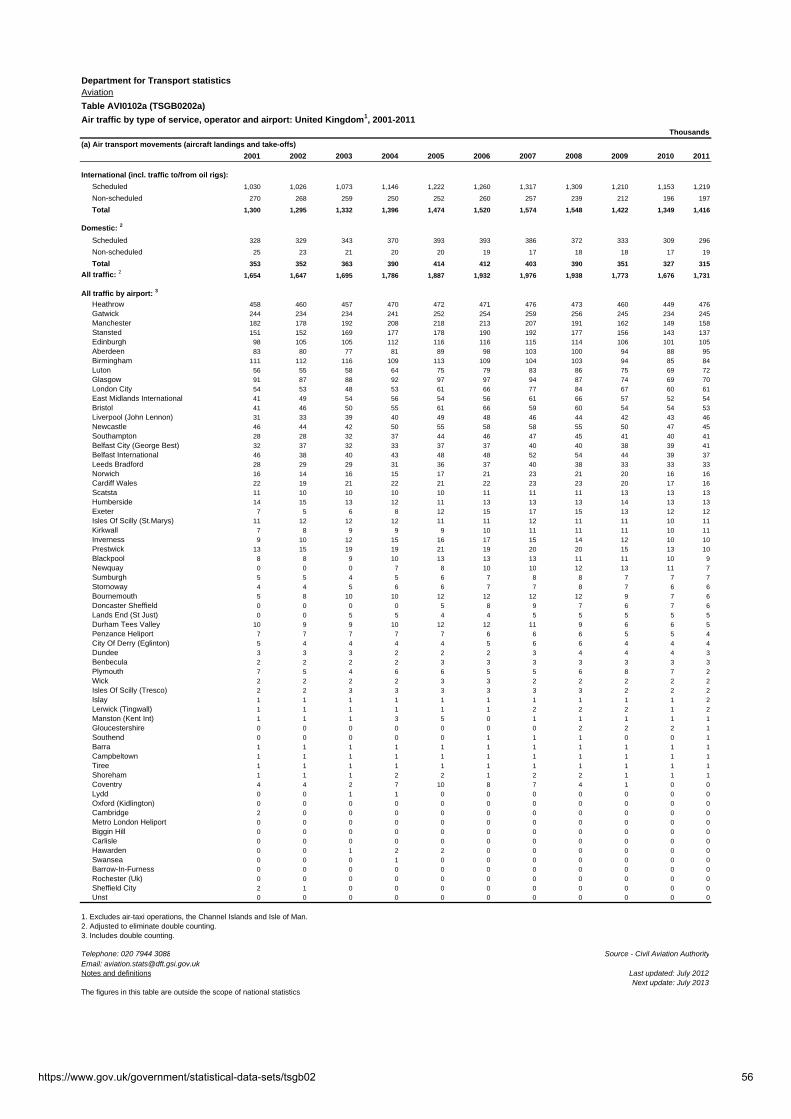
Department for Transport statisticsAviation
Table AVI0102a (TSGB0202a)
Thousands
(a) Air transport movements (aircraft landings and take-offs)
2001 2002 2003 2004 2005 2006 2007 2008 2009 2010 2011
International (incl. traffic to/from oil rigs):
Scheduled 1,030 1,026 1,073 1,146 1,222 1,260 1,317 1,309 1,210 1,153 1,219
Non-scheduled 270 268 259 250 252 260 257 239 212 196 197
Total 1,300 1,295 1,332 1,396 1,474 1,520 1,574 1,548 1,422 1,349 1,416
Domestic: 2
Scheduled 328 329 343 370 393 393 386 372 333 309 296
Non-scheduled 25 23 21 20 20 19 17 18 18 17 19
Total 353 352 363 390 414 412 403 390 351 327 315
All traffic: 2 1,654 1,647 1,695 1,786 1,887 1,932 1,976 1,938 1,773 1,676 1,731
All traffic by airport: 3
Heathrow 458 460 457 470 472 471 476 473 460 449 476
Gatwick 244 234 234 241 252 254 259 256 245 234 245
Manchester 182 178 192 208 218 213 207 191 162 149 158
Stansted 151 152 169 177 178 190 192 177 156 143 137
Edinburgh 98 105 105 112 116 116 115 114 106 101 105
Aberdeen 83 80 77 81 89 98 103 100 94 88 95
Birmingham 111 112 116 109 113 109 104 103 94 85 84
Luton 56 55 58 64 75 79 83 86 75 69 72
Glasgow 91 87 88 92 97 97 94 87 74 69 70
London City 54 53 48 53 61 66 77 84 67 60 61
East Midlands International 41 49 54 56 54 56 61 66 57 52 54
Bristol 41 46 50 55 61 66 59 60 54 54 53
Liverpool (John Lennon) 31 33 39 40 49 48 46 44 42 43 46
Newcastle 46 44 42 50 55 58 58 55 50 47 45
Southampton 28 28 32 37 44 46 47 45 41 40 41
Belfast City (George Best) 32 37 32 33 37 37 40 40 38 39 41
Belfast International 46 38 40 43 48 48 52 54 44 39 37
Leeds Bradford 28 29 29 31 36 37 40 38 33 33 33
Norwich 16 14 16 15 17 21 23 21 20 16 16
Cardiff Wales 22 19 21 22 21 22 23 23 20 17 16
Scatsta 11 10 10 10 10 11 11 11 13 13 13
Humberside 14 15 13 12 11 13 13 13 14 13 13
Exeter 7 5 6 8 12 15 17 15 13 12 12
Isles Of Scilly (St.Marys) 11 12 12 12 11 11 12 11 11 10 11
Kirkwall 7 8 9 9 9 10 11 11 11 10 11
Inverness 9 10 12 15 16 17 15 14 12 10 10
Prestwick 13 15 19 19 21 19 20 20 15 13 10
Blackpool 8 8 9 10 13 13 13 11 11 10 9
Newquay 0 0 0 7 8 10 10 12 13 11 7
Sumburgh 5 5 4 5 6 7 8 8 7 7 7
Stornoway 4 4 5 6 6 7 7 8 7 6 6
Bournemouth 5 8 10 10 12 12 12 12 9 7 6
Doncaster Sheffield 0 0 0 0 5 8 9 7 6 7 6
Lands End (St Just) 0 0 5 5 4 4 5 5 5 5 5
Durham Tees Valley 10 9 9 10 12 12 11 9 6 6 5
Penzance Heliport 7 7 7 7 7 6 6 6 5 5 4
City Of Derry (Eglinton) 5 4 4 4 4 5 6 6 4 4 4
Dundee 3 3 3 2 2 2 3 4 4 4 3
Benbecula 2 2 2 2 3 3 3 3 3 3 3
Plymouth 7 5 4 6 6 5 5 6 8 7 2
Wick 2 2 2 2 3 3 2 2 2 2 2
Isles Of Scilly (Tresco) 2 2 3 3 3 3 3 3 2 2 2
Islay 1 1 1 1 1 1 1 1 1 1 2
Lerwick (Tingwall) 1 1 1 1 1 1 2 2 2 1 2
Manston (Kent Int) 1 1 1 3 5 0 1 1 1 1 1
Gloucestershire 0 0 0 0 0 0 0 2 2 2 1
Southend 0 0 0 0 0 1 1 1 0 0 1
Barra 1 1 1 1 1 1 1 1 1 1 1
Campbeltown 1 1 1 1 1 1 1 1 1 1 1
Tiree 1 1 1 1 1 1 1 1 1 1 1
Shoreham 1 1 1 2 2 1 2 2 1 1 1
Coventry 4 4 2 7 10 8 7 4 1 0 0
Lydd 0 0 1 1 0 0 0 0 0 0 0
Oxford (Kidlington) 0 0 0 0 0 0 0 0 0 0 0
Cambridge 2 0 0 0 0 0 0 0 0 0 0
Metro London Heliport 0 0 0 0 0 0 0 0 0 0 0
Biggin Hill 0 0 0 0 0 0 0 0 0 0 0
Carlisle 0 0 0 0 0 0 0 0 0 0 0
Hawarden 0 0 1 2 2 0 0 0 0 0 0
Swansea 0 0 0 1 0 0 0 0 0 0 0
Barrow-In-Furness 0 0 0 0 0 0 0 0 0 0 0
Rochester (Uk) 0 0 0 0 0 0 0 0 0 0 0
Sheffield City 2 1 0 0 0 0 0 0 0 0 0Unst 0 0 0 0 0 0 0 0 0 0 0
1. Excludes air-taxi operations, the Channel Islands and Isle of Man.2. Adjusted to eliminate double counting.3. Includes double counting.
Telephone: 020 7944 3088 Source - Civil Aviation AuthorityEmail: [email protected] Notes and definitions Last updated: July 2012
Next update: July 2013The figures in this table are outside the scope of national statistics
Air traffic by type of service, operator and airport: United Kingdom1, 2001-2011
https://www.gov.uk/government/statistical-data-sets/tsgb02 56

Department for Transport statisticsAviation
Table AVI0102b (TSGB0202b)
Air traffic by type of service, operator and airport: United Kingdom1, 2001-2011
Millions
(b) Terminal passengers (arrivals and departures)
2001 2002 2003 2004 2005 2006 2007 2008 2009 2010 2011
International (incl. traffic to/from oil rigs):
Scheduled 104.9 108.8 116.7 130.8 143.7 151.9 160.1 160.9 152.5 150.2 159.7Non-scheduled 37.9 37.9 37.4 36.3 34.3 33.5 31.9 28.9 23.8 22.4 21.7Total 142.8 146.7 154.1 167.1 178.0 185.4 192.0 189.8 176.4 172.6 181.5
Domestic: 2
Scheduled 18.6 20.5 22.3 23.7 24.5 24.3 23.8 22.6 20.7 18.8 18.7Non-scheduled 0.2 0.2 0.2 0.2 0.2 0.2 0.2 0.2 0.2 0.2 0.2Total 18.9 20.7 22.6 23.9 24.7 24.5 24.0 22.8 20.9 19.0 18.9
All traffic: 2 161.7 167.3 176.7 191.0 202.7 209.9 216.0 212.6 197.3 191.6 200.4
All traffic by airport: 3
Heathrow 60.5 63.0 63.2 67.1 67.7 67.3 67.9 66.9 65.9 65.7 69.4
Gatwick 31.1 29.5 29.9 31.4 32.7 34.1 35.2 34.2 32.4 31.3 33.6
Manchester 19.1 18.6 19.5 21.0 22.1 22.1 21.9 21.1 18.6 17.7 18.8
Stansted 13.7 16.0 18.7 20.9 22.0 23.7 23.8 22.3 19.9 18.6 18.0
Luton 6.5 6.5 6.8 7.5 9.1 9.4 9.9 10.2 9.1 8.7 9.5
Edinburgh 6.0 6.9 7.5 8.0 8.4 8.6 9.0 9.0 9.0 8.6 9.4
Birmingham 7.7 7.9 8.9 8.8 9.3 9.1 9.1 9.6 9.1 8.6 8.6
Glasgow 7.2 7.8 8.1 8.6 8.8 8.8 8.7 8.1 7.2 6.5 6.9
Bristol 2.7 3.4 3.9 4.6 5.2 5.7 5.9 6.2 5.6 5.7 5.8
Liverpool (John Lennon) 2.3 2.8 3.2 3.4 4.4 5.0 5.5 5.3 4.9 5.0 5.2
Newcastle 3.4 3.4 3.9 4.7 5.2 5.4 5.6 5.0 4.6 4.3 4.3
East Midlands International 2.4 3.2 4.3 4.4 4.2 4.7 5.4 5.6 4.7 4.1 4.2
Belfast International 3.6 3.6 4.0 4.4 4.8 5.0 5.2 5.2 4.5 4.0 4.1
Aberdeen 2.5 2.5 2.5 2.6 2.9 3.2 3.4 3.3 3.0 2.8 3.1
London City 1.6 1.6 1.5 1.7 2.0 2.4 2.9 3.3 2.8 2.8 3.0
Leeds Bradford 1.5 1.5 2.0 2.4 2.6 2.8 2.9 2.9 2.6 2.7 2.9
Belfast City (George Best) 1.2 1.9 2.0 2.1 2.2 2.1 2.2 2.6 2.6 2.7 2.4
Southampton 0.9 0.8 1.2 1.5 1.8 1.9 2.0 1.9 1.8 1.7 1.8
Prestwick 1.2 1.5 1.9 2.2 2.4 2.4 2.4 2.4 1.8 1.7 1.3
Cardiff Wales 1.5 1.4 1.9 1.9 1.8 2.0 2.1 2.0 1.6 1.4 1.2
Doncaster Sheffield 0.0 0.0 0.0 0.0 0.6 0.9 1.1 1.0 0.8 0.9 0.8
Exeter 0.3 0.3 0.4 0.6 0.8 1.0 1.0 1.0 0.8 0.7 0.7
Bournemouth 0.3 0.4 0.5 0.5 0.8 1.0 1.1 1.1 0.9 0.7 0.6
Inverness 0.3 0.4 0.4 0.5 0.6 0.7 0.7 0.7 0.6 0.5 0.6
Norwich 0.4 0.4 0.4 0.4 0.5 0.7 0.7 0.6 0.4 0.4 0.4
City Of Derry (Eglinton) 0.2 0.2 0.2 0.2 0.2 0.3 0.4 0.4 0.3 0.3 0.4
Scatsta 0.2 0.2 0.2 0.2 0.2 0.3 0.3 0.2 0.3 0.3 0.3
Humberside 0.4 0.5 0.5 0.5 0.5 0.5 0.5 0.4 0.3 0.3 0.3
Blackpool 0.1 0.1 0.2 0.3 0.4 0.6 0.6 0.4 0.3 0.2 0.2
Newquay 0.0 0.0 0.0 0.3 0.3 0.3 0.4 0.4 0.3 0.3 0.2
Durham Tees Valley 0.7 0.7 0.7 0.8 0.9 0.9 0.7 0.6 0.3 0.2 0.2
Sumburgh 0.1 0.1 0.1 0.1 0.1 0.1 0.1 0.2 0.1 0.1 0.1
Kirkwall 0.1 0.1 0.1 0.1 0.1 0.1 0.1 0.1 0.1 0.1 0.1
Stornoway 0.1 0.1 0.1 0.1 0.1 0.1 0.1 0.1 0.1 0.1 0.1
Isles Of Scilly (St.Marys) 0.1 0.1 0.1 0.1 0.1 0.1 0.1 0.1 0.1 0.1 0.1
Penzance Heliport 0.1 0.1 0.1 0.1 0.1 0.1 0.1 0.1 0.1 0.1 0.1
Dundee 0.0 0.0 0.1 0.1 0.0 0.1 0.1 0.1 0.1 0.1 0.1
Southend 0.0 0.0 0.0 0.0 0.0 0.0 0.0 0.0 0.0 0.0 0.0
Isles Of Scilly (Tresco) 0.0 0.0 0.0 0.0 0.0 0.0 0.0 0.0 0.0 0.0 0.0
Manston (Kent Int) 0.0 0.0 0.0 0.1 0.2 0.0 0.0 0.0 0.0 0.0 0.0
Benbecula 0.0 0.0 0.0 0.0 0.0 0.0 0.0 0.0 0.0 0.0 0.0
Lands End (St Just) 0.0 0.0 0.0 0.0 0.0 0.0 0.0 0.0 0.0 0.0 0.0
Plymouth 0.1 0.1 0.1 0.1 0.1 0.1 0.1 0.1 0.1 0.1 0.0
Islay 0.0 0.0 0.0 0.0 0.0 0.0 0.0 0.0 0.0 0.0 0.0
Wick 0.0 0.0 0.0 0.0 0.0 0.0 0.0 0.0 0.0 0.0 0.0Gloucestershire 0.0 0.0 0.0 0.0 0.0 0.0 0.0 0.0 0.0 0.0 0.0Barra 0.0 0.0 0.0 0.0 0.0 0.0 0.0 0.0 0.0 0.0 0.0Campbeltown 0.0 0.0 0.0 0.0 0.0 0.0 0.0 0.0 0.0 0.0 0.0Tiree 0.0 0.0 0.0 0.0 0.0 0.0 0.0 0.0 0.0 0.0 0.0Lerwick (Tingwall) 0.0 0.0 0.0 0.0 0.0 0.0 0.0 0.0 0.0 0.0 0.0Oxford (Kidlington) 0.0 0.0 0.0 0.0 0.0 0.0 0.0 0.0 0.0 0.0 0.0Shoreham 0.0 0.0 0.0 0.0 0.0 0.0 0.0 0.0 0.0 0.0 0.0Cambridge 0.0 0.0 0.0 0.0 0.0 0.0 0.0 0.0 0.0 0.0 0.0Lydd 0.0 0.0 0.0 0.0 0.0 0.0 0.0 0.0 0.0 0.0 0.0Metro London Heliport 0.0 0.0 0.0 0.0 0.0 0.0 0.0 0.0 0.0 0.0 0.0Biggin Hill 0.0 0.0 0.0 0.0 0.0 0.0 0.0 0.0 0.0 0.0 0.0Carlisle 0.0 0.0 0.0 0.0 0.0 0.0 0.0 0.0 0.0 0.0 0.0Coventry 0.0 0.0 0.0 0.5 0.7 0.6 0.6 0.3 0.0 0.0 0.0Hawarden 0.0 0.0 0.0 0.0 0.0 0.0 0.0 0.0 0.0 0.0 0.0Swansea 0.0 0.0 0.0 0.0 0.0 0.0 0.0 0.0 0.0 0.0 0.0Barrow-In-Furness 0.0 0.0 0.0 0.0 0.0 0.0 0.0 0.0 0.0 0.0 0.0Sheffield City 0.0 0.0 0.0 0.0 0.0 0.0 0.0 0.0 0.0 0.0 0.0Unst 0.0 0.0 0.0 0.0 0.0 0.0 0.0 0.0 0.0 0.0 0.0
1. Excludes air-taxi operations, the Channel Islands and Isle of Man.2. Adjusted to eliminate double counting. Source - Civil Aviation Authority3. Includes double counting. Last updated: July 2012
Next update: July 2013Telephone: 020 7944 3088Email: [email protected] Notes and definitions
The figures in this table are outside the scope of national statistics
https://www.gov.uk/government/statistical-data-sets/tsgb02 57

Department for Transport statisticsAviation
Table AVI0102c (TSGB0202c)
Air traffic by type of service, operator and airport: United Kingdom1, 2001-2011
Thousand tonnes
(c) Freight handled (set down and picked up)2
2001 2002 2003 2004 2005 2006 2007 2008 2009 2010 2011
International (incl. traffic to/from oil rigs):
Scheduled 1,701 1,768 1,817 1,988 1,875 1,794 1,814 1,815 1,532 1,750 1,716
Non-scheduled 333 319 273 259 352 386 406 377 431 499 499
Total 2,034 2,086 2,091 2,247 2,226 2,179 2,220 2,191 1,963 2,248 2,214
Domestic: 3
Scheduled 11 10 14 18 9 4 4 3 3 4 3
Non-scheduled 44 44 43 43 58 63 49 42 39 35 39
Total 55 54 58 61 67 68 53 45 42 38.3 42
All traffic: 3 2,089 2,140 2,148 2,308 2,294 2,247 2,272 2,237 2,005 2,287 2,256
All traffic by airport: 4
Heathrow 1,180 1,235 1,223 1,325 1,306 1,263 1,311 1,397 1,278 1,473 1,484
East Midlands International 195 219 227 253 267 272 275 262 255 274 265
Stansted 166 184 199 226 237 224 204 198 183 202 203
Manchester 106 113 123 149 147 149 165 142 103 116 107
Gatwick 280 243 223 218 223 212 171 108 75 104 88
Belfast International 32 29 30 32 38 38 38 36 30 30 31
Luton 23 20 23 26 23 18 38 41 29 29 28
Manston (Kent Int) 36 32 43 27 8 21 28 26 30 28 27
Edinburgh 16 21 25 27 30 36 19 12 24 20 19
Birmingham 12 13 12 10 13 15 14 12 13 22 17
Prestwick 43 40 40 34 29 29 32 23 13 12 12
Aberdeen 5 4 3 4 4 4 3 4 4 4 5
Newcastle 1 1 1 1 0 0 1 2 3 4 3
Glasgow 6 5 5 8 9 6 4 4 2 3 2
Humberside 0 0 1 1 0 0 0 0 0 1 1
Scatsta 1 1 1 1 1 1 1 1 1 1 1
Coventry 4 5 3 3 6 8 7 6 2 0 1
Belfast City (George Best) 1 1 1 1 1 1 1 0 0 0 0
Cardiff Wales 1 1 2 3 3 2 2 1 0 0 0
Norwich 0 0 0 0 0 0 0 0 0 0 0
Sumburgh 0 0 0 0 0 0 0 0 0 0 0
Islay 0 0 0 0 0 0 0 0 0 0 0
Leeds Bradford 2 0 0 0 0 0 0 0 0 0 0
Benbecula 0 0 0 0 0 0 0 0 0 0 0
Liverpool (John Lennon) 23 14 12 9 9 6 4 4 0 0 0
Penzance Heliport 0 0 0 0 0 0 0 0 0 0 0
Southampton 0 0 0 0 0 0 0 0 0 0 0
Stornoway 0 1 1 1 1 1 1 1 0 0 0
Isles Of Scilly (St.Marys) 0 0 0 0 0 0 0 0 0 0 0
Doncaster Sheffield 0 0 0 0 0 0 2 1 0 0 0
Kirkwall 0 0 0 0 0 0 0 0 0 0 0
Barra 0 0 0 0 0 0 0 0 0 0 0
Tiree 0 0 0 0 0 0 0 0 0 0 0
Isles Of Scilly (Tresco) 0 0 0 0 0 0 0 0 0 0 0
Exeter 0 0 0 0 0 0 0 0 0 0 0
Lands End (St Just) 0 0 0 0 0 0 0 0 0 0 0
Southend 0 0 0 0 0 0 0 0 0 0 0
Blackpool 0 0 0 0 0 0 0 0 0 0 0
Durham Tees Valley 2 1 1 0 0 0 1 0 0 0 0
Bournemouth 5 6 5 6 6 5 0 0 0 0 0
Inverness 0 1 1 1 1 1 1 1 0 0 0
Cambridge 0 0 0 0 0 0 0 0 0 0 0
Wick 0 0 0 0 0 0 0 0 0 0 0
Campbeltown 0 0 0 0 0 0 0 0 0 0 0
Biggin Hill 0 0 0 0 0 0 0 0 0 0 0
Bristol 0 0 0 0 0 0 0 0 0 0 0
Carlisle 0 0 0 0 0 0 0 0 0 0 0
City Of Derry (Eglinton) 0 0 0 0 0 0 0 0 0 0 0
Gloucestershire 0 0 0 0 0 0 0 0 0 0 0
Lerwick (Tingwall) 0 0 0 0 0 0 0 0 0 0 0
Lydd 0 0 0 0 0 0 0 0 0 0 0
Plymouth 0 0 0 0 0 0 0 0 0 0 0
Shoreham 0 0 0 0 0 0 0 0 0 0 0
1. Excludes air-taxi operations, the Channel Islands and Isle of Man.2. Includes freight set down and picked up; excludes mail and passengers' luggage. 3. Adjusted to eliminate double counting.4. Includes double counting.
Telephone: 020 7944 3088 Source - Civil Aviation AuthorityEmail: [email protected] Notes and definitions Last updated: July 2012
Next update: July 2013The figures in this table are outside the scope of National Statistics
https://www.gov.uk/government/statistical-data-sets/tsgb02 58

Department for Transport statisticsAviation
Table AVI0103 (TSGB0203)
Percentage of flights on time within 15 minutes Average delay (minutes)
2008 2009 2010 2011 2008 2009 2010 2011
London airports Gatwick Scheduled 71.6 77.9 67.6 79.6 17.0 13.5 21.3 11.6Charter 58.9 70.3 63.9 73.9 32.8 23.4 32.9 20.3Total 69.7 77.0 67.1 79.0 19.3 14.7 22.6 12.5
Heathrow Scheduled 68.6 78.6 71.7 77.8 17.2 12.2 16.3 12.0Charter 57.5 67.9 55.1 66.8 22.5 19.3 29.8 19.5Total 68.6 78.6 71.7 77.7 17.2 12.2 16.3 12.0
London City Scheduled 74.6 86.4 83.5 87.4 13.0 7.8 9.8 7.7Charter 55.6 87.5 50.0 100.0 14.2 7.3 35.0 2.5Total 74.6 86.4 83.5 87.4 13.0 7.8 9.8 7.7
Luton Scheduled 71.9 78.5 67.6 78.4 16.0 13.8 21.4 12.2Charter 67.5 76.3 65.7 70.8 21.7 18.5 22.9 21.3Total 71.7 78.4 67.6 78.1 16.2 13.9 21.4 12.6
Stansted Scheduled 75.8 79.3 73.7 84.9 12.7 11.5 15.2 8.4Charter 61.6 78.0 69.3 78.6 25.3 14.3 20.4 15.1Total 75.4 79.3 73.5 84.7 13.0 11.6 15.4 8.6
Regional airports Birmingham Scheduled 77.8 82.8 76.9 84.9 13.8 11.0 15.9 9.3Charter 66.2 79.5 70.2 79.4 24.5 16.2 25.4 19.3Total 76.4 82.5 76.2 84.3 15.0 11.6 17.0 10.4
Edinburgh Scheduled 75.5 82.6 77.1 83.5 14.1 10.8 14.4 9.6Charter 64.0 68.0 58.6 63.0 25.4 21.0 34.2 28.8Total 75.3 82.4 76.8 83.2 14.3 10.9 14.7 9.9
Glasgow Scheduled 75.8 83.3 79.0 84.4 14.5 11.0 13.7 9.5Charter 60.4 73.4 60.0 70.4 32.5 20.4 35.6 23.6Total 74.4 82.4 76.9 83.0 16.2 11.9 16.1 11.0
Manchester Scheduled 73.4 79.7 72.8 77.8 15.4 12.4 17.9 13.1Charter 55.8 69.8 60.7 71.2 32.8 22.8 36.2 22.2Total 70.2 77.9 70.8 76.8 18.6 14.2 21.0 14.5
Newcastle Scheduled 77.4 84.2 76.3 84.3 13.4 10.3 16.3 9.3Charter 72.2 81.5 70.3 78.8 21.1 12.9 23.6 16.8Total 76.7 83.8 75.6 83.5 14.4 10.7 17.2 10.4
1. The methodology for estimating punctuality was reivsed in 2009 (See Notes and Definitions). Source - Civil Aviation Authority Figures based on the revised methodology are available from 2008 onwards. Last updated: July 2012
Next update: July 2013Telephone: 020 7944 3088Email: [email protected] Notes and definitions
The figures in this table are outside the scope of National Statistics
AVI0103 Punctuality at selected United Kingdom airports, 2008-20111
https://www.gov.uk/government/statistical-data-sets/tsgb02 59

Department for Transport statisticsAviation
Table AVI0104 (TSGB0204)
Forecasts of terminal passengers at United Kingdom airports1, 2008-2050
Million terminal passengers at UK airports2
2008 2020 2030 2040 2050
International3 Low . 220 255 295 330Mid 200 230 285 340 395
High . 245 315 . .
Domestic4 Low . 35 40 45 55Mid 35 40 50 60 75
High . 45 65 . .
Total5 Low . 255 300 340 380Mid 235 270 335 405 470High6
. 295 380 465 515
1. Forecasts of UK teminal passengers, constrained by airport capacity, as published in the August 2011 "UK Air Passenger Demand & CO2 forecasts" report. The analysis assumes that maximum use is made of existing runway capacity2. Figures are rounded to the nearest 5 million terminal passengers.3. Figures include international to international interlining passengers and domestic interlining passengers transferring at UK airports but not terminating in the UK.4. Figures are on a different basis from those in Table AVI0102(b) because passengers are counted at the airports at both ends of the journey and only passengers who start and end their journey in the UK are included.5. The total includes miscellaneous traffic, e.g. passengers to and from oil rigs. Figures may not equal sum of international and domestic due to rounding to nearest 5 million. 6. High scenario figures for 2040 and 2050 are generated using a model extension, and are not split into domestic and international, as the National Air Passenger Allocation Model runs failed to complete. See the August 2011 "UK Air Passenger Demand CO2 forecasts" report, Annex E, para E.11-E.14
The August 2011 'UK Air Passenger Demand & CO2 Forecasts' report is available at:www.gov.uk/government/publications/uk-aviation-forecasts-2011
Telephone: 020 7944 6608 Source: Aviation Analysis, DfTLast updated: October 2011
Next update: 2013
The figures in this table are outside the scope of National Statistics
Email: [email protected] Notes and definitions
https://www.gov.uk/government/statistical-data-sets/tsgb02 60

Department for Transport statisticsAviation
Table AVI0105 (TSGB0205)
Thousands/percentage
2001 2002 2003 2004 2005 2006 2007 2008 2009 2010 2011% of total
in 2011
European Union: Austria 1,278 1,443 1,508 1,749 1,796 1,788 1,877 1,826 1,746 1,662 1,705 1%Belgium 2,686 2,343 2,277 1,863 1,711 1,626 1,624 1,398 1,185 1,121 1,234 1%Bulgaria 187 279 382 585 771 919 953 992 881 858 878 0%Cyprus 2,962 2,683 2,787 2,776 2,989 3,006 2,969 2,951 2,703 2,596 2,636 1%Czech Republic 736 916 1,296 2,069 2,355 2,155 2,071 1,817 1,516 1,276 1,295 1%Denmark 1,988 2,070 2,013 2,186 2,255 2,305 2,345 2,395 2,452 2,404 2,559 1%Estonia 29 38 45 83 186 178 179 157 99 104 244 0%Finland 753 659 702 813 799 930 944 961 946 982 1,002 1%France 8,435 9,657 10,232 10,941 10,994 11,560 11,785 11,676 10,729 9,659 10,270 6%Germany 8,432 8,651 9,571 10,283 10,937 11,502 11,607 11,155 10,716 11,168 11,641 6%Greece 6,410 6,246 6,204 5,840 5,596 5,519 5,457 5,199 4,873 4,724 4,630 3%
Hungary 383 360 375 701 1,119 1,014 960 1,096 960 955 1,037 1%Irish Republic 9,293 9,813 10,163 10,862 11,789 12,356 12,259 12,321 10,896 9,555 9,727 5%Italy 7,456 7,654 8,913 9,677 10,713 10,571 11,207 10,737 9,914 9,619 10,260 6%
Latvia 54 58 61 126 309 461 479 464 458 550 585 0%Lithuania 48 48 55 95 222 319 340 359 319 473 564 0%Luxembourg 203 184 159 173 182 209 251 245 203 210 252 0%Malta 1,039 1,025 1,055 1,096 1,110 1,055 1,148 1,101 1,024 1,038 1,091 1%Netherlands 7,313 7,804 7,780 7,933 7,888 8,256 8,352 7,660 6,972 6,875 7,550 4%Poland 453 467 516 998 1,845 3,328 4,352 5,023 4,228 4,225 4,261 2%
Portugal & Madeira 2 3,752 3,967 4,022 4,256 4,540 4,745 5,339 5,536 5,055 5,011 5,497 3%Romania 109 117 135 143 157 194 333 488 553 631 717 0%Slovak Republic - 2 29 127 285 470 529 716 559 499 469 0%Slovenia 52 48 53 116 157 183 190 168 139 127 127 0%Spain & Canary Islands 27,576 28,952 32,230 33,478 34,558 34,877 35,535 34,558 30,425 28,711 31,482 17%Sweden 1,958 1,976 1,993 2,253 2,321 2,290 2,267 2,296 2,073 2,188 2,538 1%
Total EU-27 93,586 97,459 104,558 111,224 117,584 121,817 125,355 123,293 111,625 107,222 114,251 63%
Other Europe:Norway 1,244 1,277 1,353 1,606 1,726 1,893 1,856 1,990 2,016 2,080 2,238 1%Switzerland 3,829 3,983 4,108 4,184 4,501 4,957 5,142 5,416 5,228 5,243 5,805 3%Gibraltar 215 227 264 309 346 329 296 369 357 301 385 0%Turkey 2,112 2,233 2,175 2,791 3,551 3,406 3,887 4,355 4,796 5,408 5,183 3%
Former USSR 3 724 814 911 1,030 1,098 1,177 1,234 1,232 1,144 1,243 1,499 1%
Former Yugoslavia 3 269 310 351 433 548 730 848 770 797 823 870 0%
Rest of Europe 3 343 269 332 403 402 474 494 427 395 416 395 0%
Total Other Europe 8,736 9,111 9,493 10,757 12,173 12,966 13,756 14,557 14,733 15,515 16,376 9%
Total Europe 102,322 106,570 114,050 121,980 129,757 134,783 139,112 137,850 126,358 122,737 130,627 72%
Rest of World:
Egypt 612 643 704 994 1,560 1,948 1,965 2,280 2,670 2,886 2,165 1%Rest of North Africa 986 868 802 1,022 1,217 1,514 1,668 1,361 1,401 1,794 1,452 1%
South Africa 1,458 1,469 1,515 1,656 1,593 1,612 1,677 1,530 1,466 1,379 1,333 1%Rest of Africa 1,292 1,425 1,424 1,700 1,860 1,988 2,114 1,904 1,856 1,810 1,898 1%Israel 770 630 617 659 668 672 709 818 847 770 812 0%Qatar 228 221 297 399 547 689 843 779 865 922 955 1%Saudi Arabia 297 263 229 247 205 220 257 300 397 421 465 0%UAE 1,524 1,795 2,022 2,535 2,881 3,256 3,736 4,049 4,345 4,594 4,891 3%Rest of Near and Middle East 1,038 1,117 1,186 1,373 1,393 1,391 1,319 1,385 1,471 1,436 1,383 1%USA 17,060 16,879 16,584 18,004 18,290 18,066 18,558 18,152 16,351 15,816 16,900 9%Canada 3,133 2,961 2,894 3,308 3,606 3,634 3,865 3,522 3,102 3,065 3,142 2%South America 523 414 379 394 379 340 395 415 474 503 682 0%Central America 927 884 906 1,150 1,270 1,353 1,334 1,380 1,240 1,259 1,261 1%Caribbean 1,692 1,657 1,763 1,895 1,828 1,903 1,948 1,947 1,832 1,728 1,738 1%Australia 737 693 727 874 1,211 1,169 1,211 1,272 1,066 1,052 1,102 1%New Zealand 154 130 202 180 189 215 344 365 409 365 258 0%India 1,017 858 960 1,073 1,579 2,329 2,486 2,363 2,507 2,396 2,519 1%Pakistan 486 443 517 582 654 703 684 773 637 690 676 0%Rest of Indian sub-continent 681 682 770 856 827 832 878 833 626 732 687 0%China 213 247 211 348 487 585 631 571 536 607 663 0%Japan 1,131 1,209 1,046 1,189 1,184 1,085 1,031 963 780 684 653 0%Hong Kong 983 1,113 1,020 1,275 1,259 1,439 1,660 1,554 1,529 1,387 1,413 1%Singapore 1,209 1,203 1,150 1,169 1,158 1,272 1,230 1,248 1,222 1,107 1,161 1%Thailand 710 715 673 718 696 673 691 594 600 598 579 0%Rest of Asia 1,002 994 994 1,099 1,125 1,051 927 909 1,043 1,204 1,184 1%
Total Rest of World 4 39,866 39,512 39,594 44,701 47,665 49,938 52,163 51,265 49,272 49,206 49,982 28%
Oil Rigs 640 628 567 564 627 713 768 763 752 714 761 0%
All international airpassenger movements 142,827 146,711 154,211 167,245 178,049 185,434 192,042 189,879 176,382 172,658 181,369 100%
1. Includes Channel Islands and Isle of Man airports, unlike other tables in this chapter2. Includes Azores and Cape Verde Islands. Source - Civil Aviation Authority3. See Notes & Definitions for list of countries included in group. Last updated: July 20124. Includes Greenland. Next update: July 2013
Telephone: 020 7944 3088Email: [email protected] Notes and definitions
The figures in this table are outside the scope of National Statistics
International passenger movements at UK airports1 by country of embarkation or landing, 2001-2011
https://www.gov.uk/government/statistical-data-sets/tsgb02 61

Department for Transport statisticsAviation
Table AVI0106 (TSGB0206)
percentage /number
Survey Airport 2001 2002 2003 2004 2005 2006 2007 2008 2009 2010 2011
Gatwick Transfer 20 16 16 14 16 12 12 10 9 8 8
Terminating 80 84 84 86 84 88 88 90 91 92 92
Unweighted sample size 25,636 20,811 20,044 19,260 16,893 25,329 26,688 28,279 29,240 25,253 24,696
Heathrow Transfer 31 36 36 35 35 34 34 35 38 36 34
Terminating 69 64 64 65 65 66 66 65 62 64 66
Unweighted sample size 63,199 66,072 69,288 63,972 63,972 65,575 67,708 58,247 69,411 61,151 53,351
Luton Transfer 5 8 7 5 7 4 4 3 2 2 2
Terminating 95 92 93 95 93 96 96 97 98 98 98
Unweighted sample size 6,125 8,187 6,215 5,800 6,760 7,154 7,573 8,209 7,951 9,185 7,769
Stansted Transfer 7 9 14 12 11 10 8 8 7 6 5
Terminating 93 91 86 88 89 90 92 92 93 94 95
Unweighted sample size 7,760 9,293 9,490 10,981 10,595 21,564 25,692 23,504 24,941 26,306 24,226
Manchester Transfer 4 3 3 3 3 3 3 3 2 2 2
Terminating 96 97 97 97 97 97 97 97 98 98 98
Unweighted sample size 26,239 27,735 25,305 21,440 25,273 27,550 28,163 24,364 27,376 23,637 27,905
1. Results are based on the CAA passenger Survey, which is carried out at selected airports each year. Telephone: 020 7944 3088 Source - Civil Aviation AuthorityEmail: [email protected] Last updated: July 2012Notes and definitions Next update: July 2013
The figures in this table are outside the scope of National Statistics
Type of passenger at selected UK airports1, 2001-2011
https://www.gov.uk/government/statistical-data-sets/tsgb02 62

Department for Transport statisticsAviation
Table AVI0107 (TSGB0207)
Percentage /NumberSurvey Airport 2001 2002 2003 2004 2005 2006 2007 2008 2009 2010 2011
Gatwick Private Car350 53 51 51 51 48 48 48 46 44 42
Hire Car 2 2 3 2 2 2 2 2 2 2 2Taxi/Minicab 17 15 15 15 14 14 15 13 14 13 13Rail 21 22 25 25 25 29 29 30 31 34 35Bus/Coach 9 8 7 7 7 6 6 7 6 7 7Tram/Tube - - - - 1 - - 0 0 0 0Other - - - - - - - 1 0 0 0Total 100 100 100 100 100 100 100 100 100 100 100Sample size 14,235 12,884 13,370 13,363 11,868 21,780 23,197 25,176 26,083 22,383 21,989
HeathrowPrivate Car3
35 36 36 35 34 34 33 31 32 31 29Hire Car 3 3 3 3 3 3 2 3 3 3 3Taxi/Minicab 27 26 25 26 26 28 27 26 25 26 27Rail 8 9 9 9 10 9 10 10 10 11 12Bus/Coach 13 12 13 12 14 13 13 14 13 12 12Tram/Tube 13 13 14 14 13 13 15 16 17 16 17Other 1 - - - - - - 0 0 0 1Total 100 100 100 100 100 100 100 100 100 100 100
Sample size 35,449 31,190 31,666 31,004 38,050 39,014 40,443 34,162 38,024 36,551 33,484
Luton4
Private Car360 62 60 60 56 53 53 51 52 48 48
Hire Car 4 3 3 3 3 3 3 3 3 3 3Taxi/Minicab 10 10 12 12 13 14 14 13 13 16 18Rail 17 17 17 18 18 17 17 19 17 17 15Bus/Coach 10 7 7 7 10 13 12 14 14 16 16Tram/Tube - - - - - - - - 0 0 0Other 0 0 0 1 0 0 1 0 0 0 1Total 100 100 100 100 100 100 100 100 100 100 100Sample size 5,444 7,496 5,713 5,486 6,246 6,778 7,249 7,827 7,675 8,841 7,575
StanstedPrivate Car3
50 48 50 48 48 47 44 42 41 40 38
Hire Car 3 3 4 3 4 3 3 3 3 3 3
Taxi/Minicab 10 8 8 8 9 9 9 8 8 8 9
Rail 27 26 29 29 25 24 25 26 25 25 25
Bus/Coach 8 8 10 11 14 16 20 21 22 22 24
Tram/Tube - - - - - - - 0 0 0 0
Other 3 7 - - - 1 - 1 1 1 0
Total 100 100 100 100 100 100 100 100 100 100 100
Sample size 6,127 8,273 8,045 9,283 9,305 19,227 23,260 21,522 22,906 24,368 22,941
ManchesterPrivate Car3
59 60 58 60 58 58 57 57 58 57 57
Hire Car 3 2 2 2 2 3 3 3 2 2 2
Taxi/Minicab 29 29 29 29 29 29 30 29 26 26 26
Rail 5 5 7 7 7 7 8 8 10 11 12
Bus/Coach 4 3 4 2 3 2 3 3 3 2 2
Tram/Tube - - - - - - - 0 0 0 0
Other 1 - 1 1 1 1 - 0 0 0 0
Total 100 100 100 100 100 100 100 100 100 100 100
Sample size 21,972 25,788 23,633 19,996 23,403 25,980 26,892 23,374 26,601 22,802 27,134
1. These results are based on the CAA passenger survey, which surveys departing passengers only. The assumption, for weighting purposes, is that arriving and departing passengers share the same modal characteristics. Where more than one mode of transport is used, the final mode is presented in this table.2. Terminating passengers only.3. Including passengers using car park courtesy buses.4. Rail includes courtesy bus from Parkway station to Luton airport.
Telephone: 020 7944 3088 Source - Civil Aviation AuthorityEmail: [email protected] Last updated: July 2012Notes and definitions Next update: July 2013
The figures in this table are outside the scope of National Statistics
Mode of transport to selected UK airports1, 2, 2001-2011
https://www.gov.uk/government/statistical-data-sets/tsgb02 63

Department for Transport statistics
AviationTable AVI0108 (TSGB0208)
Percentage/NumberSurvey Airport 2001 2002 2003 2004 2005 2006 2007 2008 2009 2010 2011
Gatwick Business 19 16 18 16 17 17 18 17 15 15 16
Holiday 57 60 56 56 54 55 52 53 55 54 52
Visiting friends/relatives 21 22 24 25 26 26 29 28 28 29 30
Other 3 2 2 2 3 2 2 2 2 2 2
Total 100 100 100 100 100 100 100 100 100 100 100
Sample size 25,612 20,811 20,017 19,220 16,869 25,329 26,688 28,268 29,240 25,253 24,696
Heathrow Business 38 37 35 36 35 36 36 34 29 30 31
Holiday 28 28 28 29 28 28 28 28 29 30 29
Visiting friends/relatives 32 32 33 32 33 32 32 34 38 36 36
Other 3 3 3 3 4 4 4 4 4 4 4
Total 100 100 100 100 100 100 100 100 100 100 100
Sample size 63,173 66,072 69,102 65,722 63,878 65,575 67,708 58,179 69,411 61,151 53,351
Luton Business 24 25 24 23 20 20 21 19 18 19 17
Holiday 43 42 39 46 43 40 34 35 34 35 37
Visiting friends/relatives 30 31 35 30 35 37 43 43 45 44 43
Other 3 2 2 1 2 3 2 3 3 3 2
Total 100 100 100 100 100 100 100 100 100 100 100
Sample size 6,125 8,187 6,215 5,789 6,759 7,154 7,573 8,201 7,951 9,185 7,769
Stansted Business 20 21 17 18 18 18 19 19 16 16 16
Holiday245 41 40 42 42 42 33 32 34 35 37
Visiting friends/relatives 32 36 40 38 37 38 46 46 47 46 45
Other 3 3 3 2 2 2 3 2 2 3 2
Total 100 100 100 100 100 100 100 100 100 100 100
Sample size 7,747 9,293 9,490 10,901 10,593 21,564 25,692 23,498 24,941 26,306 24,226
Manchester Business 21 20 21 20 19 20 20 19 17 18 18
Holiday 62 63 61 60 59 58 57 58 59 59 59
Visiting friends/relatives 16 15 17 18 20 20 22 21 23 22 22
Other 1 1 2 1 2 2 1 1 1 1 1
Total 100 100 100 100 100 100 100 100 100 100 100
Sample size 26,234 27,735 25,301 21,411 25,257 27,550 28,163 24,329 27,376 23,637 27,905
1. Results are based on the CAA passenger Survey, which is carried out at selected airports each year. Source - Civil Aviation Authority
2. In 2006 'Holiday' includes some cases at Stansted which were classified as 'leisure unspecified'. Last updated: July 2012 Next update: July 2013Telephone: 020 7944 3088Email: [email protected] Notes and definitions
The figures in this table are outside the scope of National Statistics
Purpose of travel at selected UK airports1, 2001-2011
https://www.gov.uk/government/statistical-data-sets/tsgb02 64

https://www.gov.uk/government/statistical-data-sets/tsgb02 65

Department for Transport statistics
Aviation
Table AVI0201 (TSGB0210)
2001 2002 2003 2004 2005 2006 2007 2008 2009 2010 2011
(a) Aircraft kilometres flown Million kilometresInternational:
Scheduled 920 921 965 1,059 1,178 1,251 1,333 1,371 1,320 1,293 1,390Non-scheduled 437 412 431 423 414 425 444 408 347 330 336Total 1,357 1,333 1,396 1,483 1,592 1,677 1,778 1,779 1,667 1,624 1,726
Domestic:
Scheduled 128 126 123 138 147 148 141 137 123 115 116Non-scheduled 8 9 8 8 7 7 6 7 7 8 7Total 136 135 131 146 154 155 147 144 131 123 123
All services:
Scheduled 1,048 1,047 1,088 1,198 1,326 1,400 1,474 1,508 1,444 1,409 1,506Non-scheduled 445 421 440 431 421 432 451 414 354 338 344Total 1,493 1,468 1,528 1,629 1,746 1,831 1,925 1,923 1,798 1,747 1,849
(b) Passengers uplifted MillionsInternational:
Scheduled 51 52 56 64 71 75 80 84 83 83 92Non-scheduled 34 34 33 32 30 29 29 26 22 20 20Total 85 86 89 96 101 104 108 110 105 104 112
Domestic:
Scheduled 18.2 19.8 20.8 22.5 23.1 22.9 22.1 20.9 19.5 18.2 19Non-scheduled 0.3 0.3 0.3 0.2 0.2 0.2 0.2 0.1 0.2 0.2 0Total 18.5 20.2 21.0 22.7 23.3 23.0 22.3 21.0 19.7 18.4 19
All services:
Scheduled 69 72 76 86 94 98 102 105 102 101 111
Non-scheduled 34 34 34 32 30 30 29 26 22 21 20
Total 104 107 110 118 124 127 131 131 124 122 132
(c) Passenger kilometres flown Billion kilometresInternational:
Scheduled 151 148 156 173 191 204 218 224 222 218 234Non-scheduled 90 88 89 90 87 86 86 79 66 63 63Total 241 236 245 263 278 290 305 302 288 280 297
Domestic:
Scheduled 7.6 8.3 8.9 9.5 9.8 9.8 9.4 9.0 8.3 7.7 8.2Non-scheduled 0.1 0.1 0.2 0.2 0.1 0.1 0.1 0.1 0.1 0.1 0.1Total 7.7 8.5 9.1 9.8 9.9 9.9 9.5 9.0 8.4 7.8 8.2
All services:
Scheduled 159 156 165 183 200 213 228 233 231 226 242Non-scheduled 90 88 90 90 87 86 87 79 66 63 63Total 249 244 254 273 287 300 314 311 297 288 305
(d) Passenger seat occupancy PercentageInternational:
Scheduled 70.9 74.5 74.8 75.8 76.1 76.2 76.5 76.9 79.5 80.6 79.9
Non-scheduled 89.9 90.4 89.2 89.9 89.0 88.3 88.1 89.0 88.6 89.0 89.1
Total 77.0 79.7 79.5 80.1 79.7 79.4 79.5 79.7 81.4 82.3 81.7
Domestic:
Scheduled 61.8 66.0 70.5 68.0 65.3 66.1 65.3 64.3 66.4 65.7 68.4
Non-scheduled 62.3 60.6 66.0 61.8 37.9 43.4 46.4 49.1 51.1 48.2 54.2
Total 61.8 65.9 70.4 67.9 65.0 65.9 65.1 64.2 66.2 65.5 68.3
All services:
Scheduled 69.9 74.0 74.5 75.3 75.5 75.6 76.0 76.3 78.9 80.0 79.4
Non-scheduled 89.9 90.3 89.1 89.8 88.9 88.2 88.1 88.9 88.6 88.9
Total 75.9 79.1 79.1 79.6 79.1 78.9 79.0 79.1 80.9 81.8 81.2
(e) Cargo uplifted (freight and mail) Thousand tonnesInternational:
Scheduled 723.0 752.0 783.4 879.5 911.4 937.9 934.3 973.7 895.5 924.5 956.7Non-scheduled 114.0 100.6 104.8 122.2 104.4 125.4 219.9 170.2 119.7 88.2 111.9Total 837.0 852.6 888.2 1,001.7 1,015.8 1,063.2 1,154.2 1,143.8 1,015.2 1,012.7 1,068.5
Domestic:
Scheduled 13.0 16.8 17.2 15.0 10.0 8.5 7.1 6.0 5.2 4.7 4.8Non-scheduled 75.0 69.7 63.9 55.5 80.2 78.7 72.0 81.9 78.0 74.9 75.9Total 88.0 86.5 81.1 70.5 90.2 87.2 79.1 87.9 83.2 79.6 80.6
All services:
Scheduled 736.0 768.7 800.6 894.5 921.4 946.4 941.4 979.7 900.7 929.1 961.4Non-scheduled 189.0 170.3 168.7 177.7 184.7 204.1 291.9 252.0 197.8 163.1 187.7Total 925.0 939.1 969.3 1,072.2 1,106.1 1,150.4 1,233.3 1,231.7 1,098.4 1,092.2 1,149.1
(f) Cargo tonne-kilometres flown (freight and mail) MillionsInternational:
Scheduled 4,643 4,991 5,235 5,693 6,085 6,311 6,308 6,381 5,951 6,165 6,381Non-scheduled 519 295 343 331 326 725 1,427 1,084 866 695 692Total 5,162 5,286 5,578 6,024 6,411 7,036 7,735 7,465 6,817 6,860 7,073
Domestic:
Scheduled 8 6 6 5 3 2 2 2 2 1 1Non-scheduled 26 25 24 23 34 35 33 35 33 31 31Total 34 31 30 29 37 37 35 37 35 32 33
All services:
Scheduled 4,651 4,997 5,242 5,698 6,088 6,313 6,311 6,383 5,952 6,167 6,382Non-scheduled 545 320 367 354 360 760 1,460 1,120 899 726 723Total 5,196 5,317 5,608 6,053 6,449 7,073 7,770 7,502 6,851 6,892 7,106
1. Excludes sub-charter operations performed on behalf of UK airlines. Source - Civil Aviation AuthorityLast updated: July 2012
Telephone: 020 7944 3088 Next update: July 2013Email: [email protected] Notes and definitions
The figures in this table are outside the scope of National Statistics
Main outputs by type of service1: United Kingdom airlines, 2001-2011
https://www.gov.uk/government/statistical-data-sets/tsgb02 66

Department for Transport statistics
Aviation
Table AVI0203 (TSGB0211)
Number
2001 2002 2003 2004 2005 2006 2007 2008 2009 2010 2011
Pilots and co-pilots 9,984 9,933 9,758 9,798 10,064 10,671 11,259 11,534 10,690 10,268 10,188
Other cockpit personnel 274 209 120 102 135 158 152 111 125 97 27
Cabin attendants 30,461 28,548 28,398 29,634 31,120 32,718 34,369 35,267 31,592 29,542 30,782
Maintenance and overhaul personnel 11,824 11,749 11,186 9,933 9,611 9,488 9,075 8,616 8,325 7,878 8,223
Tickets and sales personnel 10,062 9,074 8,168 7,706 7,312 6,555 6,258 6,314 5,997 5,477 4,704
All other personnel 31,279 27,921 27,265 26,399 26,141 25,481 24,571 25,037 22,551 20,902 21,553
Total 93,884 87,434 84,895 83,572 84,383 85,071 85,684 86,879 79,280 74,164 74,757
Telephone: 020 7944 3088 Source - Civil Aviation Authority
Email: [email protected] Last updated: July 2012
Notes and definitions Next update: July 2013
The figures in this table are outside the scope of National Statistics
Employment worldwide: United Kingdom airlines, 2001-2011
https://www.gov.uk/government/statistical-data-sets/tsgb02 67

Department for Transport statistics
Aviation
Table AVI0301 (TSGB0212)
Activity at major airports1: worldwide, 2011
Terminal passengers2 Commercial air transport movements3
ow: ow:
Country Location Name All (millions)International
(millions)All
(thousands)International (thousands)
USA Atlanta, GA Hartsfield-Jakson International 92.4 9.9 917 69
China Beijing Capital International 78.7 .. 533 ..
UK London Heathrow 69.4 64.7 476 430
USA Chicago. IL O'Hare International 66.8 10.0 860 79
Japan Tokyo Haneda (Tokyo International) 62.3 .. 379 ..
USA Los Angeles, CA Los Angeles International 61.9 16.7 .. ..
France Paris Charles de Gaulle 60.7 55.0 507 451
USA Dallas/Fort Worth, TX Dallas-Fort Worth International 57.8 5.5 641 ..
Germany Frankfurt Frankfurt 56.3 49.5 481 409
USA Denver, CO Denver International 52.8 1.7 631 ..
China Hong Kong Hong Kong International 52.7 52.7 326 326
Indonesia Jakarta Jakarta Soekarno Hatta International 52.4 .. .. ..
UAE Dubai Dubai International 51.0 50.2 .. ..
Netherlands Amsterdam Amsterdam-Schiphol 49.7 49.7 420 420
Spain Madrid Barajas 49.5 32.5 423 255
USA New York, NY John F. Kennedy International 47.7 23.9 401 149
Thailand Bangkok Bangkok Suvarnabhumi International 46.3 35.0 300 217
Singapore Singapore Changi 45.4 45.4 302 302
China Guangzhou Guangzhou Baiyun International 45.4 .. 349 ..
USA Las Vegas, NV Maccarran International 41.5 2.6 484 ..
China Shanghai Pudong 41.4 .. .. ..
USA San Francisco, CA San Francisco International 41.0 9.1 388 50
USA Phoenix, AZ Sky Harbor International 40.6 2.3 439 ..
USA Houston, TX Houston George Bush Intercontinental 40.2 8.6 517 ..
USA Charlotte, NC Charlotte-Douglas International 39.0 2.6 514 ..
1. Complete data for all airports was not available at the time of publication.2. In some cases this figure may include transit passengers Source - Airport websites; International Civil Aviation Organization3. All commercial movements including positioning and local movements. and Airports Council International
Telephone: 020 7944 3088 Last updated: December 2012Email: [email protected] Next update: December 2013Notes & definitions
The figures in this table are outside the scope of National Statistics
https://www.gov.uk/government/statistical-data-sets/tsgb02 68

Department for Transport statisticsAviation
Table AVI0302 (TSGB0213)
Passenger traffic via major airlines1: worldwide, 2011
All scheduled traffic International scheduled traffic Charter traffic
Country Airline
Passengers uplifted
(millions)
Passenger kilometres
(billions)
Passengers uplifted
(millions)
Passenger kilometres
(billions)
Passenger kilometres
(billions)
International passenger kilometres
(billions)
United States Delta2 112.0 264.2 19.3 116.5 0.3 0.1
United States American 86.0 203.3 20.8 83.5 0.1 0.0
China China Southern Airlines 80.5 121.9 .. .. .. ..
Ireland Ryanair 76.4 93.9 76.4 93.9 .. ..
Germany Lufthansa 63.0 141.0 49.8 135.5 0.2 0.2
China China Eastern Airlines 53.5 79.0 6.0 22.2 1.2 1.1
United States US Airways 52.9 160.3 .. .. 0.0 0.0
France Air France 50.0 132.9 32.6 123.0 0.1 0.1
United States United 49.6 157.3 10.1 72.4 0.0 0.0
China Air China 48.6 92.8 6.5 34.3 0.4 0.3
United Kingdom Easyjet 47.5 54.0 42.0 51.4 0.0 0.0
United States Continental 45.1 131.6 13.9 64.8 0.2 0.1
Japan All Nippon Airways 41.9 56.5 5.6 24.2 0.1 0.0
Brazil Tam Linhas Aereas 33.5 54.8 4.2 22.9 1.0 0.3
United Kingdom British Airways 33.0 116.1 28.8 114.1 0.1 0.1
United Arab Emirates Emirates 32.7 153.3 32.7 153.3 .. ..
United States Jetblue Airways 26.4 49.4 3.4 7.2 0.0 0.0
Netherlands KLM 25.1 82.0 25.1 82.0 0.0 0.0
United States Airtran Airways 24.6 31.9 0.8 1.5 0.3 0.3
Japan JAL 24.5 44.4 6.6 29.2 0.5 0.5
United States Skywest Airlines 24.0 21.9 1.6 2.3 .. ..
Canada Air Canada 23.7 80.7 13.0 59.5 0.1 0.1
Republic Of Korea Korean Air 23.1 63.9 15.5 61.2 1.0 1.0
Scandinavia SAS 22.9 24.8 13.2 20.0 3.5 3.5
Australia Qantas 22.2 73.5 5.7 49.4 0.1 0.0
1. Based information reported to ICAO. At the time of publication complete data was not available for China Southern Airlines, US Airways or Emirates. Data for these airlines are therefore based on figures published by IATA2. There was a marked increase in passengers on Delta, following their acquisition of Northwest Airlines
Source - International Civil Aviation Organization andTelephone: 020 7944 3088 International Air Transport AssociationEmail: [email protected] Notes & definitions Last updated: December 2012
Next update: December 2013The figures in this table are outside the scope of National Statistics
https://www.gov.uk/government/statistical-data-sets/tsgb02 69
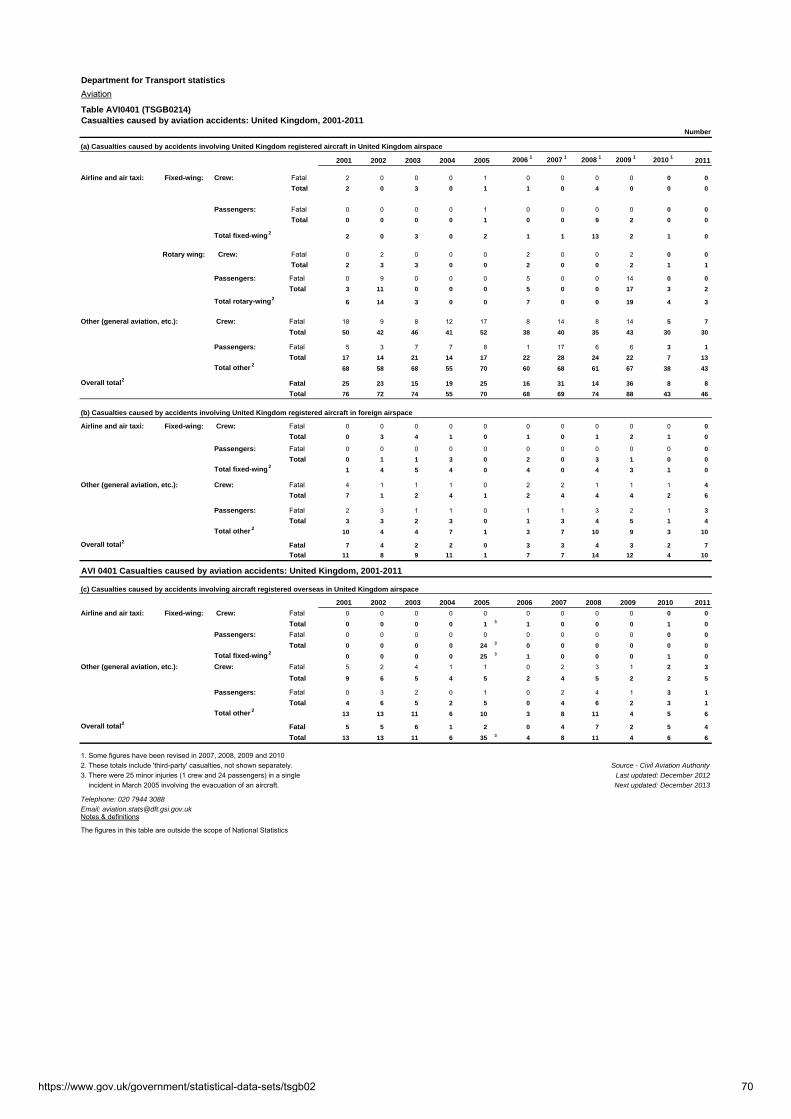
Department for Transport statistics
Aviation
Table AVI0401 (TSGB0214) Casualties caused by aviation accidents: United Kingdom, 2001-2011
Number
(a) Casualties caused by accidents involving United Kingdom registered aircraft in United Kingdom airspace
2001 2002 2003 2004 2005 2006 1 2007 1 2008 1 2009 1 2010 1 2011
Airline and air taxi: Fixed-wing: Crew: Fatal 2 0 0 0 1 0 0 0 0 0 0
Total 2 0 3 0 1 1 0 4 0 0 0
Passengers: Fatal 0 0 0 0 1 0 0 0 0 0 0
Total 0 0 0 0 1 0 0 9 2 0 0
Total fixed-wing 2 2 0 3 0 2 1 1 13 2 1 0
Rotary wing: Crew: Fatal 0 2 0 0 0 2 0 0 2 0 0
Total 2 3 3 0 0 2 0 0 2 1 1
Passengers: Fatal 0 9 0 0 0 5 0 0 14 0 0
Total 3 11 0 0 0 5 0 0 17 3 2
Total rotary-wing 2 6 14 3 0 0 7 0 0 19 4 3
Other (general aviation, etc.): Crew: Fatal 18 9 8 12 17 8 14 8 14 5 7
Total 50 42 46 41 52 38 40 35 43 30 30
Passengers: Fatal 5 3 7 7 8 1 17 6 6 3 1
Total 17 14 21 14 17 22 28 24 22 7 13
Total other 2 68 58 68 55 70 60 68 61 67 38 43
Overall total 2 Fatal 25 23 15 19 25 16 31 14 36 8 8
Total 76 72 74 55 70 68 69 74 88 43 46
(b) Casualties caused by accidents involving United Kingdom registered aircraft in foreign airspace
Airline and air taxi: Fixed-wing: Crew: Fatal 0 0 0 0 0 0 0 0 0 0 0
Total 0 3 4 1 0 1 0 1 2 1 0
Passengers: Fatal 0 0 0 0 0 0 0 0 0 0 0
Total 0 1 1 3 0 2 0 3 1 0 0
Total fixed-wing 2 1 4 5 4 0 4 0 4 3 1 0
Other (general aviation, etc.): Crew: Fatal 4 1 1 1 0 2 2 1 1 1 4
Total 7 1 2 4 1 2 4 4 4 2 6
Passengers: Fatal 2 3 1 1 0 1 1 3 2 1 3
Total 3 3 2 3 0 1 3 4 5 1 4
Total other 2 10 4 4 7 1 3 7 10 9 3 10
Overall total 2 Fatal 7 4 2 2 0 3 3 4 3 2 7
Total 11 8 9 11 1 7 7 14 12 4 10
AVI 0401 Casualties caused by aviation accidents: United Kingdom, 2001-2011
(c) Casualties caused by accidents involving aircraft registered overseas in United Kingdom airspace
2001 2002 2003 2004 2005 2006 2007 2008 2009 2010 2011
Airline and air taxi: Fixed-wing: Crew: Fatal 0 0 0 0 0 0 0 0 0 0 0
Total 0 0 0 0 1 3 1 0 0 0 1 0
Passengers: Fatal 0 0 0 0 0 0 0 0 0 0 0
Total 0 0 0 0 24 3 0 0 0 0 0 0
Total fixed-wing 2 0 0 0 0 25 3 1 0 0 0 1 0
Other (general aviation, etc.): Crew: Fatal 5 2 4 1 1 0 2 3 1 2 3
Total 9 6 5 4 5 2 4 5 2 2 5
Passengers: Fatal 0 3 2 0 1 0 2 4 1 3 1
Total 4 6 5 2 5 0 4 6 2 3 1
Total other 2 13 13 11 6 10 3 8 11 4 5 6
Overall total 2 Fatal 5 5 6 1 2 0 4 7 2 5 4
Total 13 13 11 6 35 3 4 8 11 4 6 6
1. Some figures have been revised in 2007, 2008, 2009 and 20102. These totals include 'third-party' casualties, not shown separately. Source - Civil Aviation Authority
3. There were 25 minor injuries (1 crew and 24 passengers) in a single Last updated: December 2012
incident in March 2005 involving the evacuation of an aircraft. Next updated: December 2013
Telephone: 020 7944 3088
Email: [email protected] Notes & definitions
The figures in this table are outside the scope of National Statistics
https://www.gov.uk/government/statistical-data-sets/tsgb02 70
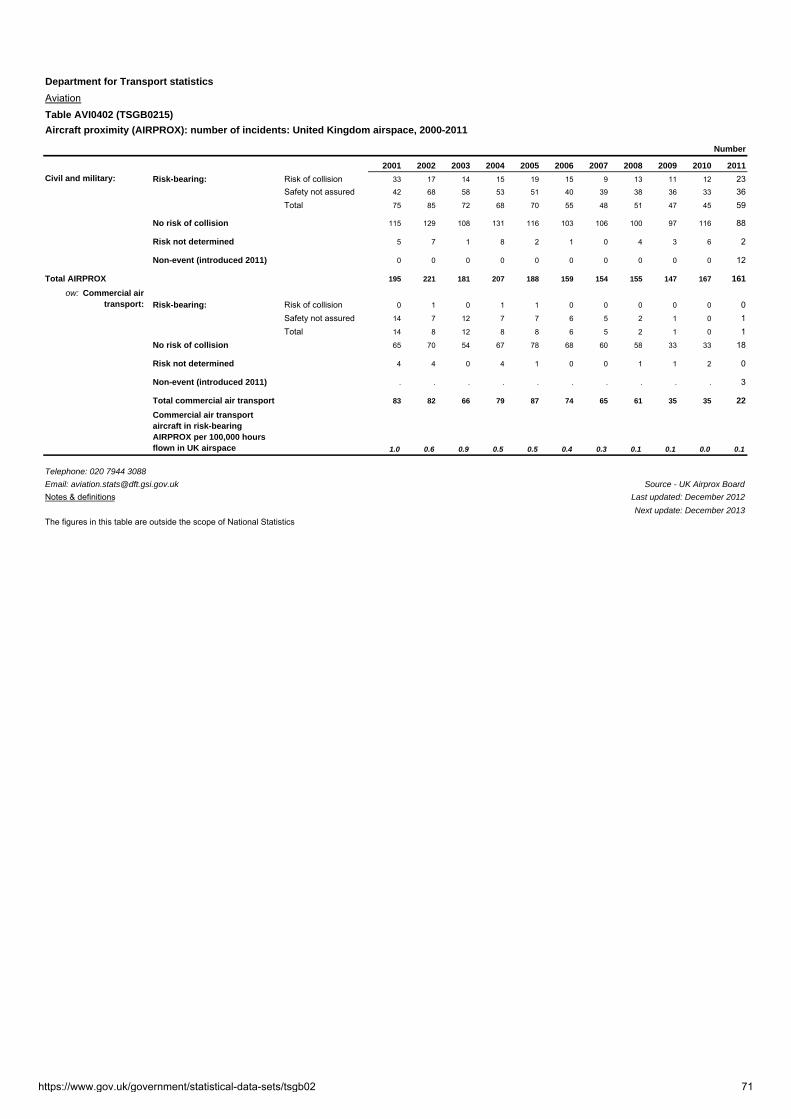
Department for Transport statistics
AviationTable AVI0402 (TSGB0215)
Aircraft proximity (AIRPROX): number of incidents: United Kingdom airspace, 2000-2011
Number
2001 2002 2003 2004 2005 2006 2007 2008 2009 2010 2011
Civil and military: Risk-bearing: Risk of collision 33 17 14 15 19 15 9 13 11 12 23Safety not assured 42 68 58 53 51 40 39 38 36 33 36Total 75 85 72 68 70 55 48 51 47 45 59
No risk of collision 115 129 108 131 116 103 106 100 97 116 88
Risk not determined 5 7 1 8 2 1 0 4 3 6 2
Non-event (introduced 2011) 0 0 0 0 0 0 0 0 0 0 12
Total AIRPROX 195 221 181 207 188 159 154 155 147 167 161
ow: Commercial air transport: Risk-bearing: Risk of collision 0 1 0 1 1 0 0 0 0 0 0
Safety not assured 14 7 12 7 7 6 5 2 1 0 1Total 14 8 12 8 8 6 5 2 1 0 1
No risk of collision 65 70 54 67 78 68 60 58 33 33 18
Risk not determined 4 4 0 4 1 0 0 1 1 2 0
Non-event (introduced 2011) . . . . . . . . . . 3
Total commercial air transport 83 82 66 79 87 74 65 61 35 35 22
Commercial air transport aircraft in risk-bearing AIRPROX per 100,000 hours flown in UK airspace 1.0 0.6 0.9 0.5 0.5 0.4 0.3 0.1 0.1 0.0 0.1
Telephone: 020 7944 3088
Email: [email protected] Source - UK Airprox Board
Notes & definitions Last updated: December 2012
Next update: December 2013The figures in this table are outside the scope of National Statistics
https://www.gov.uk/government/statistical-data-sets/tsgb02 71

https://www.gov.uk/government/statistical-data-sets/tsgb02 72
Transport Statistics Great Britain: 2012
Energy and environment
Transport energy consumption
Table ENV0102 (TSGB0302)
In 2011 transport accounted for 41 per cent of all final energy consumption in the UK. Road transport accounted for 28 per cent of final energy consumption with aviation accounting for 9 per cent.
The direct use of petroleum accounted for 98 per cent of transport energy consumption.
Energy from renewable sources made up around 2.9 per cent of transport energy consumption in 2011 up from 0.1 per cent in 2005.
This summary contains information on:
Transport energy consumption;
Greenhouse gas emissions from transport;
Air pollutant emissions from transport.
Associated tables and charts can be accessed through the Energy and environment statistics webpage.
Background on the data sources for each table can be found in the Energy and environment notes and definitions.
Almost all transport renewable energy consumption is in the form of biofuels blended into petrol and road diesel. Biofuels made up 2.8 per cent of road transport energy consumption in 2011, up from 0.2 per cent in 2005.
Biofuels as a proportion of all road transport fuels 2002 – 2011
0.0
0.5
1.0
1.5
2.0
2.5
3.0
3.5
2002 2003 2004 2005 2006 2007 2008 2009 2010 2011
Per
cen
tag
e in
ter
ms
of
ener
gy
con
ten
t
https://www.gov.uk/government/statistical-data-sets/tsgb03 73

Background notes
More information on energy consumption can be found in the Digest of UK Energy Statistics (DUKES)
Greenhouse gas emissions (Table ENV0201(a)) (TSGB0306)
There is no internationally agreed way of allocating emissions from international transport to individual nation states. However emissions from international shipping and international aviation, based on estimated fuel consumption from UK fuel bunkers, can be added to the domestic emissions to give a UK total.
Between 1990 and 2010 greenhouse gas (GHG) emissions from transport have increased by 11 per cent whilst total GHG emissions have fallen by 21 per cent over the same period. As a result, as a proportion of total GHG emissions, transport emissions have risen from 18 per cent in 1990 to 26 per cent in 2010.
UK greenhouse gas emissions, 1990 – 2010
0
100
200
300
400
500
600
700
800
900
1990 1992 1994 1996 1998 2000 2002 2004 2006 2008 2010
Mil
lio
n t
on
nes
of
carb
on
dio
xid
e eq
uiv
ale
nt
0
5
10
15
20
25
30
35
40
45
Pe
rce
nt
Domestic transport International transport All domestic (exc transport)
Transport emissions as a proportion of allgreenhouse gas emissions (right scale)
Emissions from international transport have grown by 65 per cent between 1990 and 2010. As a proportion of total GHG emissions, international transport emissions have risen from 3 per cent in 1990 to 6 per cent in 2010.
https://www.gov.uk/government/statistical-data-sets/tsgb03 74

Road transport made up 69 per cent of total GHG emissions from transport in 2010. However most of the growth in total transport GHG emissions since 1990 is attributable to growth in international air travel. Emissions from international aviation in 2010 were more than double 1990 levels (a 102 per cent increase). Emissions from international aviation made up a fifth (20 per cent) of total transport GHG emissions in 2010.
UK transport greenhouse gas emissions by mode, 1990 – 2010
0
20
40
60
80
100
120
140
160
180
200
1990 1992 1994 1996 1998 2000 2002 2004 2006 2008 2010
Mill
ion
to
nn
es o
f ca
rbo
n d
ioxi
de
equ
ival
ent
Internationalshipping
Internationalaviation
Domestic excroad transport
Road transportexc car & taxis
Car & taxis
Domestic greenhouse gas emissions (Table ENV0201(a)) (TSGB0306)
Domestic greenhouse gas (GHG) emissions from transport were around the same level in 2010 (121.9 MtCO2e) as in 1990 (122.5 MtCO2e). Domestic emissions from all other sources fell by 28 per cent over the same period. As a result emissions from domestic transport increased as a proportion of all domestic GHG emissions, from 16 per cent in 1990 to 21 per cent in 2010.
Domestic road transport GHG emissions grew by 10 per cent between 1990 and 2007, with continual improvements in the fuel economy of new cars slightly offset by continuing growth in road traffic volumes. This was followed by a fall of 8 per cent between 2007 and 2009 and then no change between 2009 and 2010.
https://www.gov.uk/government/statistical-data-sets/tsgb03 75

Road transport made up 92 per cent of all domestic transport emissions in 2010, with car travel accounting for over a half (56 per cent) and heavy goods vehicle and light van traffic accounting for just under a third (31 per cent).
UK domestic transport greenhouse gas emissions, 2010
Buses and coaches, 3.9%
Motorcycles & mopeds, 0.5%
Rail, 2.8%
Civil aviation, 1.6%
Domestic shipping, 1.5%
Other (inc other road transport emissions), 3.2%
Heavy goods vehicles, 18.9%
Cars and taxis, 55.8%
Light vans, 12.5%
The falls in road traffic volumes during the recession are likely to have been the main driver of the 8 per cent fall in domestic transport GHG emissions between 2007 and 2009. The other key factor was improvements in car fuel economy. Continual improvement in new car fuel economy over time has meant that older less efficient cars have been replaced by increasingly more efficient new cars. This is likely to be key reason for the decreases in car traffic GHG emissions since 2002 despite growth in car traffic volumes.
Increases in biofuels as a proportion of all transport fuels have also contributed to the fall in domestic transport GHG emissions between 2007 and 2010. CO2 emissions from the combustion of biofuels are not included in the GHG emission figures, in line with international guidelines. These CO2 emissions are offset by the CO2 absorbed in the growth of the crops which the biofuels are produced from.
Background notes
1. More information on greenhouse gases emissions can be found on the DECC website at: www.decc.gov.uk/en/content/cms/statistics/climate_stats/gg_emissions/intro/intro.aspx
2. More data on UK greenhouse gas emissions can be found on the DECC website at: http://www.decc.gov.uk/en/content/cms/statistics/climate_stats/gg_emissions/uk_emissions/uk_emissions.aspx
https://www.gov.uk/government/statistical-data-sets/tsgb03 76

Air pollutant emissions from transport (Table ENV0301) (TSGB0308)
Local air pollutants need to be controlled to reduce risks to health, the environment and quality of life. As is the case with greenhouse gas emissions, emissions from road transport accounts for the majority of air quality pollution from transport. Air pollutant emissions from transport have fallen considerably since 1990, mainly as a result of cleaner road vehicles and road fuels.
UK air pollutant emissions: 1990, 2000, 2005 and 2010
0
10
20
30
40
50
60
70
80
90
100
1990
2000
2005
2010
1990
2000
2005
2010
1990
2000
2005
2010
1990
2000
2005
2010
1990
2000
2005
2010
1990
2000
2005
2010
1990
2000
2005
2010
Carbonmonoxide
. Nitrogenoxides
. PM10 . Benzene . 1,3 butadiene . Lead . Sulphurdioxide
Fo
r ea
ch p
ollu
tan
t In
dex
: 19
90 =
100
Transport Non-transport
The general sale of leaded petrol banned at the end of 1999
Carbon monoxide reduces the oxygen carrying capacity of blood. Emissions from transport have fallen by 85 per cent since 1990.
Nitrogen oxides are acid gases and can affect human health and vegetation. They also contribute to the formation of ground level ozone which can trigger a range of health problems and damage vegetation. Nitrogen oxide emissions from transport have fallen by 65 per cent since 1990.
Benzene and 1,3 butadiene are also involved in the formation of ground level ozone and can cause a range of adverse health effects. They are also carcinogenic. Transport emissions of these pollutants have fallen by 85 per cent and 91 per cent respectively.
Background notes
More data and information about air pollutant emissions can be found on the DEFRA Air Quality webpage.
https://www.gov.uk/government/statistical-data-sets/tsgb03 77
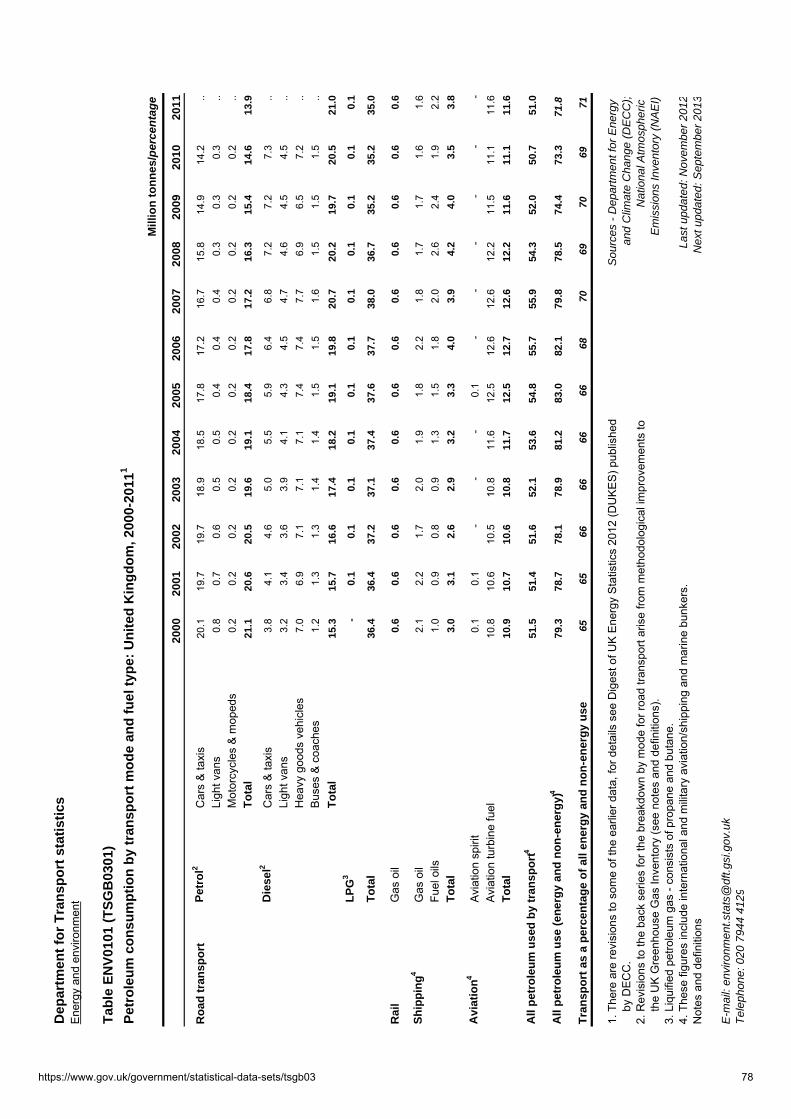
Dep
artm
ent
for
Tra
nsp
ort
sta
tist
ics
Ene
rgy
and
envi
ronm
ent
Tab
le E
NV
0101
(T
SG
B03
01)
Pet
role
um
co
nsu
mp
tio
n b
y tr
ansp
ort
mo
de
and
fu
el t
ype:
Un
ited
Kin
gd
om
, 200
0-20
111
Mill
ion
to
nn
es/p
erce
nta
ge
2000
2001
2002
2003
2004
2005
2006
2007
2008
2009
2010
2011
Ro
ad t
ran
spo
rtP
etro
l2C
ars
& ta
xis
20.1
19.7
19.7
18.9
18.5
17.8
17.2
16.7
15.8
14.9
14.2
..Li
ght v
ans
0.8
0.7
0.6
0.5
0.5
0.4
0.4
0.4
0.3
0.3
0.3
..M
otor
cycl
es &
mop
eds
0.2
0.2
0.2
0.2
0.2
0.2
0.2
0.2
0.2
0.2
0.2
..T
ota
l21
.120
.620
.519
.619
.118
.417
.817
.216
.315
.414
.613
.9
Die
sel2
Car
s &
taxi
s3.
84.
14.
65.
05.
55.
96.
46.
87.
27.
27.
3..
Ligh
t van
s3.
23.
43.
63.
94.
14.
34.
54.
74.
64.
54.
5..
Hea
vy g
oods
veh
icle
s7.
06.
97.
17.
17.
17.
47.
47.
76.
96.
57.
2..
Bus
es &
coa
ches
1.2
1.3
1.3
1.4
1.4
1.5
1.5
1.6
1.5
1.5
1.5
..T
ota
l15
.315
.716
.617
.418
.219
.119
.820
.720
.219
.720
.521
.0
LP
G3
-0.
10.
10.
10.
10.
10.
10.
10.
10.
10.
10.
1
To
tal
36.4
36.4
37.2
37.1
37.4
37.6
37.7
38.0
36.7
35.2
35.2
35.0
Rai
lG
as o
il 0.
60.
60.
60.
60.
60.
60.
60.
60.
60.
60.
60.
6
Sh
ipp
ing
4G
as o
il2.
12.
21.
72.
01.
91.
82.
21.
81.
71.
71.
61.
6Fu
el o
ils1.
00.
90.
80.
91.
31.
51.
82.
02.
62.
41.
92.
2T
ota
l3.
03.
12.
62.
93.
23.
34.
03.
94.
24.
03.
53.
8
Avi
atio
n4
Avi
atio
n sp
irit
0.1
0.1
--
-0.
1-
--
--
-A
viat
ion
turb
ine
fuel
10.8
10.6
10.5
10.8
11.6
12.5
12.6
12.6
12.2
11.5
11.1
11.6
To
tal
10.9
10.7
10.6
10.8
11.7
12.5
12.7
12.6
12.2
11.6
11.1
11.6
All
pet
role
um
use
d b
y tr
ansp
ort
451
.551
.451
.652
.153
.654
.855
.755
.954
.352
.050
.751
.0
All
pet
role
um
use
(en
erg
y an
d n
on
-en
erg
y)4
79.3
78.7
78.1
78.9
81.2
83.0
82.1
79.8
78.5
74.4
73.3
71.8
Tra
nsp
ort
as
a p
erce
nta
ge
of
all e
ner
gy
and
no
n-e
ner
gy
use
6565
6666
6666
6870
6970
6971
1. T
here
are
revi
sion
s to
som
e of
the
earli
er d
ata,
for d
etai
ls s
ee D
iges
t of U
K E
nerg
y S
tatis
tics
2012
(DU
KE
S) p
ublis
hed
Sou
rces
- D
epar
tmen
t for
Ene
rgy
b
y D
EC
C.
and
Clim
ate
Cha
nge
(DE
CC
);2.
Rev
isio
ns to
the
back
ser
ies
for t
he b
reak
dow
n by
mod
e fo
r roa
d tra
nspo
rt ar
ise
from
met
hodo
logi
cal i
mpr
ovem
ents
to
Nat
iona
l Atm
osph
eric
the
UK
Gre
enho
use
Gas
Inve
ntor
y (s
ee n
otes
and
def
initi
ons)
. E
mis
sion
s In
vent
ory
(NA
EI)
3. L
iqui
fied
petro
leum
gas
- co
nsis
ts o
f pro
pane
and
but
ane.
4. T
hese
figu
res
incl
ude
inte
rnat
iona
l and
mili
tary
avi
atio
n/sh
ippi
ng a
nd m
arin
e bu
nker
s.La
st u
pdat
ed: N
ovem
ber
2012
Not
es a
nd d
efin
ition
sN
ext u
pdat
ed: S
epte
mbe
r 20
13
E-m
ail:
envi
ronm
ent.s
tats
@df
t.gsi
.gov
.uk
Tel
epho
ne: 0
20 7
944
4129
https://www.gov.uk/government/statistical-data-sets/tsgb03 78

Dep
artm
ent
for
Tra
nsp
ort
sta
tist
ics
Ene
rgy
and
envi
ronm
ent
Tab
le E
NV
0102
(T
SG
B03
02)
En
erg
y co
nsu
mp
tio
n b
y tr
ansp
ort
mo
de
and
so
urc
e o
f en
erg
y: U
nit
ed K
ing
do
m, 2
000-
2011
1,2
Mill
ion
to
nn
es o
f o
il eq
uiv
alen
t/per
cen
tag
e
2000
2001
2002
2003
2004
2005
2006
2007
2008
2009
2010
2011
(a)
Tra
nsp
ort
en
erg
y co
nsu
mp
tio
n
Per
cen
t o
f al
l en
erg
y co
nsu
med
b
y fi
nal
use
rs in
201
1
Ro
ad t
ran
spo
rtP
etro
leum
341
.141
.141
.941
.842
.242
.542
.542
.941
.139
.639
.238
.627
Bio
fuel
s..
..-
--
0.1
0.2
0.4
0.8
1.0
1.2
1.1
1
Ele
ctric
ity..
....
..-
--
--
--
--
To
tal
41.1
41.1
41.9
41.8
42.2
42.6
42.7
43.2
41.9
40.7
40.4
39.8
28
Rai
lway
sP
etro
leum
0.6
0.7
0.7
0.7
0.7
0.6
0.6
0.6
0.7
0.6
0.7
0.7
-
Ele
ctric
ity..
....
..0.
30.
30.
30.
30.
30.
30.
30.
3-
Coa
l..
....
..-
--
--
--
--
To
tal
....
....
1.0
1.0
1.0
1.0
1.0
1.0
1.0
1.0
1
Sh
ipp
ing
4P
etro
leu
m3.
23.
32.
73.
13.
43.
54.
34.
14.
54.
23.
74.
03
Avi
atio
n4P
etro
leu
m12
.011
.811
.711
.912
.913
.914
.013
.913
.512
.812
.312
.89
To
tal t
ran
spo
rt e
ner
gy
con
sum
pti
on3,
4..
....
..59
.661
.062
.062
.360
.958
.757
.457
.641
All
ener
gy
use
d b
y fi
nal
use
rs1
....
....
162.
216
1.8
159.
515
6.7
156.
514
6.0
151.
814
0.8
100
En
erg
y u
sed
by
tran
spo
rt
as a
per
cen
tag
e o
f al
l
ener
gy
use
d b
y fi
nal
use
rs1
....
....
3738
3940
3940
3841
.
(b)
Tra
nsp
ort
en
erg
y co
nsu
mp
tio
n f
rom
ren
ewab
le s
ou
rces
Per
cen
t o
f al
l tr
ansp
ort
en
erg
y co
nsu
mp
tio
n in
201
1
% e
lect
ricity
gen
erat
ed fr
om re
new
able
sou
rces
....
....
34
45
57
79
Tran
spor
t ren
ewab
le e
lect
ricity
..
....
..-
--
--
0.1
0.1
0.1
0.1
Roa
d tra
nspo
rt bi
ofue
ls..
..-
--
0.1
0.2
0.4
0.8
1.0
1.2
1.1
2.0
To
tal r
enew
able
tra
nsp
ort
en
erg
y co
nsu
mp
tio
n..
....
..-
0.1
0.2
0.4
0.9
1.1
1.3
1.2
2.1
To
tal t
ran
spo
rt e
ner
gy
con
sum
pti
on3
....
....
59.6
61.0
62.0
62.3
60.9
58.7
57.4
57.6
100.
0
Ren
ewab
le e
ner
gy
as a
p
erce
nta
ge
of
all t
ran
spo
rt
ener
gy
con
sum
pti
on
....
....
0.1
0.1
0.3
0.9
2.1
2.6
3.0
2.9
.
1. T
his
is th
e en
ergy
con
tent
of b
oth
prim
ary
and
seco
ndar
y fu
el s
uppl
ied
to fi
nal u
sers
. Thu
s it
is n
et o
f the
fuel
Sou
rces
- D
epar
tmen
t for
Ene
rgy
in
dust
ry's
ow
n us
e an
d co
nver
sion
, tra
nsm
issi
on a
nd d
istri
butio
n lo
sses
. The
ene
rgy
nece
ssar
y to
eva
pora
te th
ean
d C
limat
e C
hang
e (D
EC
C);
w
ater
pre
sent
in th
e fu
el o
r for
med
dur
ing
the
com
bust
ion
proc
ess
is a
lso
excl
uded
. The
non
-ene
rgy
use
of fu
els
isD
iges
t of U
nite
d K
ingd
om E
nerg
y S
tatis
tics;
ex
clud
ed.
Nat
iona
l Atm
osph
eric
2.
The
re a
re re
visi
ons
to s
ome
of th
e ea
rlier
dat
a, fo
r det
ails
see
Dig
est o
f UK
Ene
rgy
Sta
tistic
s 20
12 (D
UK
ES
) E
mis
sion
s In
vent
ory
(NA
EI)
pu
blis
hed
by D
EC
C.
3. T
he 'r
oad
trans
port
- pet
role
um' a
nd 't
rans
port
tota
l' en
ergy
con
sum
ptio
n fig
ures
diff
er s
light
ly fr
om th
ose
in E
NV
0101
sin
ce th
ey in
clud
e a
smal
l am
ount
of p
etro
leum
con
sum
ptio
n fro
m o
ff-ro
ad m
achi
nery
and
equ
ipm
ent.
Last
upd
ated
: Sep
tem
ber
2012
4. T
hese
figu
res
incl
ude
inte
rnat
iona
l and
mili
tary
avi
atio
n/sh
ippi
ng a
nd th
us m
arin
e bu
nker
s.N
ext u
pdat
ed: S
epte
mbe
r 20
13
E-m
ail:
envi
ronm
ent.s
tats
@df
t.gsi
.gov
.uk
Tel
epho
ne: 0
20 7
944
4129
https://www.gov.uk/government/statistical-data-sets/tsgb03 79

Dep
artm
ent
for
Tra
nsp
ort
sta
tist
ics
Ene
rgy
and
envi
ronm
ent
Tab
le E
NV
0103
(T
SG
B03
03)
Ave
rag
e n
ew c
ar f
uel
co
nsu
mp
tio
n:
Gre
at B
rita
in, 1
997-
2011
1,2
litre
s p
er 1
00 k
m/m
iles
per
gal
lon
1997
1998
1999
2000
2001
2002
2003
2004
2005
2006
2007
2008
2009
2010
2011
Pet
rol c
ars
litre
s pe
r 100
km8.
38.
28.
18.
07.
87.
77.
67.
67.
57.
37.
26.
96.
56.
36.
1m
iles
per g
allo
n34
.234
.434
.935
.536
.036
.537
.137
.237
.838
.639
.340
.843
.744
.946
.6
Die
sel c
ars
litre
s pe
r 100
km7.
06.
96.
66.
36.
26.
16.
26.
26.
26.
36.
25.
95.
75.
45.
2m
iles
per g
allo
n44
.944
.944
.944
.945
.846
.345
.846
.045
.745
.446
.048
.049
.852
.153
.1
1. T
hese
figu
res
are
regi
stra
tion
wei
ghte
d (w
eigh
ted
to a
ccou
nt fo
r the
rela
tive
sale
s of
diff
eren
t S
ourc
es -
DV
LA d
atab
ase;
m
odel
s of
car
s).
Soc
iety
of M
otor
Man
ufac
ture
rs
2. T
hese
figu
res
are
obta
ined
und
er c
onsi
sten
t, ca
refu
lly c
ontro
lled
labo
rato
ry c
ondi
tions
and
do
and
Tra
ders
(S
MM
T) ;
n
ot re
fect
ext
erna
l fac
tors
suc
h as
col
d st
arts
, diff
erin
g dr
ivin
g co
nditi
ons,
diff
eren
t loa
dsD
efra
/DE
CC
's G
reen
hous
e
car
ried,
etc
.G
as C
onve
rsio
n F
acto
rs
E-m
ail:
envi
ronm
ent.s
tats
@df
t.gsi
.gov
.uk
Last
upd
ated
: Nov
embe
r 20
12T
elep
hone
: 020
794
4 41
29N
ext u
pdat
ed: N
ovem
ber
2013
https://www.gov.uk/government/statistical-data-sets/tsgb03 80

Dep
artm
ent
for
Tra
nsp
ort
sta
tist
ics
Ene
rgy
and
envi
ronm
ent
Tab
le E
NV
0104
(T
SG
B03
04)
Ave
rag
e h
eavy
go
od
s ve
hic
le f
uel
co
nsu
mp
tio
n:
Gre
at B
rita
in, 1
999-
2010
1,2,
3
Mile
s pe
r gal
lon
Net
wei
gh
t (t
on
nes
)20
0020
0120
0220
0320
0420
0520
0620
0720
0820
0920
10R
igid
veh
icle
sO
ver 3
.5t t
o 7.
5t13
.412
.313
.212
.613
.313
.713
.713
.713
.212
.812
.8O
ver 7
.5t t
o 14
t11
.611
.011
.310
.911
.011
.610
.811
.410
.610
.511
.1O
ver 1
4t to
17t
9.6
9.8
9.7
9.7
10.0
10.1
9.6
9.1
9.3
9.7
9.7
Ove
r 17t
to 2
5t8.
69.
08.
99.
19.
610
.010
.09.
59.
19.
49.
4O
ver 2
5t6.
76.
66.
86.
66.
66.
96.
76.
76.
46.
46.
5A
ll ri
gid
veh
icle
s10
.19.
79.
89.
59.
810
.09.
79.
49.
09.
29.
1
Art
ic v
ehic
les
Ove
r 3.5
t to
33t
8.8
8.6
8.6
8.6
9.0
9.3
9.0
8.9
8.8
8.8
8.5
Ove
r 33t
7.8
7.6
7.7
7.6
7.9
8.0
8.0
7.9
7.6
7.6
7.6
All
arti
c ve
hic
les
8.0
7.8
7.8
7.8
8.0
8.2
8.1
8.0
7.7
7.7
7.6
1. T
hese
figu
res
are
for h
eavy
goo
ds v
ehic
les
regi
ster
ed a
s go
ods
vehi
cles
in G
reat
Brit
ain,
car
ryin
g fre
ight
with
in th
e U
nite
d K
ingd
om. T
he fi
gure
s
exc
lude
non
-frei
ght c
arry
ing
HG
Vs
such
as
reco
very
veh
icle
s or
fire
eng
ines
.2.
The
se fi
gure
s ar
e ba
sed
on th
e ga
llons
of f
uel p
urch
ased
by
haul
iers
or t
aken
from
thei
r ow
n su
pplie
s fo
r a s
urve
yed
vehi
cle,
toge
ther
with
thei
r
reco
rds
of m
iles
trave
lled
durin
g a
give
n su
rvey
wee
k (s
ee n
otes
and
def
initi
ons)
. 3.
Roa
d Fr
eigh
t Sta
tistic
s 20
11 h
as n
ot y
et b
een
publ
ishe
d so
thes
e da
ta a
re n
ot y
et a
vaila
ble.
Tel
epho
ne: 0
20 7
944
4129
Sou
rce:
Con
tinui
ng S
urve
y of
Roa
ds G
oods
Tra
nspo
rt, D
fTE
-mai
l: en
viro
nmen
t.sta
ts@
dft.g
si.g
ov.u
kN
otes
and
def
initi
ons
Last
upd
ated
: Nov
embe
r 20
11N
ext u
pdat
ed: 2
013
The
figur
es in
this
tabl
e ar
e N
atio
nal S
tatis
tics
https://www.gov.uk/government/statistical-data-sets/tsgb03 81
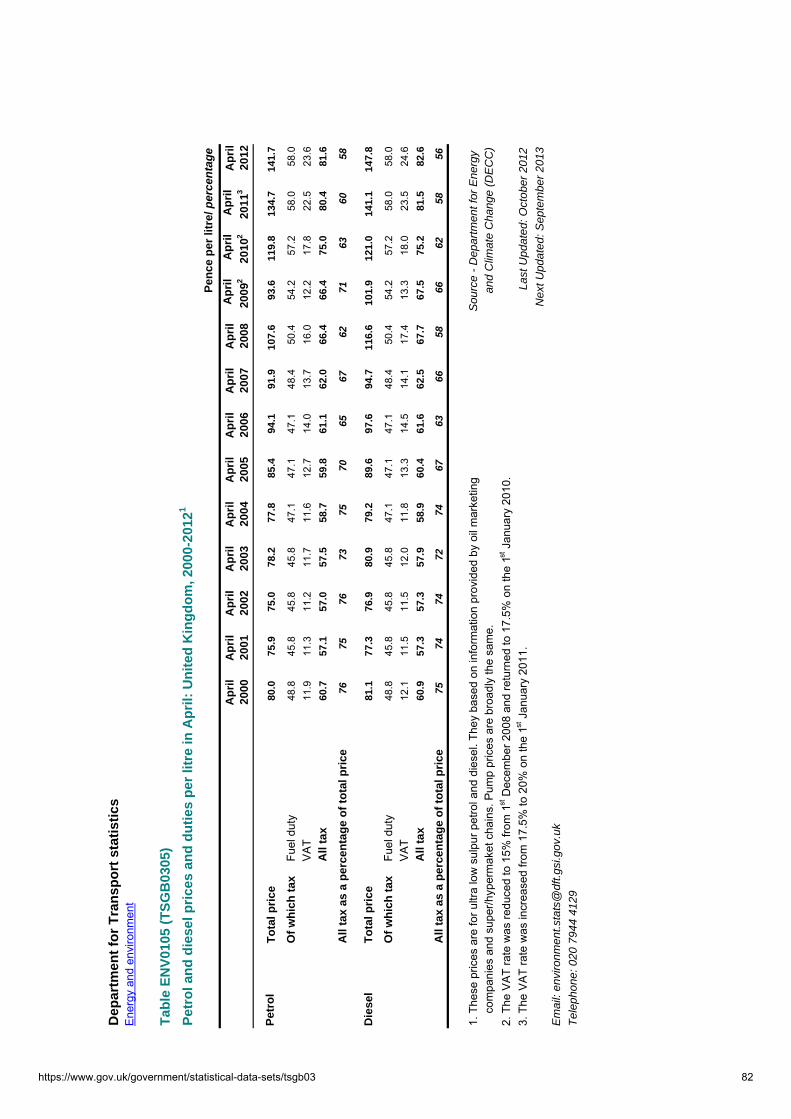
Dep
artm
ent
for
Tra
nsp
ort
sta
tist
ics
Ene
rgy
and
envi
ronm
ent
Tab
le E
NV
0105
(T
SG
B03
05)
Pet
rol a
nd
die
sel p
rice
s an
d d
uti
es p
er li
tre
in A
pri
l: U
nit
ed K
ing
do
m, 2
000-
2012
1
Pen
ce p
er li
tre/
per
cen
tag
e
Ap
ril
2000
Ap
ril
2001
Ap
ril
2002
Ap
ril
2003
Ap
ril
2004
Ap
ril
2005
Ap
ril
2006
Ap
ril
2007
Ap
ril
2008
Ap
ril
2009
2
Ap
ril
2010
2
Ap
ril
2011
3A
pri
l20
12
Pet
rol
To
tal p
rice
80.0
75.9
75.0
78.2
77.8
85.4
94.1
91.9
107.
693
.611
9.8
134.
714
1.7
Of
wh
ich
tax
Fuel
dut
y48
.845
.845
.845
.847
.147
.147
.148
.450
.454
.257
.258
.058
.0V
AT
11.9
11.3
11.2
11.7
11.6
12.7
14.0
13.7
16.0
12.2
17.8
22.5
23.6
All
tax
60.7
57.1
57.0
57.5
58.7
59.8
61.1
62.0
66.4
66.4
75.0
80.4
81.6
All
tax
as a
per
cen
tag
e o
f to
tal p
rice
7675
7673
7570
6567
6271
6360
58
Die
sel
To
tal p
rice
81.1
77.3
76.9
80.9
79.2
89.6
97.6
94.7
116.
610
1.9
121.
014
1.1
147.
8
Of
wh
ich
tax
Fuel
dut
y48
.845
.845
.845
.847
.147
.147
.148
.450
.454
.257
.258
.058
.0V
AT
12.1
11.5
11.5
12.0
11.8
13.3
14.5
14.1
17.4
13.3
18.0
23.5
24.6
All
tax
60.9
57.3
57.3
57.9
58.9
60.4
61.6
62.5
67.7
67.5
75.2
81.5
82.6
All
tax
as a
per
cen
tag
e o
f to
tal p
rice
7574
7472
7467
6366
5866
6258
56
1. T
hese
pric
es a
re fo
r ultr
a lo
w s
ulpu
r pet
rol a
nd d
iese
l. Th
ey b
ased
on
info
rmat
ion
prov
ided
by
oil m
arke
ting
Sou
rce
- D
epar
tmen
t for
Ene
rgy
c
ompa
nies
and
sup
er/h
yper
mak
et c
hain
s. P
ump
pric
es a
re b
road
ly th
e sa
me.
and
Clim
ate
Cha
nge
(DE
CC
)
2. T
he V
AT
rate
was
redu
ced
to 1
5% fr
om 1
st D
ecem
ber 2
008
and
retu
rned
to 1
7.5%
on
the
1st J
anua
ry 2
010.
3. T
he V
AT
rate
was
incr
ease
d fro
m 1
7.5%
to 2
0% o
n th
e 1st
Jan
uary
201
1.La
st U
pdat
ed: O
ctob
er 2
012
Nex
t Upd
ated
: Sep
tem
ber
2013
Em
ail:
envi
ronm
ent.s
tats
@df
t.gsi
.gov
.uk
Tel
epho
ne: 0
20 7
944
4129
https://www.gov.uk/government/statistical-data-sets/tsgb03 82

Department for Transport statisticsEnergy and the Environment
Table ENV0201 (TSGB0306)
Greenhouse gas emissions by transport mode: United Kingdom, 1999-20101
Million tonnes of carbon dioxide equivalent/percentage
1999 2000 2001 2002 2003 2004 2005 2006 2007 2008 2009 2010
(a) By source2
Percent of all domestic
in 2010Domestic transport Road transport Cars and taxis 76.7 76.5 76.1 77.3 75.9 76.3 75.5 75.1 74.5 73.0 70.3 68.0 12
Heavy goods vehicles 23.4 22.4 22.1 22.7 22.6 22.7 23.4 23.6 24.4 22.1 20.8 23.1 4
Light vans 12.6 12.8 13.2 13.5 14.0 14.6 14.9 15.4 16.0 15.7 15.1 15.2 3
Buses and coaches 3.9 4.0 4.0 4.2 4.6 4.5 4.7 4.8 5.0 4.8 4.7 4.7 1
Motorcycles & mopeds 0.6 0.6 0.6 0.6 0.7 0.6 0.7 0.6 0.7 0.6 0.6 0.6 -
Other road transport emissions3 0.2 0.3 0.4 0.5 0.5 0.6 0.5 0.5 0.5 0.5 0.4 0.5 -
Total 117.4 116.5 116.4 118.7 118.3 119.4 119.8 120.1 121.1 116.7 112.0 112.0 19
Other transport Rail1,4 1.8 1.8 1.9 1.9 1.9 2.0 2.1 2.1 2.2 2.2 2.2 2.2 -
Domestic aviation 1.9 2.1 2.2 2.2 2.2 2.3 2.5 2.4 2.3 2.2 1.9 1.8 -
Domestic shipping1 2.6 2.5 2.4 2.5 2.5 2.6 2.6 2.6 2.6 2.5 2.4 2.4 -
Other5 4.1 3.8 3.8 3.9 3.7 3.6 3.3 3.6 4.3 4.2 3.6 3.4 1
Total 10.3 10.1 10.3 10.5 10.4 10.5 10.6 10.7 11.3 11.1 10.1 9.8 2
Total domestic transport 127.8 126.7 126.7 129.2 128.7 129.9 130.4 130.8 132.4 127.7 122.2 121.9 21
Net domestic emissions all sources 670.7 672.0 676.3 654.8 659.1 657.9 652.5 647.9 638.1 623.6 569.6 587.8 100
Internationalemissions
(Memo items)6 International aviation 27.6 30.5 29.7 29.2 29.9 32.7 35.5 35.9 35.7 34.8 33.3 31.8 .
International shipping 1 7.5 6.8 7.0 5.4 6.5 7.3 7.8 10.1 9.7 10.9 10.1 8.7 .
(b) By end user2
Percent of all domestic
in 2010Domestic transport Road 134.9 133.5 133.6 137.0 135.6 135.5 135.9 135.4 136.5 131.0 126.3 126.3 21
Rail4 4.1 4.2 4.4 4.4 4.5 4.6 4.6 4.7 4.6 4.6 4.4 4.5 1
Domestic aviation 2.2 2.4 2.5 2.5 2.5 2.6 2.9 2.7 2.6 2.5 2.2 2.0 -
Domestic shipping12.5 2.5 2.5 2.5 2.7 2.8 2.9 2.8 2.9 2.9 2.8 2.7 -
Other54.6 4.3 4.3 4.4 4.2 4.1 3.7 4.1 4.8 4.7 4.0 3.9 1
Total 148.4 146.9 147.4 150.9 149.6 149.7 150.0 149.7 151.4 145.6 139.8 139.4 24Net domestic emissions all end users 670.7 672.0 676.3 654.8 659.1 657.9 652.5 647.9 638.1 623.6 569.6 587.8 100
(c) By industry7 SIC 2007
code7 Industry
Percent of all sectors
in 2010
Transport and storage industries 49.1 + 49.2 Rail transport 1.9 1.9 1.9 1.8 1.8 1.9 2.0 2.0 2.2 2.2 2.2 2.3 -
49.31/9 + 49.39 Buses, coaches, trams, etc 3.9 4.1 4.0 4.1 4.1 4.3 4.3 4.4 4.5 4.8 4.8 4.8 1
49.31/1 Underground & metro 0.6 0.6 0.6 0.6 0.6 0.7 0.7 0.7 0.7 0.7 0.7 0.7 -
49.32 Taxi operation 1.5 1.7 1.8 1.8 1.9 1.9 2.0 2.0 2.1 2.2 2.2 2.3 -
49.4 Road freight and removal services 15.2 14.7 14.9 15.4 16.4 16.0 16.6 17.1 16.6 15.9 15.3 15.0 2
49.5 Transport via pipeline 0.1 0.1 0.1 0.1 0.1 0.1 0.1 0.1 0.1 0.1 0.1 0.1 -
50 Water transport services 17.0 18.7 17.8 17.3 16.8 17.0 20.7 20.0 19.6 16.7 15.8 19.8 3
51 Air transport services 20.5 19.4 21.1 22.9 22.9 24.8 26.6 28.3 31.6 34.1 37.6 37.1 6
52 Warehousing and transport support 1.4 1.4 1.3 1.4 1.3 1.3 1.4 1.3 1.2 1.3 1.3 1.3 -
53 Postal and courier services 1.1 1.1 1.1 1.2 1.2 1.3 1.3 1.3 1.4 1.4 1.4 1.4 -
H All transport and storage industries 63.1 63.6 64.6 66.6 67.1 69.2 75.7 77.1 80.1 79.4 81.5 84.6 13
Household private transport 65.3 65.3 66.6 68.9 68.4 69.9 69.7 69.8 69.5 68.7 67.3 65.6 10
Total emissions all sectors 723.6 728.7 737.6 717.4 726.7 732.7 732.9 722.0 714.4 703.1 645.2 664.5 100
1. UK national emissions estimates are updated annually and any developments in methodology Sources - AEA Energy & Environment/DECC (NAEI); are applied retrospectively to earlier years. The largest revisions in the latest estimates were Office for National Statistics (Environmental Accounts) for shipping (a reallocation of emissions from domestic to international) and rail (a slight decrease across the series). See notes and definitions for the reasons behind these revisions. Last updated: November 20122. The 'by source' figures for transport only include direct emissions from transport while the 'by final Next updated: September 2013 user' transport figures also include appoximate emissions resulting from the production of the fuels used, which takes place within the UK (see notes and definitions). 3. 'Other road transport emissions' consist of emissions from road vehicles running on liquified petroleum gas (propane and butane) and emissions from the evaporation of engine lubricants. 4. There are no direct emissions from electric trains. However the final user emissions do include the emissions resulting from the production of the electricity used by electric trains. 5. Other mainly consists of 'military aircraft and shipping' and 'aircraft support vehicles'. 6. International aviation and international shipping emissions are not included in the national total reported to the UNFCCC, since there is no internationally agreed way of allocating these emissions to individual nation states (see notes and definitions).7. The economic sectors are based on similar concepts and classifications of industries to those used in the National Accounts (see notes and definitions). SIC 2007 = UK Standard Industrial Classification of Economic Activities 2007.
Note: The basket of greenhouse gases consists of carbon dioxide, methane, nitrous oxide, hydro-fluorocarbons, perfluorocarbons and sulphur hexafluoride (CO2, CH4, N2O, HFCs, PFCs and SF6).
E-mail: [email protected]: 020 7944 4129
https://www.gov.uk/government/statistical-data-sets/tsgb03 83

Department for Transport statisticsEnergy and the Environment
Table ENV0202 (TSGB0307)
Carbon dioxide emissions by transport mode: United Kingdom, 1999-20101
Million tonnes of carbon dioxide/percentage
1999 2000 2001 2002 2003 2004 2005 2006 2007 2008 2009 2010
(a) By source2
Percent of all domestic
in 2010Domestic transport Road transport Cars and taxis 75.2 75.1 74.9 76.1 74.8 75.3 74.5 74.1 73.7 72.3 69.7 67.4 14
Heavy goods vehicles 23.2 22.3 22.0 22.5 22.5 22.6 23.3 23.5 24.3 21.9 20.7 22.9 5
Light vans 12.5 12.7 13.1 13.4 13.9 14.5 14.8 15.3 15.9 15.5 15.0 15.1 3
Buses and coaches 3.9 4.0 4.0 4.2 4.5 4.5 4.7 4.8 5.0 4.8 4.7 4.7 1
Motorcycles & mopeds 0.5 0.5 0.6 0.6 0.7 0.6 0.6 0.6 0.7 0.6 0.6 0.6 -
Other road transport emissions3 0.2 0.3 0.4 0.5 0.5 0.5 0.5 0.5 0.5 0.5 0.4 0.5 -
Total 115.6 114.8 114.8 117.2 116.9 118.0 118.6 118.9 120.0 115.7 111.1 111.1 22
Other transport Rail1,4 1.6 1.6 1.7 1.7 1.7 1.8 1.9 1.9 1.9 2.0 2.0 2.0 -
Domestic aviation 1.9 2.0 2.1 2.1 2.2 2.3 2.5 2.4 2.3 2.2 1.9 1.8 -
Domestic shipping1 2.5 2.4 2.4 2.5 2.5 2.5 2.6 2.5 2.5 2.5 2.4 2.4 -
Other5 4.0 3.7 3.7 3.8 3.6 3.5 3.2 3.5 4.2 4.1 3.5 3.4 1
Total 10.0 9.8 10.0 10.2 10.0 10.2 10.2 10.4 10.9 10.7 9.8 9.5 2
Total domestic transport 125.7 124.6 124.8 127.4 127.0 128.2 128.8 129.2 130.9 126.4 120.9 120.6 24
Net domestic emissions all sources 543.3 550.5 562.1 544.9 554.6 555.0 551.2 549.4 541.8 529.0 477.8 495.8 100
Internationalemissions
(Memo items)6 International aviation 27.4 30.2 29.4 28.9 29.6 32.4 35.1 35.6 35.4 34.5 32.9 31.5 .
International shipping 1 7.5 6.8 7.0 5.4 6.5 7.3 7.8 10.1 9.7 10.9 10.1 8.7 .
(b) By end user2
Percent of all domestic
in 2010Domestic transport Road 132.2 130.9 131.1 134.6 133.5 133.4 134.0 133.6 134.6 129.4 124.8 124.8 25
Rail4 3.8 3.9 4.1 4.1 4.2 4.3 4.3 4.4 4.3 4.3 4.1 4.2 1
Domestic aviation 1.5 1.6 1.7 1.8 2.0 2.2 2.3 2.5 2.5 2.5 2.6 2.8 1
Domestic shipping12.9 2.8 2.7 2.8 2.8 2.8 2.9 2.8 2.8 2.8 2.7 2.6 1
Other54.5 4.2 4.2 4.3 4.1 4.0 3.6 4.0 4.7 4.5 3.9 3.8 1
Total 144.9 143.4 143.9 147.7 146.6 146.7 147.2 147.2 149.0 143.6 138.1 138.3 28Net domestic emissions all end users 543.3 550.5 562.1 544.9 554.6 555.0 551.2 549.4 541.8 529.0 477.8 495.8 100
(c) By industry7 SIC 2007
code7 Industry
Percent of all sectors
in 2010
Transport and storage industries 49.1+ 49.2 Rail transport 2.0 2.0 2.1 2.1 2.2 2.3 2.3 2.3 2.4 2.4 2.4 2.4 -
49.31/9 + 49.39 Buses, coaches, trams, etc 4.7 4.7 4.7 4.9 5.3 5.3 5.5 5.6 5.9 5.7 5.6 5.7 1
49.31/1 Underground & metro 0.7 0.7 0.7 0.6 0.2 0.2 0.2 0.2 0.2 0.2 0.2 0.2 -
49.32 Taxi operation 2.1 2.2 2.2 2.3 2.3 2.3 2.4 2.5 2.6 2.6 2.6 2.7 -
49.4 Road freight and removal services 15.8 15.1 14.8 15.0 14.9 14.8 15.0 15.1 15.6 14.1 12.3 13.5 2
49.5 Transport via pipeline 0.1 0.1 0.1 0.1 0.1 0.1 0.1 0.1 0.1 0.1 0.1 0.1 -
50 Water transport services 16.6 15.7 19.6 20.8 23.2 26.4 26.9 19.4 19.1 19.6 16.5 17.5 3
51 Air transport services 33.7 37.2 36.7 35.8 37.0 39.2 42.6 43.2 43.8 43.2 41.4 39.8 7
52 Warehousing and transport support 1.2 1.2 1.1 1.1 1.1 1.1 1.2 1.3 1.3 1.3 1.1 1.1 -
53 Postal and courier services 1.3 1.3 1.3 1.3 1.4 1.3 1.5 1.4 1.5 1.6 1.6 1.8 -
H All transport and storage industries 78.3 80.3 83.4 84.0 87.6 93.0 97.6 91.0 92.3 90.8 83.7 84.7 15
Household private transport 63.4 63.3 64.4 66.6 65.9 67.4 67.0 67.0 66.7 65.8 64.3 62.7 11
Total emissions all sectors 597.0 607.7 623.9 608.0 622.6 630.2 631.9 623.9 618.4 608.9 553.8 572.8 100
1. UK national emissions estimates are updated annually and any developments in methodology Sources - AEA Energy & Environment/DECC (NAEI); are applied retrospectively to earlier years. The largest revisions in the latest estimates were Office for National Statistics (Environmental Accounts) for shipping (a reallocation of emissions from domestic to international) and rail (a slight decrease across the series). See notes and definitions for the reasons behind these revisions. Last updated: November 20122. The 'by source' figures for transport only include direct emissions from transport while the 'by final Next updated: September 2013 user' transport figures also include appoximate emissions resulting from the production of the fuels used, which takes place within the UK (see notes and definitions). 3. 'Other road transport emissions' consist of emissions from road vehicles running on liquified petroleum gas (propane and butane) and emissions from the evaporation of engine lubricants. 4. There are no direct emissions from electric trains. However the final user emissions do include the emissions resulting from the production of the electricity used by electric trains. 5. Other mainly consists of 'military aircraft and shipping' and 'aircraft support vehicles'. 6. International aviation and international shipping emissions are not included in the national total reported to the UNFCCC, since there is no internationally agreed way of allocating these emissions to individual nation states (see notes and definitions).7. The economic sectors are based on similar concepts and classifications of industries to those used in the National Accounts (see notes and definitions). SIC 2007 = UK Standard Industrial Classification of Economic Activities 2007.
E-mail: [email protected]: 020 7944 4129
https://www.gov.uk/government/statistical-data-sets/tsgb03 84

Department for Transport statisticsEnergy and environment
Table ENV0301 (TSGB0308)Air pollutant emissions by transport mode: United Kingdom, 1999-20101
Thousand tonnes/percentage
1999 2000 2001 2002 2003 2004 2005 2006 2007 2008 2009 2010
Per cent of totalin 2010
(a) Carbon monoxide (CO)
Transport emissions Road transport Cars and taxis13,876 3,389 3,071 2,749 2,447 2,195 1,912 1,677 1,413 1,280 934 784 37
Light vans 371 291 236 189 156 130 105 96 84 72 63 52 2
Heavy goods vehicles 48 46 44 43 41 40 38 36 35 29 21 19 1
Buses and coaches 11 10 8 8 8 8 7 7 7 5 5 4 -
Motorcycles & mopeds 98 93 93 94 101 88 86 77 74 63 59 50 2
Total 4,403 3,829 3,452 3,083 2,753 2,461 2,149 1,894 1,613 1,449 1,082 909 43
Other transport Rail 12 11 11 12 11 12 13 15 15 15 15 15 1
Aviation - LTO253 61 65 56 52 59 61 56 39 35 27 26 1
Domestic shipping 22 22 23 25 26 27 28 29 31 32 33 33 2
Total 87 94 99 92 89 98 102 100 84 82 75 74 3
Transport total 4,490 3,923 3,551 3,175 2,842 2,559 2,251 1,994 1,697 1,531 1,157 983 46
National total reported to the UNECE 6,428 5,653 5,303 4,677 4,194 3,901 3,510 3,280 2,982 2,818 2,317 2,125 100
Transport memo items3 Aviation - cruise211 12 12 12 12 13 14 14 14 13 12 12 .
International shipping 18 16 16 13 15 17 18 24 23 25 24 21 .
(b) Nitrogen oxides (NOx)Thousand tonnes/percentage
Transport emissions Road transport Cars and taxis 451 396 370 342 311 289 271 256 234 227 178 163 15
Light vans 88 84 81 76 74 72 70 68 68 64 61 60 5
Heavy goods vehicles 195 188 185 181 177 175 170 166 164 148 119 111 10
Buses and coaches 53 50 48 47 47 45 43 44 43 38 36 35 3
Motorcycles & mopeds 1 2 2 2 2 2 2 1 1 1 1 1 -
Total 788 719 685 647 610 584 556 536 511 478 396 371 34
Other transport Rail 35 40 42 37 34 36 37 38 37 37 36 36 3
Aviation - LTO211 11 11 11 12 13 14 13 13 13 12 11 1
Domestic shipping 47 44 42 44 43 43 44 42 41 40 39 37 3
Total 92 95 95 91 88 91 95 93 92 90 86 85 8
Transport total 880 814 780 738 698 675 651 629 603 568 482 455 41
National total reported to the UNECE 1,861 1,791 1,761 1,678 1,646 1,594 1,580 1,525 1,461 1,317 1,143 1,106 100
Transport memo items3 Aviation - cruise2123 134 130 126 129 141 153 155 154 149 143 137 .
International shipping 167 147 149 116 137 157 168 217 229 259 240 208 .
(c) Particulates (PM10) - airbourne particulate matter with aerodynamic diameter less than 10 micrometresThousand tonnes/percentage
Transport emissions Road transport Cars and taxis 8.7 7.1 7.0 6.8 6.6 6.5 6.4 6.2 5.9 5.9 5.8 5.4 5
Light vans 8.1 6.8 6.8 6.2 5.9 5.5 5.2 4.6 4.3 3.8 3.5 3.5 3
Heavy goods vehicles 8.0 6.7 6.1 5.5 5.0 4.6 4.2 3.9 3.6 2.9 2.2 2.0 2
Buses and coaches 1.8 1.4 1.2 1.1 1.0 0.9 0.8 0.7 0.7 0.5 0.5 0.4 -
Motorcycles & mopeds 0.2 0.1 0.1 0.1 0.2 0.1 0.1 0.1 0.1 0.1 0.1 0.1 -
Tyre & brake wear 8.7 8.8 8.9 9.1 9.2 9.3 9.3 9.5 9.6 9.5 9.3 9.2 8
Road abrasion 4.6 4.7 4.7 4.8 4.9 4.9 4.9 5.0 5.1 5.0 4.9 4.8 4
Total 40.1 35.6 34.7 33.5 32.7 32.0 31.0 30.1 29.2 27.7 26.3 25.4 22
Other transport Rail 0.8 0.8 0.8 0.7 0.6 0.6 0.7 0.7 0.7 0.7 0.7 0.7 1
Aviation - LTO20.1 0.1 0.1 0.1 0.1 0.1 0.1 0.1 0.1 0.1 0.1 0.1 -
Domestic shipping 3.3 3.1 3.0 3.1 3.1 3.1 3.2 3.1 2.2 2.2 2.1 2.0 2
Total 4.3 4.0 3.9 3.9 3.8 3.8 4.0 3.9 3.0 3.0 2.9 2.8 2
Transport total 44.4 39.6 38.6 37.4 36.5 35.8 35.0 34.0 32.3 30.7 29.2 28.2 25
National total reported to the UNECE 186.1 171.3 164.9 143.1 140.0 137.8 135.0 133.4 130.7 125.6 113.9 114.2 100
Road transport resuspension419.3 19.4 19.7 20.2 20.4 20.7 20.7 21.1 21.3 21.2 21.0 20.6 .
Transport memo items3 Aviation - cruise21.7 1.9 1.9 1.8 1.9 2.0 2.2 2.2 2.2 2.2 2.1 2.0 .
International shipping 7.4 5.8 5.5 4.5 5.5 7.5 8.8 11.4 15.1 18.3 16.6 14.1 .
(d) BenzeneThousand tonnes/percentage
Transport emissions Road transport5 Cars and taxis 16.0 11.0 11.0 10.4 9.7 8.9 7.8 6.8 5.5 4.7 3.3 2.5 19
Light vans 0.9 0.3 0.3 0.3 0.3 0.2 0.2 0.2 0.2 0.1 0.1 0.1 1
Heavy goods vehicles 0.2 0.2 0.1 0.1 0.1 0.1 0.1 0.1 0.1 0.1 0.1 0.1 1
Buses and coaches - - - - 0.1 0.1 0.1 0.1 0.1 - - - -
Motorcycles & mopeds 0.8 0.2 0.3 0.3 0.3 0.3 0.3 0.3 0.3 0.2 0.2 0.1 1
Petrol evaporation 1.7 0.4 0.4 0.3 0.2 0.2 0.1 0.1 0.1 - - - -
Total 19.6 12.1 12.2 11.5 10.7 9.7 8.5 7.5 6.1 5.3 3.7 2.8 22
Other transport Rail 0.4 0.4 0.5 0.4 0.4 0.5 0.5 0.5 0.5 0.5 0.5 0.5 3
Aviation - LTO20.1 0.1 - - - - - - - - - - -
Domestic shipping 0.4 0.4 0.4 0.4 0.4 0.4 0.4 0.4 0.5 0.5 0.5 0.5 1
Total 0.9 0.9 0.9 0.9 0.9 0.9 1.0 1.0 1.0 1.0 0.9 0.9 4
Transport total 20.5 13.0 13.1 12.4 11.6 10.7 9.5 8.4 7.1 6.2 4.7 3.7 25
National total reported to the UNECE 29.8 21.4 21.0 19.6 18.4 17.7 16.2 15.0 13.6 12.4 10.3 9.3 100
Transport memo items3 Aviation - cruise20.1 0.1 0.1 0.1 0.1 0.1 0.1 0.1 0.1 0.1 0.1 0.1 .
International shipping 1.0 0.9 0.9 0.7 0.8 0.9 1.0 1.3 1.2 1.4 1.3 1.1 .
https://www.gov.uk/government/statistical-data-sets/tsgb03 85

ENV0301 (continued) Air pollutant emissions by transport mode: United Kingdom, 1999-20101
1999 2000 2001 2002 2003 2004 2005 2006 2007 2008 2009 2010
Per cent of totalin 2010
(e) 1,3-butadieneThousand tonnes/percentage
Transport emissions Road transport Cars and taxis 5.7 4.8 4.0 3.4 2.9 2.5 2.1 1.9 1.6 1.4 0.8 0.7 37
Light vans 0.6 0.4 0.3 0.3 0.2 0.2 0.1 0.1 0.1 0.1 0.1 0.1 4
Heavy goods vehicles 0.4 0.4 0.4 0.3 0.3 0.3 0.3 0.3 0.2 0.2 0.1 0.1 7
Buses and coaches 0.1 0.1 0.1 0.1 0.1 0.1 0.1 0.1 0.1 - - - 2
Motorcycles & mopeds 0.1 0.1 0.1 0.1 0.1 0.1 0.1 0.1 0.1 - - - 2
Total 6.9 5.8 5.0 4.2 3.6 3.1 2.7 2.4 2.0 1.8 1.1 0.9 52
Other transport Rail 0.2 0.2 0.2 0.2 0.2 0.2 0.2 0.2 0.2 0.2 0.2 0.2 7
Aviation - LTO20.1 - - - - - - - - - - - 1
Total - - - - 0.1 0.1 0.1 0.1 0.1 0.1 0.1 0.1 9
Transport total 0.3 0.3 0.3 0.3 0.3 0.3 0.3 0.3 0.3 0.3 0.3 0.3 61
National total reported to the UNECE 7.2 6.1 5.2 4.5 3.9 3.4 3.0 2.7 2.3 2.1 1.4 1.2 100
Transport memo items3 Aviation - cruise28.6 7.3 6.4 5.6 4.9 4.4 4.0 3.6 3.3 3.0 2.3 2.1 .
(f) Lead (Pb)Tonnes/percentage
Transport emissions Road transport5 Cars and taxis 283.0 1.5 1.3 1.3 1.3 1.3 1.3 1.3 1.0 1.0 0.9 0.9 2
Light vans 13.8 0.2 0.2 0.2 0.2 0.2 0.2 0.2 0.2 0.2 0.2 0.2 -
Heavy goods vehicles 0.4 0.4 0.3 0.4 0.4 0.4 0.4 0.4 0.4 0.3 0.3 0.4 1
Buses and coaches 0.1 0.1 0.1 0.1 0.1 0.1 0.1 0.1 0.1 0.1 0.1 0.1 -
Motorcycles & mopeds 2.4 - - - - - - - - - - - -
Total 299.6 2.2 2.0 1.9 1.9 2.0 2.0 2.0 1.7 1.6 1.6 1.6 3
Other transport Rail 0.2 0.2 0.2 0.2 0.2 0.2 0.2 0.2 0.2 0.2 0.2 0.2 -
Aviation - LTO2- 0.1 0.1 - 0.1 0.1 0.1 0.1 0.1 0.1 - - -
Domestic shipping - - - - - - - - - - - - -
Total 0.2 0.2 0.2 0.2 0.2 0.2 0.2 0.2 0.3 0.3 0.2 0.2 1
Transport total 299.8 2.4 2.2 2.2 2.2 2.2 2.3 2.3 1.9 1.9 1.8 1.8 3
National total reported to the UNECE 476.8 149.2 142.2 131.6 116.5 117.6 107.5 87.9 79.2 73.0 63.4 59.4 100
Transport memo items3 Aviation - cruise20.5 0.5 0.5 0.5 0.5 0.6 0.6 0.6 0.6 0.6 0.6 0.5 .
International shipping 0.9 0.8 0.8 0.6 0.8 0.9 1.0 1.3 1.4 1.6 1.5 1.3 .
(g) Sulphur dioxide (SO2)Thousand tonnes/percentage
Transport emissions Road transport5 Cars and taxis 12.0 5.5 3.1 2.7 2.7 2.5 2.1 2.1 1.8 1.3 0.7 0.8 -
Light vans 0.9 0.4 0.3 0.3 0.4 0.3 0.3 0.2 0.2 0.1 0.1 0.1 -
Heavy goods vehicles 1.0 0.6 0.6 0.6 0.6 0.5 0.5 0.3 0.2 0.1 0.1 0.1 -
Buses and coaches 0.1 0.1 0.1 0.1 0.1 0.1 0.1 0.1 - - - - -
Mopeds & motorcycles 0.1 - - - - - - - - - - - -
Total 14.2 6.6 4.1 3.7 3.7 3.5 3.0 2.7 2.3 1.5 0.9 1.0 -
Other transport Rail 1.4 1.3 1.3 1.5 1.7 1.7 1.7 1.9 1.8 1.2 1.2 1.1 -
Aviation - LTO20.6 0.7 0.7 0.6 0.7 0.8 0.9 1.0 0.9 0.9 0.7 0.7 -
Domestic shipping 22.3 20.4 19.7 20.8 20.4 20.5 21.2 20.1 14.3 13.5 12.8 12.1 3
Total 24.3 22.5 21.8 22.9 22.8 23.0 23.8 23.0 17.0 15.6 14.8 13.9 4
Transport total 38.6 29.1 25.9 26.6 26.5 26.5 26.8 25.7 19.2 17.1 15.7 14.9 4
National total reported to the UNECE 1,246.4 1,227.9 1,132.8 1,014.0 991.9 831.5 706.0 665.0 586.0 491.1 397.3 406.4 100
Transport memo items3 Aviation - cruise25.9 6.7 7.3 5.9 6.9 8.2 8.9 10.7 9.5 10.1 8.3 8.2 .
International shipping 63.7 48.9 46.0 38.9 47.7 66.4 78.2 100.1 135.5 159.6 146.3 120.5 .
1. UK national emission estimates are updated annually and any developments in methodology Sources - AEA Energy & Environment/DEFRA (NAEI) are applied retrospectively to earlier years. The main revisions to the latest emissions estimates were for shipping and rail (see notes and definitions). Last updated: November 20122. Domestic and international aviation are combined. LTO = Landing and takeoff. Next updated: September 20133. Emissions from aviation (cruise) and international shipping are not included in the national total that is reported to UNECE but reported separately as memo items (see notes and definitions).4. Emissions resulting from the resuspension of particles caused by the turbulence of passing vehicles. These emissions are not included in the total for PM10, to avoid double counting, but are important in reconciling roadside concentration measurements.5. The sharp falls in benzene, lead and sulphur dioxide emissions from road transport between 1999 and 2000 were mainly due to changes in the composition of road fuels as a result of an EU directive on the quality of petrol and diesel (Directive 98/70/EC).
Email: [email protected]: 020 7944 4129
https://www.gov.uk/government/statistical-data-sets/tsgb03 86

Department for Transport statisticsEnergy and environment
Table ENV0302 (TSGB0309)
Emissions for road vehicles (per vehicle kilometre) in urban conditions
Index: petrol car without three-way catalyst: pre 1993 = 100
(a) Road vehicles (per vehicle kilometre) Legislative vehicle classCarbon
monoxide
Hydro-
carbons1
Oxides of
nitrogen2
Particu-
lates3
Carbon
dioxide4
Petrol cars Without three-way catalyst Pre-Euro 1 pre 1993 100 100 100 2 100
With three-way catalyst Euro 1 1993-1996 25 9 12 1 93Euro 2 1997-2000 5 3 7 1 89Euro 3 2001-2005 2 1 3 1 83Euro 4 2006-2010 4 1 2 1 76Euro 5 2011- 4 1 2 1 67
Diesel cars Pre-Euro 1 pre 1993 6 10 27 100 91Euro 1 1993-1996 3 6 27 30 88Euro 2 1997-2000 2 4 28 21 83Euro 3 2001-2005 1 2 33 19 76
Euro 4 2006-2010 1 1 23 12 72
Euro 5 2011 0.4 1 16 0.3 63
Petrol light vans Without three-way catalyst Pre-Euro 1 pre 1994 120 117 134 2 104
With three-way catalyst Euro 1 1994-1997 32 15 19 1 96Euro 2 1998-2000 1 2 7 1 92
Euro 3 2001-2005 4 2 4 1 86Euro 4 2006- 4 1 2 1 79
Diesel light vans Pre-Euro 1 pre 1994 7 13 61 150 93Euro 1 1994-1997 6 7 50 57 116
Euro 2 1998-2001 6 7 50 61 108Euro 3 2002-2005 2 3 42 27 95Euro 4 2006- 1 2 34 16 95
Rigid HGVs Pre-Euro I pre 1993 22 69 411 275
Euro I 1993-1996 14 27 281 122
Euro II 1997-2001 12 17 304 56 See table (b)
Euro III 2002-2005 11 15 238 53 below
Euro IV 2006-2007 6 1 165 10Euro V 2008- 1 1 132 10
Artic HGVs Pre-Euro I pre 1993 25 28 663 306Euro I 1993-1996 22 43 465 231Euro II 1997-2001 18 27 495 104 See table (b)
Euro III 2002-2005 20 23 397 95 below
Euro IV 2006-2007 3 1 273 17Euro V 2008- 1 1 182 17
Buses & coaches Pre-Euro I pre 1993 28 54 515 263Euro I 1993-1996 17 35 345 177
Euro II 1997-2001 14 23 373 77 See table (b)
Euro III 2002-2005 15 21 292 73 below
Euro IV 2006-2007 1 1 200 15Euro V 2008- 1 1 159 16
Motorcycles Less than 50cc - two stroke Pre-Euro 1 pre 2000 141 1,171 1 105 38Euro 1 2000-2004 57 230 1 42 23Euro 2 2004-2006 13 131 0 21 19Euro 3 2007 13 101 0 6 16
Greater than 50cc - two stroke Pre-Euro 1 pre 2000 165 621 1 111 41Euro 1 2000-2004 109 192 2 45 38Euro 2 2004-2006 86 104 2 22 38Euro 3 2007 47 65 1 7 38
Greater than 50cc - four stroke Pre-Euro 1 pre 2000 170 113 11 10 53Euro 1 2000-2004 103 62 11 10 50Euro 2 2004-2006 54 22 6 2 48Euro 3 2007 30 14 3 2 48
(b) Fleet averaged CO2 emissions for HGVs and buses (per vehicle kilometre)4 in urban conditionsYear Rigid HGVs Artic HGVs Buses1990 414 667 4091991 421 665 4091992 421 660 4091993 406 627 4081994 394 616 4031995 400 601 3971996 393 590 3891997 390 589 3881998 373 564 3881999 380 563 4022000 377 563 4212001 395 571 4232002 384 567 4412003 400 575 4622004 386 555 4712005 381 549 4932006 398 553 4852007 410 556 4982008 425 577 5182009 428 579 5172010 434 585 517
1. The hyrdrocarbons figures are based on non-methane hydrocarbons. The figures in this table are outside2. Oxides of notrogen emission factors have been revised since the last esition the scope of national statistics3. For particulates, legislative standards exist only for diesel vehicles. Source - National Atmospheric Emissions Inventory Particulates index is diesel car: pre 1993 =100. (AEA Energy and Environment)4. Legislative standards do not apply to CO2 emissions, but average factors are available for different legislative vehicle classes based on test cycle data. Better information on HGVs is based on average Last Updated: November 2012 fuel economy of the HGV fleet each year, see table (b) above. Next updated: November 20135. The fleet averaged carbon dioxide figures for HGVs were based on fleet averaged fuel economy of HGVs using data from the DfT Continuing Survey of Road Goods Transport (CSRGT). For buses (not including coaches) the figures are based on the DfT Bus Service Operators Grant system (BSOG). Both sets of figures are corrected for urban driving conditions. Notes and definitionsEmail: [email protected]
https://www.gov.uk/government/statistical-data-sets/tsgb03 87

Department for Transport statisticsEnergy and the Environment
Table ENV0303 (TSGB0310)
Aircraft noise: population affected by noise around airports: 2000-2011
square km/thousands
2000 2001 2002 2003 2004 2005 2006 2007 2008 2009 2010 2011
Heathrow 1 Air transport movements (000's) 459.72 457.64 460.29 457.08 469.79 472.04 470.89 475.79 473.21 460.18 449.27 476.3
Area (sq km) within: 57 Leq contour 135.6 117.4 126.9 126.9 117.4 117.2 117.4 119.6 123.1 112.5 108.3 108.863 Leq contour 48.2 41.2 43.8 43.8 40.3 39.1 38.4 37.6 37.7 34.4 33.8 33.969 Leq contour 19.0 14.1 16.4 15.6 13.3 12.4 11.9 12.2 11.8 10.2 9.8 10.0
Population (000's) within: 57 Leq contour 275.2 240.4 258.3 263.7 239.7 251.7 258.0 251.9 268.5 245.3 228.7 243.3563 Leq contour 71.9 54.9 64.2 64.6 55.9 51.8 51.2 45.1 47.1 40.2 38.6 41.969 Leq contour 11.5 6.8 8.6 8.0 5.7 3.9 3.6 3.7 3.9 3.2 2.8 3.25
Gatwick Air transport movements (000's) 251.21 243.98 233.64 234.46 241.17 251.95 254.41 258.92 256.35 245.38 233.55 244.57
Area (sq km) within: 57 Leq contour 71.9 55.9 45.2 46.1 48.0 49.3 46.7 49.0 46.7 41.0 39.6 40.463 Leq contour 26.4 19.6 15.8 16.5 16.7 16.9 15.6 16.3 15.1 12.8 12.5 12.869 Leq contour 9.0 6.0 4.6 4.8 4.8 5.1 4.6 4.9 4.5 3.7 3.6 3.6
Population (000's) within: 57 Leq contour 8.7 5.2 3.5 4.2 4.5 4.7 4.5 4.8 4.4 3.6 2.9 3.163 Leq contour 1.4 0.8 0.5 0.6 0.6 0.7 0.6 0.6 0.6 0.5 0.4 0.469 Leq contour 0.2 0.1 0.1 0.1 0.1 0.1 - - - - - 0.0
Stansted Air transport movements (000's) 143.6 150.6 152.4 169.2 176.8 178.0 190.0 191.5 177.3 156.0 143.0 136.9
Area (sq km) within: 57 Leq contour 52.4 32.1 31.7 33.3 29.9 27.4 29.3 30.8 29.1 24.1 22.5 21.263 Leq contour 20.4 11.6 11.3 11.7 9.9 8.7 8.6 8.9 8.2 6.9 6.4 5.869 Leq contour 7.6 3.6 3.4 3.5 2.8 2.4 2.3 2.5 2.3 1.9 1.8 1.6
Population (000's) within: 57 Leq contour 5.7 2.3 2.0 2.3 2.9 2.0 2.0 2.5 2.9 1.5 1.4 1.363 Leq contour 1.3 0.4 0.3 0.5 0.3 0.3 0.3 0.3 0.3 0.3 0.1 0.169 Leq contour 0.2 0.1 0.1 - - - - - - - - 0.0
Manchester Air transport movements (000's) 177.58 182.1 177.55 191.52 208.49 217.99 213.03 206.5 191.23 162.13 148.88 158.0
Area (sq km) within: 57 Leq contour 46.4 43.4 40.3 39.1 39.6 40.2 37.7 37.5 35.0 29.4 29.2 30.263 Leq contour 15.8 14.6 12.8 13.3 13.7 14.3 13.0 12.4 11.1 9.7 9.4 9.469 Leq contour 5.0 4.8 4.2 4.4 4.6 4.8 4.6 4.4 3.8 3.3 3.1 3.2
Population (000's) within: 57 Leq contour 48.4 44.9 38.7 40.6 40.9 41.6 39.2 36.8 33.1 28.5 28.6 27.663 Leq contour 9.4 6.4 4.5 5.8 5.1 5.6 4.0 3.5 3.0 2.6 2.6 2.169 Leq contour 1.2 0.5 0.5 0.6 0.6 0.6 0.2 0.1 0.1 0.1 0.0 0.1
Birmingham Air transport movements (000's) 108.4 111.0 112.3 116.0 109.2 113.0 108.7 104.5 102.9 93.9 84.8 83.826
Area (sq km) within: 57 Leq contour 19.0 .. 14.8 .. 16.2 .. 16.8 .. 15.6 .. 12.9 ..63 Leq contour 6.2 .. 4.4 .. 5.1 .. 5.2 .. 4.6 .. 3.9 ..69 Leq contour 1.7 .. 1.2 .. 1.3 .. 1.4 .. 1.4 .. 1.2 ..
Population (000's) within: 57 Leq contour 33.7 .. 23.7 .. 26.2 .. 26.8 .. 22.2 .. 18.7 ..63 Leq contour 5.5 .. 2.6 .. 3.8 .. 3.6 .. 2.4 .. 2.0 ..69 Leq contour 0.1 .. - .. - .. - .. - .. - ..
Luton 2Air transport movements (000's) 55.5 56.0 55.0 58.4 64.2 75.4 78.8 83.3 85.7 75.1 68.6 72.138
Area (sq km) within: 57 Leq contour 17.6 10.6 10.9 12.2 12.8 13.5 14.9 15.4 16.6 14.9 13.1 12.863 Leq contour 6.6 3.5 3.6 4.0 4.2 4.2 4.8 5.1 5.2 5.0 4.3 4.369 Leq contour 2.4 1.2 1.2 1.3 1.3 1.3 1.5 1.6 1.5 1.5 1.3 1.3
Population (000's) within: 57 Leq contour 8.1 2.3 2.4 3.2 3.8 2.6 3.0 4.4 5.3 5.7 4.6 5.263 Leq contour 1.7 - 0.1 0.1 0.1 0.1 0.1 0.1 0.1 0.7 0.2 0.469 Leq contour 0.0 0.0 0.0 0.0 0.0 0.0 0.0 0.0 0.0 0.0 0.0 0.0
1. There were improvements made to the noise model for Heathrow in 2008; these are explained in The figures in this table are outside more detail in the noise contour report on the DfT website. An updated version of the Integrated the scope of National Statistics Noise Model (INM) was used to estimate noise contours for Luton airport in 2008 and this was Sources - Noise contour data: Major UK airports further updated for 2009. As a result, any year on year comparison for Heathrow and Luton for Air transport movements: Civil Aviation Authority 2007 onwards should be treated with caution
Last updated: December 2012
Next update: December 2013
Telephone: 020 7944 4276
https://www.gov.uk/government/statistical-data-sets/tsgb03 88

Transport Statistics Great Britain: 2012
Freight
This section contains data relating to the different methods used to transport goods around Great Britain and the different types of goods transported. There are two key measures used in freight statistics. These are 'goods lifted’ and ‘goods moved’. Goods lifted is the weight of goods carried. Goods moved takes into account the distance a load is hauled. It is calculated as the weight of goods multiplied by the distance travelled.
Freight includes:
Domestic freight moved by different modes,
including road, rail, water and pipelines.
Domestic road freight lifted and moved by foreign-
registered and Great Britain-registered HGVs.
Roll on/Roll off ferry and Channel Tunnel traffic.
Freight train movements and the impact on road
haulage.
Overall freight levels by mode
Domestic goods moved by mode: 1990 to 2010, Great Britain (Table TSGB0401)
0
50
100
150
200
250
300
1990 1992 1994 1996 1998 2000 2002 2004 2006 2008 2010
Bill
ion
to
nn
e ki
lom
etre
s
Road Rail Water Pipeline
Sources: Department for Transport; Office of Rail Regulation; Department of Energy and Climate Change
https://www.gov.uk/government/statistical-data-sets/tsgb04-freight 89

In 2010, the level of domestic freight moved was at broadly the same level as in 1990, at around 222 billion tonnes kilometres.
Since the late-1980s, more than 60 per cent of goods moved have been transported by road. The amount travelling this way rose to 151 billion tonne kilometres in 2010 from 137 billion tonne kilometres in 2009, an increase of 10 per cent.
Goods moved by rail have increased slowly since the mid-1990s to account for around 9 per cent of all goods moved in 2010. In recent years, rail freight has also accounted for around 5 per cent of goods lifted, compared with 9 per cent in 1980/81.
Goods moved by pipeline have remained fairly stable over the last 25 years, at between 10 and 12 billion tonne kilometres.
Domestic road freight activity by British and foreign-registered HGVs
In 2010 GB-registered HGVs lifted about 1.5 billion tonnes of freight in the UK (Table TSGB0433). This was 10 per cent more than in 2009.
The total imports and exports lifted by British vehicles to or from the UK were 10.4 million ton-nes in 2010—up from 9.4 in 2009 (a 10 per cent increase).
Vehicles registered in other EU-27 countries lifted 31.5 million tonnes of freight to or from the UK in 2010. This was a similar figure to that in 2009.
Cabotage is the national carriage of goods for hire or reward carried out by non-resident haul-iers on a temporary basis in a host Member State. In 2010, this was 1.27 billion tonne kms moved in the UK (Table TSGB0421). This was slightly more than in 2009 (1.23 billion tonne kms) and was less than 1 per cent of the domestic freight activity by UK registered vehicles1. Around 25 per cent of this was cabotage by vehicles registered in the Republic of Ireland and much of that will have involved movements within Northern Ireland.
Road goods vehicles travelling to mainland Europe2
1.8 million powered vehicles travelled from Great Britain to mainland Europe in 2011, up 1 per cent from 2010 and up 150 per cent from 1991. However, the number of powered vehicles is down 15 per cent from the peak of 2.1 million in 2006, largely as a result of the recession.
Of the powered goods vehicles 20 per cent (361 thousand) were UK-registered, a similar level as the 2010 share of 21 per cent.
Since the early 1990s there has been a significant rise in the number of foreign registered goods vehicles travelling to mainland Europe, from 0.4 million in 1991 to 1.4 million in 2011. However, the number of foreign registered goods vehicles has dropped 16 per cent since the peak of 1.7 million in 2007.
1 Note that only goods moved cabotage figures for the UK are available. 2 The number of vehicles travelling to the UK from mainland Europe is not available.
https://www.gov.uk/government/statistical-data-sets/tsgb04-freight 90

The number of Polish registered goods vehicles travelling to the UK from mainland Europe has increased dramatically since Poland joined the EU in 2004. In 2011, 270 thousand powered vehicles were Polish-registered, up 8 per cent on 2010 and nearly four times the 2004 level of 58 thousand.
There were 0.7 million unaccompanied trailers in 2011, so that in total 2.5 million goods vehi-cles travelled from Great Britain to mainland Europe, roughly the same as the 2010 total and 87 per cent higher than in 1991.
Roll-on/Roll-off ferry and Channel Tunnel traffic: 1990 to 2011, Great Britain (Tables TSGB0434 and TSGB0435)
0
500
1,000
1,500
2,000
2,500
3,000
3,500
1990 1992 1994 1996 1998 2000 2002 2004 2006 2008 2010
UK-registered vehicles Foreign-registered vehicles Unaccompanied trailers
Th
ou
san
d v
ehic
les
Source: Road goods vehicles travelling to mainland Europe survey, Department for Transport
Rail freight activity
The amount of freight moved in 2011/12 was 21.1 billion net tonne kilometres, a 9.5 per cent increase from 2010/11, and follows two years of increases from 2009/10.
In 2011/12, coal and domestic intermodal commodities accounted for more than 60 per cent of goods moved by rail.
https://www.gov.uk/government/statistical-data-sets/tsgb04-freight 91

Goods moved by rail, by commodity: 2000/01 to 2011/12 (Table TSGB0422)
0
5
10
15
20
25
2000/01 2001/02 2002/03 2003/04 2004/05 2005/06 2006/07 2007/08 2008/09 2009/10 2010/11 2011/12
Bil
lio
n n
et t
on
ne
kilo
met
res
Coal Domestic intermodal Other
Source: Office of Rail Regulation
The weight of goods lifted by rail has fallen by 34 per cent since 1980/81, from 154 million to 102 million tonnes. However, the amount of goods lifted increased by 17 per cent from 2009/10 to 2011/12.
Background notes
Full guidance on the methods used to compile these statistics and their sources can be found on the TSGB Chapter 4 - Freight page.
https://www.gov.uk/government/statistical-data-sets/tsgb04-freight 92

Department for Transport StatisticsTSGB0401Freight
Domestic freight transport: by mode: 1953-2011For greater detail for the years 2000-2011 see Table TSGB0403
Goods moved (billion tonne kilometres) Goods lifted (million tonnes)
All All
Year1 Road2,4 Rail3 Water Pipeline modes Road2,4 Rail3 Water Pipeline modes
1953 32 37 20 - 89 889 294 52 2 1,2371954 35 36 20 - 91 940 288 52 2 1,2821955 38 35 20 - 93 1,013 279 50 2 1,3441956 38 35 22 - 95 1,009 281 55 2 1,3471957 37 34 21 - 92 985 279 55 2 1,3211958 41 30 21 - 92 1,078 247 53 2 1,3801959 46 29 21 - 96 1,164 238 53 3 1,4581960 49 30 20 - 99 1,211 252 54 4 1,5211961 53 29 22 1 105 1,260 242 56 6 1,5641962 55 26 24 1 106 1,268 232 58 7 1,5651963 57 25 25 1 108 1,407 239 60 15 1,7211964 66 26 25 1 118 1,560 243 61 18 1,8821965 69 25 25 1 120 1,590 232 62 26 1,9101966 73 24 26 2 125 1,641 217 61 31 1,9501967 75 21 25 2 123 1,651 204 57 32 1,9441968 79 23 25 2 129 1,707 211 59 32 2,0091969 83 23 24 3 133 1,658 211 59 36 1,9641970 85 25 23 3 136 1,610 209 57 39 1,9151971 86 22 22 4 134 1,582 198 52 49 1,8811972 88 21 29 4 142 1,629 177 117 45 1,9681973 90 23 31 5 149 1,660 196 122 50 2,0281974 90 22 31 5 148 1,537 176 117 50 1,8801975 92 21 28 6 147 1,511 175 108 52 1,8461976 96 21 30 6 153 1,515 176 113 53 1,8571977 98 20 41 9 168 1,429 171 122 75 1,7971978 100 20 48 10 178 1,503 171 133 83 1,8901979 103 20 56 10 189 1,499 169 140 85 1,8931980 93 18 54 10 175 1,395 154 137 83 1,7691981 94 18 53 9 174 1,299 154 129 75 1,6571982 95 16 59 10 179 1,389 146 137 78 1,7501983 96 17 60 10 183 1,358 139 143 82 1,7221984 100 13 60 10 183 1,400 65 140 88 1,6931985 103 15 58 11 187 1,452 140 142 89 1,8231986 105 17 55 10 187 1,473 138 144 79 1,8341987 113 17 54 11 195 1,542 144 142 83 1,9111988 130 18 59 11 219 1,758 150 156 99 2,1631989 138 17 58 10 222 1,812 143 155 93 2,2031990 136 16 56 11 219 1,749 138 152 121 2,1601991 130 15 58 11 214 1,600 136 144 105 1,9851992 127 16 55 11 209 1,555 122 140 106 1,9231993 135 14 51 12 211 1,615 103 134 125 1,9771994 144 13 52 12 221 1,689 97 140 161 2,0871995 150 13 53 11 227 1,701 101 143 168 2,1131996 154 15 55 12 236 1,730 102 142 157 2,1311997 157 17 48 11 234 1,740 105 142 148 2,1351998 160 17 57 12 246 1,727 102 149 153 2,1311999 158 18 59 12 246 1,664 96 144 155 2,0592000 159 18 67 11 256 1,693 96 137 150 2,0772001 159 19 59 12 248 1,682 94 131 150 2,0582002 159 19 67 11 256 1,734 87 139 146 2,1062003 162 19 61 10 252 1,753 89 133 141 2,1162004 163 20 59 11 253 1,863 101 127 158 2,2492005 163 22 61 11 257 1,868 105 133 168 2,2752006 163 22 52 10 248 1,901 108 126 159 2,2942007 169 21 51 10 251 1,953 102 126 146 2,3282008 157 21 50 10 238 1,800 103 123 147 2,1732009 137 19 49 10 215 1,488 87 110 148 1,8332010 151 19 42 10 222 1,621 90 106 149 1,9662011 .. 21 43 10 .. .. 102 104 151 ..
1 Discontinuities in the series (denoted by lines) are described in detail in the Notes and Definitions.2 Statistics for all goods vehicles, including those under 3.5 tonnes gross vehicle weight. Rail: 020 7944 24193 Figures for rail are for financial years (e.g. 2011 will be 2011/12). Road: 020 7944 42614 Road freight figures are not available for 2011 Water: 020 7944 3087
Pipeline: 020 7215 2718Notes and definitions
Sources:
The rail figures in this table are outside the scope of National Statistics Road and water - DfT
Rail - ORR
Pipeline - DECC
Last updated: December 2012
Next update: December 2013
https://www.gov.uk/government/statistical-data-sets/tsgb04-freight 93
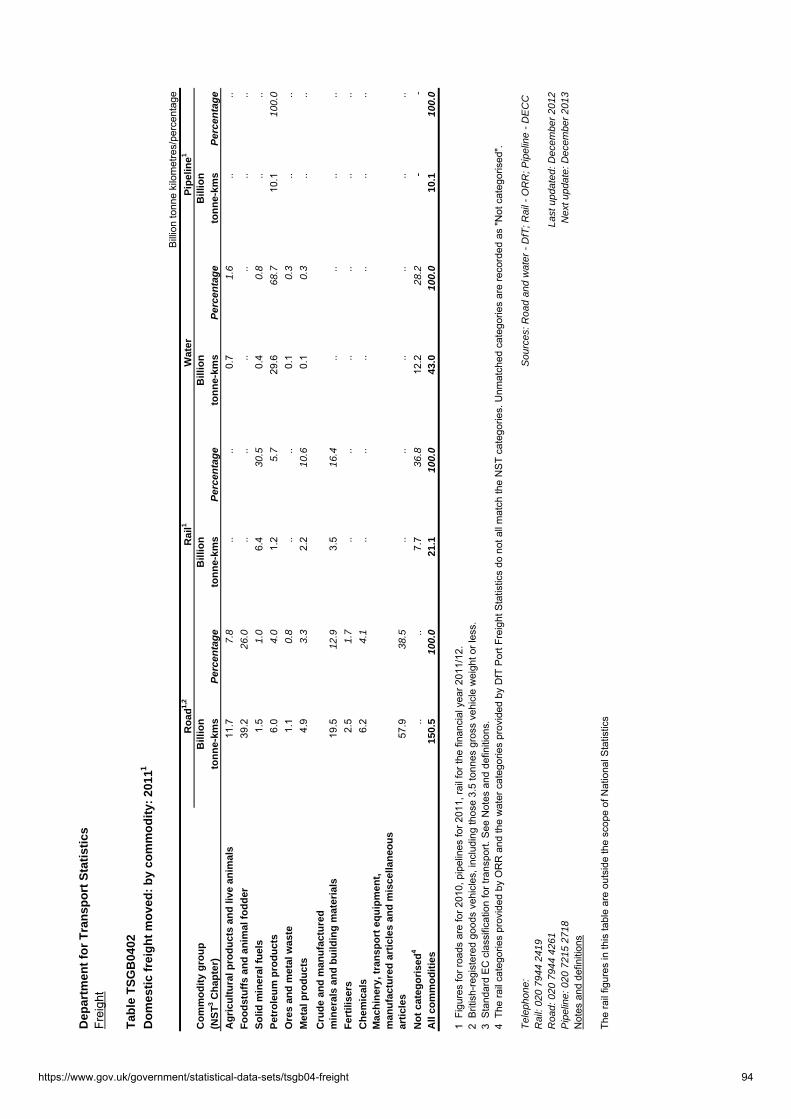
Dep
artm
ent
for
Tra
nsp
ort
Sta
tist
ics
Frei
ght
Tab
le T
SG
B04
02
Do
mes
tic
frei
gh
t m
ove
d:
by
com
mo
dit
y: 2
0111
B
illio
n to
nne
kilo
met
res/
perc
enta
ge
Co
mm
od
ity
gro
up
Bill
ion
Bill
ion
Bill
ion
Bill
ion
(NS
T3 C
hap
ter)
ton
ne-
kms
Per
cen
tag
eto
nn
e-km
sP
erce
nta
ge
ton
ne-
kms
Per
cen
tag
eto
nn
e-km
sP
erce
nta
ge
Ag
ricu
ltu
ral p
rod
uct
s an
d li
ve a
nim
als
11.7
7.8
....
0.7
1.6
....
Fo
od
stu
ffs
and
an
imal
fo
dd
er39
.226
.0..
....
....
..
So
lid m
iner
al f
uel
s1.
51.
06.
430
.50.
40.
8..
..
Pet
role
um
pro
du
cts
6.0
4.0
1.2
5.7
29.6
68.7
10.1
100.
0
Ore
s an
d m
etal
was
te1.
10.
8..
..0.
10.
3..
..
Met
al p
rod
uct
s4.
93.
32.
210
.60.
10.
3..
..
Cru
de
and
man
ufa
ctu
red
m
iner
als
and
bu
ildin
g m
ater
ials
19.5
12.9
3.5
16.4
....
....
Fer
tilis
ers
2.5
1.7
....
....
....
Ch
emic
als
6.2
4.1
....
....
....
Mac
hin
ery,
tra
nsp
ort
eq
uip
men
t,
man
ufa
ctu
red
art
icle
s an
d m
isce
llan
eou
s ar
ticl
es57
.938
.5..
....
....
..
No
t ca
teg
ori
sed
4..
..7.
736
.812
.228
.2-
-A
ll co
mm
od
itie
s15
0.5
100.
021
.110
0.0
43.0
100.
010
.110
0.0
1 F
igur
es fo
r roa
ds a
re fo
r 201
0, p
ipel
ines
for 2
011,
rail
for t
he fi
nanc
ial y
ear 2
011/
12.
2 B
ritis
h-re
gist
ered
goo
ds v
ehic
les,
incl
udin
g th
ose
3.5
tonn
es g
ross
veh
icle
wei
ght o
r les
s.3
Sta
ndar
d E
C c
lass
ifica
tion
for t
rans
port.
See
Not
es a
nd d
efin
ition
s.4
The
rail
cate
gorie
s pr
ovid
ed b
y O
RR
and
the
wat
er c
ateg
orie
s pr
ovid
ed b
y D
fT P
ort F
reig
ht S
tatis
tics
do n
ot a
ll m
atch
the
NS
T ca
tego
ries.
Unm
atch
ed c
ateg
orie
s ar
e re
cord
ed a
s "N
ot c
ateg
oris
ed".
Tel
epho
ne:
Sou
rces
: Roa
d an
d w
ater
- D
fT; R
ail -
OR
R; P
ipel
ine
- D
EC
C
Rai
l: 02
0 79
44 2
419
Roa
d: 0
20 7
944
4261
Last
upd
ated
: Dec
embe
r 20
12P
ipel
ine:
020
721
5 27
18N
ext u
pdat
e: D
ecem
ber
2013
Not
es a
nd d
efin
ition
s
The
rail
figur
es in
this
tabl
e ar
e ou
tsid
e th
e sc
ope
of N
atio
nal S
tatis
tics
Ro
ad1,
2R
ail1
Pip
elin
e1
Wat
er
https://www.gov.uk/government/statistical-data-sets/tsgb04-freight 94

Freight
Table TSGB0403
2000 2001 2002 2003 2004 2005 2006 2007 2008 2009 2010 20112
(a) Goods moved Billion tonne kilometres/percentage
Petroleum productsRoad 3 6.4 5.8 5.2 5.5 5.7 5.5 5.5 5.0 6.2 4.5 6.0 ..Rail 4 1.4 1.2 1.2 1.2 1.2 1.2 1.5 1.6 1.5 1.4 1.3 1.2Water 52.7 43.5 51.7 46.9 46.9 47.2 37.8 36.4 36.4 36.4 28.3 29.6
ow: coastwise 26.0 23.1 24.2 23.3 26.6 30.3 22.8 25.1 26.5 27.1 20.6 22.6Pipeline 11.4 11.5 10.9 10.5 10.7 10.8 10.4 10.2 10.2 10.2 10.3 10.1All modes 71.9 62.0 69.0 64.1 64.5 64.7 55.2 53.2 54.3 52.5 45.9 ..
Coal and cokeRoad 3 1.5 2.1 1.5 1.5 1.2 1.5 1.3 1.5 1.0 0.9 1.4 ..Rail 4 4.8 6.2 5.7 5.8 6.7 8.3 8.6 7.7 7.9 6.2 5.5 6.4Water 0.2 0.5 0.3 0.5 0.3 0.4 0.5 0.5 0.5 0.3 1.0 0.4All modes 6.5 8.8 7.5 7.9 8.2 10.2 10.4 9.7 9.4 7.5 7.9 ..
Other freightRoad 3 151.5 150.6 152.7 154.7 155.6 156.4 156.6 162.3 150.2 131.3 143.1 ..Rail 4 11.9 12.0 11.7 11.9 12.5 12.2 11.8 11.9 11.2 11.4 12.5 13.4Water 14.6 14.8 15.2 13.5 12.2 13.3 13.5 13.9 12.7 11.9 12.6 13.1All modes 178.1 177.4 179.6 180.0 180.3 181.9 182.0 188.1 174.1 154.6 168.2 ..
All trafficRoad 3 159.4 158.5 159.4 161.7 162.5 163.4 163.4 168.8 157.4 136.8 150.5 ..Rail 4 18.1 19.4 18.5 18.9 20.3 21.7 21.9 21.2 20.6 19.1 19.2 21.1Water 67.4 58.8 67.2 60.9 59.4 60.9 51.8 50.8 49.7 48.6 41.9 43.0Pipeline 11.4 11.5 10.9 10.5 10.7 10.8 10.4 10.2 10.2 10.2 10.3 10.1All modes 256.3 248.2 256.0 252.0 253.0 256.8 247.6 251.0 237.8 214.6 221.9 ..
Percentage of all trafficRoad 3 62 64 62 64 64 64 66 67 66 64 68 ..Rail 4 7 8 7 7 8 8 9 8 9 9 9 ..Water 26 24 26 24 24 24 21 20 21 23 19 ..Pipeline 4 5 4 4 4 4 4 4 4 5 5 ..All modes 100 100 100 100 100 100 100 100 100 100 100 ..
(b) Goods lifted Million tonnes/percentage
Petroleum productsRoad 3 75 74 59 64 67 70 66 69 76 57 67 ..Rail 4 .. .. .. .. .. .. .. .. .. .. .. ..Water 72 60 67 64 63 66 57 56 58 55 46 46
ow: coastwise 40 34 36 35 38 42 34 35 36 35 28 28Pipeline 151 151 146 141 158 168 159 146 147 148 149 151All modes 298 285 272 269 288 304 282 272 281 259 263 ..
Coal and cokeRoad 3 22 21 17 22 14 21 16 23 14 10 11 ..Rail 4 35 39 34 35 44 48 49 43 47 38 39 44Water 3 3 2 2 1 2 2 2 2 1 2 1All modes 60 63 53 59 59 71 68 68 63 49 52 ..
Other freightRoad 3 1,596 1,587 1,658 1,667 1,782 1,777 1,819 1,861 1,709 1,422 1,543 ..Rail 4 60 54 53 54 57 58 59 59 56 49 51 57Water 3 62 68 70 67 63 65 66 68 63 54 57 57All modes 1,718 1,709 1,781 1,788 1,902 1,900 1,945 1,988 1,828 1,525 1,651 ..
All trafficRoad 3 1,693 1,682 1,734 1,753 1,863 1,868 1,901 1,953 1,800 1,488 1,621 ..Rail 4 96 94 87 89 101 105 108 102 103 87 90 102Water 137 131 139 133 127 133 126 126 123 110 106 104Pipeline 151 151 146 141 158 168 159 146 147 148 149 151All modes 2,077 2,058 2,106 2,116 2,249 2,275 2,294 2,328 2,173 1,833 1,966 ..
Percentage of all trafficRoad 3 82 82 82 83 83 82 83 84 83 81 82 ..Rail 4 5 5 4 4 4 5 5 4 5 5 5 ..Water 7 6 7 6 6 6 6 5 6 6 5 ..Pipeline 7 7 7 7 7 7 7 6 7 8 8 ..All modes 100 100 100 100 100 100 100 100 100 100 100 ..
1 Discontinuities in the series (denoted by lines) are described in detail in the Notes and Definitions.2 Road freight data are not currently available for 2011.3 Statistics for all goods vehicles, including those 3.5 tonnes gross vehicle weight or less.4 Figures for rail are for financial years (e.g. 2011 will be 2011/12).
Notes and definitionsSources: Road and water - DfT; Rail - ORR; Pipeline - DECC
Telephone:Rail: 020 7944 2419 Last updated: December 2012Road: 020 7944 3180 Next update: December 2013Pipeline: 020 7215 2718
The rail figures in this table are outside the scope of National Statistics
Domestic freight transport1: by mode: 2000-2011
Department for Transport statistics
https://www.gov.uk/government/statistical-data-sets/tsgb04-freight 95

Department for Transport statistics Road Freight Statistics
Table RFS0106 (TSGB0404)
Goods lifted1 by type and weight of vehicle: annual 1990-2010, quarterly 2004-2011; by GB HGVs in UK
Million tonnes
YearOver 3.5t
to 7.5tOver 7.5t
to 17tOver 17t
to 25t Over 25t All RigidsOver 3.5t
to 33t Over 33t All artics All vehicles1990 84 279 258 325 947 192 506 698 1,6451991 75 256 236 289 857 165 484 648 1,5051992 79 236 219 282 817 142 505 646 1,4631993 76 246 211 307 840 144 540 683 1,5231994 81 236 202 332 852 142 604 746 1,5971995 77 221 162 373 833 139 637 776 1,6091996 84 222 133 371 811 138 679 817 1,6281997 76 218 120 380 793 124 726 850 1,6431998 77 191 106 401 776 125 729 854 1,6301999 81 173 86 408 748 113 706 819 1,5672000 77 152 87 424 741 107 746 852 1,5932001 80 123 86 443 733 97 751 848 1,5812002 77 111 90 491 768 81 778 859 1,6272003 70 89 100 506 765 69 809 878 1,6432004 77 87 108 540 812 59 873 932 1,7442005 70 70 110 562 812 51 883 934 1,7462006 64 64 118 585 831 49 896 945 1,7762007 54 52 127 614 848 49 926 975 1,8222008 56 44 118 513 731 44 892 937 1,6682009 56 37 102 377 572 38 746 785 1,3562010 54 37 103 414 607 33 848 881 1,4892011 . . . . . . . . .
Percentage change between1990 - 2010 -36 -87 -60 27 -36 -83 68 26 -102000 - 2010 -30 -76 18 -2 -18 -69 14 3 -72009 - 2010 -3 0 1 10 6 -13 14 12 10
2004 Q1 18 22 29 135 204 16 206 222 4262004 Q2 22 23 29 130 204 15 236 251 4552004 Q3 18 25 28 137 207 14 213 227 4342004 Q4 19 18 22 138 197 14 218 232 4292005 Q1 17 18 25 126 186 13 213 226 4122005 Q2 22 19 31 154 226 13 222 235 4612005 Q3 16 18 25 149 207 13 222 235 4422005 Q4 15 15 29 133 192 13 225 238 4312006 Q1 16 16 27 139 198 12 221 232 4312006 Q2 16 16 27 146 205 12 214 226 4312006 Q3 17 18 30 159 223 13 236 249 4722006 Q4 16 14 33 141 204 12 226 238 4422007 Q1 15 15 31 135 197 11 223 234 4302007 Q2 14 13 33 150 210 13 233 246 4562007 Q3 13 10 35 169 226 12 229 241 4672007 Q4 13 13 28 160 215 13 241 254 4692008 Q1 15 12 30 147 204 13 231 244 4482008 Q2 13 11 31 132 187 10 216 226 4132008 Q3 14 11 30 122 176 12 227 239 4152008 Q4 14 9 27 113 163 10 218 228 3912009 Q1 14 10 24 97 145 9 186 195 3402009 Q2 14 11 25 92 142 9 183 192 3342009 Q3 16 9 27 97 149 10 197 207 3562009 Q4 12 7 25 91 136 9 181 190 3262010 Q1 13 8 26 97 144 8 203 211 3552010 Q2 14 10 28 109 161 8 216 224 3862010 Q3 14 9 29 106 158 8 226 234 3932010 Q4 13 9 20 102 144 9 203 211 3552011 Q1 p 14 14 24 130 181 9 218 227 408Percentage change betweenQ1 2010 - Q1 2011 9 63 -8 34 26 9 7 7 15
1. Weight of goods transportedp Provisional
Telephone: 020 7944 4261 Source: Continuing Survey of Road Goods Transport, DfTEmail: [email protected] Last updated: November 2012The figures in this table are National Statistics Next update: November 2013
Rigids Articulated vehicles
https://www.gov.uk/government/statistical-data-sets/tsgb04-freight 96
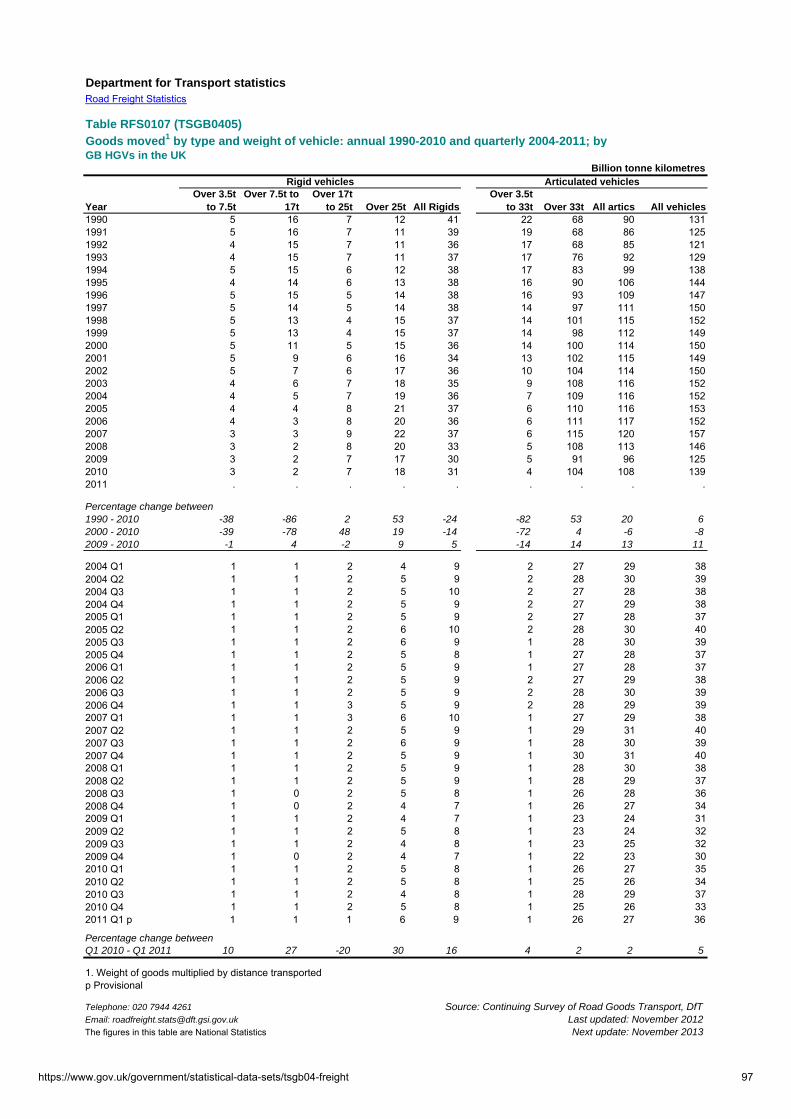
Department for Transport statistics Road Freight Statistics
Table RFS0107 (TSGB0405)
Goods moved1 by type and weight of vehicle: annual 1990-2010 and quarterly 2004-2011; by GB HGVs in the UK
Billion tonne kilometres
YearOver 3.5t
to 7.5tOver 7.5t to
17tOver 17t
to 25t Over 25t All RigidsOver 3.5t
to 33t Over 33t All artics All vehicles1990 5 16 7 12 41 22 68 90 1311991 5 16 7 11 39 19 68 86 1251992 4 15 7 11 36 17 68 85 1211993 4 15 7 11 37 17 76 92 1291994 5 15 6 12 38 17 83 99 1381995 4 14 6 13 38 16 90 106 1441996 5 15 5 14 38 16 93 109 1471997 5 14 5 14 38 14 97 111 1501998 5 13 4 15 37 14 101 115 1521999 5 13 4 15 37 14 98 112 1492000 5 11 5 15 36 14 100 114 1502001 5 9 6 16 34 13 102 115 1492002 5 7 6 17 36 10 104 114 1502003 4 6 7 18 35 9 108 116 1522004 4 5 7 19 36 7 109 116 1522005 4 4 8 21 37 6 110 116 1532006 4 3 8 20 36 6 111 117 1522007 3 3 9 22 37 6 115 120 1572008 3 2 8 20 33 5 108 113 1462009 3 2 7 17 30 5 91 96 1252010 3 2 7 18 31 4 104 108 1392011 . . . . . . . . .
Percentage change between1990 - 2010 -38 -86 2 53 -24 -82 53 20 62000 - 2010 -39 -78 48 19 -14 -72 4 -6 -82009 - 2010 -1 4 -2 9 5 -14 14 13 11
2004 Q1 1 1 2 4 9 2 27 29 382004 Q2 1 1 2 5 9 2 28 30 392004 Q3 1 1 2 5 10 2 27 28 382004 Q4 1 1 2 5 9 2 27 29 382005 Q1 1 1 2 5 9 2 27 28 372005 Q2 1 1 2 6 10 2 28 30 402005 Q3 1 1 2 6 9 1 28 30 392005 Q4 1 1 2 5 8 1 27 28 372006 Q1 1 1 2 5 9 1 27 28 372006 Q2 1 1 2 5 9 2 27 29 382006 Q3 1 1 2 5 9 2 28 30 392006 Q4 1 1 3 5 9 2 28 29 392007 Q1 1 1 3 6 10 1 27 29 382007 Q2 1 1 2 5 9 1 29 31 402007 Q3 1 1 2 6 9 1 28 30 392007 Q4 1 1 2 5 9 1 30 31 402008 Q1 1 1 2 5 9 1 28 30 382008 Q2 1 1 2 5 9 1 28 29 372008 Q3 1 0 2 5 8 1 26 28 362008 Q4 1 0 2 4 7 1 26 27 342009 Q1 1 1 2 4 7 1 23 24 312009 Q2 1 1 2 5 8 1 23 24 322009 Q3 1 1 2 4 8 1 23 25 322009 Q4 1 0 2 4 7 1 22 23 302010 Q1 1 1 2 5 8 1 26 27 352010 Q2 1 1 2 5 8 1 25 26 342010 Q3 1 1 2 4 8 1 28 29 372010 Q4 1 1 2 5 8 1 25 26 332011 Q1 p 1 1 1 6 9 1 26 27 36
Percentage change betweenQ1 2010 - Q1 2011 10 27 -20 30 16 4 2 2 5
1. Weight of goods multiplied by distance transportedp Provisional
Telephone: 020 7944 4261 Source: Continuing Survey of Road Goods Transport, DfTEmail: [email protected] Last updated: November 2012The figures in this table are National Statistics Next update: November 2013
Rigid vehicles Articulated vehicles
https://www.gov.uk/government/statistical-data-sets/tsgb04-freight 97

Department for Transport statistics Road Freight Statistics
Table RFS0108 (TSGB0407)
Goods lifted1 and goods moved2 by mode of working: annual 1990-2010 and quarterly 2004-2011 by GB HGVs in the UK
Million tonnes Billion tonne kilometres
Year
Mainly public
haulage % of total
Mainly own
account % of total All modes
Mainly public
haulage % of totalMainly own
account % of total All modes1990 978 59 667 41 1,645 95 73 36 28 1311991 862 57 643 43 1,505 86 69 39 31 1251992 843 58 620 42 1,463 86 71 35 29 1211993 911 60 612 40 1,523 93 72 35 28 1291994 980 61 618 39 1,597 101 73 37 27 1381995 987 61 622 39 1,609 107 74 37 26 1441996 1,011 62 618 38 1,628 109 74 38 26 1471997 1,044 64 599 36 1,643 112 75 37 25 1501998 1,041 64 589 36 1,630 114 75 38 25 1521999 991 64 576 36 1,567 111 75 38 25 1492000 1,038 65 556 35 1,593 113 75 37 25 1502001 1,052 67 529 33 1,581 115 77 35 23 1492002 1,019 63 608 37 1,627 111 74 39 26 1502003 1,053 64 590 36 1,643 114 75 37 25 1522004 1,101 63 643 37 1,744 111 73 41 27 1522005 1,079 62 667 38 1,746 110 72 43 28 1532006 1,104 62 671 38 1,776 110 72 43 28 1522007 1,116 61 706 39 1,822 113 72 45 28 1572008 948 57 720 43 1,668 99 68 47 32 1462009 690 51 666 49 1,356 77 62 48 38 1252010 800 54 689 46 1,489 89 64 50 36 1392011 . . . . . . . . . .
Percentage change between1990 - 2010 -18 3 -10 -6 39 62000 - 2010 -23 24 -7 -21 33 -82009 - 2010 16 3 10 15 5 11
2004 Q1 268 63 158 37 426 28 73 10 27 382004 Q2 291 64 163 36 455 28 74 10 26 392004 Q3 270 62 164 38 434 28 72 10 28 382004 Q4 272 63 157 37 429 27 72 10 28 382005 Q1 257 62 155 38 412 27 72 10 28 372005 Q2 284 62 177 38 461 28 71 11 29 402005 Q3 272 61 170 39 442 28 72 11 28 392005 Q4 267 62 164 38 431 26 72 10 28 372006 Q1 264 61 167 39 431 26 71 11 29 372006 Q2 271 63 160 37 431 28 74 10 26 382006 Q3 287 61 184 39 472 28 71 11 29 392006 Q4 282 64 160 36 442 28 72 11 28 392007 Q1 260 60 170 40 430 27 72 11 28 382007 Q2 285 62 172 38 456 29 73 11 27 402007 Q3 281 60 186 40 467 27 70 12 30 392007 Q4 290 62 179 38 469 29 72 11 28 402008 Q1 261 58 187 42 448 27 71 11 29 382008 Q2 248 60 165 40 413 26 71 11 29 372008 Q3 232 56 183 44 415 23 64 13 36 362008 Q4 207 53 185 47 391 22 65 12 35 342009 Q1 157 46 183 54 340 19 60 12 40 312009 Q2 181 54 153 46 334 20 63 12 37 322009 Q3 188 53 168 47 356 20 62 12 38 322009 Q4 163 50 163 50 326 19 62 11 38 302010 Q1 195 55 160 45 355 23 67 12 33 352010 Q2 199 52 187 48 386 21 62 13 38 342010 Q3 207 53 186 47 393 24 64 13 36 372010 Q4 199 56 157 44 355 21 62 13 38 332011 Q1 p 192 47 216 53 408 20 56 16 44 36
Percentage change betweenQ1 2010 - Q1 2011 -1 - 35 - 15 -11 - 38 - 5
1. Weight of goods transported2. Weight of goods multiplied by distance transportedp Provisional
Telephone: 020 7944 4261 Source: Continuing Survey of Road Goods Transport, DfTEmail: [email protected] Last updated: November 2012The figures in this table are National Statistics Next update: November 2013
Goods moved2Goods lifted1
https://www.gov.uk/government/statistical-data-sets/tsgb04-freight 98
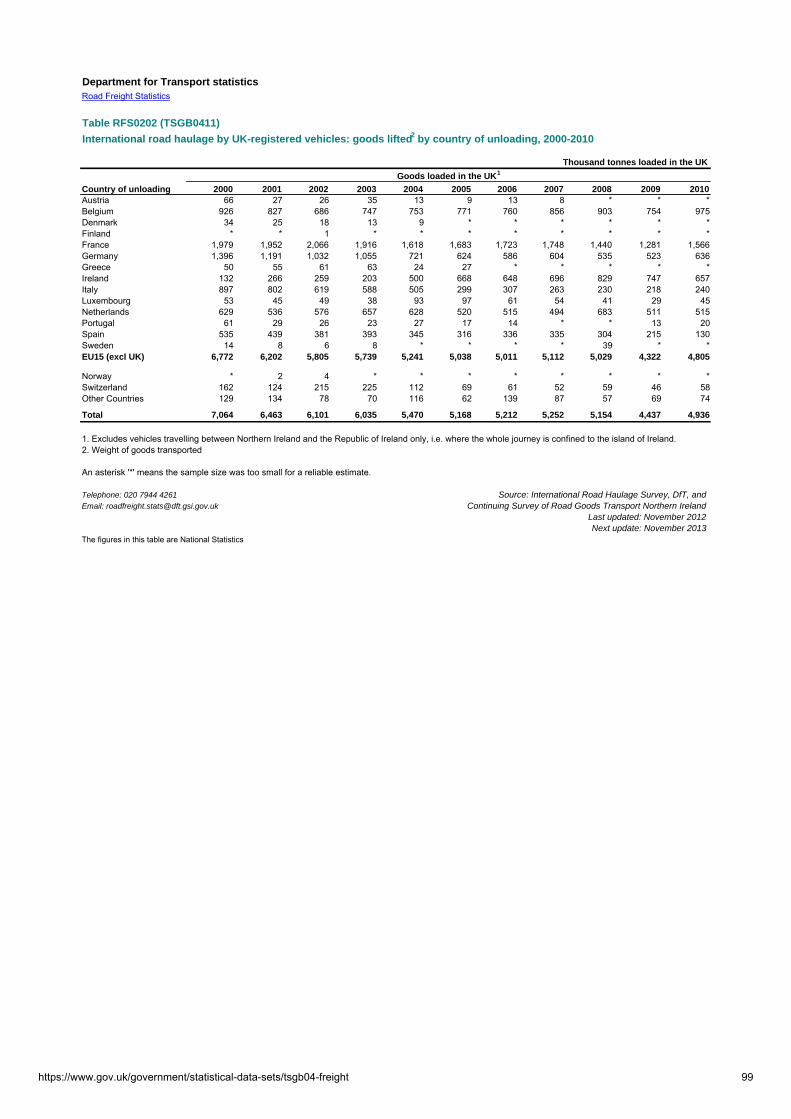
Department for Transport statistics Road Freight Statistics
Table RFS0202 (TSGB0411)
International road haulage by UK-registered vehicles: goods lifted2 by country of unloading, 2000-2010
Thousand tonnes loaded in the UK
Country of unloading 2000 2001 2002 2003 2004 2005 2006 2007 2008 2009 2010Austria 66 27 26 35 13 9 13 8 * * * Belgium 926 827 686 747 753 771 760 856 903 754 975 Denmark 34 25 18 13 9 * * * * * * Finland * * 1 * * * * * * * * France 1,979 1,952 2,066 1,916 1,618 1,683 1,723 1,748 1,440 1,281 1,566 Germany 1,396 1,191 1,032 1,055 721 624 586 604 535 523 636 Greece 50 55 61 63 24 27 * * * * * Ireland 132 266 259 203 500 668 648 696 829 747 657 Italy 897 802 619 588 505 299 307 263 230 218 240 Luxembourg 53 45 49 38 93 97 61 54 41 29 45 Netherlands 629 536 576 657 628 520 515 494 683 511 515 Portugal 61 29 26 23 27 17 14 * * 13 20 Spain 535 439 381 393 345 316 336 335 304 215 130 Sweden 14 8 6 8 * * * * 39 * * EU15 (excl UK) 6,772 6,202 5,805 5,739 5,241 5,038 5,011 5,112 5,029 4,322 4,805
Norway * 2 4 * * * * * * * * Switzerland 162 124 215 225 112 69 61 52 59 46 58 Other Countries 129 134 78 70 116 62 139 87 57 69 74
Total 7,064 6,463 6,101 6,035 5,470 5,168 5,212 5,252 5,154 4,437 4,936
1. Excludes vehicles travelling between Northern Ireland and the Republic of Ireland only, i.e. where the whole journey is confined to the island of Ireland.2. Weight of goods transported
An asterisk '*' means the sample size was too small for a reliable estimate.
Telephone: 020 7944 4261 Source: International Road Haulage Survey, DfT, andEmail: [email protected] Continuing Survey of Road Goods Transport Northern Ireland
Last updated: November 2012Next update: November 2013
The figures in this table are National Statistics
Goods loaded in the UK1
https://www.gov.uk/government/statistical-data-sets/tsgb04-freight 99

Department for Transport statistics Road Freight Statistics
Table RFS0203 (TSGB0412)
International road haulage by UK-registered vehicles: goods lifted2 by country of loading, 2000-2010
Thousand tonnes unloaded in the UK
Country of loading 2000 2001 2002 2003 2004 2005 2006 2007 2008 2009 2010Austria 35 18 17 24 * 28 * * * * * Belgium 1,154 1,139 1,051 1,280 1,184 1,405 1,339 1,234 1,410 1,418 1,658 Denmark 22 34 20 15 * * * * * * * Finland * * 1 * * * * * * * * France 2,233 2,458 2,498 2,348 1,990 2,125 2,026 2,336 2,181 1,613 1,929 Germany 1,461 1,267 1,193 1,118 877 655 682 582 524 488 509 Greece 13 9 24 6 * * * * * * * Ireland 53 92 93 80 266 263 234 266 218 181 169 Italy 1,042 913 793 771 550 370 344 280 269 264 252 Luxembourg 57 38 52 37 108 117 52 47 39 36 71 Netherlands 809 789 773 789 777 718 784 626 792 848 801 Portugal 45 20 17 29 21 9 * * * * 12 Spain 517 424 379 431 409 342 467 410 319 257 174 Sweden 14 6 3 4 * * * * * * * EU15 (excl UK) 7,455 7,208 6,914 6,933 6,201 6,048 5,962 5,819 5,764 5,122 5,591
Norway * 1 * * * * * * * * * Switzerland 118 104 187 164 111 44 56 69 48 44 38 Other Countries 91 91 57 49 44 25 23 13 * 15 12
Total 7,665 7,405 7,159 7,147 6,356 6,117 6,044 5,901 5,829 5,181 5,641
1. Excludes vehicles travelling between Northern Ireland and the Republic of Ireland only, i.e. where the whole journey is confined to the island of Ireland.2. Weight of goods transported
An asterisk '*' means the sample size was too small for a reliable estimate.
Telephone: 020 7944 4261 Source: International Road Haulage Survey andEmail: [email protected] Continuing Survey of Road Goods Transport Northern Ireland, DfTNotes & definitions Last updated: November 2012
Next update: November 2013The figures in this table are National Statistics
Goods unloaded in the UK1
https://www.gov.uk/government/statistical-data-sets/tsgb04-freight 100

Department for Transport statistics Road Freight Statistics
Table RFS0204 (TSGB0413)
International road haulage by UK-registered vehicles: goods moved2 by country of unloading, 2000-2010
Million tonne kilometres loaded in the UK
Country of unloading 2000 2001 2002 2003 2004 2005 2006 2007 2008 2009 2010Austria 109 43 45 52 23 13 21 13 * * * Belgium 472 395 347 366 364 368 380 407 403 349 465 Denmark 38 28 22 14 12 * * * * * * Finland * * 3 * * * * * * * * France 1,537 1,466 1,559 1,394 1,124 1,105 1,114 1,192 988 832 1,037 Germany 1,318 1,130 967 1,007 644 554 529 546 479 457 526 Greece 159 182 204 194 78 86 * * * * * Ireland 57 103 94 75 179 243 231 256 317 236 249 Italy 1,451 1,268 1,017 961 800 458 468 424 362 347 383 Luxembourg 33 28 32 22 55 57 36 32 26 18 26 Netherlands 385 298 301 351 320 257 286 283 394 287 270 Portugal 132 63 59 51 61 40 31 * * 30 46 Spain 997 807 700 734 636 587 625 613 536 380 218 Sweden 18 10 7 9 * * * * 50 * * EU15 (excl UK) 6,707 5,820 5,356 5,230 4,307 3,772 3,818 3,859 3,597 2,971 3,249
Norway * 3 4 * * * * * * * * Switzerland 199 148 257 271 139 84 76 63 70 55 66 Other Countries 284 308 190 169 262 136 316 207 111 154 157
Total 7,190 6,280 5,808 5,670 4,709 3,992 4,212 4,129 3,791 3,180 3,471
1. Excludes vehicles travelling between Northern Ireland and the Republic of Ireland only, i.e. where the whole journey is confined to the island of Ireland.2. Weight of goods multiplied by distance transported
An asterisk '*' means the sample size was too small for a reliable estimate.
Telephone: 020 7944 4261 Source: International Road Haulage Survey andEmail: [email protected] Continuing Survey of Road Goods Transport Northern Ireland, DfTNotes & definitions Last updated: November 2012
Next update: November 2013The figures in this table are National Statistics
Goods loaded in the UK1
https://www.gov.uk/government/statistical-data-sets/tsgb04-freight 101

Department for Transport statistics Road Freight Statistics
Table RFS0205 (TSGB0414)
International road haulage by UK-registered vehicles: goods moved2 by country of loading, 2000-2010
Million tonne kilometres unloaded in the UK
Country of loading 2000 2001 2002 2003 2004 2005 2006 2007 2008 2009 2010Austria 54 28 26 36 * 47 * * * * * Belgium 565 535 515 625 565 685 657 606 649 674 809 Denmark 23 36 25 16 * * * * * * * Finland * * 2 * * * * * * * * France 1,537 1,611 1,607 1,507 1,191 1,207 1,181 1,303 1,224 897 1,113 Germany 1,355 1,175 1,087 1,047 793 584 600 515 477 426 440 Greece 37 30 74 18 * * * * * * * Ireland 22 35 31 34 84 72 63 94 73 72 63 Italy 1,651 1,445 1,285 1,237 864 565 525 436 431 409 380 Luxembourg 34 23 34 22 65 71 32 28 24 23 48 Netherlands 471 425 418 417 425 400 450 368 455 473 445 Portugal 89 41 35 63 43 17 * * * * 24 Spain 930 747 677 775 778 619 889 747 542 460 293 Sweden 21 8 5 7 * * * * * * * EU15 (excl UK) 6,789 6,140 5,820 5,805 4,836 4,289 4,449 4,149 3,897 3,461 3,632
Norway * 2 1 * * * * * * * * Switzerland 133 123 207 198 134 49 67 81 58 52 43 Other Countries 207 210 134 124 92 64 47 30 * 31 25
Total 7,129 6,476 6,161 6,127 5,062 4,401 4,568 4,260 3,974 3,545 3,703
1. Excludes vehicles travelling between Northern Ireland and the Republic of Ireland only, i.e. where the whole journey is confined to the island of Ireland.2. Weight of goods multiplied by distance transported
An asterisk '*' means the sample size was too small for a reliable estimate.
Telephone: 020 7944 4261 Source: International Road Haulage Survey andEmail: [email protected] Continuing Survey of Road Goods Transport Northern Ireland, DfT
Last updated: November 2012Next update: November 2013
The figures in this table are National Statistics
Goods unloaded in the UK1
https://www.gov.uk/government/statistical-data-sets/tsgb04-freight 102
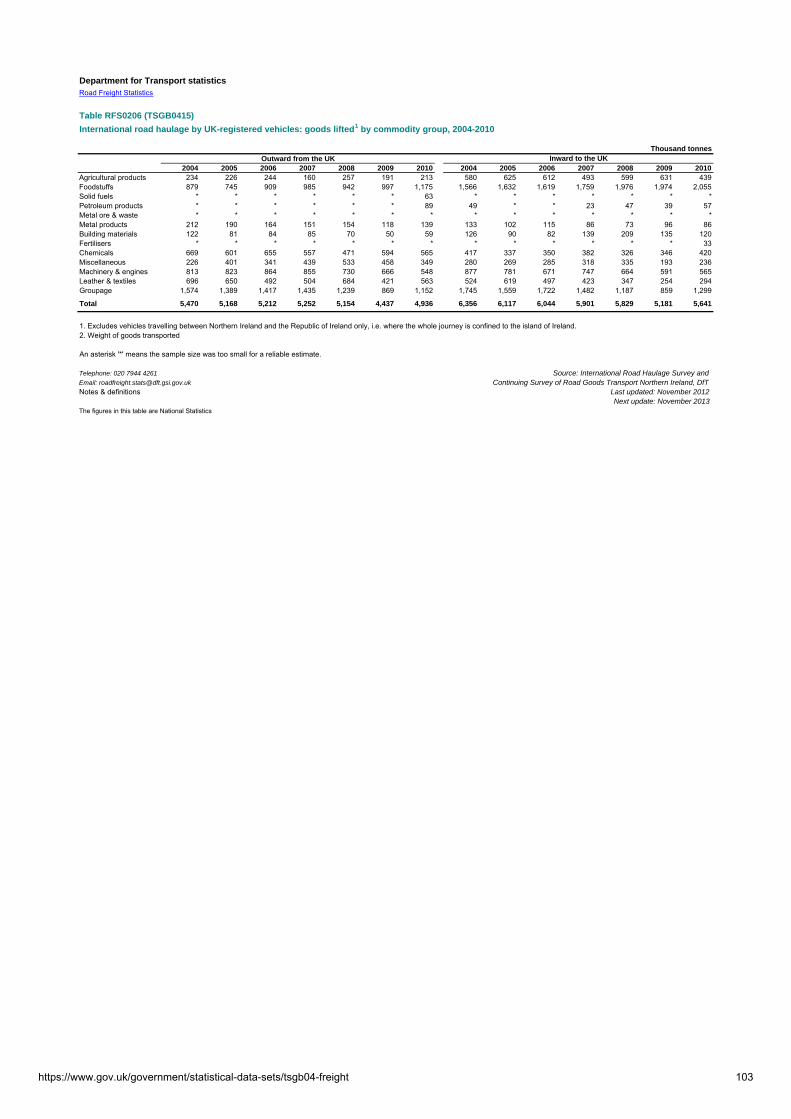
Department for Transport statistics Road Freight Statistics
Table RFS0206 (TSGB0415)
International road haulage by UK-registered vehicles: goods lifted1 by commodity group, 2004-2010
Thousand tonnes
2004 2005 2006 2007 2008 2009 2010 2004 2005 2006 2007 2008 2009 2010Agricultural products 234 226 244 160 257 191 213 580 625 612 493 599 631 439Foodstuffs 879 745 909 985 942 997 1,175 1,566 1,632 1,619 1,759 1,976 1,974 2,055Solid fuels * * * * * * 63 * * * * * * *Petroleum products * * * * * * 89 49 * * 23 47 39 57Metal ore & waste * * * * * * * * * * * * * *Metal products 212 190 164 151 154 118 139 133 102 115 86 73 96 86Building materials 122 81 84 85 70 50 59 126 90 82 139 209 135 120Fertilisers * * * * * * * * * * * * * 33Chemicals 669 601 655 557 471 594 565 417 337 350 382 326 346 420Miscellaneous 226 401 341 439 533 458 349 280 269 285 318 335 193 236Machinery & engines 813 823 864 855 730 666 548 877 781 671 747 664 591 565Leather & textiles 696 650 492 504 684 421 563 524 619 497 423 347 254 294Groupage 1,574 1,389 1,417 1,435 1,239 869 1,152 1,745 1,559 1,722 1,482 1,187 859 1,299
Total 5,470 5,168 5,212 5,252 5,154 4,437 4,936 6,356 6,117 6,044 5,901 5,829 5,181 5,641
1. Excludes vehicles travelling between Northern Ireland and the Republic of Ireland only, i.e. where the whole journey is confined to the island of Ireland.2. Weight of goods transported
An asterisk '*' means the sample size was too small for a reliable estimate.
Telephone: 020 7944 4261 Source: International Road Haulage Survey andEmail: [email protected] Continuing Survey of Road Goods Transport Northern Ireland, DfTNotes & definitions Last updated: November 2012
Next update: November 2013The figures in this table are National Statistics
Outward from the UK Inward to the UK
https://www.gov.uk/government/statistical-data-sets/tsgb04-freight 103

Department for Transport statistics Road Freight Statistics
Table RFS0207 (TSGB0416)
International road haulage by UK-registered vehicles: goods moved2 by commodity group, 2004-2010
Million tonne kilometres
2004 2005 2006 2007 2008 2009 2010 2004 2005 2006 2007 2008 2009 2010Agricultural products 299 198 242 118 163 102 115 501 377 599 438 392 446 306Foodstuffs 824 585 876 886 882 758 923 1,018 1,025 1,064 1,110 1,227 1,158 1,247Solid fuels * * * * * * 28 * * * * * * *Petroleum products * * * * * * 38 32 * * 17 25 21 31Metal ore & waste * * * * * * * * * * * * * *Metal products 209 151 120 134 128 96 93 124 75 96 49 45 84 67Building materials 91 62 71 64 55 51 56 102 67 64 169 210 137 103Fertilisers * * * * * * * * * * * * * 18Chemicals 612 533 537 435 363 414 446 305 237 253 252 236 220 270Miscellaneous 164 218 179 233 265 198 205 381 321 368 292 233 151 169Machinery & engines 706 694 719 715 590 534 432 707 624 530 579 496 444 431Leather & textiles 543 463 395 433 407 310 386 480 490 335 330 236 192 221Groupage 1,235 1,037 1,050 1,069 892 690 732 1,377 1,109 1,200 991 837 662 821
Total 4,709 3,992 4,212 4,129 3,791 3,180 3,471 5,062 4,401 4,568 4,260 3,974 3,545 3,703
1. Excludes vehicles travelling between Northern Ireland and the Republic of Ireland only, i.e. where the whole journey is confined to the island of Ireland.2. Weight of goods multiplied by distance transported
An asterisk '*' means the sample size was too small for a reliable estimate.
Telephone: 020 7944 4261 Source: International Road Haulage Survey andEmail: [email protected] Continuing Survey of Road Goods Transport Northern Ireland, DfTNotes and definitions Last updated: November 2012
Next update: November 2013The figures in this table are National Statistics
Outward from the UK Inward to the UK
https://www.gov.uk/government/statistical-data-sets/tsgb04-freight 104

Department for Transport statistics Road Freight Statistics
Table RFS0208 (TSGB0417)
Goods lifted1 from the UK by foreign-registered HGVs, by vehicle registration country: 2002-2011
Thousand tonnes loaded in the UK
Country of vehicle registration 2002 2003 2004 2005 2006 2007 2008 2009 2010 2011EU-27
Belgium 992 936 818 735 676 632 444 371 335 235Bulgaria .. .. .. .. 6 34 19 112 29 127Czech Republic 459 299 399 568 560 609 525 527 567 611Denmark 84 51 87 78 80 46 72 46 16 12Germany 1,084 1,232 1,350 1,359 1,370 1,669 1,197 1,065 996 907Estonia .. 14 .. 12 31 34 51 79 85 104Ireland 4,431 5,186 4,971 4,193 4,486 3,485 3,724 2,762 2,205 2,286Greece .. 49 57 66 60 32 12 33 15 9Spain 716 754 906 968 972 880 716 614 638 584France 1,883 1,922 2,110 1,847 2,143 2,308 1,920 1,092 967 766Italy 335 464 626 450 473 413 163 136 240 58Cyprus 1 0 0 1 1 1 0 0 0 0Latvia 8 15 17 9 20 38 83 53 34 54Lithuania .. 78 114 267 396 489 425 336 469 568Luxembourg 57 120 105 94 107 73 96 55 80 69Hungary 92 119 198 287 496 736 859 819 593 629Netherlands 1,293 1,007 1,973 1,816 1,542 1,303 1,371 1,137 1,211 1,066Austria 365 456 479 438 356 260 194 61 56 52Poland .. .. 674 1,041 1,676 2,170 2,610 2,715 3,251 2,904Portugal 82 109 241 345 208 254 112 88 128 123Romania .. .. .. .. 73 259 317 142 183 241Slovenia 86 66 61 118 123 159 230 190 197 221Slovakia .. 42 139 170 364 416 480 493 413 367Finland .. 5 .. 4 1 .. .. 1 2 ..Sweden 17 24 17 10 6 6 6 7 12 10
Non-EUNorway 1 .. .. .. 2 4 0 .. 4 ..Switzerland .. .. .. .. .. .. 69 39 51 22Croatia .. .. .. .. .. .. 15 6 8 6
1. Weight of goods transported2. Note that these are not cabotage journeys because goods were unloaded in another country not the UKNote: some data may have been revised by Member States since the Road Freight Statistics (2010) publication.. Indicates the data were not available
Telephone: 020 7944 4261 Source: EurostatEmail: [email protected] Last updated: November 2012
Next update: November 2013
Goods loaded in UK but unloaded elsewhere2
https://www.gov.uk/government/statistical-data-sets/tsgb04-freight 105
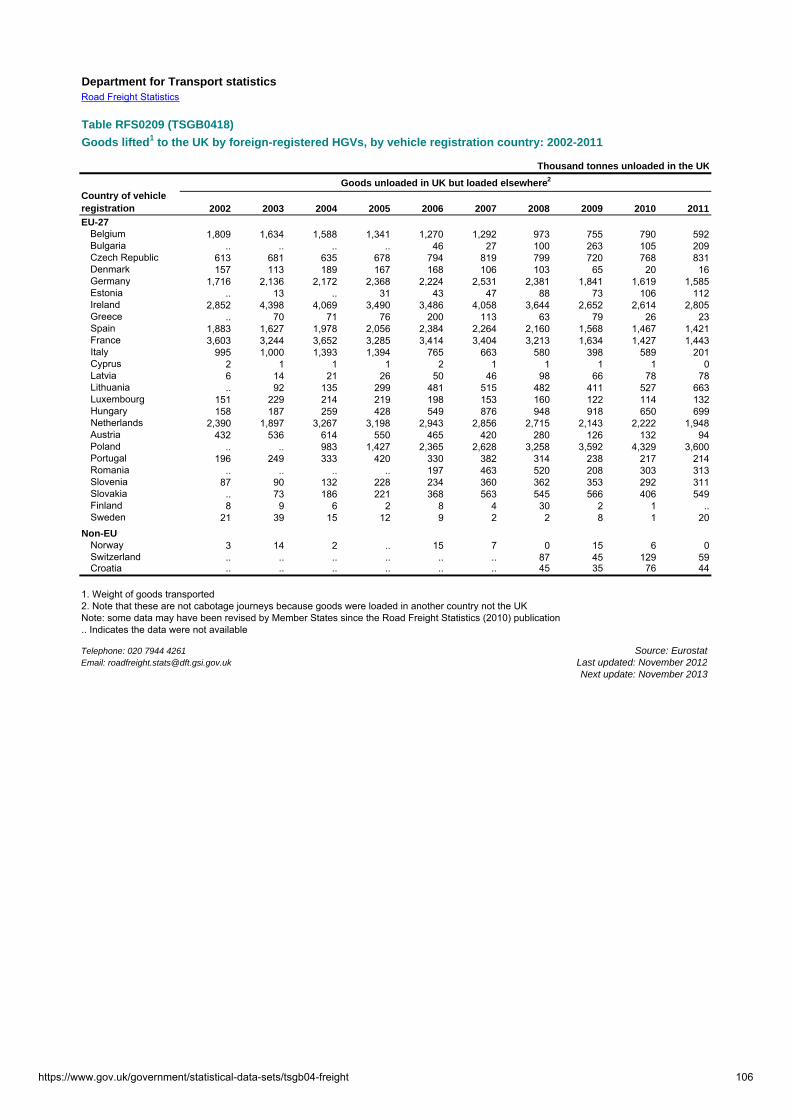
Department for Transport statistics Road Freight Statistics
Table RFS0209 (TSGB0418)
Goods lifted1 to the UK by foreign-registered HGVs, by vehicle registration country: 2002-2011
Thousand tonnes unloaded in the UK
Country of vehicle registration 2002 2003 2004 2005 2006 2007 2008 2009 2010 2011EU-27
Belgium 1,809 1,634 1,588 1,341 1,270 1,292 973 755 790 592Bulgaria .. .. .. .. 46 27 100 263 105 209Czech Republic 613 681 635 678 794 819 799 720 768 831Denmark 157 113 189 167 168 106 103 65 20 16Germany 1,716 2,136 2,172 2,368 2,224 2,531 2,381 1,841 1,619 1,585Estonia .. 13 .. 31 43 47 88 73 106 112Ireland 2,852 4,398 4,069 3,490 3,486 4,058 3,644 2,652 2,614 2,805Greece .. 70 71 76 200 113 63 79 26 23Spain 1,883 1,627 1,978 2,056 2,384 2,264 2,160 1,568 1,467 1,421France 3,603 3,244 3,652 3,285 3,414 3,404 3,213 1,634 1,427 1,443Italy 995 1,000 1,393 1,394 765 663 580 398 589 201Cyprus 2 1 1 1 2 1 1 1 1 0Latvia 6 14 21 26 50 46 98 66 78 78Lithuania .. 92 135 299 481 515 482 411 527 663Luxembourg 151 229 214 219 198 153 160 122 114 132Hungary 158 187 259 428 549 876 948 918 650 699Netherlands 2,390 1,897 3,267 3,198 2,943 2,856 2,715 2,143 2,222 1,948Austria 432 536 614 550 465 420 280 126 132 94Poland .. .. 983 1,427 2,365 2,628 3,258 3,592 4,329 3,600Portugal 196 249 333 420 330 382 314 238 217 214Romania .. .. .. .. 197 463 520 208 303 313Slovenia 87 90 132 228 234 360 362 353 292 311Slovakia .. 73 186 221 368 563 545 566 406 549Finland 8 9 6 2 8 4 30 2 1 ..Sweden 21 39 15 12 9 2 2 8 1 20
Non-EUNorway 3 14 2 .. 15 7 0 15 6 0Switzerland .. .. .. .. .. .. 87 45 129 59Croatia .. .. .. .. .. .. 45 35 76 44
1. Weight of goods transported2. Note that these are not cabotage journeys because goods were loaded in another country not the UKNote: some data may have been revised by Member States since the Road Freight Statistics (2010) publication.. Indicates the data were not available
Telephone: 020 7944 4261 Source: EurostatEmail: [email protected] Last updated: November 2012
Next update: November 2013
Goods unloaded in UK but loaded elsewhere2
https://www.gov.uk/government/statistical-data-sets/tsgb04-freight 106

Department for Transport statistics Road Freight Statistics
Table RFS0210 (TSGB0419)
Goods moved1 from the UK by foreign-registered HGVs, by vehicle registration country: 2002-2011
Million tonne kilometres loaded in the UK2
Country of vehicle registration 2002 2003 2004 2005 2006 2007 2008 2009 2010 2011EU-27
Belgium 561 465 441 397 352 324 234 196 159 124Bulgaria .. .. .. .. 21 53 26 239 65 207Czech Republic 885 547 678 831 731 740 685 630 684 820Denmark 99 68 103 99 107 53 93 54 17 9Germany 1,021 1,152 1,332 1,210 1,279 1,426 983 879 797 767Estonia .. 12 .. 11 30 41 69 99 90 105Ireland 735 811 816 855 859 872 864 721 604 639Greece .. 107 124 136 123 50 28 73 32 21Spain 1,233 1,299 1,623 1,748 1,563 1,491 1,262 1,040 1,047 930France 1,157 1,096 1,180 1,083 1,296 1,328 1,015 535 438 387Italy 542 764 932 689 735 715 232 96 315 95Cyprus 3 1 1 2 3 2 0 1 1 1Latvia 21 18 19 9 22 99 100 53 49 47Lithuania .. 177 218 373 527 650 551 415 651 668Luxembourg 51 93 86 76 77 61 80 43 65 57Hungary 185 240 360 457 705 983 1,070 996 764 707Netherlands 966 769 1,577 1,398 1,317 1,068 1,159 917 862 683Austria 478 608 609 518 350 256 204 57 56 66Poland .. .. 1,116 1,506 2,205 2,896 3,330 3,129 4,032 3,465Portugal 190 242 513 715 414 538 221 184 265 278Romania .. .. .. .. 210 797 1,017 287 338 409Slovenia 161 112 115 199 213 287 329 306 265 274Slovakia .. 95 265 317 615 624 777 649 573 597Finland .. 5 .. 12 3 .. .. 1 4 ..Sweden 28 28 21 17 3 9 5 7 8 13
Non-EUNorway 2 .. .. .. 2 6 0 .. 2 ..Switzerland .. .. .. .. .. .. 76 32 46 25Croatia .. .. .. .. .. .. 28 11 14 9
1. Weight of goods multiplied by distance transported2. Tonne kilometres includes the international leg of the trip - not just the part of the journey on UK soil3. Note that these are not cabotage journeys because goods were unloaded in another country not the UK.. Indicates data were not availableNote: some data may have been revised by Member States since the Road Freight Statistics (2010) publication
Telephone: 020 7944 4261 Source: EurostatEmail: [email protected] Last updated: November 2012
Next update: November 2013
Goods loaded in UK but unloaded elsewhere3
https://www.gov.uk/government/statistical-data-sets/tsgb04-freight 107

Department for Transport statistics Road Freight Statistics
Table RFS0211 (TSGB0420)
Goods moved1 to the UK by foreign-registered HGVs, by vehicle registration country: 2002-2011
Million tonne kilometres unloaded in the UK2
Country of vehicle registration 2002 2003 2004 2005 2006 2007 2008 2009 2010 2011EU-27
Belgium 972 850 900 761 697 694 528 397 409 298Bulgaria .. .. .. .. 100 57 117 536 193 399Czech Republic 1,131 1,182 1,099 1,078 1,216 1,201 1,125 988 993 1,105Denmark 189 133 242 234 197 125 115 78 28 13Germany 1,643 2,015 2,118 2,278 2,262 2,277 2,157 1,672 1,441 1,389Estonia .. 41 .. 45 48 74 111 96 129 113Ireland 814 955 944 934 930 1,073 1,081 931 764 791Greece .. 117 156 152 403 158 136 150 56 51Spain 3,691 2,999 3,797 4,127 4,594 4,448 4,256 3,092 2,714 2,629France 2,397 1,978 2,251 1,985 1,984 2,024 1,806 959 791 704Italy 1,725 1,702 2,430 2,340 1,229 1,063 904 619 925 342Cyprus 5 4 3 4 5 3 2 2 3 1Latvia 11 15 29 36 61 45 124 93 113 103Lithuania .. 176 195 413 660 676 602 493 677 763Luxembourg 128 173 176 178 147 115 134 94 94 94Hungary 319 394 493 738 927 1,316 1,423 1,305 904 994Netherlands 1,777 1,416 2,525 2,308 2,266 2,101 2,046 1,573 1,538 1,273Austria 600 745 845 728 596 515 338 155 156 116Poland .. .. 1,599 2,047 3,162 3,682 4,167 4,577 5,605 4,721Portugal 445 554 685 870 678 819 580 464 441 486Romania .. .. .. .. 556 1,179 1,343 468 619 547Slovenia 162 161 254 423 437 670 649 582 520 538Slovakia .. 161 339 377 598 917 908 820 598 878Finland 14 13 10 4 5 8 29 4 3 ..Sweden 23 39 15 22 9 3 3 6 1 23
Non-EUNorway 3 8 1 .. 14 7 0 30 12 0Switzerland .. .. .. .. .. .. 83 55 116 49Croatia .. .. .. .. .. .. 99 70 142 86
1. Weight of goods multiplied by distance transported2. Tonne kilometres includes the international leg of the trip - not just the part of the journey on UK soil3. Note that these are not cabotage journeys because goods were loaded in another country not the UK.. Indicates data were not availableNote: some data may have been revised by Member States since the Road Freight Statistics (2010) publication
Telephone: 020 7944 4261 Source: EurostatEmail: [email protected] Last updated: November 2012
Next update: November 2013
Goods unloaded in UK but loaded elsewhere3
https://www.gov.uk/government/statistical-data-sets/tsgb04-freight 108

Department for Transport statistics Road Freight Statistics
Table RFS0212 (TSGB0421)
Cabotage1 within the UK by country of registration of vehicle: 2004-20112
Million tonne kilometres
Country of vehicle registration 2004 2005 2006 2007 2008 2009 2010 2011Belgium 252 241 252 166 117 114 70 23Czech Republic .. .. .. .. .. .. 10 ..Denmark .. .. 6 .. .. 6 4 ..Germany 128 146 173 179 203 127 136 99Estonia .. .. .. .. .. .. .. ..Ireland 465 442 378 374 544 289 312 298Spain .. .. .. .. .. .. .. ..France 198 152 195 331 231 164 129 113Italy .. 32 .. .. 24 .. .. ..Lithuania .. .. 8 10 21 .. 6 8Luxembourg 17 19 16 8 5 4 7 9Hungary .. .. .. .. 9 9 9 23Netherlands 688 756 563 309 388 353 282 240Austria 9 5 10 .. .. .. .. ..Poland 52 36 117 109 117 124 212 173
Total 1,855 1,875 1,760 1,539 1,712 1,231 1,272 1,054
Domestic freight activity by UK vehicles 155,826 156,115 156,370 161,445 149,809 129,082 141,974 ..
Cabotage penetration rate (%) 3 1.2 1.2 1.1 0.9 1.1 0.9 0.9 0.7
1. Cabotage is the national carriage of goods for hire or reward carried out by non-resident hauliers on a temporary basis in a host Member State2. EU-27 countries where data were unavailable for all years have been excluded from this table3. The cabotage penetration rate is defined as cabotage (in tonne kilometres) as a proportion of the sum of domestic and cabotage tonne kilometre No UK domestic freight figures are available for the whole of 2011, so the 2010 figure has been used to calculate the penetration rate for 2011... Indicates data are not available
Telephone: 020 7944 4261 Source: EurostatEmail: [email protected] Last updated: November 2012
Next update: November 2013
The UK figures in this table are National Statistics
https://www.gov.uk/government/statistical-data-sets/tsgb04-freight 109

Department for Transport statistics Road Freight Statistics
Table RFS0105 (TSGB0429)Average length of haul by type of vehicle: annual 1990-2010 and quarterly 2004-2011; by GB HGVs in the UK
Kilometres
YearOver 3.5t
to 7.5tOver 7.5t to
17tOver 17t to
25t Over 25t All RigidsOver 3.5t to
33t Over 33t All artics All vehicles1990 57 58 29 38 43 113 135 129 791991 60 61 30 39 45 113 140 133 831992 56 62 30 38 44 118 135 132 831993 55 59 31 37 44 115 140 135 841994 58 64 30 37 45 119 137 133 861995 57 65 34 36 45 115 142 137 891996 59 65 40 36 47 115 136 133 901997 63 66 39 38 48 116 134 131 911998 61 68 40 37 47 115 138 135 931999 60 76 50 37 50 124 138 136 952000 66 70 56 36 49 131 135 134 942001 57 69 67 35 47 132 136 136 942002 59 66 70 35 46 122 134 133 922003 61 65 68 36 46 128 133 133 922004 55 59 69 35 44 120 125 125 872005 55 65 71 37 45 121 124 124 872006 56 54 72 35 43 122 123 123 862007 56 50 73 36 43 113 124 124 862008 54 53 68 38 45 112 121 120 872009 57 61 71 45 52 119 122 122 922010 58 63 69 44 51 118 123 122 93
Percentage change between1990 - 2010 2 9 141 18 19 4 -9 -5 172000 - 2010 -13 -10 25 22 5 -10 -9 -9 -12009 - 2010 2 4 -2 -1 -1 -1 0 0 1
2004 Q1 51 64 67 33 43 114 132 131 892004 Q2 52 57 70 35 44 115 118 118 852004 Q3 62 58 71 37 46 122 126 125 872004 Q4 55 58 71 36 44 129 125 125 882005 Q1 59 73 83 36 48 130 125 125 902005 Q2 53 60 70 37 45 131 126 126 862005 Q3 49 62 70 38 45 113 128 127 882005 Q4 60 63 62 35 43 112 119 119 852006 Q1 56 58 71 35 44 116 123 122 862006 Q2 62 50 69 35 43 126 128 128 882006 Q3 53 51 66 33 40 119 121 121 832006 Q4 53 58 81 36 46 127 123 123 872007 Q1 52 48 80 41 49 110 123 123 892007 Q2 52 51 72 36 44 115 126 125 882007 Q3 58 53 63 34 41 114 123 123 832007 Q4 62 48 80 32 41 114 124 123 862008 Q1 51 62 63 36 43 117 122 121 862008 Q2 55 55 71 38 46 119 128 128 902008 Q3 56 43 76 40 48 110 116 115 872008 Q4 56 50 61 38 44 101 119 118 872009 Q1 54 59 70 42 49 118 124 124 922009 Q2 59 59 67 50 55 119 124 124 952009 Q3 51 62 75 43 51 117 118 118 902009 Q4 65 64 72 44 52 123 122 122 932010 Q1 63 62 70 48 54 118 127 127 972010 Q2 52 74 68 43 50 124 116 116 882010 Q3 56 60 63 42 48 116 126 125 942010 Q4 61 57 80 46 53 113 122 122 942011 Q1 p 63 48 60 46 50 113 121 121 89
Percentage change betweenQ1 2010 - Q1 2011 0 -22 -13 -3 -8 -4 -5 -5 -9
p Provisional
Telephone: 020 7944 4261 Source: Continuing Survey of Road Goods Transport, DfTEmail: [email protected] Last updated: November 2012
Next update: November 2013The figures in this table are National Statistics
Articulated vehiclesRigids
https://www.gov.uk/government/statistical-data-sets/tsgb04-freight 110

Department for Transport statistics Road Freight Statistics
Table RFS0103 (TSGB0430)
Goods lifted1 by commodity grouping: annual 1990-2004 and quarterly 2004-2011; by GB HGVs in the UK
Million tonnes
YearFood, drink &
tobacco Bulk productsChemicals, petrol &
fertiliserMiscellaneous
products All Commodities1990 299 697 141 508 1,6451991 291 610 131 473 1,5051992 290 616 118 440 1,4631993 300 616 126 479 1,5231994 302 658 129 509 1,5971995 308 626 132 542 1,6091996 326 609 139 555 1,6281997 342 645 136 520 1,6431998 346 633 123 529 1,6301999 333 600 119 515 1,5672000 346 604 134 510 1,5932001 321 592 133 534 1,5812002 339 622 111 554 1,6272003 333 627 123 559 1,6432004 351 694 121 577 1,7442005 339 681 138 588 1,7462006 353 675 122 626 1,7762007 364 693 125 640 1,8222008 355 598 140 574 1,6682009 352 425 114 466 1,3562010 382 482 132 492 1,4892011 . . . . .
Percentage change between1990 - 2010 28 -31 -7 -3 -102000 - 2010 10 -20 -2 -4 -72009 - 2010 9 14 16 6 10
2004 Q1 88 162 30 146 4262004 Q2 92 190 31 141 4552004 Q3 88 168 30 149 4342004 Q4 83 175 30 141 4292005 Q1 81 148 37 146 4122005 Q2 84 204 32 141 4612005 Q3 91 168 28 155 4422005 Q4 84 161 41 145 4312006 Q1 85 153 35 157 4312006 Q2 74 174 33 150 4312006 Q3 94 181 30 167 4722006 Q4 99 167 23 152 4422007 Q1 93 155 27 155 4302007 Q2 85 181 29 162 4562007 Q3 93 187 30 157 4672007 Q4 93 171 39 167 4692008 Q1 84 164 42 158 4482008 Q2 82 161 32 137 4132008 Q3 89 142 37 147 4152008 Q4 100 130 30 132 3912009 Q1 89 110 34 107 3402009 Q2 84 107 22 121 3342009 Q3 87 108 32 130 3562009 Q4 92 99 27 108 3262010 Q1 97 109 25 124 3552010 Q2 84 134 38 129 3862010 Q3 103 125 36 129 3932010 Q4 97 115 34 110 3552011 Q1 p 97 123 41 148 408
Percentage change betweenQ1 2010 - Q1 2011 -1 13 67 19 15
1. Weight of goods transportedp Provisional
Telephone: 020 7944 4261 Source: Continuing Survey of Road Goods Transport, DfTEmail: [email protected] Last updated: November 2012The figures in this table are National Statistics Next update: November 2013
https://www.gov.uk/government/statistical-data-sets/tsgb04-freight 111
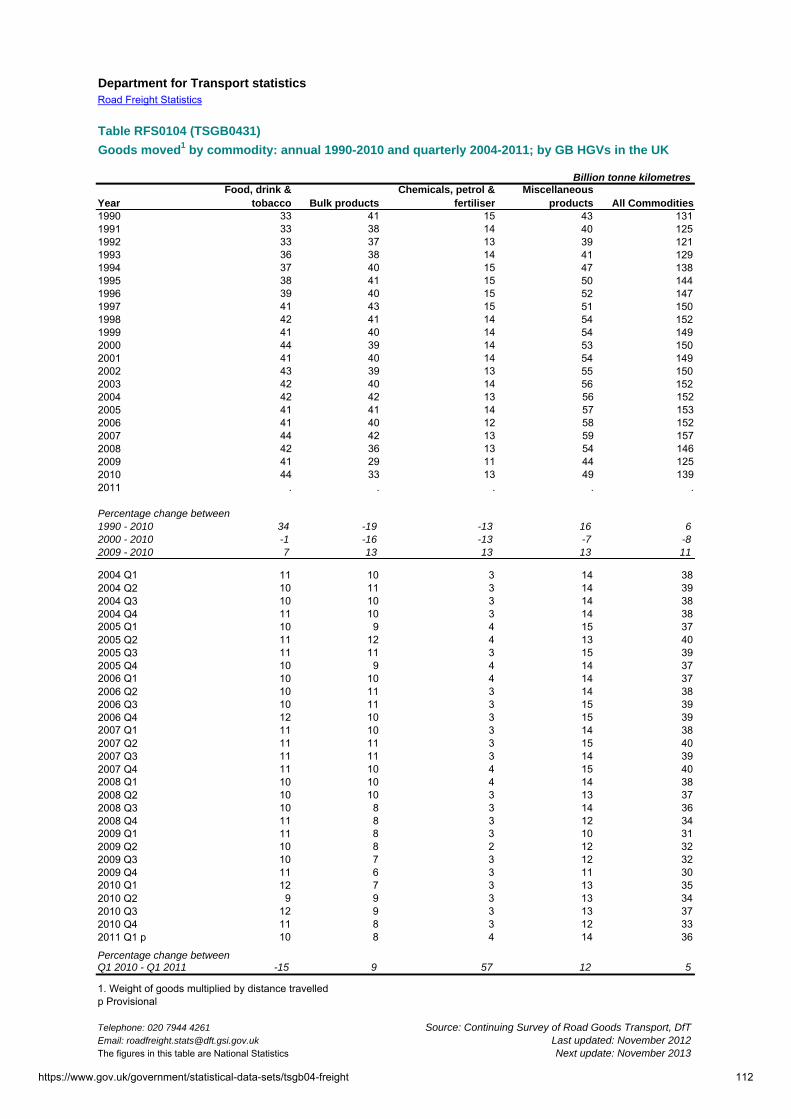
Department for Transport statistics Road Freight Statistics
Table RFS0104 (TSGB0431)
Goods moved1 by commodity: annual 1990-2010 and quarterly 2004-2011; by GB HGVs in the UK
Billion tonne kilometres
YearFood, drink &
tobacco Bulk productsChemicals, petrol &
fertiliserMiscellaneous
products All Commodities1990 33 41 15 43 1311991 33 38 14 40 1251992 33 37 13 39 1211993 36 38 14 41 1291994 37 40 15 47 1381995 38 41 15 50 1441996 39 40 15 52 1471997 41 43 15 51 1501998 42 41 14 54 1521999 41 40 14 54 1492000 44 39 14 53 1502001 41 40 14 54 1492002 43 39 13 55 1502003 42 40 14 56 1522004 42 42 13 56 1522005 41 41 14 57 1532006 41 40 12 58 1522007 44 42 13 59 1572008 42 36 13 54 1462009 41 29 11 44 1252010 44 33 13 49 1392011 . . . . .
Percentage change between1990 - 2010 34 -19 -13 16 62000 - 2010 -1 -16 -13 -7 -82009 - 2010 7 13 13 13 11
2004 Q1 11 10 3 14 382004 Q2 10 11 3 14 392004 Q3 10 10 3 14 382004 Q4 11 10 3 14 382005 Q1 10 9 4 15 372005 Q2 11 12 4 13 402005 Q3 11 11 3 15 392005 Q4 10 9 4 14 372006 Q1 10 10 4 14 372006 Q2 10 11 3 14 382006 Q3 10 11 3 15 392006 Q4 12 10 3 15 392007 Q1 11 10 3 14 382007 Q2 11 11 3 15 402007 Q3 11 11 3 14 392007 Q4 11 10 4 15 402008 Q1 10 10 4 14 382008 Q2 10 10 3 13 372008 Q3 10 8 3 14 362008 Q4 11 8 3 12 342009 Q1 11 8 3 10 312009 Q2 10 8 2 12 322009 Q3 10 7 3 12 322009 Q4 11 6 3 11 302010 Q1 12 7 3 13 352010 Q2 9 9 3 13 342010 Q3 12 9 3 13 372010 Q4 11 8 3 12 332011 Q1 p 10 8 4 14 36
Percentage change betweenQ1 2010 - Q1 2011 -15 9 57 12 5
1. Weight of goods multiplied by distance travelledp Provisional
Telephone: 020 7944 4261 Source: Continuing Survey of Road Goods Transport, DfTEmail: [email protected] Last updated: November 2012The figures in this table are National Statistics Next update: November 2013
https://www.gov.uk/government/statistical-data-sets/tsgb04-freight 112

Department for Transport statistics Road Freight Statistics
Table RFS0101 (TSGB0432)
Goods moved1 and goods lifted2: annual 1990-2010 and quarterly 2004-2011; by GB HGVs in the UK
Index (2004=100)
Year1990 131 1,645 86 941991 125 1,505 82 861992 121 1,463 80 841993 129 1,523 85 871994 138 1,597 91 921995 144 1,609 94 921996 147 1,628 97 931997 150 1,643 98 941998 152 1,630 100 931999 149 1,567 98 902000 150 1,593 99 912001 149 1,581 98 912002 150 1,627 98 932003 152 1,643 100 942004 152 1,744 100 1002005 153 1,746 100 1002006 152 1,776 100 1022007 157 1,822 103 1052008 146 1,668 96 962009 125 1,356 82 782010 139 1,489 91 852011 . . . .
Percentage change between2000 - 2010 -8 -7 -8 -72009 - 2010 11 10 11 10
Index (Q1 2004=100)
2004 Q1 38 426 100 1002004 Q2 39 455 102 1072004 Q3 38 434 100 1022004 Q4 38 429 100 1012005 Q1 37 412 98 972005 Q2 40 461 105 1082005 Q3 39 442 103 1042005 Q4 37 431 97 1012006 Q1 37 431 98 1012006 Q2 38 431 100 1012006 Q3 39 472 103 1112006 Q4 39 442 102 1042007 Q1 38 430 101 1012007 Q2 40 456 106 1072007 Q3 39 467 102 1102007 Q4 40 469 106 1102008 Q1 38 448 101 1052008 Q2 37 413 99 972008 Q3 36 415 95 982008 Q4 34 391 90 922009 Q1 31 340 83 802009 Q2 32 334 84 782009 Q3 32 356 85 842009 Q4 30 326 80 772010 Q1 35 355 91 832010 Q2 34 386 90 912010 Q3 37 393 98 922010 Q4 33 355 88 832011 Q1 p 36 408 96 96
Percentage change betweenQ1 2010 - Q1 2011 5 15 5 15
1. Weight of goods multiplied by distance travelled2. Weight of goodsp Provisional
Telephone: 020 7944 4261 Source: Continuing Survey of Road Goods Transport, DfTEmail: [email protected] Last updated: November 2012The figures in this table are National Statistics Next update: November 2013
Goods MovedTonne kms (billion)
Goods liftedTonnes (million)
Goods Moved Goods lifted
https://www.gov.uk/government/statistical-data-sets/tsgb04-freight 113

Department for Transport statistics Road Freight Statistics
Table RFS0144 (TSGB0433)Summary of domestic and international road freight by UK HGVs: annual 2004-2010 and quarterly 2004-2011
Cabotage6 Cabotage6
Year GB HGVs NI HGVs GB HGVs NI HGVs UK HGVs GB HGVs NI HGVs GB HGVs NI HGVs UK HGVs2004 1,743.7 65.3 11.5 10.2 1.9 152.1 3.7 9.6 1.5 0.42005 1,745.9 65.5 10.7 9.4 1.9 152.6 3.5 8.0 1.7 0.42006 1,775.8 69.7 10.8 13.0 2.4 152.4 3.9 8.4 1.9 0.42007 1,822.4 82.0 10.8 11.3 2.2 157.3 4.1 8.2 1.6 0.42008 1,667.5 73.7 10.5 7.9 2.5 145.8 4.0 7.4 1.3 0.42009 1,356.2 63.7 9.4 7.1 1.3 125.2 3.9 6.7 1.0 0.32010 1,488.5 56.6 10.4 8.2 2.3 138.9 3.1 7.1 1.2 0.62011 . . . . . . .
Percentage change between2009 - 2010 10 -11 10 15 75 11 -20 6 27 112
2004 Q1 425.8 16.8 2.9 2.7 0.9 37.8 0.8 2.6 0.4 0.12004 Q2 454.5 14.1 2.9 2.6 0.4 38.6 0.9 2.4 0.4 0.12004 Q3 434.0 18.2 2.9 2.4 0.4 38.0 1.0 2.3 0.3 0.12004 Q4 429.4 16.2 2.8 2.5 0.2 37.7 0.9 2.3 0.4 0.12005 Q1 412.3 19.0 2.6 2.7 0.3 37.2 1.0 2.0 0.5 0.12005 Q2 461.0 17.4 2.9 2.4 0.6 39.7 0.9 2.2 0.4 0.12005 Q3 441.7 13.0 2.7 2.2 0.8 39.0 0.8 2.0 0.4 0.12005 Q4 430.8 16.1 2.5 2.1 0.3 36.6 0.9 1.8 0.4 0.12006 Q1 430.9 18.1 2.6 2.8 0.7 37.1 1.2 2.0 0.5 0.12006 Q2 431.3 17.7 2.7 3.1 0.8 37.8 1.0 2.0 0.5 0.12006 Q3 471.9 16.2 2.8 4.0 0.3 38.9 0.8 2.3 0.5 0.12006 Q4 441.8 17.7 2.7 3.1 0.7 38.7 0.9 2.1 0.5 0.12007 Q1 430.5 19.8 2.8 2.0 0.5 38.3 1.1 2.1 0.3 0.12007 Q2 456.2 19.4 2.8 3.2 0.2 40.1 1.0 2.2 0.5 0.12007 Q3 466.8 23.0 2.6 2.7 0.9 38.8 1.1 2.0 0.4 0.12007 Q4 468.9 19.7 2.6 3.4 0.6 40.2 1.0 1.9 0.4 0.12008 Q1 447.9 19.3 2.7 1.4 0.8 38.4 1.0 1.9 0.4 0.12008 Q2 412.9 19.5 2.8 2.2 0.5 37.3 1.0 1.9 0.4 0.12008 Q3 415.2 19.6 2.8 1.7 0.6 35.9 1.0 2.0 0.3 0.12008 Q4 391.4 15.3 2.1 2.5 0.6 34.1 1.0 1.6 0.3 0.12009 Q1 339.8 16.7 2.2 1.6 0.2 31.2 1.2 1.5 0.2 0.02009 Q2 334.1 15.4 2.6 2.3 0.3 31.7 0.8 1.8 0.3 0.12009 Q3 356.2 14.7 2.4 1.6 0.5 32.1 0.9 1.7 0.3 0.12009 Q4 326.1 16.9 2.3 1.6 0.3 30.2 1.0 1.6 0.3 0.12010 Q1 354.9 15.0 2.5 1.7 0.5 34.6 0.8 1.7 0.3 0.12010 Q2 385.8 18.9 2.6 2.5 0.9 34.0 0.9 1.8 0.4 0.32010 Q3 392.6 11.7 2.7 2.4 0.6 37.0 0.8 1.8 0.3 0.12010 Q4 355.2 11.1 2.6 1.5 0.3 33.2 0.6 1.8 0.2 0.12011 Q1 p 408.4 15.2 2.7 2.4 0.5 36.4 1.1 1.7 0.4 0.1
Percentage change betweenQ1 2010 - Q1 2011 15 1 10 37 -6 5 30 0 23 -36
1. Weight of goods in tonnes2. Weight of goods multiplied by distance in tonne kilometres3. Domestic freight lifted by GB and NI-registered HGVs within the UK4. The estimates for domestic haulage include the domestic legs of international trips5. Includes all journeys, including those within the island of Ireland, so figures will be higher than those in Table RFS0201 which exclude these6. Cabotage is the national carriage of goods for hire or reward carried out by non-resident hauliers on a temporary basis in a host Member Statep Provisional
Telephone: 020 7944 4261 Source: Continuing Survey of Road Goods Transport and International Road Haulage Survey, DfTEmail: [email protected] Last updated: November 2012The figures in this table are National Statistics Next update: November 2013
Million tonnes Billion tonne kilometres
Domestic3,4 International5 Domestic3,4 International5Goods lifted1 Goods moved2
https://www.gov.uk/government/statistical-data-sets/tsgb04-freight 114
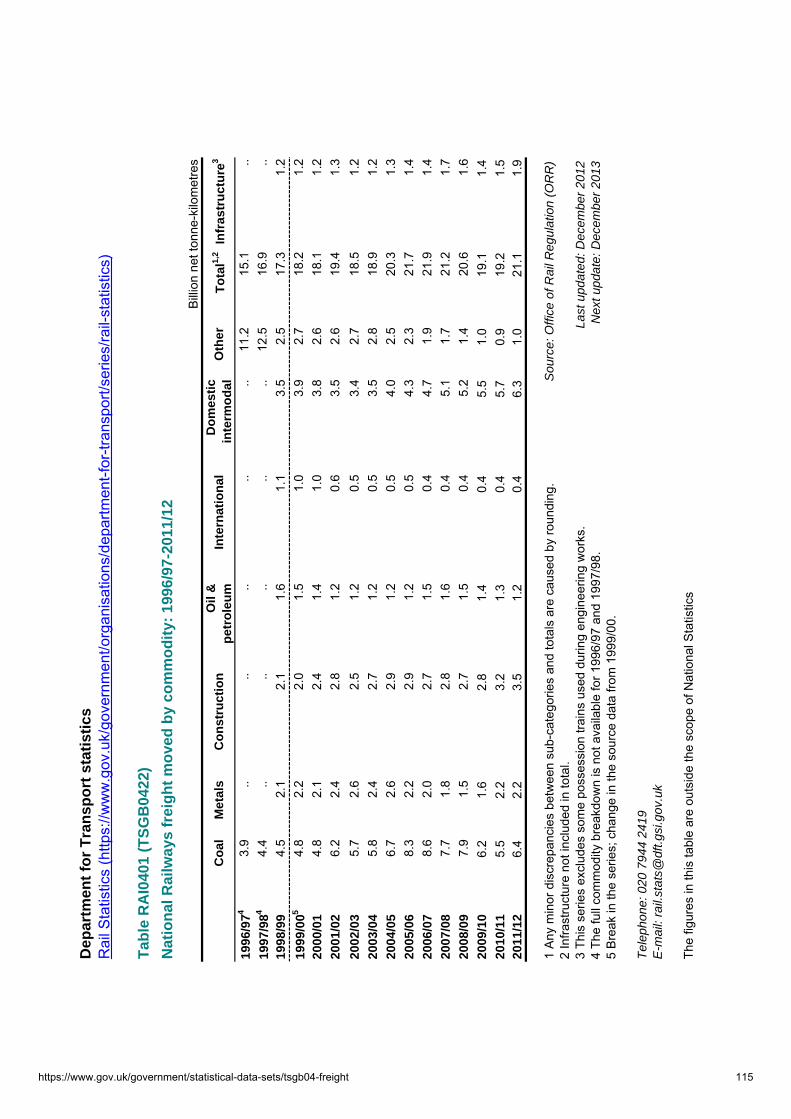
Dep
artm
ent
for
Tra
nsp
ort
sta
tist
ics
Tab
le R
AI0
401
(TS
GB
0422
)
Nat
ion
al R
ailw
ays
frei
gh
t m
ove
d b
y co
mm
od
ity:
199
6/97
-201
1/12
Bill
ion
net t
onne
-kilo
met
res
Co
alM
etal
sC
on
stru
ctio
nO
il &
p
etro
leu
mIn
tern
atio
nal
Do
mes
tic
inte
rmo
dal
Oth
erT
ota
l1,2
Infr
astr
uct
ure
3
1996
/974
3.9
....
....
..11
.215
.1..
1997
/984
4.4
....
....
..12
.516
.9..
1998
/99
4.5
2.1
2.1
1.6
1.1
3.5
2.5
17.3
1.2
1999
/005
4.8
2.2
2.0
1.5
1.0
3.9
2.7
18.2
1.2
2000
/01
4.8
2.1
2.4
1.4
1.0
3.8
2.6
18.1
1.2
2001
/02
6.2
2.4
2.8
1.2
0.6
3.5
2.6
19.4
1.3
2002
/03
5.7
2.6
2.5
1.2
0.5
3.4
2.7
18.5
1.2
2003
/04
5.8
2.4
2.7
1.2
0.5
3.5
2.8
18.9
1.2
2004
/05
6.7
2.6
2.9
1.2
0.5
4.0
2.5
20.3
1.3
2005
/06
8.3
2.2
2.9
1.2
0.5
4.3
2.3
21.7
1.4
2006
/07
8.6
2.0
2.7
1.5
0.4
4.7
1.9
21.9
1.4
2007
/08
7.7
1.8
2.8
1.6
0.4
5.1
1.7
21.2
1.7
2008
/09
7.9
1.5
2.7
1.5
0.4
5.2
1.4
20.6
1.6
2009
/10
6.2
1.6
2.8
1.4
0.4
5.5
1.0
19.1
1.4
2010
/11
5.5
2.2
3.2
1.3
0.4
5.7
0.9
19.2
1.5
2011
/12
6.4
2.2
3.5
1.2
0.4
6.3
1.0
21.1
1.9
1 A
ny m
inor
dis
crep
anci
es b
etw
een
sub-
cate
gorie
s an
d to
tals
are
cau
sed
by ro
undi
ng.
Sou
rce:
Offi
ce o
f Rai
l Reg
ulat
ion
(OR
R)
2 In
frast
ruct
ure
not i
nclu
ded
in to
tal.
3 Th
is s
erie
s ex
clud
es s
ome
poss
essi
on tr
ains
use
d du
ring
engi
neer
ing
wor
ks.
Last
upd
ated
: Dec
embe
r 20
124
The
full
com
mod
ity b
reak
dow
n is
not
ava
ilabl
e fo
r 199
6/97
and
199
7/98
.N
ext u
pdat
e: D
ecem
ber
2013
5 B
reak
in th
e se
ries;
cha
nge
in th
e so
urce
dat
a fro
m 1
999/
00.
Tel
epho
ne: 0
20 7
944
2419
E-m
ail:
rail.
stat
s@df
t.gsi
.gov
.uk
The
figur
es in
this
tabl
e ar
e ou
tsid
e th
e sc
ope
of N
atio
nal S
tatis
tics
Rai
l Sta
tistic
s (h
ttps:
//ww
w.g
ov.u
k/go
vern
men
t/org
anis
atio
ns/d
epar
tmen
t-for
-tran
spor
t/ser
ies/
rail-
stat
istic
s)
https://www.gov.uk/government/statistical-data-sets/tsgb04-freight 115

Department for Transport statistics
Table RAI0402 (TSGB0423)
National Railways freight lifted by commodity: 1996/97-2011/12
Million tonnesCoal Other Total1
1996/97 52.2 49.6 101.81997/98 50.3 55.1 105.41998/99 45.3 56.8 102.11999/002 35.9 60.6 96.52000/01 35.3 60.3 95.62001/02 39.5 54.5 93.92002/03 34.0 53.0 87.02003/04 35.2 53.7 88.92004/053,R 44.1 56.8 100.92005/064 47.6 57.7 105.32006/07 48.7 59.5 108.22007/085 43.3 59.1 102.42008/09 46.6 56.1 102.72009/10 37.9 49.3 87.22010/11 38.8 51.1 89.92011/12 44.4 57.3 101.7
R 2004/05 coal lifted has been revised by ORR since the previous publication.1 Any minor discrepancies between sub-categories and totals are caused by rounding.2 Break in the series; change in the source data from 1999/00.3 Break in the series; increase largely due to changes in data collection method.4 Break in the series; figures from 2005/06 onwards include some of the tonnes lifted by GB Railfreight.5 Break in the series; coal data was not supplied by GB Railfreight prior to 2007/08.
Telephone: 020 7944 2419 Source: Office of Rail Regulation (ORR)E-mail: [email protected]
Last updated: December 2012Next update: December 2013
The figures in this table are outside the scope of National Statistics
Rail Statistics (https://www.gov.uk/government/organisations/department-for-transport/series/rail-statistics)
https://www.gov.uk/government/statistical-data-sets/tsgb04-freight 116

Dep
artm
ent
for
Tra
nsp
ort
sta
tist
ics
Tab
le R
AI0
403
(TS
GB
0424
)
Nat
ion
al R
ailw
ays
frei
gh
t
Nu
mb
er o
f fr
eig
ht
trai
n m
ove
men
ts, i
mp
acts
on
ro
ad h
aula
ge
and
Fre
igh
t P
erfo
rman
ce M
easu
re:
2005
/06-
2011
/12
2005
/06
2006
/07
2007
/08
2008
/09R
2009
/10R
2010
/11R
2011
/12
(a)
Nu
mb
er o
f fr
eig
ht
trai
n m
ove
men
ts1,
2
Thou
sand
sT
ota
l nu
mb
er o
f fr
eig
ht
trai
ns
mo
vem
ents
455.
636
4.9
332.
231
6.7
278.
526
5.6
273.
9
(b)
Imp
acts
on
ro
ad h
aula
ge
Bill
ions
Ro
ad v
ehic
le k
ilom
etre
s eq
uiv
alen
t31.
21.
41.
41.
41.
41.
4..5
Mill
ions
Ro
ad v
ehic
le jo
urn
eys
equ
ival
ent4
6.7
6.6
6.7
8.2
6.5
5.9
..5
(c)
Fre
igh
t P
erfo
rman
ce M
easu
re (F
PM
)1,6
Per
cent
age
FP
M65
.466
.868
.771
.174
.673
.975
.8
1 Fi
gure
s ha
ve b
een
sour
ced
from
Net
wor
k R
ail.
2 M
easu
res
the
tota
l num
ber o
f tra
in m
ovem
ents
(inc
ludi
ng in
frast
ruct
ure
train
s) o
n th
e ne
twor
k.3
The
equi
vale
nt d
ista
nce
that
road
veh
icle
s w
ould
nee
d to
hav
e tra
velle
d to
mov
e th
e am
ount
s of
frei
ght c
arrie
d on
rail,
whi
ch is
affe
cted
mor
e by
vol
ume
than
by
wei
ght.
4 Th
e eq
uiva
lent
num
ber o
f roa
d ve
hicl
e tri
ps n
eces
sary
to m
ove
this
frei
ght.
5 D
ata
for 2
011/
12 w
ill n
ot b
e pu
blis
hed
until
Jul
y 20
13.
6 P
erce
ntag
e of
trai
ns a
rriv
ing
on ti
me
at th
eir f
inal
des
tinat
ion.
A tr
ain
is c
onsi
dere
d 'o
n tim
e' if
it a
rriv
es w
ithin
10
min
utes
of i
ts s
ched
uled
arr
ival
tim
e.
R R
evis
ions
hav
e be
en m
ade
to th
e 20
09/1
0 an
d 20
10/1
1 nu
mbe
r of f
reig
ht tr
ain
mov
emen
ts, 2
008/
09 a
nd 2
009/
10 ro
ad v
ehic
le jo
urne
ys e
quiv
alen
t and
201
0/11
FP
M.
Tel
epho
ne: 0
20 7
944
2419
Sou
rces
: Offi
ce o
f Rai
l Reg
ulat
ion
(OR
R);
Net
wor
k R
ail
E-m
ail:
rail.
stat
s@df
t.gsi
.gov
.uk
Not
es a
nd d
efin
ition
sLa
st u
pdat
ed: D
ecem
ber
2012
The
figur
es in
this
tabl
e ar
e ou
tsid
e th
e sc
ope
of N
atio
nal S
tatis
tics
Nex
t upd
ate:
Dec
embe
r 20
13
Rai
l Sta
tistic
s (h
ttps:
//ww
w.g
ov.u
k/go
vern
men
t/org
anis
atio
ns/d
epar
tmen
t-for
-tran
spor
t/ser
ies/
rail-
stat
istic
s)
https://www.gov.uk/government/statistical-data-sets/tsgb04-freight 117

Dep
artm
ent
for
Tra
nsp
ort
Sta
tist
ics
Rol
l-on
Rol
l-off
Inte
rnat
iona
l Fre
ight
Tab
le R
oR
o01
01 (
TS
GB
0434
)
Thou
sand
s
Un
acco
mp
anie
dA
ll
Yea
rU
KF
ore
ign
Un
kno
wn
To
tal
trai
lers
ve
hic
les
1990
339
383
272
458
31,
307
1991
360
363
272
659
81,
324
1992
374
394
277
062
91,
399
1993
398
392
679
659
31,
390
1994
453
439
489
670
21,
598
1995
486
461
395
067
71,
628
1996
531
484
21,
018
626
1,64
419
97
543
598
61,
146
740
1,88
619
9854
472
65
1,27
573
72,
012
1999
563
885
61,
454
738
2,19
120
00
545
1,04
318
1,60
571
32,
318
2001
518
1,17
420
1,71
268
62,
398
2002
493
1,29
018
1,80
272
62,
527
2003
474
1,32
219
1,81
578
02,
595
2004
441
1,44
610
1,89
778
72,
684
2005
418
1,51
310
1,94
176
32,
704
2006
406
1,60
69
2,02
178
42,
805
2007
40
01,
719
112,
129
772
2,90
120
08
382
1,67
25
2,06
070
92,
768
2009
347
1,40
413
1,76
461
12,
375
2010
379
1,40
69
1,79
467
32,
468
2011
361
1,44
64
1,81
266
02,
472
Per
cen
tag
e an
nu
al c
han
ge
-53
*1
-20
Tel
epho
ne: 0
20 7
944
2021
Sou
rce:
DfT
Rol
l-on
Rol
l-off
Goo
ds V
ehic
le S
urve
yE
mai
l: m
ariti
me.
stat
s@df
t.gsi
.gov
.uk
Last
upd
ated
: Nov
embe
r 20
12Th
e fig
ures
in th
is ta
ble
are
Nat
iona
l Sta
tistic
sN
ext u
pdat
e: N
ovem
ber
2013
Ro
ad g
oo
ds
veh
icle
s tr
avel
ling
to
mai
nla
nd
Eu
rop
e, 1
990-
2011
Po
wer
ed v
ehic
les
by
cou
ntr
y o
f re
gis
trat
ion
https://www.gov.uk/government/statistical-data-sets/tsgb04-freight 118

Dep
artm
ent
for
Tra
nsp
ort
Sta
tist
ics
Rol
l-on
Rol
l-off
Inte
rnat
iona
l Fre
ight
Tab
le R
oR
o02
01 (
TS
GB
0435
)
Po
wer
ed g
oo
ds
veh
icle
s b
y co
un
try
of
reg
istr
atio
n1, 1
990-
2011
Thou
sand
s
Yea
r
UK
Ger
man
yF
ran
ceIt
aly
Net
her
lan
ds
Po
lan
dE
U15
3E
U27
5 N
on
EU
6U
nkn
ow
nA
ll fo
reig
nA
ll co
un
trie
s
1990
339
3413
115
71..
689
..33
238
372
419
9136
030
129
1469
..69
6..
272
363
726
1992
374
3114
114
72..
738
..30
239
477
019
9339
828
144
1373
..76
0..
306
392
796
1994
453
2816
323
76..
858
..34
443
989
719
9548
628
155
2985
..91
8..
293
461
950
1996
531
3018
229
87..
989
..26
248
41,
018
1997
543
3923
430
107
..1,
113
..28
659
81,
146
1998
544
5227
235
125
..1,
235
..35
572
61,
275
1999
563
7331
946
153
71,
400
..47
688
51,
454
2000
545
111
339
6818
510
1,53
5..
5318
1,04
31,
605
2001
518
132
352
9118
712
1,61
2..
7920
1,17
41,
712
2002
493
148
363
128
186
121,
667
..11
618
1,29
01,
802
2003
474
156
363
132
210
141,
648
..14
719
1,32
21,
815
2004
441
233
224
9926
458
1,68
41,
818
6910
1,44
61,
897
2005
418
214
214
9225
210
01,
590
1,82
410
610
1,51
31,
941
2006
406
212
205
8824
414
71,
542
1,87
813
49
1,60
62,
021
2007
400
218
197
8225
220
51,
540
2,02
396
111,
719
2,12
920
0838
220
017
961
244
256
1,41
21,
990
655
1,67
22,
060
2009
347
153
144
4317
625
91,
144
1,68
863
131,
404
1,76
420
1037
915
213
246
194
250
1,18
81,
739
469
1,40
61,
794
2011
361
136
123
4219
927
01,
145
1,75
751
41,
446
1,81
2
Per
cen
tag
e an
nu
al c
han
ge
-5-1
1-7
-10
38
-41
9*
31
1 C
ompa
rison
of t
he q
uarte
rly fi
gure
s by
cou
ntry
sho
uld
be tr
eate
d w
ith c
autio
n.2
Incl
udes
Lux
embo
urg
from
198
3 - 2
003.
3
Prio
r to
1995
, rel
ates
to E
U12
(Aus
tria,
Sw
eden
and
Fin
land
did
not
join
unt
il 19
95).
4 F
or 2
004,
200
5 an
d 20
06 d
oes
not i
nclu
de B
ulga
ria a
nd R
oman
ia (t
hey
did
not j
oin
the
EU
unt
il 20
07)
5 (a
) Bef
ore
2004
incl
udes
New
Mem
ber S
tate
cou
ntrie
s as
non
e w
ere
mem
bers
of t
he E
U a
t thi
s tim
e. N
o in
divi
dual
bre
akdo
wn
avai
labl
e be
fore
199
9 fo
r the
se c
ount
ries.
(b) R
oman
ia a
nd B
ulga
ria in
clud
ed in
200
4, 2
005
and
2006
as
they
did
not
join
the
EU
unt
il 20
076
Fig
ures
for o
ne o
pera
tor h
ave
been
est
imat
ed in
Q3
2011
.S
ourc
e: D
fT R
oll-o
n R
oll-o
ff G
oods
Veh
icle
Sur
vey
Last
upd
ated
: Nov
embe
r 20
12T
elep
hone
: 020
794
4 20
21N
ext u
pdat
e: N
ovem
ber
2013
Em
ail:
mar
itim
e.st
ats@
dft.g
si.g
ov.u
k
The
figur
es in
this
tabl
e ar
e N
atio
nal S
tatis
tics
https://www.gov.uk/government/statistical-data-sets/tsgb04-freight 119

https://www.gov.uk/government/statistical-data-sets/tsgb04-freight 120

Transport Statistics Great Britain: 2012
Maritime
This section contains statistics relating to maritime and inland waters transport.
Associated tables and charts can be accessed through the Ports statistics webpage.
Freight traffic handled at UK sea ports (Tables TSGB0501 to 0503)
UK port freight traffic, 1980 to 2011
0
100
200
300
400
500
600
700
1980
1982
1984
1986
1988
1990
1992
1994
1996
1998
2000
2002
2004
2006
2008
2010
Mil
lio
n t
on
nes
Imports Exports Domestic
UK sea ports handled 519 million tonnes (Mt) of freight traffic in 2011, an increase of 1 per cent on 2010, but 11 per cent lower than in the peak in 2005.
Over the ten years since 2001, imports have increased by 9 per cent where as exports have decreased by 23 per cent and domestic traffic has fallen by 18 per cent.
Maritime Statistics includes:
Freight handled at UK sea ports
Passenger traffic at UK sea ports
Waterborne freight in the UK
Shipping, including commercial shipping fleets, industry revenue and expenditure and maritime incidents
https://www.gov.uk/government/statistical-data-sets/tsgb05-maritime 121

Top 10 UK ports by tonnage 2011 UK port traffic by cargo type, 2011
Liquid bulk traffic 46%
Other cargo 4%
Container and ro-ro 30%
Dry bulk traff ic 20%
Port Million tonnes % of total
1. Grimsby & Immingham 57.2 11.0
2. London 48.8 9.4
3. Milford Haven 48.7 9.4
4. Southampton 37.9 7.3
5. Tees and Hartlepool 35.2 6.8
6. Liverpool 32.7 6.3
7. Forth 27.9 5.4
8. Felixstowe 26.8 5.2
9. Dover 24.3 4.7
10. Medway 16.1 3.1
Other major UK ports 151.5 29.2
Minor UK ports 12.5 2.4
All UK ports 519.5 100
100% = 519.5 million tonnes
Grimsby and Immingham was the UK’s largest port by tonnage in 2011. The top three ports remained the same as in 2010.
Liquid bulk traffic accounted for 46 per cent of the total port traffic; dry bulks 20 per cent, container and roll-on/roll-off (ro-ro) traffic 30 per cent and other cargo 4 per cent.
Unitised freight traffic (Tables TSGB0504 to 0507)
Unitised traffic forms part of the freight traffic described above. In 2011 UK major ports handled 11.8 million main freight units (containers, road goods vehicles, unaccompanied trailers and shipborne port-to-port trailers/barges), 1.4 per cent lower than in 2010. These units carried 149 million tonnes of goods, up 2 per cent on the previous year.
The number of lo-lo containers through UK major ports totalled 4.9 million units (58 million tonnes) in 2011. This represents a 1 per cent decrease in units between 2010 and 2011.
Road goods vehicles and unaccompanied trailers decreased by 2 per cent to 6.2 million units (79 million tonnes). The latest figure represents an 11 per cent increase in units since 2001.
https://www.gov.uk/government/statistical-data-sets/tsgb05-maritime 122
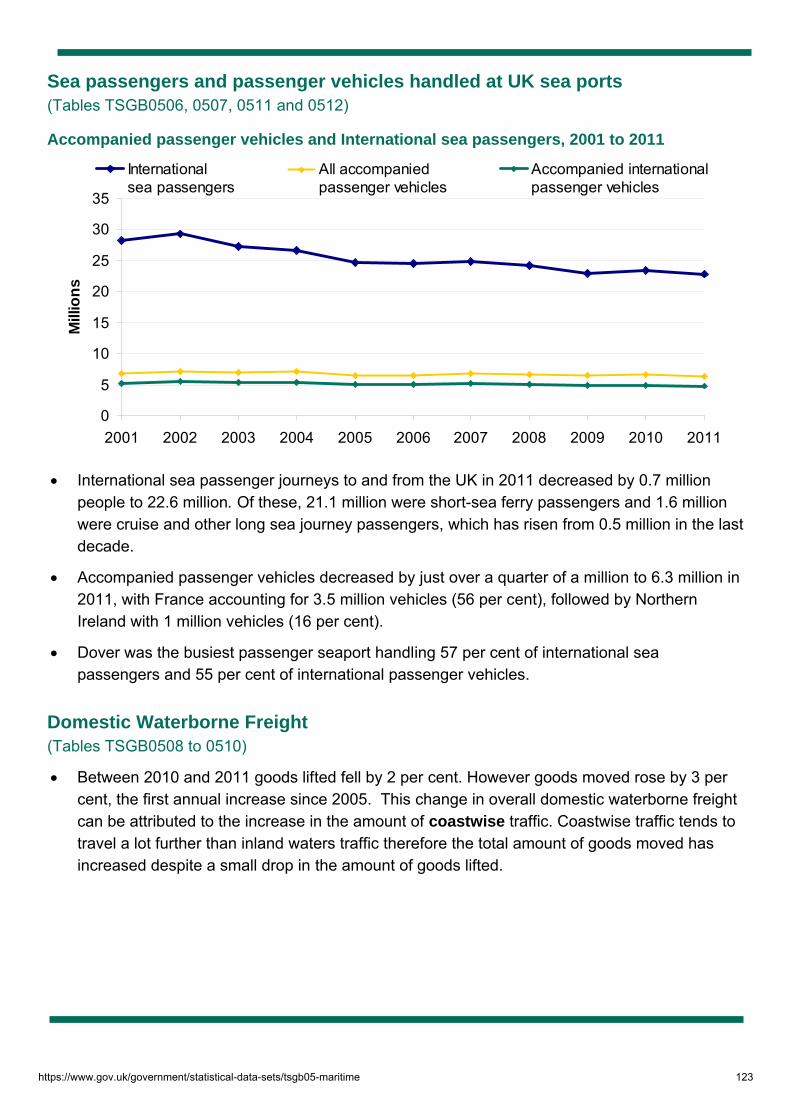
Sea passengers and passenger vehicles handled at UK sea ports (Tables TSGB0506, 0507, 0511 and 0512)
Accompanied passenger vehicles and International sea passengers, 2001 to 2011
0
5
10
15
20
25
30
35
2001 2002 2003 2004 2005 2006 2007 2008 2009 2010 2011
Mill
ion
s
International sea passengers
All accompanied passenger vehicles
Accompanied international passenger vehicles
International sea passenger journeys to and from the UK in 2011 decreased by 0.7 million people to 22.6 million. Of these, 21.1 million were short-sea ferry passengers and 1.6 million were cruise and other long sea journey passengers, which has risen from 0.5 million in the last decade.
Accompanied passenger vehicles decreased by just over a quarter of a million to 6.3 million in 2011, with France accounting for 3.5 million vehicles (56 per cent), followed by Northern Ireland with 1 million vehicles (16 per cent).
Dover was the busiest passenger seaport handling 57 per cent of international sea passengers and 55 per cent of international passenger vehicles.
Domestic Waterborne Freight (Tables TSGB0508 to 0510)
Between 2010 and 2011 goods lifted fell by 2 per cent. However goods moved rose by 3 per cent, the first annual increase since 2005. This change in overall domestic waterborne freight can be attributed to the increase in the amount of coastwise traffic. Coastwise traffic tends to travel a lot further than inland waters traffic therefore the total amount of goods moved has increased despite a small drop in the amount of goods lifted.
https://www.gov.uk/government/statistical-data-sets/tsgb05-maritime 123

Domestic Waterborne Freight, goods lifted, 2001-2011
0
20
40
60
80
100
120
140
160
2001
2002
2003
2004
2005
2006
2007
2008
2009
2010
2011
Mil
lio
n t
on
nes
Inland w aters Coastw ise One-port Total
Domestic Waterborne Freight, goods moved, 2001-2011
0
10
20
30
40
50
60
70
80
2001
2002
2003
2004
2005
2006
2007
2008
2009
2010
2011
Bill
ion
to
nn
e-k
m
Inland w aters Coastw ise One-port Total
In 2011 traffi c on UK inland waters was stable co mpared to 2010, wi th 43.9 million tonnes lifted and 1.4 billion tonne-kilometres moved. The River Thames remains the busiest inland waterway.
Despite a steady decline since 2002, there was an increase in one-port traffic (i.e. to and from offshore installations and sea dredging) in 2011 of 6 per cent. from 20.3 million tonnes lifted in 2010 to 21.6 million tonnes lifted in 2011
https://www.gov.uk/government/statistical-data-sets/tsgb05-maritime 124

Shipping Statistics (Tables TSGB0513 to 0518)
UK and Crown Dependency registered and UK owned trading vessels over 500 gross tons2 (gt), 2001 – 2011
0
5
10
15
20
25
30
35
40
45
2001 2002 2003 2004 2005 2006 2007 2008 2009* 2010 2011
Mill
ion
dead
wei
ght t
onne
s
UK and Crown Dependency registered trading vessels over 500gtUK owned trading vessels over 500gt
* Definition for w hat constitutes a trading vessel changed in 2009
The deadweight tonnage3 (dwt) of UK and Crown Dependency registered4 vessels over 500gt has increased by 190 per cent since 2001, from 13.6 million dwt to 39.6 million dwt in 2009.
Ships on the UK register need not be owned by UK interests, and vice versa. UK owned trading vessel deadweight tonnage has nearly doubled over the previous ten years, from 12 million in 2001 to 22.5 million in 2011.
Background notes
1. Full guidance on the methods used to compile these statistics and their sources can be found on the TSGB Chapter 5 - Maritime Page.
2. Gross tonnage. A measure of vessel size representing the total of all the enclosed spaces of the vessel obtained by means of a formula, which has as its basis the volume in cubic metres.
3. The deadweight tonnage is the total weight of cargo, fuel, fresh water, stores and crew which the ship can carry when immersed to her (usually summer) load line.
4. The UK registered vessels includes those registered under the Crown Dependencies (Channel Islands and the Isle of Man)
https://www.gov.uk/government/statistical-data-sets/tsgb05-maritime 125
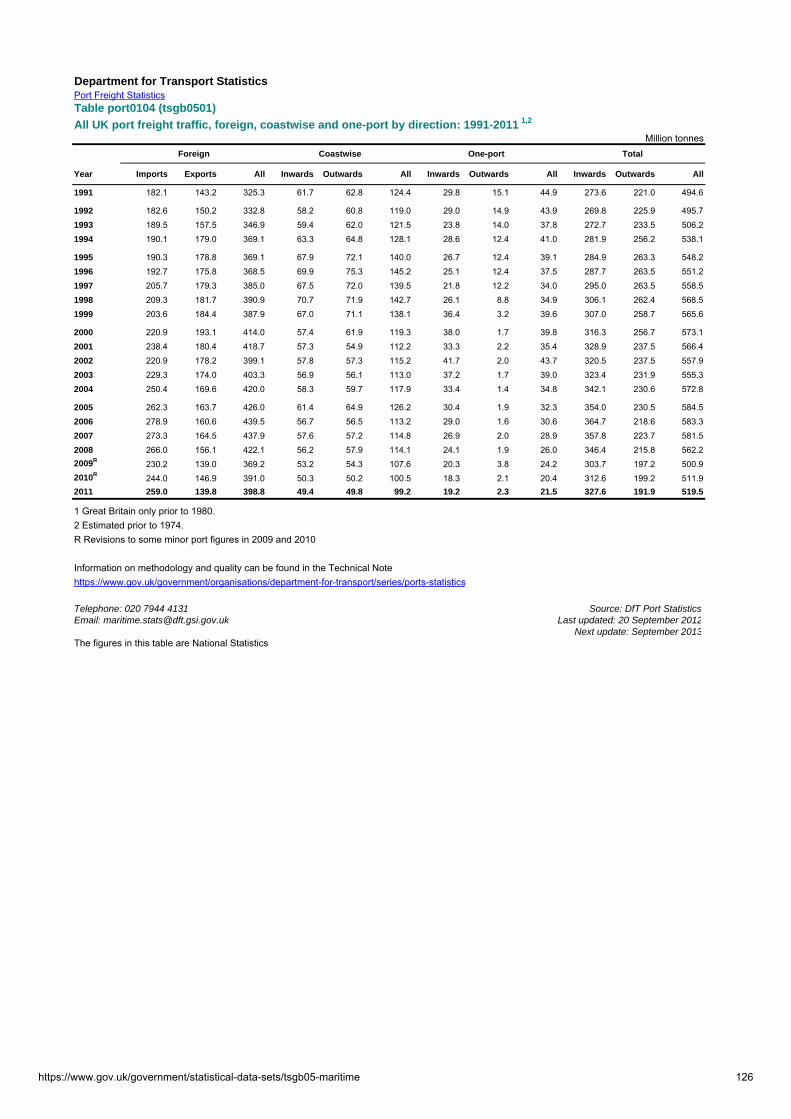
Department for Transport StatisticsPort Freight StatisticsTable port0104 (tsgb0501)
All UK port freight traffic, foreign, coastwise and one-port by direction: 1991-2011 1,2
Million tonnesForeign Coastwise One-port Total
Year Imports Exports All Inwards Outwards All Inwards Outwards All Inwards Outwards All
1991 182.1 143.2 325.3 61.7 62.8 124.4 29.8 15.1 44.9 273.6 221.0 494.6
1992 182.6 150.2 332.8 58.2 60.8 119.0 29.0 14.9 43.9 269.8 225.9 495.71993 189.5 157.5 346.9 59.4 62.0 121.5 23.8 14.0 37.8 272.7 233.5 506.21994 190.1 179.0 369.1 63.3 64.8 128.1 28.6 12.4 41.0 281.9 256.2 538.1
1995 190.3 178.8 369.1 67.9 72.1 140.0 26.7 12.4 39.1 284.9 263.3 548.21996 192.7 175.8 368.5 69.9 75.3 145.2 25.1 12.4 37.5 287.7 263.5 551.21997 205.7 179.3 385.0 67.5 72.0 139.5 21.8 12.2 34.0 295.0 263.5 558.51998 209.3 181.7 390.9 70.7 71.9 142.7 26.1 8.8 34.9 306.1 262.4 568.51999 203.6 184.4 387.9 67.0 71.1 138.1 36.4 3.2 39.6 307.0 258.7 565.6
2000 220.9 193.1 414.0 57.4 61.9 119.3 38.0 1.7 39.8 316.3 256.7 573.12001 238.4 180.4 418.7 57.3 54.9 112.2 33.3 2.2 35.4 328.9 237.5 566.42002 220.9 178.2 399.1 57.8 57.3 115.2 41.7 2.0 43.7 320.5 237.5 557.92003 229.3 174.0 403.3 56.9 56.1 113.0 37.2 1.7 39.0 323.4 231.9 555.32004 250.4 169.6 420.0 58.3 59.7 117.9 33.4 1.4 34.8 342.1 230.6 572.8
2005 262.3 163.7 426.0 61.4 64.9 126.2 30.4 1.9 32.3 354.0 230.5 584.52006 278.9 160.6 439.5 56.7 56.5 113.2 29.0 1.6 30.6 364.7 218.6 583.32007 273.3 164.5 437.9 57.6 57.2 114.8 26.9 2.0 28.9 357.8 223.7 581.52008 266.0 156.1 422.1 56.2 57.9 114.1 24.1 1.9 26.0 346.4 215.8 562.22009R 230.2 139.0 369.2 53.2 54.3 107.6 20.3 3.8 24.2 303.7 197.2 500.92010R 244.0 146.9 391.0 50.3 50.2 100.5 18.3 2.1 20.4 312.6 199.2 511.92011 259.0 139.8 398.8 49.4 49.8 99.2 19.2 2.3 21.5 327.6 191.9 519.5
1 Great Britain only prior to 1980.2 Estimated prior to 1974.R Revisions to some minor port figures in 2009 and 2010
Information on methodology and quality can be found in the Technical Notehttps://www.gov.uk/government/organisations/department-for-transport/series/ports-statistics
Telephone: 020 7944 4131 Source: DfT Port StatisticsEmail: [email protected] Last updated: 20 September 2012
Next update: September 2013The figures in this table are National Statistics
https://www.gov.uk/government/statistical-data-sets/tsgb05-maritime 126
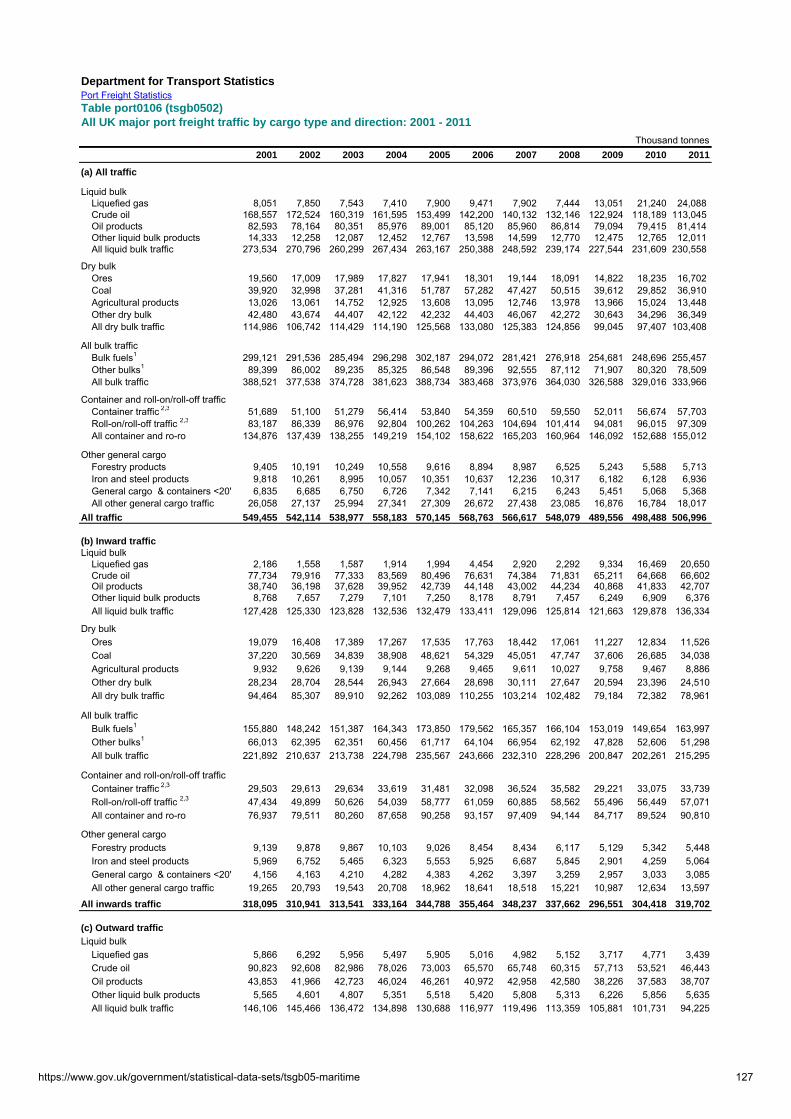
Department for Transport StatisticsPort Freight StatisticsTable port0106 (tsgb0502)All UK major port freight traffic by cargo type and direction: 2001 - 2011
Thousand tonnes2001 2002 2003 2004 2005 2006 2007 2008 2009 2010 2011
(a) All traffic
Liquid bulk Liquefied gas 8,051 7,850 7,543 7,410 7,900 9,471 7,902 7,444 13,051 21,240 24,088 Crude oil 168,557 172,524 160,319 161,595 153,499 142,200 140,132 132,146 122,924 118,189 113,045 Oil products 82,593 78,164 80,351 85,976 89,001 85,120 85,960 86,814 79,094 79,415 81,414 Other liquid bulk products 14,333 12,258 12,087 12,452 12,767 13,598 14,599 12,770 12,475 12,765 12,011 All liquid bulk traffic 273,534 270,796 260,299 267,434 263,167 250,388 248,592 239,174 227,544 231,609 230,558
Dry bulk Ores 19,560 17,009 17,989 17,827 17,941 18,301 19,144 18,091 14,822 18,235 16,702 Coal 39,920 32,998 37,281 41,316 51,787 57,282 47,427 50,515 39,612 29,852 36,910 Agricultural products 13,026 13,061 14,752 12,925 13,608 13,095 12,746 13,978 13,966 15,024 13,448 Other dry bulk 42,480 43,674 44,407 42,122 42,232 44,403 46,067 42,272 30,643 34,296 36,349 All dry bulk traffic 114,986 106,742 114,429 114,190 125,568 133,080 125,383 124,856 99,045 97,407 103,408
All bulk traffic Bulk fuels1 299,121 291,536 285,494 296,298 302,187 294,072 281,421 276,918 254,681 248,696 255,457 Other bulks1 89,399 86,002 89,235 85,325 86,548 89,396 92,555 87,112 71,907 80,320 78,509 All bulk traffic 388,521 377,538 374,728 381,623 388,734 383,468 373,976 364,030 326,588 329,016 333,966
Container and roll-on/roll-off traffic Container traffic 2,3 51,689 51,100 51,279 56,414 53,840 54,359 60,510 59,550 52,011 56,674 57,703 Roll-on/roll-off traffic 2,3 83,187 86,339 86,976 92,804 100,262 104,263 104,694 101,414 94,081 96,015 97,309 All container and ro-ro 134,876 137,439 138,255 149,219 154,102 158,622 165,203 160,964 146,092 152,688 155,012
Other general cargo Forestry products 9,405 10,191 10,249 10,558 9,616 8,894 8,987 6,525 5,243 5,588 5,713 Iron and steel products 9,818 10,261 8,995 10,057 10,351 10,637 12,236 10,317 6,182 6,128 6,936 General cargo & containers <20' 6,835 6,685 6,750 6,726 7,342 7,141 6,215 6,243 5,451 5,068 5,368 All other general cargo traffic 26,058 27,137 25,994 27,341 27,309 26,672 27,438 23,085 16,876 16,784 18,017All traffic 549,455 542,114 538,977 558,183 570,145 568,763 566,617 548,079 489,556 498,488 506,996
(b) Inward trafficLiquid bulk Liquefied gas 2,186 1,558 1,587 1,914 1,994 4,454 2,920 2,292 9,334 16,469 20,650 Crude oil 77,734 79,916 77,333 83,569 80,496 76,631 74,384 71,831 65,211 64,668 66,602 Oil products 38,740 36,198 37,628 39,952 42,739 44,148 43,002 44,234 40,868 41,833 42,707 Other liquid bulk products 8,768 7,657 7,279 7,101 7,250 8,178 8,791 7,457 6,249 6,909 6,376 All liquid bulk traffic 127,428 125,330 123,828 132,536 132,479 133,411 129,096 125,814 121,663 129,878 136,334
Dry bulk Ores 19,079 16,408 17,389 17,267 17,535 17,763 18,442 17,061 11,227 12,834 11,526 Coal 37,220 30,569 34,839 38,908 48,621 54,329 45,051 47,747 37,606 26,685 34,038 Agricultural products 9,932 9,626 9,139 9,144 9,268 9,465 9,611 10,027 9,758 9,467 8,886 Other dry bulk 28,234 28,704 28,544 26,943 27,664 28,698 30,111 27,647 20,594 23,396 24,510 All dry bulk traffic 94,464 85,307 89,910 92,262 103,089 110,255 103,214 102,482 79,184 72,382 78,961
All bulk traffic Bulk fuels1 155,880 148,242 151,387 164,343 173,850 179,562 165,357 166,104 153,019 149,654 163,997 Other bulks1 66,013 62,395 62,351 60,456 61,717 64,104 66,954 62,192 47,828 52,606 51,298 All bulk traffic 221,892 210,637 213,738 224,798 235,567 243,666 232,310 228,296 200,847 202,261 215,295
Container and roll-on/roll-off traffic Container traffic 2,3 29,503 29,613 29,634 33,619 31,481 32,098 36,524 35,582 29,221 33,075 33,739 Roll-on/roll-off traffic 2,3 47,434 49,899 50,626 54,039 58,777 61,059 60,885 58,562 55,496 56,449 57,071 All container and ro-ro 76,937 79,511 80,260 87,658 90,258 93,157 97,409 94,144 84,717 89,524 90,810
Other general cargo Forestry products 9,139 9,878 9,867 10,103 9,026 8,454 8,434 6,117 5,129 5,342 5,448 Iron and steel products 5,969 6,752 5,465 6,323 5,553 5,925 6,687 5,845 2,901 4,259 5,064 General cargo & containers <20' 4,156 4,163 4,210 4,282 4,383 4,262 3,397 3,259 2,957 3,033 3,085 All other general cargo traffic 19,265 20,793 19,543 20,708 18,962 18,641 18,518 15,221 10,987 12,634 13,597
All inwards traffic 318,095 310,941 313,541 333,164 344,788 355,464 348,237 337,662 296,551 304,418 319,702
(c) Outward traffic
Liquid bulk Liquefied gas 5,866 6,292 5,956 5,497 5,905 5,016 4,982 5,152 3,717 4,771 3,439 Crude oil 90,823 92,608 82,986 78,026 73,003 65,570 65,748 60,315 57,713 53,521 46,443 Oil products 43,853 41,966 42,723 46,024 46,261 40,972 42,958 42,580 38,226 37,583 38,707 Other liquid bulk products 5,565 4,601 4,807 5,351 5,518 5,420 5,808 5,313 6,226 5,856 5,635 All liquid bulk traffic 146,106 145,466 136,472 134,898 130,688 116,977 119,496 113,359 105,881 101,731 94,225
https://www.gov.uk/government/statistical-data-sets/tsgb05-maritime 127

All UK major port freight traffic by cargo type and direction: 2001 - 2011
Thousand tonnes2001 2002 2003 2004 2005 2006 2007 2008 2009 2010 2011
Dry bulk Ores 481 601 600 559 405 538 702 1,030 3,595 5,401 5,176 Coal 2,700 2,429 2,442 2,408 3,167 2,953 2,376 2,768 2,007 3,167 2,871 Agricultural products 3,094 3,435 5,613 3,780 4,340 3,630 3,135 3,950 4,209 5,557 4,561 Other dry bulk 14,247 14,970 15,864 15,179 14,568 15,705 15,956 14,625 10,050 10,899 11,839 All dry bulk traffic 20,522 21,435 24,519 21,927 22,479 22,825 22,169 22,374 19,860 25,025 24,447
All bulk traffic Bulk fuels1 143,242 143,294 134,107 131,955 128,336 114,510 116,064 110,814 101,662 99,042 91,460 Other bulks1 23,386 23,607 26,884 24,870 24,830 25,292 25,601 24,919 24,079 27,714 27,211 All bulk traffic 166,628 166,901 160,990 156,825 153,167 139,802 141,665 135,733 125,741 126,756 118,672
Container and roll-on/roll-off traffic Container traffic 2,3 22,186 21,487 21,645 22,796 22,359 22,261 23,986 23,968 22,789 23,599 23,964 Roll-on/roll-off traffic 2,3 35,753 36,440 36,350 38,765 41,485 43,204 43,808 42,852 38,585 39,566 40,238 All container and ro-ro 57,939 57,927 57,995 61,561 63,844 65,465 67,795 66,820 61,374 63,165 64,202
Other general cargo Forestry products 266 313 382 454 590 440 553 408 113 246 265 Iron and steel products 3,849 3,509 3,530 3,735 4,798 4,712 5,550 4,472 3,281 1,869 1,872 General cargo & containers <20' 2,679 2,522 2,540 2,444 2,959 2,879 2,818 2,984 2,494 2,034 2,283 All other general cargo traffic 6,793 6,344 6,451 6,633 8,347 8,032 8,921 7,864 5,889 4,149 4,420All outwards traffic 231,360 231,173 225,436 225,019 225,357 213,299 218,380 210,417 193,005 194,070 187,294
1 Dry bulk oil products included in other bulks2 Containers carried on by shipborne port to port trailers included in Roll-on/Roll-off traffic3 Figures after 2004 are not directly comparable with earlier years. Please see Section 2 of the Technical Note (link below) for details
Information on methodology and quality can be found in the Technical Note:https://www.gov.uk/government/organisations/department-for-transport/series/ports-statistics
Source: DfT Port StatisticsTelephone: 020 7944 4131 Last updated: 20 September 2012Email: [email protected] Next update: September 2013
The figures in this table are National Statistics
https://www.gov.uk/government/statistical-data-sets/tsgb05-maritime 128

Dep
artm
ent
for
Tra
nsp
ort
Sta
tist
ics
Por
t Fre
ight
Sta
tistic
sT
able
po
rt01
03 (
tsg
b05
03)
All
UK
po
rt f
reig
ht
traf
fic
by
reg
ion
an
d c
ou
ntr
y: 2
008
- 20
11Th
ousa
nd to
nnes
2008
2009
R
2010
R
2011
Reg
ion
InO
ut
All
InO
ut
All
InO
ut
All
InO
ut
All
Nor
th E
ast
23,3
9029
,930
53,3
2017
,908
26,6
7044
,578
15,4
4825
,233
40,6
8118
,683
23,9
8142
,665
Nor
th W
est
30,6
6114
,804
45,4
6528
,304
13,7
9842
,102
28,5
8414
,487
43,0
7131
,280
14,4
3945
,719
Yor
kshi
re a
nd T
he H
umbe
r71
,706
19,5
3291
,238
59,3
9617
,475
76,8
7259
,518
17,3
2176
,839
62,6
5617
,357
80,0
13E
ast M
idla
nds
1,00
448
71,
491
765
377
1,14
290
548
91,
394
884
384
1,26
8W
est M
idla
nds
--
--
--
--
--
--
Eas
t of E
ngla
nd 2
52,3
2820
,198
72,5
2747
,955
18,8
5666
,811
51,5
7320
,836
72,4
0851
,801
19,9
3571
,737
o
f whi
ch P
ort o
f Lon
don
31,4
817,
559
39,0
4129
,021
6,06
635
,087
31,0
177,
481
38,4
9730
,295
7,12
237
,418
Lond
on1
6,49
795
67,
453
5,77
670
16,
478
5,43
478
26,
216
6,34
986
47,
212
Sou
th E
ast 2
65,9
9630
,284
96,2
8060
,139
27,7
8587
,924
59,9
4829
,538
89,4
8661
,855
28,7
6090
,615
o
f whi
ch P
ort o
f Lon
don
5,88
658
66,
472
3,77
110
63,
877
3,34
73
3,34
94,
164
24,
166
Sou
th W
est
14,6
554,
106
18,7
6111
,661
3,22
514
,886
9,81
83,
473
13,2
9110
,657
3,43
214
,089
Eng
land
266,
236
120,
298
386,
534
231,
904
108,
888
340,
792
231,
227
112,
158
343,
386
244,
164
109,
153
353,
318
Wal
es36
,248
19,5
4255
,790
34,7
7918
,944
53,7
2342
,118
18,6
2360
,741
44,6
7720
,836
65,5
13S
cotla
nd 2
8,02
468
,322
96,3
4623
,280
62,2
9985
,580
24,4
4460
,374
84,8
1824
,276
53,1
3777
,413
Gre
at B
ritai
n33
0,50
820
8,16
153
8,66
928
9,96
419
0,13
148
0,09
529
7,78
919
1,15
548
8,94
431
3,11
818
3,12
549
6,24
3
Nor
ther
n Ire
land
15,8
607,
638
23,4
9713
,743
7,04
320
,786
14,8
378,
074
22,9
1114
,465
8,78
723
,252
Un
ited
Kin
gd
om
346,
368
215,
798
562,
166
303,
706
197,
174
500,
881
312,
626
199,
229
511,
855
327,
582
191,
912
519,
495
2 P
rior t
o 20
04, E
ast o
f En g
land
traf
fic a
nd S
outh
Eas
t tra
ffic
does
not
incl
ude
traffi
c th
roug
h po
rts in
thes
e re
gion
s th
at a
re p
art o
f the
Por
t of L
ondo
nR
Rev
isio
ns to
som
e m
inor
por
t fig
ures
for 2
009
and
2010
Info
rmat
ion
on m
etho
dolo
gy a
nd q
ualit
y ca
n be
foun
d in
the
Tech
nica
l Not
e:ht
tps:
//ww
w.g
ov.u
k/go
vern
men
t/org
anis
atio
ns/d
epar
tmen
t-for
-tran
spor
t/ser
ies/
ports
-sta
tistic
sS
ourc
e: D
fT P
ort S
tatis
tics
Tel
epho
ne: 0
20 7
944
4131
Last
upd
ated
: 20
Sep
tem
ber
2012
Em
ail:
mar
itim
e.st
ats@
dft.g
si.g
ov.u
kN
ext u
pdat
e: S
epte
mbe
r 20
13
The
figur
es in
this
tabl
e ar
e N
atio
nal S
tatis
tics
1 P
rior t
o 20
04, L
ondo
n tra
ffic
incl
udes
all
traffi
c th
roug
h th
e P
ort o
f Lon
don.
Thi
s w
ill in
clud
e tra
ffic
thro
ugh
som
e po
rts in
the
Sou
th E
ast a
nd E
ast o
f Eng
land
Reg
ions
https://www.gov.uk/government/statistical-data-sets/tsgb05-maritime 129

Department for Transport StatisticsPort Freight StatisticsTable port0203 (tsgb0504)
All UK ports unitised freight traffic, by type of freight unit: 2001 - 2011 1
Thousand units
Units 2001 2002 2003 2004 2005 2006 2007 2008 2009 2010 2011
Containers on Lo-Lo and conventional services 2,3. Includes all containers to 1988 4,464 4,506 4,533 4,919 4,754 4,883 5,381 5,269 4,482 4,961 4,927
Containers on Ro-Ro services2
Road goods vehicles (includes unaccompanied trailers to 1981) 3,317 3,479 3,547 3,857 3,906 4,183 4,295 4,305 3,874 3,651 3,549Unaccompanied trailers 2,687 2,760 2,781 2,734 2,840 2,944 2,989 2,737 2,634 2,754 2,723
Rail wagons, shipborne port-to-port trailers & barges 2,3 344 348 374 383 665 668 744 657 676 725 728
All main freight units 10,811 11,094 11,235 11,893 12,165 12,678 13,408 12,968 11,667 12,091 11,927
Other unitised freight: Import/export vehicles 3,313 3,662 3,736 3,953 3,978 3,906 4,022 3,592 2,803 3,263 3,428
Other units 225 167 163 145 208 186 244 145 111 121 75
All freight units 14,349 14,923 15,133 15,991 16,351 16,770 17,674 16,705 14,581 15,475 15,431
Thousand tonnes of goods
Tonnage 2001 2002 2003 2004 2005 2006 2007 2008 2009 2010 2011
Containers on Lo-Lo and conventional services 2,3. Includes all containers to 1988 51,814 51,178 51,413 56,502 53,949 54,493 60,718 59,734 52,266 56,896 57,959
Containers on Ro-Ro services2
Road goods vehicles (includes unaccompanied trailers to 1981) 37,706 39,119 38,759 42,896 44,854 46,592 48,233 48,694 44,397 42,545 42,509
Unaccompanied trailers 35,678 36,843 37,361 38,087 38,600 39,658 38,534 36,114 34,241 37,210 38,534Rail wagons, shipborne port-to-port trailers & barges 2,3 4,846 5,294 5,505 5,483 10,064 10,837 11,099 10,800 11,023 11,209 11,384
All main freight units 130,043 132,434 133,038 142,969 147,468 151,580 158,583 155,342 141,928 147,860 150,386
Other unitised freight: Import/export vehicles 4,023 4,693 4,839 5,268 5,400 5,566 5,932 5,144 4,004 4,708 5,288
Other units 1,849 1,437 1,497 1,433 1,513 1,803 1,641 1,463 1,167 1,172 367
All freight units 135,915 138,565 139,374 149,669 154,381 158,949 166,156 161,948 147,099 153,740 156,041
1 Includes estimates for traffic at minor ports.2 Containers carried on Ro-Ro vessels by shipborne port-to-port trailer are classified to 'rail wagons, shipborne port-to-port trailers and barges' or 'Lo-Lo and conventional services3 In 2005 more accurate recording of container/shipborne port-to-port trailer movements meant that the 2005 figures were not directly comparable with earlier years. It is estimated that approximately 300,000 container units, which in earlier years would have been reported as containers, were reported under 'rail wagons, shipborne port-to-port trailers and barges' in 2005 Please see Section 2 of the Technical Note for more details
Information on methodology and quality can be found in the Technical Note:https://www.gov.uk/government/organisations/department-for-transport/series/ports-statistics
Source: DfT Port StatisticsTelephone: 020 7944 4131 Last updated: 20 September 2012Email: [email protected] Next update: September 2013
The figures in this table are National Statistics
https://www.gov.uk/government/statistical-data-sets/tsgb05-maritime 130
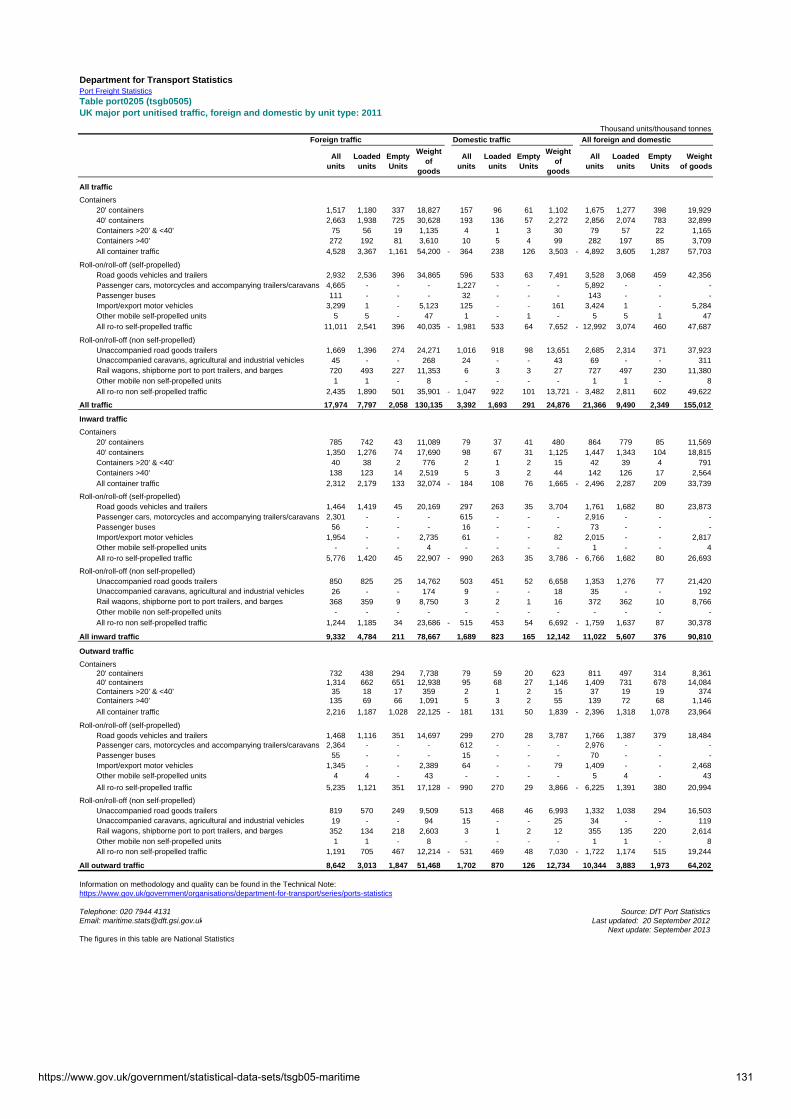
Department for Transport StatisticsPort Freight Statistics
Table port0205 (tsgb0505)UK major port unitised traffic, foreign and domestic by unit type: 2011
Thousand units/thousand tonnes
Foreign traffic Domestic traffic All foreign and domestic
All units
Loaded units
Empty Units
Weight of
goods
All units
Loaded units
Empty Units
Weight of
goods
All units
Loaded units
Empty Units
Weight of goods
All traffic
Containers 20' containers 1,517 1,180 337 18,827 157 96 61 1,102 1,675 1,277 398 19,929 40' containers 2,663 1,938 725 30,628 193 136 57 2,272 2,856 2,074 783 32,899 Containers >20' & <40' 75 56 19 1,135 4 1 3 30 79 57 22 1,165 Containers >40' 272 192 81 3,610 10 5 4 99 282 197 85 3,709
All container traffic 4,528 3,367 1,161 54,200 - 364 238 126 3,503 - 4,892 3,605 1,287 57,703
Roll-on/roll-off (self-propelled) Road goods vehicles and trailers 2,932 2,536 396 34,865 596 533 63 7,491 3,528 3,068 459 42,356 Passenger cars, motorcycles and accompanying trailers/caravans 4,665 - - - 1,227 - - - 5,892 - - - Passenger buses 111 - - - 32 - - - 143 - - - Import/export motor vehicles 3,299 1 - 5,123 125 - - 161 3,424 1 - 5,284 Other mobile self-propelled units 5 5 - 47 1 - 1 - 5 5 1 47
All ro-ro self-propelled traffic 11,011 2,541 396 40,035 - 1,981 533 64 7,652 - 12,992 3,074 460 47,687
Roll-on/roll-off (non self-propelled) Unaccompanied road goods trailers 1,669 1,396 274 24,271 1,016 918 98 13,651 2,685 2,314 371 37,923 Unaccompanied caravans, agricultural and industrial vehicles 45 - - 268 24 - - 43 69 - - 311 Rail wagons, shipborne port to port trailers, and barges 720 493 227 11,353 6 3 3 27 727 497 230 11,380 Other mobile non self-propelled units 1 1 - 8 - - - - 1 1 - 8
All ro-ro non self-propelled traffic 2,435 1,890 501 35,901 - 1,047 922 101 13,721 - 3,482 2,811 602 49,622
All traffic 17,974 7,797 2,058 130,135 3,392 1,693 291 24,876 21,366 9,490 2,349 155,012
Inward traffic
Containers 20' containers 785 742 43 11,089 79 37 41 480 864 779 85 11,569 40' containers 1,350 1,276 74 17,690 98 67 31 1,125 1,447 1,343 104 18,815 Containers >20' & <40' 40 38 2 776 2 1 2 15 42 39 4 791 Containers >40' 138 123 14 2,519 5 3 2 44 142 126 17 2,564
All container traffic 2,312 2,179 133 32,074 - 184 108 76 1,665 - 2,496 2,287 209 33,739
Roll-on/roll-off (self-propelled) Road goods vehicles and trailers 1,464 1,419 45 20,169 297 263 35 3,704 1,761 1,682 80 23,873 Passenger cars, motorcycles and accompanying trailers/caravans 2,301 - - - 615 - - - 2,916 - - - Passenger buses 56 - - - 16 - - - 73 - - - Import/export motor vehicles 1,954 - - 2,735 61 - - 82 2,015 - - 2,817 Other mobile self-propelled units - - - 4 - - - - 1 - - 4
All ro-ro self-propelled traffic 5,776 1,420 45 22,907 - 990 263 35 3,786 - 6,766 1,682 80 26,693
Roll-on/roll-off (non self-propelled) Unaccompanied road goods trailers 850 825 25 14,762 503 451 52 6,658 1,353 1,276 77 21,420 Unaccompanied caravans, agricultural and industrial vehicles 26 - - 174 9 - - 18 35 - - 192 Rail wagons, shipborne port to port trailers, and barges 368 359 9 8,750 3 2 1 16 372 362 10 8,766 Other mobile non self-propelled units - - - - - - - - - - - -
All ro-ro non self-propelled traffic 1,244 1,185 34 23,686 - 515 453 54 6,692 - 1,759 1,637 87 30,378
All inward traffic 9,332 4,784 211 78,667 1,689 823 165 12,142 11,022 5,607 376 90,810
Outward traffic
Containers 20' containers 732 438 294 7,738 79 59 20 623 811 497 314 8,361 40' containers 1,314 662 651 12,938 95 68 27 1,146 1,409 731 678 14,084 Containers >20' & <40' 35 18 17 359 2 1 2 15 37 19 19 374 Containers >40' 135 69 66 1,091 5 3 2 55 139 72 68 1,146
All container traffic 2,216 1,187 1,028 22,125 - 181 131 50 1,839 - 2,396 1,318 1,078 23,964
Roll-on/roll-off (self-propelled) Road goods vehicles and trailers 1,468 1,116 351 14,697 299 270 28 3,787 1,766 1,387 379 18,484 Passenger cars, motorcycles and accompanying trailers/caravans 2,364 - - - 612 - - - 2,976 - - - Passenger buses 55 - - - 15 - - - 70 - - - Import/export motor vehicles 1,345 - - 2,389 64 - - 79 1,409 - - 2,468 Other mobile self-propelled units 4 4 - 43 - - - - 5 4 - 43
All ro-ro self-propelled traffic 5,235 1,121 351 17,128 - 990 270 29 3,866 - 6,225 1,391 380 20,994
Roll-on/roll-off (non self-propelled) Unaccompanied road goods trailers 819 570 249 9,509 513 468 46 6,993 1,332 1,038 294 16,503 Unaccompanied caravans, agricultural and industrial vehicles 19 - - 94 15 - - 25 34 - - 119 Rail wagons, shipborne port to port trailers, and barges 352 134 218 2,603 3 1 2 12 355 135 220 2,614 Other mobile non self-propelled units 1 1 - 8 - - - - 1 1 - 8 All ro-ro non self-propelled traffic 1,191 705 467 12,214 - 531 469 48 7,030 - 1,722 1,174 515 19,244
All outward traffic 8,642 3,013 1,847 51,468 1,702 870 126 12,734 10,344 3,883 1,973 64,202
Information on methodology and quality can be found in the Technical Note:https://www.gov.uk/government/organisations/department-for-transport/series/ports-statistics
Telephone: 020 7944 4131 Source: DfT Port StatisticsEmail: [email protected] Last updated: 20 September 2012
Next update: September 2013The figures in this table are National Statistics
https://www.gov.uk/government/statistical-data-sets/tsgb05-maritime 131
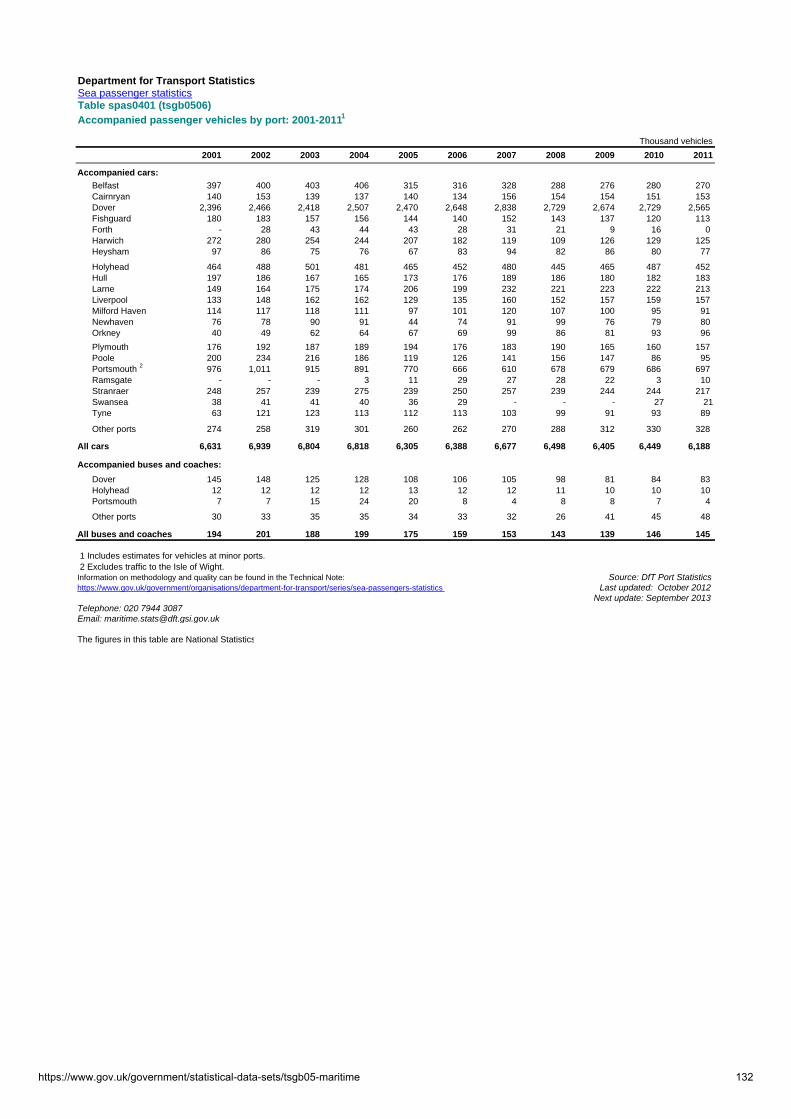
Department for Transport StatisticsSea passenger statisticsTable spas0401 (tsgb0506)Accompanied passenger vehicles by port: 2001-20111
Thousand vehicles
2001 2002 2003 2004 2005 2006 2007 2008 2009 2010 2011
Accompanied cars:
Belfast 397 400 403 406 315 316 328 288 276 280 270 Cairnryan 140 153 139 137 140 134 156 154 154 151 153 Dover 2,396 2,466 2,418 2,507 2,470 2,648 2,838 2,729 2,674 2,729 2,565 Fishguard 180 183 157 156 144 140 152 143 137 120 113 Forth - 28 43 44 43 28 31 21 9 16 0 Harwich 272 280 254 244 207 182 119 109 126 129 125 Heysham 97 86 75 76 67 83 94 82 86 80 77
Holyhead 464 488 501 481 465 452 480 445 465 487 452 Hull 197 186 167 165 173 176 189 186 180 182 183 Larne 149 164 175 174 206 199 232 221 223 222 213 Liverpool 133 148 162 162 129 135 160 152 157 159 157 Milford Haven 114 117 118 111 97 101 120 107 100 95 91 Newhaven 76 78 90 91 44 74 91 99 76 79 80 Orkney 40 49 62 64 67 69 99 86 81 93 96
Plymouth 176 192 187 189 194 176 183 190 165 160 157 Poole 200 234 216 186 119 126 141 156 147 86 95 Portsmouth 2 976 1,011 915 891 770 666 610 678 679 686 697 Ramsgate - - - 3 11 29 27 28 22 3 10 Stranraer 248 257 239 275 239 250 257 239 244 244 217 Swansea 38 41 41 40 36 29 - - - 27 21 Tyne 63 121 123 113 112 113 103 99 91 93 89
Other ports 274 258 319 301 260 262 270 288 312 330 328
All cars 6,631 6,939 6,804 6,818 6,305 6,388 6,677 6,498 6,405 6,449 6,188
Accompanied buses and coaches:
Dover 145 148 125 128 108 106 105 98 81 84 83 Holyhead 12 12 12 12 13 12 12 11 10 10 10 Portsmouth 7 7 15 24 20 8 4 8 8 7 4
Other ports 30 33 35 35 34 33 32 26 41 45 48
All buses and coaches 194 201 188 199 175 159 153 143 139 146 145
1 Includes estimates for vehicles at minor ports. 2 Excludes traffic to the Isle of Wight.Information on methodology and quality can be found in the Technical Note: Source: DfT Port Statisticshttps://www.gov.uk/government/organisations/department-for-transport/series/sea-passengers-statistics Last updated: October 2012
Next update: September 2013Telephone: 020 7944 3087Email: [email protected]
The figures in this table are National Statistics
https://www.gov.uk/government/statistical-data-sets/tsgb05-maritime 132

Department for Transport StatisticsSea passenger statisticsTable spas0402 (tsgb0507)
Accompanied passenger vehicles by route: 2001 - 2011 1
Thousand vehicles
2001 2002 2003 2004 2005 2006 2007 2008 2009 2010 2011
(a) Cars
Overseas route: Belgium 115 120 111 112 124 129 132 118 97 86 79 Denmark 26 27 22 23 21 48 26 21 26 25 24 France 3,619 3,727 3,669 3,720 3,449 3,563 3,734 3,712 3,585 3,563 3,435 Germany 27 32 19 24 23 - - - - - - Irish Republic 833 878 879 837 773 751 781 723 735 757 698 Netherlands 383 420 390 379 336 330 290 241 305 309 304 Scandinavia and Baltic 15 36 44 31 39 19 21 61 - 3 2 of which: Norway 6 15 29 9 20 9 21 61 - - - Sweden 8 20 15 21 18 10 - - - 1 1 Spain 93 104 80 81 94 85 88 95 103 123 122All overseas routes 5,111 5,344 5,213 5,207 4,861 4,927 5,072 4,972 4,850 4,867 4,666
Channel Tunnel 2 2,530 2,336 2,279 2,101 2,047 2,046 2,142 1,907 1,917 2,125 2,263
Coastwise route 3
Northern Ireland 4 1,078 1,082 1,104 1,138 1,054 1,007 1,089 1,026 1,024 1,021 978 Isle of Man 136 166 159 157 75 147 183 152 153 157 147 Orkneys & Shetlands 4 104 125 155 156 163 170 196 206 208 234 235 Channel Islands 162 179 128 111 104 90 89 94 103 101 95 Other 39 42 44 48 48 47 49 49 67 68 68All coastwise routes 3 1,520 1,594 1,591 1,611 1,444 1,461 1,605 1,526 1,555 1,581 1,522
All cars 6,631 6,939 6,804 6,818 6,305 6,388 6,677 6,498 6,405 6,448 6,188
(b) Buses and coaches
Overseas route: Belgium 2 1 4 4 4 3 4 3 2 3 3 Denmark - - - 1 - - - - - - - France 153 155 141 152 128 114 110 106 89 90 87 Germany - - - 1 - - - - - - - Irish Republic 16 17 16 16 17 15 15 14 12 13 12 Netherlands 6 8 7 5 8 7 7 5 5 7 7 Scandinavia and Baltic - 1 1 1 1 - - 1 - - - Spain 1 1 1 1 1 1 1 1 - 1 1
All overseas routes 178 183 169 181 159 142 137 131 109 113 111
Channel Tunnel 5 75 72 72 63 77 67 65 61 55 57 56
Coastwise route 3
Northern Ireland 4 14 16 17 17 15 15 15 10 28 30 31 Isle of Man 1 1 1 - - - - - - - - Orkneys & Shetlands 4 - - 1 1 1 1 1 2 2 2 3 Channel Islands - - - - - - - - - - - Other - - - - 1 - - - - - -
All coastwise routes 3 16 17 19 18 16 18 16 12 31 33 34All buses and coaches 194 201 188 199 175 159 153 143 139 146 145
1 Includes estimates for vehicles at minor ports.2 Passenger cars (including minibuses with up to 16 seats) on shuttles for comparison, but numbers not included in totals3 Excludes traffic to the Isle of Wight.4 Includes vehicles counted at ports at both GB mainland and island ends of routes.5 Passenger buses and coaches (excluding minibuses with less than 16 seats) on shuttles for comparison, but numbers not included in totals.Information on methodology and quality can be found in the Technical Note:https://www.gov.uk/government/organisations/department-for-transport/series/sea-passengers-statistics
Telephone: 020 7944 3087 Source: DfT Port StatisticsEmail: [email protected] Last updated: October 2012The figures in this table are National Statistics Next update: September 2013
https://www.gov.uk/government/statistical-data-sets/tsgb05-maritime 133

Department for Transport StatisticsDomestic Waterborne Freight StatisticsTable dwf0101 (tsgb0508)Waterborne transport within the United Kingdom, 2001-2011
a) Goods lifted Million tonnes
2001 2002 2003 2004 2005 2006 2007 2008 2009 2010 2011
UK inland waters traffic
Non-seagoing traffic Internal 4.3 4.0 3.2 2.6 3.4 3.6 3.4 3.7 3.3 2.9 3.0 Seagoing traffic (by route) Coastwise 8.8 6.8 7.4 7.2 8.6 8.5 8.0 7.7 6.6 6.0 6.4 Foreign 33.4 32.0 31.8 30.1 32.0 34.0 34.9 35.2 27.5 31.3 30.3 One-port 7.0 6.2 5.0 4.7 4.8 4.9 5.7 5.4 4.1 3.0 3.6
Total 53.5 49.0 47.4 44.6 48.7 51.0 52.0 51.9 41.4 43.3 43.3
Coastwise traffic between UK ports 58.5 59.5 58.5 59.8 65.1 58.1 58.8 58.1 54.6 51.3 49.0
One-port traffic of UK ports 35.1 43.7 39.0 34.8 32.3 30.6 28.9 26.0 24.1 20.3 21.6
All traffic 1 131.3 139.1 132.5 127.2 132.8 126.3 125.9 123.0 109.5 105.8 103.9
b) Goods moved Billion tonne-kilometres
2001 2002 2003 2004 2005 2006 2007 2008 2009 2010 2011
UK inland waters traffic
Non-seagoing traffic Internal 0.2 0.2 0.2 0.2 0.2 0.2 0.1 0.2 0.1 0.1 0.1 Seagoing traffic (by route) Coastwise 0.2 0.2 0.2 0.2 0.2 0.2 0.2 0.2 0.2 0.2 0.2 Foreign 1.1 1.1 1.0 1.0 1.1 1.1 1.2 1.1 0.8 1.0 0.9 One-port 0.3 0.3 0.2 0.2 0.2 0.2 0.2 0.2 0.2 0.1 0.1
Total 1.8 1.7 1.6 1.5 1.6 1.7 1.7 1.7 1.3 1.4 1.4
Coastwise traffic between UK ports 1 34 35 33 35 39 32 35 35 35 30 31.3
One-port traffic of UK ports 1 23.3 30.8 26.4 22.9 20.3 18.2 15.0 13.3 12.8 10.8 10.3
All traffic 1 58.8 67.2 60.9 59.4 60.9 51.8 50.8 49.7 48.6 41.9 43.0
1. The 'All traffic' figures in table 1(a) for all years and in table 1(b) from 2000 onwards are calculated by the addition of the totals for coastwise traffic and one-port traffic together with the internal and foreign components of inland waters traffic. See Technical Notes for more details.Technical NoteTelephone: 020 7944 2021 Source: DfT Port Statistics and Barge Survey
Email: [email protected] Last updated: December 2012
Next update: December 2013
The figures in this table are National Statistics
https://www.gov.uk/government/statistical-data-sets/tsgb05-maritime 134

tsgb0509
Principal ports, port groups and freight waterways
Telephone: 020 7944 2021Email: [email protected]
https://www.gov.uk/government/statistical-data-sets/tsgb05-maritime 135
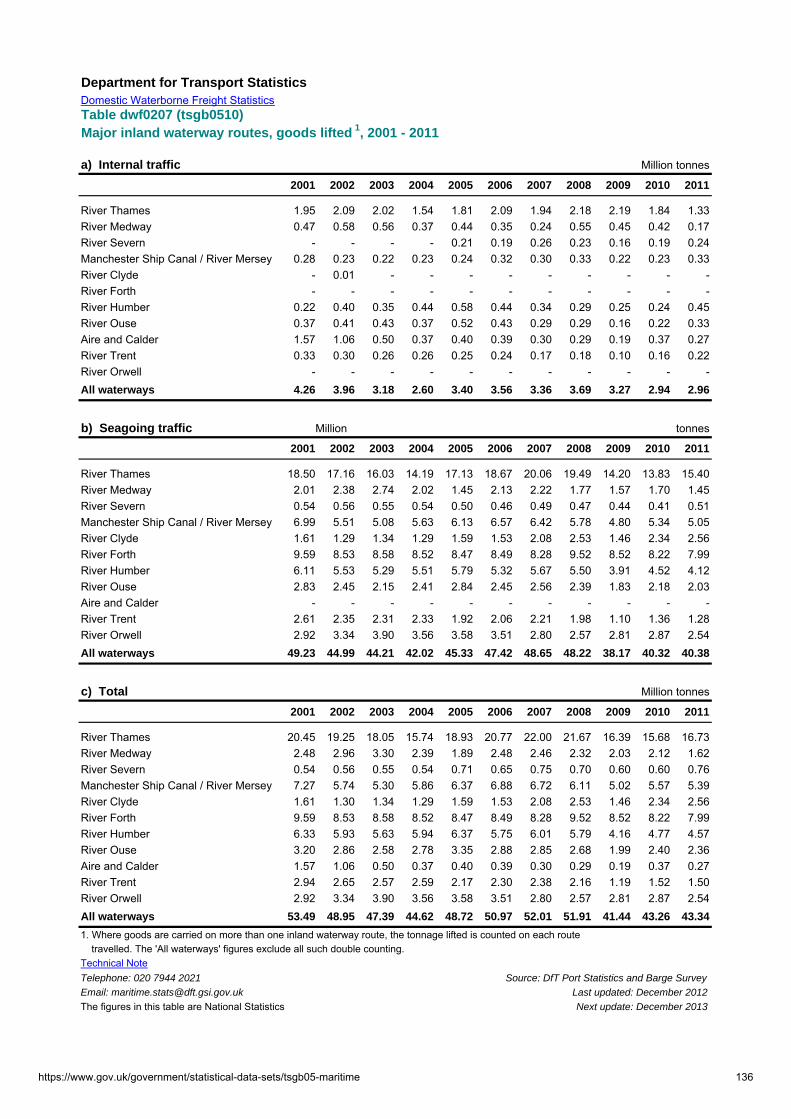
Department for Transport StatisticsDomestic Waterborne Freight StatisticsTable dwf0207 (tsgb0510)Major inland waterway routes, goods lifted 1, 2001 - 2011
a) Internal traffic Million tonnes
2001 2002 2003 2004 2005 2006 2007 2008 2009 2010 2011
River Thames 1.95 2.09 2.02 1.54 1.81 2.09 1.94 2.18 2.19 1.84 1.33River Medway 0.47 0.58 0.56 0.37 0.44 0.35 0.24 0.55 0.45 0.42 0.17River Severn - - - - 0.21 0.19 0.26 0.23 0.16 0.19 0.24Manchester Ship Canal / River Mersey 0.28 0.23 0.22 0.23 0.24 0.32 0.30 0.33 0.22 0.23 0.33River Clyde - 0.01 - - - - - - - - -River Forth - - - - - - - - - - -River Humber 0.22 0.40 0.35 0.44 0.58 0.44 0.34 0.29 0.25 0.24 0.45River Ouse 0.37 0.41 0.43 0.37 0.52 0.43 0.29 0.29 0.16 0.22 0.33Aire and Calder 1.57 1.06 0.50 0.37 0.40 0.39 0.30 0.29 0.19 0.37 0.27River Trent 0.33 0.30 0.26 0.26 0.25 0.24 0.17 0.18 0.10 0.16 0.22River Orwell - - - - - - - - - - -All waterways 4.26 3.96 3.18 2.60 3.40 3.56 3.36 3.69 3.27 2.94 2.96
b) Seagoing traffic Million tonnes
2001 2002 2003 2004 2005 2006 2007 2008 2009 2010 2011
River Thames 18.50 17.16 16.03 14.19 17.13 18.67 20.06 19.49 14.20 13.83 15.40River Medway 2.01 2.38 2.74 2.02 1.45 2.13 2.22 1.77 1.57 1.70 1.45River Severn 0.54 0.56 0.55 0.54 0.50 0.46 0.49 0.47 0.44 0.41 0.51Manchester Ship Canal / River Mersey 6.99 5.51 5.08 5.63 6.13 6.57 6.42 5.78 4.80 5.34 5.05River Clyde 1.61 1.29 1.34 1.29 1.59 1.53 2.08 2.53 1.46 2.34 2.56River Forth 9.59 8.53 8.58 8.52 8.47 8.49 8.28 9.52 8.52 8.22 7.99River Humber 6.11 5.53 5.29 5.51 5.79 5.32 5.67 5.50 3.91 4.52 4.12River Ouse 2.83 2.45 2.15 2.41 2.84 2.45 2.56 2.39 1.83 2.18 2.03Aire and Calder - - - - - - - - - - -River Trent 2.61 2.35 2.31 2.33 1.92 2.06 2.21 1.98 1.10 1.36 1.28River Orwell 2.92 3.34 3.90 3.56 3.58 3.51 2.80 2.57 2.81 2.87 2.54All waterways 49.23 44.99 44.21 42.02 45.33 47.42 48.65 48.22 38.17 40.32 40.38
c) Total Million tonnes
2001 2002 2003 2004 2005 2006 2007 2008 2009 2010 2011
River Thames 20.45 19.25 18.05 15.74 18.93 20.77 22.00 21.67 16.39 15.68 16.73River Medway 2.48 2.96 3.30 2.39 1.89 2.48 2.46 2.32 2.03 2.12 1.62River Severn 0.54 0.56 0.55 0.54 0.71 0.65 0.75 0.70 0.60 0.60 0.76Manchester Ship Canal / River Mersey 7.27 5.74 5.30 5.86 6.37 6.88 6.72 6.11 5.02 5.57 5.39River Clyde 1.61 1.30 1.34 1.29 1.59 1.53 2.08 2.53 1.46 2.34 2.56River Forth 9.59 8.53 8.58 8.52 8.47 8.49 8.28 9.52 8.52 8.22 7.99River Humber 6.33 5.93 5.63 5.94 6.37 5.75 6.01 5.79 4.16 4.77 4.57River Ouse 3.20 2.86 2.58 2.78 3.35 2.88 2.85 2.68 1.99 2.40 2.36Aire and Calder 1.57 1.06 0.50 0.37 0.40 0.39 0.30 0.29 0.19 0.37 0.27River Trent 2.94 2.65 2.57 2.59 2.17 2.30 2.38 2.16 1.19 1.52 1.50River Orwell 2.92 3.34 3.90 3.56 3.58 3.51 2.80 2.57 2.81 2.87 2.54All waterways 53.49 48.95 47.39 44.62 48.72 50.97 52.01 51.91 41.44 43.26 43.34
1. Where goods are carried on more than one inland waterway route, the tonnage lifted is counted on each route travelled. The 'All waterways' figures exclude all such double counting.Technical NoteTelephone: 020 7944 2021 Source: DfT Port Statistics and Barge Survey
Email: [email protected] Last updated: December 2012
The figures in this table are National Statistics Next update: December 2013
https://www.gov.uk/government/statistical-data-sets/tsgb05-maritime 136

Department for Transport StatisticsSea passenger statisticsTable spas103 (tsgb0511)
UK international short sea passenger movements by overseas country: 2001 - 2011
Thousands
2001 2002 2003 2004 2005 2006 2007 2008 2009 2010 2011
Belgium 1379 1129 740 739 778 748 751 676 566 614 495
Denmark 156 132 88 97 91 89 96 90 99 98 105
France 19485 20555 19077 18565 16834 16925 17377 16844 16,002 15,869 15,537
Germany 164 161 92 117 98 1 1 1 1 2 2
Irish Republic 1 3882 3880 3802 3656 3380 3221 3291 3069 2,930 3,102 2,921
Netherlands 2026 2209 2094 2002 1848 1897 1636 1667 1,685 1,794 1,792
Norway 230 241 235 231 200 149 153 120 1 1 1
Spain 355 341 308 310 378 372 357 370 340 401 293
Sweden 73 73 81 75 79 59 5 4 3 4 4
Others 4 3 7 7 8 6 1 - - - -
All short sea routes 27,753 28,726 26,523 25,799 23,693 23,465 23,668 22,840 21,626 21,883 21,149
1 Includes passengers between Irish Rep & IOM until 1982
Telephone: 020 7944 3087 Source: DfT Port Statistics
Email: [email protected] Last updated: February 2012
Next update: February 2013
The figures in this table are National Statistics
https://www.gov.uk/government/statistical-data-sets/tsgb05-maritime 137
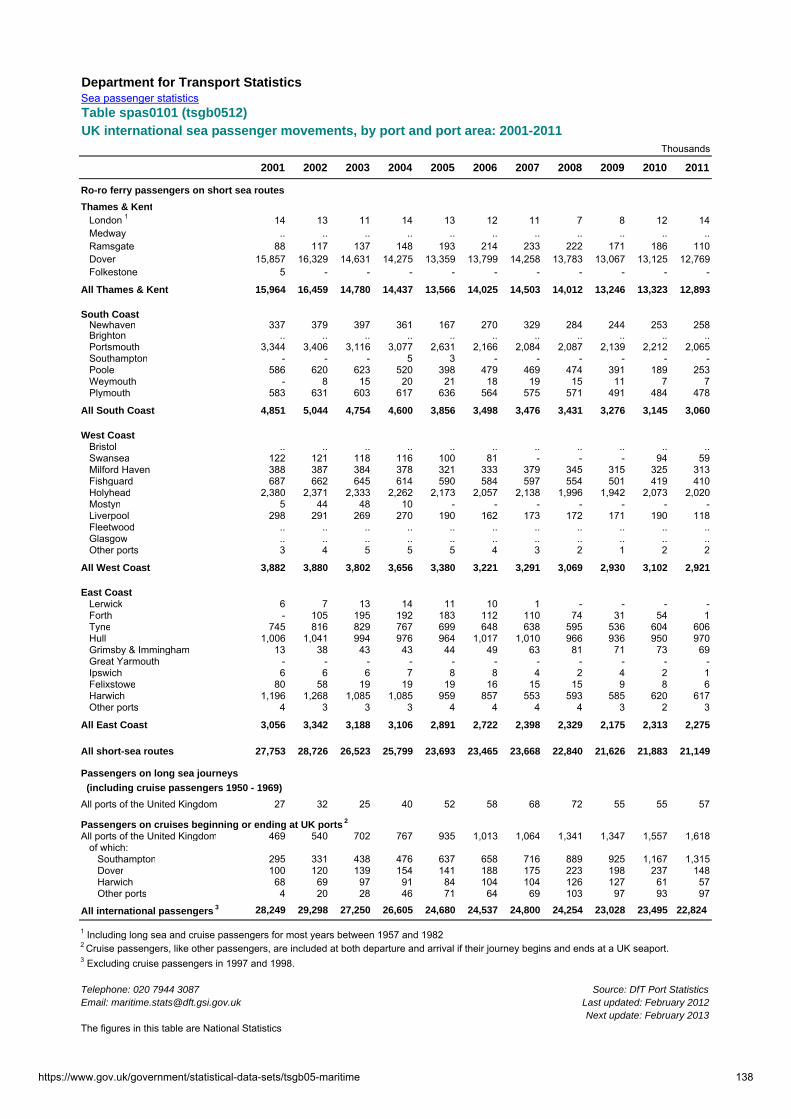
Department for Transport StatisticsSea passenger statisticsTable spas0101 (tsgb0512)
Thousands
2001 2002 2003 2004 2005 2006 2007 2008 2009 2010 2011
Ro-ro ferry passengers on short sea routes
Thames & Kent London 1 14 13 11 14 13 12 11 7 8 12 14 Medway .. .. .. .. .. .. .. .. .. .. .. Ramsgate 88 117 137 148 193 214 233 222 171 186 110 Dover 15,857 16,329 14,631 14,275 13,359 13,799 14,258 13,783 13,067 13,125 12,769 Folkestone 5 - - - - - - - - - -
All Thames & Kent 15,964 16,459 14,780 14,437 13,566 14,025 14,503 14,012 13,246 13,323 12,893
South Coast Newhaven 337 379 397 361 167 270 329 284 244 253 258 Brighton .. .. .. .. .. .. .. .. .. .. .. Portsmouth 3,344 3,406 3,116 3,077 2,631 2,166 2,084 2,087 2,139 2,212 2,065 Southampton - - - 5 3 - - - - - - Poole 586 620 623 520 398 479 469 474 391 189 253 Weymouth - 8 15 20 21 18 19 15 11 7 7 Plymouth 583 631 603 617 636 564 575 571 491 484 478
All South Coast 4,851 5,044 4,754 4,600 3,856 3,498 3,476 3,431 3,276 3,145 3,060
West Coast Bristol .. .. .. .. .. .. .. .. .. .. .. Swansea 122 121 118 116 100 81 - - - 94 59 Milford Haven 388 387 384 378 321 333 379 345 315 325 313 Fishguard 687 662 645 614 590 584 597 554 501 419 410 Holyhead 2,380 2,371 2,333 2,262 2,173 2,057 2,138 1,996 1,942 2,073 2,020 Mostyn 5 44 48 10 - - - - - - - Liverpool 298 291 269 270 190 162 173 172 171 190 118 Fleetwood .. .. .. .. .. .. .. .. .. .. .. Glasgow .. .. .. .. .. .. .. .. .. .. .. Other ports 3 4 5 5 5 4 3 2 1 2 2
All West Coast 3,882 3,880 3,802 3,656 3,380 3,221 3,291 3,069 2,930 3,102 2,921
East Coast Lerwick 6 7 13 14 11 10 1 - - - - Forth - 105 195 192 183 112 110 74 31 54 1 Tyne 745 816 829 767 699 648 638 595 536 604 606 Hull 1,006 1,041 994 976 964 1,017 1,010 966 936 950 970 Grimsby & Immingham 13 38 43 43 44 49 63 81 71 73 69 Great Yarmouth - - - - - - - - - - - Ipswich 6 6 6 7 8 8 4 2 4 2 1 Felixstowe 80 58 19 19 19 16 15 15 9 8 6 Harwich 1,196 1,268 1,085 1,085 959 857 553 593 585 620 617 Other ports 4 3 3 3 4 4 4 4 3 2 3
All East Coast 3,056 3,342 3,188 3,106 2,891 2,722 2,398 2,329 2,175 2,313 2,275
All short-sea routes 27,753 28,726 26,523 25,799 23,693 23,465 23,668 22,840 21,626 21,883 21,149
Passengers on long sea journeys
(including cruise passengers 1950 - 1969)
All ports of the United Kingdom 27 32 25 40 52 58 68 72 55 55 57
Passengers on cruises beginning or ending at UK ports 2
All ports of the United Kingdom 469 540 702 767 935 1,013 1,064 1,341 1,347 1,557 1,618 of which: Southampton 295 331 438 476 637 658 716 889 925 1,167 1,315 Dover 100 120 139 154 141 188 175 223 198 237 148 Harwich 68 69 97 91 84 104 104 126 127 61 57 Other ports 4 20 28 46 71 64 69 103 97 93 97
All international passengers 3 28,249 29,298 27,250 26,605 24,680 24,537 24,800 24,254 23,028 23,495 22,824
1 Including long sea and cruise passengers for most years between 1957 and 19822 Cruise passengers, like other passengers, are included at both departure and arrival if their journey begins and ends at a UK seaport.3 Excluding cruise passengers in 1997 and 1998.
Telephone: 020 7944 3087 Source: DfT Port StatisticsEmail: [email protected] Last updated: February 2012
Next update: February 2013The figures in this table are National Statistics
UK international sea passenger movements, by port and port area: 2001-2011
https://www.gov.uk/government/statistical-data-sets/tsgb05-maritime 138
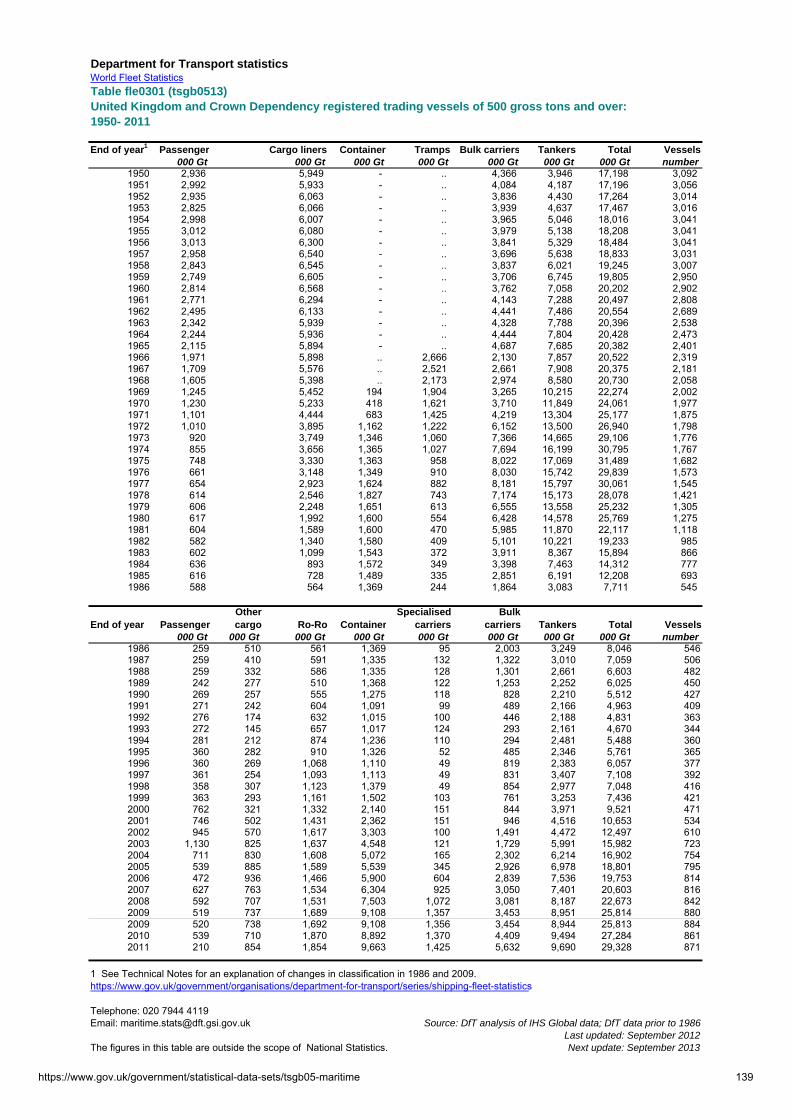
Department for Transport statisticsWorld Fleet StatisticsTable fle0301 (tsgb0513)United Kingdom and Crown Dependency registered trading vessels of 500 gross tons and over:1950- 2011
End of year1 Passenger Cargo liners Container Tramps Bulk carriers Tankers Total Vessels000 Gt 000 Gt 000 Gt 000 Gt 000 Gt 000 Gt 000 Gt number
1950 2,936 5,949 - .. 4,366 3,946 17,198 3,092 1951 2,992 5,933 - .. 4,084 4,187 17,196 3,056 1952 2,935 6,063 - .. 3,836 4,430 17,264 3,014 1953 2,825 6,066 - .. 3,939 4,637 17,467 3,016 1954 2,998 6,007 - .. 3,965 5,046 18,016 3,041 1955 3,012 6,080 - .. 3,979 5,138 18,208 3,041 1956 3,013 6,300 - .. 3,841 5,329 18,484 3,041 1957 2,958 6,540 - .. 3,696 5,638 18,833 3,031 1958 2,843 6,545 - .. 3,837 6,021 19,245 3,007 1959 2,749 6,605 - .. 3,706 6,745 19,805 2,950 1960 2,814 6,568 - .. 3,762 7,058 20,202 2,902 1961 2,771 6,294 - .. 4,143 7,288 20,497 2,808 1962 2,495 6,133 - .. 4,441 7,486 20,554 2,689 1963 2,342 5,939 - .. 4,328 7,788 20,396 2,538 1964 2,244 5,936 - .. 4,444 7,804 20,428 2,473 1965 2,115 5,894 - .. 4,687 7,685 20,382 2,401 1966 1,971 5,898 .. 2,666 2,130 7,857 20,522 2,319 1967 1,709 5,576 .. 2,521 2,661 7,908 20,375 2,181 1968 1,605 5,398 .. 2,173 2,974 8,580 20,730 2,058 1969 1,245 5,452 194 1,904 3,265 10,215 22,274 2,002 1970 1,230 5,233 418 1,621 3,710 11,849 24,061 1,977 1971 1,101 4,444 683 1,425 4,219 13,304 25,177 1,875 1972 1,010 3,895 1,162 1,222 6,152 13,500 26,940 1,798 1973 920 3,749 1,346 1,060 7,366 14,665 29,106 1,776 1974 855 3,656 1,365 1,027 7,694 16,199 30,795 1,767 1975 748 3,330 1,363 958 8,022 17,069 31,489 1,682 1976 661 3,148 1,349 910 8,030 15,742 29,839 1,573 1977 654 2,923 1,624 882 8,181 15,797 30,061 1,545 1978 614 2,546 1,827 743 7,174 15,173 28,078 1,421 1979 606 2,248 1,651 613 6,555 13,558 25,232 1,305 1980 617 1,992 1,600 554 6,428 14,578 25,769 1,275 1981 604 1,589 1,600 470 5,985 11,870 22,117 1,118 1982 582 1,340 1,580 409 5,101 10,221 19,233 985 1983 602 1,099 1,543 372 3,911 8,367 15,894 866 1984 636 893 1,572 349 3,398 7,463 14,312 777 1985 616 728 1,489 335 2,851 6,191 12,208 693 1986 588 564 1,369 244 1,864 3,083 7,711 545
End of year PassengerOther cargo Ro-Ro Container
Specialised carriers
Bulk carriers Tankers Total Vessels
000 Gt 000 Gt 000 Gt 000 Gt 000 Gt 000 Gt 000 Gt 000 Gt number1986 259 510 561 1,369 95 2,003 3,249 8,046 5461987 259 410 591 1,335 132 1,322 3,010 7,059 5061988 259 332 586 1,335 128 1,301 2,661 6,603 4821989 242 277 510 1,368 122 1,253 2,252 6,025 4501990 269 257 555 1,275 118 828 2,210 5,512 4271991 271 242 604 1,091 99 489 2,166 4,963 4091992 276 174 632 1,015 100 446 2,188 4,831 3631993 272 145 657 1,017 124 293 2,161 4,670 3441994 281 212 874 1,236 110 294 2,481 5,488 3601995 360 282 910 1,326 52 485 2,346 5,761 3651996 360 269 1,068 1,110 49 819 2,383 6,057 3771997 361 254 1,093 1,113 49 831 3,407 7,108 3921998 358 307 1,123 1,379 49 854 2,977 7,048 4161999 363 293 1,161 1,502 103 761 3,253 7,436 4212000 762 321 1,332 2,140 151 844 3,971 9,521 4712001 746 502 1,431 2,362 151 946 4,516 10,653 5342002 945 570 1,617 3,303 100 1,491 4,472 12,497 6102003 1,130 825 1,637 4,548 121 1,729 5,991 15,982 7232004 711 830 1,608 5,072 165 2,302 6,214 16,902 7542005 539 885 1,589 5,539 345 2,926 6,978 18,801 7952006 472 936 1,466 5,900 604 2,839 7,536 19,753 8142007 627 763 1,534 6,304 925 3,050 7,401 20,603 8162008 592 707 1,531 7,503 1,072 3,081 8,187 22,673 8422009 519 737 1,689 9,108 1,357 3,453 8,951 25,814 8802009 520 738 1,692 9,108 1,356 3,454 8,944 25,813 8842010 539 710 1,870 8,892 1,370 4,409 9,494 27,284 8612011 210 854 1,854 9,663 1,425 5,632 9,690 29,328 871
1 See Technical Notes for an explanation of changes in classification in 1986 and 2009.https://www.gov.uk/government/organisations/department-for-transport/series/shipping-fleet-statistics
Telephone: 020 7944 4119Email: [email protected] Source: DfT analysis of IHS Global data; DfT data prior to 1986
Last updated: September 2012The figures in this table are outside the scope of National Statistics. Next update: September 2013
https://www.gov.uk/government/statistical-data-sets/tsgb05-maritime 139
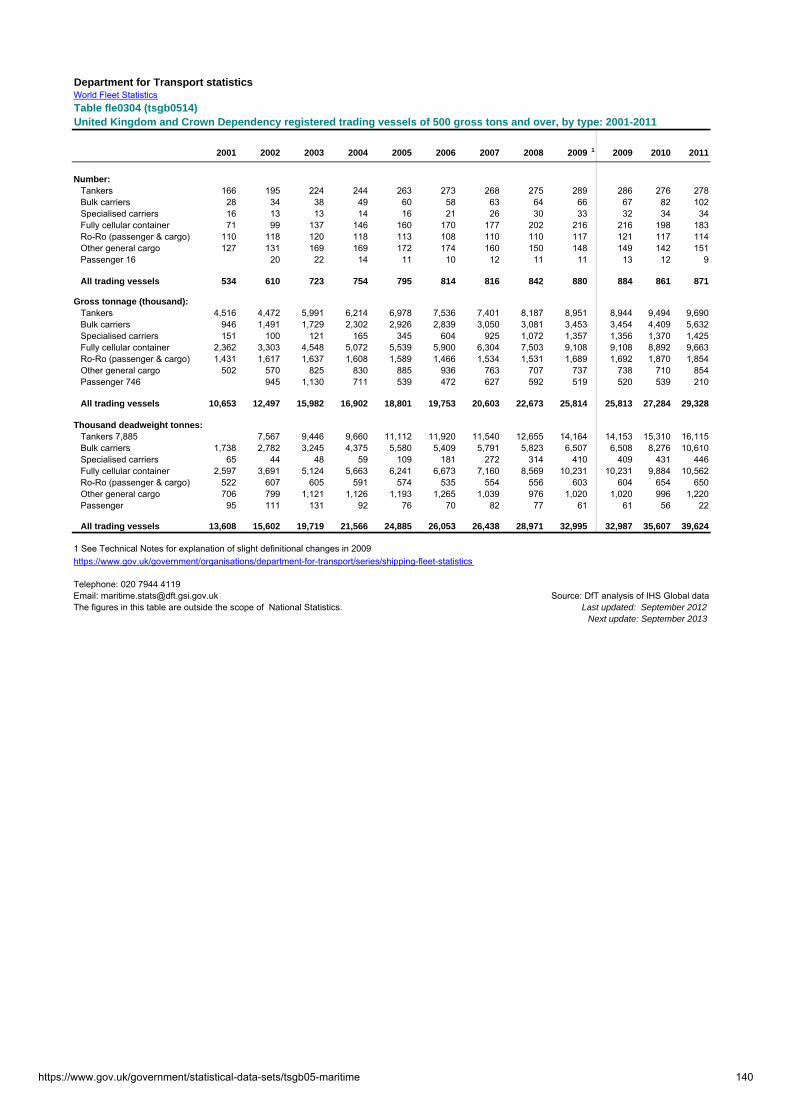
Department for Transport statisticsWorld Fleet StatisticsTable fle0304 (tsgb0514)United Kingdom and Crown Dependency registered trading vessels of 500 gross tons and over, by type: 2001-2011
2001 2002 2003 2004 2005 2006 2007 2008 2009 1 2009 2010 2011
Number:Tankers 166 195 224 244 263 273 268 275 289 286 276 278Bulk carriers 28 34 38 49 60 58 63 64 66 67 82 102Specialised carriers 16 13 13 14 16 21 26 30 33 32 34 34Fully cellular container 71 99 137 146 160 170 177 202 216 216 198 183Ro-Ro (passenger & cargo) 110 118 120 118 113 108 110 110 117 121 117 114Other general cargo 127 131 169 169 172 174 160 150 148 149 142 151Passenger 16 20 22 14 11 10 12 11 11 13 12 9
All trading vessels 534 610 723 754 795 814 816 842 880 884 861 871
Gross tonnage (thousand):Tankers 4,516 4,472 5,991 6,214 6,978 7,536 7,401 8,187 8,951 8,944 9,494 9,690Bulk carriers 946 1,491 1,729 2,302 2,926 2,839 3,050 3,081 3,453 3,454 4,409 5,632Specialised carriers 151 100 121 165 345 604 925 1,072 1,357 1,356 1,370 1,425Fully cellular container 2,362 3,303 4,548 5,072 5,539 5,900 6,304 7,503 9,108 9,108 8,892 9,663Ro-Ro (passenger & cargo) 1,431 1,617 1,637 1,608 1,589 1,466 1,534 1,531 1,689 1,692 1,870 1,854Other general cargo 502 570 825 830 885 936 763 707 737 738 710 854Passenger 746 945 1,130 711 539 472 627 592 519 520 539 210
All trading vessels 10,653 12,497 15,982 16,902 18,801 19,753 20,603 22,673 25,814 25,813 27,284 29,328
Thousand deadweight tonnes:Tankers 7,885 7,567 9,446 9,660 11,112 11,920 11,540 12,655 14,164 14,153 15,310 16,115Bulk carriers 1,738 2,782 3,245 4,375 5,580 5,409 5,791 5,823 6,507 6,508 8,276 10,610Specialised carriers 65 44 48 59 109 181 272 314 410 409 431 446Fully cellular container 2,597 3,691 5,124 5,663 6,241 6,673 7,160 8,569 10,231 10,231 9,884 10,562Ro-Ro (passenger & cargo) 522 607 605 591 574 535 554 556 603 604 654 650Other general cargo 706 799 1,121 1,126 1,193 1,265 1,039 976 1,020 1,020 996 1,220Passenger 95 111 131 92 76 70 82 77 61 61 56 22
All trading vessels 13,608 15,602 19,719 21,566 24,885 26,053 26,438 28,971 32,995 32,987 35,607 39,624
1 See Technical Notes for explanation of slight definitional changes in 2009https://www.gov.uk/government/organisations/department-for-transport/series/shipping-fleet-statistics
Telephone: 020 7944 4119Email: [email protected] Source: DfT analysis of IHS Global dataThe figures in this table are outside the scope of National Statistics. Last updated: September 2012
Next update: September 2013
https://www.gov.uk/government/statistical-data-sets/tsgb05-maritime 140

Department for Transport statisticsWorld Fleet StatisticsTable fle0204B (tsgb0515)United Kingdom owned trading vessels of 500 gross tons and over: by type, number and tonnage: 2001-2011
2001 2002 2003 2004 2005 2006 2007 2008 2009 1 2009 2010 2011
Number: Tankers 114 113 124 145 144 149 143 145 153 150 138 139Dry bulk 38 35 43 51 60 60 63 70 65 66 65 74Specialised carriers 10 10 9 9 11 17 19 23 26 25 28 28Fully cellular container 77 72 92 78 75 91 101 104 108 108 116 114Ro-Ro (passenger & cargo) 103 105 109 106 102 98 105 107 106 110 111 106Other general cargo 116 115 124 138 146 146 158 157 116 118 116 116Passenger 18 20 26 15 19 18 23 25 25 27 33 34
All trading vessels 476 470 527 542 557 579 612 631 599 604 607 611
Gross tonnage (thousand tons):Tankers 2,579 2,620 3,601 4,497 4,139 4,668 5,246 5,827 6,374 6,367 5,647 5,536Dry bulk 1,845 1,772 1,913 2,287 2,753 2,614 2,786 3,214 3,185 3,184 3,060 3,378Specialised carriers 100 100 82 81 261 594 798 960 1,250 1,249 1,306 1,376Fully cellular container 2,525 2,509 3,552 3,035 3,297 4,254 4,893 4,886 5,341 5,341 6,172 6,125Ro-Ro (passenger & cargo) 1,355 1,423 1,589 1,472 1,404 1,334 1,445 1,450 1,535 1,538 1,693 1,761Other general cargo 409 570 793 940 912 963 1,070 1,095 685 687 644 664Passenger 636 725 1,092 588 919 915 1,088 1,360 1,207 1,208 1,626 1,586
All trading vessels 9,449 9,720 12,622 12,900 13,685 15,341 17,327 18,792 19,577 19,576 20,149 20,425
Thousand deadweight tonnes:Tankers 4,646 4,690 5,529 6,687 6,054 6,080 6,474 7,265 7,640 7,628 6,440 6,247Dry bulk 3,495 3,377 3,594 4,300 5,345 4,922 5,228 5,994 5,876 5,875 5,651 7,240Specialised carriers 45 45 42 40 90 189 241 293 394 393 428 453Fully cellular container 2,734 2,785 3,993 3,349 3,708 4,758 5,491 5,523 5,969 5,969 6,878 6,834Ro-Ro (passenger & cargo) 414 454 543 514 504 478 513 531 572 574 616 634Other general cargo 569 807 1,113 1,323 1,233 1,296 1,464 1,499 927 931 853 885Passenger 82 87 130 64 117 114 139 153 129 129 175 170
All trading vessels 11,985 12,245 14,945 16,277 17,052 17,836 19,551 21,257 21,507 21,499 21,041 22,464
1 See Technical Notes for explanation of slight definitional changes in 2009https://www.gov.uk/government/organisations/department-for-transport/series/shipping-fleet-statistics
Telephone: 020 7944 4119 Source: DfT analysis of IHS Global dataEmail: [email protected] Last updated: September 2012
Next update: September 2013The figures in this table are outside the scope of National Statistics.
https://www.gov.uk/government/statistical-data-sets/tsgb05-maritime 141

Department for Transport StatisticsTable tsgb0516United Kingdom shipping industry: international revenue and expenditure: 2001 - 2011
£ Million
2001 2002 2003 2004 2005 2006 2007 2008 2009 2010 2011
(a) RevenueDry cargo and passenger vessels:(including ferries)
Freight on:Imports 541 534 501 547 619 390 423 436 369 481 555Exports 406 481 525 444 544 530 552 636 538 644 639Cross-trades 1,609 1,844 2,069 3,180 3,874 3,132 2,924 3,262 2,860 2,821 2,908Total freight revenue 2,556 2,859 3,095 4,171 5,037 4,052 3,899 4,334 3,767 3,946 4,102Charter receipts 106 129 196 676 963 1,086 1,564 2,014 2,185 2,385 2,799Passenger revenue 488 569 993 846 608 444 430 469 621 887 1,449
Total revenue 3,150 3,557 4,284 5,693 6,608 5,582 5,893 6,817 6,573 7,218 8,350
Wet (tankers and liquefied gas carriers):Freight on:
Imports 46 47 44 48 52 79 87 86 73 64 58Exports 82 96 126 173 174 130 142 219 120 135 116Cross-trades 497 420 742 1,305 1,194 1,222 1,395 2,530 1,315 1,446 1,311Total freight revenue 625 563 912 1,526 1,420 1,431 1,624 2,835 1,508 1,645 1,485Charter receipts 336 162 247 472 748 603 554 763 580 413 437
Total revenue 961 725 1,159 1,998 2,168 2,034 2,178 3,598 2,088 2,058 1,922All vessels:
Freight on:Imports 587 581 545 595 671 469 510 522 442 545 613Exports 488 577 651 617 718 660 694 855 658 779 755Cross-trades 2,106 2,264 2,811 4,485 5,068 4,354 4,319 5,792 4,175 4,267 4,219Total freight revenue 3,181 3,422 4,007 5,697 6,457 5,483 5,523 7,169 5,275 5,591 5,587Charter receipts 442 291 443 1,148 1,711 1,689 2,118 2,777 2,765 2,798 3,236Passenger revenue 488 569 993 846 608 444 430 469 621 887 1,449
Total revenue 4,111 4,282 5,443 7,691 8,776 7,616 8,071 10,415 8,661 9,276 10,272
(b) Expenditure
Dry cargo operations:Bunkers 321 377 429 537 701 463 255 409 302 387 835Other disbursements 1,284 1,618 1,646 1,962 2,759 1,405 1,373 1,646 1,564 2,033 2,543Charter payments 335 255 236 692 577 317 106 185 267 214 518
Total expenditure 1,940 2,250 2,311 3,191 4,037 2,185 1,734 2,240 2,133 2,634 3,896
Wet cargo operations:Bunkers 146 134 171 195 319 278 399 749 447 577 691Other disbursements 141 135 284 276 523 236 408 385 393 304 289Charter payments 176 140 184 359 636 655 721 1,257 1,099 915 640
Total expenditure 463 409 639 830 1,478 1,169 1,528 2,391 1,939 1,796 1,620All cargo operations:
Bunkers 467 511 600 732 1,020 741 654 1,158 749 964 1,526Other disbursements 1,425 1,753 1,930 2,238 3,282 1,641 1,781 2,031 1,957 2,337 2,832Charter payments 511 395 420 1,051 1,213 972 827 1,442 1,366 1,129 1,158
Total expenditure 2,403 2,659 2,950 4,021 5,515 3,354 3,262 4,631 4,072 4,430 5,516
Email: [email protected] Source: Office for National StatisticsTelephone: 01623 456753
Last updated: November 2012The figures in this table are outside the scope of National Statistics. Next update: November 2013
https://www.gov.uk/government/statistical-data-sets/tsgb05-maritime 142

Department for Transport Statistics
Table tsgb0517
Marine accident fatalities and injuries reported: 2001-2011
Number
2001 2002 2003 2004 2005 2006 2007 2008 2009 2010 2011
(a) United Kingdom registered merchant vessels of 100 gross tons and over, any location
Deaths of passengers, crew members and others by causeDeaths from accidents to vessels 0 1 0 0 1 1 3 1 0 0 1Deaths from accidents on board 1 5 1 3 1 3 9 5 3 7 4Deaths from persons overboard 4 0 2 1 2 2 0 2 4 0 1
Total 5 6 3 4 4 6 12 8 7 7 6
Deaths and injuries to passengers by type of injuryDeaths 1 0 0 0 1 1 0 2 1 2 1Fractures 111 109 138 115 79 82 79 90 74 71 84Other injuries 26 24 48 32 29 31 27 78 40 20 24
Total 138 133 186 147 109 114 106 170 115 93 109
Deaths and injuries to crew members by type of injuryDeaths 3 5 3 4 2 3 12 5 6 3 5Fractures 71 80 81 68 61 57 65 57 50 57 49Other injuries 222 219 205 237 183 171 166 162 143 163 128
Total 296 304 289 309 246 231 243 224 199 223 182
Deaths and injuries to others (e.g. pilots, surveyors)Deaths 1 1 0 0 1 2 0 1 0 2 0Fractures 0 1 1 1 3 4 2 2 2 5 3Other injuries 5 3 4 3 2 2 3 6 4 6 4
Total 6 5 5 4 6 8 5 9 6 13 7
(b) Deaths of passengers, crew members and others, any vessels in UK waters1
By locationCoastal waters 8 16 19 14 25 31 35 15 16 13 23Port/harbour area 4 9 5 4 7 6 5 10 6 7 9River/canal 5 2 4 1 4 13 12 7 6 7 11Non-tidal waters 2 4 0 0 5 2 11 1 9 0 3
Total 19 31 28 19 41 52 63 33 37 27 46
By vessel typeUK merchant vessel 100gt & over 2 3 2 1 2 1 5 2 3 0 4UK merchant vessel under100gt 3 2 4 3 2 6 5 1 1 3 6UK fishing vessel 6 8 9 9 6 12 5 7 11 5 6UK pleasure craft (non-commercial)2 3 8 10 3 23 26 46 19 20 16 22UK other (non-commercial) 0 0 0 0 0 0 1 0 0 0 0Non UK merchant vessel 100gt & over 5 5 2 2 4 5 0 4 0 3 8Non UK other 0 5 1 1 4 2 1 0 2 0 0
Total 19 31 28 19 41 52 63 33 37 27 46
Deaths of passengers, crew members and others by causeDeaths from accidents to vessels 3 11 15 10 21 17 30 8 14 5 14Deaths from accidents on board 6 7 5 3 5 9 9 6 4 3 8Deaths from persons overboard 10 13 8 6 15 26 24 19 19 19 24
Total 19 31 28 19 41 52 63 33 37 27 46
1 Marine accidents recorded by the MAIB. The requirement on vessels to report accidents to the MAIB varies by vessel type and location (see Notes). However, the MAIB will record details of, and may investigate, significant accidents of which they are notified by bodies such as the Coastguard.2 A special exercise in 2005-2007 to research pleasure craft deaths resulted in higher recording of deaths.
Source: Maritime Accidents Investigation Branch (MAIB), DfT
Telephone: 023 8039 5500
Email: [email protected] Last updated: October 2012
Next update: November 2013The figures in this table are outside the scope of National Statistics.
https://www.gov.uk/government/statistical-data-sets/tsgb05-maritime 143
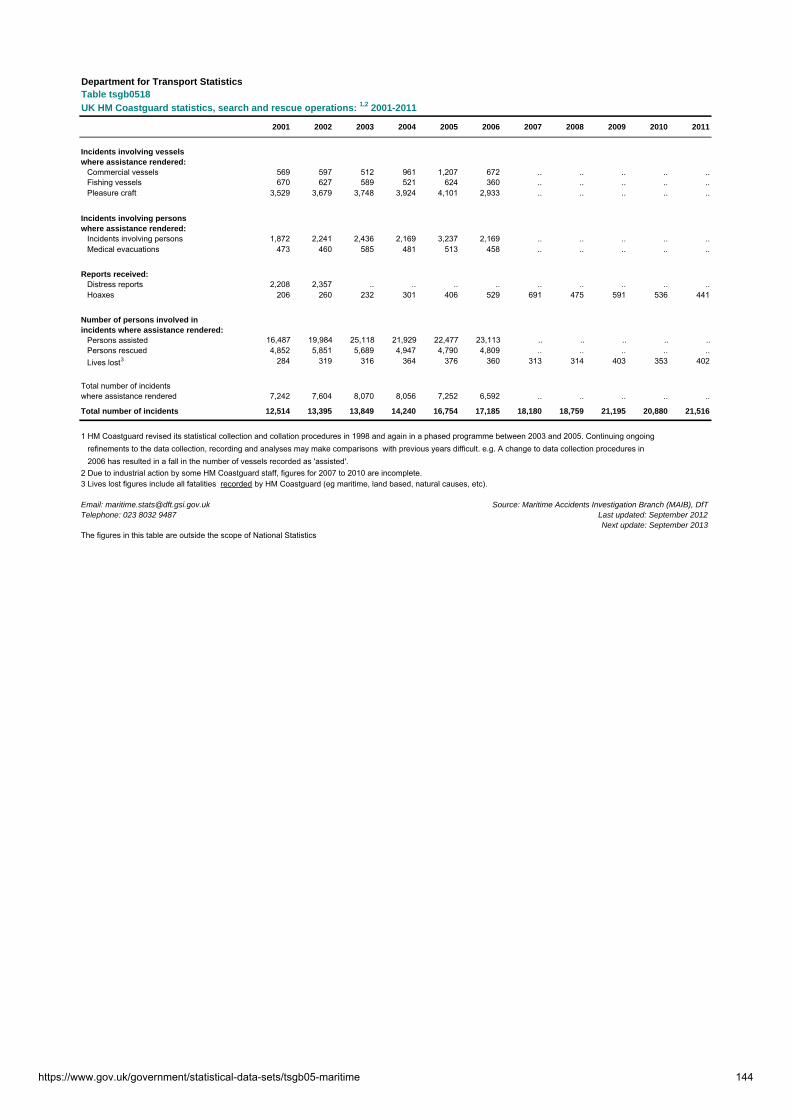
Department for Transport StatisticsTable tsgb0518
UK HM Coastguard statistics, search and rescue operations: 1,2 2001-2011
2001 2002 2003 2004 2005 2006 2007 2008 2009 2010 2011
Incidents involving vessels where assistance rendered:
Commercial vessels 569 597 512 961 1,207 672 .. .. .. .. ..Fishing vessels 670 627 589 521 624 360 .. .. .. .. ..Pleasure craft 3,529 3,679 3,748 3,924 4,101 2,933 .. .. .. .. ..
Incidents involving personswhere assistance rendered:
Incidents involving persons 1,872 2,241 2,436 2,169 3,237 2,169 .. .. .. .. ..Medical evacuations 473 460 585 481 513 458 .. .. .. .. ..
Reports received:Distress reports 2,208 2,357 .. .. .. .. .. .. .. .. ..Hoaxes 206 260 232 301 406 529 691 475 591 536 441
Number of persons involved inincidents where assistance rendered:
Persons assisted 16,487 19,984 25,118 21,929 22,477 23,113 .. .. .. .. ..Persons rescued 4,852 5,851 5,689 4,947 4,790 4,809 .. .. .. .. ..Lives lost3 284 319 316 364 376 360 313 314 403 353 402
Total number of incidents where assistance rendered 7,242 7,604 8,070 8,056 7,252 6,592 .. .. .. .. ..
Total number of incidents 12,514 13,395 13,849 14,240 16,754 17,185 18,180 18,759 21,195 20,880 21,516
1 HM Coastguard revised its statistical collection and collation procedures in 1998 and again in a phased programme between 2003 and 2005. Continuing ongoing refinements to the data collection, recording and analyses may make comparisons with previous years difficult. e.g. A change to data collection procedures in 2006 has resulted in a fall in the number of vessels recorded as 'assisted'.2 Due to industrial action by some HM Coastguard staff, figures for 2007 to 2010 are incomplete.3 Lives lost figures include all fatalities recorded by HM Coastguard (eg maritime, land based, natural causes, etc).
Email: [email protected] Source: Maritime Accidents Investigation Branch (MAIB), DfTTelephone: 023 8032 9487 Last updated: September 2012
Next update: September 2013The figures in this table are outside the scope of National Statistics
https://www.gov.uk/government/statistical-data-sets/tsgb05-maritime 144

Transport Statistics Great Britain: 2012
Public Transport
This section looks at the use of public transport in Great Britain and related data about public transport from Transport Statistics Great Britain published in December 2012.
Public Transport includes:
National Rail
Underground systems
Light Rail and Tram systems
Buses and Concessionary Travel
Taxis
National Rail
Passenger kilometres on national railways, by ticket type: Great Britain, annual from
2000/01 (Table RAI0103)
0
10
20
30
40
50
60
2000/01 2001/02 2002/03 2003/04 2004/05 2005/06 2006/07 2007/08 2008/09 2009/10 2010/11 2011/12
Bill
ion
pa
ss
en
ge
r k
ilom
etr
es
Ordinary fare Season ticket All tickets
https://www.gov.uk/government/statistical-data-sets/tsgb06 145

Since privatisation (1994/95), the number of journeys made by national rail has doubled, from 0.7 billion to 1.5 billion in 2011/12 (52 per cent since 2001/02). During this period the number of journeys has risen every year apart from a slight drop between 2008/09 and 2009/10, which was likely a result of the recession. Between 2010/11 and 2011/12 the number of journeys rose again, by 7.8 per cent.
Passenger kilometres travelled by national rail follow a similar trend to passenger journeys, and have doubled since 1994/95, increasing from 28.7 billion to 57.3 billion passenger kilometres in 2011/12. The effects of the Hatfield crash in October 2000 briefly caused an interruption in the steady upward trend, but usage has increased again since then.
Punctuality and reliability are measured through the Public Performance Measure (PPM), which combines figures for punctuality and reliability into a single performance measure, measuring the proportion of trains that arrive at their destinations on time. In 2011/12, 91.6 per cent of all services arrived on time, which is higher than all previous years since records began in 1997/98. PPM fell sharply as a result of the speed restrictions imposed following the Hatfield crash in October 2000, dropping to a low of 78.0 per cent in 2001/02. Long distance services were particularly affected. Since the Hatfield crash, PPM for all the sectors has been improving gradually.
National railways revenue for all franchised operators has increased by 104 per cent between 2001/02 and 2011/12, from £3.5 billion to £7.2 billion. To take into account inflation, the figures have also been adjusted to 2011/12 prices and these figures show that over the same period revenue has increased by 60 per cent.
Detailed statistics on national rail and the channel tunnel can be found on the DfT Rail Statistics website
Underground Systems
There were 1.2 billion passenger journeys on the London Underground and 13 million journeys on the Glasgow Subway in 2011/12.
Detailed statistics (tables and charts) on Underground Systems can be found on the DfT Light Rail Statistics website, table numbers LRT9901 and LRT9902.
https://www.gov.uk/government/statistical-data-sets/tsgb06 146

Light Rail and Tram Systems
Light rail and tram passenger journeys in England increased by 4 per cent between 2010/11 and 2011/12. In 2011/12, there were 204 million passenger journeys. This represents the highest number of passenger journeys to date.
Light rail and tram vehicle miles in England increased by 4 per cent between 2010/11 and 2011/12. In 2011/12 there were 14.5 million vehicle miles.
Annual Share of Passenger Journeys: England, 1983/84 onwards
(Table LRT0101)
Light rail and tram passenger revenue in England increased by 9.1 per cent in real terms between 2010/11 and 2011/12.
At March 2012, there were 406 passenger cars on light rail systems in England, a slight increase on March 2011 due to an increase in passenger cars on the Manchester Metrolink from 47 to 56. Since 2004/05, there here has been an increase of around 9 per cent, with increases on the DLR and Metrolink partially offset by a large fall in the number of Blackpool trams where the old fleet has been largely replaced by a smaller number of higher capacity, accessible vehicles as part of the refurbishment work.
Detailed statistics (tables and charts) on Light Rail and Tram Systems can be found on the DfT Light Rail Statistics website, table numbers LRT0101 to LRT0302.
https://www.gov.uk/government/statistical-data-sets/tsgb06 147

Buses and Concessionary Travel
There were 4.7 billion bus passenger journeys in England in 2011/12. This is a 0.5 per cent increase from the 2010/11 level. Journeys in London increased by 2.4 per cent over this period and now account for half of all bus passenger journeys in England.
Bus vehicle miles in England increased by 0.8 per cent between 2010/11 and 2011/12, with 21 per cent of mileage outside London on local authority supported services in 2011/12.
Bus fares in England increased by 6 per cent between March 2011 and March 2012. The all items Retail Prices Index rose by 4 per cent over the same period.
55 per cent of operating revenue for local bus services came from passenger fare receipts in 2011/12 (54 per cent in 2010/11).
Net public funding support for local bus services in England decreased by 5 per cent in real terms between 2010/11 and 2011/12.
Estimated operating revenue for local bus services by revenue type, England (at 2011/12 prices) 2004/05 to 2011/12 (in £ millions) (Table BUS0501)
0
1,000
2,000
3,000
4,000
5,000
6,000
2004/05 2005/06 2006/07 2007/08 2008/09 2009/10 2010/11 2011/12Year
Revenue (£ millions) Passenger fare receipts Public Transport Support Concessionary Travel Bus Service Operators Grant
In 2011/12, there were 53 thousand Public Service Vehicles (PSVs) in use by local bus operators in Great Britain, of which 42 thousand (80 per cent) were buses and the remainder minibuses and coaches.
https://www.gov.uk/government/statistical-data-sets/tsgb06 148
In 2011/12, there were around 9.8m older and disabled concessionary bus passes in England, with an average of 109 bus journeys per pass per year.
Detailed statistics (tables and charts) on buses and concessionary travel can be found on the DfT Bus Statistics website, table numbers BUS0101 to BUS1003.
Taxis
There were 78,000 licensed taxis in England and Wales as at 31 March 2011. Of these 73,000 were in England, an increase of 3% from 2009, the last time that this information was collected.
There were 155,100 licensed Private Hire Vehicles (PHVs) in England and Wales as at 31 March 2011. 150,900 of these were in England, an increase of 3% compared with 2009.
Overall, there were 299,200 licensed taxi or PHV drivers in England and Wales, with 287,300 of these in England (an increase of 5% compared with 2009).
Detailed statistics (tables and charts) on taxis can be found on the DfT Taxi Statistics website, table numbers TAXI0101 to TAXI0104.
Background notes
Full guidance on the methods used to compile these statistics and their sources can be accessed from the Transport Statistics Great Britain Page.
https://www.gov.uk/government/statistical-data-sets/tsgb06 149
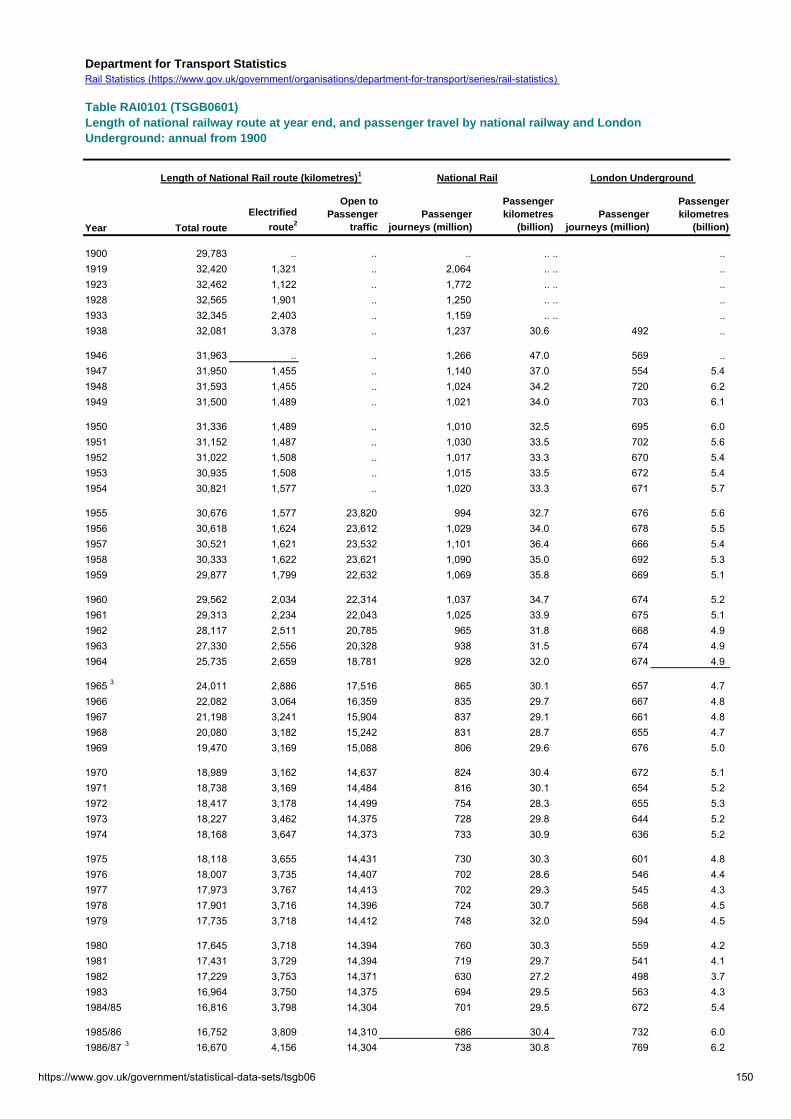
Department for Transport Statistics
Table RAI0101 (TSGB0601)Length of national railway route at year end, and passenger travel by national railway and LondonUnderground: annual from 1900
Length of National Rail route (kilometres)1 National Rail London Underground
Year Total route
Electrified
route2
Open to Passenger
trafficPassenger
journeys (million)
Passenger kilometres
(billion)Passenger
journeys (million)
Passenger kilometres
(billion)
1900 29,783 .. .. .. .. .. .. 1919 32,420 1,321 .. 2,064 .. .. .. 1923 32,462 1,122 .. 1,772 .. .. .. 1928 32,565 1,901 .. 1,250 .. .. .. 1933 32,345 2,403 .. 1,159 .. .. .. 1938 32,081 3,378 .. 1,237 30.6 492 ..
1946 31,963 .. .. 1,266 47.0 569 .. 1947 31,950 1,455 .. 1,140 37.0 554 5.41948 31,593 1,455 .. 1,024 34.2 720 6.21949 31,500 1,489 .. 1,021 34.0 703 6.1
1950 31,336 1,489 .. 1,010 32.5 695 6.01951 31,152 1,487 .. 1,030 33.5 702 5.61952 31,022 1,508 .. 1,017 33.3 670 5.41953 30,935 1,508 .. 1,015 33.5 672 5.41954 30,821 1,577 .. 1,020 33.3 671 5.7
1955 30,676 1,577 23,820 994 32.7 676 5.61956 30,618 1,624 23,612 1,029 34.0 678 5.51957 30,521 1,621 23,532 1,101 36.4 666 5.41958 30,333 1,622 23,621 1,090 35.0 692 5.31959 29,877 1,799 22,632 1,069 35.8 669 5.1
1960 29,562 2,034 22,314 1,037 34.7 674 5.21961 29,313 2,234 22,043 1,025 33.9 675 5.11962 28,117 2,511 20,785 965 31.8 668 4.91963 27,330 2,556 20,328 938 31.5 674 4.91964 25,735 2,659 18,781 928 32.0 674 4.9
1965 3 24,011 2,886 17,516 865 30.1 657 4.71966 22,082 3,064 16,359 835 29.7 667 4.81967 21,198 3,241 15,904 837 29.1 661 4.81968 20,080 3,182 15,242 831 28.7 655 4.71969 19,470 3,169 15,088 806 29.6 676 5.0
1970 18,989 3,162 14,637 824 30.4 672 5.11971 18,738 3,169 14,484 816 30.1 654 5.21972 18,417 3,178 14,499 754 28.3 655 5.31973 18,227 3,462 14,375 728 29.8 644 5.21974 18,168 3,647 14,373 733 30.9 636 5.2
1975 18,118 3,655 14,431 730 30.3 601 4.81976 18,007 3,735 14,407 702 28.6 546 4.41977 17,973 3,767 14,413 702 29.3 545 4.31978 17,901 3,716 14,396 724 30.7 568 4.51979 17,735 3,718 14,412 748 32.0 594 4.5
1980 17,645 3,718 14,394 760 30.3 559 4.21981 17,431 3,729 14,394 719 29.7 541 4.11982 17,229 3,753 14,371 630 27.2 498 3.71983 16,964 3,750 14,375 694 29.5 563 4.31984/85 16,816 3,798 14,304 701 29.5 672 5.4
1985/86 16,752 3,809 14,310 686 30.4 732 6.01986/87 3 16,670 4,156 14,304 738 30.8 769 6.2
Rail Statistics (https://www.gov.uk/government/organisations/department-for-transport/series/rail-statistics)
https://www.gov.uk/government/statistical-data-sets/tsgb06 150

Length of national railway route at year end, and passenger travel by national railway and LondonUnderground: annual from 1900
Length of National Rail route (kilometres)1 National Rail London Underground
Year Total route
Electrified
route2
Open to Passenger
trafficPassenger
journeys (million)
Passenger kilometres
(billion)Passenger
journeys (million)
Passenger kilometres
(billion)
1987/88 16,633 4,207 14,302 798 32.4 798 6.31988/89 16,599 4,376 14,309 822 34.3 815 6.31989/90 16,587 4,546 14,318 812 33.3 765 6.0
1990/91 16,584 4,912 14,317 810 33.2 775 6.21991/92 16,588 4,886 14,291 792 32.5 751 5.91992/93 16,528 4,910 14,317 770 31.7 728 5.81993/94 16,536 4,968 14,357 740 30.4 735 5.81994/95 4 16,542 4,970 14,359 735 28.7 764 6.1
1995/96 16,666 5,163 15,002 761 30.0 784 6.31996/97 16,666 5,176 15,034 801 32.1 772 6.21997/98 16,656 5,166 15,024 846 34.7 832 6.51998/99 16,659 5,166 15,038 892 36.3 866 6.71999/00 3 16,649 5,167 15,038 931 38.5 927 7.2
2000/01 16,652 5,167 15,042 957 38.2 970 7.52001/02 16,652 5,167 15,042 960 39.1 953 7.52002/03 16,670 5,167 15,042 976 39.7 942 7.42003/04 16,493 5,200 14,883 1,012 40.9 948 7.32004/05 3 16,116 5,200 14,328 1,040 41.7 976 7.6
2005/06 15,810 5,205 14,356 1,076 43.1 970 7.62006/07 15,795 5,250 14,353 1,145 46.2 1,040 7.92007/08 3 15,814 5,250 14,484 1,218 48.9 1,096 8.42008/09 15,814 5,250 14,494 1,266 50.6 1,089 8.62009/10 5,R 15,753 5,239 14,482 1,259 51.4 1,059 8.52010/11 R 15,777 5,262 14,506 1,356 54.5 1,107 8.92011/12 P 15,742 5,261 14,506 1,462 57.3 1,171 9.5
1. The length of route is that managed by Network Rail (formerly Railtrack). It does not include track managed by private companies or Passenger Transport Executive services operating on separately managed track.2. Pre-1947 figures refer to track length, not route length, and include electrified sidings. In 1947 electrified track kilometres totalled 3,370. 3. Break in series due to a change in methodology (see Notes and Definitions).4. Break in series. From 1994/95 figures include an element of double counting, as a journey involving more than one train is counted for each train. This contrasts with former British Rail data for which a through ticket journey was counted only once. 5. Break in series. From 2009/10 National Rail passenger journeys and passenger kilometres figures include non-franchised train operators. Figures prior to this include franchised operators only. In 2009/10 there were 1,258 million franchised passenger journeys and 51.1 billion passenger kilometres.P. 2011/12 passenger journeys and kilometres are provisional.
Rail: 020 7944 2419London Underground: 020 7944 3094 Sources: ORR, London UndergroundEmail: [email protected] Last updated: December 2012
Next updated: December 2013The figures in this table are outside the scope of National Statistics
https://www.gov.uk/government/statistical-data-sets/tsgb06 151
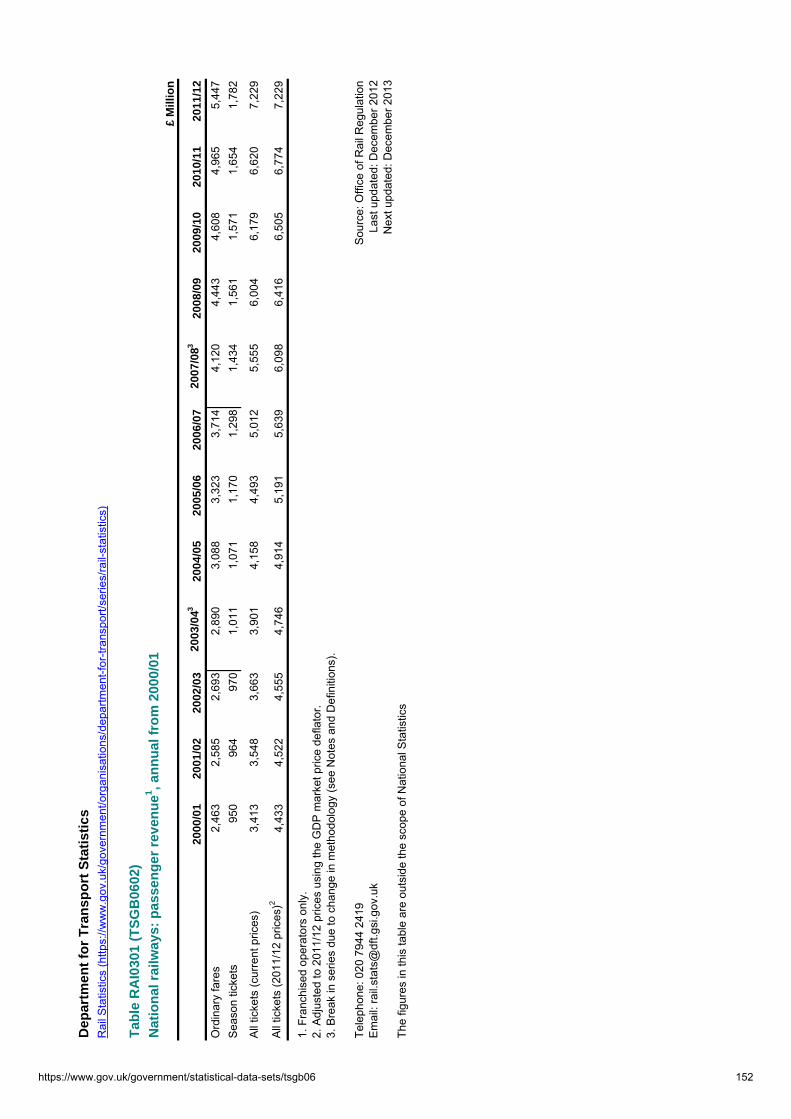
Dep
artm
ent
for
Tra
nsp
ort
Sta
tist
ics
Tab
le R
AI0
301
(TS
GB
0602
)
Nat
ion
al r
ailw
ays:
pas
sen
ger
rev
enu
e1, a
nn
ual
fro
m 2
000/
01£
Mill
ion
2000
/01
2001
/02
2002
/03
2003
/043
2004
/05
2005
/06
2006
/07
2007
/083
2008
/09
2009
/10
2010
/11
2011
/12
Ord
inar
y fa
res
2,46
32,
585
2,69
32,
890
3,08
83,
323
3,71
44,
120
4,44
34,
608
4,96
55,
447
Sea
son
ticke
ts95
096
497
01,
011
1,07
11,
170
1,29
81,
434
1,56
11,
571
1,65
41,
782
All
ticke
ts (c
urre
nt p
rices
)3,
413
3,54
83,
663
3,90
14,
158
4,49
35,
012
5,55
56,
004
6,17
96,
620
7,22
9
All
ticke
ts (2
011/
12 p
rices
)24,
433
4,52
24,
555
4,74
64,
914
5,19
15,
639
6,09
86,
416
6,50
56,
774
7,22
9
1. F
ranc
hise
d op
erat
ors
only
.2.
Adj
uste
d to
201
1/12
pric
es u
sing
the
GD
P m
arke
t pric
e de
flato
r.3.
Bre
ak in
ser
ies
due
to c
hang
e in
met
hodo
logy
(see
Not
es a
nd D
efin
ition
s).
Tele
phon
e: 0
20 7
944
2419
Sou
rce:
Offi
ce o
f Rai
l Reg
ulat
ion
Em
ail:
rail.
stat
s@df
t.gsi
.gov
.uk
Last
upd
ated
: Dec
embe
r 201
2N
ext u
pdat
ed: D
ecem
ber 2
013
The
figur
es in
this
tabl
e ar
e ou
tsid
e th
e sc
ope
of N
atio
nal S
tatis
tics
Rai
l Sta
tistic
s (h
ttps:
//ww
w.g
ov.u
k/go
vern
men
t/org
anis
atio
ns/d
epar
tmen
t-for
-tran
spor
t/ser
ies/
rail-
stat
istic
s)
https://www.gov.uk/government/statistical-data-sets/tsgb06 152
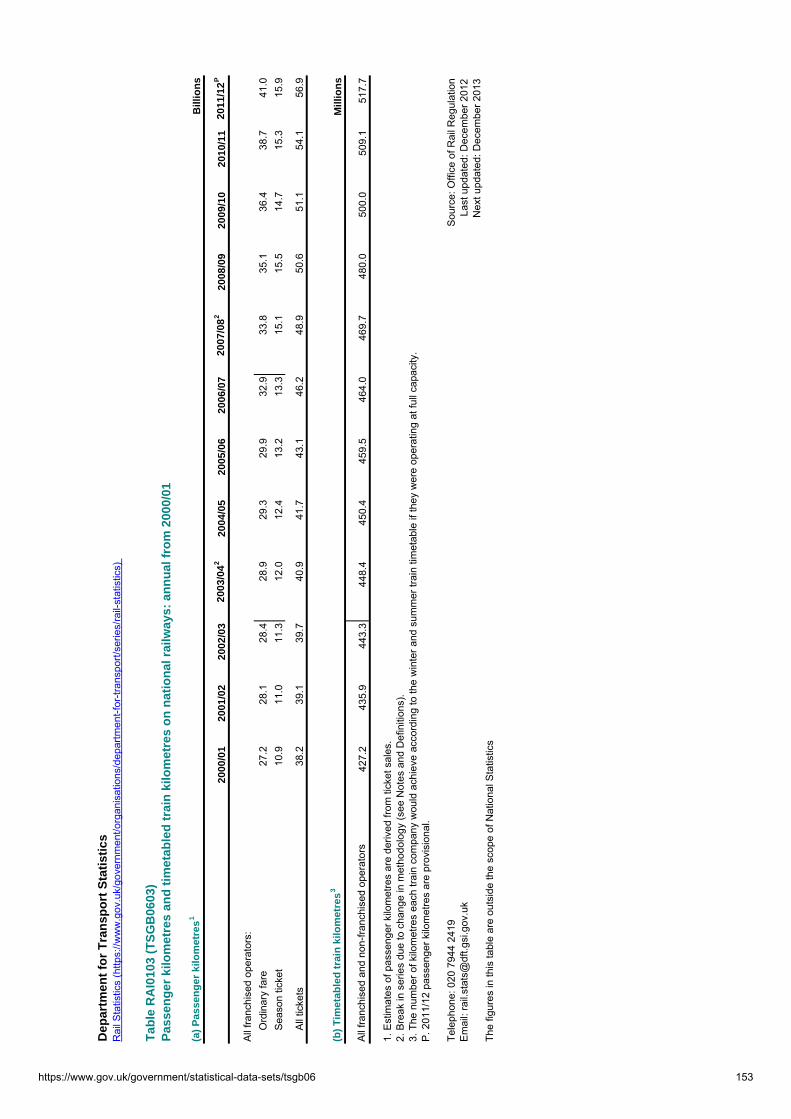
Dep
artm
ent
for
Tra
nsp
ort
Sta
tist
ics
Tab
le R
AI0
103
(TS
GB
0603
)P
asse
ng
er k
ilom
etre
s an
d t
imet
able
d t
rain
kilo
met
res
on
nat
ion
al r
ailw
ays:
an
nu
al f
rom
200
0/01
(a)
Pas
sen
ger
kilo
met
res
1B
illio
ns
2000
/01
2001
/02
2002
/03
2003
/04
220
04/0
520
05/0
620
06/0
720
07/0
82
2008
/09
2009
/10
2010
/11
2011
/12
P
All
franc
hise
d op
erat
ors:
Ord
inar
y fa
re27
.228
.128
.428
.929
.329
.932
.933
.835
.136
.438
.741
.0
Sea
son
ticke
t10
.911
.011
.312
.012
.413
.213
.315
.115
.514
.715
.315
.9
A
ll tic
kets
38.2
39.1
39.7
40.9
41.7
43.1
46.2
48.9
50.6
51.1
54.1
56.9
(b)
Tim
etab
led
tra
in k
ilom
etre
s3
Mill
ion
s
All
franc
hise
d an
d no
n-fra
nchi
sed
oper
ator
s42
7.2
435.
944
3.3
448.
445
0.4
459.
546
4.0
469.
748
0.0
500.
050
9.1
517.
7
1. E
stim
ates
of p
asse
nger
kilo
met
res
are
deriv
ed fr
om ti
cket
sal
es.
2. B
reak
in s
erie
s du
e to
cha
nge
in m
etho
dolo
gy (s
ee N
otes
and
Def
initi
ons)
.3.
The
num
ber o
f kilo
met
res
each
trai
n co
mpa
ny w
ould
ach
ieve
acc
ordi
ng to
the
win
ter a
nd s
umm
er tr
ain
timet
able
if th
ey w
ere
oper
atin
g at
full
capa
city
.P
. 201
1/12
pas
seng
er k
ilom
etre
s ar
e pr
ovis
iona
l.
Tele
phon
e: 0
20 7
944
2419
Sou
rce:
Offi
ce o
f Rai
l Reg
ulat
ion
Em
ail:
rail.
stat
s@df
t.gsi
.gov
.uk
Last
upd
ated
: Dec
embe
r 201
2N
ext u
pdat
ed: D
ecem
ber 2
013
The
figur
es in
this
tabl
e ar
e ou
tsid
e th
e sc
ope
of N
atio
nal S
tatis
tics
Rai
l Sta
tistic
s (h
ttps:
//ww
w.g
ov.u
k/go
vern
men
t/org
anis
atio
ns/d
epar
tmen
t-for
-tran
spor
t/ser
ies/
rail-
stat
istic
s)
https://www.gov.uk/government/statistical-data-sets/tsgb06 153
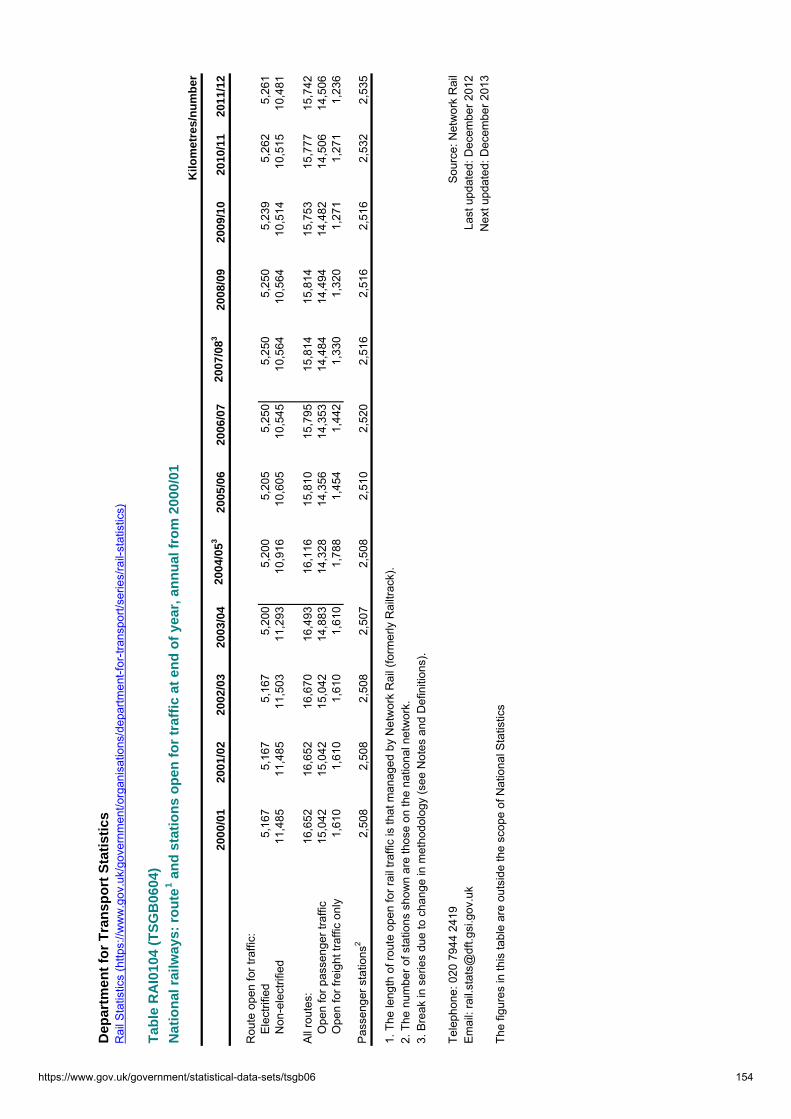
Dep
artm
ent
for
Tra
nsp
ort
Sta
tist
ics
Tab
le R
AI0
104
(TS
GB
0604
)
Nat
ion
al r
ailw
ays:
ro
ute
1 a
nd
sta
tio
ns
op
en f
or
traf
fic
at e
nd
of
year
, an
nu
al f
rom
200
0/01
Kilo
met
res/
nu
mb
er
2000
/01
2001
/02
2002
/03
2003
/04
2004
/053
2005
/06
2006
/07
2007
/083
2008
/09
2009
/10
2010
/11
2011
/12
Rou
te o
pen
for t
raffi
c:
Ele
ctrif
ied
5,16
75,
167
5,16
75,
200
5,20
05,
205
5,25
05,
250
5,25
05,
239
5,26
25,
261
N
on-e
lect
rifie
d 11
,485
11,4
8511
,503
11,2
9310
,916
10,6
0510
,545
10,5
6410
,564
10,5
1410
,515
10,4
81
All
rout
es:
16,6
5216
,652
16,6
7016
,493
16,1
1615
,810
15,7
9515
,814
15,8
1415
,753
15,7
7715
,742
O
pen
for p
asse
nger
traf
fic15
,042
15,0
4215
,042
14,8
8314
,328
14,3
5614
,353
14,4
8414
,494
14,4
8214
,506
14,5
06
Ope
n fo
r fre
ight
traf
fic o
nly
1,61
01,
610
1,61
01,
610
1,78
81,
454
1,44
21,
330
1,32
01,
271
1,27
11,
236
Pas
seng
er s
tatio
ns2
2,50
82,
508
2,50
82,
507
2,50
82,
510
2,52
02,
516
2,51
62,
516
2,53
22,
535
1. T
he le
ngth
of r
oute
ope
n fo
r rai
l tra
ffic
is th
at m
anag
ed b
y N
etw
ork
Rai
l (fo
rmer
ly R
ailtr
ack)
.2.
The
num
ber o
f sta
tions
sho
wn
are
thos
e on
the
natio
nal n
etw
ork.
3. B
reak
in s
erie
s du
e to
cha
nge
in m
etho
dolo
gy (s
ee N
otes
and
Def
initi
ons)
.
Tele
phon
e: 0
20 7
944
2419
Sou
rce:
Net
wor
k R
ail
Em
ail:
rail.
stat
s@df
t.gsi
.gov
.uk
Last
upd
ated
: Dec
embe
r 201
2N
ext u
pdat
ed: D
ecem
ber 2
013
The
figur
es in
this
tabl
e ar
e ou
tsid
e th
e sc
ope
of N
atio
nal S
tatis
tics
Rai
l Sta
tistic
s (h
ttps:
//ww
w.g
ov.u
k/go
vern
men
t/org
anis
atio
ns/d
epar
tmen
t-for
-tran
spor
t/ser
ies/
rail-
stat
istic
s)
https://www.gov.uk/government/statistical-data-sets/tsgb06 154

Dep
artm
ent
for
Tra
nsp
ort
Sta
tist
ics
Tab
le R
AI0
105
(TS
GB
0605
)N
atio
nal
rai
lway
s: P
ub
lic P
erfo
rman
ce M
easu
re, a
nn
ual
fro
m 2
002/
03P
erce
nta
ge
Pu
blic
Per
form
ance
Mea
sure
(P
PM
)120
02/0
320
03/0
420
04/0
520
05/0
620
06/0
7220
07/0
820
08/0
920
09/1
020
10/1
1R20
11/1
2
Long
dis
tanc
e op
erat
ors
70.6
73.4
79.1
82.2
84.9
86.2
87.3
88.9
87.9
89.2
Lond
on a
nd S
outh
Eas
t ope
rato
rs79
.180
.584
.787
.988
.890
.691
.091
.491
.191
.7R
egio
nal o
pera
tors
80.4
82.8
82.6
85.0
87.6
89.6
90.6
92.0
91.1
92.0
All
franc
hise
d op
erat
ors
79.2
81.2
83.5
86.4
88.1
89.9
90.6
91.5
90.8
91.6
1. P
PM
is a
mea
sure
of t
he p
erce
ntag
e of
trai
ns a
rriv
ing
on ti
me.
A tr
ain
is d
efin
ed a
s on
tim
e if
it ar
rives
at i
ts d
estin
atio
n w
ithin
five
min
utes
of t
he p
lann
ed a
rriv
al ti
me
for
L
ondo
n an
d S
outh
Eas
t and
regi
onal
ope
rato
rs, o
r with
in te
n m
inut
es fo
r lon
g-di
stan
ce o
pera
tors
.2.
Bre
ak in
the
serie
s du
e to
cha
nge
in m
etho
dolo
gy (s
ee N
otes
and
Def
initi
ons)
.
Tele
phon
e: 0
20 7
944
2419
Sou
rce:
Offi
ce o
f Rai
l Reg
ulat
ion
Em
ail:
rail.
stat
s@df
t.gsi
.gov
.uk
Last
upd
ated
: Dec
embe
r 201
2N
ext u
pdat
ed: D
ecem
ber 2
013
The
figur
es in
this
tabl
e ar
e ou
tsid
e th
e sc
ope
of N
atio
nal S
tatis
tics
Rai
l Sta
tistic
s (h
ttps:
//ww
w.g
ov.u
k/go
vern
men
t/org
anis
atio
ns/d
epar
tmen
t-for
-tran
spor
t/ser
ies/
rail-
stat
istic
s)
https://www.gov.uk/government/statistical-data-sets/tsgb06 155

Dep
artm
ent
for
Tra
nsp
ort
Sta
tist
ics
Tab
le R
AI0
106
(TS
GB
0606
)A
vera
ge
age
of
nat
ion
al r
ail r
olli
ng
sto
ck:
ann
ual
fro
m 2
000/
01Y
ears
Ave
rag
e ag
e o
f ro
llin
g s
tock
120
00/0
120
01/0
220
02/0
320
03/0
420
04/0
520
05/0
620
06/0
720
07/0
8220
08/0
920
09/1
020
10/1
120
11/1
2
Long
dis
tanc
e op
erat
ors
25.9
723
.51
22.1
319
.03
16.9
215
.45
16.1
517
.02
18.5
019
.56
20.5
621
.19
Lond
on a
nd S
outh
Eas
t ope
rato
rs20
.36
20.4
819
.89
17.5
514
.29
11.9
712
.73
13.7
014
.65
14.6
515
.41
15.9
0R
egio
nal o
pera
tors
16.4
215
.56
15.7
315
.30
15.6
716
.56
15.8
817
.01
18.0
519
.03
19.9
619
.74
All
oper
ator
s20
.34
19.8
619
.33
17.0
514
.68
13.2
013
.70
15.1
316
.15
16.5
117
.34
17.7
3
1. A
vera
ge a
ge a
t the
end
of t
he fi
nanc
ial y
ear.
2. B
reak
in th
e se
ries
due
to c
hang
e in
met
hodo
logy
(see
Not
es a
nd D
efin
ition
s).
Tele
phon
e: 0
20 7
944
2419
Sou
rce:
Offi
ce o
f Rai
l Reg
ulat
ion
Em
ail:
rail.
stat
s@df
t.gsi
.gov
.uk
Last
upd
ated
: Dec
embe
r 201
2N
ext u
pdat
ed: D
ecem
ber 2
013
The
figur
es in
this
tabl
e ar
e ou
tsid
e th
e sc
ope
of N
atio
nal S
tatis
tics
Rai
l Sta
tistic
s (h
ttps:
//ww
w.g
ov.u
k/go
vern
men
t/org
anis
atio
ns/d
epar
tmen
t-for
-tran
spor
t/ser
ies/
rail-
stat
istic
s)
https://www.gov.uk/government/statistical-data-sets/tsgb06 156

Department for Transport statistics
Table RAI0210 (TSGB0607)
Passengers in excess of capacity (PiXC)1 on a typical autumn weekday on
London & South East train operators' services2,3: annual from 1990Percentage of passengers in excess of capacity; 3-hour peaks; all London & South East operators
Percentage
Year AM peak (07:00-09:59) PM peak (16:00-18:59) Both peaks
1990 4.3% 2.2% 3.3%1991 3.8% 2.1% 3.0%1992 3.7% 1.5% 2.7%1993 3.3% 1.4% 2.5%1994 3.2% 1.0% 2.1%
1995 3.0% 1.0% 2.1%1996 2.6% 1.2% 1.9%1997 3.9% 2.1% 3.1%1998 3.7% 1.4% 2.7%1999 3.8% 1.6% 2.8%
2000 5.1% 1.8% 3.6%2001 5.0% 1.7% 3.6%2002 3.7% 2.1% 2.9%2003 3.8% 1.5% 2.7%2004 4.1% 1.5% 2.9%
2005 4.0% 1.6% 2.9%2006 4.7% 1.9% 3.4%2007 4.2% 1.5% 3.0%2008 4.0% 1.8% 3.0%2009 2.9% 1.4% 2.2%
2010 4.0% 1.9% 3.0%2011R 4.0% 2.2% 3.2%
R 2011 figures were revised in December 2012. Details of this revision can be found in the correction note on the publication release page at the following link:
1 Percentage of standard class passengers in excess of the capacity on their train service. See Notes and definitions for more information.2 Applies to autumn weekday commuter services on a typical weekday arriving in London during the AM peak, and those departing during the PM peak. The measure is derived from the number of passengers travelling in excess of capacity on all services, divided by the total number of people travelling, and expressed as a percentage.3 Several different methods have been used to calculate the standing allowances included in the capacities for different types of rolling stock over this period, so earlier figures may not be directly comparable with more recent ones.
Source: Passenger counts; Department for Transport and Transport for LondonLast updated: 6 December 2012
Telephone: 020 7944 2419 Next updated: July 2013Email: [email protected]
The figures in this table are outside the scope of National Statistics
Notes and definitions (https://www.gov.uk/government/uploads/system/uploads/attachment_data/file/ 9078/rail-notes-definitions.pdf)
Rail Statistics (https://www.gov.uk/government/organisations/department-for-transport/series/rail-statistics)
https://www.gov.uk/government/publications/rail-passenger-numbers-and-crowding-on-weekdays-in-major-cities-in-england-and-wales-2011
https://www.gov.uk/government/statistical-data-sets/tsgb06 157

Dep
artm
ent
for
Tra
nsp
ort
Sta
tist
ics
Tab
le R
AI0
108
(TS
GB
0608
)C
han
nel
Tu
nn
el:
traf
fic
to a
nd
fro
m E
uro
pe,
an
nu
al f
rom
200
0T
ho
usa
nd
s
2000
2001
2002
2003
2004
2005
2006
2007
2008
2009
2010
2011
Veh
icle
s ca
rrie
d on
Le
Shu
ttle:
1
P
asse
nger
veh
icle
s2,
864
2,60
52,
408
2,35
12,
165
2,12
42,
089
2,20
71,
963
1,97
12,
182
2,31
9
Fre
ight
veh
icle
s1,
133
1,19
81,
231
1,28
51,
281
1,30
91,
296
1,41
51,
254
769
1,08
91,
263
A
ll ve
hicl
es3,
997
3,80
33,
639
3,63
63,
446
3,43
33,
385
3,62
23,
218
2,74
03,
271
3,58
2
Pas
seng
ers
on E
uros
tar2 a
nd L
e S
huttl
e317
,018
16,3
1315
,252
14,6
9915
,064
15,5
2715
,501
16,1
6416
,102
16,1
2817
,044
17,2
48
Thro
ugh-
train
frei
ght t
onne
s42,
947
2,44
71,
487
1,74
31,
889
1,58
81,
569
1,21
41,
239
1,18
11,
128
1,32
5
1. In
clud
es c
omm
erci
al a
nd n
on-c
omm
erci
al tr
affic
(see
Not
es a
nd D
efin
ition
s).
2. O
nly
Eur
osta
r pas
seng
ers
trave
lling
thro
ugh
the
Cha
nnel
Tun
nel a
re in
clud
ed; j
ourn
eys
betw
eens
Par
is-C
alai
s an
d B
russ
els-
Lille
are
exc
lude
d.3.
Le
Shu
ttle
pass
enge
r num
bers
exc
lude
non
-com
mer
cial
traf
fic.
4. R
ail f
reig
ht s
ervi
ces
by tr
ain
oper
ator
s (D
B S
chen
ker o
n be
half
of B
RB
, the
SN
CF
and
its s
ubsi
diar
ies,
and
Eur
opor
te) u
sing
the
Tunn
el.
Tele
phon
e: 0
20 7
944
2419
Sou
rces
: Eur
otun
nel,
Eur
osta
r and
EW
S In
tern
atio
nal/D
B S
chen
ker
Em
ail:
rail.
stat
s@df
t.gsi
.gov
.uk
Last
upd
ated
: Dec
embe
r 201
2N
ext u
pdat
ed: D
ecem
ber 2
013
The
figur
es in
this
tabl
e ar
e ou
tsid
e th
e sc
ope
of N
atio
nal S
tatis
tics
Rai
l Sta
tistic
s (h
ttps:
//ww
w.g
ov.u
k/go
vern
men
t/org
anis
atio
ns/d
epar
tmen
t-for
-tran
spor
t/ser
ies/
rail-
stat
istic
s)
https://www.gov.uk/government/statistical-data-sets/tsgb06 158

Department for Transport Statistics
Table RAI0302 (TSGB0625)Government support to the rail industry: annual from 1985/86
£ Million
Financial year
Central Government
grants1
Passenger Transport
Executive (PTE) grants
Direct rail
support2
Other Government
support3
Total government
supportFreight grants
1985/86 849 78 0 61 988 71986/87 755 70 0 22 847 61987/88 796 68 0 -251 613 21988/89 551 70 0 -175 446 21989/90 479 84 0 232 795 1
1990/91 637 115 0 440 1,192 41991/92 902 120 0 562 1,584 11992/93 1,194 107 0 870 2,171 21993/94 926 166 0 535 1,627 41994/95 1,815 346 0 -464 1,697 3
1995/964 1,712 362 0 -1,643 431 41996/974 1,809 291 0 -1,044 1,056 151997/98 1,429 375 0 25 1,829 291998/99 1,196 337 0 53 1,586 291999/00 1,031 312 0 75 1,418 23
2000/01 847 283 0 84 1,214 362001/02 731 306 684 105 1,826 572002/03 935 304 1,166 183 2,588 492003/04 1,359 414 1,670 179 3,622 322004/05 878 389 2,370 154 3,791 26
2005/06 879 332 3,366 24 4,602 232006/07 1,456 313 4,463 76 6,308 302007/08 1,123 310 3,673 187 5,293 182008/09 273 317 4,266 356 5,213 212009/10 467 316 3,798 38 4,619 20
2010/11 -51 207 3,680 125 3,960 202011/12 -133 214 3,744 76 3,901 17
1. Central Government grants involve payments to train operating companies and performance receipts received from train companies. Negative values reflect where the Government was in receipt of payments.2. Direct rail support comprises Network Grant payments to Network Rail, and includes payments to London and Continental Railways during the construction of the High Speed 1 route.3. Other Government support includes DfT support to the British Transport Police, Rail Pensions, Passenger Focus, the Rail Heritage Committee and a grant to British Rail to finance its residual activities.4. Following privatisation, the proceeds from the sales of rolling stock operating companies (ROSCOs) and British Rail non-passenger business in 1995-96 and 1996-97 are included in the Other Government support category.
Telephone: 020 7944 2419 Source: Department for Transport, Transport Scotland and Welsh AssemblyEmail: [email protected] Last updated: December 2012
Next updated: December 2013The figures in this table are outside the scope of National Statistics
Rail Statistics (https://www.gov.uk/government/organisations/department-for-transport/series/rail-statistics)
https://www.gov.uk/government/statistical-data-sets/tsgb06 159

Department for Transport Statistics
Table RAI0303 (TSGB0626)
Private investment in the rail industry 1,2: annual from 2006/07£ Million
2006/07 2007/08 2008/09 2009/10 2010/11 2011/12
Track and Signalling 106 8 2 -4 0 1Rolling Stock 326 400 345 423 274 369Stations 155 78 28 12 28 33Other Investment 156 79 79 29 74 99
Total Investment 743 566 455 460 377 503
1. These figures exclude Network Rail investment. Source: Office for National Statistics2. Negative numbers reflect the disposal of rail assets. Last updated: December 2012
Next updated: December 2013Telephone: 020 7944 2419Email: [email protected]
The figures in this table are outside the scope of National Statistics
Rail Statistics (https://www.gov.uk/government/organisations/department-for-transport/series/rail-statistics)
https://www.gov.uk/government/statistical-data-sets/tsgb06 160

Dep
artm
ent
for
Tra
nsp
ort
sta
tist
ics
Ligh
t rai
l sta
tistic
s ht
tps:
//ww
w.g
ov.u
k/go
vern
men
t/org
anis
atio
ns/d
epar
tmen
t-for
-tran
spor
t/ser
ies/
light
-rai
l-and
-tram
-sta
tistic
s
Tab
le L
RT
9901
a [m
iles]
(T
SG
B06
09)
Lo
nd
on
Un
der
gro
un
d s
tati
stic
s, a
nn
ual
fro
m 2
000/
01
Pas
sen
ger
Jo
urn
eys
(mill
ion
s)R
ecei
pts
(£
mill
ion
)
Ord
inar
y1S
easo
n
tick
etA
ll jo
urn
eys
Pas
sen
ger
m
iles
(mill
ion
s)
Lo
aded
tra
in
mile
s (m
illio
ns)
Sta
tio
ns
Rai
l ca
rria
ges
Ro
ute
m
iles
Ord
inar
y1S
easo
n
tick
etT
raff
ic
rece
ipts
Tra
ffic
rec
eip
ts
at 2
011/
12
pri
ces2
Rec
eip
ts p
er
jou
rney
(£)
Rec
eip
ts p
er
jny
at 2
011/
12
pri
ces2
2000
/01
486
484
970
4,64
240
274
3,95
425
461
051
91,
129
1,46
71.
161.
5120
01/0
249
146
295
34,
630
4027
43,
954
254
636
515
1,15
11,
467
1.21
1.54
2002
/03
495
446
942
4,57
841
274
3,95
425
462
851
01,
138
1,41
51.
211.
5020
03/0
449
145
794
84,
561
4327
43,
959
254
625
536
1,16
11,
413
1.22
1.49
2004
/05
486
490
976
4,72
643
274
3,95
925
466
357
81,
241
1,46
71.
271.
5020
05/0
646
051
097
04,
714
4327
44,
070
254
678
630
1,30
81,
511
1.35
1.56
2006
/07
519
521
1,04
04,
938
4327
34,
070
254
782
635
1,41
71,
595
1.36
1.53
2007
/08
581
515
1,09
65,
190
4326
84,
070
254
880
645
1,52
51,
674
1.39
1.53
2008
/09
616
473
1,08
95,
372
4427
04,
070
254
962
654
1,61
51,
726
1.48
1.58
2009
/10
634
425
1,05
95,
255
4327
04,
078
249
840
612
1,63
51,
722
1.54
1.63
2010
/11
660
447
1,10
75,
515
4327
04,
134
249
1,08
767
21,
759
1,80
11.
591.
6320
11/1
268
548
61,
171
5,91
545
270
4,12
724
91,
208
774
1,98
21,
982
1.69
1.69
1. O
rdin
ary
jour
neys
incl
ude
daily
trav
elca
rds
and
thos
e w
here
con
cess
iona
ry fa
res
appl
y.2.
Adj
ustm
ent t
o va
lues
usi
ng th
e H
M T
reas
ury
GD
P D
efla
tor (
as a
t 28
June
201
2). '
Oth
er' i
ncom
e no
long
er a
vaila
ble
on th
e sa
me
basi
s as
pre
viou
sly
publ
ishe
d.
Tele
phon
e: 0
20 7
944
3094
Sou
rce:
Tra
nspo
rt fo
r Lon
don
Em
ail:
bus.
stat
istic
s@df
t.gsi
.gov
.uk
Last
upd
ated
: Jul
y 20
12N
ext u
pdat
e: S
umm
er 2
013
The
figur
es in
this
tabl
e ar
e ou
tsid
e th
e sc
ope
of N
atio
nal S
tatis
tics
https://www.gov.uk/government/statistical-data-sets/tsgb06 161
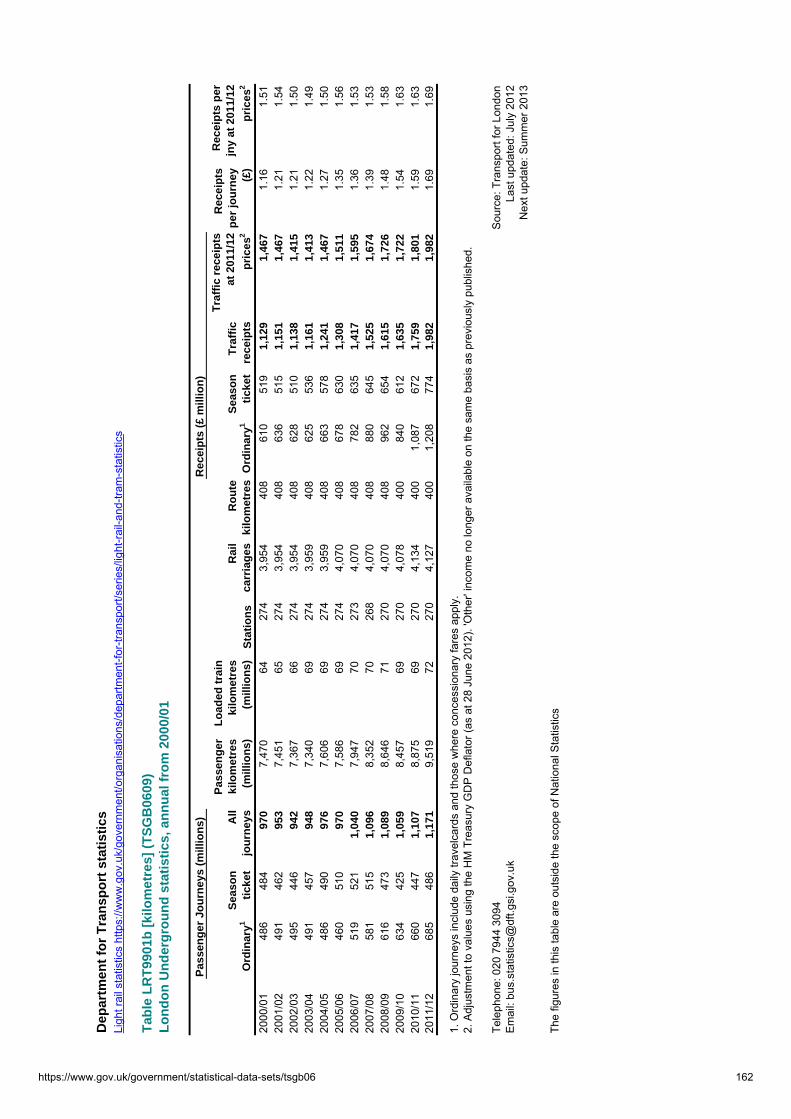
Dep
artm
ent
for
Tra
nsp
ort
sta
tist
ics
Ligh
t rai
l sta
tistic
s ht
tps:
//ww
w.g
ov.u
k/go
vern
men
t/org
anis
atio
ns/d
epar
tmen
t-for
-tran
spor
t/ser
ies/
light
-rai
l-and
-tram
-sta
tistic
s
Tab
le L
RT
9901
b [
kilo
met
res]
(T
SG
B06
09)
Lo
nd
on
Un
der
gro
un
d s
tati
stic
s, a
nn
ual
fro
m 2
000/
01
Pas
sen
ger
Jo
urn
eys
(mill
ion
s)R
ecei
pts
(£
mill
ion
)
Ord
inar
y1S
easo
n
tick
etA
ll jo
urn
eys
Pas
sen
ger
ki
lom
etre
s (m
illio
ns)
Lo
aded
tra
in
kilo
met
res
(mill
ion
s)S
tati
on
s R
ail
carr
iag
esR
ou
te
kilo
met
res
Ord
inar
y1S
easo
n
tick
etT
raff
ic
rece
ipts
Tra
ffic
rec
eip
ts
at 2
011/
12
pri
ces2
Rec
eip
ts
per
jou
rney
(£
)
Rec
eip
ts p
er
jny
at 2
011/
12
pri
ces2
2000
/01
486
484
970
7,47
064
274
3,95
440
861
051
91,
129
1,46
71.
161.
5120
01/0
249
146
295
37,
451
6527
43,
954
408
636
515
1,15
11,
467
1.21
1.54
2002
/03
495
446
942
7,36
766
274
3,95
440
862
851
01,
138
1,41
51.
211.
5020
03/0
449
145
794
87,
340
6927
43,
959
408
625
536
1,16
11,
413
1.22
1.49
2004
/05
486
490
976
7,60
669
274
3,95
940
866
357
81,
241
1,46
71.
271.
5020
05/0
646
051
097
07,
586
6927
44,
070
408
678
630
1,30
81,
511
1.35
1.56
2006
/07
519
521
1,04
07,
947
7027
34,
070
408
782
635
1,41
71,
595
1.36
1.53
2007
/08
581
515
1,09
68,
352
7026
84,
070
408
880
645
1,52
51,
674
1.39
1.53
2008
/09
616
473
1,08
98,
646
7127
04,
070
408
962
654
1,61
51,
726
1.48
1.58
2009
/10
634
425
1,05
98,
457
6927
04,
078
400
840
612
1,63
51,
722
1.54
1.63
2010
/11
660
447
1,10
78,
875
6927
04,
134
400
1,08
767
21,
759
1,80
11.
591.
6320
11/1
268
548
61,
171
9,51
972
270
4,12
740
01,
208
774
1,98
21,
982
1.69
1.69
1. O
rdin
ary
jour
neys
incl
ude
daily
trav
elca
rds
and
thos
e w
here
con
cess
iona
ry fa
res
appl
y.2.
Adj
ustm
ent t
o va
lues
usi
ng th
e H
M T
reas
ury
GD
P D
efla
tor (
as a
t 28
June
201
2). '
Oth
er' i
ncom
e no
long
er a
vaila
ble
on th
e sa
me
basi
s as
pre
viou
sly
publ
ishe
d.
Tele
phon
e: 0
20 7
944
3094
Sou
rce:
Tra
nspo
rt fo
r Lon
don
Em
ail:
bus.
stat
istic
s@df
t.gsi
.gov
.uk
Last
upd
ated
: Jul
y 20
12N
ext u
pdat
e: S
umm
er 2
013
The
figur
es in
this
tabl
e ar
e ou
tsid
e th
e sc
ope
of N
atio
nal S
tatis
tics
https://www.gov.uk/government/statistical-data-sets/tsgb06 162

Department for Transport statisticsLight rail statistics https://www.gov.uk/government/organisations/department-for-transport/series/light-rail-and-tram-statistics
Table LRT9902a [miles] (TSGB0610)Glasgow Underground statistics, annual from 1982/83
Passenger journeys (millions)
Passenger miles
(millions)
Loaded train or tram miles
[also referred to as vehicle miles]
(millions)Stations or stops
served
Passenger carriages
or tramcars
Route miles openfor passenger
traffic
Passenger revenue at2011/12 prices
(£ millions)1982/83 11.8 20.3 0.7 15 33 6.8 6.81983/84 12.3 21.5 0.7 15 33 6.8 8.21984/85 12.7 21.7 0.7 15 33 6.8 8.31985/86 13.1 22.5 0.7 15 33 6.8 7.91986/87 13.7 23.6 0.7 15 33 6.8 8.51987/88 13.6 24.3 0.7 15 33 6.8 8.51988/89 13.6 24.5 0.7 15 33 6.8 9.21989/90 13.5 24.3 0.7 15 33 6.8 8.91990/91 13.7 24.6 0.7 15 33 6.8 9.41991/92 13.6 24.4 0.7 15 33 6.8 9.41992/93 13.5 24.3 0.7 15 41 6.8 9.51993/94 14.3 25.7 0.7 15 41 6.8 10.11994/95 14.7 26.5 0.7 15 41 6.8 10.41995/96 14.3 25.7 0.7 15 41 6.8 11.31996/97 13.7 24.7 0.7 15 41 6.8 11.21997/98 14.1 28.1 0.7 15 41 6.8 11.71998/99 14.6 29.0 0.7 15 41 6.8 12.31999/00 14.7 29.2 0.7 15 41 6.8 13.02000/01 14.4 28.6 0.7 15 41 6.8 13.02001/02 13.8 27.4 0.7 15 41 6.8 12.92002/03 13.4 26.6 0.7 15 41 6.8 12.62003/04 13.3 26.5 0.7 15 41 6.8 12.62004/05 13.3 26.5 0.7 15 41 6.8 12.92005/06 13.2 26.2 0.7 15 41 6.5 12.92006/07 13.5 26.8 0.7 15 41 6.5 13.92007/08 14.5 28.8 0.8 15 41 6.5 14.22008/09 14.1 28.1 0.8 15 41 6.5 15.72009/10 13.1 26.0 0.7 15 41 6.5 14.82010/11 13.0 25.9 0.7 15 41 6.5 14.52011/12 12.9 25.6 0.8 15 41 6.5 14.3
Telephone: 020 7944 3094 Source: DfT Light Rail and Tram SurveyEmail: [email protected] Last updated: 19 July 2012Notes and Definitions (https://www.gov.uk/government/organisations/department-for-transport/series/light-rail-and-tram-statistics) Next update: Summer 2013
The figures in this table are outside the scope of National Statistics
https://www.gov.uk/government/statistical-data-sets/tsgb06 163

Department for Transport statisticsLight rail statistics https://www.gov.uk/government/organisations/department-for-transport/series/light-rail-and-tram-statistics
Table LRT9902b [kilometres] (TSGB0610)Glasgow Underground statistics, annual from 1982/83
Passenger journeys (millions)
Passenger kilometres (millions)
Loaded train or tram kilometres
[also referred to as vehicle kilometres]
(millions)Stations or stops
served
Passenger carriages
or tramcars
Route kilometres open for passenger
traffic
Passenger revenue at2011/12 prices
(£ millions)1982/83 11.8 32.7 1.1 15 33 11.0 6.81983/84 12.3 34.6 1.1 15 33 11.0 8.21984/85 12.7 34.9 1.1 15 33 11.0 8.31985/86 13.1 36.2 1.1 15 33 11.0 7.91986/87 13.7 38.0 1.1 15 33 11.0 8.51987/88 13.6 39.1 1.1 15 33 11.0 8.51988/89 13.6 39.4 1.2 15 33 11.0 9.21989/90 13.5 39.1 1.2 15 33 11.0 8.91990/91 13.7 39.6 1.1 15 33 11.0 9.41991/92 13.6 39.3 1.1 15 33 11.0 9.41992/93 13.5 39.1 1.1 15 41 11.0 9.51993/94 14.3 41.4 1.1 15 41 11.0 10.11994/95 14.7 42.6 1.1 15 41 11.0 10.41995/96 14.3 41.4 1.1 15 41 11.0 11.31996/97 13.7 39.8 1.1 15 41 11.0 11.21997/98 14.1 45.2 1.1 15 41 11.0 11.71998/99 14.6 46.7 1.1 15 41 11.0 12.31999/00 14.7 47.0 1.2 15 41 11.0 13.02000/01 14.4 46.1 1.2 15 41 11.0 13.02001/02 13.8 44.1 1.2 15 41 11.0 12.92002/03 13.4 42.8 1.1 15 41 11.0 12.62003/04 13.3 42.7 1.1 15 41 11.0 12.62004/05 13.3 42.6 1.1 15 41 11.0 12.92005/06 13.2 42.1 1.2 15 41 10.4 12.92006/07 13.5 43.2 1.2 15 41 10.4 13.92007/08 14.5 46.3 1.2 15 41 10.4 14.22008/09 14.1 45.2 1.2 15 41 10.4 15.72009/10 13.1 41.8 1.2 15 41 10.4 14.82010/11 13.0 41.6 1.1 15 41 10.4 14.52011/12 12.9 41.2 1.3 15 41 10.4 14.3
Telephone: 020 7944 3094 Source: DfT Light Rail and Tram SurveyEmail: [email protected] Last updated: 19 July 2012Notes and Definitions (https://www.gov.uk/government/organisations/department-for-transport/series/light-rail-and-tram-statistics) Next update: Summer 2013
The figures in this table are outside the scope of National Statistics
https://www.gov.uk/government/statistical-data-sets/tsgb06 164

Department for Transport statisticsLight rail statistics https://www.gov.uk/government/organisations/department-for-transport/series/light-rail-and-tram-statistics
Table LRT0101 (TSGB0611)
Passenger journeys on light rail and trams by system1: England - annual from 1983/84
Millions
Financial year
Docklands Light Railway
Croydon Tramlink
Nottingham Express
Transit Midland MetroSheffield
Supertram Tyne and
Wear Metro
Manchester
Metrolink2Blackpool Tramway England
1983/84 . . . . . 49.8 . 6.2 56.0
1984/85 . . . . . 57.2 . 6.0 63.2
1985/86 . . . . . 59.1 . 6.2 65.3
1986/87 . . . . . 46.4 . 6.2 52.6
1987/88 . . . . . 44.9 . 5.4 50.3
1988/89 6.6 . . . . 45.4 . 5.4 57.4
1989/90 8.5 . . . . 45.5 . 5.6 59.6
1990/91 8.0 . . . . 43.6 . 5.8 57.4
1991/92 7.9 . . . . 40.6 . 5.0 53.5
1992/93 6.9 . . . . 38.9 8.1 5.2 59.1
1993/94 8.3 . . . . 38.3 11.3 5.5 63.4
1994/95 11.3 . . . 2.2 37.0 12.3 5.4 68.2
1995/96 14.5 . . . 5.3 35.9 12.6 4.9 73.2
1996/97 16.7 . . . 7.8 35.4 13.4 4.9 78.2
1997/98 21.0 . . . 9.2 35.0 13.8 4.7 83.7
1998/99 27.6 . . . 10.4 33.8 13.2 4.4 89.3
1999/00 31.3 . . 4.8 10.9 32.7 14.2 4.3 98.2
2000/01 38.4 15.0 . 5.4 11.1 32.5 17.2 4.1 123.6
2001/02 41.3 18.2 . 4.8 11.4 33.4 18.2 4.9 132.2
2002/03 45.7 18.7 . 4.9 11.5 36.6 18.8 4.5 140.7
2003/04 48.5 19.8 0.4 5.1 12.3 37.9 18.9 3.7 146.5
2004/05 50.1 22.0 8.5 5.0 12.8 36.8 19.7 3.9 158.7
2005/06 53.5 22.5 9.8 5.1 13.1 35.8 19.9 3.6 163.4
2006/07 63.9 24.6 10.1 4.9 14.0 37.9 19.8 3.4 178.62007/08 66.6 27.2 10.2 4.8 14.8 39.8 20.0 2.9 186.22008/09 67.8 27.2 9.8 4.7 15.0 40.6 21.1 2.3 188.62009/10 69.4 25.8 9.0 4.7 14.7 40.8 19.6 2.2 186.22010/11 78.3 27.9 9.7 4.8 15.0 39.9 19.2 1.6 196.52011/12 86.1 28.6 9.0 4.9 15.0 37.9 21.8 1.1 204.3
1 For further information on these systems including network and infrastructure changes that may affect the figures, please refer to the technical information. 2 Manchester Metrolink have revised their method for calculation of passenger boardings so the figures from 2010/11 are not directly comparable with previous years.
Telephone: 020 7944 3094 Source: DfT Light Rail and Tram SurveyEmail: [email protected] Last updated: 19 July 2012Notes and Definitions (https://www.gov.uk/government/organisations/department-for-transport/series/light-rail-and-tram-statistics) Next update:Summer 2013
The figures in this table are National Statistics
https://www.gov.uk/government/statistical-data-sets/tsgb06 165
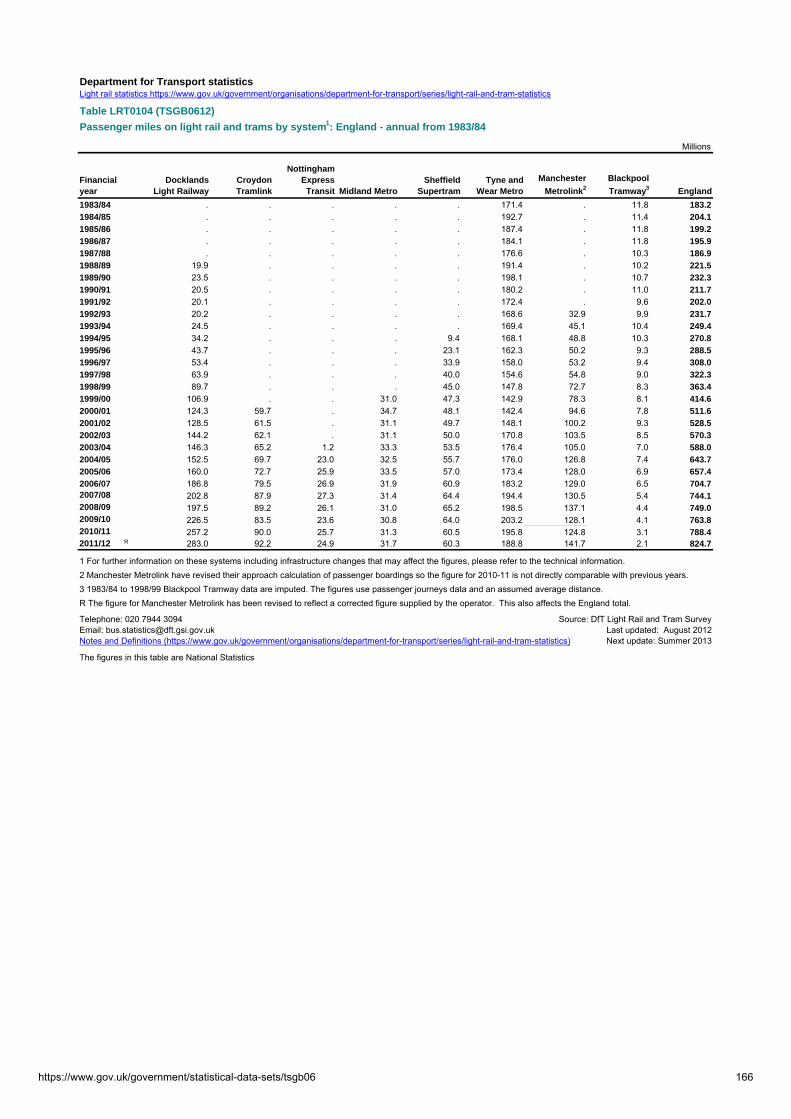
Department for Transport statisticsLight rail statistics https://www.gov.uk/government/organisations/department-for-transport/series/light-rail-and-tram-statistics
Table LRT0104 (TSGB0612)
Passenger miles on light rail and trams by system1: England - annual from 1983/84
Millions
Financial year
Docklands Light Railway
Croydon Tramlink
Nottingham Express
Transit Midland MetroSheffield
Supertram Tyne and
Wear Metro
Manchester
Metrolink2
Blackpool
Tramway3 England
1983/84 . . . . . 171.4 . 11.8 183.2
1984/85 . . . . . 192.7 . 11.4 204.1
1985/86 . . . . . 187.4 . 11.8 199.2
1986/87 . . . . . 184.1 . 11.8 195.9
1987/88 . . . . . 176.6 . 10.3 186.9
1988/89 19.9 . . . . 191.4 . 10.2 221.5
1989/90 23.5 . . . . 198.1 . 10.7 232.3
1990/91 20.5 . . . . 180.2 . 11.0 211.7
1991/92 20.1 . . . . 172.4 . 9.6 202.0
1992/93 20.2 . . . . 168.6 32.9 9.9 231.7
1993/94 24.5 . . . . 169.4 45.1 10.4 249.4
1994/95 34.2 . . . 9.4 168.1 48.8 10.3 270.8
1995/96 43.7 . . . 23.1 162.3 50.2 9.3 288.5
1996/97 53.4 . . . 33.9 158.0 53.2 9.4 308.0
1997/98 63.9 . . . 40.0 154.6 54.8 9.0 322.3
1998/99 89.7 . . . 45.0 147.8 72.7 8.3 363.4
1999/00 106.9 . . 31.0 47.3 142.9 78.3 8.1 414.6
2000/01 124.3 59.7 . 34.7 48.1 142.4 94.6 7.8 511.6
2001/02 128.5 61.5 . 31.1 49.7 148.1 100.2 9.3 528.5
2002/03 144.2 62.1 . 31.1 50.0 170.8 103.5 8.5 570.3
2003/04 146.3 65.2 1.2 33.3 53.5 176.4 105.0 7.0 588.0
2004/05 152.5 69.7 23.0 32.5 55.7 176.0 126.8 7.4 643.7
2005/06 160.0 72.7 25.9 33.5 57.0 173.4 128.0 6.9 657.4
2006/07 186.8 79.5 26.9 31.9 60.9 183.2 129.0 6.5 704.72007/08 202.8 87.9 27.3 31.4 64.4 194.4 130.5 5.4 744.12008/09 197.5 89.2 26.1 31.0 65.2 198.5 137.1 4.4 749.02009/10 226.5 83.5 23.6 30.8 64.0 203.2 128.1 4.1 763.82010/11 257.2 90.0 25.7 31.3 60.5 195.8 124.8 3.1 788.42011/12 R 283.0 92.2 24.9 31.7 60.3 188.8 141.7 2.1 824.7
1 For further information on these systems including infrastructure changes that may affect the figures, please refer to the technical information. 2 Manchester Metrolink have revised their approach calculation of passenger boardings so the figure for 2010-11 is not directly comparable with previous years.3 1983/84 to 1998/99 Blackpool Tramway data are imputed. The figures use passenger journeys data and an assumed average distance.R The figure for Manchester Metrolink has been revised to reflect a corrected figure supplied by the operator. This also affects the England total.
Telephone: 020 7944 3094 Source: DfT Light Rail and Tram SurveyEmail: [email protected] Last updated: August 2012Notes and Definitions (https://www.gov.uk/government/organisations/department-for-transport/series/light-rail-and-tram-statistics) Next update: Summer 2013
The figures in this table are National Statistics
https://www.gov.uk/government/statistical-data-sets/tsgb06 166

Department for Transport statisticsLight rail statistics https://www.gov.uk/government/organisations/department-for-transport/series/light-rail-and-tram-statistics
Table LRT0106 (TSGB0613)
Vehicle miles on light rail and trams by system1: England - annual from 1983/84
Millions
Financial year
Docklands Light Railway
Croydon Tramlink
Nottingham Express
Transit Midland MetroSheffield
Supertram Tyne and
Wear MetroManchester
MetrolinkBlackpool Tramway England
1983/84 . . . . . 3.2 . 0.8 3.9
1984/85 . . . . . 3.9 . 0.8 4.7
1985/86 . . . . . 3.6 . 0.8 4.4
1986/87 . . . . . 3.7 . 0.8 4.4
1987/88 . . . . . 3.5 . 0.8 4.3
1988/89 0.5 . . . . 3.4 . 0.8 4.7
1989/90 0.4 . . . . 3.6 . 0.8 4.8
1990/91 0.5 . . . . 3.7 . 0.8 5.0
1991/92 0.6 . . . . 3.7 . 0.8 5.1
1992/93 0.7 . . . . 3.5 1.2 0.9 6.3
1993/94 0.7 . . . . 3.4 1.2 0.9 6.2
1994/95 0.9 . . . 0.7 3.5 1.3 0.8 7.2
1995/96 1.2 . . . 1.6 3.4 1.3 0.8 8.3
1996/97 1.4 . . . 1.7 3.1 1.4 0.8 8.4
1997/98 1.5 . . . 1.7 3.0 2.0 0.8 8.9
1998/99 1.6 . . . 1.5 3.0 2.1 0.8 9.0
1999/00 1.8 . . 1.1 1.5 3.0 2.3 0.7 10.3
2000/01 1.8 1.3 . 1.2 1.5 2.9 2.7 0.8 12.2
2001/02 1.8 1.5 . 1.0 1.5 2.9 2.8 0.8 12.4
2002/03 2.0 1.5 . 1.1 1.6 3.9 2.9 0.7 13.7
2003/04 2.1 1.6 0.0 1.0 1.5 3.6 2.8 0.6 13.2
2004/05 2.0 1.5 0.6 1.0 1.5 3.5 2.8 0.5 13.5
2005/06 2.1 1.5 0.7 1.0 1.5 3.4 2.8 0.5 13.5
2006/07 2.7 1.6 0.7 1.0 1.5 3.6 2.3 0.6 14.12007/08 2.8 1.4 0.7 1.0 1.5 3.8 2.5 0.5 14.12008/09 2.5 1.4 0.7 1.0 1.5 3.5 2.4 0.5 13.52009/10 2.8 1.6 0.7 1.0 1.5 3.5 2.1 0.4 13.62010/11 2.9 1.6 0.7 1.0 1.5 3.5 2.3 0.3 13.92011/12 3.1 1.7 0.7 1.0 1.5 3.5 2.9 0.1 14.5
1 For further information on these systems including infrastructure changes that may affect the figures, please refer to the technical information.
Telephone: 020 7944 3094 Source: DfT Light Rail and Tram SurveyEmail: [email protected] Last updated: 19 July 2012Notes and Definitions (https://www.gov.uk/government/organisations/department-for-transport/series/light-rail-and-tram-statistics) Next update: Summer 2013
The figures in this table are National Statistics
https://www.gov.uk/government/statistical-data-sets/tsgb06 167

Department for Transport statisticsLight rail statistics https://www.gov.uk/government/organisations/department-for-transport/series/light-rail-and-tram-statistics
Table LRT0201 (TSGB0614)
Number of stations or stops on light rail and trams by system1: England - annual from 1995/96
Financial year
Docklands Light Railway
Croydon Tramlink
Nottingham Express
Transit Midland MetroSheffield
Supertram Tyne and
Wear MetroManchester
Metrolink
Blackpool
Tramway2 England
1995/96 28 . . . 45 46 26 62 207
1996/97 28 . . . 45 46 26 62 207
1997/98 29 . . . 46 46 26 62 209
1998/99 29 . . . 47 46 26 62 210
1999/00 34 . . 23 47 46 36 62 248
2000/01 34 38 . 23 47 46 36 62 286
2001/02 34 38 . 23 48 58 36 62 299
2002/03 34 38 . 23 48 58 37 62 300
2003/04 34 38 23 23 48 58 37 62 323
2004/05 34 38 23 23 48 58 37 62 323
2005/06 38 39 23 23 48 59 37 62 329
2006/07 34 39 23 23 48 59 37 61 3242007/08 39 38 23 23 48 60 37 61 3292008/09 40 39 23 23 48 60 37 61 3312009/10 40 39 23 23 48 60 37 59 3292010/11 40 39 23 23 48 60 38 59 3302011/12 45 39 23 23 48 60 42 31 311
1 For further information on these systems including infrastructure changes that may affect the figures, please refer to the technical information. 2 The number of stops has been shown for one direction of the route (as is the case with the other systems). In publications prior to 2011/12 the figures shown covered both directions.
Telephone: 020 7944 3094 Source: DfT Light Rail and Tram SurveyEmail: [email protected] Last updated: 19 July 2012Notes and Definitions (https://www.gov.uk/government/organisations/department-for-transport/series/light-rail-and-tram-statistics) Next update: Autumn 2013
The figures in this table are National Statistics
https://www.gov.uk/government/statistical-data-sets/tsgb06 168

Department for Transport statisticsLight rail statistics https://www.gov.uk/government/organisations/department-for-transport/series/light-rail-and-tram-statistics
Table LRT0202 (TSGB0615)
Passenger carriages or tram cars on light rail and trams by system1: England annual from 1983/84
Financial year
Docklands Light Railway
Croydon Tramlink
Nottingham Express
Transit Midland MetroSheffield
Supertram Tyne and
Wear MetroManchester
MetrolinkBlackpool Tramway England
1983/84 . . . . . 88 . 75 163
1984/85 . . . . . 88 . 75 163
1985/86 . . . . . 88 . 75 163
1986/87 . . . . . 88 . 75 163
1987/88 . . . . . 90 . 76 166
1988/89 11 . . . . 90 . 79 180
1989/90 11 . . . . 90 . 79 180
1990/91 21 . . . . 90 . 81 192
1991/92 40 . . . . 90 . 79 209
1992/93 38 . . . . 90 26 81 235
1993/94 86 . . . . 90 26 81 283
1994/95 86 . . . 25 90 26 81 308
1995/96 70 . . . 25 90 26 76 287
1996/97 70 . . . 25 90 26 76 287
1997/98 70 . . . 25 90 26 76 287
1998/99 70 . . . 25 90 26 76 287
1999/00 70 . . 16 25 90 32 75 308
2000/01 79 24 . 16 25 90 32 81 347
2001/02 74 24 . 16 25 90 32 75 336
2002/03 94 24 . 16 25 90 32 76 357
2003/04 94 24 15 16 25 90 32 76 372
2004/05 94 24 15 16 25 90 32 76 372
2005/06 94 24 15 16 25 90 32 76 372
2006/07 94 24 15 16 25 90 32 75 3712007/08 94 24 15 16 25 90 32 74 3702008/09 110 24 15 16 25 90 32 73 3852009/10 149 24 15 16 25 90 44 73 4362010/11 149 24 15 16 25 90 47 31 3972011/12 149 24 15 16 25 90 56 31 406
1 For further information on these systems including infrastructure changes that may affect the figures, please refer to the technical information.
Telephone: 020 7944 3094 Source: DfT Light Rail and Tram SurveyEmail: [email protected] Last updated: 19 July 2012Notes and Definitions (https://www.gov.uk/government/organisations/department-for-transport/series/light-rail-and-tram-statistics) Next update: Summer 2013
The figures in this table are National Statistics
https://www.gov.uk/government/statistical-data-sets/tsgb06 169
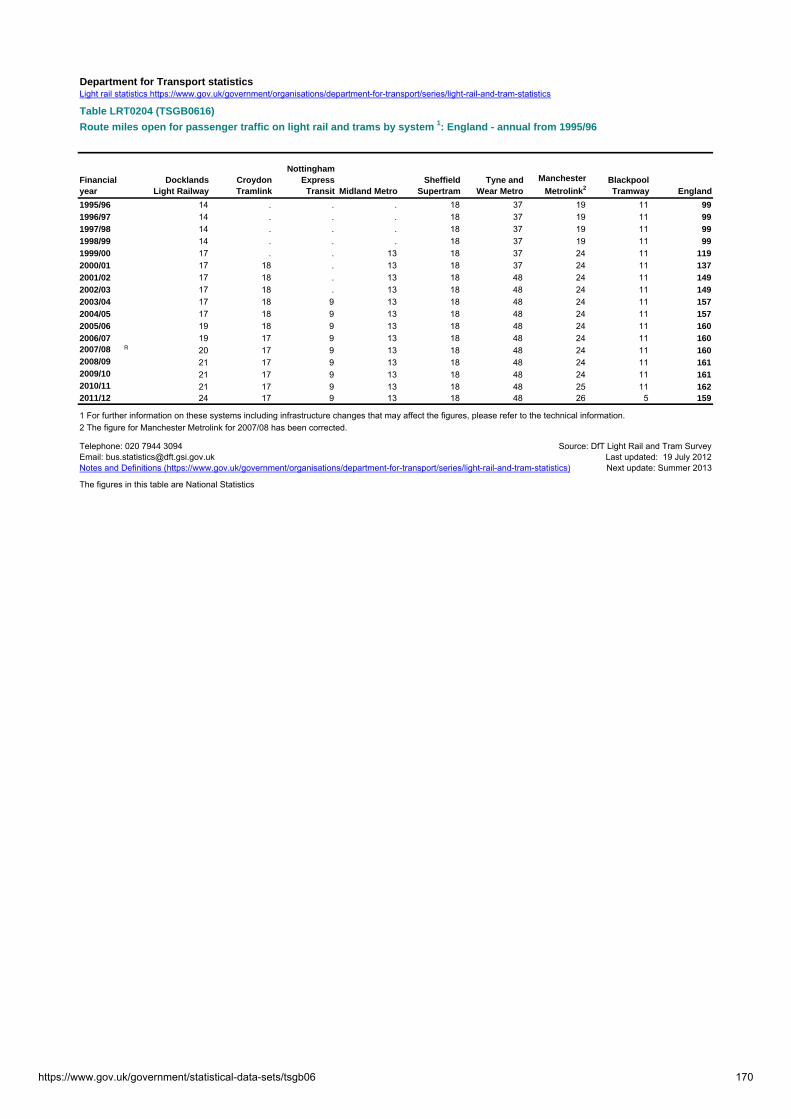
Department for Transport statisticsLight rail statistics https://www.gov.uk/government/organisations/department-for-transport/series/light-rail-and-tram-statistics
Table LRT0204 (TSGB0616)
Route miles open for passenger traffic on light rail and trams by system 1: England - annual from 1995/96
Financial year
Docklands Light Railway
Croydon Tramlink
Nottingham Express
Transit Midland MetroSheffield
Supertram Tyne and
Wear Metro
Manchester
Metrolink2Blackpool Tramway England
1995/96 14 . . . 18 37 19 11 99
1996/97 14 . . . 18 37 19 11 99
1997/98 14 . . . 18 37 19 11 99
1998/99 14 . . . 18 37 19 11 99
1999/00 17 . . 13 18 37 24 11 119
2000/01 17 18 . 13 18 37 24 11 137
2001/02 17 18 . 13 18 48 24 11 149
2002/03 17 18 . 13 18 48 24 11 149
2003/04 17 18 9 13 18 48 24 11 157
2004/05 17 18 9 13 18 48 24 11 157
2005/06 19 18 9 13 18 48 24 11 160
2006/07 19 17 9 13 18 48 24 11 1602007/08 R 20 17 9 13 18 48 24 11 1602008/09 21 17 9 13 18 48 24 11 1612009/10 21 17 9 13 18 48 24 11 1612010/11 21 17 9 13 18 48 25 11 1622011/12 24 17 9 13 18 48 26 5 159
1 For further information on these systems including infrastructure changes that may affect the figures, please refer to the technical information. 2 The figure for Manchester Metrolink for 2007/08 has been corrected.
Telephone: 020 7944 3094 Source: DfT Light Rail and Tram SurveyEmail: [email protected] Last updated: 19 July 2012Notes and Definitions (https://www.gov.uk/government/organisations/department-for-transport/series/light-rail-and-tram-statistics) Next update: Summer 2013
The figures in this table are National Statistics
https://www.gov.uk/government/statistical-data-sets/tsgb06 170

Department for Transport statisticsLight rail statistics https://www.gov.uk/government/organisations/department-for-transport/series/light-rail-and-tram-statistics
Table LRT0301 (TSGB0617)
Passenger revenue at 2011/12 prices1 on light rail and trams by system2: England - annual from 1983/84
£ Millions
Financial year
Docklands Light Railway
Croydon Tramlink
Nottingham Express
Transit Midland MetroSheffield
Supertram Tyne and
Wear MetroManchester
MetrolinkBlackpool Tramway England
1983/84 . . . . . 24.1 . 5.1 29.3
1984/85 . . . . . 25.3 . 4.9 30.2
1985/86 . . . . . 26.2 . 5.3 31.5
1986/87 . . . . . 27.6 . 5.1 32.7
1987/88 . . . . . 28.2 . 5.5 33.7
1988/89 4.7 . . . . 28.9 . 5.8 39.4
1989/90 5.7 . . . . 29.0 . 5.9 40.6
1990/91 5.0 . . . . 27.1 . 5.7 37.8
1991/92 4.5 . . . . 27.6 . 5.5 37.7
1992/93 5.2 . . . . 28.3 10.6 5.6 49.7
1993/94 6.7 . . . . 28.5 14.1 6.2 55.6
1994/95 9.4 . . . 2.3 28.3 14.5 6.4 60.9
1995/96 13.4 . . . 5.2 28.1 15.8 6.5 69.0
1996/97 16.6 . . . 6.5 28.7 18.3 6.2 76.2
1997/98 19.0 . . . 8.1 30.1 19.4 6.3 82.9
1998/99 26.6 . . . 8.1 30.0 20.6 5.6 90.9
1999/00 27.4 . . 3.3 8.8 30.4 22.2 5.6 97.7
2000/01 37.4 15.8 . 4.0 9.2 31.3 23.6 5.6 126.9
2001/02 41.1 16.5 . 4.9 9.7 31.9 25.7 6.0 135.8
2002/03 44.3 18.6 . 6.2 12.7 35.7 26.1 5.7 149.3
2003/04 45.3 19.6 . 6.3 11.2 38.2 25.5 4.8 150.9
2004/05 47.8 21.3 6.9 6.4 13.1 38.5 26.1 5.1 165.2
2005/06 53.3 21.8 8.5 6.8 12.1 39.7 26.2 5.0 173.3
2006/07 60.6 21.3 8.4 7.1 14.0 39.6 26.6 5.0 182.62007/08 69.3 22.9 8.7 6.9 15.1 40.9 24.6 4.4 192.72008/09 68.4 19.3 9.2 7.1 16.2 44.1 24.0 3.7 192.02009/10 78.8 17.1 8.3 6.8 15.8 42.9 24.7 3.1 197.72010/11 90.9 19.6 9.2 7.2 15.6 42.6 28.1 2.5 215.72011/12 105.3 21.2 8.4 7.4 15.4 42.2 33.7 1.7 235.3
1 Adjusted for inflation using the GDP market price deflator (as at 28 June 2012).2 For further information on these systems including infrastructure changes that may affect the figures, please refer to the technical information.
Telephone: 020 7944 3094 Source: DfT Light Rail and Tram SurveyEmail: [email protected] Last updated: 19 July 2012Notes and Definitions (https://www.gov.uk/government/organisations/department-for-transport/series/light-rail-and-tram-statistics) Next update: Summer 2013
The figures in this table are National Statistics
https://www.gov.uk/government/statistical-data-sets/tsgb06 171

Department for Transport statisticsBus statistics https://www.gov.uk/government/organisations/department-for-transport/series/bus-statistics
Table BUS0103 (TSGB0618)
Millions
Estimation
method1 London
English metropolitan
areas
English non-metropolitan
areas England Scotland Wales Great Britain
England outside London
1970 1,502 2,986 .. .. .. .. 8,643 ..1971 1,479 .. .. .. .. .. 8,128 ..1972 1,412 .. .. .. .. .. 7,901 ..1973 1,438 .. .. .. .. .. 7,866 ..1974 1,472 .. .. .. .. .. 7,706 ..1975 1,453 2,599 .. .. 891 .. 7,524 ..1976 1,421 2,459 .. .. 881 .. 7,141 ..1977 1,372 2,356 .. .. 824 .. 6,856 ..1978 1,300 2,269 .. .. 794 .. 6,617 ..1979 1,232 2,245 .. .. 786 .. 6,463 ..1980 1,181 2,207 .. .. 763 .. 6,216 ..1981 1,079 2,033 .. .. 716 .. 5,688 ..1982 1,041 1,981 1,615 4,637 694 181 5,512 3,5961983 1,087 2,011 1,623 4,721 680 180 5,581 3,6341984 1,162 2,047 1,598 4,807 669 168 5,644 3,6451985/86 1,152 2,068 1,582 4,801 671 163 5,635 3,6501986/87 2 1,164 1,810 1,565 4,538 644 152 5,335 3,3751987/88 1,207 1,732 1,545 4,484 647 156 5,287 3,2771988/89 1,211 1,695 1,496 4,402 647 161 5,210 3,1911989/90 1,188 1,648 1,468 4,304 613 151 5,068 3,1161990/91 1,178 1,547 1,390 4,115 585 145 4,845 2,9371991/92 1,149 1,478 1,328 3,956 571 133 4,660 2,8061992/93 1,129 1,383 1,302 3,814 532 129 4,475 2,6851993/94 1,117 1,337 1,268 3,722 525 133 4,381 2,6051994/95 1,155 1,330 1,273 3,758 513 132 4,403 2,6031995/96 1,193 1,358 1,303 3,853 506 130 4,489 2,6611996/97 1,230 1,310 1,304 3,844 478 133 4,455 2,6141997/98 1,281 1,292 1,286 3,859 448 122 4,430 2,5781998/99 1,266 1,256 1,286 3,808 424 118 4,350 2,5421999/00 1,294 1,213 1,297 3,804 455 117 4,376 2,5102000/01 1,347 1,203 1,292 3,842 458 119 4,420 2,4952001/02 1,422 1,196 1,263 3,881 466 108 4,455 2,4592002/03 1,527 1,182 1,255 3,964 471 115 4,550 2,4372003/04 1,692 1,162 1,233 4,087 478 116 4,681 2,3952004/05 Old .. 1,128 1,210 4,140 479 118 4,737 2,3382004/05 R New 1,802 1,069 1,177 4,049 460 123 4,631 2,2462005/06 R 1,881 1,070 1,184 4,135 466 120 4,721 2,2542006/07 R 1,993 1,073 1,253 4,320 476 119 4,915 2,3262007/08 R 2,160 1,099 1,297 4,556 488 121 5,165 2,3962008/09 R 2,228 1,105 1,330 4,663 484 125 5,272 2,4352009/10 R 2,238 1,086 1,315 4,639 459 116 5,214 2,4012010/11 R 2,269 1,070 1,317 4,656 431 116 5,203 2,3872011/12 2,324 1,041 1,314 4,678 439 116 5,233 2,355
1 Break in the local bus series (outside London) due to changes in the estimation methodology from 2004/052 Deregulation of the bus market took place in October 1986. For more information see the technical information (link below)R Previously published figures have been revised. For details of the revisions (which include planned updates) please see the technical information (link below)
Telephone: 020 7944 3094 Source: DfT Public Service Vehicle Survey, Transport for LondonEmail: [email protected] Last updated: 15 November 2012Notes & definitions (https://www.gov.uk/government/organisations/department-for-transport/series/bus-statistics) Next update: Autumn 2013
The figures in this table are National Statistics
Passenger journeys on local bus services by metropolitan area status and country: Great Britain, annual from 1970
https://www.gov.uk/government/statistical-data-sets/tsgb06 172

Department for Transport statisticsBus statistics https://www.gov.uk/government/organisations/department-for-transport/series/bus-statistics
Table BUS0203a (TSGB0619)Vehicle miles on local bus services by metropolitan area status and country: Great Britain, annual from 1970
Millions
Year
Estimation
method1 London
English metropolitan
areas
English non-metropolitan
areas England Scotland Wales Great Britain
England outside London
1970 199 427 .. .. .. .. 1,630 ..1971 197 .. .. .. .. .. 1,616 ..1972 190 .. .. .. .. .. 1,560 ..1973 180 .. .. .. .. .. 1,529 ..1974 174 .. .. .. .. .. 1,499 ..1975 176 416 .. .. 210 .. 1,520 ..1976 181 408 .. .. 204 .. 1,510 ..1977 180 391 .. .. 191 .. 1,456 ..1978 173 384 .. .. 185 .. 1,430 ..1979 165 378 .. .. 184 .. 1,391 ..1980 173 382 .. .. 188 .. 1,406 ..1981 175 365 .. .. 183 .. 1,331 ..1982 165 364 539 1,068 178 66 1,312 9031983 164 362 544 1,069 180 66 1,315 9061984 167 363 548 1,077 178 65 1,320 9111985/86 170 357 528 1,054 177 59 1,290 8851986/87 2 173 346 577 1,096 188 58 1,342 9231987/88 172 383 631 1,186 204 65 1,455 1,0141988/89 177 394 638 1,209 202 73 1,485 1,0321989/90 181 407 647 1,234 209 74 1,517 1,0541990/91 189 404 643 1,236 209 77 1,521 1,0471991/92 196 411 643 1,251 221 75 1,546 1,0541992/93 205 422 646 1,273 216 74 1,563 1,0681993/94 213 431 658 1,302 224 81 1,606 1,0891994/95 221 447 671 1,339 229 78 1,647 1,1181995/96 219 432 685 1,336 219 76 1,631 1,1171996/97 213 430 693 1,336 229 75 1,639 1,1231997/98 225 433 673 1,331 229 73 1,633 1,1061998/99 222 425 698 1,345 223 73 1,642 1,1231999/00 225 411 720 1,356 226 77 1,659 1,1312000/01 230 406 704 1,341 229 78 1,649 1,1102001/02 237 401 685 1,323 228 78 1,629 1,0862002/03 251 392 676 1,319 232 77 1,628 1,0682003/04 276 370 664 1,310 229 70 1,609 1,0342004/05 Old .. 357 669 1,318 222 72 1,612 1,0262004/05 R New 292 368 659 1,319 223 81 1,622 1,0272005/06 R 286 366 665 1,318 232 79 1,629 1,0312006/07 R 289 366 662 1,317 239 77 1,632 1,0282007/08 R 289 372 663 1,324 242 77 1,643 1,0352008/09 R 294 367 669 1,330 240 78 1,648 1,0362009/10 R 297 355 664 1,317 234 78 1,628 1,0192010/11 R 299 354 666 1,319 215 77 1,611 1,0202011/12 302 351 656 1,308 210 73 1,591 1,007
1 Break in the local bus series (outside London) due to changes in the estimation methodology from 2004/052 Deregulation of the bus market took place in October 1986. For more information see the technical information (link below)R Previously published figures have been revised. For details of the revisions (which include planned updates) please see the technical information (link below)
Telephone: 020 7944 3094 Source: DfT Public Service Vehicle Survey, Transport for LondonEmail: [email protected] Last updated: 15 November 2012Notes & definitions (https://www.gov.uk/government/organisations/department-for-transport/series/bus-statistics) Next update: Autumn 2013
The figures in this table are National Statistics
https://www.gov.uk/government/statistical-data-sets/tsgb06 173
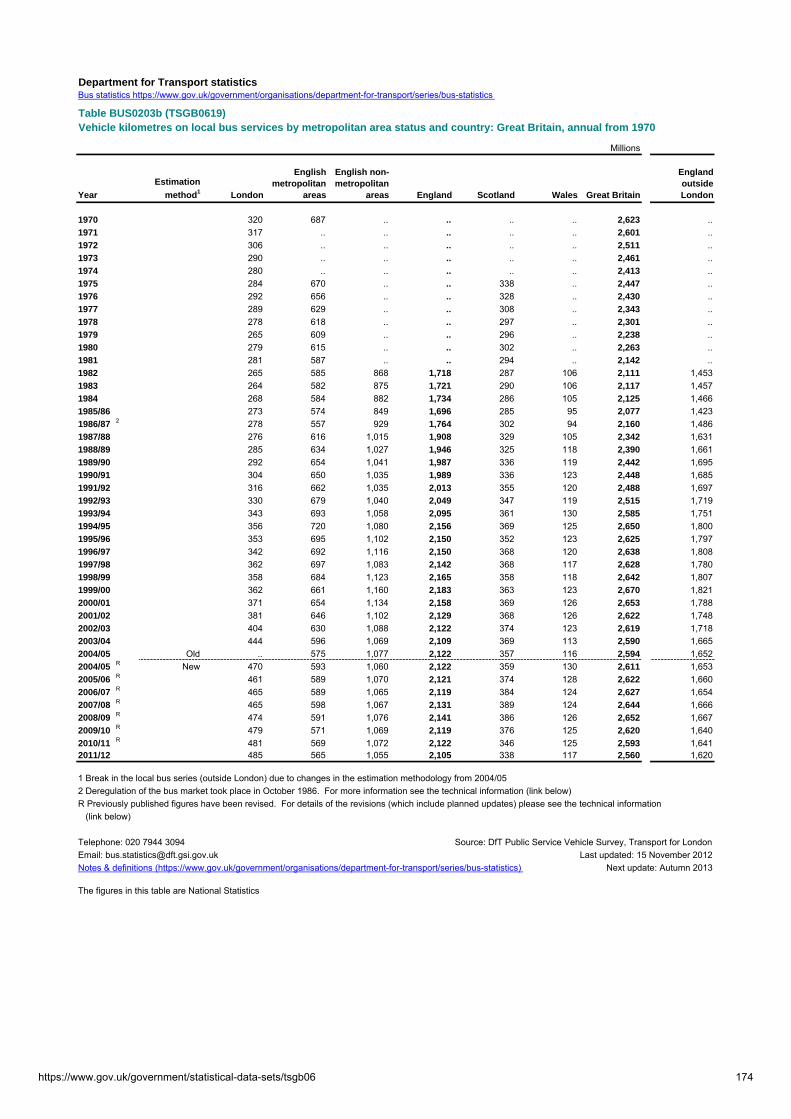
Department for Transport statisticsBus statistics https://www.gov.uk/government/organisations/department-for-transport/series/bus-statistics
Table BUS0203b (TSGB0619)Vehicle kilometres on local bus services by metropolitan area status and country: Great Britain, annual from 1970
Millions
Year
Estimation
method1 London
English metropolitan
areas
English non-metropolitan
areas England Scotland Wales Great Britain
England outside London
1970 320 687 .. .. .. .. 2,623 ..1971 317 .. .. .. .. .. 2,601 ..1972 306 .. .. .. .. .. 2,511 ..1973 290 .. .. .. .. .. 2,461 ..1974 280 .. .. .. .. .. 2,413 ..1975 284 670 .. .. 338 .. 2,447 ..1976 292 656 .. .. 328 .. 2,430 ..1977 289 629 .. .. 308 .. 2,343 ..1978 278 618 .. .. 297 .. 2,301 ..1979 265 609 .. .. 296 .. 2,238 ..1980 279 615 .. .. 302 .. 2,263 ..1981 281 587 .. .. 294 .. 2,142 ..1982 265 585 868 1,718 287 106 2,111 1,4531983 264 582 875 1,721 290 106 2,117 1,4571984 268 584 882 1,734 286 105 2,125 1,4661985/86 273 574 849 1,696 285 95 2,077 1,4231986/87 2 278 557 929 1,764 302 94 2,160 1,4861987/88 276 616 1,015 1,908 329 105 2,342 1,6311988/89 285 634 1,027 1,946 325 118 2,390 1,6611989/90 292 654 1,041 1,987 336 119 2,442 1,6951990/91 304 650 1,035 1,989 336 123 2,448 1,6851991/92 316 662 1,035 2,013 355 120 2,488 1,6971992/93 330 679 1,040 2,049 347 119 2,515 1,7191993/94 343 693 1,058 2,095 361 130 2,585 1,7511994/95 356 720 1,080 2,156 369 125 2,650 1,8001995/96 353 695 1,102 2,150 352 123 2,625 1,7971996/97 342 692 1,116 2,150 368 120 2,638 1,8081997/98 362 697 1,083 2,142 368 117 2,628 1,7801998/99 358 684 1,123 2,165 358 118 2,642 1,8071999/00 362 661 1,160 2,183 363 123 2,670 1,8212000/01 371 654 1,134 2,158 369 126 2,653 1,7882001/02 381 646 1,102 2,129 368 126 2,622 1,7482002/03 404 630 1,088 2,122 374 123 2,619 1,7182003/04 444 596 1,069 2,109 369 113 2,590 1,6652004/05 Old .. 575 1,077 2,122 357 116 2,594 1,6522004/05 R New 470 593 1,060 2,122 359 130 2,611 1,6532005/06 R 461 589 1,070 2,121 374 128 2,622 1,6602006/07 R 465 589 1,065 2,119 384 124 2,627 1,6542007/08 R 465 598 1,067 2,131 389 124 2,644 1,6662008/09 R 474 591 1,076 2,141 386 126 2,652 1,6672009/10 R 479 571 1,069 2,119 376 125 2,620 1,6402010/11 R 481 569 1,072 2,122 346 125 2,593 1,6412011/12 485 565 1,055 2,105 338 117 2,560 1,620
1 Break in the local bus series (outside London) due to changes in the estimation methodology from 2004/052 Deregulation of the bus market took place in October 1986. For more information see the technical information (link below)R Previously published figures have been revised. For details of the revisions (which include planned updates) please see the technical information (link below)
Telephone: 020 7944 3094 Source: DfT Public Service Vehicle Survey, Transport for LondonEmail: [email protected] Last updated: 15 November 2012Notes & definitions (https://www.gov.uk/government/organisations/department-for-transport/series/bus-statistics) Next update: Autumn 2013
The figures in this table are National Statistics
https://www.gov.uk/government/statistical-data-sets/tsgb06 174

Department for Transport statisticsBus statistics https://www.gov.uk/government/organisations/department-for-transport/series/bus-statistics
Table BUS0205a (TSGB0620)
Millions
Year
Estimation
method1 London2
English metropolitan
areas
English non-metropolitan
areas
England excluding
London Scotland WalesGreat Britain
excluding London
Commercial
1987/88 .. 318 524 842 175 50 1,067
1988/89 .. 327 532 859 175 55 1,089
1989/90 .. 340 534 874 180 58 1,112
1990/91 .. 345 534 879 181 61 1,121
1991/92 .. 354 528 882 189 58 1,129
1992/93 .. 363 533 896 187 57 1,140
1993/94 .. 377 541 918 191 61 1,170
1994/95 .. 392 552 944 198 61 1,203
1995/96 .. 373 564 937 183 62 1,182
1996/97 .. 374 577 951 193 59 1,203
1997/98 .. 375 557 932 193 57 1,182
1998/99 .. 373 570 943 185 55 1,183
1999/00 .. 360 592 952 191 58 1,201
2000/01 .. 356 574 930 195 60 1,185
2001/02 .. 349 538 887 190 59 1,136
2002/03 .. 341 523 864 193 55 1,112
2003/04 .. 316 511 827 188 53 1,068
2004/05 Old .. 305 499 804 187 52 1,043
2004/05 R New .. 317 487 804 187 56 1,046
2005/06 R .. 315 488 804 192 55 1,050
2006/07 R .. 313 481 794 191 52 1,037
2007/08 R .. 319 482 801 193 51 1,044
2008/09 R .. 311 481 792 193 52 1,038
2009/10 R .. 296 483 779 188 50 1,017
2010/11 R .. 295 488 783 174 50 1,006
2011/12 .. 296 495 791 174 51 1,016
Local authority supported
1987/88 .. 65 107 172 30 15 217
1988/89 .. 66 106 172 27 18 217
1989/90 .. 66 112 178 29 16 223
1990/91 .. 59 109 168 27 16 211
1991/92 .. 58 116 174 32 16 222
1992/93 .. 59 114 173 29 17 219
1993/94 .. 54 117 171 34 20 225
1994/95 .. 55 118 173 32 17 222
1995/96 .. 58 120 178 34 15 227
1996/97 .. 56 116 172 35 16 223
1997/98 .. 58 116 174 36 16 226
1998/99 .. 52 128 180 37 19 236
1999/00 .. 50 128 178 35 18 231
2000/01 .. 50 130 180 35 18 233
2001/02 .. 53 147 200 39 19 258
2002/03 .. 51 153 204 39 22 265
2003/04 .. 54 153 207 42 17 266
2004/05 Old .. 53 170 223 35 20 278
2004/05 R New .. 51 171 223 37 25 284
2005/06 R .. 51 177 227 41 24 292
2006/07 R .. 53 181 234 48 25 307
2007/08 R .. 53 181 234 49 26 310
2008/09 R .. 56 187 243 46 26 316
2009/10 R .. 59 181 240 46 27 313
2010/11 R .. 59 178 237 41 28 3062011/12 .. 55 160 215 36 22 274
1 Break in the local bus series (outside London) due to changes in the estimation methodology from 2004/052 Buses in London operate under a different regulatory model to the rest of the country, and comparisons on a service type basis wouldhave little meaning. London figures are therefore excluded from this table.R Previously published figures have been revised. For details of the revisions (which include planned updates) please see the technical information (link below)
Telephone: 020 7944 3094 Source: DfT Public Service Vehicle Survey, Transport for LondonEmail: [email protected] Last updated: 15 November 2012Notes and definitions (https://www.gov.uk/government/organisations/department-for-transport/series/bus-statistics) Next update: Autumn 2013The figures in this table are National Statistics
Vehicle miles on local bus services by metropolitan area status and country, and service type: Great Britain, annual from 1987/88
https://www.gov.uk/government/statistical-data-sets/tsgb06 175

Department for Transport statisticsBus statistics https://www.gov.uk/government/organisations/department-for-transport/series/bus-statistics
Table BUS0205b (TSGB0620)
Millions
Year
Estimation
method1 London2
English metropolitan
areas
English non-metropolitan
areas
England excluding
London Scotland Wales
Great Britain excluding
London
Commercial
1987/88 .. 512 844 1,356 281 81 1,718
1988/89 .. 527 856 1,383 281 89 1,753
1989/90 .. 547 859 1,406 289 94 1,789
1990/91 .. 555 859 1,414 292 98 1,804
1991/92 .. 569 849 1,418 304 94 1,816
1992/93 .. 584 857 1,441 301 91 1,833
1993/94 .. 606 870 1,476 307 98 1,881
1994/95 .. 631 889 1,520 318 98 1,936
1995/96 .. 601 908 1,509 295 99 1,903
1996/97 .. 602 929 1,531 311 95 1,937
1997/98 .. 604 897 1,501 310 92 1,903
1998/99 .. 601 918 1,519 298 88 1,905
1999/00 .. 580 953 1,533 307 94 1,934
2000/01 .. 573 923 1,496 314 97 1,907
2001/02 .. 561 866 1,427 306 95 1,828
2002/03 .. 549 841 1,390 311 89 1,790
2003/04 .. 509 823 1,332 302 85 1,719
2004/05 Old .. 491 803 1,294 301 84 1,679
2004/05 New .. 510 784 1,295 300 89 1,684
2005/06 .. 508 786 1,294 308 88 1,691
2006/07 .. 504 774 1,277 307 84 1,668
2007/08 .. 513 776 1,289 310 82 1,681
2008/09 .. 500 775 1,275 311 84 1,670
2009/10 .. 476 778 1,254 302 81 1,637
2010/11 .. 474 785 1,259 280 80 1,620
2011/12 .. 476 797 1,274 279 82 1,635
Local authority supported
1987/88 .. 105 172 277 48 24 349
1988/89 .. 107 171 278 44 29 351
1989/90 .. 107 181 288 47 26 361
1990/91 .. 95 176 271 44 25 340
1991/92 .. 93 186 279 51 26 356
1992/93 .. 95 183 278 46 27 351
1993/94 .. 87 188 275 54 32 361
1994/95 .. 89 190 279 51 27 357
1995/96 .. 94 193 287 54 24 365
1996/97 .. 90 187 277 57 25 359
1997/98 .. 93 186 279 58 25 362
1998/99 .. 84 206 290 60 30 380
1999/00 .. 81 206 287 56 29 372
2000/01 .. 81 210 291 56 29 376
2001/02 .. 85 236 321 62 31 414
2002/03 .. 82 247 329 63 35 427
2003/04 .. 87 246 333 67 28 428
2004/05 Old .. 85 274 359 56 32 447
2004/05 R New .. 82 276 358 59 40 457
2005/06 R .. 82 284 366 66 39 471
2006/07 R .. 85 291 377 77 40 494
2007/08 R .. 85 292 377 79 42 498
2008/09 R .. 90 302 392 74 42 509
2009/10 R .. 95 291 386 74 44 504
2010/11 R .. 95 287 382 66 44 4922011/12 .. 88 258 346 58 35 440
1 Break in the local bus series (outside London) due to changes in the estimation methodology from 2004/052 Buses in London operate under a different regulatory model to the rest of the country, and comparisons on a service type basis wouldhave little meaning. London figures are therefore excluded from this table.R Previously published figures have been revised. For details of the revisions (which include planned updates) please see the technical information (link below)
Telephone: 020 7944 3094 Source: DfT Public Service Vehicle Survey, Transport for LondonEmail: [email protected] Last updated: 15 November 2012Notes and definitions (https://www.gov.uk/government/organisations/department-for-transport/series/bus-statistics) Next update: Autumn 2013The figures in this table are National Statistics
Vehicle kilometres on local bus services by metropolitan area status and country, and service type: Great Britain, annual from 1987/88
https://www.gov.uk/government/statistical-data-sets/tsgb06 176

Department for Transport statisticsBus Statistics (www.gov.uk/government/organisations/department-for-transport/series/bus-statistics)
Table BUS0405a (TSGB0621)
Local bus fares index (at current prices2) by metropolitan area status and country: Great Britain, annual from 1995
March 2005=100
Local bus fares index
Year1
All items Retail
Prices Index London
English metropolitan
areas
English non-metropolitan
areas England Scotland Wales Great Britain
England outside London
1995 R 77.4 71.1 61.8 61.8 63.9 70.2 63.5 64.6 63.1
1996 R 79.5 74.3 65.2 64.7 67.0 72.4 64.5 67.6 66.0
1997 R 81.6 77.0 69.0 67.9 70.2 77.8 67.2 71.1 69.8
1998 R 84.4 80.0 72.6 71.4 73.6 84.1 71.8 74.9 73.7
1999 R 86.1 83.3 75.8 74.9 77.0 87.5 75.3 78.3 77.2
2000 R 88.4 83.2 79.1 78.4 79.6 89.6 80.3 80.9 80.5
2001 R 90.4 83.9 83.3 82.7 82.9 92.2 84.7 84.1 84.4
2002 R 91.6 81.5 87.3 86.6 85.3 93.5 88.6 86.4 87.9
2003 R 94.4 81.8 90.3 90.8 88.0 96.1 91.6 89.2 91.5
2004 R 96.9 86.9 94.7 95.3 92.7 97.1 95.8 93.4 95.42005 100.0 100.0 100.0 100.0 100.0 100.0 100.0 100.0 100.02006 102.4 105.7 111.9 107.8 108.3 105.1 105.0 107.9 109.62007 107.3 116.6 113.6 102.0 110.2 111.4 111.5 110.4 106.92008 111.3 111.2 121.6 106.7 112.8 116.7 117.5 113.4 113.02009 110.9 120.0 136.5 113.9 122.5 126.5 125.3 123.1 123.22010 115.9 135.2 137.6 115.6 128.8 129.5 128.7 129.0 124.72011 122.0 144.5 146.4 119.4 135.7 132.2 130.1 135.2 130.32012 126.4 152.3 156.2 127.0 144.0 139.1 137.8 143.4 138.9
1 Index as at March.2 Not adjusted for inflation.R Previously published figures for England (total), Wales and Scotland have been revised to correct a calculation error.
Telephone: 020 7944 3094 Source: DfT Fares Survey, Office for National StatisticsEmail: [email protected] Last updated: 20 September 2012 (corrected November 2012)
Next update: Autumn 2013Notes and Definitions (https://www.gov.uk/government/organisations/department-for-transport/series/bus-statistics)
The figures in this table are National Statistics
https://www.gov.uk/government/statistical-data-sets/tsgb06 177
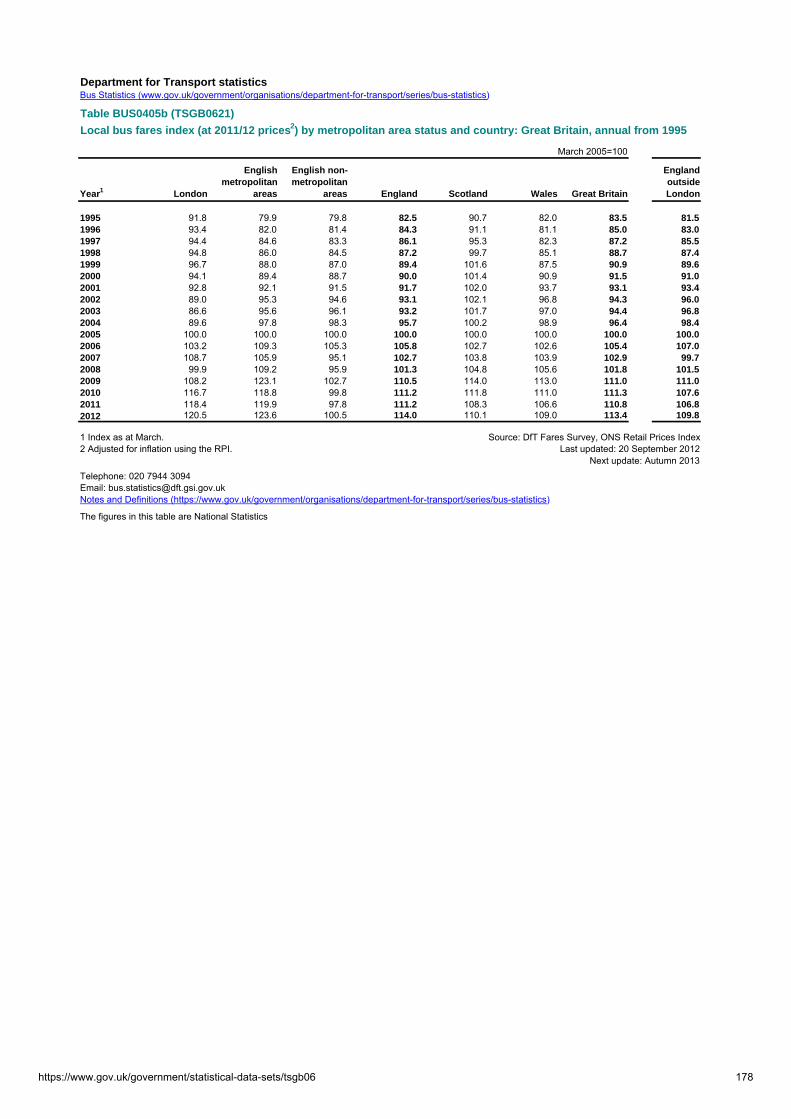
Department for Transport statisticsBus Statistics (www.gov.uk/government/organisations/department-for-transport/series/bus-statistics)
Table BUS0405b (TSGB0621)
Local bus fares index (at 2011/12 prices2) by metropolitan area status and country: Great Britain, annual from 1995
March 2005=100
Year1 London
English metropolitan
areas
English non-metropolitan
areas England Scotland Wales Great Britain
England outside London
1995 91.8 79.9 79.8 82.5 90.7 82.0 83.5 81.51996 93.4 82.0 81.4 84.3 91.1 81.1 85.0 83.01997 94.4 84.6 83.3 86.1 95.3 82.3 87.2 85.51998 94.8 86.0 84.5 87.2 99.7 85.1 88.7 87.41999 96.7 88.0 87.0 89.4 101.6 87.5 90.9 89.62000 94.1 89.4 88.7 90.0 101.4 90.9 91.5 91.02001 92.8 92.1 91.5 91.7 102.0 93.7 93.1 93.42002 89.0 95.3 94.6 93.1 102.1 96.8 94.3 96.02003 86.6 95.6 96.1 93.2 101.7 97.0 94.4 96.82004 89.6 97.8 98.3 95.7 100.2 98.9 96.4 98.42005 100.0 100.0 100.0 100.0 100.0 100.0 100.0 100.02006 103.2 109.3 105.3 105.8 102.7 102.6 105.4 107.02007 108.7 105.9 95.1 102.7 103.8 103.9 102.9 99.72008 99.9 109.2 95.9 101.3 104.8 105.6 101.8 101.52009 108.2 123.1 102.7 110.5 114.0 113.0 111.0 111.02010 116.7 118.8 99.8 111.2 111.8 111.0 111.3 107.62011 118.4 119.9 97.8 111.2 108.3 106.6 110.8 106.82012 120.5 123.6 100.5 114.0 110.1 109.0 113.4 109.8
1 Index as at March. Source: DfT Fares Survey, ONS Retail Prices Index2 Adjusted for inflation using the RPI. Last updated: 20 September 2012
Telephone: 020 7944 3094
Next update: Autumn 2013
Email: [email protected] and Definitions (https://www.gov.uk/government/organisations/department-for-transport/series/bus-statistics)
The figures in this table are National Statistics
https://www.gov.uk/government/statistical-data-sets/tsgb06 178

Department for Transport statisticsBus Statistics (https://www.gov.uk/government/organisations/department-for-transport/series/bus-statistics)
Table BUS0501a (TSGB0622)
£ Millions
Area / Financial Year
Passenger
fare receipts3
Gross Public
Transport Support4
Concessionary
Travel5Bus Service
Operators Grant6
Total estimated
operating revenue1
England
2004/05 R 2,303 934 485 348 4,070
2005/06 R 2,447 1,021 481 363 4,312
2006/07 R 2,460 1,088 724 367 4,639
2007/08 R 2,562 1,140 807 392 4,901
2008/09 R 8 2,653 1,263 926 423 5,266
2009/10 R 9 2,738 1,229 970 430 5,368
2010/11 R 2,884 1,061 1,004 420 5,369
2011/12 P 3,005 994 995 430 5,425
London7
2004/05 R 727 556 138 91 1,512
2005/06 R 788 596 151 95 1,630
2006/07 R 840 617 162 97 1,716
2007/08 R 872 662 176 103 1,813
2008/09 R 8 882 725 181 113 1,900
2009/10 R 9 941 692 183 112 1,928
2010/11 R 1,058 564 191 108 1,922
2011/12 1,117 519 210 111 1,956
English metropolitan areas
2004/05 R 661 105 215 92 1,073
2005/06 R 695 117 191 95 1,099
2006/07 R 679 131 251 96 1,157
2007/08 R 692 134 265 104 1,195
2008/09 R 8 717 140 288 110 1,254
2009/10 R 9 726 137 310 111 1,284
2010/11 R 744 127 309 108 1,289
2011/12 P 763 129 302 111 1,306
English non-metropolitan areas
2004/05 R 914 273 133 165 1,485
2005/06 R 964 308 139 173 1,583
2006/07 R 940 341 311 174 1,766
2007/08 R 998 343 366 185 1,893
2008/09 R 8 1,054 399 458 200 2,111
2009/10 R 9 1,071 400 477 207 2,1562010/11 R 1,081 369 504 204 2,1582011/12 1,125 346 483 208 2,163
1. Excludes capital receipts, and other streams of bus operator revenue that are not directly related to the provision of local bus services (e.g. income from advertising, private hire work, etc.)2. These figures are not adjusted for inflation.3. Only includes fare receipts retained by bus operators. On some tendered or supported services, fare receipts are passed to the local authority.4. Public Transport Support is the total of all local authorities' gross costs incurred in support of bus services, either directly or by subsidies to operators orindividuals. The bulk of these costs will be accounted for by payments to operators providing tendered or supported bus services (including non-local servicesin some case). However, the figures also include administration costs and some inter-authority transfers, meaning that a small proportion of the sums shown will not reach bus operators. In London it will also include depreciation on capital.5. Concessionary Travel is the total of all local authorities' net costs of statutory or discretionary concessionary bus travel.Discretionary concessionary travel is decided by local authorites, and can include travel for those that not included within the statutory concession, travelwithin the peak or travel on other modes. These figures exclude travel on the London Underground, Mersey Ferries and Rail, West Yorkshire PTE Rail, andLight Rail Systems, however they do include funding for taxi tokens. Table bus0811 shows the total including all discretionary elements excluded here.Although gross local authority costs would normally be the best measure of operators' revenue, net costs have been used in preference to gross costsin this table. This is because the latter figures include double-counting as a result of substantial inter-authority funding transfers, where one local authorityadministers a concessionary travel scheme on behalf of several others. The figures include administration costs, meaning that a small proportion of the sums shown will not reach bus operators.6. Bus Service Operators Grant (BSOG) is a subsidy provided by Central Government to operators of local bus services.The distribution of BSOG payments between English Metropolitan areas and English non-Metropolitan areas is an estimate.These figures include payments for the BSOG AVL and smartcard incentives from April 2010, but not the coach concession.7. London runs an entirely tendered market and therefore some comparisons with the rest of country should be treated with care. For example concessionarytravel is available on other modes than buses. Concessionary Fare Reimbursement in London includes funding from London Councils, received throughspecial grant. The figures are supplied by London Councils and will not necessarily equal RSG Funding plus London Councils' Special Grant.8. Until 2009/10 figures in this table for public transport support, and concessionary travel outside London, were on a Financial Reporting Standard 17 (FRS17)basis. For 2009/10 they are on a non-FRS17 basis. For 2010/11 onwards they are on a non-International Accounting Standard 19 (IAS19) basis.9. The 2009/10 figures contain an additional element of spending, RECS, which for other years is included only in capital charges and therefore excludedfrom current expenditure (as shown here). This may affect comparisons with previous or following years.R Minor revisions have been made to earlier years data.P We are expecting a revision to the 2011/12 “public transport support” figure in one metropolitan transport authority. The revised figure is not yet available so,as an interim step, we have used an estimate for this authority based on published budget data.
Telephone: 020 7944 3094 Source: DfT Public Service Vehicle Survey, CLG RO forms, DfT BSOG returns, London CouncilsEmail: [email protected] Last updated: December 2012Notes and definitions (https://www.gov.uk/government/organisations/department-for-transport/series/bus-statistics) Next update: Autumn 2013
The figures in this table are National Statistics
Estimated operating revenue1 (at current prices2) for local bus services by revenue type and metropolitan area status: England, annual from 2004/05
https://www.gov.uk/government/statistical-data-sets/tsgb06 179

Department for Transport statisticsBus Statistics (https://www.gov.uk/government/organisations/department-for-transport/series/bus-statistics)
Table BUS0501b (TSGB0622)
£ Millions
Area / Financial Year
Passenger
fare receipts3
Gross Public
Transport Support4
Concessionary
Travel5Bus Service
Operators Grant6
Total estimated
operating revenue1
England
2004/05 R 2,722 1,103 574 411 4,809
2005/06 R 2,827 1,180 555 420 4,982
2006/07 R 2,767 1,224 815 413 5,219
2007/08 R 2,813 1,251 886 431 5,380
2008/09 R 8 2,835 1,350 990 452 5,627
2009/10 R 9 2,883 1,294 1,021 453 5,651
2010/11 R 2,951 1,085 1,027 430 5,494
2011/12 P 3,005 994 995 430 5,425
London7
2004/05 R 859 656 163 107 1,786
2005/06 R 911 689 174 110 1,884
2006/07 R 946 694 182 109 1,930
2007/08 R 957 727 193 113 1,990
2008/09 R 8 942 775 193 121 2,031
2009/10 R 9 990 729 193 118 2,030
2010/11 R 1,083 578 195 110 1,967
2011/12 1,117 519 210 111 1,956
English metropolitan areas
2004/05 R 782 124 254 109 1,268
2005/06 R 803 136 221 110 1,269
2006/07 R 764 147 282 108 1,302
2007/08 R 760 148 291 114 1,312
2008/09 R 8 766 149 307 117 1,340
2009/10 R 9 765 145 326 117 1,352
2010/11 R 762 130 316 111 1,319
2011/12 P 763 129 302 111 1,306
English non-metropolitan areas
2004/05 R 1,080 323 157 195 1,755
2005/06 R 1,113 356 160 200 1,829
2006/07 R 1,058 383 350 196 1,987
2007/08 R 1,096 377 402 203 2,078
2008/09 R 8 1,127 426 489 214 2,256
2009/10 R 9 1,128 421 503 218 2,2702010/11 R 1,107 377 516 209 2,2092011/12 1,125 346 483 208 2,163
1. Excludes capital receipts, and other streams of bus operator revenue that are not directly related to the provision of local bus services (e.g. income from advertising, private hire work, etc.)2. Adjusted for inflation using GDP deflator (as at 27 September 2012).3. Only includes fare receipts retained by bus operators. On some tendered or supported services, fare receipts are passed to the local authority.4. Public Transport Support is the total of all local authorities' gross costs incurred in support of bus services, either directly or by subsidies to operators orindividuals. The bulk of these costs will be accounted for by payments to operators providing tendered or supported bus services (including non-local servicesin some case). However, the figures also include administration costs and some inter-authority transfers, meaning that a small proportion of the sums shown will not reach bus operators. In London it will also include depreciation on capital.5. Concessionary Travel is the total of all local authorities' net costs of statutory or discretionary concessionary bus travel.Discretionary concessionary travel is decided by local authorites, and can include travel for those that not included within the statutory concession, travelwithin the peak or travel on other modes. These figures exclude travel on the London Underground, Mersey Ferries and Rail, West Yorkshire PTE Rail and Light Rail Systems, however they do include funding for taxi tokens. Table bus0811 shows the total including all discretionary elements excluded here.Although gross local authority costs would normally be the best measure of operators' revenue, net costs have been used in preference to gross costsin this table. This is because the latter figures include double-counting as a result of substantial inter-authority funding transfers, where one local authorityadministers a concessionary travel scheme on behalf of several others. The figures include administration costs, meaning that a small proportion of the sums shown will not reach bus operators.6. Bus Service Operators Grant (BSOG) is a subsidy provided by Central Government to operators of local bus services.The distribution of BSOG payments between English Metropolitan areas and English non-Metropolitan areas is an estimate.These figures include payments for the BSOG AVL and smartcard incentives from April 2010, but not the coach concession.7. London runs an entirely tendered market and therefore some comparisons with the rest of country should be treated with care. For example concessionarytravel is available on other modes than buses. Concessionary Fare Reimbursement in London includes funding from London Councils, received throughspecial grant. The figures are supplied by London Councils and will not necessarily equal RSG Funding plus London Councils' Special Grant.8. Until 2009/10 figures in this table for public transport support, and concessionary travel outside London, were on a Financial Reporting Standard 17 (FRS17)basis. For 2009/10 they are on a non-FRS17 basis. For 2010/11 onwards they are on a non-International Accounting Standard 19 (IAS19) basis.9. The 2009/10 figures contain an additional element of spending, RECS, which for other years is included only in capital charges and therefore excludedfrom current expenditure (as shown here). This may affect comparisons with previous or following years.R Minor revisions have been made to earlier years data.P We are expecting a revision to the 2011/12 “public transport support” figure in one metropolitan transport authority. The revised figure is not yet available so,as an interim step, we have used an estimate for this authority based on published budget data.
Source: DfT Public Service Vehicle Survey, CLG RO forms, DfT BSOG returns, London Councils, HM Treasury GDP deflatorTelephone: 020 7944 3094 Last updated: December 2012Email: [email protected] Next update: Autumn 2013Notes and definitions (https://www.gov.uk/government/organisations/department-for-transport/series/bus-statistics)The figures in this table are National Statistics
Estimated operating revenue1 (at 2011/12 prices2) for local bus services by revenue type and metropolitan area status: England, annual from 2004/05
https://www.gov.uk/government/statistical-data-sets/tsgb06 180

Department for Transport statisticsBus Statistics (https://www.gov.uk/government/organisations/department-for-transport/series/bus-statistics)
Table BUS0502a (TSGB0623)
£ Millions
Area / Financial Year
Net Public Transport
Support3
Concessionary
Travel4Bus Service
Operators Grant5 Total estimated net support1
England
1996/97 201 406 190 797
1997/98 185 402 187 774
1998/99 221 419 222 862
1999/00 229 420 277 926
2000/01 290 421 301 1,012
2001/02 454 430 304 1,188
2002/03 691 421 317 1,430
2003/04 859 427 332 1,618
2004/05 R 853 485 348 1,686
2005/06 R 939 481 363 1,783
2006/07 R 968 724 367 2,059
2007/08 R 1,027 807 392 2,227
2008/09 R 7 1,106 926 423 2,455
2009/10 R 8 1,072 970 430 2,472
2010/11 R 934 1,004 420 2,358
2011/12 P 865 995 430 2,289
London6
1996/97 12 130 29 171
1997/98 1 122 30 153
1998/99 1 123 37 161
1999/00 1 119 46 166
2000/01 57 117 47 221
2001/02 201 111 56 368
2002/03 420 108 66 594
2003/04 560 105 80 745
2004/05 R 549 138 91 778
2005/06 R 595 151 95 841
2006/07 R 616 162 97 875
2007/08 R 661 176 103 940
2008/09 R 7 723 181 113 1,017
2009/10 R 8 690 183 112 985
2010/11 R 564 191 108 862
2011/12 518 210 111 838
English metropolitan areas
1996/97 106 174 62 342
1997/98 98 176 62 336
1998/99 110 193 70 373
1999/00 101 195 84 380
2000/01 104 196 93 393
2001/02 110 197 92 398
2002/03 106 191 92 389
2003/04 113 191 90 394
2004/05 R 104 215 92 411
2005/06 R 116 191 95 403
2006/07 R 130 251 96 478
2007/08 R 134 265 104 502
2008/09 R 7 139 288 110 537
2009/10 R 8 137 310 111 557
2010/11 R 127 309 108 544
2011/12 P 129 302 111 542
English non-metropolitan areas
1996/97 83 102 99 284
1997/98 86 104 96 286
1998/99 110 103 115 328
1999/00 127 106 147 380
2000/01 129 108 161 399
2001/02 143 122 156 421
2002/03 165 123 159 447
2003/04 187 131 162 480
2004/05 R 200 133 165 497
2005/06 R 228 139 173 539
Estimated net support1 paid by central and local government (at current prices2) for local bus services and concessionary travel by area type: England, annual from 1996/97
https://www.gov.uk/government/statistical-data-sets/tsgb06 181

£ Millions
Estimated net support1 paid by central and local government (at current prices2) for local bus services and concessionary travel by area type: England, annual from 1996/97
2006/07 R 221 311 174 707
2007/08 R 233 366 185 784
2008/09 R 7 244 458 200 902
2009/10 R 8 244 477 207 9292010/11 R 243 504 204 9522011/12 218 483 208 909
1. Figures reflect net revenue cost to the public purse. Gross expenditure is offset by income sources, including local authority income from passenger fare receipts on some tendered orsupported services. Capital funding support for local bus services is excluded.2. These figures are not adjusted for inflation.3. Public Transport Support is the total of all local authorities' net costs incurred in support of bus services, either directly or by subsidiesto operators or individuals. The bulk of these costs will be accounted for by payments to operators providing tendered or supported busservices (including non-local services in some cases). However, the figures also include administration costs and inter-authority transfers,meaning that a small proportion of the sums shown will not reach bus operators. In London it will also include depreciation on capital.4. Concessionary Travel is the total of all local authorities' net costs of statutory or discretionary concessionary bus travel.Discretionary concessionary travel is decided by local authorites, and can include travel for those that not included within the statutoryconcession, travel within the peak, or travel on other modes. These figures exclude travel on the London Underground, Mersey Ferries and Rail, West Yorkshire PTE Rail and Light Rail Systems, however they do include funding for taxi tokens. Table bus0811 shows the total including all discretionary elements excluded here.The figures include administration costs, meaning that a small proportion of the sums shown will not reach bus operators.5. Bus Service Operators Grant (BSOG) is a subsidy provided by Central Government to operators of local bus services.The distribution of BSOG payments betweenLondon, English Metropolitan areas and English non-Metropolitan areas is an estimate.These figures include payments for the BSOG AVL and smartcard incentives from April 2010, but not the coach concession.6. London runs an entirely tendered market and therefore some comparisons with the rest of country should be treated with care. Forexample concessionary travel is available on other modes than buses. Concessionary Fare Reimbursement in London includesfunding from London Councils, received through special grant. The figures are supplied by London Councils and will not necessarilyequal RSG Funding plus London Councils' Special Grant.7. Until 2009/10 figures in this table for public transport support, and concessionary travel outside London, were on a Financial Reporting Standard 17 (FRS17) basis. For 2009/10 they are on a non-FRS17 basis. For 2010/11 onwards they are on a non-International Accounting Standard 19 (IAS19) basis.8. The 2009/10 figures contain an additional element of spending, RECS, which for other years is included only in capital chargesand therefore excluded from current expenditure (as shown here). This may affect comparisons with previous or following years.R Minor revisions have been made to earlier years data.P We are expecting a revision to the 2011/12 “public transport support” figure in one metropolitan transport authority. The revised figure is not yet available so, as an interim step, we have used an estimate for this authority based on published budget data.
Telephone: 020 7944 3094Email: [email protected] and definitions (https://www.gov.uk/government/organisations/department-for-transport/series/bus-statistics)
The figures in this table are National Statistics Source: CLG RO forms, DfT BSOG returns, Transport for London, London CouncilsLast updated: December 2012
Next update: Autumn 2013
https://www.gov.uk/government/statistical-data-sets/tsgb06 182

Department for Transport statisticsBus Statistics (https://www.gov.uk/government/organisations/department-for-transport/series/bus-statistics)
Table BUS0502b (TSGB0623)
£ Millions
Area / Financial Year
Net Public Transport
Support3
Concessionary
Travel4Bus Service
Operators Grant5Total estimated net
support1
England
1996/97 278 562 263 1,103
1997/98 251 545 254 1,051
1998/99 294 557 295 1,146
1999/00 299 548 362 1,210
2000/01 377 546 391 1,315
2001/02 578 548 387 1,514
2002/03 860 524 394 1,778
2003/04 1,045 519 404 1,968
2004/05 R 1,008 574 411 1,992
2005/06 R 1,085 555 420 2,060
2006/07 R 1,089 815 413 2,317
2007/08 R 1,128 886 431 2,444
2008/09 R 7 1,182 990 452 2,623
2009/10 R 8 1,128 1,021 453 2,602
2010/11 R 956 1,027 430 2,413
2011/12 P 865 995 430 2,289
London6
1996/97 17 180 40 237
1997/98 1 166 41 208
1998/99 1 164 49 214
1999/00 1 155 60 217
2000/01 74 152 61 287
2001/02 257 141 71 469
2002/03 522 134 82 739
2003/04 681 128 98 906
2004/05 R 649 163 107 919
2005/06 R 688 174 110 972
2006/07 R 693 182 109 984
2007/08 R 726 193 113 1,032
2008/09 R 7 773 193 121 1,087
2009/10 R 8 727 193 118 1,037
2010/11 R 577 195 110 882
2011/12 518 210 111 838
English metropolitan areas
1996/97 147 241 85 473
1997/98 133 239 84 455
1998/99 146 257 93 496
1999/00 132 255 110 496
2000/01 135 254 121 510
2001/02 140 251 117 508
2002/03 132 237 115 483
2003/04 137 232 110 479
2004/05 R 123 254 109 486
2005/06 R 134 221 110 465
2006/07 R 147 282 108 537
2007/08 R 147 291 114 552
2008/09 R 7 149 307 117 573
2009/10 R 8 144 326 117 587
2010/11 R 130 316 111 557
2011/12 P 129 302 111 542
English non-metropolitan areas
1996/97 115 141 137 393
1997/98 117 141 130 388
1998/99 146 137 153 436
1999/00 166 138 192 497
2000/01 168 140 209 518
2001/02 182 156 199 537
2002/03 206 152 198 556
2003/04 227 159 197 584
2004/05 R 236 157 195 587
2005/06 R 263 160 200 623
Estimated net support1 paid by central and local government (at 2011/12 prices2) for local bus services and concessionary travel by area type: England, annual from 1996/97
https://www.gov.uk/government/statistical-data-sets/tsgb06 183

£ Millions
Estimated net support1 paid by central and local government (at 2011/12 prices2) for local bus services and concessionary travel by area type: England, annual from 1996/97
2006/07 R 249 350 196 795
2007/08 R 255 402 203 861
2008/09 R 7 260 489 214 9632009/10 R 8 257 503 218 978
2010/11 R 249 516 209 9742011/12 218 483 208 909
1. Figures reflect net revenue cost to the public purse. Gross expenditure is offset by income sources, including local authority income from passenger fare receipts on some tendered orsupported services. Capital funding support for local bus services is excluded.2. Adjusted for inflation using GDP deflator (as at 27 September 2012).3. Public Transport Support is the total of all local authorities' net costs incurred in support of bus services, either directly or by subsidiesto operators or individuals. The bulk of these costs will be accounted for by payments to operators providing tendered or supported busservices (including non-local services in some cases). However, the figures also include administration costs and inter-authority transfers,meaning that a small proportion of the sums shown will not reach bus operators. In London it will also include depreciation on capital.4. Concessionary Travel is the total of all local authorities' net costs of statutory or discretionary concessionary bus travel.Discretionary concessionary travel is decided by local authorites, and can include travel for those that not included within the statutoryconcession, travel within the peak, or travel on other modes. These figures exclude travel on the London Underground, Mersey Ferries and Rail, West Yorkshire PTE Rail and Light Rail Systems, however they do include funding for taxi tokens. Table bus0811 shows the total including all discretionary elements excluded here.The figures include administration costs, meaning that a small proportion of the sums shown will not reach bus operators.5. Bus Service Operators Grant (BSOG) is a subsidy provided by Central Government to operators of local bus services.The distribution of BSOG payments betweenLondon, English Metropolitan areas and English non-Metropolitan areas is an estimate.These figures include payments for the BSOG AVL and smartcard incentives from April 2010, but not the coach concession.6. London runs an entirely tendered market and therefore some comparisons with the rest of country should be treated with care. Forexample concessionary travel is available on other modes than buses. Concessionary Fare Reimbursement in London includesfunding from London Councils, received through special grant. The figures are supplied by London Councils and will not necessarilyequal RSG Funding plus London Councils' Special Grant.7. Until 2009/10 figures in this table for public transport support, and concessionary travel outside London, were on a Financial Reporting Standard 17 (FRS17) basis. For 2009/10 they are on a non-FRS17 basis. For 2010/11 onwards they are on a non-International Accounting Standard 19 (IAS19) basis.8. The 2009/10 figures contain an additional element of spending, RECS, which for other years is included only in capital chargesand therefore excluded from current expenditure (as shown here). This may affect comparisons with previous or following years.R Minor revisions have been made to earlier years data.P We are expecting a revision to the 2011/12 “public transport support” figure in one metropolitan transport authority. The revised figure is not yet available so, as an interim step, we have used an estimate for this authority based on published budget data.
Source: CLG RO forms, DfT BSOG returns, Transport for London, London Councils, HM Treasury GDP deflator
Telephone: 020 7944 3094 Last updated: December 2012Email: [email protected] Next update: Autumn 2013Notes and definitions (https://www.gov.uk/government/organisations/department-for-transport/series/bus-statistics)
The figures in this table are National Statistics
https://www.gov.uk/government/statistical-data-sets/tsgb06 184

Department for Transport statisticsBus Statistics (https://www.gov.uk/government/organisations/department-for-transport/series/bus-statistics)
Table BUS0601 (TSGB0624)Public service vehicle3 stock4 by type of vehicle2, local bus operators only1 : Great Britain, annual from 2004/05
Thousands
Year Buses4 Coaches 5 Minibuses 6 Total number of vehicles
2004/05 R 41.8 8.0 2.4 52.2
2005/06 R 42.0 7.8 2.2 52.0
2006/07 R 42.8 8.3 2.0 53.0
2007/08 R 42.6 8.6 2.2 53.4
2008/09 R 42.8 8.8 1.8 53.5
2009/10 R 42.7 8.5 1.7 53.0
2010/11 R 42.3 8.5 1.9 52.82011/12 42.2 8.6 1.9 52.6
1 This table covers all operators who run local bus services, including those who also do non-local work (e.g. private hire, school contracts).Operators who do solely non-local work are excluded.2 Figures in this table differ from those on buses and coaches published in DfT's Vehicle Licencing Statistics for several reasons.The latter includes vehicles other than those kept by Public Service Vehicle operators, vehicles subject to a Statutory Off RoadNotification (SORN) and vehicles operated under a special restricted licence as taxis, none of which are counted here.3 Public Service Vehicles in the bus and coach taxation class having nine or more seats. Excludes community buses and PSVs operated under a special restricted licence as taxis. 4 Buses are licenced for over 22 passengers (including standing).5 Coaches have 17 or more seats (with no standing)6 Minibuses have 8 to 22 passengers (including standing)
R Previously published figures have been revised. For details of the revisions (which include planned updates) please see the technical information (link below)
Telephone: 020 7944 3094 Source: DfT Public Service Vehicle SurveyEmail: [email protected] Last updated: 15 November 2012Notes and definitions (https://www.gov.uk/government/organisations/department-for-transport/series/bus-statistics) Next update: Autumn 2013
The figures in this table are National Statistics
https://www.gov.uk/government/statistical-data-sets/tsgb06 185

Department for Transport statisticsBus Statistics (https://www.gov.uk/government/organisations/department-for-transport/series/bus-statistics)
Table BUS0821 (TSGB0627)
Thousands / Millions / Number
London
English metropolitan
areas4English non-
metropolitan areas England
England excluding
London
Number of older and disabled concessionary travel passes (thousands)
2010/11 R 1,152 2,284 6,180 9,617 8,4652011/12 (outturn) 1,217 2,233 6,305 9,755 8,5382012/13 (forecast) 1,297 2,232 6,512 10,041 8,744
Number of older and disabled concessionary bus journeys (millions)
2010/11 R 299 311 449 1,059 7602011/12 (outturn) 305 304 456 1,064 7592012/13 (forecast) 315 300 458 1,074 758
Average number of bus concessionary journeys per pass
2010/11 R 260 136 73 110 902011/12 (outturn) 250 136 72 109 892012/13 (forecast) 243 134 70 107 87
Notes and definitions (https://www.gov.uk/government/organisations/department-for-transport/series/bus-statistics)
Telephone: 020 7944 3094 Source: DfT Concessionary Travel SurveyEmail: [email protected] Last updated: 15 November 2012The figures in this table are outside the scope of National Statistics Next update: Autumn 2013
Older and disabled concessionary travel passes1,2 and bus concessionary journeys3 per pass by metropolitan area status: England, annual from 2010/11
3. All bus journeys by older and disabled people which are subject to reimbursement by the Travel Concession Authority. This covers discretionary concessionary journeys (e.g. pre-0930) as well as those made under the statutory scheme.
1. ENCTS passes for older and disabled people meeting the statutory eligibility criteria, plus a small number of discretionary passes offered by individual Travel Concession Authorities to other older and disabled people.
R Some statistics for 2010/11 have been revised in light of information collected for the most recent survey. Further details available in the Notes and Definitions document.
5. Passes may not sum to totals due to rounding.
4. Refers to the six Former Metropolitan Counties - Tyne & Wear, Merseyside, Greater Manchester, West Midlands, South Yorkshire and West Yorkshire.
2. Passes are as reported by TCAs and are known to include a small number of inactive passes - e.g. issued to people who are now deceased - so are not an exact proxy for "pass holders". See Notes & Definitions document for more details.
https://www.gov.uk/government/statistical-data-sets/tsgb06 186

Dep
artm
ent
for
Tra
nsp
ort
sta
tist
ics
Taxi
Sta
tistic
s (h
ttp://
ww
w.d
ft.go
v.uk
/sta
tistic
s/se
ries/
taxi
s/)
Tab
le T
AX
I010
2T
axis
, Pri
vate
Hir
e V
ehic
les
(PH
Vs)
an
d t
hei
r d
rive
rs:
En
gla
nd
an
d W
ales
, fro
m 2
005
Thou
sand
s
Lic
ense
d t
axis
an
d t
axi d
rive
rsP
riva
te h
ire
veh
icle
s (P
HV
s)
Yea
r
Wh
eelc
hai
r ac
cess
ible
taxi
s 1
Oth
er
taxi
sT
ota
l ta
xis
Tax
i on
ly
licen
sed
d
rive
rs
Wh
eelc
hai
r ac
cess
ible
PH
Vs
2
Veh
icle
lic
ence
s is
sued
Op
erat
or
licen
ces
issu
ed
PH
V o
nly
lice
nse
d d
rive
rs
Du
al t
axi/P
HV
dri
ver
lice
nce
s
To
tal d
rive
r lic
ence
s is
sued
En
gla
nd
2005
36.3
27.8
64.2
68.8
..12
0.4
13.8
122.
550
.824
2.1
2007
40.6
28.4
68.9
69.6
..12
9.3
14.5
126.
656
.125
2.2
2009
43.0
28.0
71.1
66.9
..14
6.2
16.5
147.
459
.027
3.4
2011
44.3
28.8
73.0
66.0
3.6
150.
915
.915
4.1
67.2
287.
3
En
gla
nd
an
d W
ales
2005
36.8
31.2
68.0
71.1
..12
4.5
14.6
124.
158
.325
3.5
2007
41.5
32.1
73.6
71.6
..13
3.0
15.3
128.
463
.526
3.5
2009
44.3
31.6
75.9
68.9
..15
0.8
17.4
149.
367
.328
5.6
2011
45.6
32.4
78.0
68.1
3.8
155.
116
.715
5.9
75.3
299.
21
Incl
udes
pur
pose
bui
lt ta
xis
(whi
ch a
re w
heel
chai
r acc
essi
ble)
and
con
verte
d ve
hicl
es.
2 In
form
atio
n ab
out w
heel
chai
r acc
essi
ble
PH
Vs
was
col
lect
ed fo
r the
firs
t tim
e in
201
1. R
espo
nse
rate
s fo
r thi
s qu
estio
n w
ere
low
er th
an fo
r oth
er p
arts
of t
he s
urve
y an
d th
ese
figur
es a
re e
stim
ated
by s
calin
g th
ose
prov
ided
by
auth
oriti
es th
at w
ere
able
to p
rovi
de a
resp
onse
. Tf
L w
ere
unab
le to
pro
vide
a fi
gure
for L
ondo
n so
thes
e to
tals
are
like
ly to
repr
esen
t und
eres
timat
es.
Tele
phon
e: 0
20 7
944
3094
Sou
rce:
Tax
i Lic
ensi
ng A
utho
ritie
sE
mai
l: bu
s.st
atis
tics@
dft.g
si.g
ov.u
kLa
st u
pdat
ed: 1
5 D
ecem
ber 2
011
Nex
t upd
ate:
201
3
The
figur
es in
this
tabl
e ar
e N
atio
nal S
tatis
tics
https://www.gov.uk/government/statistical-data-sets/tsgb06 187

https://www.gov.uk/government/statistical-data-sets/tsgb06 188

Transport Statistics Great Britain: 2012
Roads and traffic
This section presents statistics on Roads and traffic in Great Britain from Transport Statistics Great Britain for 2012.
For further information on road traffic, speeds and lengths please email [email protected].
For further information on road expenditure and construction, and taxation revenue, please email [email protected].
Roads and traffic includes:
Road traffic
Traffic forecasts
Road lengths
Vehicle speeds
Congestion
Road taxation revenue Road traffic Since the 1950s the long term trend in the volume of road traffic has been one of growth. Fluctuations in road traffic volume tend to coincide with events such as changes in the economy and car ownership. In 2011, the overall motor vehicle traffic volume in Great Britain was 303.8 billion vehicle miles.
This is similar to traffic volume in 2010 (303.2 billion vehicle miles) and follows three consecutive years of decreases.
Year-on-year growth of motor vehicle road traffic in Great Britain, 1950-2011
-4
-2
0
2
4
6
8
10
12
14
16
18
1950 1955 1960 1965 1970 1975 1980 1985 1990 1995 2000 2005 2010
Year
High growth in car ownership
Suez crisis
OPEC oil embargo Strong economic growth
Early 1990s recession
Fuel protests
Fuel price spike and recent economic
downturn
Oth
er m
otor
veh
icle
s
https://www.gov.uk/government/statistical-data-sets/tsgb07 189

Road traffic by vehicle type (cars and all motor vehicles), 1951-2011
0
50
100
150
200
250
300
350
1951 1956 1961 1966 1971 1976 1981 1986 1991 1996 2001 2006 2011Year
Bill
ion
ve
hic
le m
iles
Cars and taxis Other motor vehicles
Car traffic increased slightly (0.4 per cent) between 2010 and 2011, from 239.8 to 240.7 billion vehicle miles. This follows a decline for three consecutive years between 2008 and 2010. Longer term, car traffic increased by around 1.6 per cent between 2001 and 2011.
Light goods vehicle (LGV) traffic grew for the second year in 2011, increasing by 0.8 per cent to 41.4 billion vehicle miles. LGV traffic peaked in 2007, with recent increases not being large enough to cancel out the falls experienced in 2008 and 2009.
Traffic on rural roads has increased by 6.6 per cent over the past 10 years between 2001 and 2011, whilst traffic on urban roads has decreased by 2.8 per cent.
Traffic on motorways increased by 1.3 per cent between 2010 and 2011 and traffic on all major roads by 0.7 per cent. Over the past 10 years, the volume of traffic on motorways has grown by 9.5 per cent while traffic on all roads has increased by only 3.5 per cent.
Detailed statistics (tables and charts) on “Annual road traffic by vehicle type” can be found in the Annual Road Traffic Statistics web tables, TRA0101, TRA0104, TRA0201, and TRA0204
Road traffic forecasts (Table TRA9905)
Despite the traffic estimates for 2008 to 2010 showing declines in overall traffic levels, and a stabilisation in the latest year, the Department’s forecasts suggest the longer term trend of continual traffic growth will resume.
Forecasts from the National Transport Model suggest that motor vehicle traffic in 2035 will be 36 per cent higher than in 2003. The greatest growth forecast is in LGV traffic, which is predicted to be 119 per cent higher than in 2003. The only predicted decrease is bus and coach traffic which is forecast to be 14 per cent lower in 2035 than in 2003.
https://www.gov.uk/government/statistical-data-sets/tsgb07 190
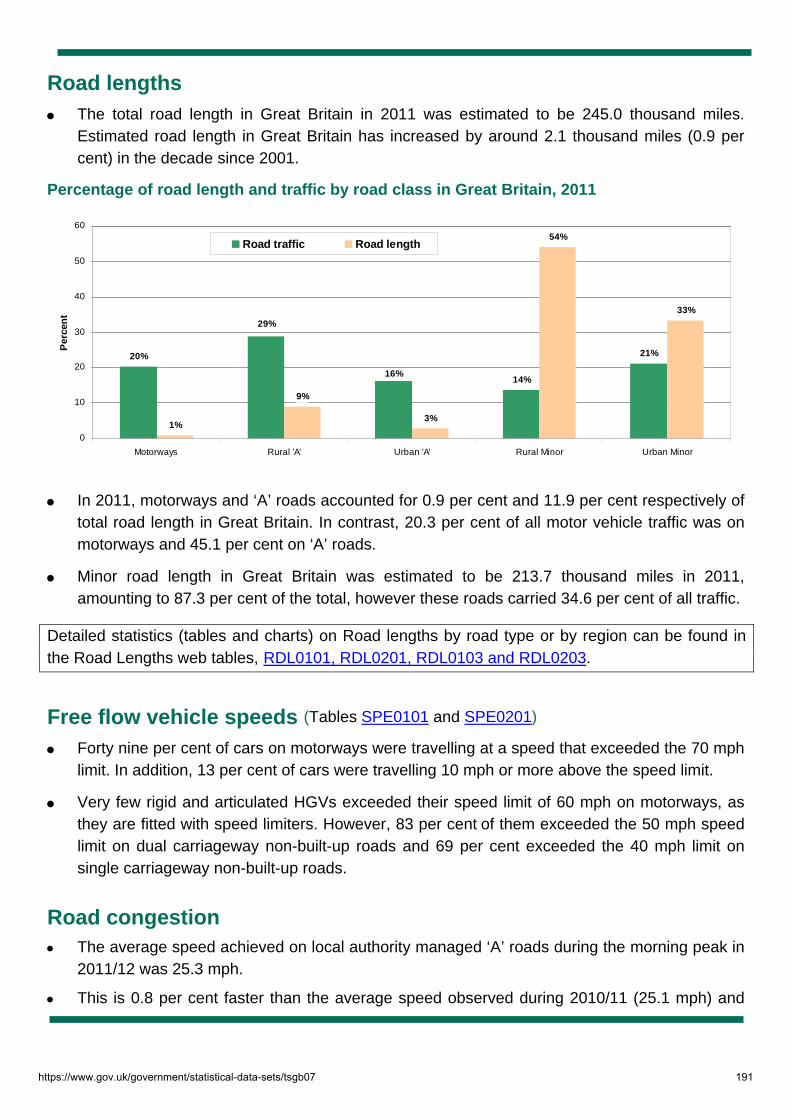
Road lengths
The total road length in Great Britain in 2011 was estimated to be 245.0 thousand miles. Estimated road length in Great Britain has increased by around 2.1 thousand miles (0.9 per cent) in the decade since 2001.
Percentage of road length and traffic by road class in Great Britain, 2011
16%
29%
20%
14%
21%
1%
9%
3%
54%
33%
0
10
20
30
40
50
60
Motorways Rural 'A' Urban 'A' Rural Minor Urban Minor
Per
cen
t
Road traffic Road length
In 2011, motorways and ‘A’ roads accounted for 0.9 per cent and 11.9 per cent respectively of total road length in Great Britain. In contrast, 20.3 per cent of all motor vehicle traffic was on motorways and 45.1 per cent on ‘A’ roads.
Minor road length in Great Britain was estimated to be 213.7 thousand miles in 2011, amounting to 87.3 per cent of the total, however these roads carried 34.6 per cent of all traffic.
Detailed statistics (tables and charts) on Road lengths by road type or by region can be found in the Road Lengths web tables, RDL0101, RDL0201, RDL0103 and RDL0203.
Free flow vehicle speeds (Tables SPE0101 and SPE0201)
Forty nine per cent of cars on motorways were travelling at a speed that exceeded the 70 mph limit. In addition, 13 per cent of cars were travelling 10 mph or more above the speed limit.
Very few rigid and articulated HGVs exceeded their speed limit of 60 mph on motorways, as they are fitted with speed limiters. However, 83 per cent of them exceeded the 50 mph speed limit on dual carriageway non-built-up roads and 69 per cent exceeded the 40 mph limit on single carriageway non-built-up roads.
Road congestion The average speed achieved on local authority managed ‘A’ roads during the morning peak in
2011/12 was 25.3 mph.
This is 0.8 per cent faster than the average speed observed during 2010/11 (25.1 mph) and
https://www.gov.uk/government/statistical-data-sets/tsgb07 191
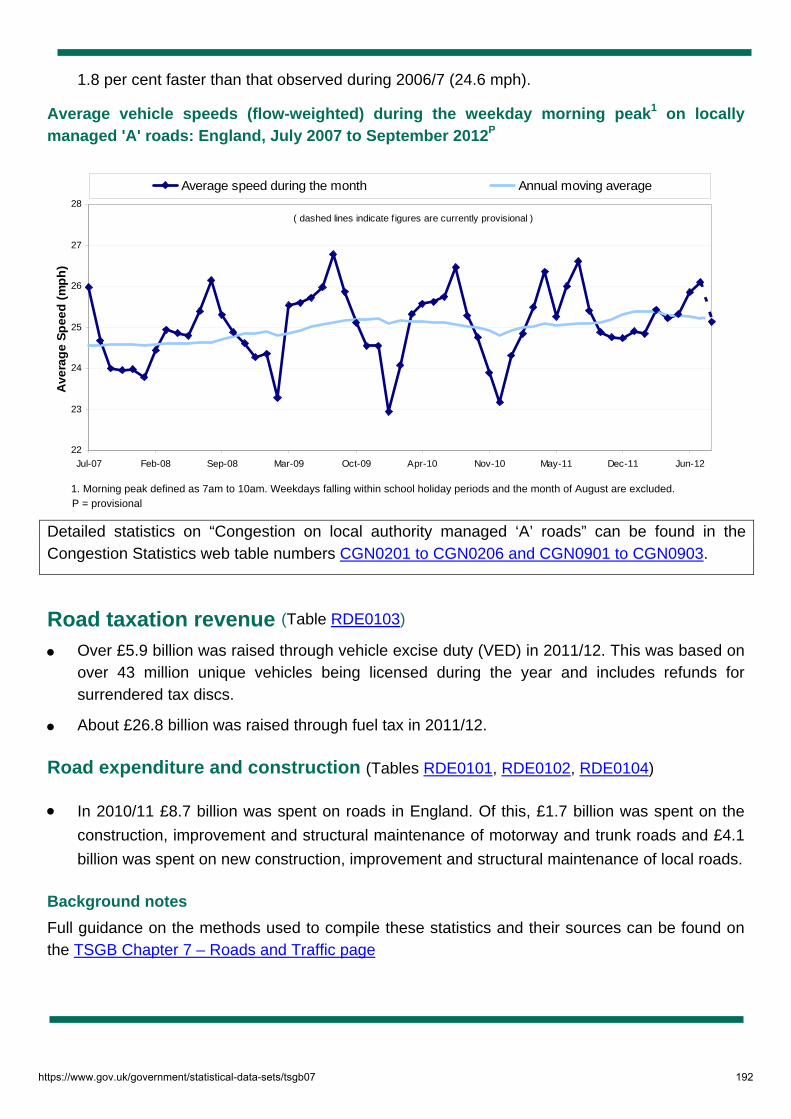
1.8 per cent faster than that observed during 2006/7 (24.6 mph).
Average vehicle speeds (flow-weighted) during the weekday morning peak1 on locally managed 'A' roads: England, July 2007 to September 2012P
22
23
24
25
26
27
28
Jul-07 Feb-08 Sep-08 Mar-09 Oct-09 Apr-10 Nov-10 May-11 Dec-11 Jun-12
Ave
rag
e S
pee
d (
mp
h)
Average speed during the month Annual moving average
( dashed lines indicate f igures are currently provisional )
1. Morning peak defined as 7am to 10am. Weekdays falling within school holiday periods and the month of August are excluded. P = provisional
Detailed statistics on “Congestion on local authority managed ‘A’ roads” can be found in the Congestion Statistics web table numbers CGN0201 to CGN0206 and CGN0901 to CGN0903.
Road taxation revenue (Table RDE0103)
Over £5.9 billion was raised through vehicle excise duty (VED) in 2011/12. This was based on over 43 million unique vehicles being licensed during the year and includes refunds for surrendered tax discs.
About £26.8 billion was raised through fuel tax in 2011/12.
Road expenditure and construction (Tables RDE0101, RDE0102, RDE0104)
In 2010/11 £8.7 billion was spent on roads in England. Of this, £1.7 billion was spent on the
construction, improvement and structural maintenance of motorway and trunk roads and £4.1
billion was spent on new construction, improvement and structural maintenance of local roads.
Background notes
Full guidance on the methods used to compile these statistics and their sources can be found on the TSGB Chapter 7 – Roads and Traffic page
https://www.gov.uk/government/statistical-data-sets/tsgb07 192
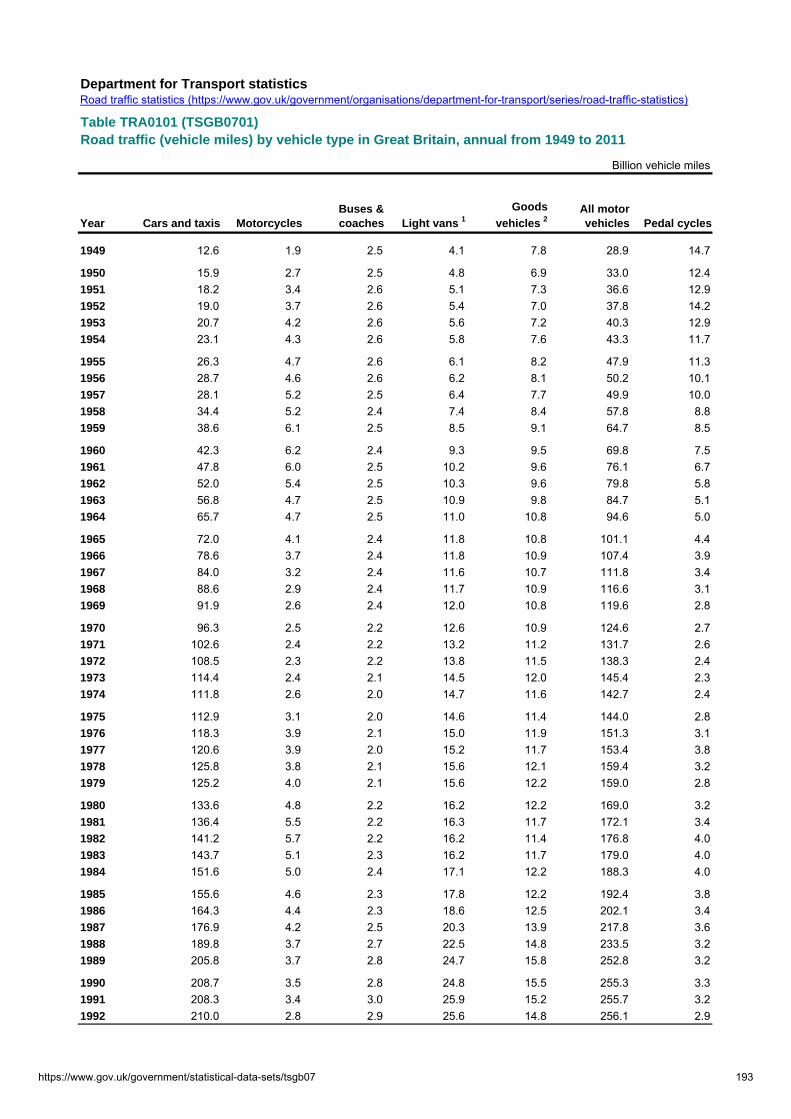
Department for Transport statisticsRoad traffic statistics (https://www.gov.uk/government/organisations/department-for-transport/series/road-traffic-statistics)
Table TRA0101 (TSGB0701)Road traffic (vehicle miles) by vehicle type in Great Britain, annual from 1949 to 2011
Billion vehicle miles
Year Cars and taxis MotorcyclesBuses & coaches Light vans 1
Goods
vehicles 2All motor vehicles Pedal cycles
1949 12.6 1.9 2.5 4.1 7.8 28.9 14.7
1950 15.9 2.7 2.5 4.8 6.9 33.0 12.41951 18.2 3.4 2.6 5.1 7.3 36.6 12.91952 19.0 3.7 2.6 5.4 7.0 37.8 14.21953 20.7 4.2 2.6 5.6 7.2 40.3 12.91954 23.1 4.3 2.6 5.8 7.6 43.3 11.7
1955 26.3 4.7 2.6 6.1 8.2 47.9 11.31956 28.7 4.6 2.6 6.2 8.1 50.2 10.11957 28.1 5.2 2.5 6.4 7.7 49.9 10.01958 34.4 5.2 2.4 7.4 8.4 57.8 8.81959 38.6 6.1 2.5 8.5 9.1 64.7 8.5
1960 42.3 6.2 2.4 9.3 9.5 69.8 7.51961 47.8 6.0 2.5 10.2 9.6 76.1 6.71962 52.0 5.4 2.5 10.3 9.6 79.8 5.81963 56.8 4.7 2.5 10.9 9.8 84.7 5.11964 65.7 4.7 2.5 11.0 10.8 94.6 5.0
1965 72.0 4.1 2.4 11.8 10.8 101.1 4.41966 78.6 3.7 2.4 11.8 10.9 107.4 3.91967 84.0 3.2 2.4 11.6 10.7 111.8 3.41968 88.6 2.9 2.4 11.7 10.9 116.6 3.11969 91.9 2.6 2.4 12.0 10.8 119.6 2.8
1970 96.3 2.5 2.2 12.6 10.9 124.6 2.71971 102.6 2.4 2.2 13.2 11.2 131.7 2.61972 108.5 2.3 2.2 13.8 11.5 138.3 2.41973 114.4 2.4 2.1 14.5 12.0 145.4 2.31974 111.8 2.6 2.0 14.7 11.6 142.7 2.4
1975 112.9 3.1 2.0 14.6 11.4 144.0 2.81976 118.3 3.9 2.1 15.0 11.9 151.3 3.11977 120.6 3.9 2.0 15.2 11.7 153.4 3.81978 125.8 3.8 2.1 15.6 12.1 159.4 3.21979 125.2 4.0 2.1 15.6 12.2 159.0 2.8
1980 133.6 4.8 2.2 16.2 12.2 169.0 3.21981 136.4 5.5 2.2 16.3 11.7 172.1 3.41982 141.2 5.7 2.2 16.2 11.4 176.8 4.01983 143.7 5.1 2.3 16.2 11.7 179.0 4.01984 151.6 5.0 2.4 17.1 12.2 188.3 4.0
1985 155.6 4.6 2.3 17.8 12.2 192.4 3.81986 164.3 4.4 2.3 18.6 12.5 202.1 3.41987 176.9 4.2 2.5 20.3 13.9 217.8 3.61988 189.8 3.7 2.7 22.5 14.8 233.5 3.21989 205.8 3.7 2.8 24.7 15.8 252.8 3.2
1990 208.7 3.5 2.8 24.8 15.5 255.3 3.31991 208.3 3.4 3.0 25.9 15.2 255.7 3.21992 210.0 2.8 2.9 25.6 14.8 256.1 2.9
https://www.gov.uk/government/statistical-data-sets/tsgb07 193

Department for Transport statisticsRoad traffic statistics (https://www.gov.uk/government/organisations/department-for-transport/series/road-traffic-statistics)
Table TRA0101 (TSGB0701)Road traffic (vehicle miles) by vehicle type in Great Britain, annual from 1949 to 2011
Billion vehicle miles
Year Cars and taxis MotorcyclesBuses & coaches Light vans 1
Goods
vehicles 2All motor vehicles Pedal cycles
19933 210.1 2.3 2.9 25.8 15.1 256.2 2.5
1994 214.4 2.3 2.9 26.9 15.4 261.9 2.51995 218.2 2.3 3.0 27.7 15.8 267.0 2.61996 223.6 2.3 3.1 28.7 16.3 274.1 2.51997 227.3 2.5 3.2 30.2 16.7 279.8 2.51998 230.3 2.6 3.3 31.6 17.2 284.9 2.51999 234.5 2.8 3.3 32.1 17.5 290.2 2.52000 233.7 2.8 3.2 32.4 17.5 289.7 2.62001 236.9 3.0 3.2 33.2 17.4 293.7 2.62002 242.7 3.1 3.2 34.0 17.6 300.6 2.72003 242.3 3.4 3.3 35.7 17.7 302.4 2.82004 245.0 3.2 3.2 37.4 18.2 306.9 2.62005 244.0 3.3 3.2 38.4 18.0 306.9 2.72006 246.9 3.2 3.3 39.9 18.0 311.4 2.82007 247.3 3.4 3.4 41.9 18.2 314.1 2.62008 245.4 3.1 3.1 41.6 17.8 311.0 2.82009 244.8 3.2 3.1 40.7 16.3 308.1 3.02010 239.8 2.9 3.1 41.0 16.4 303.2 3.02011 240.7 2.9 2.9 41.4 15.9 303.8 3.1
1 Not exceeding 3,500 kgs gross vehicle weight, post 19822 Over 3,500 kgs gross vehicle weight, post 19823 Data for 1993 onwards are not directly comparable with the figures for 1992 and earlier
Telephone: 020 7944 3095Email: [email protected] and definitions (https://www.gov.uk/government/organisations/department-for-transport/series/road-traffic-statistics)The figures in this table are National Statistics. Source: DfT National Road Traffic Survey
Last updated: June 2012Revised: August 2012
Next update: June 2013
4.The 2011 estimates presented here were revised in August 2012 to correct for omitted data for a small number of sections of the major road network in Scotland. Further details are avaliable at http://dft.gov.uk/statistics/series/traffic/ 2011 Road Traffic Estimates - Note of Revision Aug 2012.pdf
https://www.gov.uk/government/statistical-data-sets/tsgb07 194
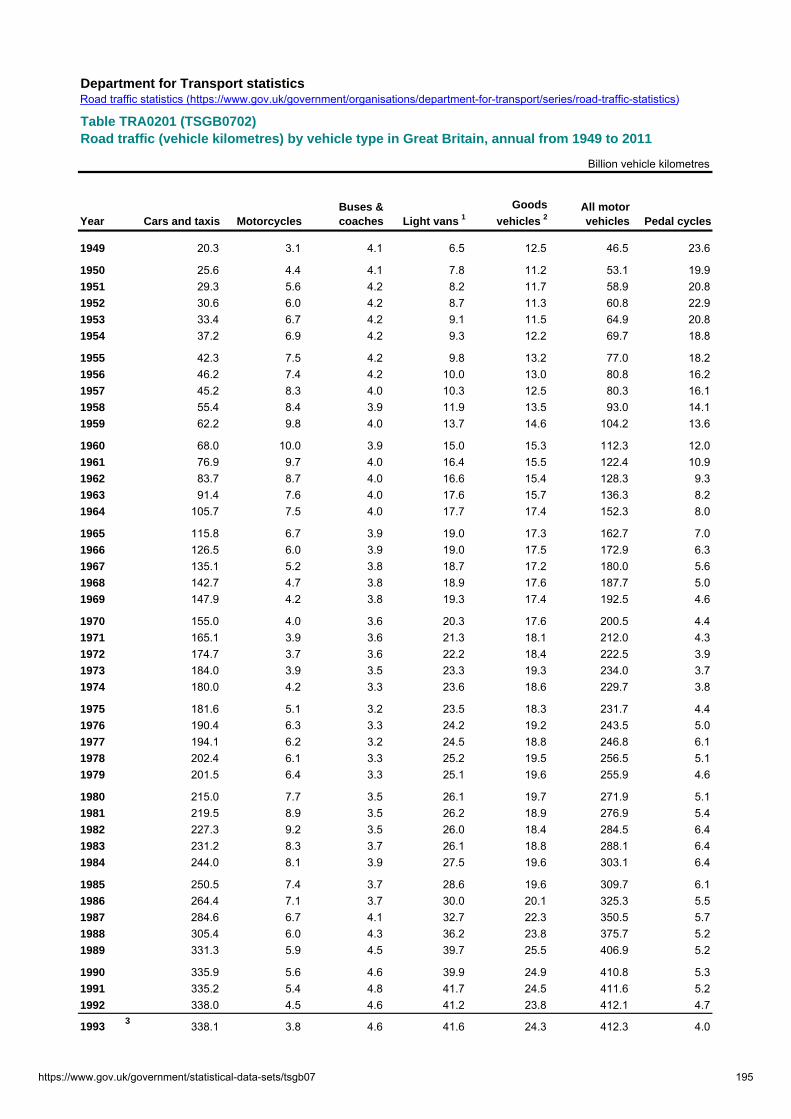
Department for Transport statisticsRoad traffic statistics (https://www.gov.uk/government/organisations/department-for-transport/series/road-traffic-statistics)
Table TRA0201 (TSGB0702)Road traffic (vehicle kilometres) by vehicle type in Great Britain, annual from 1949 to 2011
Billion vehicle kilometres
Year Cars and taxis MotorcyclesBuses & coaches Light vans 1
Goods
vehicles 2All motor vehicles Pedal cycles
1949 20.3 3.1 4.1 6.5 12.5 46.5 23.6
1950 25.6 4.4 4.1 7.8 11.2 53.1 19.91951 29.3 5.6 4.2 8.2 11.7 58.9 20.81952 30.6 6.0 4.2 8.7 11.3 60.8 22.91953 33.4 6.7 4.2 9.1 11.5 64.9 20.81954 37.2 6.9 4.2 9.3 12.2 69.7 18.8
1955 42.3 7.5 4.2 9.8 13.2 77.0 18.21956 46.2 7.4 4.2 10.0 13.0 80.8 16.21957 45.2 8.3 4.0 10.3 12.5 80.3 16.11958 55.4 8.4 3.9 11.9 13.5 93.0 14.11959 62.2 9.8 4.0 13.7 14.6 104.2 13.6
1960 68.0 10.0 3.9 15.0 15.3 112.3 12.01961 76.9 9.7 4.0 16.4 15.5 122.4 10.91962 83.7 8.7 4.0 16.6 15.4 128.3 9.31963 91.4 7.6 4.0 17.6 15.7 136.3 8.21964 105.7 7.5 4.0 17.7 17.4 152.3 8.0
1965 115.8 6.7 3.9 19.0 17.3 162.7 7.01966 126.5 6.0 3.9 19.0 17.5 172.9 6.31967 135.1 5.2 3.8 18.7 17.2 180.0 5.61968 142.7 4.7 3.8 18.9 17.6 187.7 5.01969 147.9 4.2 3.8 19.3 17.4 192.5 4.6
1970 155.0 4.0 3.6 20.3 17.6 200.5 4.41971 165.1 3.9 3.6 21.3 18.1 212.0 4.31972 174.7 3.7 3.6 22.2 18.4 222.5 3.91973 184.0 3.9 3.5 23.3 19.3 234.0 3.71974 180.0 4.2 3.3 23.6 18.6 229.7 3.8
1975 181.6 5.1 3.2 23.5 18.3 231.7 4.41976 190.4 6.3 3.3 24.2 19.2 243.5 5.01977 194.1 6.2 3.2 24.5 18.8 246.8 6.11978 202.4 6.1 3.3 25.2 19.5 256.5 5.11979 201.5 6.4 3.3 25.1 19.6 255.9 4.6
1980 215.0 7.7 3.5 26.1 19.7 271.9 5.11981 219.5 8.9 3.5 26.2 18.9 276.9 5.41982 227.3 9.2 3.5 26.0 18.4 284.5 6.41983 231.2 8.3 3.7 26.1 18.8 288.1 6.41984 244.0 8.1 3.9 27.5 19.6 303.1 6.4
1985 250.5 7.4 3.7 28.6 19.6 309.7 6.11986 264.4 7.1 3.7 30.0 20.1 325.3 5.51987 284.6 6.7 4.1 32.7 22.3 350.5 5.71988 305.4 6.0 4.3 36.2 23.8 375.7 5.21989 331.3 5.9 4.5 39.7 25.5 406.9 5.2
1990 335.9 5.6 4.6 39.9 24.9 410.8 5.31991 335.2 5.4 4.8 41.7 24.5 411.6 5.21992 338.0 4.5 4.6 41.2 23.8 412.1 4.7
19933 338.1 3.8 4.6 41.6 24.3 412.3 4.0
https://www.gov.uk/government/statistical-data-sets/tsgb07 195

Department for Transport statisticsRoad traffic statistics (https://www.gov.uk/government/organisations/department-for-transport/series/road-traffic-statistics)
Table TRA0201 (TSGB0702)Road traffic (vehicle kilometres) by vehicle type in Great Britain, annual from 1949 to 2011
Billion vehicle kilometres
Year Cars and taxis MotorcyclesBuses & coaches Light vans 1
Goods
vehicles 2All motor vehicles Pedal cycles
1994 345.0 3.8 4.6 43.3 24.8 421.5 4.01995 351.1 3.7 4.9 44.5 25.4 429.7 4.11996 359.9 3.8 5.0 46.2 26.2 441.1 4.11997 365.8 4.0 5.2 48.6 26.9 450.3 4.11998 370.6 4.1 5.2 50.8 27.7 458.5 4.01999 377.4 4.5 5.3 51.6 28.1 467.0 4.12000 376.0 4.6 5.1 52.2 28.2 466.2 4.12001 381.2 4.8 5.1 53.4 28.0 472.6 4.22002 390.6 5.0 5.2 54.7 28.3 483.7 4.42003 390.0 5.6 5.3 57.4 28.4 486.7 4.42004 394.2 5.1 5.1 60.2 29.3 493.9 4.12005 392.7 5.3 5.1 61.8 28.9 493.9 4.32006 397.4 5.1 5.3 64.3 29.0 501.1 4.52007 397.9 5.5 5.4 67.4 29.3 505.4 4.12008 395.0 5.0 5.0 66.9 28.6 500.6 4.62009 394.0 5.1 5.0 65.5 26.2 495.8 4.82010 385.9 4.6 5.0 66.1 26.3 487.9 4.82011 387.4 4.6 4.7 66.6 25.6 488.9 4.9
1 Not exceeding 3,500 kgs gross vehicle weight, post 19822 Over 3,500 kgs gross vehicle weight, post 19823 Data for 1993 onwards are not directly comparable with the figures for 1992 and earlier
Telephone: 020 7944 3095Email: [email protected] and definitions (https://www.gov.uk/government/organisations/department-for-transport/series/road-traffic-statistics)The figures in this table are National Statistics.
Source: DfT National Road Traffic SurveyLast updated: June 2012
Revision: August 2012Next update: June 2013
4.The 2011 estimates presented here were revised in August 2012 to correct for omitted data for a small number of sections of the major road network in Scotland. Further details are avaliable at http://dft.gov.uk/statistics/series/traffic/ 2011 Road Traffic Estimates - Note of Revision Aug 2012.pdf
https://www.gov.uk/government/statistical-data-sets/tsgb07 196

Department for Transport statisticsRoad traffic statistics (https://www.gov.uk/government/organisations/department-for-transport/series/road-traffic-statistics)
Table TRA0102a (TSGB0703)
Motor vehicle traffic (vehicle miles) by road class in Great Britain, from 1950 to 1993
Billion vehicle miles
Year Motorway 2 Non-built-up Built-up All 'A' roadsAll major
roads Non-built-up Built-upAll minor
roads All roads
1950 . .. .. .. .. .. .. .. 33.01955 . .. .. .. .. .. .. .. 47.81960 0.4 19.8 20.4 40.1 40.6 12.4 16.8 29.2 69.81965 2.4 27.1 29.6 56.7 59.1 .. .. 42.0 101.11970 5.9 32.2 35.0 67.2 73.1 .. .. 51.4 124.61975 13.6 37.3 36.8 74.1 87.7 23.5 32.8 56.3 144.01980 18.3 43.4 40.2 83.6 101.8 24.2 42.9 67.2 169.01985 23.6 53.9 41.3 95.2 118.8 27.0 46.7 73.6 192.4
1990 38.3 71.3 48.7 120.0 158.3 32.1 64.9 97.0 255.31991 37.9 72.7 49.3 122.1 159.9 31.5 64.2 95.8 255.81992 38.2 72.7 49.4 122.1 160.3 30.9 64.9 95.8 256.11993 39.7 73.4 48.5 121.9 161.6 28.3 66.3 94.6 256.1
Source: DfT National Road Traffic Survey2 Includes trunk motorways and principal motorways Last updated: June 2011
Telephone: 020 7944 3095Email: [email protected] and definitions (https://www.gov.uk/government/organisations/department-for-transport/series/road-traffic-statistics)
The figures in this table are National Statistics.
'A' roads
Major roads
Minor roads
1 Prior to 1993, built-up roads are those with a speed limit of 40 mph or less (irrespective of whether there are buildings or not).
https://www.gov.uk/government/statistical-data-sets/tsgb07 197

Department for Transport statisticsRoad traffic statistics (https://www.gov.uk/government/organisations/department-for-transport/series/road-traffic-statistics)
Table TRA0102b (TSGB0703)
Motor vehicle traffic (vehicle miles) by road class in Great Britain, annual from 1993 to 2011
Billion vehicle miles
Year Motorway 2 Rural Urban All 'A' roadsAll major
roads Rural UrbanAll minor
roads All roads
1993 42.4 70.4 48.0 118.5 160.8 34.8 60.6 95.4 256.21994 44.0 72.4 48.8 121.2 165.2 35.8 61.0 96.8 261.91995 45.9 74.3 49.7 124.0 169.9 35.9 61.2 97.1 267.01996 48.6 76.7 50.3 127.0 175.6 36.6 61.9 98.5 274.11997 51.0 78.7 50.3 129.0 180.0 37.3 62.5 99.8 279.81998 53.3 79.9 50.5 130.5 183.7 37.5 63.6 101.1 284.91999 54.6 81.2 50.9 132.1 186.7 38.1 65.4 103.5 290.22000 54.9 80.8 50.7 131.5 186.4 38.1 65.1 103.2 289.72001 56.4 82.8 50.9 133.7 190.1 38.0 65.5 103.6 293.72002 57.6 84.7 51.1 135.8 193.4 39.7 67.5 107.2 300.62003 57.8 86.5 50.8 137.3 195.1 39.5 67.7 107.3 302.42004 60.0 87.8 51.5 139.2 199.3 40.4 67.3 107.7 306.92005 60.3 87.8 50.8 138.6 198.9 40.8 67.2 107.9 306.92006 61.8 89.2 51.3 140.5 202.3 42.2 66.9 109.1 311.42007 62.5 89.2 50.5 139.7 202.2 43.7 68.1 111.8 314.12008 62.2 88.7 49.7 138.5 200.7 43.7 66.7 110.3 311.02009 61.8 88.2 50.0 138.2 200.0 42.4 65.7 108.1 308.12010 61.0 86.9 49.5 136.4 197.4 42.3 63.5 105.8 303.22011 61.8 87.7 49.3 137.0 198.8 41.2 63.8 105.0 303.8
2 Includes trunk motorways and principal motorways
Telephone: 020 7944 3095 Source: DfT National Road Traffic SurveyEmail: [email protected] Last updated: June 2012Notes and definitions (https://www.gov.uk/government/organisations/department-for-transport/series/road-traffic-statistics) Revised: August 2012
The figures in this table are National Statistics. Next update: June 2013
3.The 2011 estimates presented here were revised in August 2012 to correct for omitted data for a small number of sections of the major road network in Scotland. Further details are avaliable at http://dft.gov.uk/statistics/series/traffic/ 2011 Road Traffic Estimates - Note of Revision Aug 2012.pdf
1 Urban roads: Major and minor roads within an urban area with a population of 10,000 or more. These are based on the 2001 urban settlements. The definition for 'urban settlement' is in 'Urban and rural area definitions: a user guide which can be found at: http://webarchive.nationalarchives.gov.uk/20120919153000/http://www.communities.gov.uk/publications/planningandbuilding/urbanrural
A' roads
Major roads
Minor roads
https://www.gov.uk/government/statistical-data-sets/tsgb07 198

Department for Transport statisticsRoad traffic statistics (https://www.gov.uk/government/organisations/department-for-transport/series/road-traffic-statistics)
Table TRA0202a (TSGB0704)
Motor vehicle traffic (vehicle kilometres) by road class in Great Britain, 1950 to 1993
Billion vehicle kilometres
Year Motorway 2 Non-built-up Built-up All 'A' roadsAll major
roads Non-built-up Built-upAll minor
roads All roads
1950 . .. .. .. .. .. .. .. 53.11955 . .. .. .. .. .. .. .. 77.01960 0.7 31.8 32.8 64.6 65.4 19.9 27.1 47.0 112.31965 3.8 43.6 47.6 91.3 95.1 .. .. 67.6 162.71970 9.5 51.9 56.3 108.2 117.7 .. .. 82.8 200.51975 21.9 60.0 59.2 119.2 141.1 37.8 52.8 90.6 231.71980 29.4 69.8 64.7 134.5 163.8 39.0 69.1 108.1 271.91985 38.0 86.8 66.4 153.2 191.2 43.4 75.1 118.5 309.7
1990 61.6 114.8 78.3 193.1 254.8 51.6 104.4 156.1 410.81991 61.0 117.0 79.4 196.5 257.4 50.7 103.4 154.2 411.61992 61.5 117.0 79.5 196.5 258.0 49.7 104.4 154.1 412.11993 63.9 118.1 78.0 196.1 260.0 45.5 106.7 152.2 412.2
Source: DfT National Road Traffic Survey2 Includes trunk motorways and principal motorways Last updated: June 2011
Telephone: 020 7944 3095Email: [email protected] and definitions (https://www.gov.uk/government/organisations/department-for-transport/series/road-traffic-statistics)
The figures in this table are National Statistics.
'A' roads
Major roads
Minor roads
1 Prior to 1993, built-up roads are those with a speed limit of 40 mph or less (irrespective of whether there are buildings or not).
https://www.gov.uk/government/statistical-data-sets/tsgb07 199

Department for Transport statisticsRoad traffic statistics (https://www.gov.uk/government/organisations/department-for-transport/series/road-traffic-statistics)
Table TRA0202b (TSGB0704)
Motor vehicle traffic (vehicle kilometres) by road class in Great Britain, annual from 1993 to 2011
Billion vehicle kilometres
Year Motorway 2 Rural Urban All 'A' roadsAll major
roads Rural UrbanAll minor
roads All roads
1993 68.2 113.3 77.3 190.6 258.8 56.1 97.4 153.5 412.31994 70.7 116.5 78.5 195.1 265.8 57.6 98.1 155.7 421.51995 73.9 119.5 80.1 199.6 273.5 57.8 98.5 156.2 429.71996 78.3 123.5 80.9 204.4 282.7 58.9 99.6 158.5 441.11997 82.1 126.6 80.9 207.5 289.6 60.0 100.7 160.7 450.31998 85.7 128.7 81.3 210.0 295.7 60.4 102.4 162.8 458.51999 87.8 130.7 81.9 212.6 300.4 61.3 105.3 166.6 467.02000 88.3 130.0 81.7 211.7 300.0 61.3 104.8 166.1 466.22001 90.8 133.3 81.8 215.1 305.9 61.2 105.5 166.7 472.62002 92.6 136.4 82.2 218.6 311.2 63.9 108.6 172.5 483.72003 93.0 139.3 81.8 221.0 314.0 63.6 109.0 172.6 486.72004 96.6 141.3 82.8 224.1 320.7 64.9 108.3 173.3 493.92005 97.0 141.4 81.8 223.1 320.2 65.6 108.1 173.7 493.92006 99.5 143.6 82.5 226.1 325.5 67.9 107.6 175.5 501.12007 100.6 143.5 81.3 224.9 325.4 70.3 109.7 180.0 505.42008 100.1 142.8 80.1 222.8 323.0 70.3 107.3 177.6 500.62009 99.5 142.0 80.4 222.4 321.9 68.3 105.7 174.0 495.82010 98.2 139.8 79.7 219.5 317.7 68.1 102.1 170.2 487.92011 99.5 141.2 79.3 220.4 319.9 66.3 102.7 169.0 488.9
2 Includes trunk motorways and principal motorways
Telephone: 020 7944 3095Email: [email protected] Source: DfT National Road Traffic SurveyNotes and definitions (https://www.gov.uk/government/organisations/department-for-transport/series/road-traffic-statistics) Last updated: June 2012The figures in this table are National Statistics. Revised: August 2012
3.The 2011 estimates presented here were revised in August 2012 to correct for omitted data for a small number of sections of the major road network in Scotland. Further details are avaliable at http://dft.gov.uk/statistics/series/traffic/ 2011 Road Traffic Estimates - Note of Revision Aug 2012.pdf
1 Urban roads: Major and minor roads within an urban area with a population of 10,000 or more. These are based on the 2001 urban settlements. The definition for 'urban settlement' is in 'Urban and rural area definitions: a user guide which can be found at: http://webarchive.nationalarchives.gov.uk/20120919153000/http://www.communities.gov.uk/publications/planningandbuilding/urbanrural
A' roads
Major roads
Minor roads
https://www.gov.uk/government/statistical-data-sets/tsgb07 200

Department for Transport statisticsRoad traffic statistics (https://www.gov.uk/government/organisations/department-for-transport/series/road-traffic-statistics)
Table TRA0104 (TSGB0705)
Road traffic (vehicle miles) by vehicle type and road class in Great Britain, annual 2011
Billion vehicle miles
Cars and taxis Motorcycles Buses & coaches Light vans
Goods vehicles
All motor vehicles Pedal cycles
Motorways 2 46.6 0.2 0.3 7.8 6.9 61.8 -
Rural 'A' roads: - - - - - - -Trunk 3 27.5 0.2 0.2 4.9 3.2 36.1 -Principal 41.1 0.5 0.4 7.1 2.5 51.6 0.1All rural 'A' roads 68.7 0.7 0.6 12.0 5.7 87.7 0.1
Urban 'A' roads: 1 - - - - - - -Trunk 3 2.6 - - 0.4 0.2 3.3 -Principal 37.6 0.5 0.7 5.7 1.4 45.9 0.4All urban 'A' roads 40.2 0.5 0.7 6.2 1.6 49.3 0.4
All major roads 4 155.5 1.5 1.6 25.9 14.3 198.8 0.6
Minor roads: - - - - - - -Minor rural roads 32.8 0.5 0.3 6.7 0.9 41.2 0.7Minor urban roads 1 52.4 0.9 1.0 8.7 0.8 63.8 1.8All minor roads 85.2 1.4 1.3 15.4 1.6 105.0 2.5
All roads 240.7 2.9 2.9 41.4 15.9 303.8 3.1
Source: DfT National Road Traffic SurveyLast updated: June 2012
Revised: August 20122 Includes trunk motorways and principal motorways Next update: June 20133 Figures for trunk and principal roads in England since 2001 are affected by the detrunking programme4 Includes motorways, urban and rural 'A' roads
Telephone: 020 7944 3095
Email: [email protected] and definitions (https://www.gov.uk/government/organisations/department-for-transport/series/road-traffic-statistics)The figures in this table are National Statistics.
1 Urban roads: Major and minor roads within an urban area with a population of 10,000 or more. These are based on the 2001 urban settlements. The definition for 'urban settlement' is in 'Urban andand rural area definitions: a user guide which can be found at: http://webarchive.nationalarchives.gov.uk/20120919153000/http://www.communities.gov.uk/publications/planningandbuilding/urbanrural
5.The 2011 estimates presented here were revised in August 2012 to correct for omitted data for a small number of sections of the major road network in Scotland. Further details are avaliable at http://dft.gov.uk/statistics/series/traffic/ 2011 Road Traffic Estimates - Note of Revision Aug 2012.pdf
https://www.gov.uk/government/statistical-data-sets/tsgb07 201

Department for Transport statisticsRoad traffic statistics (https://www.gov.uk/government/organisations/department-for-transport/series/road-traffic-statistics)
Table TRA0204 (TSGB0706)
Road traffic (vehicle kilometres) by vehicle type and road class in Great Britain, annual 2011
Billion vehicle kilometres
Cars and taxis MotorcyclesBuses & coaches Light vans
Goods vehicles
All motor vehicles Pedal cycles
Motorways 2 75.0 0.4 0.4 12.5 11.2 99.5 -
Rural 'A' roads:
Trunk 3 44.3 0.4 0.3 7.9 5.2 58.1 -Principal 66.2 0.8 0.6 11.4 4.1 83.1 0.2All rural 'A' roads 110.5 1.1 0.9 19.3 9.3 141.2 0.2
Urban 'A' roads: 1
Trunk 3 4.3 - - 0.7 0.3 5.4 -Principal 60.5 0.8 1.1 9.2 2.3 73.9 0.7All urban 'A' roads 64.7 0.8 1.2 9.9 2.6 79.3 0.7
All major roads 4 250.3 2.4 2.5 41.7 23.0 319.9 0.9
Minor roads:
Minor rural roads 52.8 0.8 0.5 10.8 1.4 66.3 1.1Minor urban roads 1 84.3 1.5 1.7 14.0 1.2 102.7 2.9All minor roads 137.1 2.3 2.1 24.9 2.6 169.0 4.0
All roads 387.4 4.6 4.7 66.6 25.6 488.9 4.9
Source: DfT National Road Traffic Survey2 Includes trunk motorways and principal motorways Last updated: June 20123 Figures for trunk and principal roads in England since 2001 are affected by the detrunking programme Revised: August 20124 Includes motorways, urban and rural 'A' roads Next update: June 2013
Telephone: 020 7944 3095Email: [email protected] and definitions (https://www.gov.uk/government/organisations/department-for-transport/series/road-traffic-statistics)
The figures in this table are National Statistics.
1 Urban roads: Major and minor roads within an urban area with a population of 10,000 or more. These are based on the 2001 urban settlements. The definition for 'urban settlement' is in 'Urban and rural area definitions: a user guide which can be found at: http://webarchive.nationalarchives.gov.uk/20120919153000/http://www.communities.gov.uk/publications/planningandbuilding/urbanrural
5.The 2011 estimates presented here were revised in August 2012 to correct for omitted data for a small number of sections of the major road network in Scotland. Further details are avaliable at http://dft.gov.uk/statistics/series/traffic/ 2011 Road Traffic Estimates - Note of Revision Aug 2012.pdf
https://www.gov.uk/government/statistical-data-sets/tsgb07 202

Department for Transport statisticsRoad traffic statistics (https://www.gov.uk/government/organisations/department-for-transport/series/road-traffic-statistics)
Table TRA9905 (TSGB0707)
Forecasts of road traffic in England and vehicles in Great Britain 1
Index: 2003 = 100
2003 2010 2015 2020 2025 2030 2035
Traffic volume: England:
Cars and taxis 100 99 102 112 123 130 136
Goods vehicles 2 100 92 106 112 118 123 131
Light goods vehicles 100 117 135 157 177 197 219
Buses and coaches 100 96 93 89 89 89 86
All motor traffic (except two wheelers) 100 101 106 117 129 137 145
Car ownership 3: Great Britain:
Cars per person 100 107 111 114 117 120 123
Number of cars 100 109 117 124 131 138 146
Source: Transport Appraisal and Startegic Modelling2 Over 3.5 tonnes gross vehicle weight Last updated: January 2012
Next update: 2013
Telephone: 020 7944 6197Notes and definitions (https://www.gov.uk/government/organisations/department-for-transport/series/road-traffic-statistics)
The figures in this table are not National Statistics.
3 Car Ownership Data is taken from the NTEM dataset (Ver 6.1). More detailed data can be obtained from the TEMPRO website: www.dft.gov.uk/tempro
1 The traffic forecasts are central forecasts taken from the Department's Road Transport Forecasts for England 2011, which is available on the website at: https://www.gov.uk/government/publications/road-transport-forecasts-2011-results-from-the-department-for-transports-national-transport-model. The published paper also contains a forecast range reflecting uncertainties in the key forecasting assumptions that affect travel demand; and a break down of the forecasts by region.
https://www.gov.uk/government/statistical-data-sets/tsgb07 203

Department for Transport statisticsRoad lengths statistics
Table RDL0203 (TSGB0708)Road lengths (kilometres) by road type in Great Britain, 1914 - 2011
Kilometres
Minor roads
Year Trunk Principal Total Trunk Principal Total
All major roads B road C road Unclassified
All minor roads All roads
1914 . . . . .. .. .. .. . .. .. 284,843
1923 . . . . 37,383 37,383 37,383 23,720 . 224,265 247,985 285,369
1928 . . . . 40,457 40,457 40,457 25,244 . 221,996 247,240 287,697
1933 . . . . 42,784 42,784 42,784 26,786 . 215,842 242,628 285,412
1938 . . . 4,953 39,276 44,229 44,229 27,418 . 217,799 245,217 289,446
1943 . . . 7,176 37,305 44,481 44,481 28,532 . .. .. ..
1947 . . . 13,181 31,410 44,591 44,591 28,498 77,768 143,735 250,001 294,592
1951 . . . 13,275 31,435 44,710 44,710 28,481 78,346 145,929 252,756 297,466
1952 . . . 13,274 31,484 44,758 44,758 28,471 78,340 147,002 253,813 298,570
1953 . . . 13,284 31,464 44,748 44,748 28,485 78,364 148,161 255,010 299,758
1954 . . . 13,309 31,519 44,828 44,828 28,469 78,409 149,305 256,183 301,012
1955 . . . 13,309 31,553 44,862 44,862 28,479 78,505 150,863 257,847 302,710
1956 . . . 13,309 31,656 44,965 44,965 28,398 78,565 152,297 259,260 304,226
1957 . . . 13,311 31,762 45,073 45,073 28,333 78,615 153,998 260,946 306,018
1958 . . . 13,372 31,714 45,086 45,086 28,329 78,621 155,583 262,533 307,620
1959 13 . 13 13,388 31,744 45,132 45,145 28,329 78,653 158,573 265,555 310,700
1960 153 . 153 13,427 31,765 45,192 45,345 28,334 78,718 160,106 267,158 312,502
1961 209 10 219 13,419 31,770 45,189 45,408 28,357 78,740 161,667 268,764 314,171
1962 233 10 243 13,421 31,787 45,208 45,451 28,349 78,785 163,064 270,198 315,649
1963 312 10 322 13,433 31,850 45,283 45,605 28,337 78,829 166,611 273,777 319,382
1964 470 10 480 13,415 31,892 45,307 45,787 28,368 78,837 168,463 275,668 321,455
1965 557 10 566 13,436 31,961 45,397 45,964 28,392 78,855 170,357 277,604 323,568
1966 616 13 629 13,414 32,040 45,454 46,083 28,376 78,858 171,865 279,099 325,182
1967 747 11 761 13,412 32,532 45,944 46,702 .. .. .. 279,479 326,180
1968 869 11 884 .. .. 46,006 46,890 .. .. .. 281,288 328,178
1969 946 18 964 13,493 32,515 46,008 46,972 .. .. 166,089 273,343 320,315
1970 1,022 35 1,057 13,441 32,549 45,990 47,047 .. .. 168,152 275,437 322,484
1971 1,235 35 1,270 13,433 32,702 46,135 47,405 .. .. 169,872 277,260 324,665
1972 1,609 60 1,669 13,451 32,765 46,216 47,885 .. .. 172,428 279,832 327,717
1973 1,660 70 1,730 13,351 32,789 46,140 47,870 27,409 79,791 172,060 279,260 327,131
1974 1,776 92 1,869 13,343 32,850 46,193 48,061 27,500 80,062 173,443 281,005 329,066
1975 1,881 94 1,975 13,359 32,994 46,353 48,328 27,606 80,156 173,949 281,711 330,039
1976 2,062 93 2,155 13,440 33,132 46,572 48,727 27,812 80,512 175,794 284,118 332,846
1977 2,131 106 2,237 13,092 33,492 46,584 48,821 27,875 80,693 177,874 286,442 335,263
1978 2,287 107 2,394 12,533 34,092 46,625 49,019 27,874 80,545 178,826 287,245 336,264
1979 2,340 116 2,455 12,465 34,314 46,779 49,235 27,866 80,599 180,278 288,743 337,978
1980 2,445 111 2,556 12,504 34,076 46,580 49,136 28,151 80,736 181,610 290,497 339,633
1981 2,524 123 2,647 12,391 34,533 46,924 49,571 28,232 80,398 184,119 292,749 342,320
1982 2,561 131 2,692 12,340 34,569 46,909 49,601 28,451 80,358 185,531 294,340 343,942
1983 2,609 132 2,741 12,363 34,687 47,050 49,791 28,537 80,327 187,121 295,985 345,776
1984 2,678 108 2,786 12,379 34,754 47,133 49,919 29,036 80,123 188,511 297,670 347,589
1985 2,705 108 2,813 12,309 34,800 47,109 49,923 29,042 80,460 189,276 298,777 348,699
1986 2,820 101 2,920 12,540 34,868 47,408 50,328 29,121 80,360 191,267 300,748 351,076
1987 2,874 101 2,975 12,520 34,988 47,508 50,483 29,766 80,004 192,442 302,212 352,695
1988 2,891 102 2,992 12,581 34,939 47,520 50,513 29,681 80,165 193,957 303,803 354,315
1989 2,903 92 2,995 12,715 35,039 47,754 50,748 29,706 80,542 195,606 305,854 356,602
1990 2,993 77 3,070 12,674 35,149 47,823 50,893 29,838 80,716 196,588 307,142 358,034
1991 3,033 68 3,102 12,322 35,580 47,903 51,004 30,106 81,073 197,783 308,962 359,966
1992 3,063 71 3,133 12,295 35,641 47,936 51,070 30,227 81,334 199,679 311,240 362,310
1993 3,139 72 3,211 11,680 34,442 46,122 49,333 30,229 83,816 221,461 335,506 384,839
1994 3,170 72 3,242 11,645 34,502 46,147 49,389 30,225 83,931 222,012 336,168 385,557
1995 3,197 72 3,269 11,643 34,660 46,303 49,572 30,221 84,046 222,562 336,829 386,401
1996 3,253 45 3,298 11,714 34,477 46,191 49,489 30,217 84,162 223,115 337,494 386,983
1997 3,333 45 3,378 11,798 34,558 46,356 49,734 30,213 84,277 223,668 338,158 387,893
1998 3,376 44 3,421 11,682 34,714 46,396 49,816 30,209 84,392 224,225 338,826 388,641
1999 3,404 45 3,449 11,698 34,871 46,569 50,018 30,205 84,509 224,783 339,497 389,515
2000 3,422 45 3,467 11,701 34,906 46,607 50,074 30,200 84,624 225,339 340,163 390,237
2001 1 3,431 45 3,476 11,369 35,285 46,654 50,130 30,196 84,742 225,901 340,839 390,969
2002 3,433 45 3,478 10,679 35,995 46,674 50,152 30,192 84,858 226,462 341,512 391,663
2003 3,432 46 3,478 9,615 37,037 46,652 50,130 30,188 84,976 227,048 342,212 392,342
2004 2 3,478 46 3,523 9,147 37,521 46,668 50,192 30,178 84,223 223,082 337,483 387,674
2005R 3,471 48 3,518 8,708 38,019 46,727 50,246 30,189 84,459 223,183 337,830 388,076
2006R, 2 3,508 48 3,555 8,706 38,030 46,735 50,291 30,018 84,469 229,605 344,092 394,383
2007R 3,518 41 3,559 8,670 38,073 46,743 50,302 30,265 84,423 229,889 344,577 394,879
2008 3,518 41 3,559 8,634 38,057 46,691 50,249 30,161 84,574 229,482 344,217 394,467
2009 3,519 41 3,560 8,596 38,173 46,770 50,329 30,141 84,813 229,145 344,099 394,428
2010 3,517 41 3,558 8,489 38,218 46,707 50,265 30,192 84,827 228,970 343,989 394,2532011 3,529 41 3,570 8,508 38,225 46,734 50,304 30,208 84,831 228,953 343,992 394,296
1. Figures for trunk and principal 'A' roads in England, from 2001 onwards, are affected by the detrunking programme.2. New information from 2004 and from 2006 enabled better estimates of road lengths to be made - see Notes and definitions.
Telephone: 020 7944 3180 Source: Department for TransportEmail: [email protected] and definitions Last updated: 28 June 2012Methodology note Next update: June 2013
The figures in this table are National Statistics
A roadsMotorways

Department for Transport statisticsRoad lengths statistics
Table RDL0103 (TSGB0709)Road lengths (miles) by road type in Great Britain, 1914 - 2011
Miles
Minor roads
Year Trunk Principal Total Trunk Principal Total
All major roads B roads C roads Unclassified
All minor roads All roads
1914 . . . . .. .. .. .. . .. .. 284,843
1923 . . . . 23,229 14,434 23,229 14,739 . 139,352 154,091 177,320
1928 . . . . 25,139 15,621 25,139 15,686 . 137,942 153,628 178,767
1933 . . . . 26,585 16,519 26,585 16,644 . 134,118 150,762 177,347
1938 . . . 3,078 24,405 17,077 27,483 17,037 . 135,334 152,371 179,853
1943 . . . 4,459 23,180 17,174 27,639 17,729 . .. .. ..
1947 . . . 8,190 19,517 17,217 27,708 17,708 48,323 89,313 155,343 183,051
1951 . . . 8,249 19,533 17,263 27,782 17,697 48,682 90,676 157,055 184,837
1952 . . . 8,248 19,563 17,281 27,811 17,691 48,678 91,343 157,712 185,523
1953 . . . 8,254 19,551 17,277 27,805 17,700 48,693 92,063 158,456 186,261
1954 . . . 8,270 19,585 17,308 27,855 17,690 48,721 92,774 159,185 187,040
1955 . . . 8,270 19,606 17,321 27,876 17,696 48,781 93,742 160,219 188,095
1956 . . . 8,270 19,670 17,361 27,940 17,646 48,818 94,633 161,097 189,037
1957 . . . 8,271 19,736 17,403 28,007 17,605 48,849 95,690 162,144 190,151
1958 . . . 8,309 19,706 17,408 28,015 17,603 48,853 96,675 163,130 191,146
1959 8 . 8 8,319 19,725 17,426 28,052 17,603 48,873 98,533 165,008 193,060
1960 95 . 95 8,343 19,738 17,449 28,176 17,606 48,913 99,485 166,004 194,180
1961 130 6 136 8,338 19,741 17,448 28,215 17,620 48,927 100,455 167,002 195,217
1962 145 6 151 8,339 19,752 17,455 28,242 17,615 48,955 101,323 167,893 196,135
1963 194 6 200 8,347 19,791 17,484 28,338 17,608 48,982 103,527 170,117 198,455
1964 292 6 298 8,336 19,817 17,493 28,451 17,627 48,987 104,678 171,292 199,743
1965 346 6 352 8,349 19,860 17,528 28,561 17,642 48,998 105,855 172,495 201,056
1966 383 8 391 8,335 19,909 17,550 28,635 17,632 49,000 106,792 173,424 202,059
1967 464 7 473 8,334 20,214 17,739 29,019 .. .. .. 173,660 202,679
1968 540 7 549 .. .. 28,587 29,136 .. .. .. 174,784 203,920
1969 588 11 599 8,384 20,204 17,764 29,187 .. .. 103,203 169,848 199,035
1970 635 22 657 8,352 20,225 17,757 29,234 .. .. 104,485 171,149 200,382
1971 767 22 789 8,347 20,320 17,813 29,456 .. .. 105,554 172,281 201,738
1972 1,000 37 1,037 8,358 20,359 17,844 29,754 .. .. 107,142 173,880 203,634
1973 1,032 44 1,075 8,296 20,374 28,670 29,745 17,031 49,580 106,913 173,524 203,270
1974 1,104 57 1,161 8,291 20,412 28,703 29,864 17,088 49,748 107,773 174,608 204,472
1975 1,169 58 1,227 8,301 20,502 28,802 30,030 17,154 49,807 108,087 175,047 205,077
1976 1,281 58 1,339 8,351 20,587 28,939 30,278 17,282 50,028 109,233 176,543 206,821
1977 1,324 66 1,390 8,135 20,811 28,946 30,336 17,321 50,140 110,526 177,987 208,323
1978 1,421 67 1,488 7,788 21,184 28,971 30,459 17,320 50,048 111,117 178,486 208,945
1979 1,454 72 1,526 7,745 21,322 29,067 30,593 17,315 50,082 112,020 179,417 210,010
1980 1,519 69 1,588 7,770 21,174 28,944 30,532 17,492 50,167 112,847 180,507 211,038
1981 1,568 76 1,645 7,699 21,458 29,157 30,802 17,543 49,957 114,406 181,906 212,708
1982 1,591 81 1,673 7,668 21,480 29,148 30,821 17,679 49,932 115,284 182,894 213,716
1983 1,621 82 1,703 7,682 21,554 29,236 30,939 17,732 49,913 116,272 183,917 214,855
1984 1,664 67 1,731 7,692 21,595 29,287 31,018 18,042 49,786 117,135 184,963 215,982
1985 1,681 67 1,748 7,649 21,624 29,272 31,020 18,046 49,995 117,611 185,651 216,672
1986 1,752 63 1,815 7,792 21,666 29,458 31,273 18,095 49,933 118,848 186,876 218,149
1987 1,786 63 1,849 7,780 21,741 29,520 31,369 18,496 49,712 119,578 187,786 219,155
1988 1,796 63 1,859 7,818 21,710 29,528 31,387 18,443 49,812 120,519 188,774 220,161
1989 1,804 57 1,861 7,901 21,772 29,673 31,534 18,458 50,046 121,544 190,049 221,582
1990 1,860 48 1,908 7,875 21,841 29,716 31,623 18,540 50,155 122,154 190,849 222,472
1991 1,885 42 1,927 7,657 22,109 29,765 31,693 18,707 50,376 122,897 191,980 223,672
1992 1,903 44 1,947 7,640 22,147 29,786 31,733 18,782 50,539 124,075 193,396 225,129
1993 1,951 45 1,995 7,258 21,401 28,659 30,654 18,783 52,081 137,610 208,474 239,128
1994 1,970 45 2,015 7,236 21,439 28,674 30,689 18,781 52,152 137,952 208,885 239,574
1995 1,987 45 2,031 7,235 21,537 28,771 30,803 18,779 52,224 138,294 209,296 240,099
1996 2,021 28 2,049 7,279 21,423 28,702 30,751 18,776 52,296 138,637 209,709 240,460
1997 2,071 28 2,099 7,331 21,473 28,804 30,903 18,774 52,367 138,981 210,122 241,026
1998 2,098 27 2,126 7,259 21,570 28,829 30,954 18,771 52,439 139,327 210,537 241,490
1999 2,115 28 2,143 7,269 21,668 28,937 31,080 18,769 52,512 139,674 210,954 242,033
2000 2,126 28 2,154 7,271 21,690 28,960 31,115 18,765 52,583 140,019 211,368 242,482
2001 1 2,132 28 2,160 7,064 21,925 28,990 31,149 18,763 52,656 140,368 211,788 242,937
2002 2,133 28 2,161 6,636 22,366 29,002 31,163 18,760 52,728 140,717 212,206 243,368
2003 2,133 29 2,161 5,975 23,014 28,988 31,149 18,758 52,802 141,081 212,641 243,790
2004 2 2,161 29 2,189 5,684 23,315 28,998 31,188 18,752 52,334 138,617 209,702 240,890
2005R 2,157 30 2,186 5,411 23,624 29,035 31,221 18,758 52,480 138,679 209,918 241,139
2006R, 2 2,180 30 2,209 5,410 23,631 29,040 31,249 18,652 52,487 142,670 213,809 245,058
2007R 2,186 26 2,212 5,387 23,658 29,045 31,256 18,806 52,458 142,847 214,110 245,367
2008 2,186 26 2,211 5,365 23,648 29,012 31,224 18,741 52,552 142,594 213,887 245,110
2009 2,186 26 2,212 5,341 23,720 29,061 31,273 18,729 52,700 142,384 213,813 245,086
2010 2,185 26 2,211 5,275 23,748 29,022 31,233 18,760 52,709 142,275 213,745 244,9782011 2,193 26 2,218 5,287 23,752 29,039 31,257 18,770 52,712 142,265 213,747 245,004
1. Figures for trunk and principal 'A' roads in England, from 2001 onwards, are affected by the detrunking programme.2. New information from 2004 and from 2006 enabled better estimates of road lengths to be made - see Notes and definitions.
Telephone: 020 7944 3180 Source: Department for TransportEmail: [email protected] and definitions Last updated: 28 June 2012Methodology note Next update: June 2013
The figures in this table are National Statistics
A roadsMotorways

Department for Transport statisticsRoad lengths statistics
Table RDL0201 (TSGB0710)Road lengths (kilometres) by road type and region and country in Great Britain, 2011
Kilometres
Motorways1 Rural 'A' 1 Urban 'A' 1 Minor rural1 Minor urban1
(a) Total length
North East 58 1,272 496 1,826 7,439 6,899 14,338 16,163
North West 646 2,312 1,680 4,638 13,667 18,637 32,305 36,942
Yorkshire and the Humber 384 2,270 1,072 3,725 15,546 12,688 28,234 31,959
East Midlands 195 3,174 689 4,058 18,259 8,997 27,256 31,313
West Midlands 430 2,453 1,094 3,977 16,106 12,768 28,874 32,851
East of England 265 3,068 816 4,149 24,578 10,907 35,486 39,634
London 60 62 1,651 1,773 306 12,721 13,027 14,800
South East 655 3,777 1,456 5,888 22,925 18,804 41,729 47,617
South West 327 4,237 711 5,275 34,339 10,285 44,624 49,899
England 3,019 22,624 9,664 35,307 153,164 112,707 265,871 301,178
Wales 141 3,645 516 4,303 22,668 6,859 29,527 33,830
Scotland 410 9,377 908 10,695 36,848 11,745 48,594 59,288
Great Britain 3,570 35,646 11,088 50,304 212,681 131,311 343,992 394,296
(b) Length which is major road dual carriageway
North East 58 314 167 539 . . . .North West 644 293 417 1,355 . . . .Yorkshire and the Humber 372 293 296 962 . . . .East Midlands 194 505 165 864 . . . .West Midlands 412 348 360 1,120 . . . .East of England 265 846 185 1,296 . . . .London 60 23 411 495 . . . .South East 653 893 368 1,913 . . . .South West 327 546 182 1,055 . . . .
England 2,985 4,062 2,552 9,599 . . . .
Wales 141 426 122 689 . . . .Scotland 395 547 235 1,176 . . . .
Great Britain 3,521 5,034 2,909 11,464 . . . .
1. Use controls at top of sheet to expand/collapse selection
Telephone: 020 7944 3180 Source: Department for TransportEmail: [email protected] and definitions Last updated: 28 June 2012Methodology note Next update: June 2013
The figures in this table are National Statistics
All roadsMajor roads Minor roads
All major roads
All minor roads
https://www.gov.uk/government/statistical-data-sets/tsgb07 206

Department for Transport statisticsRoad lengths statistics
Table RDL0101 (TSGB0711)Road lengths (miles) by road type and region and country in Great Britain, 2011
Miles
Motorways1 Rural 'A' 1 Urban 'A' 1 Minor rural1 Minor urban1
(a) Total length
North East 36 790 308 1,134 4,622 4,287 8,909 10,043
North West 401 1,437 1,044 2,882 8,492 11,581 20,073 22,955
Yorkshire and the Humber 238 1,411 666 2,315 9,660 7,884 17,544 19,859
East Midlands 121 1,972 428 2,521 11,345 5,590 16,936 19,457
West Midlands 267 1,524 680 2,471 10,008 7,934 17,942 20,413
East of England 165 1,907 507 2,578 15,272 6,778 22,050 24,628
London 37 38 1,026 1,102 190 7,905 8,095 9,196
South East 407 2,347 905 3,659 14,245 11,684 25,929 29,588
South West 203 2,633 442 3,277 21,337 6,391 27,728 31,006
England 1,876 14,058 6,005 21,939 95,172 70,033 165,205 187,143
Wales 88 2,265 321 2,673 14,085 4,262 18,347 21,021
Scotland 255 5,827 564 6,645 22,897 7,298 30,195 36,840
Great Britain 2,218 22,149 6,890 31,257 132,154 81,593 213,747 245,004
(b) Length which is major road dual carriageway
North East 36 195 104 335 . . . .North West 400 182 259 842 . . . .Yorkshire and the Humber 231 182 184 598 . . . .East Midlands 120 314 103 537 . . . .West Midlands 256 216 224 696 . . . .East of England 165 526 115 805 . . . .London 37 15 256 307 . . . .South East 406 555 228 1,189 . . . .South West 203 339 113 656 . . . .
England 1,855 2,524 1,586 5,964 . . . .
Wales 88 265 76 428 . . . .Scotland 245 340 146 731 . . . .
Great Britain 2,188 3,128 1,807 7,124 . . . .
1. Use controls at top of sheet to expand/collapse selection
Telephone: 020 7944 3180 Source: Department for TransportEmail: [email protected] and definitions Last updated: 28 June 2012Methodology note Next update: June 2013
The figures in this table are National Statistics
All roads
Major roads Minor roads
All major roads
All minor roads
https://www.gov.uk/government/statistical-data-sets/tsgb07 207

Dep
artm
ent
for
Tra
nsp
ort
sta
tist
ics
Roa
d le
ngth
s st
atis
tics
Tab
le R
DL
0202
a (T
SG
B07
12)
To
tal r
oad
len
gth
(ki
lom
etre
s) b
y ro
ad t
ype
and
loca
l au
tho
rity
in G
reat
Bri
tain
, 201
1
Kilo
met
res
Mo
torw
ays
'A' r
oad
s M
ino
r ro
ads
All
road
s
ON
S A
rea
Co
de
Reg
ion
Lo
cal a
uth
ori
tyTr
unk
mot
orw
ays
Prin
cipa
lm
otor
way
sA
llm
oto
rway
sTr
unk
rura
l 'A
'Tr
unk
urba
n 'A
'P
rinci
pal
rura
l 'A
'P
rinci
pal
urba
n 'A
'A
ll 'A
' ro
ads
Rur
al 'B
' U
rban
'B'
Rur
al 'C
' U
rban
'C'
Rur
al 'U
' U
rban
'U'
All
min
or
road
s
Maj
or:
Tru
nk
road
s
Maj
or:
P
rin
icip
al
road
sM
ino
rro
ads
To
tal r
oad
le
ng
th
E06
0000
47N
orth
Eas
tC
ount
y D
urha
m U
A36
.80.
036
.835
.37.
032
9.1
33.3
404.
735
5.8
46.0
635.
958
.71,
239.
289
2.8
3,22
8.4
79.1
362.
43,
228.
43,
669.
9E
0600
0005
Nor
th E
ast
Dar
lingt
on U
A9.
50.
09.
512
.20.
037
.913
.964
.019
.110
.190
.218
.895
.323
9.1
472.
621
.751
.847
2.6
546.
1E
0600
0001
Nor
th E
ast
Har
tlepo
ol U
A0.
00.
00.
08.
40.
017
.619
.845
.81.
37.
711
.510
.944
.327
9.1
354.
88.
437
.435
4.8
400.
6E
0600
0002
Nor
th E
ast
Mid
dles
brou
gh U
A0.
00.
00.
06.
36.
33.
328
.844
.76.
110
.44.
122
.39.
841
3.1
465.
812
.632
.146
5.8
510.
5E
0600
0048
Nor
th E
ast
Nor
thum
berla
nd U
A
0.0
0.0
0.0
162.
60.
040
5.4
36.8
604.
861
2.0
25.3
1,45
5.4
69.7
1,91
1.1
485.
94,
559.
416
2.6
442.
24,
559.
45,
164.
2E
0600
0003
Nor
th E
ast
Red
car a
nd C
leve
land
UA
0.0
0.0
0.0
4.4
3.1
64.1
22.0
93.6
15.4
7.4
34.0
12.3
222.
028
7.8
578.
97.
586
.157
8.9
672.
5E
0600
0004
Nor
th E
ast
Sto
ckto
n-on
-Tee
s U
A0.
00.
00.
019
.19.
631
.341
.910
1.9
3.4
9.9
69.3
31.7
83.1
553.
475
0.8
28.7
73.2
750.
885
2.7
E08
0000
20N
orth
Eas
tG
ates
head
5.3
0.0
5.3
6.4
6.7
28.3
32.7
74.1
18.5
27.2
34.7
61.0
145.
753
5.3
822.
418
.461
.082
2.4
901.
8E
0800
0021
Nor
th E
ast
New
cast
le u
pon
Tyne
0.0
2.4
2.4
13.0
8.2
1.3
65.0
87.5
11.0
36.7
14.3
72.3
55.4
689.
687
9.3
21.2
68.7
879.
396
9.2
E08
0000
22N
orth
Eas
tN
orth
Tyn
esid
e0.
00.
00.
07.
25.
315
.562
.090
.017
.817
.71.
631
.951
.757
7.3
698.
012
.577
.569
8.0
788.
0E
0800
0023
Nor
th E
ast
Sou
th T
ynes
ide
0.1
0.0
0.1
5.9
2.5
16.6
29.2
54.2
6.7
26.4
2.4
31.2
28.5
403.
749
8.9
8.5
45.8
498.
955
3.2
E08
0000
24N
orth
Eas
tS
unde
rland
3.9
0.0
3.9
12.9
0.0
27.5
61.8
102.
218
.630
.122
.946
.890
.581
9.6
1,02
8.5
16.8
89.3
1,02
8.5
1,13
4.6
E06
0000
08N
orth
Wes
tB
lack
burn
with
Dar
wen
UA
8.0
0.0
8.0
0.0
0.0
16.2
38.2
54.4
7.4
10.9
47.6
9.4
42.9
367.
848
6.0
8.0
54.4
486.
054
8.4
E06
0000
09N
orth
Wes
tB
lack
pool
UA
0.0
0.0
0.0
0.0
0.0
1.9
39.1
41.0
0.3
20.6
0.6
14.6
5.9
373.
941
5.9
0.0
41.0
415.
945
6.9
E06
0000
49N
orth
Wes
tC
hesh
ire E
ast U
A47
.30.
047
.36.
90.
032
1.1
94.3
422.
310
5.6
35.4
497.
071
.484
9.4
824.
72,
383.
554
.241
5.4
2,38
3.5
2,85
3.1
E06
0000
50N
orth
Wes
tC
hesh
ire W
est a
nd C
hest
er U
A40
.50.
040
.530
.70.
022
0.9
61.4
313.
010
8.7
32.4
419.
779
.371
1.7
689.
22,
041.
071
.228
2.3
2,04
1.0
2,39
4.5
E06
0000
06N
orth
Wes
tH
alto
n U
A6.
40.
06.
40.
00.
016
.732
.949
.64.
814
.219
.342
.748
.738
9.8
519.
56.
449
.651
9.5
575.
5E
0600
0007
Nor
th W
est
War
ringt
on U
A33
.70.
033
.70.
00.
042
.358
.610
0.9
26.4
9.4
50.3
29.2
159.
457
5.5
850.
233
.710
0.9
850.
298
4.8
E10
0000
06N
orth
Wes
tC
umbr
ia 1
06.9
0.0
106.
919
4.1
7.4
740.
157
.099
8.6
566.
318
.12,
070.
928
0.7
3,55
3.9
502.
16,
992.
030
8.4
797.
16,
992.
08,
097.
5E
0800
0001
Nor
th W
est
Bol
ton
17.2
0.0
17.2
0.0
0.0
27.2
74.2
101.
414
.034
.527
.319
.665
.071
0.4
870.
817
.210
1.4
870.
898
9.4
E08
0000
02N
orth
Wes
tB
ury
20.7
0.0
20.7
0.0
0.0
6.0
49.1
55.1
8.1
25.2
2.4
35.2
54.3
484.
961
0.1
20.7
55.1
610.
168
5.9
E08
0000
03N
orth
Wes
tM
anch
este
r16
.53.
219
.70.
02.
22.
011
0.2
114.
41.
336
.10.
183
.812
.31,
102.
01,
235.
618
.711
5.4
1,23
5.6
1,36
9.7
E08
0000
04N
orth
Wes
tO
ldha
m 8
.30.
08.
30.
24.
039
.554
.698
.37.
923
.13.
727
.998
.655
5.3
716.
512
.594
.171
6.5
823.
1E
0800
0005
Nor
th W
est
Roc
hdal
e25
.80.
025
.80.
00.
015
.567
.182
.66.
117
.725
.110
.552
.456
3.9
675.
725
.882
.667
5.7
784.
1E
0800
0006
Nor
th W
est
Sal
ford
28.0
0.0
28.0
0.0
0.0
3.3
84.6
87.9
0.7
29.3
25.2
3.4
0.0
621.
968
0.5
28.0
87.9
680.
579
6.4
E08
0000
07N
orth
Wes
tS
tock
port
12.9
0.0
12.9
0.0
0.0
10.1
74.0
84.1
5.1
33.3
15.7
27.7
59.7
753.
789
5.2
12.9
84.1
895.
299
2.2
E08
0000
08N
orth
Wes
tTa
mes
ide
15.3
0.0
15.3
2.1
1.1
3.5
59.6
66.3
3.0
28.8
2.0
35.4
60.5
556.
468
6.1
18.5
63.1
686.
176
7.7
E08
0000
09N
orth
Wes
tTr
affo
rd9.
50.
09.
50.
00.
06.
951
.558
.49.
543
.711
.137
.441
.859
2.0
735.
59.
558
.473
5.5
803.
4E
0800
0010
Nor
th W
est
Wig
an18
.40.
018
.40.
00.
030
.086
.611
6.6
19.8
36.4
36.2
31.5
95.8
801.
71,
021.
418
.411
6.6
1,02
1.4
1,15
6.4
E10
0000
17N
orth
Wes
tLa
ncas
hire
150
.911
.816
2.7
38.6
11.7
437.
921
2.6
700.
830
8.6
145.
81,
131.
715
9.3
1,72
8.0
2,58
8.7
6,06
2.1
201.
266
2.3
6,06
2.1
6,92
5.6
E08
0000
11N
orth
Wes
tK
now
sley
15.
85.
321
.10.
00.
418
.029
.047
.49.
312
.119
.427
.345
.539
4.9
508.
516
.252
.350
8.5
577.
0E
0800
0012
Nor
th W
est
Live
rpoo
l0.
01.
01.
00.
00.
05.
311
7.9
123.
21.
434
.410
.362
.21.
21,
196.
81,
306.
30.
012
4.2
1,30
6.3
1,43
0.5
E08
0000
14N
orth
Wes
tS
efto
n8.
20.
08.
20.
35.
412
.768
.486
.89.
827
.929
.136
.267
.372
2.7
893.
013
.981
.189
3.0
988.
0E
0800
0013
Nor
th W
est
St.
Hel
ens
14.0
0.0
14.0
0.0
0.0
39.9
43.2
83.1
27.9
13.2
18.6
5.4
97.7
472.
663
5.4
14.0
83.1
635.
473
2.5
E08
0000
15N
orth
Wes
tW
irral
20.0
0.0
20.0
0.0
0.0
21.9
83.8
105.
718
.548
.510
.843
.270
.689
2.2
1,08
3.8
20.0
105.
71,
083.
81,
209.
5
E06
0000
11Y
orks
hire
and
The
Hum
ber
Eas
t Rid
ing
of Y
orks
hire
UA
34.8
0.0
34.8
18.8
0.8
323.
622
.436
5.6
309.
423
.785
2.0
66.0
1,42
4.8
363.
13,
039.
054
.434
6.0
3,03
9.0
3,43
9.4
E06
0000
10Y
orks
hire
and
The
Hum
ber
Kin
gsto
n up
on H
ull,
City
of U
A0.
00.
00.
00.
012
.90.
032
.845
.70.
19.
50.
377
.913
.459
5.8
697.
012
.932
.869
7.0
742.
7E
0600
0012
Yor
kshi
re a
nd T
he H
umbe
rN
orth
Eas
t Lin
coln
shire
UA
0.0
0.0
0.0
13.2
0.0
37.9
33.4
84.5
17.8
14.5
47.7
33.2
69.0
371.
755
3.9
13.2
71.3
553.
963
8.4
E06
0000
13Y
orks
hire
and
The
Hum
ber
Nor
th L
inco
lnsh
ire U
A39
.00.
039
.012
.90.
013
4.8
18.8
166.
515
3.0
8.9
301.
627
.050
5.4
213.
61,
209.
551
.915
3.6
1,20
9.5
1,41
5.0
E06
0000
14Y
orks
hire
and
The
Hum
ber
Yor
k U
A0.
00.
00.
023
.60.
040
.732
.096
.325
.74.
897
.934
.917
3.1
365.
470
1.8
23.6
72.7
701.
879
8.1
E10
0000
23Y
orks
hire
and
The
Hum
ber
Nor
th Y
orks
hire
52
.60.
052
.616
4.7
0.0
817.
866
.21,
048.
762
9.8
27.9
2,61
9.9
129.
44,
156.
262
1.1
8,18
4.3
217.
388
4.0
8,18
4.3
9,28
5.6
E08
0000
16Y
orks
hire
and
The
Hum
ber
Bar
nsle
y17
.30.
017
.321
.00.
079
.650
.015
0.6
34.4
39.7
103.
460
.827
4.6
526.
81,
039.
738
.312
9.6
1,03
9.7
1,20
7.6
E08
0000
17Y
orks
hire
and
The
Hum
ber
Don
cast
er60
.40.
060
.44.
40.
094
.657
.015
6.0
38.7
14.4
187.
464
.439
8.3
746.
71,
449.
964
.815
1.6
1,44
9.9
1,66
6.3
E08
0000
18Y
orks
hire
and
The
Hum
ber
Rot
herh
am 2
7.1
0.0
27.1
0.0
0.0
38.2
68.4
106.
659
.635
.729
.814
8.3
257.
454
0.1
1,07
0.9
27.1
106.
61,
070.
91,
204.
6E
0800
0019
Yor
kshi
re a
nd T
he H
umbe
rS
heffi
eld
10.3
0.0
10.3
4.5
1.2
43.5
102.
215
1.4
16.5
84.7
222.
429
.054
.31,
412.
31,
819.
216
.014
5.7
1,81
9.2
1,98
0.9
E08
0000
32Y
orks
hire
and
The
Hum
ber
Bra
dfor
d2.
70.
02.
70.
00.
057
.294
.815
2.0
30.6
47.6
56.0
71.8
360.
11,
218.
71,
784.
82.
715
2.0
1,78
4.8
1,93
9.5
E08
0000
33Y
orks
hire
and
The
Hum
ber
Cal
derd
ale
12.3
0.0
12.3
0.0
0.0
51.6
84.1
135.
724
.510
.560
.649
.140
4.3
483.
91,
032.
912
.313
5.7
1,03
2.9
1,18
0.9
E08
0000
34Y
orks
hire
and
The
Hum
ber
Kirk
lees
23.
10.
023
.10.
00.
080
.212
9.4
209.
650
.639
.663
.985
.445
5.5
985.
91,
680.
923
.120
9.6
1,68
0.9
1,91
3.6
E08
0000
35Y
orks
hire
and
The
Hum
ber
Leed
s64
.33.
567
.810
.20.
010
4.4
190.
130
4.7
18.0
58.6
89.2
66.9
397.
02,
003.
52,
633.
274
.529
8.0
2,63
3.2
3,00
5.7
E08
0000
36Y
orks
hire
and
The
Hum
ber
Wak
efie
ld36
.20.
036
.29.
80.
083
.075
.116
7.9
58.1
31.0
93.6
36.9
310.
480
6.8
1,33
6.8
46.0
158.
11,
336.
81,
540.
9
E06
0000
15E
ast M
idla
nds
Der
by U
A0.
00.
00.
03.
613
.60.
956
.174
.20.
35.
80.
075
.837
.756
6.1
685.
717
.257
.068
5.7
759.
9E
0600
0016
Eas
t Mid
land
sLe
ices
ter U
A0.
00.
00.
03.
40.
00.
066
.670
.00.
714
.02.
443
.417
.567
0.7
748.
73.
466
.674
8.7
818.
7E
0600
0018
Eas
t Mid
land
sN
ottin
gham
UA
0.3
0.0
0.3
1.0
9.4
0.0
62.0
72.4
0.9
23.9
0.0
43.1
10.9
645.
572
4.3
10.7
62.0
724.
379
7.0
E06
0000
17E
ast M
idla
nds
Rut
land
UA
0.0
0.0
0.0
18.5
0.0
77.0
0.0
95.5
30.7
6.3
176.
90.
320
4.6
36.5
455.
318
.577
.045
5.3
550.
8E
1000
0007
Eas
t Mid
land
sD
erby
shire
35.
50.
035
.590
.52.
850
8.8
108.
171
0.2
377.
793
.01,
131.
119
6.0
1,82
4.7
1,25
9.2
4,88
1.7
128.
861
6.9
4,88
1.7
5,62
7.4
E10
0000
18E
ast M
idla
nds
Leic
este
rshi
re 8
2.3
0.0
82.3
79.3
0.4
292.
260
.243
2.1
188.
945
.21,
122.
018
9.1
1,36
6.9
1,10
8.3
4,02
0.4
162.
035
2.4
4,02
0.4
4,53
4.8
E10
0000
19E
ast M
idla
nds
Linc
olns
hire
0.0
0.0
0.0
61.7
0.0
975.
270
.71,
107.
671
9.0
70.8
2,77
0.9
161.
83,
276.
577
3.7
7,77
2.7
61.7
1,04
5.9
7,77
2.7
8,88
0.3
E10
0000
21E
ast M
idla
nds
Nor
tham
pton
shire
54.4
0.0
54.4
168.
41.
436
5.1
133.
466
8.3
132.
619
.61,
004.
811
5.2
1,42
2.8
1,10
4.1
3,79
9.1
224.
249
8.5
3,79
9.1
4,52
1.8
E10
0000
24E
ast M
idla
nds
Not
tingh
amsh
ire 2
2.9
0.0
22.9
128.
17.
139
9.8
96.8
631.
817
0.2
108.
966
5.5
103.
71,
602.
41,
516.
94,
167.
615
8.1
496.
64,
167.
64,
822.
3

Dep
artm
ent
for
Tra
nsp
ort
sta
tist
ics
Roa
d le
ngth
s st
atis
tics
Tab
le R
DL
0202
a (T
SG
B07
12)
To
tal r
oad
len
gth
(ki
lom
etre
s) b
y ro
ad t
ype
and
loca
l au
tho
rity
in G
reat
Bri
tain
, 201
1
Kilo
met
res
Mo
torw
ays
'A' r
oad
s M
ino
r ro
ads
All
road
s
ON
S A
rea
Co
de
Reg
ion
Lo
cal a
uth
ori
tyTr
unk
mot
orw
ays
Prin
cipa
lm
otor
way
sA
llm
oto
rway
sTr
unk
rura
l 'A
'Tr
unk
urba
n 'A
'P
rinci
pal
rura
l 'A
'P
rinci
pal
urba
n 'A
'A
ll 'A
' ro
ads
Rur
al 'B
' U
rban
'B'
Rur
al 'C
' U
rban
'C'
Rur
al 'U
' U
rban
'U'
All
min
or
road
s
Maj
or:
Tru
nk
road
s
Maj
or:
P
rin
icip
al
road
sM
ino
rro
ads
To
tal r
oad
le
ng
th
E06
0000
19W
est M
idla
nds
Her
efor
dshi
re, C
ount
y of
UA
7.5
0.0
7.5
72.6
5.0
349.
220
.444
7.2
297.
918
.11,
044.
130
.91,
296.
719
8.9
2,88
6.6
85.1
369.
62,
886.
63,
341.
3E
0600
0051
Wes
t Mid
land
sS
hrop
shire
UA
12.4
0.0
12.4
122.
10.
040
5.5
32.2
559.
853
5.3
25.4
1,72
0.1
45.2
2,00
7.8
292.
14,
625.
913
4.5
437.
74,
625.
95,
198.
1E
0600
0021
Wes
t Mid
land
sS
toke
-on-
Tren
t UA
0.0
0.0
0.0
0.9
16.0
6.0
81.7
104.
61.
619
.26.
426
.720
.969
1.8
766.
616
.987
.776
6.6
871.
2E
0600
0020
Wes
t Mid
land
sTe
lford
and
Wre
kin
UA
12.0
0.0
12.0
4.4
0.0
51.5
27.5
83.4
51.5
16.0
115.
610
9.9
215.
842
5.0
933.
816
.479
.093
3.8
1,02
9.2
E10
0000
28W
est M
idla
nds
Sta
fford
shire
100
.70.
010
0.7
84.4
13.2
503.
115
6.1
756.
825
2.7
79.3
1,23
2.3
222.
52,
046.
31,
612.
55,
445.
619
8.3
659.
25,
445.
66,
303.
1E
1000
0031
Wes
t Mid
land
sW
arw
icks
hire
140.
20.
014
0.2
85.6
3.5
312.
976
.847
8.8
370.
558
.376
8.1
95.7
1,32
8.1
887.
93,
508.
622
9.3
389.
73,
508.
64,
127.
6E
0800
0025
Wes
t Mid
land
sB
irmin
gham
22.0
3.2
25.2
0.0
0.0
6.1
189.
719
5.8
0.0
122.
95.
413
7.0
29.4
2,01
1.0
2,30
5.7
22.0
199.
02,
305.
72,
526.
7E
0800
0026
Wes
t Mid
land
sC
oven
try3.
70.
03.
73.
00.
04.
646
.854
.47.
652
.22.
956
.539
.265
5.1
813.
56.
751
.481
3.5
871.
6E
0800
0027
Wes
t Mid
land
sD
udle
y 5.
50.
05.
50.
00.
08.
085
.593
.53.
441
.82.
734
.611
.482
7.8
921.
75.
593
.592
1.7
1,02
0.7
E08
0000
28W
est M
idla
nds
San
dwel
l 18.
10.
018
.10.
00.
30.
083
.784
.00.
337
.90.
055
.41.
869
2.7
788.
118
.483
.778
8.1
890.
2E
0800
0029
Wes
t Mid
land
sS
olih
ull
19.8
0.0
19.8
3.6
0.0
26.4
26.7
56.7
36.6
32.8
65.4
34.8
137.
348
3.1
790.
023
.453
.179
0.0
866.
5E
0800
0030
Wes
t Mid
land
sW
alsa
ll8.
70.
08.
72.
00.
911
.267
.481
.56.
034
.00.
010
.645
.967
7.9
774.
411
.678
.677
4.4
864.
6E
0800
0031
Wes
t Mid
land
sW
olve
rham
pton
0.0
0.0
0.0
0.0
0.0
0.3
61.5
61.8
0.2
13.2
0.0
35.0
5.7
649.
170
3.2
0.0
61.8
703.
276
5.0
E10
0000
34W
est M
idla
nds
Wor
cest
ersh
ire 7
6.4
0.0
76.4
19.2
2.4
370.
196
.548
8.2
307.
381
.491
7.5
146.
21,
168.
099
0.0
3,61
0.4
98.0
466.
63,
610.
44,
175.
0
E06
0000
55E
ast o
f Eng
land
Bed
ford
UA
0.
00.
00.
028
.70.
055
.725
.911
0.3
21.2
8.4
185.
123
.928
3.1
257.
377
9.0
28.7
81.6
779.
088
9.3
E06
0000
56E
ast o
f Eng
land
Cen
tral B
edfo
rdsh
ire U
A
26.6
0.0
26.6
43.1
6.5
110.
021
.618
1.2
79.4
7.9
286.
135
.048
5.3
356.
81,
250.
576
.213
1.6
1,25
0.5
1,45
8.3
E06
0000
32E
ast o
f Eng
land
Luto
n U
A2.
60.
02.
60.
00.
02.
728
.631
.32.
18.
70.
010
.64.
940
2.5
428.
82.
631
.342
8.8
462.
7E
0600
0031
Eas
t of E
ngla
ndP
eter
boro
ugh
UA
0.0
0.0
0.0
34.1
5.2
44.2
35.4
118.
953
.31.
311
4.6
41.7
194.
540
0.0
805.
439
.379
.680
5.4
924.
3E
0600
0033
Eas
t of E
ngla
ndS
outh
end-
on-S
ea U
A0.
00.
00.
00.
00.
00.
033
.533
.50.
09.
50.
033
.36.
336
8.2
417.
30.
033
.541
7.3
450.
8E
0600
0034
Eas
t of E
ngla
ndTh
urro
ck U
A6.
70.
06.
717
.80.
234
.829
.382
.120
.710
.849
.927
.183
.529
1.9
483.
924
.764
.148
3.9
572.
7E
1000
0003
Eas
t of E
ngla
ndC
ambr
idge
shire
47.
50.
047
.516
4.1
4.4
341.
052
.256
1.7
507.
747
.197
1.8
120.
91,
802.
365
7.1
4,10
6.9
216.
039
3.2
4,10
6.9
4,71
6.1
E10
0000
12E
ast o
f Eng
land
Ess
ex 7
5.3
0.0
75.3
148.
10.
032
5.4
158.
563
2.0
620.
414
9.8
1,47
7.3
238.
42,
589.
72,
418.
17,
493.
722
3.4
483.
97,
493.
78,
201.
0E
1000
0015
Eas
t of E
ngla
ndH
ertfo
rdsh
ire10
6.3
0.0
106.
310
.60.
029
0.3
195.
949
6.8
215.
110
5.3
598.
722
6.3
983.
62,
186.
44,
315.
411
6.9
486.
24,
315.
44,
918.
5E
1000
0020
Eas
t of E
ngla
ndN
orfo
lk0.
00.
00.
017
5.1
7.3
653.
792
.692
8.7
622.
923
.33,
165.
627
2.2
4,13
9.9
915.
59,
139.
418
2.4
746.
39,
139.
410
,068
.1E
1000
0029
Eas
t of E
ngla
ndS
uffo
lk0.
00.
00.
011
8.4
10.2
470.
410
8.3
707.
366
8.0
55.4
1,71
0.4
223.
62,
634.
997
3.0
6,26
5.3
128.
657
8.7
6,26
5.3
6,97
2.6
E09
0000
07Lo
ndon
Cam
den
0.0
0.0
0.0
0.0
0.0
0.0
38.0
38.0
0.3
19.9
0.0
0.0
0.0
227.
224
7.4
0.0
38.0
247.
428
5.4
E09
0000
01Lo
ndon
City
of L
ondo
n0.
00.
00.
00.
00.
00.
012
.912
.90.
01.
10.
17.
10.
036
.544
.80.
012
.944
.857
.7E
0900
0012
Lond
onH
ackn
ey0.
00.
00.
00.
00.
00.
035
.635
.60.
812
.30.
015
.21.
821
0.6
240.
70.
035
.624
0.7
276.
3E
0900
0013
Lond
onH
amm
ersm
ith a
nd F
ulha
m0.
00.
00.
00.
00.
00.
032
.132
.10.
04.
70.
011
.80.
017
5.0
191.
50.
032
.119
1.5
223.
6E
0900
0014
Lond
onH
arin
gey
0.0
0.0
0.0
0.0
0.0
0.0
37.1
37.1
0.2
19.5
0.2
21.2
0.0
277.
931
9.0
0.0
37.1
319.
035
6.1
E09
0000
19Lo
ndon
Islin
gton
0.0
0.0
0.0
0.0
0.0
0.0
38.1
38.1
0.0
7.5
0.3
14.8
0.0
181.
920
4.5
0.0
38.1
204.
524
2.6
E09
0000
20Lo
ndon
Ken
sing
ton
and
Che
lsea
0.0
0.0
0.0
0.0
0.0
0.0
30.4
30.4
0.2
9.9
0.1
8.9
0.0
157.
917
7.0
0.0
30.4
177.
020
7.4
E09
0000
22Lo
ndon
Lam
beth
0.0
0.0
0.0
0.0
0.0
0.0
53.3
53.3
0.0
12.3
1.3
29.6
0.0
278.
932
2.1
0.0
53.3
322.
137
5.4
E09
0000
23Lo
ndon
Lew
isha
m0.
00.
00.
00.
00.
00.
038
.738
.70.
018
.40.
225
.90.
036
3.8
408.
30.
038
.740
8.3
447.
0E
0900
0025
Lond
onN
ewha
m0.
00.
00.
00.
00.
00.
052
.152
.10.
013
.60.
00.
00.
035
0.2
363.
80.
052
.136
3.8
415.
9E
0900
0028
Lond
onS
outh
war
k0.
00.
00.
00.
00.
00.
054
.054
.00.
017
.20.
243
.00.
028
1.6
342.
00.
054
.034
2.0
396.
0E
0900
0030
Lond
onTo
wer
Ham
lets
0.0
0.0
0.0
0.0
0.0
0.0
41.3
41.3
0.3
22.3
0.6
55.5
0.0
179.
625
8.3
0.0
41.3
258.
329
9.6
E09
0000
32Lo
ndon
Wan
dsw
orth
0.0
0.0
0.0
0.0
0.0
0.0
54.5
54.5
0.1
15.3
0.0
0.0
0.0
360.
537
5.9
0.0
54.5
375.
943
0.4
E09
0000
33Lo
ndon
Wes
tmin
ster
0.0
0.0
0.0
0.0
0.0
0.0
60.0
60.0
0.5
18.3
0.1
27.6
0.0
235.
728
2.2
0.0
60.0
282.
234
2.2
E09
0000
02Lo
ndon
Bar
king
and
Dag
enha
m0.
00.
00.
00.
00.
00.
436
.737
.10.
02.
90.
125
.01.
926
4.8
294.
70.
037
.129
4.7
331.
8E
0900
0003
Lond
onB
arne
t12
.00.
012
.00.
00.
012
.084
.496
.42.
118
.40.
00.
010
.462
5.4
656.
312
.096
.465
6.3
764.
7E
0900
0004
Lond
onB
exle
y0.
00.
00.
00.
00.
05.
762
.768
.41.
511
.10.
030
.58.
742
3.6
475.
40.
068
.447
5.4
543.
8E
0900
0005
Lond
onB
rent
0.0
0.0
0.0
0.0
0.0
0.0
52.8
52.8
0.5
14.6
0.1
39.2
0.0
379.
043
3.4
0.0
52.8
433.
448
6.2
E09
0000
06Lo
ndon
Bro
mle
y0.
00.
00.
00.
00.
013
.176
.589
.64.
923
.59.
055
.683
.763
4.7
811.
40.
089
.681
1.4
901.
0E
0900
0008
Lond
onC
royd
on0.
00.
00.
00.
00.
00.
476
.877
.20.
627
.61.
052
.015
.360
3.3
699.
80.
077
.269
9.8
777.
0E
0900
0009
Lond
onE
alin
g0.
00.
00.
00.
00.
00.
054
.254
.20.
925
.30.
00.
00.
050
8.4
534.
60.
054
.253
4.6
588.
8E
0900
0010
Lond
onE
nfie
ld11
.20.
011
.20.
00.
05.
974
.580
.40.
06.
60.
045
.413
.148
6.5
551.
611
.280
.455
1.6
643.
2E
0900
0011
Lond
onG
reen
wic
h0.
00.
00.
00.
00.
00.
065
.965
.90.
313
.31.
644
.70.
038
2.0
441.
90.
065
.944
1.9
507.
8E
0900
0015
Lond
onH
arro
w1.
00.
01.
00.
00.
00.
639
.840
.40.
01.
81.
819
.85.
740
5.5
434.
61.
040
.443
4.6
476.
0E
0900
0016
Lond
onH
aver
ing
11.8
0.0
11.8
0.0
0.0
8.5
41.0
49.5
11.1
13.2
26.5
44.5
18.1
477.
059
0.4
11.8
49.5
590.
465
1.7
E09
0000
17Lo
ndon
Hill
ingd
on10
.30.
010
.30.
00.
08.
464
.072
.41.
416
.720
.931
.823
.656
3.1
657.
510
.372
.465
7.5
740.
2E
0900
0018
Lond
onH
ouns
low
9.8
0.0
9.8
0.0
0.0
0.0
70.1
70.1
0.2
13.9
0.0
30.5
0.0
379.
542
4.1
9.8
70.1
424.
150
4.0
E09
0000
21Lo
ndon
Kin
gsto
n up
on T
ham
es0.
00.
00.
00.
00.
03.
840
.544
.31.
86.
50.
018
.81.
127
1.6
299.
80.
044
.329
9.8
344.
1E
0900
0024
Lond
onM
erto
n0.
00.
00.
00.
00.
00.
039
.939
.90.
820
.30.
019
.00.
129
6.6
336.
80.
039
.933
6.8
376.
7E
0900
0026
Lond
onR
edbr
idge
4.0
0.0
4.0
0.0
0.0
1.9
55.1
57.0
0.9
6.7
7.8
15.2
2.1
443.
047
5.7
4.0
57.0
475.
753
6.7
E09
0000
27Lo
ndon
Ric
hmon
d up
on T
ham
es0.
00.
00.
00.
00.
00.
061
.961
.90.
123
.60.
018
.70.
031
0.2
352.
60.
061
.935
2.6
414.
5E
0900
0029
Lond
onS
utto
n0.
00.
00.
00.
00.
00.
029
.429
.42.
226
.20.
016
.06.
534
9.2
400.
10.
029
.440
0.1
429.
5E
0900
0031
Lond
onW
alth
am F
ores
t0.
00.
00.
00.
00.
00.
847
.147
.96.
114
.04.
018
.10.
033
6.7
378.
90.
047
.937
8.9
426.
8

Dep
artm
ent
for
Tra
nsp
ort
sta
tist
ics
Roa
d le
ngth
s st
atis
tics
Tab
le R
DL
0202
a (T
SG
B07
12)
To
tal r
oad
len
gth
(ki
lom
etre
s) b
y ro
ad t
ype
and
loca
l au
tho
rity
in G
reat
Bri
tain
, 201
1
Kilo
met
res
Mo
torw
ays
'A' r
oad
s M
ino
r ro
ads
All
road
s
ON
S A
rea
Co
de
Reg
ion
Lo
cal a
uth
ori
tyTr
unk
mot
orw
ays
Prin
cipa
lm
otor
way
sA
llm
oto
rway
sTr
unk
rura
l 'A
'Tr
unk
urba
n 'A
'P
rinci
pal
rura
l 'A
'P
rinci
pal
urba
n 'A
'A
ll 'A
' ro
ads
Rur
al 'B
' U
rban
'B'
Rur
al 'C
' U
rban
'C'
Rur
al 'U
' U
rban
'U'
All
min
or
road
s
Maj
or:
Tru
nk
road
s
Maj
or:
P
rin
icip
al
road
sM
ino
rro
ads
To
tal r
oad
le
ng
th
E06
0000
36S
outh
Eas
tB
rack
nell
Fore
st U
A0.
90.
00.
90.
00.
026
.422
.348
.729
.613
.118
.426
.150
.727
0.4
408.
30.
948
.740
8.3
457.
9E
0600
0043
Sou
th E
ast
Brig
hton
and
Hov
e U
A0.
00.
00.
014
.20.
06.
239
.359
.72.
720
.216
.229
.810
.748
3.7
563.
314
.245
.556
3.3
623.
0E
0600
0046
Sou
th E
ast
Isle
of W
ight
UA
0.0
0.0
0.0
0.0
0.0
99.4
22.0
121.
473
.319
.415
4.4
30.4
272.
920
8.4
758.
80.
012
1.4
758.
888
0.2
E06
0000
35S
outh
Eas
tM
edw
ay U
A7.
90.
07.
90.
00.
025
.543
.769
.217
.914
.250
.634
.213
3.8
518.
776
9.4
7.9
69.2
769.
484
6.5
E06
0000
42S
outh
Eas
tM
ilton
Key
nes
UA
16.8
0.0
16.8
10.3
8.4
45.7
26.9
91.3
18.8
13.3
77.5
139.
716
3.6
699.
01,
111.
935
.572
.61,
111.
91,
220.
0E
0600
0044
Sou
th E
ast
Por
tsm
outh
UA
7.1
2.4
9.5
4.0
0.0
0.0
44.3
48.3
4.4
9.3
0.0
21.0
12.8
347.
539
5.0
11.1
46.7
395.
045
2.8
E06
0000
38S
outh
Eas
tR
eadi
ng U
A1.
10.
01.
10.
00.
00.
335
.335
.61.
39.
00.
059
.113
.727
4.7
357.
81.
135
.635
7.8
394.
5E
0600
0039
Sou
th E
ast
Slo
ugh
UA
9.3
0.0
9.3
0.0
0.0
4.6
17.1
21.7
0.9
4.7
0.0
2.5
14.6
260.
628
3.3
9.3
21.7
283.
331
4.3
E06
0000
45S
outh
Eas
tS
outh
ampt
on U
A2.
50.
02.
50.
10.
00.
554
.354
.90.
23.
20.
054
.83.
845
8.3
520.
32.
654
.852
0.3
577.
7E
0600
0037
Sou
th E
ast
Wes
t Ber
kshi
re U
A44
.50.
044
.522
.80.
082
.421
.212
6.4
66.8
8.0
385.
337
.150
2.8
245.
61,
245.
667
.310
3.6
1,24
5.6
1,41
6.5
E06
0000
40S
outh
Eas
tW
inds
or a
nd M
aide
nhea
d U
A20
.20.
020
.26.
80.
040
.432
.279
.438
.430
.377
.325
.887
.933
3.2
592.
927
.072
.659
2.9
692.
5E
0600
0041
Sou
th E
ast
Wok
ingh
am U
A12
.78.
220
.90.
00.
050
.423
.974
.336
.222
.460
.924
.614
5.4
357.
964
7.4
12.7
82.5
647.
474
2.6
E10
0000
02S
outh
Eas
tB
ucki
ngha
msh
ire 6
0.9
0.0
60.9
6.6
0.0
273.
683
.036
3.2
117.
625
.780
3.8
118.
496
8.9
791.
12,
825.
567
.535
6.6
2,82
5.5
3,24
9.6
E10
0000
11S
outh
Eas
tE
ast S
usse
x 0.
00.
00.
090
.37.
325
8.4
84.4
440.
423
1.8
47.7
678.
511
5.5
936.
396
0.4
2,97
0.2
97.6
342.
82,
970.
23,
410.
6E
1000
0014
Sou
th E
ast
Ham
pshi
re 1
27.3
0.0
127.
313
5.8
3.3
509.
915
8.5
807.
543
5.3
138.
41,
554.
847
7.4
2,63
1.3
2,70
7.6
7,94
4.8
266.
466
8.4
7,94
4.8
8,87
9.6
E10
0000
16S
outh
Eas
tK
ent 1
61.7
0.0
161.
716
1.8
6.4
565.
823
9.2
973.
232
3.6
125.
81,
574.
130
1.2
3,33
8.1
2,28
8.8
7,95
1.6
329.
980
5.0
7,95
1.6
9,08
6.5
E10
0000
25S
outh
Eas
tO
xfor
dshi
re56
.60.
056
.646
.61.
551
2.7
79.7
640.
541
4.3
52.3
1,06
0.5
81.1
1,44
1.2
921.
63,
971.
010
4.7
592.
43,
971.
04,
668.
1E
1000
0030
Sou
th E
ast
Sur
rey
101.
80.
010
1.8
52.2
7.6
294.
226
3.4
617.
421
1.3
169.
940
8.9
215.
41,
281.
52,
525.
64,
812.
616
1.6
557.
64,
812.
65,
531.
8E
1000
0032
Sou
th E
ast
Wes
t Sus
sex
12.7
0.0
12.7
75.2
10.3
354.
312
0.4
560.
225
4.4
73.0
769.
823
6.3
945.
01,
320.
53,
599.
098
.247
4.7
3,59
9.0
4,17
1.9
E06
0000
22S
outh
Wes
tB
ath
and
Nor
th E
ast S
omer
set U
A0.
00.
00.
014
.61.
782
.035
.113
3.4
37.2
11.2
267.
446
.425
0.3
313.
292
5.7
16.3
117.
192
5.7
1,05
9.1
E06
0000
28S
outh
Wes
tB
ourn
emou
th U
A0.
00.
00.
00.
00.
02.
236
.538
.70.
511
.60.
231
.88.
241
7.4
469.
70.
038
.746
9.7
508.
4E
0600
0023
Sou
th W
est
Bris
tol,
City
of U
A13
.90.
013
.90.
00.
51.
489
.591
.43.
552
.15.
168
.523
.388
5.3
1,03
7.8
14.4
90.9
1,03
7.8
1,14
3.1
E06
0000
52S
outh
Wes
tC
ornw
all U
A
0.0
0.0
0.0
152.
02.
549
7.6
44.7
696.
856
3.9
17.6
2,50
1.7
143.
23,
055.
138
0.1
6,66
1.6
154.
554
2.3
6,66
1.6
7,35
8.4
E06
0000
53S
outh
Wes
tIs
les
of S
cilly
UA
0.0
0.0
0.0
0.0
0.0
7.7
0.0
7.7
0.0
0.0
0.0
0.0
29.0
0.0
29.0
0.0
7.7
29.0
36.7
E06
0000
24S
outh
Wes
tN
orth
Som
erse
t UA
29.2
0.0
29.2
0.0
0.0
78.5
14.7
93.2
57.7
24.6
195.
952
.528
9.0
407.
81,
027.
529
.293
.21,
027.
51,
149.
9E
0600
0026
Sou
th W
est
Ply
mou
th U
A0.
00.
00.
03.
39.
30.
928
.542
.05.
230
.812
.272
.120
.462
6.1
766.
812
.629
.476
6.8
808.
8E
0600
0029
Sou
th W
est
Poo
le U
A0.
00.
00.
03.
30.
03.
735
.942
.93.
128
.229
.929
.20.
039
3.5
483.
93.
339
.648
3.9
526.
8E
0600
0025
Sou
th W
est
Sou
th G
louc
este
rshi
re U
A74
.20.
074
.28.
00.
064
.949
.912
2.8
91.9
27.2
222.
857
.833
3.4
589.
01,
322.
182
.211
4.8
1,32
2.1
1,51
9.1
E06
0000
30S
outh
Wes
tS
win
don
UA
15.3
0.0
15.3
14.9
0.0
29.2
20.7
64.8
40.5
37.0
38.8
41.3
181.
447
1.7
810.
730
.249
.981
0.7
890.
8E
0600
0027
Sou
th W
est
Torb
ay U
A0.
00.
00.
00.
00.
015
.929
.345
.21.
47.
17.
242
.552
.036
6.1
476.
30.
045
.247
6.3
521.
5E
0600
0054
Sou
th W
est
Wilt
shire
UA
35
.00.
035
.011
7.3
7.4
486.
062
.467
3.1
293.
125
.71,
555.
311
8.9
1,49
2.2
546.
54,
031.
715
9.7
548.
44,
031.
74,
739.
8E
1000
0008
Sou
th W
est
Dev
on 3
8.5
0.0
38.5
180.
00.
090
4.5
50.0
1,13
4.5
619.
238
.54,
359.
915
1.4
5,90
4.1
772.
911
,846
.021
8.5
954.
511
,846
.013
,019
.0E
1000
0009
Sou
th W
est
Dor
set 0
.00.
00.
088
.52.
932
5.2
32.1
448.
733
5.4
58.7
1,07
5.9
49.1
1,58
9.3
770.
63,
879.
091
.435
7.3
3,87
9.0
4,32
7.7
E10
0000
13S
outh
Wes
tG
louc
este
rshi
re 6
8.2
0.0
68.2
57.7
3.0
445.
195
.660
1.4
346.
053
.11,
395.
817
5.0
1,78
7.0
1,11
6.3
4,87
3.2
128.
954
0.7
4,87
3.2
5,54
2.8
E10
0000
27S
outh
Wes
tS
omer
set
52.5
0.0
52.5
69.6
0.0
582.
858
.771
1.1
430.
226
.92,
103.
910
4.4
2,72
3.6
594.
15,
983.
112
2.1
641.
55,
983.
16,
746.
7
W06
0000
01W
ales
Isle
of A
ngle
sey
0.0
0.0
0.0
33.2
0.2
135.
15.
617
4.1
122.
32.
535
5.6
5.3
500.
055
.11,
040.
833
.414
0.7
1,04
0.8
1,21
4.9
W06
0000
02W
ales
Gw
yned
d0.
00.
00.
020
7.6
0.5
293.
97.
750
9.7
200.
70.
284
9.7
9.8
898.
142
.82,
001.
320
8.1
301.
62,
001.
32,
511.
0W
0600
0003
Wal
esC
onw
y0.
00.
00.
012
1.5
0.0
87.7
23.7
232.
916
1.5
10.4
456.
439
.254
2.1
209.
21,
418.
812
1.5
111.
41,
418.
81,
651.
7W
0600
0004
Wal
esD
enbi
ghsh
ire0.
00.
00.
073
.40.
011
6.7
16.7
206.
813
3.7
7.3
498.
922
.744
2.9
133.
91,
239.
473
.413
3.4
1,23
9.4
1,44
6.2
W06
0000
05W
ales
Flin
tshi
re0.
00.
00.
044
.05.
910
7.0
38.1
195.
047
.128
.623
3.3
29.5
408.
033
9.1
1,08
5.6
49.9
145.
11,
085.
61,
280.
6W
0600
0006
Wal
esW
rexh
am0.
00.
00.
027
.52.
676
.122
.112
8.3
119.
428
.331
7.1
57.0
331.
122
7.7
1,08
0.6
30.1
98.2
1,08
0.6
1,20
8.9
W06
0000
23W
ales
Pow
ys0.
00.
00.
041
5.5
2.7
241.
70.
666
0.5
596.
33.
52,
086.
310
.22,
010.
628
.54,
735.
441
8.2
242.
34,
735.
45,
395.
9W
0600
0008
Wal
esC
ered
igio
n0.
00.
00.
010
7.6
7.1
158.
51.
327
4.5
324.
21.
783
2.2
8.4
810.
533
.12,
010.
111
4.7
159.
82,
010.
12,
284.
6W
0600
0009
Wal
esP
embr
okes
hire
0.0
0.0
0.0
112.
86.
514
9.4
2.0
270.
722
9.1
7.1
958.
421
.01,
058.
777
.72,
352.
011
9.3
151.
42,
352.
02,
622.
7W
0600
0010
Wal
esC
arm
arth
ensh
ire5.
10.
05.
114
1.7
5.6
225.
319
.539
2.1
293.
031
.61,
201.
757
.31,
350.
323
4.4
3,16
8.3
152.
424
4.8
3,16
8.3
3,56
5.5
W06
0000
11W
ales
Sw
anse
a15
.40.
015
.40.
00.
050
.947
.398
.246
.448
.211
0.6
17.3
223.
362
1.3
1,06
7.1
15.4
98.2
1,06
7.1
1,18
0.7
W06
0000
12W
ales
Nea
th P
ort T
albo
t23
.20.
023
.223
.51.
885
.026
.513
6.8
41.6
25.8
39.8
11.9
243.
134
6.9
709.
148
.511
1.5
709.
186
9.1
W06
0000
13W
ales
Brid
gend
17.7
0.0
17.7
0.0
0.0
67.3
30.6
97.9
17.3
12.0
68.8
39.3
247.
528
4.5
669.
417
.797
.966
9.4
785.
0W
0600
0014
Wal
esTh
e V
ale
of G
lam
orga
n3.
70.
03.
70.
00.
052
.718
.371
.048
.812
.027
3.7
37.6
197.
727
5.4
845.
23.
771
.084
5.2
919.
9W
0600
0015
Wal
esC
ardi
ff17
.00.
017
.02.
40.
027
.362
.992
.67.
420
.254
.058
.048
.677
8.2
966.
419
.490
.296
6.4
1,07
6.0
W06
0000
16W
ales
Rho
ndda
Cyn
on T
af9.
80.
09.
823
.84.
885
.663
.017
7.2
25.4
46.8
88.8
35.2
242.
957
7.4
1,01
6.5
38.4
148.
61,
016.
51,
203.
5W
0600
0024
Wal
esM
erth
yr T
ydfil
0.0
0.0
0.0
35.7
0.0
11.1
11.7
58.5
7.2
4.9
14.0
20.7
77.6
162.
528
6.9
35.7
22.8
286.
934
5.4
W06
0000
18W
ales
Cae
rphi
lly0.
00.
00.
03.
80.
071
.720
.395
.827
.737
.310
8.9
43.7
282.
542
6.5
926.
63.
892
.092
6.6
1,02
2.4
W06
0000
19W
ales
Bla
enau
Gw
ent
0.0
0.0
0.0
8.1
3.2
26.6
15.0
52.9
5.8
14.4
33.6
14.4
36.3
254.
035
8.5
11.3
41.6
358.
541
1.4
W06
0000
20W
ales
Torfa
en0.
00.
00.
011
.51.
710
.910
.935
.013
.25.
433
.651
.080
.425
5.4
439.
013
.221
.843
9.0
474.
0W
0600
0021
Wal
esM
onm
outh
shire
22.7
0.0
22.7
88.3
5.4
55.5
1.4
150.
613
9.5
8.7
441.
317
.272
6.2
121.
21,
454.
111
6.4
56.9
1,45
4.1
1,62
7.4
W06
0000
22W
ales
New
port
26.7
0.0
26.7
16.7
0.0
10.6
22.8
50.1
21.1
24.0
116.
226
.210
8.3
360.
365
6.1
43.4
33.4
656.
173
2.9

Dep
artm
ent
for
Tra
nsp
ort
sta
tist
ics
Roa
d le
ngth
s st
atis
tics
Tab
le R
DL
0202
a (T
SG
B07
12)
To
tal r
oad
len
gth
(ki
lom
etre
s) b
y ro
ad t
ype
and
loca
l au
tho
rity
in G
reat
Bri
tain
, 201
1
Kilo
met
res
Mo
torw
ays
'A' r
oad
s M
ino
r ro
ads
All
road
s
ON
S A
rea
Co
de
Reg
ion
Lo
cal a
uth
ori
tyTr
unk
mot
orw
ays
Prin
cipa
lm
otor
way
sA
llm
oto
rway
sTr
unk
rura
l 'A
'Tr
unk
urba
n 'A
'P
rinci
pal
rura
l 'A
'P
rinci
pal
urba
n 'A
'A
ll 'A
' ro
ads
Rur
al 'B
' U
rban
'B'
Rur
al 'C
' U
rban
'C'
Rur
al 'U
' U
rban
'U'
All
min
or
road
s
Maj
or:
Tru
nk
road
s
Maj
or:
P
rin
icip
al
road
sM
ino
rro
ads
To
tal r
oad
le
ng
th
S12
0000
33S
cotla
ndA
berd
een
City
0.0
0.0
0.0
14.1
15.0
14.1
44.6
87.8
15.4
19.9
64.2
28.3
131.
863
6.5
896.
129
.158
.789
6.1
983.
9S
1200
0034
Sco
tland
Abe
rdee
nshi
re0.
00.
00.
017
7.2
1.8
695.
110
.288
4.3
783.
57.
71,
528.
17.
92,
888.
714
8.5
5,36
4.4
179.
070
5.3
5,36
4.4
6,24
8.7
S12
0000
41S
cotla
ndA
ngus
0.7
0.0
0.7
46.8
0.0
169.
226
.024
2.0
227.
98.
747
1.8
16.6
746.
122
5.8
1,69
6.9
47.5
195.
21,
696.
91,
939.
6S
1200
0035
Sco
tland
Arg
yll &
But
e0.
00.
00.
025
0.2
0.0
538.
78.
079
6.9
611.
00.
042
7.7
6.6
883.
367
.21,
995.
825
0.2
546.
71,
995.
82,
792.
7S
1200
0005
Sco
tland
Cla
ckm
anna
nshi
re0.
00.
00.
00.
00.
044
.77.
752
.425
.97.
724
.83.
410
6.5
90.1
258.
40.
052
.425
8.4
310.
8S
1200
0006
Sco
tland
Dum
fries
and
Gal
low
ay60
.40.
060
.428
0.2
3.6
483.
317
.778
4.8
725.
15.
31,
160.
215
.41,
885.
914
0.5
3,93
2.4
344.
250
1.0
3,93
2.4
4,77
7.6
S12
0000
42S
cotla
ndD
unde
e C
ity0.
00.
00.
00.
515
.22.
228
.546
.42.
111
.80.
095
.935
.240
0.2
545.
215
.730
.754
5.2
591.
6S
1200
0008
Sco
tland
Eas
t Ayr
shire
9.8
0.0
9.8
47.0
0.0
132.
27.
618
6.8
178.
215
.020
5.7
5.1
581.
414
6.5
1,13
1.9
56.8
139.
81,
131.
91,
328.
5S
1200
0009
Sco
tland
Eas
t Dun
barto
nshi
re0.
00.
00.
00.
00.
031
.121
.052
.130
.613
.819
.913
.995
.430
2.5
476.
10.
052
.147
6.1
528.
2S
1200
0010
Sco
tland
Eas
t Lot
hian
0.0
0.0
0.0
63.7
0.0
94.2
7.6
165.
516
2.9
3.0
220.
82.
148
8.6
53.5
930.
963
.710
1.8
930.
91,
096.
4S
1200
0011
Sco
tland
Eas
t Ren
frew
shire
11.9
0.0
11.9
0.0
0.0
22.9
15.9
38.8
27.4
7.6
48.4
34.5
107.
623
3.6
459.
111
.938
.845
9.1
509.
8S
1200
0036
Sco
tland
Edi
nbur
gh, C
ity o
f16
.40.
016
.416
.40.
032
.695
.214
4.2
19.1
33.1
59.0
60.4
114.
81,
063.
71,
350.
132
.812
7.8
1,35
0.1
1,51
0.7
S12
0000
13S
cotla
ndE
ilean
Sia
r0.
00.
00.
00.
00.
033
3.3
0.0
333.
316
0.7
0.0
173.
70.
063
1.0
0.0
965.
40.
033
3.3
965.
41,
298.
7S
1200
0014
Sco
tland
Falk
irk36
.30.
036
.32.
70.
052
.154
.910
9.7
66.4
28.1
101.
513
.617
3.0
418.
880
1.4
39.0
107.
080
1.4
947.
4S
1200
0015
Sco
tland
Fife
17.3
0.0
17.3
84.2
6.3
268.
948
.740
8.1
260.
753
.433
0.7
22.4
940.
976
6.1
2,37
4.2
107.
831
7.6
2,37
4.2
2,79
9.6
S12
0000
43S
cotla
ndG
lasg
ow C
ity45
.10.
045
.10.
00.
06.
812
1.1
127.
99.
751
.90.
420
9.0
52.5
1,34
4.9
1,66
8.4
45.1
127.
91,
668.
41,
841.
4S
1200
0017
Sco
tland
Hig
hlan
d0.
00.
00.
095
2.6
8.4
1,38
2.6
1.2
2,34
4.8
950.
123
.31,
424.
913
.43,
125.
122
7.8
5,76
4.6
961.
01,
383.
85,
764.
68,
109.
4S
1200
0018
Sco
tland
Inve
rcly
de0.
00.
00.
010
.02.
417
.316
.646
.317
.74.
835
.218
.882
.520
6.6
365.
612
.433
.936
5.6
411.
9S
1200
0019
Sco
tland
Mid
loth
ian
0.0
0.0
0.0
33.9
2.1
66.7
12.2
114.
971
.211
.991
.010
.220
8.0
153.
654
5.9
36.0
78.9
545.
966
0.8
S12
0000
20S
cotla
ndM
oray
0.0
0.0
0.0
93.5
4.1
155.
63.
425
6.6
288.
41.
835
7.8
5.5
797.
589
.11,
540.
197
.615
9.0
1,54
0.1
1,79
6.7
S12
0000
21S
cotla
ndN
orth
Ayr
shire
0.0
0.0
0.0
58.9
3.2
72.1
21.8
156.
013
2.9
20.2
196.
110
.433
4.4
310.
41,
004.
462
.193
.91,
004.
41,
160.
4S
1200
0044
Sco
tland
Nor
th L
anar
kshi
re24
.50.
024
.517
.113
.264
.862
.015
7.1
81.1
55.3
172.
655
.234
3.0
804.
21,
511.
454
.812
6.8
1,51
1.4
1,69
3.0
S12
0000
23S
cotla
ndO
rkne
y Is
land
s0.
00.
00.
00.
00.
016
3.8
0.0
163.
820
8.9
0.0
159.
80.
053
6.2
0.0
904.
90.
016
3.8
904.
91,
068.
7S
1200
0024
Sco
tland
Per
th a
nd K
inro
ss39
.10.
039
.114
3.7
0.0
461.
716
.662
2.0
347.
80.
063
5.7
2.4
1,17
2.6
163.
72,
322.
218
2.8
478.
32,
322.
22,
983.
3S
1200
0038
Sco
tland
Ren
frew
shire
20.4
0.0
20.4
21.9
0.0
31.2
27.2
80.3
44.3
18.1
106.
133
.516
7.4
465.
383
4.7
42.3
58.4
834.
793
5.4
S12
0000
26S
cotla
ndS
cotti
sh B
orde
rs0.
00.
00.
015
6.2
4.7
453.
37.
062
1.2
598.
15.
676
2.2
5.9
1,19
7.3
105.
82,
674.
916
0.9
460.
32,
674.
93,
296.
1S
1200
0027
Sco
tland
She
tland
Isla
nds
0.0
0.0
0.0
0.0
0.0
225.
00.
022
5.0
154.
60.
019
8.5
0.0
476.
70.
082
9.8
0.0
225.
082
9.8
1,05
4.8
S12
0000
28S
cotla
ndS
outh
Ayr
shire
0.0
0.0
0.0
93.1
0.0
84.6
23.7
201.
419
0.2
12.4
216.
415
.843
3.0
273.
71,
141.
593
.110
8.3
1,14
1.5
1,34
2.9
S12
0000
29S
cotla
ndS
outh
Lan
arks
hire
67.4
0.0
67.4
35.2
6.5
230.
339
.431
1.4
179.
440
.440
0.1
39.6
695.
477
6.7
2,13
1.6
109.
126
9.7
2,13
1.6
2,51
0.4
S12
0000
30S
cotla
ndS
tirlin
g22
.80.
022
.810
1.0
0.0
195.
018
.931
4.9
149.
98.
516
2.5
7.9
370.
516
0.9
860.
212
3.8
213.
986
0.2
1,19
7.9
S12
0000
39S
cotla
ndW
est D
unba
rtons
hire
0.0
0.0
0.0
18.1
1.3
16.9
27.7
64.0
0.0
8.8
18.8
8.1
34.6
279.
434
9.7
19.4
44.6
349.
741
3.7
S12
0000
40S
cotla
ndW
est L
othi
an37
.50.
037
.50.
00.
011
6.6
27.6
144.
290
.024
.611
0.5
5.8
315.
141
9.3
965.
337
.514
4.2
965.
31,
147.
0
Tel
epho
ne: 0
20 7
944
3180
Sou
rce:
Dep
artm
ent f
or T
rans
port
Em
ail:
road
.leng
th@
dft.g
si.g
ov.u
kN
otes
and
def
initi
ons
Last
upd
ated
: 28
June
201
2M
etho
dolo
gy n
ote
Nex
t upd
ate:
Jun
e 20
13
The
figur
es in
this
tabl
e ar
e N
atio
nal S
tatis
tics

Dep
artm
ent
for
Tra
nsp
ort
sta
tist
ics
Roa
d le
ngth
s st
atis
tics
Tab
le R
DL
0102
aT
ota
l ro
ad le
ng
th (
mile
s) b
y ro
ad t
ype
and
loca
l au
tho
rity
in G
reat
Bri
tain
, 201
1
Mile
sM
oto
rway
s'A
' ro
ads
Min
or
road
sA
ll ro
ads
ON
S A
rea
Co
de
Reg
ion
Lo
cal a
uth
ori
tyTr
unk
mot
orw
ays
Prin
cipa
lm
otor
way
sA
llm
oto
rway
sTr
unk
rura
l 'A
'Tr
unk
urba
n 'A
'P
rinci
pal
rura
l 'A
'P
rinci
pal
urba
n 'A
'A
ll 'A
'ro
ads
Rur
al 'B
' U
rban
'B'
Rur
al 'C
' U
rban
'C'
Rur
al 'U
' U
rban
'U'
All
min
or
road
s
Maj
or:
Tru
nk
road
s
Maj
or:
P
rin
icip
al
road
sM
ino
rro
ads
To
tal r
oad
le
ng
th
E06
0000
47N
orth
Eas
tC
ount
y D
urha
m U
A22
.90.
022
.921
.94.
320
4.5
20.7
251.
522
1.1
28.6
395.
136
.577
0.0
554.
82,
006.
049
.222
5.2
2,00
6.0
2,28
0.4
E06
0000
05N
orth
Eas
tD
arlin
gton
UA
5.9
0.0
5.9
7.6
0.0
23.5
8.6
39.8
11.9
6.3
56.0
11.7
59.2
148.
629
3.7
13.5
32.2
293.
733
9.3
E06
0000
01N
orth
Eas
tH
artle
pool
UA
0.0
0.0
0.0
5.2
0.0
10.9
12.3
28.5
0.8
4.8
7.1
6.8
27.5
173.
422
0.5
5.2
23.2
220.
524
8.9
E06
0000
02N
orth
Eas
tM
iddl
esbr
ough
UA
0.0
0.0
0.0
3.9
3.9
2.1
17.9
27.8
3.8
6.5
2.5
13.9
6.1
256.
728
9.4
7.8
19.9
289.
431
7.2
E06
0000
48N
orth
Eas
tN
orth
umbe
rland
UA
0.
00.
00.
010
1.0
0.0
251.
922
.937
5.8
380.
315
.790
4.3
43.3
1,18
7.5
301.
92,
833.
110
1.0
274.
82,
833.
13,
208.
9E
0600
0003
Nor
th E
ast
Red
car a
nd C
leve
land
UA
0.0
0.0
0.0
2.7
1.9
39.8
13.7
58.2
9.6
4.6
21.1
7.6
137.
917
8.8
359.
74.
753
.535
9.7
417.
9E
0600
0004
Nor
th E
ast
Sto
ckto
n-on
-Tee
s U
A0.
00.
00.
011
.96.
019
.426
.063
.32.
16.
243
.119
.751
.634
3.9
466.
517
.845
.546
6.5
529.
8E
0800
0020
Nor
th E
ast
Gat
eshe
ad3.
30.
03.
34.
04.
217
.620
.346
.011
.516
.921
.637
.990
.533
2.6
511.
011
.437
.951
1.0
560.
4E
0800
0021
Nor
th E
ast
New
cast
le u
pon
Tyne
0.0
1.5
1.5
8.1
5.1
0.8
40.4
54.4
6.8
22.8
8.9
44.9
34.4
428.
554
6.4
13.2
42.7
546.
460
2.2
E08
0000
22N
orth
Eas
tN
orth
Tyn
esid
e0.
00.
00.
04.
53.
39.
638
.555
.911
.111
.01.
019
.832
.135
8.7
433.
77.
848
.243
3.7
489.
6E
0800
0023
Nor
th E
ast
Sou
th T
ynes
ide
0.1
0.0
0.1
3.7
1.6
10.3
18.1
33.7
4.2
16.4
1.5
19.4
17.7
250.
831
0.0
5.3
28.5
310.
034
3.7
E08
0000
24N
orth
Eas
tS
unde
rland
2.4
0.0
2.4
8.0
0.0
17.1
38.4
63.5
11.6
18.7
14.2
29.1
56.2
509.
363
9.1
10.4
55.5
639.
170
5.0
E06
0000
08N
orth
Wes
tB
lack
burn
with
Dar
wen
UA
5.0
0.0
5.0
0.0
0.0
10.1
23.7
33.8
4.6
6.8
29.6
5.8
26.7
228.
530
2.0
5.0
33.8
302.
034
0.8
E06
0000
09N
orth
Wes
tB
lack
pool
UA
0.0
0.0
0.0
0.0
0.0
1.2
24.3
25.5
0.2
12.8
0.4
9.1
3.7
232.
325
8.4
0.0
25.5
258.
428
3.9
E06
0000
49N
orth
Wes
tC
hesh
ire E
ast U
A29
.40.
029
.44.
30.
019
9.5
58.6
262.
465
.622
.030
8.8
44.4
527.
851
2.4
1,48
1.0
33.7
258.
11,
481.
01,
772.
8E
0600
0050
Nor
th W
est
Che
shire
Wes
t and
Che
ster
UA
25.2
0.0
25.2
19.1
0.0
137.
338
.219
4.5
67.5
20.1
260.
849
.344
2.2
428.
21,
268.
244
.217
5.4
1,26
8.2
1,48
7.9
E06
0000
06N
orth
Wes
tH
alto
n U
A4.
00.
04.
00.
00.
010
.420
.430
.83.
08.
812
.026
.530
.324
2.2
322.
84.
030
.832
2.8
357.
6E
0600
0007
Nor
th W
est
War
ringt
on U
A20
.90.
020
.90.
00.
026
.336
.462
.716
.45.
831
.318
.199
.035
7.6
528.
320
.962
.752
8.3
611.
9E
1000
0006
Nor
th W
est
Cum
bria
66.
40.
066
.412
0.6
4.6
459.
935
.462
0.5
351.
911
.21,
286.
817
4.4
2,20
8.3
312.
04,
344.
619
1.6
495.
34,
344.
65,
031.
6E
0800
0001
Nor
th W
est
Bol
ton
10.7
0.0
10.7
0.0
0.0
16.9
46.1
63.0
8.7
21.4
17.0
12.2
40.4
441.
454
1.1
10.7
63.0
541.
161
4.8
E08
0000
02N
orth
Wes
tB
ury
12.9
0.0
12.9
0.0
0.0
3.7
30.5
34.2
5.0
15.7
1.5
21.9
33.7
301.
337
9.1
12.9
34.2
379.
142
6.2
E08
0000
03N
orth
Wes
tM
anch
este
r10
.32.
012
.20.
01.
41.
268
.571
.10.
822
.40.
152
.17.
668
4.8
767.
811
.671
.776
7.8
851.
1E
0800
0004
Nor
th W
est
Old
ham
5.2
0.0
5.2
0.1
2.5
24.5
33.9
61.1
4.9
14.4
2.3
17.3
61.3
345.
044
5.2
7.8
58.5
445.
251
1.5
E08
0000
05N
orth
Wes
tR
ochd
ale
16.0
0.0
16.0
0.0
0.0
9.6
41.7
51.3
3.8
11.0
15.6
6.5
32.6
350.
441
9.9
16.0
51.3
419.
948
7.2
E08
0000
06N
orth
Wes
tS
alfo
rd17
.40.
017
.40.
00.
02.
152
.654
.60.
418
.215
.72.
10.
038
6.4
422.
817
.454
.642
2.8
494.
9E
0800
0007
Nor
th W
est
Sto
ckpo
rt8.
00.
08.
00.
00.
06.
346
.052
.33.
220
.79.
817
.237
.146
8.3
556.
38.
052
.355
6.3
616.
5E
0800
0008
Nor
th W
est
Tam
esid
e9.
50.
09.
51.
30.
72.
237
.041
.21.
917
.91.
222
.037
.634
5.7
426.
311
.539
.242
6.3
477.
0E
0800
0009
Nor
th W
est
Traf
ford
5.9
0.0
5.9
0.0
0.0
4.3
32.0
36.3
5.9
27.2
6.9
23.2
26.0
367.
945
7.0
5.9
36.3
457.
049
9.2
E08
0000
10N
orth
Wes
tW
igan
11.4
0.0
11.4
0.0
0.0
18.6
53.8
72.5
12.3
22.6
22.5
19.6
59.5
498.
263
4.7
11.4
72.5
634.
771
8.6
E10
0000
17N
orth
Wes
tLa
ncas
hire
93.
87.
310
1.1
24.0
7.3
272.
113
2.1
435.
519
1.8
90.6
703.
299
.01,
073.
71,
608.
53,
766.
812
5.0
411.
53,
766.
84,
303.
4E
0800
0011
Nor
th W
est
Kno
wsl
ey 9
.83.
313
.10.
00.
211
.218
.029
.55.
87.
512
.117
.028
.324
5.4
316.
010
.132
.531
6.0
358.
5E
0800
0012
Nor
th W
est
Live
rpoo
l0.
00.
60.
60.
00.
03.
373
.376
.60.
921
.46.
438
.60.
774
3.7
811.
70.
077
.281
1.7
888.
9E
0800
0014
Nor
th W
est
Sef
ton
5.1
0.0
5.1
0.2
3.4
7.9
42.5
53.9
6.1
17.3
18.1
22.5
41.8
449.
155
4.9
8.6
50.4
554.
961
3.9
E08
0000
13N
orth
Wes
tS
t. H
elen
s8.
70.
08.
70.
00.
024
.826
.851
.617
.38.
211
.63.
460
.729
3.7
394.
88.
751
.639
4.8
455.
2E
0800
0015
Nor
th W
est
Wirr
al12
.40.
012
.40.
00.
013
.652
.165
.711
.530
.16.
726
.843
.955
4.4
673.
412
.465
.767
3.4
751.
5
E06
0000
11Y
orks
hire
and
The
Hum
ber
Eas
t Rid
ing
of Y
orks
hire
UA
21.6
0.0
21.6
11.7
0.5
201.
113
.922
7.2
192.
314
.752
9.4
41.0
885.
322
5.6
1,88
8.3
33.8
215.
01,
888.
32,
137.
1E
0600
0010
Yor
kshi
re a
nd T
he H
umbe
rK
ings
ton
upon
Hul
l, C
ity o
f UA
0.0
0.0
0.0
0.0
8.0
0.0
20.4
28.4
0.1
5.9
0.2
48.4
8.3
370.
243
3.1
8.0
20.4
433.
146
1.5
E06
0000
12Y
orks
hire
and
The
Hum
ber
Nor
th E
ast L
inco
lnsh
ire U
A0.
00.
00.
08.
20.
023
.520
.852
.511
.19.
029
.620
.642
.923
1.0
344.
28.
244
.334
4.2
396.
7E
0600
0013
Yor
kshi
re a
nd T
he H
umbe
rN
orth
Lin
coln
shire
UA
24.2
0.0
24.2
8.0
0.0
83.8
11.7
103.
595
.15.
518
7.4
16.8
314.
013
2.7
751.
532
.295
.475
1.5
879.
2E
0600
0014
Yor
kshi
re a
nd T
he H
umbe
rY
ork
UA
0.0
0.0
0.0
14.7
0.0
25.3
19.9
59.8
16.0
3.0
60.8
21.7
107.
622
7.0
436.
114
.745
.243
6.1
495.
9E
1000
0023
Yor
kshi
re a
nd T
he H
umbe
rN
orth
Yor
kshi
re
32.7
0.0
32.7
102.
30.
050
8.2
41.1
651.
639
1.3
17.3
1,62
7.9
80.4
2,58
2.5
385.
95,
085.
513
5.0
549.
35,
085.
55,
769.
8E
0800
0016
Yor
kshi
re a
nd T
he H
umbe
rB
arns
ley
10.7
0.0
10.7
13.0
0.0
49.5
31.1
93.6
21.4
24.7
64.2
37.8
170.
632
7.3
646.
023
.880
.564
6.0
750.
4E
0800
0017
Yor
kshi
re a
nd T
he H
umbe
rD
onca
ster
37.5
0.0
37.5
2.7
0.0
58.8
35.4
96.9
24.0
8.9
116.
440
.024
7.5
464.
090
0.9
40.3
94.2
900.
91,
035.
4E
0800
0018
Yor
kshi
re a
nd T
he H
umbe
rR
othe
rham
16.
80.
016
.80.
00.
023
.742
.566
.237
.022
.218
.592
.115
9.9
335.
666
5.4
16.8
66.2
665.
474
8.5
E08
0000
19Y
orks
hire
and
The
Hum
ber
She
ffiel
d6.
40.
06.
42.
80.
727
.063
.594
.110
.352
.613
8.2
18.0
33.7
877.
61,
130.
49.
990
.51,
130.
41,
230.
9E
0800
0032
Yor
kshi
re a
nd T
he H
umbe
rB
radf
ord
1.7
0.0
1.7
0.0
0.0
35.5
58.9
94.4
19.0
29.6
34.8
44.6
223.
875
7.3
1,10
9.0
1.7
94.4
1,10
9.0
1,20
5.1
E08
0000
33Y
orks
hire
and
The
Hum
ber
Cal
derd
ale
7.6
0.0
7.6
0.0
0.0
32.1
52.3
84.3
15.2
6.5
37.7
30.5
251.
230
0.7
641.
87.
684
.364
1.8
733.
8E
0800
0034
Yor
kshi
re a
nd T
he H
umbe
rK
irkle
es 1
4.4
0.0
14.4
0.0
0.0
49.8
80.4
130.
231
.424
.639
.753
.128
3.0
612.
61,
044.
514
.413
0.2
1,04
4.5
1,18
9.1
E08
0000
35Y
orks
hire
and
The
Hum
ber
Leed
s40
.02.
242
.16.
30.
064
.911
8.1
189.
311
.236
.455
.441
.624
6.7
1,24
4.9
1,63
6.2
46.3
185.
21,
636.
21,
867.
7E
0800
0036
Yor
kshi
re a
nd T
he H
umbe
rW
akef
ield
22.5
0.0
22.5
6.1
0.0
51.6
46.7
104.
336
.119
.358
.222
.919
2.9
501.
383
0.6
28.6
98.2
830.
695
7.5
E06
0000
15E
ast M
idla
nds
Der
by U
A0.
00.
00.
02.
28.
50.
634
.946
.10.
23.
60.
047
.123
.435
1.8
426.
110
.735
.442
6.1
472.
2E
0600
0016
Eas
t Mid
land
sLe
ices
ter U
A0.
00.
00.
02.
10.
00.
041
.443
.50.
48.
71.
527
.010
.941
6.8
465.
22.
141
.446
5.2
508.
7E
0600
0018
Eas
t Mid
land
sN
ottin
gham
UA
0.2
0.0
0.2
0.6
5.8
0.0
38.5
45.0
0.6
14.9
0.0
26.8
6.8
401.
145
0.1
6.6
38.5
450.
149
5.2
E06
0000
17E
ast M
idla
nds
Rut
land
UA
0.0
0.0
0.0
11.5
0.0
47.8
0.0
59.3
19.1
3.9
109.
90.
212
7.1
22.7
282.
911
.547
.828
2.9
342.
3E
1000
0007
Eas
t Mid
land
sD
erby
shire
22.
10.
022
.156
.21.
731
6.2
67.2
441.
323
4.7
57.8
702.
812
1.8
1,13
3.8
782.
43,
033.
380
.038
3.3
3,03
3.3
3,49
6.7
E10
0000
18E
ast M
idla
nds
Leic
este
rshi
re 5
1.1
0.0
51.1
49.3
0.2
181.
637
.426
8.5
117.
428
.169
7.2
117.
584
9.4
688.
72,
498.
210
0.7
219.
02,
498.
22,
817.
8E
1000
0019
Eas
t Mid
land
sLi
ncol
nshi
re0.
00.
00.
038
.30.
060
6.0
43.9
688.
244
6.8
44.0
1,72
1.8
100.
52,
035.
948
0.8
4,82
9.7
38.3
649.
94,
829.
75,
518.
0E
1000
0021
Eas
t Mid
land
sN
orth
ampt
onsh
ire33
.80.
033
.810
4.6
0.9
226.
982
.941
5.3
82.4
12.2
624.
471
.688
4.1
686.
12,
360.
713
9.3
309.
82,
360.
72,
809.
7E
1000
0024
Eas
t Mid
land
sN
ottin
gham
shire
14.
20.
014
.279
.64.
424
8.4
60.1
392.
610
5.8
67.7
413.
564
.499
5.7
942.
62,
589.
698
.230
8.6
2,58
9.6
2,99
6.4

Dep
artm
ent
for
Tra
nsp
ort
sta
tist
ics
Roa
d le
ngth
s st
atis
tics
Tab
le R
DL
0102
aT
ota
l ro
ad le
ng
th (
mile
s) b
y ro
ad t
ype
and
loca
l au
tho
rity
in G
reat
Bri
tain
, 201
1
Mile
sM
oto
rway
s'A
' ro
ads
Min
or
road
sA
ll ro
ads
ON
S A
rea
Co
de
Reg
ion
Lo
cal a
uth
ori
tyTr
unk
mot
orw
ays
Prin
cipa
lm
otor
way
sA
llm
oto
rway
sTr
unk
rura
l 'A
'Tr
unk
urba
n 'A
'P
rinci
pal
rura
l 'A
'P
rinci
pal
urba
n 'A
'A
ll 'A
'ro
ads
Rur
al 'B
' U
rban
'B'
Rur
al 'C
' U
rban
'C'
Rur
al 'U
' U
rban
'U'
All
min
or
road
s
Maj
or:
Tru
nk
road
s
Maj
or:
P
rin
icip
al
road
sM
ino
rro
ads
To
tal r
oad
le
ng
th
E06
0000
19W
est M
idla
nds
Her
efor
dshi
re, C
ount
y of
UA
4.7
0.0
4.7
45.1
3.1
217.
012
.727
7.9
185.
111
.264
8.8
19.2
805.
712
3.6
1,79
3.7
52.9
229.
71,
793.
72,
076.
2E
0600
0051
Wes
t Mid
land
sS
hrop
shire
UA
7.7
0.0
7.7
75.9
0.0
252.
020
.034
7.8
332.
615
.81,
068.
828
.11,
247.
618
1.5
2,87
4.4
83.6
272.
02,
874.
43,
229.
9E
0600
0021
Wes
t Mid
land
sS
toke
-on-
Tren
t UA
0.0
0.0
0.0
0.6
9.9
3.7
50.8
65.0
1.0
11.9
4.0
16.6
13.0
429.
947
6.3
10.5
54.5
476.
354
1.3
E06
0000
20W
est M
idla
nds
Telfo
rd a
nd W
reki
n U
A7.
50.
07.
52.
70.
032
.017
.151
.832
.09.
971
.868
.313
4.1
264.
158
0.2
10.2
49.1
580.
263
9.5
E10
0000
28W
est M
idla
nds
Sta
fford
shire
62.
60.
062
.652
.48.
231
2.6
97.0
470.
315
7.0
49.3
765.
713
8.3
1,27
1.5
1,00
2.0
3,38
3.7
123.
240
9.6
3,38
3.7
3,91
6.6
E10
0000
31W
est M
idla
nds
War
wic
kshi
re87
.10.
087
.153
.22.
219
4.4
47.7
297.
523
0.2
36.2
477.
359
.582
5.2
551.
72,
180.
114
2.5
242.
12,
180.
12,
564.
8E
0800
0025
Wes
t Mid
land
sB
irmin
gham
13.7
2.0
15.7
0.0
0.0
3.8
117.
912
1.7
0.0
76.4
3.4
85.1
18.3
1,24
9.6
1,43
2.7
13.7
123.
71,
432.
71,
570.
0E
0800
0026
Wes
t Mid
land
sC
oven
try2.
30.
02.
31.
90.
02.
929
.133
.84.
732
.41.
835
.124
.440
7.1
505.
54.
231
.950
5.5
541.
6E
0800
0027
Wes
t Mid
land
sD
udle
y 3.
40.
03.
40.
00.
05.
053
.158
.12.
126
.01.
721
.57.
151
4.4
572.
73.
458
.157
2.7
634.
2E
0800
0028
Wes
t Mid
land
sS
andw
ell 1
1.2
0.0
11.2
0.0
0.2
0.0
52.0
52.2
0.2
23.5
0.0
34.4
1.1
430.
448
9.7
11.4
52.0
489.
755
3.1
E08
0000
29W
est M
idla
nds
Sol
ihul
l12
.30.
012
.32.
20.
016
.416
.635
.222
.720
.440
.621
.685
.330
0.2
490.
914
.533
.049
0.9
538.
4E
0800
0030
Wes
t Mid
land
sW
alsa
ll5.
40.
05.
41.
20.
67.
041
.950
.63.
721
.10.
06.
628
.542
1.2
481.
27.
248
.848
1.2
537.
2E
0800
0031
Wes
t Mid
land
sW
olve
rham
pton
0.0
0.0
0.0
0.0
0.0
0.2
38.2
38.4
0.1
8.2
0.0
21.7
3.5
403.
343
6.9
0.0
38.4
436.
947
5.3
E10
0000
34W
est M
idla
nds
Wor
cest
ersh
ire 4
7.5
0.0
47.5
11.9
1.5
230.
060
.030
3.4
190.
950
.657
0.1
90.8
725.
861
5.2
2,24
3.4
60.9
289.
92,
243.
42,
594.
2
E06
0000
55E
ast o
f Eng
land
Bed
ford
UA
0.
00.
00.
017
.80.
034
.616
.168
.513
.25.
211
5.0
14.9
175.
915
9.9
484.
017
.850
.748
4.0
552.
6E
0600
0056
Eas
t of E
ngla
ndC
entra
l Bed
ford
shire
UA
16
.50.
016
.526
.84.
068
.413
.411
2.6
49.3
4.9
177.
821
.730
1.6
221.
777
7.0
47.3
81.8
777.
090
6.1
E06
0000
32E
ast o
f Eng
land
Luto
n U
A1.
60.
01.
60.
00.
01.
717
.819
.41.
35.
40.
06.
63.
025
0.1
266.
41.
619
.426
6.4
287.
5E
0600
0031
Eas
t of E
ngla
ndP
eter
boro
ugh
UA
0.0
0.0
0.0
21.2
3.2
27.5
22.0
73.9
33.1
0.8
71.2
25.9
120.
924
8.5
500.
524
.449
.550
0.5
574.
3E
0600
0033
Eas
t of E
ngla
ndS
outh
end-
on-S
ea U
A0.
00.
00.
00.
00.
00.
020
.820
.80.
05.
90.
020
.73.
922
8.8
259.
30.
020
.825
9.3
280.
1E
0600
0034
Eas
t of E
ngla
ndTh
urro
ck U
A4.
20.
04.
211
.10.
121
.618
.251
.012
.96.
731
.016
.851
.918
1.4
300.
715
.339
.830
0.7
355.
9E
1000
0003
Eas
t of E
ngla
ndC
ambr
idge
shire
29.
50.
029
.510
2.0
2.7
211.
932
.434
9.0
315.
529
.360
3.8
75.1
1,11
9.9
408.
32,
551.
913
4.2
244.
32,
551.
92,
930.
4E
1000
0012
Eas
t of E
ngla
ndE
ssex
46.
80.
046
.892
.00.
020
2.2
98.5
392.
738
5.5
93.1
918.
014
8.1
1,60
9.2
1,50
2.5
4,65
6.4
138.
830
0.7
4,65
6.4
5,09
5.9
E10
0000
15E
ast o
f Eng
land
Her
tford
shire
66.1
0.0
66.1
6.6
0.0
180.
412
1.7
308.
713
3.7
65.4
372.
014
0.6
611.
21,
358.
62,
681.
572
.630
2.1
2,68
1.5
3,05
6.2
E10
0000
20E
ast o
f Eng
land
Nor
folk
0.0
0.0
0.0
108.
84.
540
6.2
57.5
577.
138
7.1
14.5
1,96
7.0
169.
12,
572.
456
8.9
5,67
9.0
113.
346
3.7
5,67
9.0
6,25
6.0
E10
0000
29E
ast o
f Eng
land
Suf
folk
0.0
0.0
0.0
73.6
6.3
292.
367
.343
9.5
415.
134
.41,
062.
813
8.9
1,63
7.3
604.
63,
893.
179
.935
9.6
3,89
3.1
4,33
2.6
E09
0000
07Lo
ndon
Cam
den
0.0
0.0
0.0
0.0
0.0
0.0
23.6
23.6
0.2
12.4
0.0
0.0
0.0
141.
215
3.7
0.0
23.6
153.
717
7.3
E09
0000
01Lo
ndon
City
of L
ondo
n0.
00.
00.
00.
00.
00.
08.
08.
00.
00.
70.
14.
40.
022
.727
.80.
08.
027
.835
.9E
0900
0012
Lond
onH
ackn
ey0.
00.
00.
00.
00.
00.
022
.122
.10.
57.
60.
09.
41.
113
0.9
149.
60.
022
.114
9.6
171.
7E
0900
0013
Lond
onH
amm
ersm
ith a
nd F
ulha
m0.
00.
00.
00.
00.
00.
019
.919
.90.
02.
90.
07.
30.
010
8.7
119.
00.
019
.911
9.0
138.
9E
0900
0014
Lond
onH
arin
gey
0.0
0.0
0.0
0.0
0.0
0.0
23.1
23.1
0.1
12.1
0.1
13.2
0.0
172.
719
8.2
0.0
23.1
198.
222
1.3
E09
0000
19Lo
ndon
Islin
gton
0.0
0.0
0.0
0.0
0.0
0.0
23.7
23.7
0.0
4.7
0.2
9.2
0.0
113.
012
7.1
0.0
23.7
127.
115
0.7
E09
0000
20Lo
ndon
Ken
sing
ton
and
Che
lsea
0.0
0.0
0.0
0.0
0.0
0.0
18.9
18.9
0.1
6.2
0.1
5.5
0.0
98.1
110.
00.
018
.911
0.0
128.
9E
0900
0022
Lond
onLa
mbe
th0.
00.
00.
00.
00.
00.
033
.133
.10.
07.
60.
818
.40.
017
3.3
200.
10.
033
.120
0.1
233.
3E
0900
0023
Lond
onLe
wis
ham
0.0
0.0
0.0
0.0
0.0
0.0
24.0
24.0
0.0
11.4
0.1
16.1
0.0
226.
125
3.7
0.0
24.0
253.
727
7.8
E09
0000
25Lo
ndon
New
ham
0.0
0.0
0.0
0.0
0.0
0.0
32.4
32.4
0.0
8.5
0.0
0.0
0.0
217.
622
6.1
0.0
32.4
226.
125
8.4
E09
0000
28Lo
ndon
Sou
thw
ark
0.0
0.0
0.0
0.0
0.0
0.0
33.6
33.6
0.0
10.7
0.1
26.7
0.0
175.
021
2.5
0.0
33.6
212.
524
6.1
E09
0000
30Lo
ndon
Tow
er H
amle
ts0.
00.
00.
00.
00.
00.
025
.725
.70.
213
.90.
434
.50.
011
1.6
160.
50.
025
.716
0.5
186.
2E
0900
0032
Lond
onW
ands
wor
th0.
00.
00.
00.
00.
00.
033
.933
.90.
19.
50.
00.
00.
022
4.0
233.
60.
033
.923
3.6
267.
4E
0900
0033
Lond
onW
estm
inst
er0.
00.
00.
00.
00.
00.
037
.337
.30.
311
.40.
117
.10.
014
6.5
175.
40.
037
.317
5.4
212.
6E
0900
0002
Lond
onB
arki
ng a
nd D
agen
ham
0.0
0.0
0.0
0.0
0.0
0.2
22.8
23.1
0.0
1.8
0.1
15.5
1.2
164.
518
3.1
0.0
23.1
183.
120
6.2
E09
0000
03Lo
ndon
Bar
net
7.5
0.0
7.5
0.0
0.0
7.5
52.4
59.9
1.3
11.4
0.0
0.0
6.5
388.
640
7.8
7.5
59.9
407.
847
5.2
E09
0000
04Lo
ndon
Bex
ley
0.0
0.0
0.0
0.0
0.0
3.5
39.0
42.5
0.9
6.9
0.0
19.0
5.4
263.
229
5.4
0.0
42.5
295.
433
7.9
E09
0000
05Lo
ndon
Bre
nt0.
00.
00.
00.
00.
00.
032
.832
.80.
39.
10.
124
.40.
023
5.5
269.
30.
032
.826
9.3
302.
1E
0900
0006
Lond
onB
rom
ley
0.0
0.0
0.0
0.0
0.0
8.1
47.5
55.7
3.0
14.6
5.6
34.5
52.0
394.
450
4.2
0.0
55.7
504.
255
9.9
E09
0000
08Lo
ndon
Cro
ydon
0.0
0.0
0.0
0.0
0.0
0.2
47.7
48.0
0.4
17.1
0.6
32.3
9.5
374.
943
4.8
0.0
48.0
434.
848
2.8
E09
0000
09Lo
ndon
Eal
ing
0.0
0.0
0.0
0.0
0.0
0.0
33.7
33.7
0.6
15.7
0.0
0.0
0.0
315.
933
2.2
0.0
33.7
332.
236
5.9
E09
0000
10Lo
ndon
Enf
ield
7.0
0.0
7.0
0.0
0.0
3.7
46.3
50.0
0.0
4.1
0.0
28.2
8.1
302.
334
2.7
7.0
50.0
342.
739
9.7
E09
0000
11Lo
ndon
Gre
enw
ich
0.0
0.0
0.0
0.0
0.0
0.0
40.9
40.9
0.2
8.3
1.0
27.8
0.0
237.
427
4.6
0.0
40.9
274.
631
5.5
E09
0000
15Lo
ndon
Har
row
0.6
0.0
0.6
0.0
0.0
0.4
24.7
25.1
0.0
1.1
1.1
12.3
3.5
252.
027
0.0
0.6
25.1
270.
029
5.8
E09
0000
16Lo
ndon
Hav
erin
g7.
30.
07.
30.
00.
05.
325
.530
.86.
98.
216
.527
.711
.229
6.4
366.
97.
330
.836
6.9
404.
9E
0900
0017
Lond
onH
illin
gdon
6.4
0.0
6.4
0.0
0.0
5.2
39.8
45.0
0.9
10.4
13.0
19.8
14.7
349.
940
8.6
6.4
45.0
408.
645
9.9
E09
0000
18Lo
ndon
Hou
nslo
w6.
10.
06.
10.
00.
00.
043
.643
.60.
18.
60.
019
.00.
023
5.8
263.
56.
143
.626
3.5
313.
2E
0900
0021
Lond
onK
ings
ton
upon
Tha
mes
0.0
0.0
0.0
0.0
0.0
2.4
25.2
27.5
1.1
4.0
0.0
11.7
0.7
168.
818
6.3
0.0
27.5
186.
321
3.8
E09
0000
24Lo
ndon
Mer
ton
0.0
0.0
0.0
0.0
0.0
0.0
24.8
24.8
0.5
12.6
0.0
11.8
0.1
184.
320
9.3
0.0
24.8
209.
323
4.1
E09
0000
26Lo
ndon
Red
brid
ge2.
50.
02.
50.
00.
01.
234
.235
.40.
64.
24.
89.
41.
327
5.3
295.
62.
535
.429
5.6
333.
5E
0900
0027
Lond
onR
ichm
ond
upon
Tha
mes
0.0
0.0
0.0
0.0
0.0
0.0
38.5
38.5
0.1
14.7
0.0
11.6
0.0
192.
721
9.1
0.0
38.5
219.
125
7.6
E09
0000
29Lo
ndon
Sut
ton
0.0
0.0
0.0
0.0
0.0
0.0
18.3
18.3
1.4
16.3
0.0
9.9
4.0
217.
024
8.6
0.0
18.3
248.
626
6.9
E09
0000
31Lo
ndon
Wal
tham
For
est
0.0
0.0
0.0
0.0
0.0
0.5
29.3
29.8
3.8
8.7
2.5
11.2
0.0
209.
223
5.4
0.0
29.8
235.
426
5.2

Dep
artm
ent
for
Tra
nsp
ort
sta
tist
ics
Roa
d le
ngth
s st
atis
tics
Tab
le R
DL
0102
aT
ota
l ro
ad le
ng
th (
mile
s) b
y ro
ad t
ype
and
loca
l au
tho
rity
in G
reat
Bri
tain
, 201
1
Mile
sM
oto
rway
s'A
' ro
ads
Min
or
road
sA
ll ro
ads
ON
S A
rea
Co
de
Reg
ion
Lo
cal a
uth
ori
tyTr
unk
mot
orw
ays
Prin
cipa
lm
otor
way
sA
llm
oto
rway
sTr
unk
rura
l 'A
'Tr
unk
urba
n 'A
'P
rinci
pal
rura
l 'A
'P
rinci
pal
urba
n 'A
'A
ll 'A
'ro
ads
Rur
al 'B
' U
rban
'B'
Rur
al 'C
' U
rban
'C'
Rur
al 'U
' U
rban
'U'
All
min
or
road
s
Maj
or:
Tru
nk
road
s
Maj
or:
P
rin
icip
al
road
sM
ino
rro
ads
To
tal r
oad
le
ng
th
E06
0000
36S
outh
Eas
tB
rack
nell
Fore
st U
A0.
60.
00.
60.
00.
016
.413
.930
.318
.48.
111
.416
.231
.516
8.0
253.
70.
630
.325
3.7
284.
5E
0600
0043
Sou
th E
ast
Brig
hton
and
Hov
e U
A0.
00.
00.
08.
80.
03.
924
.437
.11.
712
.610
.118
.56.
630
0.6
350.
08.
828
.335
0.0
387.
1E
0600
0046
Sou
th E
ast
Isle
of W
ight
UA
0.0
0.0
0.0
0.0
0.0
61.8
13.7
75.4
45.5
12.1
95.9
18.9
169.
612
9.5
471.
50.
075
.447
1.5
546.
9E
0600
0035
Sou
th E
ast
Med
way
UA
4.9
0.0
4.9
0.0
0.0
15.8
27.2
43.0
11.1
8.8
31.4
21.3
83.1
322.
347
8.1
4.9
43.0
478.
152
6.0
E06
0000
42S
outh
Eas
tM
ilton
Key
nes
UA
10.4
0.0
10.4
6.4
5.2
28.4
16.7
56.7
11.7
8.3
48.2
86.8
101.
743
4.3
690.
922
.145
.169
0.9
758.
1E
0600
0044
Sou
th E
ast
Por
tsm
outh
UA
4.4
1.5
5.9
2.5
0.0
0.0
27.5
30.0
2.7
5.8
0.0
13.0
8.0
215.
924
5.4
6.9
29.0
245.
428
1.4
E06
0000
38S
outh
Eas
tR
eadi
ng U
A0.
70.
00.
70.
00.
00.
221
.922
.10.
85.
60.
036
.78.
517
0.7
222.
30.
722
.122
2.3
245.
1E
0600
0039
Sou
th E
ast
Slo
ugh
UA
5.8
0.0
5.8
0.0
0.0
2.9
10.6
13.5
0.6
2.9
0.0
1.6
9.1
161.
917
6.0
5.8
13.5
176.
019
5.3
E06
0000
45S
outh
Eas
tS
outh
ampt
on U
A1.
60.
01.
60.
10.
00.
333
.734
.10.
12.
00.
034
.12.
428
4.8
323.
31.
634
.132
3.3
359.
0E
0600
0037
Sou
th E
ast
Wes
t Ber
kshi
re U
A27
.70.
027
.714
.20.
051
.213
.278
.541
.55.
023
9.4
23.1
312.
415
2.6
774.
041
.864
.477
4.0
880.
2E
0600
0040
Sou
th E
ast
Win
dsor
and
Mai
denh
ead
UA
12.6
0.0
12.6
4.2
0.0
25.1
20.0
49.3
23.9
18.8
48.0
16.0
54.6
207.
036
8.4
16.8
45.1
368.
443
0.3
E06
0000
41S
outh
Eas
tW
okin
gham
UA
7.9
5.1
13.0
0.0
0.0
31.3
14.9
46.2
22.5
13.9
37.8
15.3
90.3
222.
440
2.3
7.9
51.3
402.
346
1.4
E10
0000
02S
outh
Eas
tB
ucki
ngha
msh
ire 3
7.8
0.0
37.8
4.1
0.0
170.
051
.622
5.7
73.1
16.0
499.
573
.660
2.0
491.
61,
755.
741
.922
1.6
1,75
5.7
2,01
9.2
E10
0000
11S
outh
Eas
tE
ast S
usse
x 0.
00.
00.
056
.14.
516
0.6
52.4
273.
714
4.0
29.6
421.
671
.858
1.8
596.
81,
845.
660
.621
3.0
1,84
5.6
2,11
9.2
E10
0000
14S
outh
Eas
tH
amps
hire
79.
10.
079
.184
.42.
131
6.8
98.5
501.
827
0.5
86.0
966.
129
6.6
1,63
5.0
1,68
2.4
4,93
6.7
165.
541
5.3
4,93
6.7
5,51
7.5
E10
0000
16S
outh
Eas
tK
ent 1
00.5
0.0
100.
510
0.5
4.0
351.
614
8.6
604.
720
1.1
78.2
978.
118
7.2
2,07
4.2
1,42
2.2
4,94
0.9
205.
050
0.2
4,94
0.9
5,64
6.1
E10
0000
25S
outh
Eas
tO
xfor
dshi
re35
.20.
035
.229
.00.
931
8.6
49.5
398.
025
7.4
32.5
659.
050
.489
5.5
572.
72,
467.
565
.136
8.1
2,46
7.5
2,90
0.6
E10
0000
30S
outh
Eas
tS
urre
y63
.30.
063
.332
.44.
718
2.8
163.
738
3.6
131.
310
5.6
254.
113
3.8
796.
31,
569.
32,
990.
410
0.4
346.
52,
990.
43,
437.
3E
1000
0032
Sou
th E
ast
Wes
t Sus
sex
7.9
0.0
7.9
46.7
6.4
220.
274
.834
8.1
158.
145
.447
8.3
146.
858
7.2
820.
52,
236.
361
.029
5.0
2,23
6.3
2,59
2.3
E06
0000
22S
outh
Wes
tB
ath
and
Nor
th E
ast S
omer
set U
A0.
00.
00.
09.
11.
151
.021
.882
.923
.17.
016
6.2
28.8
155.
519
4.6
575.
210
.172
.857
5.2
658.
1E
0600
0028
Sou
th W
est
Bou
rnem
outh
UA
0.0
0.0
0.0
0.0
0.0
1.4
22.7
24.0
0.3
7.2
0.1
19.8
5.1
259.
429
1.9
0.0
24.0
291.
931
5.9
E06
0000
23S
outh
Wes
tB
risto
l, C
ity o
f UA
8.6
0.0
8.6
0.0
0.3
0.9
55.6
56.8
2.2
32.4
3.2
42.6
14.5
550.
164
4.9
8.9
56.5
644.
971
0.3
E06
0000
52S
outh
Wes
tC
ornw
all U
A
0.0
0.0
0.0
94.4
1.6
309.
227
.843
3.0
350.
410
.91,
554.
589
.01,
898.
423
6.2
4,13
9.3
96.0
337.
04,
139.
34,
572.
3E
0600
0053
Sou
th W
est
Isle
s of
Sci
lly U
A0.
00.
00.
00.
00.
04.
80.
04.
80.
00.
00.
00.
018
.00.
018
.00.
04.
818
.022
.8E
0600
0024
Sou
th W
est
Nor
th S
omer
set U
A18
.10.
018
.10.
00.
048
.89.
157
.935
.915
.312
1.7
32.6
179.
625
3.4
638.
518
.157
.963
8.5
714.
5E
0600
0026
Sou
th W
est
Ply
mou
th U
A0.
00.
00.
02.
15.
80.
617
.726
.13.
219
.17.
644
.812
.738
9.0
476.
57.
818
.347
6.5
502.
6E
0600
0029
Sou
th W
est
Poo
le U
A0.
00.
00.
02.
10.
02.
322
.326
.71.
917
.518
.618
.10.
024
4.5
300.
72.
124
.630
0.7
327.
3E
0600
0025
Sou
th W
est
Sou
th G
louc
este
rshi
re U
A46
.10.
046
.15.
00.
040
.331
.076
.357
.116
.913
8.4
35.9
207.
236
6.0
821.
551
.171
.382
1.5
943.
9E
0600
0030
Sou
th W
est
Sw
indo
n U
A9.
50.
09.
59.
30.
018
.112
.940
.325
.223
.024
.125
.711
2.7
293.
150
3.7
18.8
31.0
503.
755
3.5
E06
0000
27S
outh
Wes
tTo
rbay
UA
0.0
0.0
0.0
0.0
0.0
9.9
18.2
28.1
0.9
4.4
4.5
26.4
32.3
227.
529
6.0
0.0
28.1
296.
032
4.0
E06
0000
54S
outh
Wes
tW
iltsh
ire U
A
21.7
0.0
21.7
72.9
4.6
302.
038
.841
8.2
182.
116
.096
6.4
73.9
927.
233
9.6
2,50
5.2
99.2
340.
82,
505.
22,
945.
2E
1000
0008
Sou
th W
est
Dev
on 2
3.9
0.0
23.9
111.
80.
056
2.0
31.1
704.
938
4.8
23.9
2,70
9.1
94.1
3,66
8.6
480.
37,
360.
813
5.8
593.
17,
360.
88,
089.
6E
1000
0009
Sou
th W
est
Dor
set 0
.00.
00.
055
.01.
820
2.1
19.9
278.
820
8.4
36.5
668.
530
.598
7.5
478.
82,
410.
356
.822
2.0
2,41
0.3
2,68
9.1
E10
0000
13S
outh
Wes
tG
louc
este
rshi
re 4
2.4
0.0
42.4
35.9
1.9
276.
659
.437
3.7
215.
033
.086
7.3
108.
71,
110.
469
3.6
3,02
8.1
80.1
336.
03,
028.
13,
444.
1E
1000
0027
Sou
th W
est
Som
erse
t32
.60.
032
.643
.20.
036
2.1
36.5
441.
926
7.3
16.7
1,30
7.3
64.9
1,69
2.4
369.
23,
717.
775
.939
8.6
3,71
7.7
4,19
2.2
W06
0000
01W
ales
Isle
of A
ngle
sey
0.0
0.0
0.0
20.6
0.1
83.9
3.5
108.
276
.01.
622
1.0
3.3
310.
734
.264
6.7
20.8
87.4
646.
775
4.9
W06
0000
02W
ales
Gw
yned
d0.
00.
00.
012
9.0
0.3
182.
64.
831
6.7
124.
70.
152
8.0
6.1
558.
126
.61,
243.
612
9.3
187.
41,
243.
61,
560.
3W
0600
0003
Wal
esC
onw
y0.
00.
00.
075
.50.
054
.514
.714
4.7
100.
46.
528
3.6
24.4
336.
813
0.0
881.
675
.569
.288
1.6
1,02
6.3
W06
0000
04W
ales
Den
bigh
shire
0.0
0.0
0.0
45.6
0.0
72.5
10.4
128.
583
.14.
531
0.0
14.1
275.
283
.277
0.1
45.6
82.9
770.
189
8.6
W06
0000
05W
ales
Flin
tshi
re0.
00.
00.
027
.33.
766
.523
.712
1.2
29.3
17.8
145.
018
.325
3.5
210.
767
4.6
31.0
90.2
674.
679
5.7
W06
0000
06W
ales
Wre
xham
0.0
0.0
0.0
17.1
1.6
47.3
13.7
79.7
74.2
17.6
197.
035
.420
5.7
141.
567
1.5
18.7
61.0
671.
575
1.2
W06
0000
23W
ales
Pow
ys0.
00.
00.
025
8.2
1.7
150.
20.
441
0.4
370.
52.
21,
296.
46.
31,
249.
317
.72,
942.
425
9.9
150.
62,
942.
43,
352.
9W
0600
0008
Wal
esC
ered
igio
n0.
00.
00.
066
.94.
498
.50.
817
0.6
201.
41.
151
7.1
5.2
503.
620
.61,
249.
071
.399
.31,
249.
01,
419.
6W
0600
0009
Wal
esP
embr
okes
hire
0.0
0.0
0.0
70.1
4.0
92.8
1.2
168.
214
2.4
4.4
595.
513
.065
7.8
48.3
1,46
1.5
74.1
94.1
1,46
1.5
1,62
9.7
W06
0000
10W
ales
Car
mar
then
shire
3.2
0.0
3.2
88.0
3.5
140.
012
.124
3.6
182.
119
.674
6.7
35.6
839.
014
5.6
1,96
8.7
94.7
152.
11,
968.
72,
215.
5W
0600
0011
Wal
esS
wan
sea
9.6
0.0
9.6
0.0
0.0
31.6
29.4
61.0
28.8
30.0
68.7
10.7
138.
838
6.1
663.
19.
661
.066
3.1
733.
7W
0600
0012
Wal
esN
eath
Por
t Tal
bot
14.4
0.0
14.4
14.6
1.1
52.8
16.5
85.0
25.8
16.0
24.7
7.4
151.
121
5.6
440.
630
.169
.344
0.6
540.
0W
0600
0013
Wal
esB
ridge
nd11
.00.
011
.00.
00.
041
.819
.060
.810
.77.
542
.824
.415
3.8
176.
841
5.9
11.0
60.8
415.
948
7.8
W06
0000
14W
ales
The
Val
e of
Gla
mor
gan
2.3
0.0
2.3
0.0
0.0
32.7
11.4
44.1
30.3
7.5
170.
123
.412
2.8
171.
152
5.2
2.3
44.1
525.
257
1.6
W06
0000
15W
ales
Car
diff
10.6
0.0
10.6
1.5
0.0
17.0
39.1
57.5
4.6
12.6
33.6
36.0
30.2
483.
660
0.5
12.1
56.0
600.
566
8.6
W06
0000
16W
ales
Rho
ndda
Cyn
on T
af6.
10.
06.
114
.83.
053
.239
.111
0.1
15.8
29.1
55.2
21.9
150.
935
8.8
631.
623
.992
.363
1.6
747.
8W
0600
0024
Wal
esM
erth
yr T
ydfil
0.0
0.0
0.0
22.2
0.0
6.9
7.3
36.4
4.5
3.0
8.7
12.9
48.2
101.
017
8.3
22.2
14.2
178.
321
4.6
W06
0000
18W
ales
Cae
rphi
lly0.
00.
00.
02.
40.
044
.612
.659
.517
.223
.267
.727
.217
5.5
265.
057
5.8
2.4
57.2
575.
863
5.3
W06
0000
19W
ales
Bla
enau
Gw
ent
0.0
0.0
0.0
5.0
2.0
16.5
9.3
32.9
3.6
8.9
20.9
8.9
22.6
157.
822
2.8
7.0
25.8
222.
825
5.6
W06
0000
20W
ales
Torfa
en0.
00.
00.
07.
11.
16.
86.
821
.78.
23.
420
.931
.750
.015
8.7
272.
88.
213
.527
2.8
294.
5W
0600
0021
Wal
esM
onm
outh
shire
14.1
0.0
14.1
54.9
3.4
34.5
0.9
93.6
86.7
5.4
274.
210
.745
1.2
75.3
903.
572
.335
.490
3.5
1,01
1.2
W06
0000
22W
ales
New
port
16.6
0.0
16.6
10.4
0.0
6.6
14.2
31.1
13.1
14.9
72.2
16.3
67.3
223.
940
7.7
27.0
20.8
407.
745
5.4

Dep
artm
ent
for
Tra
nsp
ort
sta
tist
ics
Roa
d le
ngth
s st
atis
tics
Tab
le R
DL
0102
aT
ota
l ro
ad le
ng
th (
mile
s) b
y ro
ad t
ype
and
loca
l au
tho
rity
in G
reat
Bri
tain
, 201
1
Mile
sM
oto
rway
s'A
' ro
ads
Min
or
road
sA
ll ro
ads
ON
S A
rea
Co
de
Reg
ion
Lo
cal a
uth
ori
tyTr
unk
mot
orw
ays
Prin
cipa
lm
otor
way
sA
llm
oto
rway
sTr
unk
rura
l 'A
'Tr
unk
urba
n 'A
'P
rinci
pal
rura
l 'A
'P
rinci
pal
urba
n 'A
'A
ll 'A
'ro
ads
Rur
al 'B
' U
rban
'B'
Rur
al 'C
' U
rban
'C'
Rur
al 'U
' U
rban
'U'
All
min
or
road
s
Maj
or:
Tru
nk
road
s
Maj
or:
P
rin
icip
al
road
sM
ino
rro
ads
To
tal r
oad
le
ng
th
S12
0000
33S
cotla
ndA
berd
een
City
0.0
0.0
0.0
8.8
9.3
8.8
27.7
54.6
9.6
12.4
39.9
17.6
81.9
395.
555
6.8
18.1
36.5
556.
861
1.4
S12
0000
34S
cotla
ndA
berd
eens
hire
0.0
0.0
0.0
110.
11.
143
1.9
6.3
549.
548
6.8
4.8
949.
54.
91,
795.
092
.33,
333.
311
1.2
438.
33,
333.
33,
882.
8S
1200
0041
Sco
tland
Ang
us0.
40.
00.
429
.10.
010
5.1
16.2
150.
414
1.6
5.4
293.
210
.346
3.6
140.
31,
054.
429
.512
1.3
1,05
4.4
1,20
5.2
S12
0000
35S
cotla
ndA
rgyl
l & B
ute
0.0
0.0
0.0
155.
50.
033
4.7
5.0
495.
237
9.7
0.0
265.
84.
154
8.9
41.8
1,24
0.1
155.
533
9.7
1,24
0.1
1,73
5.3
S12
0000
05S
cotla
ndC
lack
man
nans
hire
0.0
0.0
0.0
0.0
0.0
27.8
4.8
32.6
16.1
4.8
15.4
2.1
66.2
56.0
160.
60.
032
.616
0.6
193.
1S
1200
0006
Sco
tland
Dum
fries
and
Gal
low
ay37
.50.
037
.517
4.1
2.2
300.
311
.048
7.7
450.
63.
372
0.9
9.6
1,17
1.8
87.3
2,44
3.5
213.
931
1.3
2,44
3.5
2,96
8.7
S12
0000
42S
cotla
ndD
unde
e C
ity0.
00.
00.
00.
39.
41.
417
.728
.81.
37.
30.
059
.621
.924
8.7
338.
89.
819
.133
8.8
367.
6S
1200
0008
Sco
tland
Eas
t Ayr
shire
6.1
0.0
6.1
29.2
0.0
82.1
4.7
116.
111
0.7
9.3
127.
83.
236
1.3
91.0
703.
335
.386
.970
3.3
825.
5S
1200
0009
Sco
tland
Eas
t Dun
barto
nshi
re0.
00.
00.
00.
00.
019
.313
.032
.419
.08.
612
.48.
659
.318
8.0
295.
80.
032
.429
5.8
328.
2S
1200
0010
Sco
tland
Eas
t Lot
hian
0.0
0.0
0.0
39.6
0.0
58.5
4.7
102.
810
1.2
1.9
137.
21.
330
3.6
33.2
578.
439
.663
.357
8.4
681.
3S
1200
0011
Sco
tland
Eas
t Ren
frew
shire
7.4
0.0
7.4
0.0
0.0
14.2
9.9
24.1
17.0
4.7
30.1
21.4
66.9
145.
228
5.3
7.4
24.1
285.
331
6.8
S12
0000
36S
cotla
ndE
dinb
urgh
, City
of
10.2
0.0
10.2
10.2
0.0
20.3
59.2
89.6
11.9
20.6
36.7
37.5
71.3
661.
083
8.9
20.4
79.4
838.
993
8.7
S12
0000
13S
cotla
ndE
ilean
Sia
r0.
00.
00.
00.
00.
020
7.1
0.0
207.
199
.90.
010
7.9
0.0
392.
10.
059
9.9
0.0
207.
159
9.9
807.
0S
1200
0014
Sco
tland
Falk
irk22
.60.
022
.61.
70.
032
.434
.168
.241
.317
.563
.18.
510
7.5
260.
249
8.0
24.2
66.5
498.
058
8.7
S12
0000
15S
cotla
ndFi
fe10
.70.
010
.752
.33.
916
7.1
30.3
253.
616
2.0
33.2
205.
513
.958
4.6
476.
01,
475.
367
.019
7.3
1,47
5.3
1,73
9.6
S12
0000
43S
cotla
ndG
lasg
ow C
ity28
.00.
028
.00.
00.
04.
275
.279
.56.
032
.20.
212
9.9
32.6
835.
71,
036.
728
.079
.51,
036.
71,
144.
2S
1200
0017
Sco
tland
Hig
hlan
d0.
00.
00.
059
1.9
5.2
859.
10.
71,
457.
059
0.4
14.5
885.
48.
31,
941.
814
1.5
3,58
2.0
597.
185
9.9
3,58
2.0
5,03
8.9
S12
0000
18S
cotla
ndIn
verc
lyde
0.0
0.0
0.0
6.2
1.5
10.7
10.3
28.8
11.0
3.0
21.9
11.7
51.3
128.
422
7.2
7.7
21.1
227.
225
5.9
S12
0000
19S
cotla
ndM
idlo
thia
n0.
00.
00.
021
.11.
341
.47.
671
.444
.27.
456
.56.
312
9.2
95.4
339.
222
.449
.033
9.2
410.
6S
1200
0020
Sco
tland
Mor
ay0.
00.
00.
058
.12.
596
.72.
115
9.4
179.
21.
122
2.3
3.4
495.
555
.495
7.0
60.6
98.8
957.
01,
116.
4S
1200
0021
Sco
tland
Nor
th A
yrsh
ire0.
00.
00.
036
.62.
044
.813
.596
.982
.612
.612
1.9
6.5
207.
819
2.9
624.
138
.658
.362
4.1
721.
0S
1200
0044
Sco
tland
Nor
th L
anar
kshi
re15
.20.
015
.210
.68.
240
.338
.597
.650
.434
.410
7.2
34.3
213.
149
9.7
939.
134
.178
.893
9.1
1,05
2.0
S12
0000
23S
cotla
ndO
rkne
y Is
land
s0.
00.
00.
00.
00.
010
1.8
0.0
101.
812
9.8
0.0
99.3
0.0
333.
20.
056
2.3
0.0
101.
856
2.3
664.
1S
1200
0024
Sco
tland
Per
th a
nd K
inro
ss24
.30.
024
.389
.30.
028
6.9
10.3
386.
521
6.1
0.0
395.
01.
572
8.6
101.
71,
442.
911
3.6
297.
21,
442.
91,
853.
7S
1200
0038
Sco
tland
Ren
frew
shire
12.7
0.0
12.7
13.6
0.0
19.4
16.9
49.9
27.5
11.2
65.9
20.8
104.
028
9.1
518.
726
.336
.351
8.7
581.
2S
1200
0026
Sco
tland
Sco
ttish
Bor
ders
0.0
0.0
0.0
97.1
2.9
281.
74.
338
6.0
371.
63.
547
3.6
3.7
744.
065
.71,
662.
110
0.0
286.
01,
662.
12,
048.
1S
1200
0027
Sco
tland
She
tland
Isla
nds
0.0
0.0
0.0
0.0
0.0
139.
80.
013
9.8
96.1
0.0
123.
30.
029
6.2
0.0
515.
60.
013
9.8
515.
665
5.4
S12
0000
28S
cotla
ndS
outh
Ayr
shire
0.0
0.0
0.0
57.8
0.0
52.6
14.7
125.
111
8.2
7.7
134.
59.
826
9.1
170.
170
9.3
57.8
67.3
709.
383
4.4
S12
0000
29S
cotla
ndS
outh
Lan
arks
hire
41.9
0.0
41.9
21.9
4.0
143.
124
.519
3.5
111.
525
.124
8.6
24.6
432.
148
2.6
1,32
4.5
67.8
167.
61,
324.
51,
559.
9S
1200
0030
Sco
tland
Stir
ling
14.2
0.0
14.2
62.8
0.0
121.
211
.719
5.7
93.1
5.3
101.
04.
923
0.2
100.
053
4.5
76.9
132.
953
4.5
744.
3S
1200
0039
Sco
tland
Wes
t Dun
barto
nshi
re0.
00.
00.
011
.20.
810
.517
.239
.80.
05.
511
.75.
021
.517
3.6
217.
312
.127
.721
7.3
257.
1S
1200
0040
Sco
tland
Wes
t Lot
hian
23.3
0.0
23.3
0.0
0.0
72.5
17.1
89.6
55.9
15.3
68.7
3.6
195.
826
0.5
599.
823
.389
.659
9.8
712.
7
Tel
epho
ne: 0
20 7
944
3180
Sou
rce:
Dep
artm
ent f
or T
rans
port
Em
ail:
road
.leng
th@
dft.g
si.g
ov.u
kN
otes
and
def
initi
ons
Last
upd
ated
: 28
June
201
2M
etho
dolo
gy n
ote
Nex
t upd
ate:
Jun
e 20
13
The
figur
es in
this
tabl
e ar
e N
atio
nal S
tatis
tics

Department for Transport statisticsFree flow speeds statistics (https://www.gov.uk/government/organisations/department-for-transport/series/speeds-statistics)
Table SPE0101 (TSGB0714)Free-flow vehicle speeds on non-built-up roads by road type and vehicle type in Great Britain, 2011
Per cent / miles per hour / number of vehicles
Motorcycles 7 Cars Cars towing Light Goods 4Buses /
Coaches 2 6 34 or
more 3 & 45 or
more
(a) Motorways 1
Under 50 mph 3 3 12 3 5 6 10 12 10 9
50-59 mph 26 13 57 15 41 51 81 86 86 90
60-64 mph 9 14 20 13 25 11 8 0 2 0
65-69 mph 13 20 8 19 11 12 0 0 1 0
70-74 mph 16 21 3 20 10 10 0 0 0 0
75-79 mph 14 15 1 15 5 6 0 0 0 0
80-89 mph 15 12 0 13 3 4 0 0 0 0
90 mph and over 5 2 0 2 0 1 0 0 0 0
Speed limit (mph) 70 70 60 70 70 n/a 60 60 60 60
20 13 4 15 3 n/a 0 1 1 0
Average speed (mph) 69 69 57 70 62 61 54 54 54 54
Number observed (thousands) 3,201 472,755 3,256 82,884 6,369 30,959 2,863 1,716 7,260 42,829
(b) Dual carriageways 2
Under 30 mph 0 0 1 0 0 1 0 0 0 0
30-39 mph 1 0 1 0 0 1 1 1 1 0
40-49 mph 5 3 15 3 9 8 18 18 20 15
50-59 mph 17 17 53 18 41 50 70 80 75 83
60-64 mph 10 17 18 16 25 13 10 0 2 1
65-69 mph 15 22 8 21 12 12 0 0 1 0
70-79 mph 31 32 4 32 11 12 0 1 1 0
80 mph and over 21 9 0 11 2 3 0 0 0 0
Speed limit (mph) 70 70 60 70 60 n/a 50 50 50 50
21 9 4 11 13 n/a 10 1 5 1
Average speed (mph) 70 68 56 68 60 59 53 53 53 53
Number observed (thousands) 370 46,092 360 7,127 385 2,548 257 210 453 2,763
(c) Single carriageways 3
Under 20 mph 1 0 2 0 0 1 1 1 1 0
20-29 mph 3 3 7 3 3 3 6 6 8 3
30-39 mph 11 16 21 15 21 19 27 27 25 26
40-49 mph 33 44 51 42 50 46 50 48 48 53
50-59 mph 28 29 18 30 22 25 15 17 17 19
60-64 mph 9 5 1 6 2 4 0 0 1 0
65-69 mph 5 2 0 2 1 1 0 0 0 0
70 mph and over 9 1 0 2 1 1 0 0 0 0
Speed limit (mph) 60 60 50 60 50 n/a 40 40 40 40
9 1 1 2 4 n/a 16 18 18 19
Average speed (mph) 52 48 42 48 45 46 42 43 43 44
Number observed (thousands) 464 40,840 403 5,816 410 1,957 223 168 275 1,164
1 Average vehicle speeds from 26 motorway sites. Source: DfT Automatic Traffic Counters2 Average vehicle speeds from 7 dual carriageway sites. Last updated: July 20123 Average vehicle speeds from 24 single carriageway sites. Next update: July 20134 Goods vehicles 3.5 tonnes gross weight and under.5 Goods vehicles over 3.5 tonnes gross weight.6 Speed limit depends on loading which cannot be determined.7 Motorcycles include mopeds and other types of two wheeled motor vehicles.
Telephone: 020 7944 3095Email: [email protected] and definitions (https://www.gov.uk/government/organisations/department-for-transport/series/speeds-statistics)
The figures in this table are National Statistics.
Percentage more than 10 mph over limit
Percentage more than 10 mph over limit
Heavy goods vehicles 5
Rigid by number of axlesArticulated by
number of axles
Percentage more than 10 mph over limit
https://www.gov.uk/government/statistical-data-sets/tsgb07 216

Department for Transport statisticsFree flow speeds statistics (https://www.gov.uk/government/organisations/department-for-transport/series/speeds-statistics)
Table SPE0102 (TSGB0715)Free flow vehicle speeds on built-up roads by speed limit and vehicle type in Great Britain, 2011
Per cent / miles per hour / number of vehicles
Motorcycles 3 Cars Cars towing Light Goods 4Buses /
Coaches 2 34 or
more 3 & 45 or
more
(a) 30 mph speed limit roads 1
Under 20 mph 8 4 5 5 11 7 7 4 6 2
20-29 mph 42 49 53 45 64 47 54 47 50 53
30-34 mph 27 31 32 31 19 29 30 36 31 34
35-39 mph 14 12 8 14 5 12 7 9 10 9
40-44 mph 6 3 1 4 1 3 1 2 3 2
45-49 mph 2 1 0 1 0 1 0 0 1 0
50 mph and over 2 0 0 0 1 1 0 0 0 0
23 16 10 19 7 17 9 12 14 11
Average speed (mph) 30 30 29 30 27 30 29 30 30 30
Number observed (thousands) 610 54,395 120 6,401 601 1,791 103 93 72 164
(b) 40 mph speed limit roads 2
Under 20 mph 4 3 4 4 4 5 4 3 5 2
20-29 mph 18 20 25 19 25 21 22 18 19 16
30-34 mph 19 25 26 24 28 25 24 24 24 23
35-39 mph 24 29 29 28 30 28 33 34 33 41
40-44 mph 18 15 12 16 10 13 14 16 14 14
45-49 mph 10 6 3 7 2 5 3 4 3 3
50-59 mph 6 2 1 3 1 2 0 1 1 1
60 mph and over 2 0 0 1 1 1 0 0 0 0
17 8 4 10 4 8 3 5 4 3
Average speed (mph) 37 35 34 35 34 35 34 35 34 35
Number observed (thousands) 739 46,592 170 6,136 552 1,825 179 125 154 419
1 Average vehicle speeds from 25 sites. Source: DfT Automatic Traffic Counters2 Average vehicle speeds from 10 sites. Last updated: June 20123 Motorcycles includes mopeds and other types of two wheeled motor vehicles. Next update: June 20134 Goods vehicles 3.5 tonnes gross weight and under.5 Goods vehicles over 3.5 tonnes gross weight.
Telephone: 020 7944 3095Email: [email protected] and definitions (https://www.gov.uk/government/organisations/department-for-transport/series/speeds-statistics)
The figures in this table are National Statistics.
Percentage over 45 mph
Heavy goods vehicles 5
Rigid by number of axlesArticulated by
number of axles
Percentage over 35 mph
https://www.gov.uk/government/statistical-data-sets/tsgb07 217

Department for Transport statistics
Table CGN0201a (TSGB0716)
miles per hour
Country / region / local authority ONS area code 2006/7 2007/8 2008/9 2009/10 2010/11 2011/12
ENGLAND E92000001 (921) 24.6 24.7 25.1 25.0 25.1 25.3 0.8
NORTH EAST E12000001 (A) 28.7 28.6 28.6 28.4 28.3 29.2 3.1County Durham UA E06000047 (00EJ) 34.0 34.0 33.9 33.4 33.0 33.7 2.1Darlington UA E06000005 (00EH) 27.4 26.8 27.5 27.3 27.2 27.1 -0.2Hartlepool UA E06000001 (00EB) 35.4 30.7 34.7 34.6 34.0 34.5 1.4Middlesbrough UA E06000002 (00EC) 27.1 27.2 24.9 26.4 27.6 28.6 3.6Northumberland UA E06000048 (00EM) 37.1 36.6 36.2 35.8 35.7 35.7 0.1Redcar and Cleveland UA E06000003 (00EE) 37.1 36.9 37.2 37.1 35.7 36.0 0.8Stockton-on-Tees UA E06000004 (00EF) 25.8 26.2 26.4 25.8 25.7 26.2 2.0Tyne and Wear (Met County) E11000004 (2D) 23.3 23.5 23.6 23.4 23.3 24.7 5.9
Gateshead E08000020 (00CH) 20.6 21.1 21.1 20.7 20.7 22.5 8.6Newcastle upon Tyne E08000021 (00CJ) 18.4 18.5 18.7 19.0 19.1 19.6 2.7North Tyneside E08000022 (00CK) 26.3 25.2 25.1 25.8 25.9 27.9 7.8South Tyneside E08000023 (00CL) 22.5 22.9 23.0 22.3 21.8 24.3 11.5Sunderland E08000024 (00CM) 29.3 30.0 30.4 29.3 29.0 29.7 2.4
NORTH WEST E12000002 (B) 22.5 22.5 22.8 22.6 22.7 22.9 0.9Blackburn with Darwen UA E06000008 (00EX) 19.0 19.0 19.2 19.2 19.7 19.7 -0.1Blackpool UA E06000009 (00EY) 18.7 18.4 18.9 18.7 17.8 18.9 5.7Cheshire East UA E06000049 (00EQ) 27.9 27.8 28.4 28.6 28.0 28.7 2.3Cheshire West and Chester UA E06000050 (00EW) 29.6 29.2 29.6 29.9 29.9 29.5 -1.4Halton UA E06000006 (00ET) 35.3 34.9 37.4 34.5 37.0 37.0 0.0Warrington UA E06000007 (00EU) 21.6 21.3 22.4 21.8 21.9 21.9 -0.2Cumbria E10000006 (16) 31.4 31.4 31.2 31.0 31.3 32.0 2.3Lancashire E10000017 (30) 25.2 25.3 25.3 25.4 25.7 26.0 1.3Greater Manchester (Met County) E11000001 (2A) 18.0 18.1 18.5 18.3 18.3 18.3 0.0
Bolton E08000001 (00BL) 21.1 21.1 20.9 20.6 20.9 21.2 1.4Bury E08000002 (00BM) 17.8 18.2 18.2 18.2 18.9 18.7 -1.0Manchester E08000003 (00BN) 15.8 16.0 16.1 15.6 15.8 15.7 -0.4Oldham E08000004 (00BP) 19.9 19.4 19.5 19.3 19.2 19.1 -1.0Rochdale E08000005 (00BQ) 19.6 19.7 20.2 19.5 19.2 19.9 3.4Salford E08000006 (00BR) 16.9 17.0 17.2 17.5 17.8 17.3 -2.3Stockport E08000007 (00BS) 16.9 17.6 18.5 18.3 17.9 18.0 0.8Tameside E08000008 (00BT) 16.7 16.3 16.9 16.4 16.1 15.7 -2.5Trafford E08000009 (00BU) 18.3 18.4 19.2 18.9 18.7 18.7 -0.2Wigan E08000010 (00BW) 19.4 19.3 20.4 20.3 20.1 20.5 1.7
Merseyside (Met County) E11000002 (2B) 21.8 21.6 21.8 21.7 21.8 22.1 1.4Knowsley E08000011 (00BX) 30.7 30.1 30.7 29.8 30.8 31.6 2.5Liverpool E08000012 (00BY) 17.1 16.9 17.2 17.1 17.3 17.6 1.7Sefton E08000014 (00CA) 22.6 22.4 22.7 22.3 22.5 22.6 0.6St. Helens E08000013 (00BZ) 26.4 26.5 26.4 26.6 26.7 26.6 -0.3Wirral E08000015 (00CB) 23.8 23.5 23.9 23.6 23.6 23.5 -0.4
YORKSHIRE AND THE HUMBER E12000003 (D) 24.6 24.7 25.0 25.1 25.4 25.6 1.0East Riding of Yorkshire UA E06000011 (00FB) 36.2 36.0 35.9 35.4 34.8 35.4 1.6Kingston upon Hull, City of UA E06000010 (00FA) 15.8 15.6 16.1 16.4 16.7 16.9 1.1North East Lincolnshire UA E06000012 (00FC) 25.1 25.5 25.3 25.0 25.1 25.5 1.6North Lincolnshire UA E06000013 (00FD) 36.9 37.6 37.3 37.5 36.8 37.2 1.0York UA E06000014 (00FF) 20.3 20.5 20.5 20.3 20.9 21.4 2.2North Yorkshire E10000023 (36) 34.6 34.2 33.5 34.0 34.3 34.5 0.8South Yorkshire (Met County) E11000003 (2C) 23.0 23.4 24.0 23.7 23.9 24.3 1.7
Barnsley E08000016 (00CC) 27.3 27.6 27.8 26.9 27.2 27.7 1.8Doncaster E08000017 (00CE) 25.7 25.4 26.4 25.6 25.9 26.9 3.8Rotherham E08000018 (00CF) 26.0 26.3 27.2 27.0 27.7 27.5 -0.7Sheffield E08000019 (00CG) 18.6 19.4 19.7 19.7 19.7 20.1 1.8
West Yorkshire (Met County) E11000006 (2F) 21.1 21.0 21.5 21.8 22.2 22.2 0.2Bradford E08000032 (00CX) 18.9 18.9 18.9 20.2 20.5 20.8 1.8Calderdale E08000033 (00CY) 21.5 21.3 21.7 21.0 21.5 21.5 -0.3Kirklees E08000034 (00CZ) 21.1 20.9 20.8 20.6 21.0 20.5 -2.4Leeds E08000035 (00DA) 21.2 21.2 22.4 22.9 23.2 23.1 -0.1Wakefield E08000036 (00DB) 23.8 23.7 23.9 23.8 24.6 25.1 2.0
EAST MIDLANDS E12000004 (E) 28.8 28.9 29.0 28.9 28.9 29.3 1.5Derby UA E06000015 (00FK) 19.0 19.7 20.3 20.1 20.8 20.6 -0.7Leicester UA E06000016 (00FN) 16.9 16.5 17.0 16.7 16.6 17.0 2.4Nottingham UA E06000018 (00FY) 15.8 16.1 16.5 16.5 16.2 16.6 2.0Rutland UA E06000017 (00FP) 42.2 42.0 41.2 41.0 41.9 42.0 0.3Derbyshire E10000007 (17) 29.9 30.2 30.3 30.3 30.3 30.8 1.4Leicestershire E10000018 (31) 31.4 31.1 31.4 31.5 31.4 31.3 -0.2Lincolnshire E10000019 (32) 36.1 36.1 36.0 35.6 35.3 36.3 2.6Northamptonshire E10000021 (34) 30.4 30.7 30.5 30.7 30.4 30.8 1.3Nottinghamshire E10000024 (37) 28.6 29.1 29.0 29.0 29.1 29.6 1.8
WEST MIDLANDS E12000005 (F) 25.1 25.3 26.0 25.7 25.8 26.2 1.5
Congestion & Reliability Statistics
Percentage change
2010/11 to 2011/12
Average vehicle speeds (flow-weighted) during the weekday morning peak 1 on locally managed 'A' roads2: by local authority in
England, annually from 2006/73
Average speed
https://www.gov.uk/government/statistical-data-sets/tsgb07 218

Department for Transport statistics
Table CGN0201a (TSGB0716)
miles per hour
Country / region / local authority ONS area code 2006/7 2007/8 2008/9 2009/10 2010/11 2011/12
Congestion & Reliability Statistics
Percentage change
2010/11 to 2011/12
Average vehicle speeds (flow-weighted) during the weekday morning peak 1 on locally managed 'A' roads2: by local authority in
England, annually from 2006/73
Average speed
Herefordshire, County of UA E06000019 (00GA) 34.5 34.4 34.7 33.5 33.5 34.1 1.8Shropshire UA E06000051 (00GG) 36.8 36.8 36.5 36.0 36.2 36.5 0.8Stoke-on-Trent UA E06000021 (00GL) 19.5 19.8 19.6 19.5 19.2 19.6 2.1Telford and Wrekin UA E06000020 (00GF) 40.4 39.6 39.1 38.9 39.5 40.2 1.8Staffordshire E10000028 (41) 28.1 28.5 28.9 28.6 28.8 29.0 1.0Warwickshire E10000031 (44) 29.5 29.7 29.7 29.7 30.3 30.6 0.8Worcestershire E10000034 (47) 30.3 30.2 31.4 31.4 31.3 31.6 0.9West Midlands (Met County) E11000005 (2E) 19.4 19.5 20.1 19.9 20.0 20.3 1.7
Birmingham E08000025 (00CN) 18.1 17.8 18.5 18.6 18.5 18.7 0.9Coventry E08000026 (00CQ) 24.9 25.1 25.5 25.6 25.1 25.5 1.7Dudley E08000027 (00CR) 18.0 18.1 18.5 18.7 18.9 19.5 2.9Sandwell E08000028 (00CS) 17.6 18.3 19.2 18.6 18.8 19.7 4.8Solihull E08000029 (00CT) 30.5 31.4 31.2 29.8 31.2 30.9 -1.1Walsall E08000030 (00CU) 19.7 20.4 20.6 20.6 20.0 20.7 3.3Wolverhampton E08000031 (00CW) 17.1 16.9 17.3 17.1 17.3 17.5 1.3
EAST OF ENGLAND E12000006 (G) 29.6 29.7 30.2 30.1 29.8 30.3 1.6Bedford UA E06000055 (00KB) 24.6 24.9 24.8 24.6 27.2 28.1 3.5Central Bedfordshire UA E06000056 (00KC) 31.5 31.4 33.3 32.2 32.7 33.3 1.8Luton UA E06000032 (00KA) 19.5 19.2 19.4 21.9 21.2 21.3 0.6Peterborough UA E06000031 (00JA) 35.9 33.0 33.4 36.0 34.8 37.3 7.2Southend-on-Sea UA E06000033 (00KF) 19.5 19.9 18.9 18.9 18.6 19.0 2.2Thurrock UA E06000034 (00KG) 37.7 37.1 39.4 38.7 38.2 39.3 2.7Cambridgeshire E10000003 (12) 32.0 32.1 31.9 31.8 31.6 31.2 -1.1Essex E10000012 (22) 30.6 30.7 30.9 30.0 29.3 30.3 3.6Hertfordshire E10000015 (26) 26.2 27.0 28.6 29.0 28.2 28.4 0.7Norfolk E10000020 (33) 31.4 31.6 31.5 31.2 31.4 31.9 1.6Suffolk E10000029 (42) 30.7 30.9 30.7 30.8 30.9 30.9 -0.1
LONDON E12000007 (H) 15.9 15.8 16.3 16.5 16.4 16.2 -1.2Inner London E13000001 (1B) 12.6 12.4 12.7 13.0 12.7 12.6 -1.5
Camden E09000007 (00AG) 9.9 9.2 9.5 9.8 9.6 9.4 -1.6City of London E09000001 (00AA) 8.7 8.9 9.1 9.8 9.2 9.4 1.9Hackney E09000012 (00AM) 12.7 12.5 12.8 12.8 12.3 12.9 5.1Hammersmith and Fulham E09000013 (00AN) 13.3 13.0 14.5 14.1 14.1 13.1 -7.2Haringey E09000014 (00AP) 11.9 12.2 12.6 12.7 12.4 12.4 -0.7Islington E09000019 (00AU) 10.1 10.0 10.2 10.3 10.1 10.2 1.0Kensington and Chelsea E09000020 (00AW) 12.9 12.6 12.9 13.0 11.3 11.8 4.6Lambeth E09000022 (00AY) 11.3 11.4 11.1 11.3 11.3 11.4 1.0Lewisham E09000023 (00AZ) 11.1 10.5 11.2 11.5 11.5 11.0 -4.5Newham E09000025 (00BB) 24.5 23.5 23.1 23.8 23.6 22.7 -3.7Southwark E09000028 (00BE) 11.2 10.6 10.5 10.7 10.7 10.6 -0.6Tower Hamlets E09000030 (00BG) 13.9 14.7 14.8 16.2 15.8 15.3 -3.3Wandsworth E09000032 (00BJ) 11.3 11.6 12.1 11.8 12.3 12.3 -0.5Westminster E09000033 (00BK) 11.3 11.2 11.2 11.3 10.3 10.4 0.7
Outer London E13000002 (1C) 17.9 17.8 18.5 18.5 18.5 18.3 -1.1Barking and Dagenham E09000002 (00AB) 19.1 18.4 17.8 17.6 17.3 17.3 -0.3Barnet E09000003 (00AC) 16.9 17.2 17.1 16.9 16.8 16.8 -0.4Bexley E09000004 (00AD) 22.4 23.7 24.1 24.1 23.7 24.3 2.4Brent E09000005 (00AE) 15.9 16.0 15.6 16.2 17.4 16.2 -6.9Bromley E09000006 (00AF) 18.5 18.9 18.8 19.1 19.2 19.3 0.5Croydon E09000008 (00AH) 15.5 15.4 15.4 15.4 15.6 15.6 0.0Ealing E09000009 (00AJ) 16.1 16.0 17.1 18.2 19.3 17.8 -7.8Enfield E09000010 (00AK) 18.4 17.8 18.4 18.2 16.2 18.1 11.7Greenwich E09000011 (00AL) 15.5 14.5 16.6 16.4 16.3 16.0 -1.8Harrow E09000015 (00AQ) 15.6 16.2 16.3 16.1 16.6 16.4 -1.4Havering E09000016 (00AR) 24.0 23.3 23.7 24.3 24.2 23.9 -1.4Hillingdon E09000017 (00AS) 22.7 23.4 24.7 24.3 23.4 22.2 -5.1Hounslow E09000018 (00AT) 14.9 15.1 16.4 16.5 16.5 15.5 -5.7Kingston upon Thames E09000021 (00AX) 21.2 20.9 23.3 22.6 24.4 22.6 -7.2Merton E09000024 (00BA) 13.4 13.7 14.1 13.7 13.9 14.1 0.8Redbridge E09000026 (00BC) 21.4 21.4 20.9 21.4 20.4 21.3 4.4Richmond upon Thames E09000027 (00BD) 13.4 13.6 14.6 14.1 14.2 13.3 -6.7Sutton E09000029 (00BF) 15.1 15.1 16.0 15.2 15.9 16.4 3.1Waltham Forest E09000031 (00BH) 22.3 21.4 22.1 21.5 21.5 22.2 3.2
SOUTH EAST E12000008 (J) 27.2 27.2 27.6 27.3 27.6 27.5 -0.2Bracknell Forest UA E06000036 (00MA) 28.0 28.5 29.1 29.3 28.6 27.9 -2.6Brighton and Hove UA E06000043 (00ML) 17.6 17.5 18.1 17.7 17.8 17.5 -1.7Isle of Wight UA E06000046 (00MW) 24.9 24.7 24.5 23.8 24.2 24.0 -0.8Medway UA E06000035 (00LC) 24.8 24.7 25.1 23.6 25.0 25.3 1.2Milton Keynes UA E06000042 (00MG) 33.2 31.6 35.3 34.5 34.8 34.1 -2.2Portsmouth UA E06000044 (00MR) 16.7 17.5 16.9 17.2 17.1 17.6 3.1Reading UA E06000038 (00MC) 13.5 14.0 15.3 14.7 15.0 14.6 -2.4Slough UA E06000039 (00MD) 16.0 15.9 16.2 16.2 15.6 15.3 -2.3Southampton UA E06000045 (00MS) 17.5 17.2 17.3 16.7 17.0 17.6 3.5
https://www.gov.uk/government/statistical-data-sets/tsgb07 219

Department for Transport statistics
Table CGN0201a (TSGB0716)
miles per hour
Country / region / local authority ONS area code 2006/7 2007/8 2008/9 2009/10 2010/11 2011/12
Congestion & Reliability Statistics
Percentage change
2010/11 to 2011/12
Average vehicle speeds (flow-weighted) during the weekday morning peak 1 on locally managed 'A' roads2: by local authority in
England, annually from 2006/73
Average speed
West Berkshire UA E06000037 (00MB) 28.4 27.9 29.6 29.2 29.4 29.3 -0.6Windsor and Maidenhead UA E06000040 (00ME) 25.9 25.6 25.3 25.3 25.1 25.6 1.8Wokingham UA E06000041 (00MF) 27.3 28.0 28.1 26.3 28.0 28.1 0.4Buckinghamshire E10000002 (11) 28.4 28.1 28.5 28.3 28.4 28.3 -0.3East Sussex E10000011 (21) 29.5 29.4 29.8 29.0 29.2 30.0 2.5Hampshire E10000014 (24) 31.7 31.6 32.4 31.9 32.3 32.3 -0.1Kent E10000016 (29) 27.7 28.0 28.5 28.4 28.7 29.3 2.3Oxfordshire E10000025 (38) 31.2 31.6 31.8 31.6 32.0 31.6 -1.1Surrey E10000030 (43) 23.8 23.7 23.9 24.0 24.1 23.5 -2.6West Sussex E10000032 (45) 31.4 31.2 31.0 30.6 31.2 31.1 -0.1
SOUTH WEST E12000009 (K) 28.5 28.6 28.8 28.7 28.6 29.1 1.6Bath and North East Somerset UA E06000022 (00HA) 21.9 21.5 22.6 22.4 22.4 22.8 1.5Bournemouth UA E06000028 (00HN) 24.0 23.2 25.4 24.7 24.3 23.6 -3.2Bristol, City of UA E06000023 (00HB) 14.7 15.1 15.9 15.6 15.5 15.7 1.1Cornwall UA E06000052 (00HE) 32.5 32.8 32.9 32.6 32.8 33.0 0.7Isles of Scilly UA E06000053 (00HF) .. .. .. .. .. .. ..North Somerset UA E06000024 (00HC) 28.9 29.0 29.5 29.4 29.8 30.1 0.8Plymouth UA E06000026 (00HG) 21.5 21.6 21.7 21.1 19.5 20.3 4.4Poole UA E06000029 (00HP) 22.3 23.6 23.5 24.0 23.6 23.8 0.6South Gloucestershire UA E06000025 (00HD) 25.3 25.1 25.3 24.9 24.6 25.1 2.0Swindon UA E06000030 (00HX) 26.0 26.1 26.1 26.5 26.5 27.6 4.2Torbay UA E06000027 (00HH) 23.3 23.0 23.0 23.3 22.0 23.3 6.0Wiltshire UA E06000054 (00HY) 32.1 32.0 32.0 31.9 32.1 32.5 1.4Devon E10000008 (18) 31.8 31.9 32.1 32.0 32.2 32.6 1.1Dorset E10000009 (19) 35.7 35.5 34.7 34.4 34.6 36.1 4.5Gloucestershire E10000013 (23) 29.2 29.3 29.4 29.3 29.5 29.7 0.9Somerset E10000027 (40) 31.3 31.3 31.2 31.2 31.4 31.5 0.4
1. Morning peak defined as 7am to 10am. Weekdays falling within August and school holiday periods are excluded.2. Average speeds are measured in both directions.3. Academic years - September to July.
.. = not available
Source: DfT Congestion DataTelephone: 020 7944 6579 Last updated: November 2012Email: [email protected] Next update: November 2013
Notes & definitions
https://www.gov.uk/government/statistical-data-sets/tsgb07 220

Department for Transport statistics
Table CGN0201b (TSGB0716)
minutes per mile
Country / region / local authority ONS area code 2006/7 2007/8 2008/9 2009/10 2010/11 2011/12
ENGLAND E92000001 (921) 2.43 2.43 2.39 2.40 2.39 2.37 -0.8
NORTH EAST E12000001 (A) 2.09 2.10 2.10 2.11 2.12 2.06 -3.0County Durham UA E06000047 (00EJ) 1.77 1.77 1.77 1.80 1.82 1.78 -2.0Darlington UA E06000005 (00EH) 2.19 2.24 2.18 2.20 2.21 2.21 0.2Hartlepool UA E06000001 (00EB) 1.69 1.95 1.73 1.73 1.76 1.74 -1.4Middlesbrough UA E06000002 (00EC) 2.21 2.21 2.41 2.27 2.18 2.10 -3.5Northumberland UA E06000048 (00EM) 1.62 1.64 1.66 1.68 1.68 1.68 -0.1Redcar and Cleveland UA E06000003 (00EE) 1.62 1.62 1.61 1.62 1.68 1.67 -0.8Stockton-on-Tees UA E06000004 (00EF) 2.32 2.29 2.27 2.32 2.34 2.29 -2.0Tyne and Wear (Met County) E11000004 (2D) 2.57 2.56 2.55 2.57 2.58 2.43 -5.6
Gateshead E08000020 (00CH) 2.92 2.84 2.84 2.89 2.89 2.66 -7.9Newcastle upon Tyne E08000021 (00CJ) 3.25 3.24 3.22 3.16 3.14 3.06 -2.6North Tyneside E08000022 (00CK) 2.28 2.38 2.39 2.33 2.32 2.15 -7.2South Tyneside E08000023 (00CL) 2.67 2.62 2.60 2.69 2.76 2.47 -10.3Sunderland E08000024 (00CM) 2.05 2.00 1.97 2.05 2.07 2.02 -2.3
NORTH WEST E12000002 (B) 2.67 2.67 2.63 2.65 2.65 2.62 -0.9Blackburn with Darwen UA E06000008 (00EX) 3.15 3.16 3.13 3.12 3.05 3.05 0.1Blackpool UA E06000009 (00EY) 3.21 3.26 3.17 3.20 3.36 3.18 -5.4Cheshire East UA E06000049 (00EQ) 2.15 2.16 2.11 2.10 2.14 2.09 -2.2Cheshire West and Chester UA E06000050 (00EW) 2.02 2.06 2.03 2.01 2.01 2.04 1.4Halton UA E06000006 (00ET) 1.70 1.72 1.60 1.74 1.62 1.62 0.0Warrington UA E06000007 (00EU) 2.78 2.82 2.68 2.75 2.74 2.74 0.2Cumbria E10000006 (16) 1.91 1.91 1.93 1.93 1.92 1.87 -2.3Lancashire E10000017 (30) 2.38 2.37 2.37 2.36 2.34 2.31 -1.3Greater Manchester (Met County) E11000001 (2A) 3.33 3.31 3.24 3.29 3.28 3.28 0.0
Bolton E08000001 (00BL) 2.84 2.85 2.87 2.91 2.87 2.83 -1.4Bury E08000002 (00BM) 3.37 3.29 3.29 3.30 3.18 3.21 1.0Manchester E08000003 (00BN) 3.79 3.74 3.72 3.84 3.81 3.82 0.4Oldham E08000004 (00BP) 3.02 3.09 3.07 3.11 3.12 3.15 1.0Rochdale E08000005 (00BQ) 3.06 3.05 2.97 3.08 3.12 3.02 -3.3Salford E08000006 (00BR) 3.55 3.53 3.48 3.42 3.38 3.46 2.3Stockport E08000007 (00BS) 3.55 3.42 3.25 3.28 3.36 3.33 -0.8Tameside E08000008 (00BT) 3.59 3.68 3.55 3.66 3.72 3.82 2.6Trafford E08000009 (00BU) 3.28 3.26 3.13 3.18 3.20 3.21 0.2Wigan E08000010 (00BW) 3.10 3.10 2.94 2.95 2.98 2.93 -1.7
Merseyside (Met County) E11000002 (2B) 2.75 2.78 2.75 2.77 2.75 2.71 -1.4Knowsley E08000011 (00BX) 1.95 2.00 1.96 2.01 1.95 1.90 -2.4Liverpool E08000012 (00BY) 3.51 3.54 3.50 3.50 3.48 3.42 -1.7Sefton E08000014 (00CA) 2.65 2.67 2.64 2.69 2.67 2.65 -0.6St. Helens E08000013 (00BZ) 2.27 2.27 2.27 2.26 2.25 2.25 0.3Wirral E08000015 (00CB) 2.52 2.55 2.51 2.54 2.54 2.55 0.4
YORKSHIRE AND THE HUMBER E12000003 (D) 2.44 2.43 2.40 2.39 2.36 2.34 -0.9East Riding of Yorkshire UA E06000011 (00FB) 1.66 1.67 1.67 1.69 1.72 1.69 -1.6Kingston upon Hull, City of UA E06000010 (00FA) 3.80 3.84 3.73 3.65 3.59 3.55 -1.1North East Lincolnshire UA E06000012 (00FC) 2.39 2.35 2.37 2.40 2.39 2.35 -1.5North Lincolnshire UA E06000013 (00FD) 1.63 1.60 1.61 1.60 1.63 1.61 -1.0York UA E06000014 (00FF) 2.96 2.93 2.93 2.96 2.87 2.81 -2.1North Yorkshire E10000023 (36) 1.74 1.75 1.79 1.77 1.75 1.74 -0.8South Yorkshire (Met County) E11000003 (2C) 2.61 2.56 2.50 2.53 2.51 2.47 -1.7
Barnsley E08000016 (00CC) 2.20 2.17 2.16 2.23 2.21 2.17 -1.8Doncaster E08000017 (00CE) 2.33 2.36 2.27 2.34 2.32 2.23 -3.7Rotherham E08000018 (00CF) 2.31 2.28 2.21 2.23 2.17 2.18 0.7Sheffield E08000019 (00CG) 3.22 3.09 3.05 3.04 3.04 2.99 -1.8
West Yorkshire (Met County) E11000006 (2F) 2.84 2.85 2.79 2.75 2.71 2.70 -0.2Bradford E08000032 (00CX) 3.17 3.18 3.17 2.96 2.93 2.88 -1.8Calderdale E08000033 (00CY) 2.79 2.82 2.76 2.86 2.78 2.79 0.3Kirklees E08000034 (00CZ) 2.84 2.88 2.88 2.91 2.86 2.93 2.4Leeds E08000035 (00DA) 2.83 2.82 2.68 2.62 2.59 2.59 0.1Wakefield E08000036 (00DB) 2.52 2.53 2.51 2.52 2.44 2.39 -1.9
EAST MIDLANDS E12000004 (E) 2.09 2.07 2.07 2.08 2.08 2.05 -1.5Derby UA E06000015 (00FK) 3.15 3.05 2.95 2.99 2.89 2.91 0.7Leicester UA E06000016 (00FN) 3.55 3.64 3.53 3.60 3.62 3.53 -2.4Nottingham UA E06000018 (00FY) 3.79 3.72 3.63 3.64 3.70 3.63 -1.9Rutland UA E06000017 (00FP) 1.42 1.43 1.46 1.47 1.43 1.43 -0.3Derbyshire E10000007 (17) 2.01 1.99 1.98 1.98 1.98 1.95 -1.4Leicestershire E10000018 (31) 1.91 1.93 1.91 1.91 1.91 1.92 0.2Lincolnshire E10000019 (32) 1.66 1.66 1.67 1.69 1.70 1.66 -2.5Northamptonshire E10000021 (34) 1.97 1.96 1.97 1.96 1.97 1.95 -1.3Nottinghamshire E10000024 (37) 2.10 2.06 2.07 2.07 2.06 2.03 -1.8
WEST MIDLANDS E12000005 (F) 2.39 2.38 2.31 2.33 2.32 2.29 -1.4
Congestion & Reliability Statistics
Percentage change
20010/11 to 2011/12
Average vehicle journey times (flow-weighted) during the weekday morning peak1 on locally managed 'A' roads2: by local authority in
England, annually from 2006/73
Average journey time
https://www.gov.uk/government/statistical-data-sets/tsgb07 221
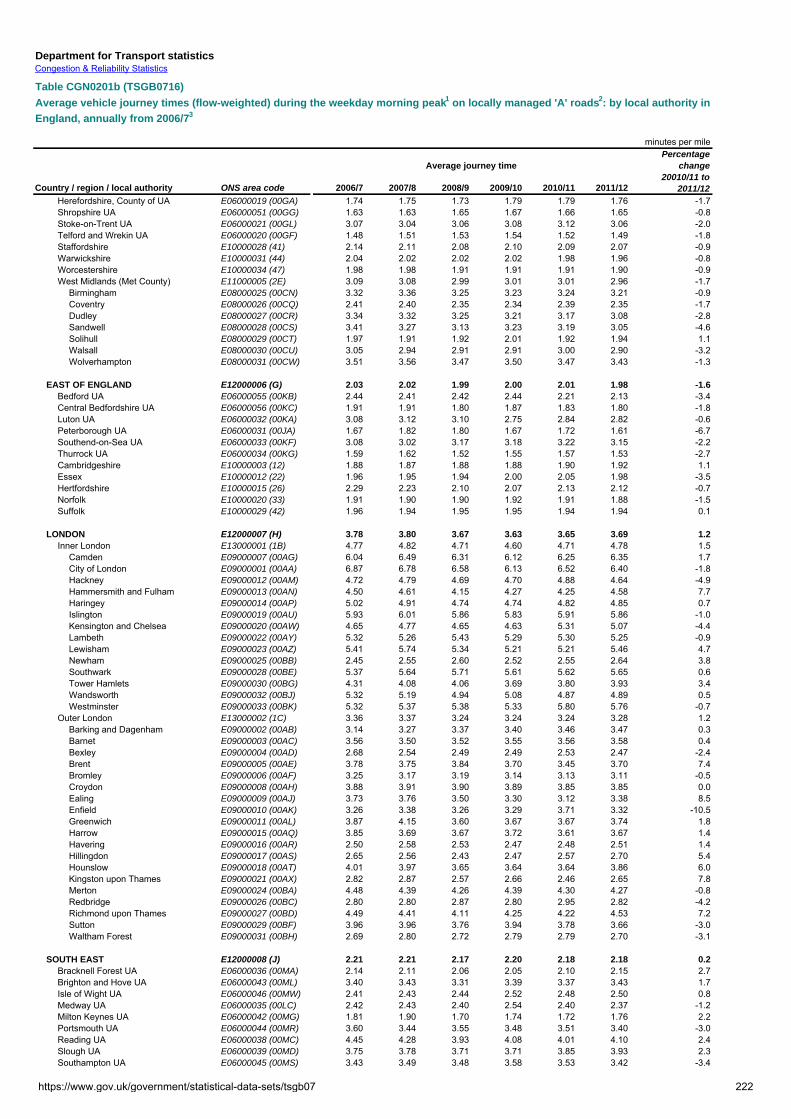
Department for Transport statistics
Table CGN0201b (TSGB0716)
minutes per mile
Country / region / local authority ONS area code 2006/7 2007/8 2008/9 2009/10 2010/11 2011/12
Congestion & Reliability Statistics
Percentage change
20010/11 to 2011/12
Average vehicle journey times (flow-weighted) during the weekday morning peak1 on locally managed 'A' roads2: by local authority in
England, annually from 2006/73
Average journey time
Herefordshire, County of UA E06000019 (00GA) 1.74 1.75 1.73 1.79 1.79 1.76 -1.7Shropshire UA E06000051 (00GG) 1.63 1.63 1.65 1.67 1.66 1.65 -0.8Stoke-on-Trent UA E06000021 (00GL) 3.07 3.04 3.06 3.08 3.12 3.06 -2.0Telford and Wrekin UA E06000020 (00GF) 1.48 1.51 1.53 1.54 1.52 1.49 -1.8Staffordshire E10000028 (41) 2.14 2.11 2.08 2.10 2.09 2.07 -0.9Warwickshire E10000031 (44) 2.04 2.02 2.02 2.02 1.98 1.96 -0.8Worcestershire E10000034 (47) 1.98 1.98 1.91 1.91 1.91 1.90 -0.9West Midlands (Met County) E11000005 (2E) 3.09 3.08 2.99 3.01 3.01 2.96 -1.7
Birmingham E08000025 (00CN) 3.32 3.36 3.25 3.23 3.24 3.21 -0.9Coventry E08000026 (00CQ) 2.41 2.40 2.35 2.34 2.39 2.35 -1.7Dudley E08000027 (00CR) 3.34 3.32 3.25 3.21 3.17 3.08 -2.8Sandwell E08000028 (00CS) 3.41 3.27 3.13 3.23 3.19 3.05 -4.6Solihull E08000029 (00CT) 1.97 1.91 1.92 2.01 1.92 1.94 1.1Walsall E08000030 (00CU) 3.05 2.94 2.91 2.91 3.00 2.90 -3.2Wolverhampton E08000031 (00CW) 3.51 3.56 3.47 3.50 3.47 3.43 -1.3
EAST OF ENGLAND E12000006 (G) 2.03 2.02 1.99 2.00 2.01 1.98 -1.6Bedford UA E06000055 (00KB) 2.44 2.41 2.42 2.44 2.21 2.13 -3.4Central Bedfordshire UA E06000056 (00KC) 1.91 1.91 1.80 1.87 1.83 1.80 -1.8Luton UA E06000032 (00KA) 3.08 3.12 3.10 2.75 2.84 2.82 -0.6Peterborough UA E06000031 (00JA) 1.67 1.82 1.80 1.67 1.72 1.61 -6.7Southend-on-Sea UA E06000033 (00KF) 3.08 3.02 3.17 3.18 3.22 3.15 -2.2Thurrock UA E06000034 (00KG) 1.59 1.62 1.52 1.55 1.57 1.53 -2.7Cambridgeshire E10000003 (12) 1.88 1.87 1.88 1.88 1.90 1.92 1.1Essex E10000012 (22) 1.96 1.95 1.94 2.00 2.05 1.98 -3.5Hertfordshire E10000015 (26) 2.29 2.23 2.10 2.07 2.13 2.12 -0.7Norfolk E10000020 (33) 1.91 1.90 1.90 1.92 1.91 1.88 -1.5Suffolk E10000029 (42) 1.96 1.94 1.95 1.95 1.94 1.94 0.1
LONDON E12000007 (H) 3.78 3.80 3.67 3.63 3.65 3.69 1.2Inner London E13000001 (1B) 4.77 4.82 4.71 4.60 4.71 4.78 1.5
Camden E09000007 (00AG) 6.04 6.49 6.31 6.12 6.25 6.35 1.7City of London E09000001 (00AA) 6.87 6.78 6.58 6.13 6.52 6.40 -1.8Hackney E09000012 (00AM) 4.72 4.79 4.69 4.70 4.88 4.64 -4.9Hammersmith and Fulham E09000013 (00AN) 4.50 4.61 4.15 4.27 4.25 4.58 7.7Haringey E09000014 (00AP) 5.02 4.91 4.74 4.74 4.82 4.85 0.7Islington E09000019 (00AU) 5.93 6.01 5.86 5.83 5.91 5.86 -1.0Kensington and Chelsea E09000020 (00AW) 4.65 4.77 4.65 4.63 5.31 5.07 -4.4Lambeth E09000022 (00AY) 5.32 5.26 5.43 5.29 5.30 5.25 -0.9Lewisham E09000023 (00AZ) 5.41 5.74 5.34 5.21 5.21 5.46 4.7Newham E09000025 (00BB) 2.45 2.55 2.60 2.52 2.55 2.64 3.8Southwark E09000028 (00BE) 5.37 5.64 5.71 5.61 5.62 5.65 0.6Tower Hamlets E09000030 (00BG) 4.31 4.08 4.06 3.69 3.80 3.93 3.4Wandsworth E09000032 (00BJ) 5.32 5.19 4.94 5.08 4.87 4.89 0.5Westminster E09000033 (00BK) 5.32 5.37 5.38 5.33 5.80 5.76 -0.7
Outer London E13000002 (1C) 3.36 3.37 3.24 3.24 3.24 3.28 1.2Barking and Dagenham E09000002 (00AB) 3.14 3.27 3.37 3.40 3.46 3.47 0.3Barnet E09000003 (00AC) 3.56 3.50 3.52 3.55 3.56 3.58 0.4Bexley E09000004 (00AD) 2.68 2.54 2.49 2.49 2.53 2.47 -2.4Brent E09000005 (00AE) 3.78 3.75 3.84 3.70 3.45 3.70 7.4Bromley E09000006 (00AF) 3.25 3.17 3.19 3.14 3.13 3.11 -0.5Croydon E09000008 (00AH) 3.88 3.91 3.90 3.89 3.85 3.85 0.0Ealing E09000009 (00AJ) 3.73 3.76 3.50 3.30 3.12 3.38 8.5Enfield E09000010 (00AK) 3.26 3.38 3.26 3.29 3.71 3.32 -10.5Greenwich E09000011 (00AL) 3.87 4.15 3.60 3.67 3.67 3.74 1.8Harrow E09000015 (00AQ) 3.85 3.69 3.67 3.72 3.61 3.67 1.4Havering E09000016 (00AR) 2.50 2.58 2.53 2.47 2.48 2.51 1.4Hillingdon E09000017 (00AS) 2.65 2.56 2.43 2.47 2.57 2.70 5.4Hounslow E09000018 (00AT) 4.01 3.97 3.65 3.64 3.64 3.86 6.0Kingston upon Thames E09000021 (00AX) 2.82 2.87 2.57 2.66 2.46 2.65 7.8Merton E09000024 (00BA) 4.48 4.39 4.26 4.39 4.30 4.27 -0.8Redbridge E09000026 (00BC) 2.80 2.80 2.87 2.80 2.95 2.82 -4.2Richmond upon Thames E09000027 (00BD) 4.49 4.41 4.11 4.25 4.22 4.53 7.2Sutton E09000029 (00BF) 3.96 3.96 3.76 3.94 3.78 3.66 -3.0Waltham Forest E09000031 (00BH) 2.69 2.80 2.72 2.79 2.79 2.70 -3.1
SOUTH EAST E12000008 (J) 2.21 2.21 2.17 2.20 2.18 2.18 0.2Bracknell Forest UA E06000036 (00MA) 2.14 2.11 2.06 2.05 2.10 2.15 2.7Brighton and Hove UA E06000043 (00ML) 3.40 3.43 3.31 3.39 3.37 3.43 1.7Isle of Wight UA E06000046 (00MW) 2.41 2.43 2.44 2.52 2.48 2.50 0.8Medway UA E06000035 (00LC) 2.42 2.43 2.40 2.54 2.40 2.37 -1.2Milton Keynes UA E06000042 (00MG) 1.81 1.90 1.70 1.74 1.72 1.76 2.2Portsmouth UA E06000044 (00MR) 3.60 3.44 3.55 3.48 3.51 3.40 -3.0Reading UA E06000038 (00MC) 4.45 4.28 3.93 4.08 4.01 4.10 2.4Slough UA E06000039 (00MD) 3.75 3.78 3.71 3.71 3.85 3.93 2.3Southampton UA E06000045 (00MS) 3.43 3.49 3.48 3.58 3.53 3.42 -3.4
https://www.gov.uk/government/statistical-data-sets/tsgb07 222

Department for Transport statistics
Table CGN0201b (TSGB0716)
minutes per mile
Country / region / local authority ONS area code 2006/7 2007/8 2008/9 2009/10 2010/11 2011/12
Congestion & Reliability Statistics
Percentage change
20010/11 to 2011/12
Average vehicle journey times (flow-weighted) during the weekday morning peak1 on locally managed 'A' roads2: by local authority in
England, annually from 2006/73
Average journey time
West Berkshire UA E06000037 (00MB) 2.11 2.15 2.03 2.05 2.04 2.05 0.6Windsor and Maidenhead UA E06000040 (00ME) 2.32 2.34 2.37 2.37 2.39 2.35 -1.8Wokingham UA E06000041 (00MF) 2.20 2.15 2.13 2.28 2.14 2.14 -0.3Buckinghamshire E10000002 (11) 2.11 2.14 2.11 2.12 2.11 2.12 0.3East Sussex E10000011 (21) 2.04 2.04 2.01 2.07 2.05 2.00 -2.5Hampshire E10000014 (24) 1.89 1.90 1.85 1.88 1.86 1.86 0.1Kent E10000016 (29) 2.16 2.14 2.10 2.12 2.09 2.05 -2.3Oxfordshire E10000025 (38) 1.92 1.90 1.89 1.90 1.88 1.90 1.1Surrey E10000030 (43) 2.52 2.54 2.51 2.50 2.49 2.55 2.7West Sussex E10000032 (45) 1.91 1.92 1.94 1.96 1.93 1.93 0.1
SOUTH WEST E12000009 (K) 2.10 2.10 2.08 2.09 2.10 2.06 -1.6Bath and North East Somerset UA E06000022 (00HA) 2.74 2.79 2.66 2.68 2.68 2.64 -1.5Bournemouth UA E06000028 (00HN) 2.50 2.59 2.36 2.43 2.46 2.55 3.3Bristol, City of UA E06000023 (00HB) 4.07 3.98 3.78 3.85 3.86 3.82 -1.1Cornwall UA E06000052 (00HE) 1.85 1.83 1.82 1.84 1.83 1.82 -0.7Isles of Scilly UA E06000053 (00HF) .. .. .. .. .. .. ..North Somerset UA E06000024 (00HC) 2.07 2.07 2.03 2.04 2.01 1.99 -0.8Plymouth UA E06000026 (00HG) 2.80 2.78 2.77 2.85 3.08 2.95 -4.2Poole UA E06000029 (00HP) 2.69 2.54 2.55 2.50 2.54 2.52 -0.6South Gloucestershire UA E06000025 (00HD) 2.37 2.39 2.37 2.41 2.44 2.39 -2.0Swindon UA E06000030 (00HX) 2.31 2.30 2.30 2.27 2.26 2.17 -4.1Torbay UA E06000027 (00HH) 2.58 2.61 2.60 2.57 2.73 2.58 -5.7Wiltshire UA E06000054 (00HY) 1.87 1.88 1.87 1.88 1.87 1.84 -1.4Devon E10000008 (18) 1.89 1.88 1.87 1.87 1.86 1.84 -1.1Dorset E10000009 (19) 1.68 1.69 1.73 1.74 1.74 1.66 -4.3Gloucestershire E10000013 (23) 2.06 2.04 2.04 2.05 2.04 2.02 -0.9Somerset E10000027 (40) 1.92 1.92 1.92 1.92 1.91 1.91 -0.4
1. Morning peak defined as 7am to 10am. Weekdays falling within August and school holiday periods are excluded.2. Average journey times are measured in both directions.3. Academic years - September to July.
.. = not available
Source: DfT Congestion DataTelephone: 020 7944 6579 Last updated: November 2012Email: [email protected] Next update: November 2013
Notes & definitions
https://www.gov.uk/government/statistical-data-sets/tsgb07 223

Dep
artm
ent
for
Tra
nsp
ort
sta
tist
ics
Tran
spor
t Sta
tistic
s G
reat
Brit
ain
Tab
le T
SG
B07
17
Reg
ion
al e
xpen
dit
ure
on
ro
ads:
201
0/11
1
£ M
illio
n
No
rth
E
ast
No
rth
W
est
Yo
rksh
ire
and
th
e H
um
ber
Eas
t M
idla
nd
sW
est
Mid
lan
ds
Eas
t o
f E
ng
lan
dS
ou
th
Eas
tL
on
do
nS
ou
th
Wes
tE
ng
lan
d
Mo
torw
ays
and
tru
nk
road
s:
New
con
stru
ctio
n/im
prov
emen
t and
stru
ctur
al
mai
nten
ance
71.0
114.
719
2.2
235.
912
3.0
670.
623
6.4
6.6
87.3
1,73
7.6
Cur
rent
mai
nten
ance
, inc
ludi
ng ro
utin
e &
win
ter
mai
nten
ance
33.1
39.4
58.0
34.1
27.5
49.1
107.
55.
759
.041
3.5
DB
FO s
ervi
ce p
aym
ents
245
.10.
075
.319
.20.
050
.212
7.9
0.0
50.6
368.
2
Lo
cal R
oad
s:3
New
con
stru
ctio
n/im
prov
emen
t for
hig
hway
s, li
ghtin
g,
road
saf
ety
and
stru
ctur
al m
aint
enan
ce4
211.
273
9.7
308.
927
3.2
394.
646
1.3
487.
285
9.2
433.
94,
169.
2R
even
ue e
xpen
ditu
re o
n br
idge
stru
ctur
al
mai
nten
ance
& s
treng
then
ing
4.0
4.7
3.1
1.7
7.0
7.3
9.3
14.5
3.9
55.6
Rou
tine
and
win
ter m
aint
enan
ce37
.513
2.3
111.
384
.912
2.7
123.
420
8.9
214.
912
8.3
1,16
4.2
Rev
enue
exp
endi
ture
on
road
saf
ety
7.8
15.5
16.4
14.1
38.5
16.6
24.5
174.
212
.332
0.0
Rev
enue
exp
endi
ture
on
publ
ic li
ghtin
g45
.684
.153
.137
.556
.446
.459
.865
.741
.749
0.3
All
road
exp
end
itu
re45
5.2
1,13
0.4
818.
370
0.7
769.
61,
424.
91,
261.
61,
340.
881
7.1
8,71
8.7
1 A
ppor
tionm
ent b
etw
een
the
regi
ons
invo
lves
an
estim
atio
n pr
oces
s.2
Pay
men
ts to
con
tract
ors
unde
r Des
ign,
Bui
ld, F
inan
ce &
Ope
rate
(DB
FO) s
chem
es.
3 Lo
cal a
utho
rity
expe
nditu
re e
xclu
des
expe
nditu
re o
n ca
r par
ks.
4 In
clud
es e
xpen
ditu
re o
n 'p
atch
ing'
.
Tel
epho
ne: 0
20 7
944
5032
Sou
rces
- H
ighw
ays
Age
ncy
Fin
anci
al A
ccou
nts
and
loca
l aut
horit
y re
turn
s to
the
Dep
artm
ent f
or C
omm
uniti
es a
nd L
ocal
Gov
ernm
ent (
DC
LG)
Em
ail:
road
mai
nten
ance
.sta
ts@
dft.g
si.g
ov.u
kLa
st U
pdat
ed: N
ovem
ber
2012
The
figur
es in
this
tabl
e ar
e ou
tsid
e th
e sc
ope
of N
atio
nal S
tatis
tics
Nex
t Upd
ated
: Nov
embe
r 20
13
https://www.gov.uk/government/statistical-data-sets/tsgb07 224
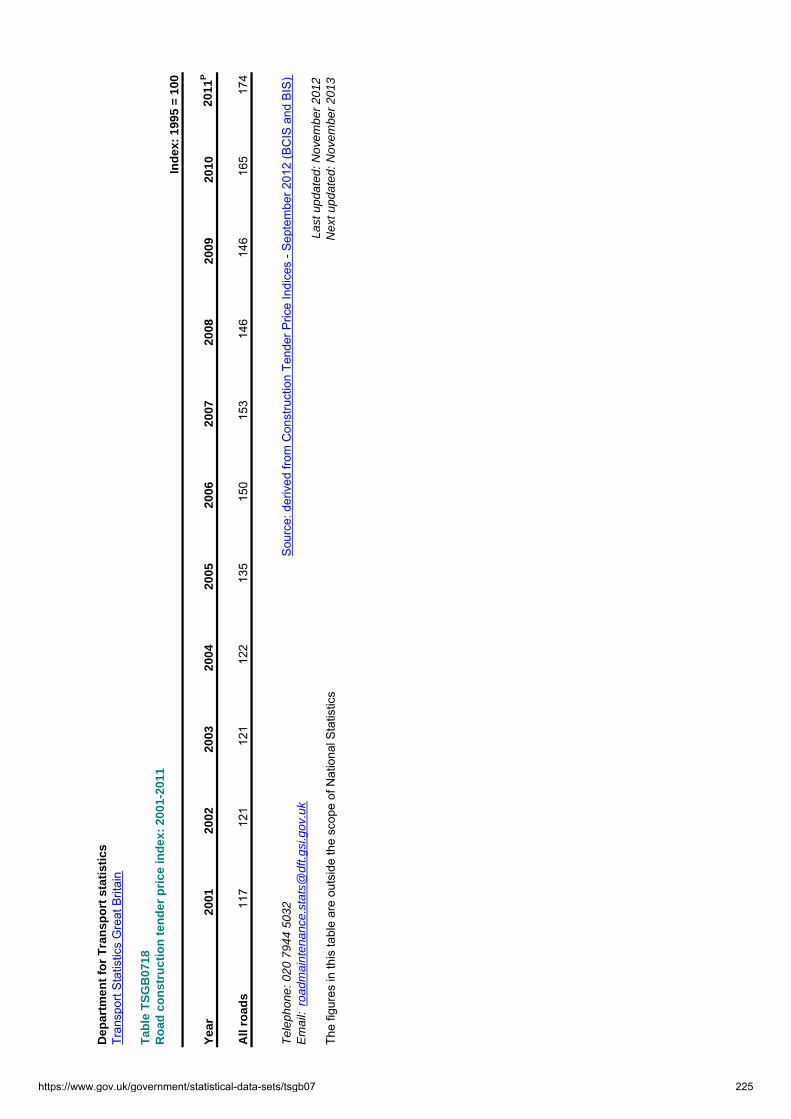
Dep
artm
ent
for
Tra
nsp
ort
sta
tist
ics
Tran
spor
t Sta
tistic
s G
reat
Brit
ain
Tab
le T
SG
B07
18R
oad
co
nst
ruct
ion
ten
der
pri
ce in
dex
: 20
01-2
011
Ind
ex:
1995
= 1
00
Yea
r20
0120
0220
0320
0420
0520
0620
0720
0820
0920
1020
11P
All
road
s11
712
112
112
213
515
015
314
614
616
517
4
Tel
epho
ne: 0
20 7
944
5032
Sou
rce:
der
ived
from
Con
stru
ctio
n Te
nder
Pric
e In
dice
s - S
epte
mbe
r 201
2 (B
CIS
and
BIS
)E
mai
l: ro
adm
aint
enan
ce.s
tats
@df
t.gsi
.gov
.uk
Last
upd
ated
: Nov
embe
r 20
12Th
e fig
ures
in th
is ta
ble
are
outs
ide
the
scop
e of
Nat
iona
l Sta
tistic
sN
ext u
pdat
ed: N
ovem
ber
2013
https://www.gov.uk/government/statistical-data-sets/tsgb07 225

Department for Transport statisticsTransport Statistics Great Britain
Table RDE0103 (TSGB0719)
Road taxation revenue in 2011/12
£millionNumber of
vehicles 1 Vehicle excise
(a) Vehicle Excise Duty classified by vehicle taxation group (thousand) duty 2
Private and light goods 39,505 5,591Motorcycles, scooters and mopeds 1,375 60Buses and coaches 126 29Goods 487 233Other 1,987 18
All vehicles 43,480 5,932
(b) Fuel tax classified by propulsion type2 Petrol Diesel Total1
11,258 14,944 26,800
1. Total number of unique vehicles licenced during the year. This will exceed the licenced stock at any one time.2. The overall estimate of vehicle excise duty raised is provided by DVLA. The split of this total across vehicle taxation groups is estimated by applying the relevant excise duty rate to the average of the number of licenced vehicles in each group at the end of each quarter of the year.3. Total fuel tax by propulsion includes oil and gas.4. Not including receipts from VAT Source: HMRC and DVLA
Last updated: November 2012Contact: 020-7944 3077 Next updated: November 2013Email: [email protected] The road tax figures in this table are outside the scope of National Statistics
https://www.gov.uk/government/statistical-data-sets/tsgb07 226
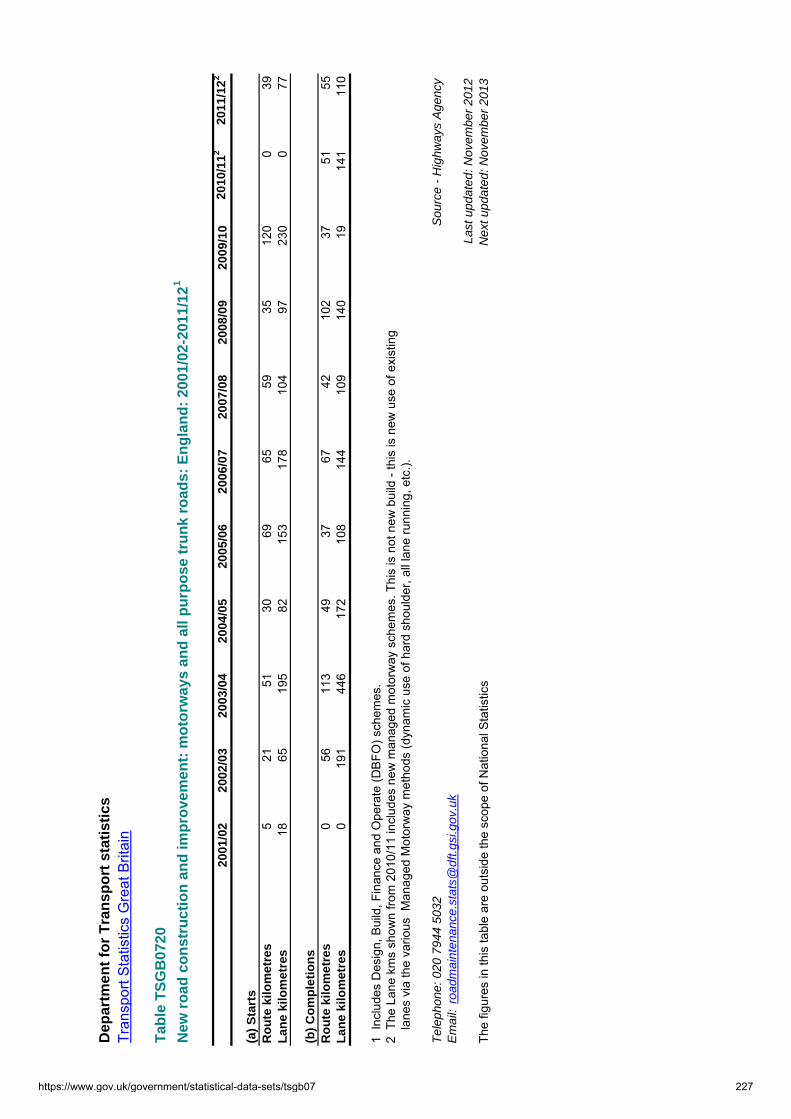
Dep
artm
ent
for
Tra
nsp
ort
sta
tist
ics
Tran
spor
t Sta
tistic
s G
reat
Brit
ain
Tab
le T
SG
B07
20
New
ro
ad c
on
stru
ctio
n a
nd
imp
rove
men
t: m
oto
rway
s an
d a
ll p
urp
ose
tru
nk
road
s: E
ng
lan
d:
2001
/02-
2011
/12
1
2001
/02
2002
/03
2003
/04
2004
/05
2005
/06
2006
/07
2007
/08
2008
/09
2009
/10
2010
/11
220
11/1
22
(a)
Sta
rts
Ro
ute
kilo
met
res
521
5130
6965
5935
120
039
Lan
e ki
lom
etre
s18
6519
582
153
178
104
9723
00
77
(b)
Co
mp
leti
on
sR
ou
te k
ilom
etre
s0
5611
349
3767
4210
237
5155
Lan
e ki
lom
etre
s0
191
446
172
108
144
109
140
1914
111
0
1 In
clud
es D
esig
n, B
uild
, Fin
ance
and
Ope
rate
(DB
FO) s
chem
es.
2 T
he L
ane
kms
show
n fro
m 2
010/
11 in
clud
es n
ew m
anag
ed m
otor
way
sch
emes
. Thi
s is
not
new
bui
ld -
this
is n
ew u
se o
f exi
stin
g
lane
s vi
a th
e va
rious
Man
aged
Mot
orw
ay m
etho
ds (d
ynam
ic u
se o
f har
d sh
ould
er, a
ll la
ne ru
nnin
g, e
tc.).
Tel
epho
ne: 0
20 7
944
5032
Sou
rce
- H
ighw
ays
Age
ncy
Em
ail:
road
mai
nten
ance
.sta
ts@
dft.g
si.g
ov.u
kLa
st u
pdat
ed: N
ovem
ber
2012
The
figur
es in
this
tabl
e ar
e ou
tsid
e th
e sc
ope
of N
atio
nal S
tatis
tics
Nex
t upd
ated
: Nov
embe
r 20
13
https://www.gov.uk/government/statistical-data-sets/tsgb07 227

https://www.gov.uk/government/statistical-data-sets/tsgb07 228

Transport Statistics Great Britain: 2012
Transport Accidents and Casualties
This section looks at road and rail accidents and casualties, and motoring offences.
Transport Accidents and Casualties includes:
Traffic and reported road accident casualties, by casualty severity, roads user type, road class.
Reported road accident casualties, by road class, hour of day.
Breath tests performed on car drivers and motorcycle riders.
Motoring offences.
Rail accident casualties by casualty severity and casualty mode.
Rail signals passed at danger (SPADS).on Network rail controlled infrastructure.
Reported Road Casualties (Table TSGB0801 – 0804, 0809)
In 2011, there were a total of 203,950 reported casualties of all severities, 35 per cent lower than a decade earlier in 2001. A total of 1,901 people were killed, 49 per cent lower than in 2001, 23,122 were seriously injured (down 38 per cent) and 178,927 were slightly injured (down 34 per cent). Between 2001 and 2011 traffic grew by 3.2 per cent.
Traffic and reported casualties by severity: Great Britain 2001 to 2011: Index 2001=100
0
20
40
60
80
100
120
2001 2002 2003 2004 2005 2006 2007 2008 2009 2010 2011
Ind
ex (
2001
= 1
00)
Traffic (vehicle miles) Killed Seriously injured Slighlty injured
https://www.gov.uk/government/statistical-data-sets/tsgb08-traffic-accidents-and-casualties 229

The chart above shows the trends in killed, seriously and slightly injured casualties between 2001 and 2011. Although traffic levels have been above the 2001 levels every year since, all categories of injured causalities have fallen. The numbers of slightly injured and seriously injured have shown a similar almost consistent fall each year (aside from the 2010 to 2011 increase in seriously injured).
The pattern for numbers killed is a little less regular, with the most significantly falls being seen between 2006 and 2010, when they decreased by 42 per cent.
Proportion of reported casualties by road user type and severity: GB 2011
0%
20%
40%
60%
80%
100%
Killed Serious Slight All
Car occupant Motorcycle rider / passengerBus or coach occupant Pedal cyclesPedestrian Other
The chart above shows that car occupants accounted for nearly 60 per cent of all casualties as well as being the largest group of casualties across all the levels of severity.
Vulnerable road users, made up of cyclists, motorcyclists and pedestrians, together accounted for 49 per cent of all deaths but only 35 per cent of seriously and slightly injured casualties. Within this group of vulnerable road users, only around a fifth of killed or seriously injured casualties were pedal cyclists in comparison with 41 per cent being pedestrians and 39 per cent being motorcyclists.
Nearly two thirds of accidents occur on urban roads. However this is reversed for fatal accidents with 61 per cent occurring on rural roads. Only 4 per cent of all accidents occur on motorways, a rate of 94 accidents per billion vehicle miles driven in comparison with 848 accidents per billion miles on urban roads and 369 accidents per billion miles on rural roads.
https://www.gov.uk/government/statistical-data-sets/tsgb08-traffic-accidents-and-casualties 230

Motoring offences (Tables TSGB0804, 0810 – 0811)
In 2008, speed limit offences accounted for just under half of all motoring offences (excluding
obstruction, waiting and parking offences) with licence, insurance and record keeping offences accounting for a further fifth.
Rail accidents and casualties (Tables TSGB0805 – TSGB0808)
Excluding suicides, in 2011/12 there were 66 fatalities on the National Rail network. This was 50 per cent higher than in 2010/11 when there were 44, but this number is in line with previous figures over the last decade. This increase was mainly due to a rise in the number of trespassers killed, 53 of whom were killed in 2011/12 following a large drop to 29 the year before. The remaining 13 fatalities were 4 passengers, 1 member of the workforce and 8 members of the public (excluding trespassers).
Excluding attempted suicides, there were 419 major injuries in 2011/12 compared to 411 the previous year. This number has fallen by 17 per cent since 2001/02. Overall casualties rose by 4 per cent from 12,974 in 2010/11 to 13,466 in 2011/12. This is the second consecutive rise, following six consecutive years of falls. Passenger kilometres rose by 5 per cent from 2010/11 to 2011/12, and have risen by 47 per cent since 2001/02.
Casualties on the rail network by severity, excluding suicides: GB 2001/02 – 2011/12
0
20
40
60
80
100
120
140
160
2001/02 2002/03 2003/04 2004/05 2005/06 2006/07 2007/08 2008/09 2009/10 2010/11 2011/12
Ind
ex:
2001
/02
= 1
00
Fatalities Fatalities and major injuries All casualties Passenger kilometres
The majority of fatalities on the rail network are suicides. In 2011/12 there were 236, 78 per cent of the total 302 fatalities. There were also 23 major injuries, 19 minor injuries and 1 instance of shock/trauma following suicide attempts.
https://www.gov.uk/government/statistical-data-sets/tsgb08-traffic-accidents-and-casualties 231
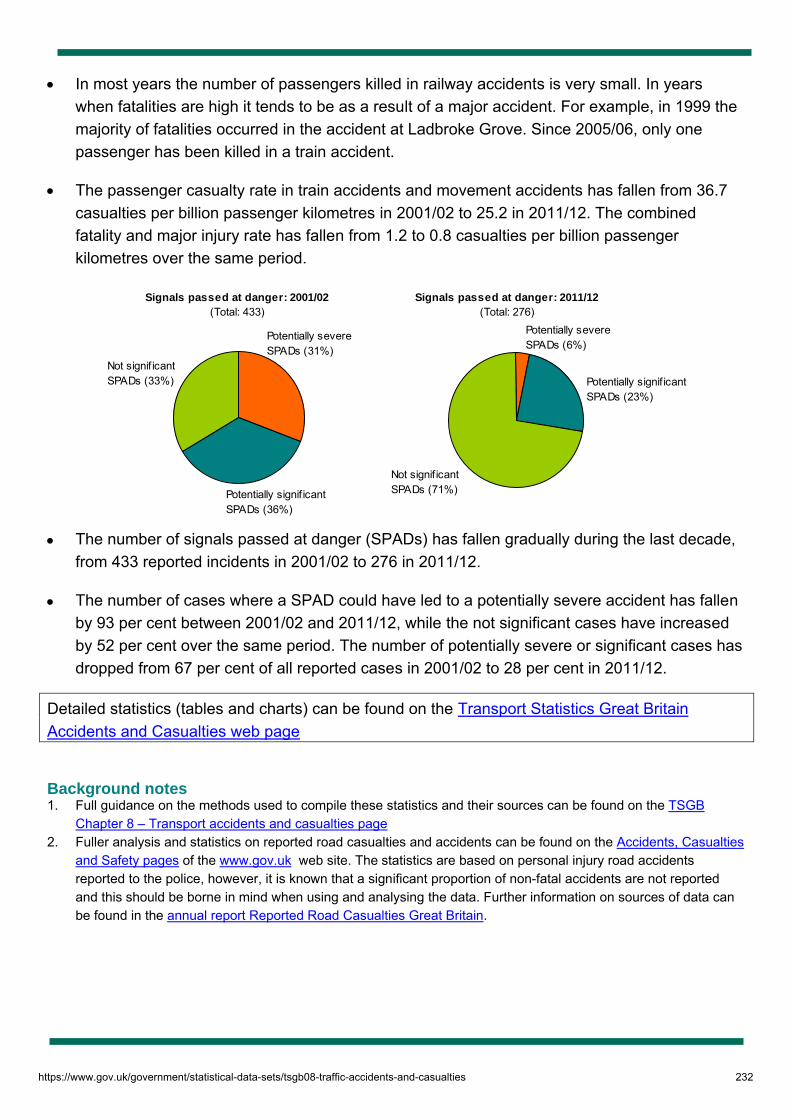
In most years the number of passengers killed in railway accidents is very small. In years when fatalities are high it tends to be as a result of a major accident. For example, in 1999 the majority of fatalities occurred in the accident at Ladbroke Grove. Since 2005/06, only one passenger has been killed in a train accident.
The passenger casualty rate in train accidents and movement accidents has fallen from 36.7 casualties per billion passenger kilometres in 2001/02 to 25.2 in 2011/12. The combined fatality and major injury rate has fallen from 1.2 to 0.8 casualties per billion passenger kilometres over the same period.
Signals passed at danger: 2001/02(Total: 433)
Not signif icant SPADs (33%)
Potentially severe SPADs (31%)
Potentially signif icant SPADs (36%)
Signals passed at danger: 2011/12(Total: 276)
Not signif icant SPADs (71%)
Potentially severe SPADs (6%)
Potentially signif icant SPADs (23%)
The number of signals passed at danger (SPADs) has fallen gradually during the last decade, from 433 reported incidents in 2001/02 to 276 in 2011/12.
The number of cases where a SPAD could have led to a potentially severe accident has fallen by 93 per cent between 2001/02 and 2011/12, while the not significant cases have increased by 52 per cent over the same period. The number of potentially severe or significant cases has dropped from 67 per cent of all reported cases in 2001/02 to 28 per cent in 2011/12.
Detailed statistics (tables and charts) can be found on the Transport Statistics Great Britain Accidents and Casualties web page
Background notes 1. Full guidance on the methods used to compile these statistics and their sources can be found on the TSGB
Chapter 8 – Transport accidents and casualties page 2. Fuller analysis and statistics on reported road casualties and accidents can be found on the Accidents, Casualties
and Safety pages of the www.gov.uk web site. The statistics are based on personal injury road accidents reported to the police, however, it is known that a significant proportion of non-fatal accidents are not reported and this should be borne in mind when using and analysing the data. Further information on sources of data can be found in the annual report Reported Road Casualties Great Britain.
https://www.gov.uk/government/statistical-data-sets/tsgb08-traffic-accidents-and-casualties 232

Department for Transport Statisticshttps://www.gov.uk/government/organisations/department-for-transport/series/road-accidents-and-safety-statisticsTSGB0801 (RAS40007)
Reported road accidents and casualties: 1950-2011
Number/rate per billion vehicle miles
Casualties
Killed (number) Injured (thousands)
AccidentsPedest-
riansPedal
cyclistsMotor
cyclistsAll other
road users All killed Serious SlightAll
injuredAll
casualtiesCasualty rate
per All traffic
Year '000 no no no no no '000 '000 '000 '000Billion
vehicle milesbillion vehicle
miles
1950 167 2,251 805 1,129 827 5,012 49 148 196 201 4,438 451951 178 2,398 800 1,175 877 5,250 52 159 211 216 4,372 501952 172 2,063 743 1,142 758 4,706 50 153 203 208 3,998 521953 186 2,233 720 1,237 900 5,090 57 165 222 227 4,262 531954 196 2,226 696 1,148 940 5,010 57 176 233 238 4,333 551955 217 2,287 708 1,362 1,169 5,526 62 200 262 268 4,529 591956 216 2,270 650 1,250 1,197 5,367 61 201 263 268 4,441 601957 219 2,225 663 1,425 1,237 5,550 64 205 268 274 4,571 601958 237 2,408 668 1,421 1,473 5,970 69 225 294 300 4,502 671959 261 2,520 738 1,680 1,582 6,520 81 246 327 333 4,556 731960 272 2,708 679 1,743 1,840 6,970 84 256 341 348 4,498 77
1961 270 2,717 645 1,544 2,002 6,908 85 258 343 350 4,222 831962 264 2,681 583 1,323 2,122 6,709 84 251 335 342 3,994 861963 272 2,740 589 1,279 2,314 6,922 88 261 349 356 3,966 901964 292 2,986 583 1,445 2,806 7,820 95 282 378 385 3,870 1001965 299 3,105 543 1,244 3,060 7,952 98 292 390 398 3,774 105
1966 292 3,153 514 1,134 3,184 7,985 100 285 384 392 3,527 1111967 277 2,964 463 920 2,972 7,319 94 269 363 370 3,209 1151968 264 2,762 391 877 2,780 6,810 89 254 342 349 2,917 1201969 262 2,955 402 791 3,217 7,365 91 255 346 353 2,880 1231970 267 2,925 373 761 3,440 7,499 93 262 356 363 2,855 127
1971 259 2,939 411 800 3,549 7,699 91 253 344 352 2,620 1341972 265 3,083 367 729 3,584 7,763 91 261 352 360 2,557 1411973 262 2,806 336 750 3,514 7,406 89 257 346 354 2,395 1481974 244 2,642 282 797 3,162 6,883 82 236 318 325 2,236 1451975 246 2,344 278 838 2,906 6,366 77 241 319 325 2,214 147
1976 259 2,335 300 990 2,945 6,570 80 254 333 340 2,200 1541977 266 2,313 301 1,182 2,818 6,614 82 260 341 348 2,214 1571978 265 2,427 316 1,163 2,925 6,831 83 260 343 350 2,152 1631979 255 2,118 320 1,160 2,754 6,352 81 248 335 335 2,067 1621980 252 1,941 302 1,163 2,547 5,953 79 242 327 329 1,909 172
1981 248 1,874 310 1,131 2,531 5,846 78 241 325 325 1,852 1751982 256 1,869 294 1,091 2,683 5,937 80 249 334 334 1,850 1811983 243 1,914 323 963 2,245 5,445 71 233 309 309 1,687 1831984 253 1,868 345 967 2,419 5,599 73 246 324 324 1,687 1921985 246 1,789 286 796 2,294 5,165 71 241 318 318 1,618 196
1986 248 1,841 271 762 2,511 5,385 69 247 321 321 1,564 2061987 239 1,703 280 723 2,419 5,125 64 242 311 311 1,407 2211988 247 1,753 227 670 2,402 5,052 63 254 322 322 1,362 2371989 261 1,706 294 683 2,690 5,373 63 273 342 342 1,334 2561990 258 1,694 256 659 2,608 5,217 60 275 341 341 1,319 259
1991 236 1,496 242 548 2,282 4,568 52 255 311 311 1,202 2591992 233 1,347 204 469 2,209 4,229 49 257 311 311 1,200 2591993 1 229 1,241 186 427 1,960 3,814 45 257 306 306 1,183 2591994 234 1,124 172 444 1,910 3,650 47 265 315 315 1,193 2641995 231 1,038 213 445 1,925 3,621 46 262 311 311 1,152 270
1996 236 997 203 440 1,958 3,598 44 272 321 321 1,159 2771997 240 973 183 509 1,934 3,599 43 281 328 328 1,161 2821998 239 906 158 498 1,859 3,421 41 281 325 325 1,132 2871999 235 870 172 547 1,834 3,423 39 278 320 320 1,094 2932000 234 857 127 605 1,820 3,409 38 279 320 320 1,094 293
2001 229 826 138 583 1,903 3,450 37 273 313 313 1,053 2972002 222 775 130 609 1,917 3,431 36 263 303 303 992 3052003 214 774 114 693 1,927 3,508 34 253 291 291 945 3082004 207 671 134 585 1,831 3,221 31 246 281 281 899 3122005 199 671 148 569 1,813 3,201 29 239 271 271 866 313
2006 189 675 146 599 1,752 3,172 29 227 258 258 812 3182007 182 646 136 588 1,576 2,946 28 217 248 248 771 3212008 171 572 115 493 1,358 2,538 26 202 231 231 723 3192009 164 500 104 472 1,146 2,222 25 195 222 222 702 3162010 154 405 111 403 931 1,850 23 184 209 209 670 3112011 151 453 107 362 979 1,901 23 179 204 204 665 307
1 See Notes and Definitions in Section 7 for details of discontinuity in road traffic figures from 1993 onwards. From 1993 the data has been estimated using the expansion factors and the new methodology for measuring road lengths, they are not directly comparable with the figures for 1992 and earlier.
Source: Reported Road Casualties Great BritainLast updated: December 2012
Telephone: 020 7944 6595 Next update: December 2013Email: [email protected]
https://www.gov.uk/government/statistical-data-sets/tsgb08-traffic-accidents-and-casualties 233

Department for Transport statisticshttps://www.gov.uk/government/organisations/department-for-transport/series/road-accidents-and-safety-statistics
TSGB0802 (RAS30069)Reported road accident casualties by road user type and severity: 2000-2011
Number
2000 2001 2002 2003 2004 2005 2006 2007 2008 2009 2010 2011
Child pedestrians: 1
Killed 107 107 79 74 77 63 71 57 57 37 26 33 KSI2 3,226 3,144 2,828 2,381 2,339 2,134 2,025 1,899 1,784 1,660 1,646 1,602 All severities 16,184 15,819 14,231 12,544 12,234 11,250 10,131 9,527 8,648 7,983 7,929 7,807
Adult pedestrians: 3
Killed 750 712 688 695 589 604 602 585 515 463 379 420 KSI 6,112 5,745 5,644 5,422 5,005 4,847 4,894 4,900 4,724 4,295 3,874 4,227 All severities 24,481 23,463 23,258 22,531 21,404 20,725 19,774 19,676 19,013 18,248 17,320 17,802
Child pedal cyclists: 1
Killed 27 25 22 18 25 20 31 13 12 14 7 6 KSI 758 674 594 595 577 527 503 522 417 458 398 398 All severities 6,260 5,451 4,809 4,769 4,682 4,286 3,765 3,633 3,306 3,204 2,828 2,881
Adult pedal cyclists: 3
Killed 98 111 107 95 109 127 115 122 103 90 104 101 KSI 1,954 1,951 1,801 1,776 1,697 1,787 1,898 1,994 2,101 2,225 2,333 2,750 All severities 13,630 12,974 11,712 11,643 11,366 11,637 11,911 12,050 12,546 13,420 13,970 15,908Motorcyclists 4 and passengers Killed 605 583 609 693 585 569 599 588 493 472 403 362 KSI 7,374 7,305 7,500 7,652 6,648 6,508 6,484 6,737 6,049 5,822 5,183 5,609 All severities 28,212 28,810 28,353 28,411 25,641 24,824 23,326 23,459 21,550 20,703 18,686 20,150Car drivers and passengers Killed 1,665 1,749 1,747 1,769 1,671 1,675 1,612 1,432 1,257 1,059 835 883 KSI 19,719 19,424 18,728 17,291 16,144 14,617 14,254 12,967 11,968 11,112 9,749 9,225 All severities 206,799 202,802 197,425 188,342 183,858 178,302 171,000 161,433 149,188 143,412 133,205 124,924Bus/coach drivers and passengers Killed 15 14 19 11 20 9 19 12 6 14 9 7 KSI 578 562 551 500 488 363 426 455 432 370 401 332 All severities 10,088 9,884 9,005 9,068 8,820 7,920 7,253 7,079 6,929 6,317 6,268 6,177LGV drivers and passengers Killed 66 64 70 72 62 54 52 58 43 36 34 34 KSI 813 811 780 765 631 587 564 494 445 417 359 340 All severities 7,007 7,304 7,007 6,897 6,166 6,048 5,914 5,340 4,913 4,743 4,494 4,499HGV drivers and passengers Killed 55 54 63 44 47 55 39 52 23 14 28 28 KSI 571 500 524 429 406 395 383 363 240 189 212 195 All severities 3,597 3,388 3,178 3,061 2,883 2,843 2,530 2,476 1,930 1,519 1,578 1,415
All road users: 5
Killed 3,409 3,450 3,431 3,508 3,221 3,201 3,172 2,946 2,538 2,222 1,850 1,901 KSI 41,564 40,560 39,407 37,215 34,351 32,155 31,845 30,720 28,572 26,912 24,510 25,023 All severities 320,283 313,309 302,605 290,607 280,840 271,017 258,404 247,780 230,905 222,146 208,648 203,950
1. Casualties aged 0 -15.2. Killed and seriously injured.3. Casualties aged 16 and over.4. Includes mopeds and scooters.5. Includes other motor or non-motor vehicle users, and unknown road user type and casualty age.
Last updated: December 2012
Next update: December 2013Contact: 020-7944 6595
E-mail: [email protected]
The figures in this table are National Statistics
https://www.gov.uk/government/statistical-data-sets/tsgb08-traffic-accidents-and-casualties 234

Department for Transport statisticshttps://www.gov.uk/government/organisations/department-for-transport/series/road-accidents-and-safety-statisticsTSGB0803 (RAS10002)Reported accidents and accident rates by road class and severity, Great Britain, 2005-09 average, 2004-2011
Number of accidents/rate per billion miles
2005-09 average 2004 2005 2006 2007 2008 2009 2010 2011
Urban roads2,3
A roads Fatal 456 527 489 526 469 420 374 307 328 Fatal and serious 6,258 7,116 6,440 6,615 6,430 6,149 5,656 5,391 5,687 All severities 49,121 57,708 53,780 50,483 48,661 47,207 45,473 43,697 44,179 Rate 966 1,114 1,052 977 956 941 902 875 889
Other roads4
Fatal 444 504 510 500 452 412 347 265 288 Fatal and serious 8,237 8,871 8,699 8,682 8,404 7,952 7,448 6,943 7,159 All severities 64,587 72,639 71,570 68,173 64,731 60,354 58,108 54,853 53,622 Rate 941 1,019 998 949 881 832 813 793 817
All urban roads5
Fatal 900 1,031 999 1,026 921 832 721 572 616 Fatal and serious 14,495 15,987 15,139 15,297 14,834 14,101 13,104 12,334 12,846 All severities 113,708 130,347 125,350 118,656 113,392 107,561 103,581 98,550 97,801 Rate 952 1,059 1,021 961 912 877 850 828 848
Rural roads2,3
A roads Fatal 983 1,140 1,123 1,127 1,018 858 790 657 713 Fatal and serious 6,056 6,932 6,616 6,381 6,119 5,604 5,559 4,931 5,067 All severities 31,857 36,656 34,780 33,555 32,649 29,627 28,676 26,577 25,710 Rate 359 417 396 376 366 334 325 306 293
Other roads4
Fatal 558 656 615 609 621 515 432 389 376 Fatal and serious 5,000 5,745 5,167 5,239 5,093 4,907 4,593 4,125 4,168 All severities 27,466 31,175 29,899 28,546 28,085 26,144 24,654 22,787 22,144 Rate 637 752 711 654 620 575 558 516 529
All rural roads5
Fatal 1,542 1,796 1,738 1,736 1,639 1,373 1,222 1,046 1,089 Fatal and serious 11,056 12,677 11,783 11,620 11,212 10,511 10,152 9,056 9,235 All severities 59,323 67,831 64,679 62,101 60,734 55,771 53,330 49,364 47,854 Rate 450 525 498 467 451 415 402 376 369
All roads5
Motorways Fatal 149 149 176 164 154 136 114 113 92 Fatal and serious 919 1,047 1,007 953 989 848 798 781 702 All severities 7,773 9,072 8,619 8,379 7,976 7,249 6,643 6,500 5,819 Rate 126 151 143 136 128 117 107 107 94
A roads Fatal 1,439 1,669 1,612 1,653 1,487 1,278 1,164 964 1,041 Fatal and serious 12,316 14,055 13,063 12,997 12,550 11,755 11,215 10,322 10,754 All severities 80,991 94,429 88,599 84,050 81,316 76,839 74,149 70,274 69,889 Rate 580 676 637 596 580 553 534 513 508
Other roads4
Fatal 1,003 1,160 1,125 1,109 1,073 927 779 654 664 Fatal and serious 13,238 14,624 13,872 13,922 13,497 12,859 12,041 11,068 11,327 All severities 92,067 103,909 101,517 96,732 92,823 86,503 82,762 77,640 75,766 Rate 824 922 893 838 782 733 715 685 705
Total5
Fatal 2,590 2,978 2,913 2,926 2,714 2,341 2,057 1,731 1,797 Fatal and serious 26,473 29,726 27,942 27,872 27,036 25,462 24,054 22,171 22,783 All severities 180,831 207,410 198,735 189,161 182,115 170,591 163,554 154,414 151,474 Rate 578 664 635 594 567 534 517 496 494
1 Figures have been rounded to the nearest whole number.2 Excludes motorways.3 See urban and rural definitions.4 B roads, C roads and unclassified roads: excludes cases where road class was not reported.5 Includes cases where road class was not reported.
Telephone: 020 7944 6595 Source: DfT STATS19, DfT National Road Traffic SurveyEmail: [email protected] Last updated: December 2012Notes and Definitions Next update: December 2013
The figures in this table are National Statistics
https://www.gov.uk/government/statistical-data-sets/tsgb08-traffic-accidents-and-casualties 235

Dep
artm
ent
for
Tra
nsp
ort
sta
tist
ics
http
s://w
ww
.gov
.uk/
gove
rnm
ent/o
rgan
isat
ions
/dep
artm
ent-f
or-tr
ansp
ort/s
erie
s/ro
ad-a
ccid
ents
-and
-saf
ety-
stat
istic
sT
SG
B08
04 (
RA
S51
014)
Dri
vers
an
d r
ider
s in
inju
ry r
oad
acc
iden
ts:
bre
ath
tes
ts a
nd
fai
lure
s: G
B 2
001-
2011
Nu
mb
er/P
erce
nta
ge
2002
2003
2004
2005
2006
2007
2008
2009
2010
2011
a. T
otal
invo
lved
390,
273
374,
098
362,
303
348,
773
331,
120
318,
009
294,
442
280,
786
263,
284
256,
101
b. T
otal
test
s re
ques
ted
196,
232
187,
276
183,
972
183,
219
179,
270
179,
558
162,
969
151,
918
141,
240
138,
650
c. T
otal
faile
d8,
104
8,15
07,
427
7,11
56,
594
6,27
85,
520
5,12
54,
287
4,36
6
Test
ing
rate
(b/a
x 1
00)
5050
5153
5456
5554
5454
Test
failu
re ra
te (c
/b x
100
)4.
14.
44.
03.
93.
73.
53.
43.
43.
03.
1To
tal f
ailu
re ra
te (c
/a x
100
)2.
12.
22.
02.
02.
02.
01.
91.
81.
61.
7S
ourc
e: S
TA
TS
19
Tele
phon
e: 0
20 7
944
6595
Em
ail:
road
acc.
stat
s@df
t.gsi
.gov
.uk
Not
es a
nd d
efin
ition
s se
e: h
ttps:
//ww
w.g
ov.u
k/te
chni
cal-g
uida
nce-
for-
trans
port-
stat
s#ro
ad-a
ccid
ents
-and
-saf
ety-
stat
istic
sS
ourc
e: S
TATS
19, C
oron
ers
and
Pro
cura
tors
Fis
cal
Last
upd
ated
: Dec
embe
r 201
2N
ext u
pdat
e: D
ecem
ber 2
013
The
figur
es in
this
tabl
e ar
e N
atio
nal S
tatis
tics
A n
ote
on m
etho
dolo
gy c
an b
e fo
und
at:
http
://as
sets
.dft.
gov.
uk/s
tatis
tics/
rele
ases
/road
-acc
iden
ts-a
nd-s
afet
y-dr
ink-
driv
e-es
timat
es-2
011/
met
hodo
logy
-not
es-d
rink-
driv
e.pd
f
https://www.gov.uk/government/statistical-data-sets/tsgb08-traffic-accidents-and-casualties 236

Department for Transport Statistics
RAI0501 (TSGB0805)
Railway1 accidents: casualties by type of accident: 2001/02 - 2011/12
Number
2001/02 2002/03R 2003/04R 2004/05R 2005/06R 2006/07R 2007/08R 2008/09R 2009/10R 2010/11R 2011/12
Fatalities:
Passenger fatalities 5 18 7 12 8 9 7 5 5 7 4 Train accidents 0 6 0 5 0 1 0 0 0 0 0 Slip trips and falls 1 1 3 1 3 2 1 2 1 1 1 Platform train interface 4 7 3 3 1 4 3 3 4 5 3 Assault and abuse 0 2 1 2 1 1 1 0 0 1 0 On-board injuries 0 0 0 0 0 0 0 0 0 0 0 Contact with object or person 0 0 0 0 0 0 0 0 0 0 0 Struck by train on station crossing 0 0 0 1 2 1 2 0 0 0 0 Other passenger fatalities 0 2 0 0 1 0 0 0 0 0 0 Workforce fatalities 5 5 8 4 4 2 2 3 3 1 1 Infrastructure workforce 4 3 7 2 3 0 2 3 3 1 1 Train driver 0 0 0 1 1 1 0 0 0 0 0 Other train crew 0 0 0 0 0 0 0 0 0 0 0 Station staff 0 1 0 0 0 0 0 0 0 0 0 Revenue protection 0 0 0 0 0 0 0 0 0 0 0 Other workforce fatalities 1 1 1 1 0 1 0 0 0 0 0 Public fatalities 71 50 59 43 56 56 60 58 64 36 61 Trespassers 56 41 40 38 43 44 51 45 50 29 53 Level crossings 12 7 16 5 11 9 8 12 13 6 5 Other public fatalities 3 2 3 0 2 3 1 1 1 1 3
Total fatalities (excl. suicides) 81 73 74 59 68 67 69 66 72 44 66
Suicides 192 200 189 193 225 226 208 219 234 204 236
Total fatalities 273 273 263 252 293 293 277 285 306 248 302
Major injuries:
Passenger major injuries 274 276 287 232 244 248 218 232 236 250 252 Train accidents 3 10 0 10 2 29 0 0 3 6 1 Slip trips and falls 166 158 183 138 160 137 139 157 144 156 163 Platform train interface 56 62 58 55 40 39 39 39 43 45 47 Assault and abuse 8 17 9 4 12 7 9 6 9 10 11 On-board injuries 31 23 30 15 20 29 21 24 29 26 23 Contact with object or person 9 4 4 4 8 7 9 4 7 5 7 Struck by train on station crossing 0 0 0 1 0 0 1 0 0 0 0 Other passenger injuries 1 2 3 5 2 0 0 2 1 2 0 Workforce major injuries 173 161 176 208 149 127 139 131 123 125 127 Infrastructure workforce 106 99 100 137 86 77 73 80 74 76 67 Train driver 14 2 12 12 7 6 18 6 10 11 12 Other train crew 25 32 29 26 31 20 18 20 18 12 18 Station staff 15 15 14 17 12 12 15 9 8 8 9 Revenue protection 6 9 13 5 5 3 2 2 4 5 5 Other workforce injuries 7 4 8 11 8 9 13 14 9 13 16 Public major injuries 55 40 55 43 41 58 46 55 38 36 40 Trespassers 39 30 32 29 29 38 29 33 19 18 14 Level crossings 9 4 14 6 4 8 4 9 7 5 8 Other public injuries 7 6 9 8 8 12 13 13 12 13 18
Total major injuries (excl. suicides) 502 477 518 483 434 433 403 418 397 411 419
Suicides 37 33 30 22 32 34 28 34 25 36 23
Total major injuries 539 510 548 505 466 467 431 452 422 447 442
Minor injuries 11,657 11,499 12,158 12,047 11,668 11,254 10,887 10,829 10,801 11,174 11,534 Passengers 5,010 4,850 5,134 5,030 4,860 4,887 5,043 5,241 5,293 5,604 5,912 Workforce 6,444 6,547 6,913 6,868 6,676 6,197 5,693 5,442 5,307 5,369 5,418 Public 189 94 99 142 117 162 141 128 188 186 185 Suicides 14 8 12 7 15 8 10 18 13 15 19
Shock/trauma 1,820 1,925 2,067 1,750 1,788 1,787 1,776 1,601 1,347 1,360 1,467 Passengers 143 216 308 218 255 325 329 259 206 228 263 Workforce 1,670 1,701 1,750 1,529 1,522 1,458 1,439 1,335 1,137 1,129 1,201 Public 7 7 6 3 9 3 8 7 3 3 2 Suicides 0 1 3 0 2 1 0 0 1 0 1
All casualties (excl. suicides) 14,046 13,965 14,802 14,332 13,941 13,532 13,125 12,896 12,603 12,974 13,466
All casualties 14,289 14,207 15,036 14,554 14,215 13,801 13,371 13,167 12,876 13,229 13,745
Note: RSSB continually updates and revises previous years’ data in light of any new information that becomes available.
1 Includes National Rail only.
Telephone: 020 7944 2419 Source: Rail Safety and Standards Board (RSSB)Email: [email protected] Last updated: December 2012
The figures in this table are outside the scope of National Statistics Next update: December 2013
https://www.gov.uk/government/organisations/department-for-transport/series/rail-statistics
https://www.gov.uk/government/statistical-data-sets/tsgb08-traffic-accidents-and-casualties 237

Dep
artm
ent
for
Tra
nsp
ort
Sta
tist
ics
RA
I050
2 (T
SG
B08
06)
Rai
lway
1 m
ove
men
t ac
cid
ents
: p
asse
ng
er c
asu
alti
es a
nd
cas
ual
ty r
ates
: 20
01/0
2 -
2011
/12 N
umbe
r/bill
ion
kilo
met
res/
rate
per
bill
ion
pass
enge
r ki
lom
etre
s
2001
/02R
2002
/03R
2003
/04R
2004
/05R
2005
/06R
2006
/07R
2007
/08R
2008
/09R
2009
/10R
2010
/11R
2011
/12
Pas
sen
ger
cas
ual
ties
:2
F
atal
itie
s1
80
50
20
00
00
M
ajo
r in
juri
es44
6357
6033
6029
3141
4948
M
ino
r in
juri
es1,
331
1,25
81,
209
1,19
21,
040
1,08
31,
039
1,14
91,
249
1,34
81,
342
S
ho
ck/t
rau
ma
5969
6344
4767
6961
4347
55
A
ll ca
sual
ties
1,43
51,
398
1,32
91,
301
1,12
01,
212
1,13
71,
241
1,33
31,
444
1,44
5
Pas
sen
ger
kilo
met
res
(bill
ion
s)3
39.1
39.7
40.9
41.7
43.1
46.2
48.9
50.6
51.4
54.5
57.3
Pas
sen
ger
cas
ual
ty r
ates
:
Fat
alit
ies
0.0
0.2
0.0
0.1
0.0
0.0
0.0
0.0
0.0
0.0
0.0
M
ajo
r in
juri
es1.
11.
61.
41.
40.
81.
30.
60.
60.
80.
90.
8
Min
or
inju
ries
34.0
31.7
29.6
28.6
24.1
23.5
21.2
22.7
24.3
24.7
23.4
S
ho
ck/t
rau
ma
1.5
1.7
1.5
1.1
1.1
1.5
1.4
1.2
0.8
0.9
1.0
A
ll ca
sual
ties
36.7
35.2
32.5
31.2
26.0
26.3
23.2
24.5
25.9
26.5
25.2
Not
e: R
SS
B c
ontin
ually
upd
ates
and
revi
ses
prev
ious
yea
rs’ c
asua
lty d
ata
in li
ght o
f any
new
info
rmat
ion
that
bec
omes
ava
ilabl
e. P
asse
nger
kilo
met
res
from
200
9/10
and
201
0/11
hav
e be
en
revi
sed
from
thos
e pr
evio
usly
incl
uded
in th
is ta
ble
to in
clud
e no
n-fra
nchi
sed
train
ope
rato
rs a
s w
ell a
s fra
nchi
sed
oper
ator
s. C
asua
lty ra
tes
have
bee
n re
vise
d ac
cord
ingl
y.
1 In
clud
es N
atio
nal R
ail o
nly.
2 P
asse
nger
cas
ualti
es o
win
g to
trai
n ac
cide
nts
and
mov
emen
t acc
iden
ts in
volv
ing
peop
le o
n bo
ard
train
s or
in th
e ac
t of b
oard
ing
or a
light
ing
from
them
(see
Not
es a
nd D
efin
ition
s).
3 F
igur
es u
p to
200
8/09
onl
y in
clud
e fra
nchi
sed
train
ope
rato
rs, f
rom
200
9/10
they
incl
ude
non-
franc
hise
d op
erat
ors
as w
ell.
This
has
a s
mal
l im
pact
on
the
tota
ls, w
ith n
on-fr
anch
ised
o
pera
tors
mak
ing
up 0
.6 p
er c
ent o
f the
tota
l pas
seng
er k
ilom
etre
s in
200
9/10
.
Tele
phon
e: 0
20 7
944
2419
Sou
rce:
Rai
l Saf
ety
and
Sta
ndar
ds B
oard
(RS
SB
)E
mai
l: ra
il.st
ats@
dft.g
si.g
ov.u
kLa
st u
pdat
ed: D
ecem
ber
2012
Nex
t upd
ate:
Dec
embe
r 20
13
The
figur
es in
this
tabl
e ar
e ou
tsid
e th
e sc
ope
of N
atio
nal S
tatis
tics
http
s://w
ww
.gov
.uk/
gove
rnm
ent/o
rgan
isat
ions
/dep
artm
ent-f
or-tr
ansp
ort/s
erie
s/ra
il-st
atis
tics
https://www.gov.uk/government/statistical-data-sets/tsgb08-traffic-accidents-and-casualties 238

Department for Transport Statistics
RAI0503 (TSGB0807)
Railway1 accidents: train accidents: 2001/02 - 2011/12
Number
2001/02 2002/03 2003/04 2004/05R 2005/06 2006/07 2007/08R 2008/09 2009/10R 2010/11R 2011/12
Potentially high risk train accidents (PHRTAs) 70 65 55 63 46 45 44 49 42 18 34
Involving passenger trains 33 34 27 35 23 24 20 31 26 14 18 Collisions between trains 2 5 2 3 2 1 4 6 4 1 5 Derailments2 9 7 7 6 6 11 3 3 8 5 0 Collisions with road vehicles (not at level crossing) 2 1 4 5 1 2 5 0 2 0 2 Collisions with road vehicles (at level crossing) 16 18 14 15 13 9 7 18 12 5 9 Striking buffer stops 4 3 0 6 1 1 1 4 0 2 2 Struck by large falling objects 0 0 0 0 0 0 0 0 0 1 0 Not involving passenger trains 37 31 28 28 23 21 24 18 16 4 16 Collisions between trains 0 1 3 2 2 1 1 0 0 1 1 Derailments2 34 25 22 19 18 15 18 13 12 3 14 Collisions with road vehicles (not at level crossing) 1 2 0 3 0 1 3 2 2 0 0 Collisions with road vehicles (at level crossing) 2 3 3 2 3 4 1 3 2 0 0 Striking buffer stops 0 0 0 2 0 0 1 0 0 0 1 Struck by large falling objects 0 0 0 0 0 0 0 0 0 0 0
Non-PHRTAs 1,528 1,194 1,000 944 753 780 740 648 540 508 517
Involving passenger trains 1,220 987 852 814 621 665 622 552 472 445 436 Open door collisions 52 36 29 15 1 2 3 3 1 0 0 Roll back collisions 8 5 8 10 5 4 3 2 4 6 1 Striking animals 97 92 96 109 120 126 113 116 144 169 170 Struck by missiles 478 364 286 271 208 221 225 198 141 90 58 Train fires 263 253 255 221 128 136 87 73 70 57 44 Striking level crossing gates/barriers 6 7 1 4 2 3 4 6 2 7 2 Striking other objects 316 230 177 184 157 173 187 154 110 116 161 Not involving passenger trains 308 207 148 130 132 115 118 96 68 63 81 Open door collisions 2 1 1 0 0 0 0 0 1 0 0 Roll back collisions 0 1 0 0 1 0 0 0 0 2 0 Striking animals 14 16 6 7 20 13 14 12 16 21 22 Struck by missiles 185 114 70 60 66 63 60 46 22 8 10 Train fires 58 37 47 24 15 11 9 11 6 9 8 Striking level crossing gates/barriers 1 0 1 0 2 1 4 2 5 1 1 Striking other objects 48 38 23 39 28 27 31 25 18 22 40
Total train accidents 1,598 1,259 1,055 1,007 799 825 784 697 582 526 551
Note: RSSB continually updates and revises previous years’ data in light of any new information that becomes available.
1 Includes National Rail only.2 Excludes derailments caused by collisions with road vehicles at level crossings.
Source: Rail Safety and Standards Board (RSSB)Telephone: 020 7944 2419 Last updated: December 2012
Email: [email protected] Next update: December 2013
The figures in this table are outside the scope of National Statistics
https://www.gov.uk/government/organisations/department-for-transport/series/rail-statistics
https://www.gov.uk/government/statistical-data-sets/tsgb08-traffic-accidents-and-casualties 239

Dep
artm
ent
for
Tra
nsp
ort
Sta
tist
ics
RA
I050
4 (T
SG
B08
08)
SP
AD
s1 on
Net
wo
rk R
ail c
on
tro
lled
infr
astr
uct
ure
: 20
01/0
2 -
2011
/12
Num
ber
2001
/02
2002
/03
2003
/04
2004
/05
2005
/06
2006
/07
2007
/08
2008
/09
2009
/10
2010
/11
2011
/12
Po
ten
tial
ly s
ever
e S
PA
Ds
134
104
4334
1918
2117
1918
9P
ote
nti
ally
sig
nif
ican
t S
PA
Ds
154
121
116
105
101
8772
7261
7068
No
t si
gn
ific
ant
SP
AD
s13
117
121
123
120
822
825
620
319
421
119
9U
ncl
assi
fied
146
41
00
00
00
0
All
SP
AD
s43
340
237
437
132
833
334
929
227
429
927
6
1 S
igna
ls p
asse
d at
dan
ger (
see
Not
es a
nd D
efin
ition
s).
Tele
phon
e: 0
20 7
944
2419
Sou
rce:
Rai
l Saf
ety
and
Sta
ndar
ds B
oard
(RS
SB
)E
mai
l: ra
il.st
ats@
dft.g
si.g
ov.u
kLa
st u
pdat
ed: D
ecem
ber
2012
The
figur
es in
this
tabl
e ar
e ou
tsid
e th
e sc
ope
of N
atio
nal S
tatis
tics
Nex
t upd
ate:
Dec
embe
r 20
13
http
s://w
ww
.gov
.uk/
gove
rnm
ent/o
rgan
isat
ions
/dep
artm
ent-f
or-tr
ansp
ort/s
erie
s/ra
il-st
atis
tics
https://www.gov.uk/government/statistical-data-sets/tsgb08-traffic-accidents-and-casualties 240

https://www.gov.uk/government/organisations/department-for-transport/series/road-accidents-and-safety-statisticsTSGB0809 (RAS52002)International comparisons of road deaths1: number and rates for different road users: by selected countries: 1999 - 2011
1999 2000 2001 2002 2003 2004 2005 2006 2007 2008 2009 2010 20112
Rate of road deaths in 2011 per million
population3
Great Britain 3,423 3,409 3,450 3,431 3,508 3,221 3,201 3,172 2,946 2,538 2,222 1,850 1,901 31
Northern Ireland 141 171 148 150 150 147 135 126 113 107 115 55 59 33
United Kingdom 3,564 3,580 3,598 3,581 3,658 3,368 3,336 3,298 3,059 2,645 2,337 1,905 1,960 31
Austria 1,079 976 958 956 931 878 768 730 691 679 633 552 523 62
Belgium 1,397 1,470 1,486 1,306 1,214 1,162 1,089 1,069 1,067 922 955 840 875 80
Bulgaria 1,047 1,012 1,011 959 960 943 957 1,043 1,006 1,061 901 775 658 88
Cyprus 113 111 98 94 97 117 102 86 89 82 71 60 71 88
Czech Republic 1,455 1,486 1,334 1,431 1,447 1,382 1,286 1,063 1,222 1,076 901 802 773 73
Denmark 514 498 431 463 432 369 331 306 406 392 303 265 220 40
Estonia 232 204 199 223 164 170 169 204 196 132 100 78 101 75
Finland 431 396 433 415 379 375 379 336 380 344 281 270 292 54
France 8,487 8,079 8,160 7,655 6,058 5,530 5,318 4,709 4,620 4,275 4,273 3,992 3,970 61
Germany 7,772 7,503 6,977 6,842 6,613 5,842 5,361 5,091 4,949 4,477 4,152 3,651 4,002 49
Greece 2,116 2,037 1,880 1,634 1,605 1,670 1,658 1,657 1,612 1,559 1,453 1,281 1,087 96
Hungary 1,306 1,200 1,239 1,429 1,326 1,296 1,278 1,303 1,232 996 822 739 638 64
Irish Republic 413 415 411 376 337 374 399 365 338 279 239 212 186 42
Italy 6,688 7,061 7,096 6,980 6,563 6,122 5,818 5,669 5,131 4,739 4,050 3,998 3,800 63
Latvia 604 588 558 559 532 516 442 1,043 419 316 254 218 179 80
Lithuania 748 641 706 697 709 752 773 759 739 498 370 300 297 92
Luxembourg 58 76 70 62 53 50 45 36 43 35 47 32 33 64
Malta 4 15 16 16 16 13 17 11 14 15 21 15 17 41
Netherlands 1,090 1,082 993 987 1,028 804 750 730 791 750 720 640 661 40
Poland 6,730 6,294 5,534 5,827 5,640 5,712 5,444 5,243 5,583 5,437 4,572 3,907 4,189 110
Portugal 1,995 1,860 1,671 1,675 1,546 1,294 1,247 969 974 882 839 845 785 74
Romania 2,505 2,499 2,461 2,398 2,235 2,418 2,461 2,478 2,794 3,063 2,796 2,377 2,018 94
Slovakia 647 628 614 610 645 603 560 579 627 606 385 353 324 60
Slovenia 334 313 278 269 242 274 258 263 293 214 171 138 141 69Spain 5,738 5,776 5,517 5,347 5,400 4,749 4,442 4,104 3,823 3,102 2,668 2,470 2,056 45
Sweden 580 591 531 515 512 463 423 428 454 380 341 266 314 33
Croatia 662 655 647 627 701 608 597 614 619 659 538 426 416 94
Israel 466 452 531 515 445 467 437 405 382 412 314 352 341 44
Iceland 21 32 24 29 23 23 19 31 15 12 17 8 12 38
Norway 304 341 275 312 282 259 224 242 233 255 212 210 168 34
Switzerland 583 592 554 513 546 510 409 370 384 357 349 327 320 41
Australia 1,758 1,817 1,737 1,715 1,621 1,590 1,627 1,598 1,617 1,466 1,504 1,366 1,292 57
Canada 2,972 2,927 2,779 2,931 2,766 2,725 2,925 2,892 2,754 2,431 2,130 .. .. ..
Japan 10,372 10,403 10,060 9,575 8,877 8,492 7,931 7,272 6,639 6,023 5,772 5,745 5,449 43
New Zealand 509 462 455 404 461 436 405 391 422 366 384 375 284 66
Republic of Korea 10,756 10,236 8,097 7,222 7,212 6,563 6,376 6,327 6,166 5,870 5,838 5,505 5,229 107
USA 41,717 41,945 42,116 42,815 42,643 42,636 43,443 42,708 41,259 37,261 33,963 32,788 32,310 105
1
2 Provisional data.3 Population taken from the OECD's International Road and Traffic Accidents Database and EUROSTAT and may differ from the figures in INT0101 and INT0104.r Revised as sucides which were previously included have now been removed.Source: International Road Traffic and Accident Database (OECD), ETSC, EUROSTAT and CARE (EU road accident database).Telephone: 020 7944 6595 Last updated: December 2012
Email: [email protected] Next update: December 2013
In accordance with the commonly agreed international definition, most countries define a fatality as one being due to a road accident where death occurs within 30 days of the accident. The official road accident statistics of some countries however, limit the fatalities to those occurring within shorter periods after the accident. Numbers of deaths and death rates in the above table have been adjusted according to the factors used by the Economic Commission for Europe and the International Transport Forum (ITF) (formerly known as ECMT) to represent standardised 30-day deaths: Italy (7 days) +8%; France (6 days) +5.7%; Portugal (1 day) +14%; Republic of Korea (3 days) +15%.
Department for Transport statistics
https://www.gov.uk/government/statistical-data-sets/tsgb08-traffic-accidents-and-casualties 241
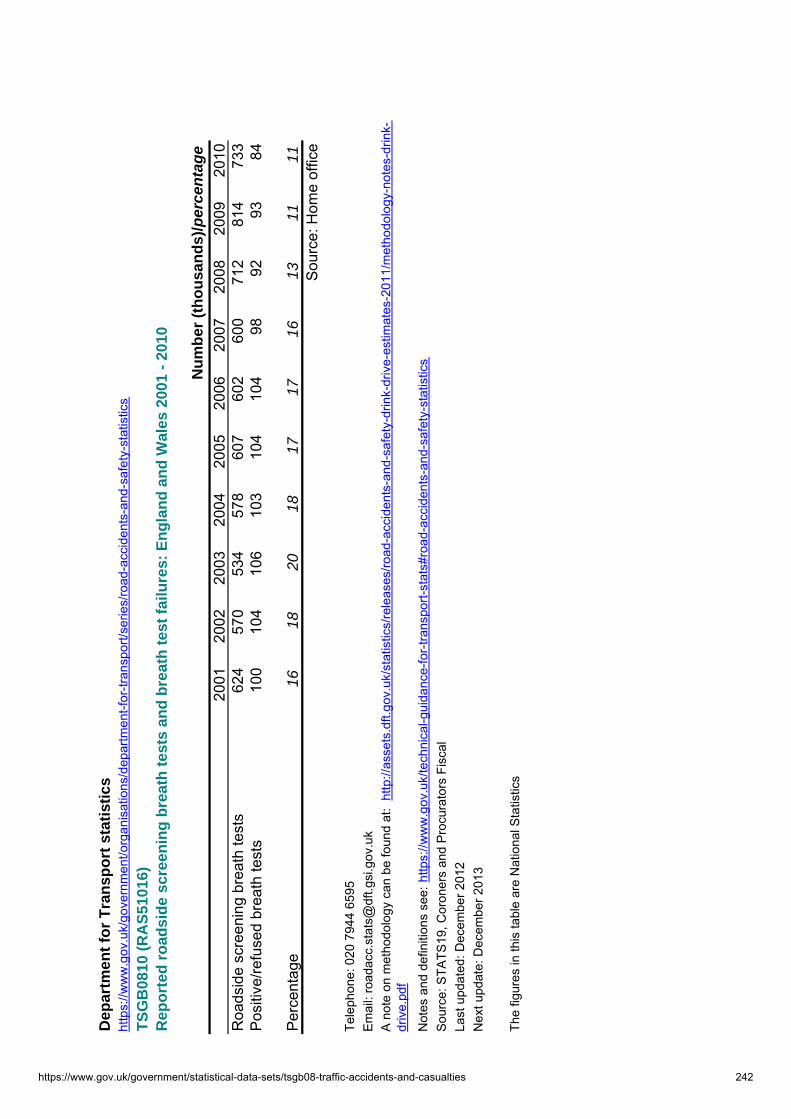
Dep
artm
ent
for
Tra
nsp
ort
sta
tist
ics
TS
GB
0810
(R
AS
5101
6)R
epo
rted
ro
adsi
de
scre
enin
g b
reat
h t
ests
an
d b
reat
h t
est
failu
res:
En
gla
nd
an
d W
ales
200
1 -
2010
Nu
mb
er (
tho
usa
nd
s)/p
erce
nta
ge
2001
2002
2003
2004
2005
2006
2007
2008
2009
2010
Roa
dsid
e sc
reen
ing
brea
th te
sts
624
570
534
578
607
602
600
712
814
733
Pos
itive
/refu
sed
brea
th te
sts
100
104
106
103
104
104
9892
9384
Per
cent
age
1618
2018
1717
1613
1111
Sou
rce:
Hom
e of
fice
Tele
phon
e: 0
20 7
944
6595
Em
ail:
road
acc.
stat
s@df
t.gsi
.gov
.uk
Not
es a
nd d
efin
ition
s se
e: h
ttps:
//ww
w.g
ov.u
k/te
chni
cal-g
uida
nce-
for-
trans
port-
stat
s#ro
ad-a
ccid
ents
-and
-saf
ety-
stat
istic
sS
ourc
e: S
TATS
19, C
oron
ers
and
Pro
cura
tors
Fis
cal
Last
upd
ated
: Dec
embe
r 201
2N
ext u
pdat
e: D
ecem
ber 2
013
The
figur
es in
this
tabl
e ar
e N
atio
nal S
tatis
tics
A n
ote
on m
etho
dolo
gy c
an b
e fo
und
at:
http
://as
sets
.dft.
gov.
uk/s
tatis
tics/
rele
ases
/road
-acc
iden
ts-a
nd-s
afet
y-dr
ink-
driv
e-es
timat
es-2
011/
met
hodo
logy
-not
es-d
rink-
driv
e.pd
f
http
s://w
ww
.gov
.uk/
gove
rnm
ent/o
rgan
isat
ions
/dep
artm
ent-f
or-tr
ansp
ort/s
erie
s/ro
ad-a
ccid
ents
-and
-saf
ety-
stat
istic
s
https://www.gov.uk/government/statistical-data-sets/tsgb08-traffic-accidents-and-casualties 242

Dep
artm
ent
for
Tra
nsp
ort
sta
tist
ics
http
s://w
ww
.gov
.uk/
gove
rnm
ent/o
rgan
isat
ions
/dep
artm
ent-f
or-tr
ansp
ort/s
erie
s/ro
ad-a
ccid
ents
-and
-saf
ety-
stat
istic
sT
SG
B08
11 (
RA
S61
001)
Mo
tor
veh
icle
off
ence
s: f
ind
ing
s o
f g
uilt
at
all c
ou
rts,
fix
ed p
enal
ty n
oti
ces
and
wri
tten
war
nin
gs:
by
typ
e o
f o
ffen
ce:
En
gla
nd
an
d W
ales
: 20
00-2
010
Thou
sand
s of
offe
nces
2000
2001
2002
2003
2004
2005
2006
2007
2008
2009
2010
Offe
nce
type
:D
ange
rous
, car
eles
s or
dru
nken
driv
ing
etc
17
617
217
117
723
127
532
226
727
529
925
2A
ccid
ent o
ffenc
es18
1818
1918
1716
1612
1312
Spe
ed li
mit
offe
nces
1,15
41,
386
1,53
82,
041
2,07
62,
087
1,93
31,
592
1,35
91,
206
1,10
8U
naut
horis
ed ta
kin g
or t
heft
of m
otor
veh
icle
3232
3230
2725
2323
1914
12Li
cenc
e, in
sura
nce
and
reco
rd k
eepi
ng o
ffenc
es78
576
981
995
395
784
474
764
156
449
844
7V
ehic
le te
st a
nd c
ondi
tion
offe
nces
243
226
228
241
227
187
152
117
114
113
112
Ne g
lect
of t
raffi
c si
gns
and
dire
ctio
ns a
nd p
edes
trian
righ
ts23
221
821
326
425
824
524
523
722
620
918
7O
ther
offe
nces
rela
ting
to m
otor
veh
icle
s (e
xcep
t obs
truct
ion,
w
aitin
g an
d pa
rkin
g)26
825
523
928
035
438
035
234
632
328
629
5A
ll o
ffen
ces
(exc
ept
ob
stru
ctio
n,w
aiti
ng
an
d p
arki
ng
)2,
911
3,07
63,
259
4,00
54,
147
4,05
93,
789
3,23
82,
892
2,63
72,
425
Obs
truct
ion,
wai
ting
and
park
ing
offe
nces
11,
611
1,34
11,
180
1,05
989
658
449
945
433
826
920
2A
ll o
ffen
ces
4,52
34,
417
4,43
95,
244
5,04
34,
643
4,28
83,
691
3,23
02,
906
2,62
7
1 E
xclu
des
Pen
alty
Cha
rge
Not
ices
issu
ed b
y Lo
cal A
utho
ritie
s un
der
'C
ivil
Par
king
Enf
orce
men
t pow
ers
- see
Not
es2
For d
etai
ls o
n ve
hicl
e of
fenc
es d
ealt
with
by
the
cour
ts s
ee M
inis
try o
f Jus
tice
Sta
tistic
al B
ulle
tin,
"C
rimin
al J
ustic
e S
tatis
tics
Eng
land
and
Wal
es 2
011"
and
ass
ocia
ted
Sup
plem
enta
ry T
able
s -
"V
olum
e 6
- Mot
orin
g". C
opie
s of
this
repo
rt an
d ot
her p
ublic
atio
ns c
an
be
dow
nloa
ded
free
from
the
Min
istry
of J
ustic
e w
ebsi
te a
t http
://w
ww
.just
ice.
gov.
uk/p
ublic
atio
ns/c
rimin
alan
nual
.htm
3 Fo
r det
ails
on
fixed
pen
alty
not
ices
and
writ
ten
war
ning
s se
e H
ome
Offi
ce S
tatis
tical
Bul
letin
, "P
olic
e P
ower
s an
d
Pro
cedu
res,
Eng
land
and
Wal
es 2
010/
11".
Cop
ies
of th
is re
port
and
othe
r pub
licat
ions
can
be
dow
nloa
ded
free
from
th
e H
ome
Offi
ce w
ebsi
te a
t http
://w
ww
.hom
eoffi
ce.g
ov.u
k/pu
blic
atio
ns/s
cien
ce-r
esea
rch-
stat
istic
s/re
sear
ch-s
tatis
tics/
polic
e-re
sear
ch/p
olic
e-po
wer
s-pr
oced
ures
-201
011/
Con
tact
: 020
333
4 49
69S
ourc
e - M
inis
try o
f Jus
tice2
Con
tact
: 020
703
5 02
99S
ourc
e - H
ome
Offi
ce3
Last
upd
ated
: Dec
embe
r 201
2N
ext u
pdat
e: D
ecem
ber 2
013
The
figur
es in
this
tabl
e ar
e N
atio
nal S
tatis
tics
https://www.gov.uk/government/statistical-data-sets/tsgb08-traffic-accidents-and-casualties 243

https://www.gov.uk/government/statistical-data-sets/tsgb08-traffic-accidents-and-casualties 244

Transport Statistics Great Britain: 2012
Vehicles
This section looks at the number of licensed vehicles in Great Britain and related data about vehicles from Transport Statistics Great Britain published on 13 December 2012.
The Vehicles chapter includes: The number of licensed vehicles broken down
by taxation class.
The number of newly registered vehicles broken down by taxation class.
The number of driving tests undertaken with pass/fail rates.
The number of MOT tests undertaken with pass/fail rates.
Licensed Vehicles
Number of licensed vehicles by tax class, 1950 to 2011 (Table VEH0103, and by body type in Table VEH0102)
0
5
10
15
20
25
30
35
1950 1955 1960 1965 1970 1975 1980 1985 1990 1995 2000 2005 2010
Num
ber o
f lic
ense
d ve
hicl
es (m
illio
ns)
Private and light goods vehicles Other vehicles
The chart above shows that the number of licensed vehicles in Great Britain has increased from about 4 million in 1950 to over 34 million in 2011.
https://www.gov.uk/government/statistical-data-sets/tsgb09-vehicles 245

The number of licensed vehicles has grown by about 3.6 per cent a year on average from 1950 to 2011. However, the number grew by only 0.3 per cent in 2011, and the period since 2007 rivals the early 1990s for the lowest period of growth on record since World War 2.
Vehicles in the private and light goods taxation class (which is mainly made up of private cars and light vans) accounted for about 89 per cent of all the licensed vehicles in 2011.
New Vehicle Registrations
Motor vehicles registered for the first time by tax class: 1951 to 2011 (Table VEH0153)
0
5
10
15
20
25
30
1950 1955 1960 1965 1970 1975 1980 1985 1990 1995 2000 2005 2010
Tota
l num
ber o
f new
regi
stra
tions
(tho
usan
ds)
Private and light goods vehicles Other vehicles
The total number of vehicles being registered for the first time has increased from about 414 thousand a year in 1951 to peak of over 3.2 million vehicles a year in the early 2000s. The number dipped to just under 2.4 million in 2011, 1.5 per cent lower than in 2010, and only marginally higher than in 2009, which was the lowest year since 1996.
Most of the increase in new registrations has been in the private and light good vehicles tax class. New registrations in the other tax classes have remained fairly steady with most years between 290 thousand and 440 thousand new vehicle registrations.
It is likely that the significant decrease in new registrations since 2008 was caused by the recession and the ongoing economic climate. New car and light van registrations were helped by the Vehicle Scrappage Scheme which ran between May 2009 and March 2010.
https://www.gov.uk/government/statistical-data-sets/tsgb09-vehicles 246

MOT Tests (Tables TSGB0908 to TSGB0912)
Road vehicle testing scheme (MOT) test results: 2000/01 to 2011/12 (Table TSGB0908)
0
5
10
15
20
25
30
2000/01 2001/02 2002/03 2003/04 2004/05 2005/06 2006/07 2007/08 2008/09 2009/10 2010/11 2011/12
MO
T te
sts
unde
rtak
en (m
illio
ns)
40%
50%
60%
70%
80%
90%
100%
Pass rate (%)
Tests taken Pass rate
As the number of licensed vehicles has increased, so too has the number of MOT tests undertaken. More than one test per valid vehicle is carried out a year as some vehicles fail their initial test, undergo rectification work, and are retested.
During the period 2000/01 to 2011/12 the overall pass rate stayed steady at around 70 per cent.
Over 28.5 million MOT tests were carried out in 2011/12. The vast majority of these (26.8 million) were of cars and other small passenger vehicles (up to 12 seats).
The most common reason for rejection (RfR) for cars was with the lighting and signalling system. In 2011/12 19 per cent of all car tests failed for this reason. Other common defects on cars include brakes, suspension and tyres. These defects tend to be the most common across the other vehicle types as well.
https://www.gov.uk/government/statistical-data-sets/tsgb09-vehicles 247
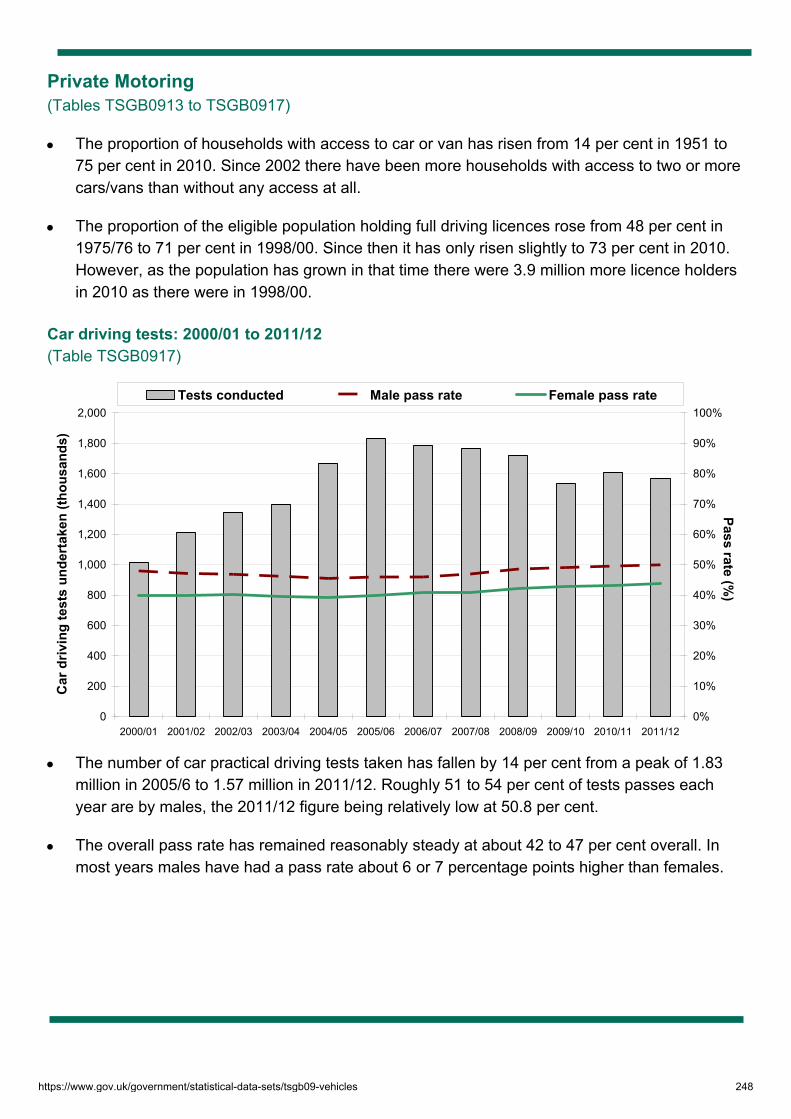
Private Motoring (Tables TSGB0913 to TSGB0917)
The proportion of households with access to car or van has risen from 14 per cent in 1951 to 75 per cent in 2010. Since 2002 there have been more households with access to two or more cars/vans than without any access at all.
The proportion of the eligible population holding full driving licences rose from 48 per cent in 1975/76 to 71 per cent in 1998/00. Since then it has only risen slightly to 73 per cent in 2010. However, as the population has grown in that time there were 3.9 million more licence holders in 2010 as there were in 1998/00.
Car driving tests: 2000/01 to 2011/12 (Table TSGB0917)
0
200
400
600
800
1,000
1,200
1,400
1,600
1,800
2,000
2000/01 2001/02 2002/03 2003/04 2004/05 2005/06 2006/07 2007/08 2008/09 2009/10 2010/11 2011/12
Car
driv
ing
test
s un
dert
aken
(tho
usan
ds)
0%
10%
20%
30%
40%
50%
60%
70%
80%
90%
100%
Pass rate (%)
Tests conducted Male pass rate Female pass rate
The number of car practical driving tests taken has fallen by 14 per cent from a peak of 1.83 million in 2005/6 to 1.57 million in 2011/12. Roughly 51 to 54 per cent of tests passes each year are by males, the 2011/12 figure being relatively low at 50.8 per cent.
The overall pass rate has remained reasonably steady at about 42 to 47 per cent overall. In most years males have had a pass rate about 6 or 7 percentage points higher than females.
https://www.gov.uk/government/statistical-data-sets/tsgb09-vehicles 248
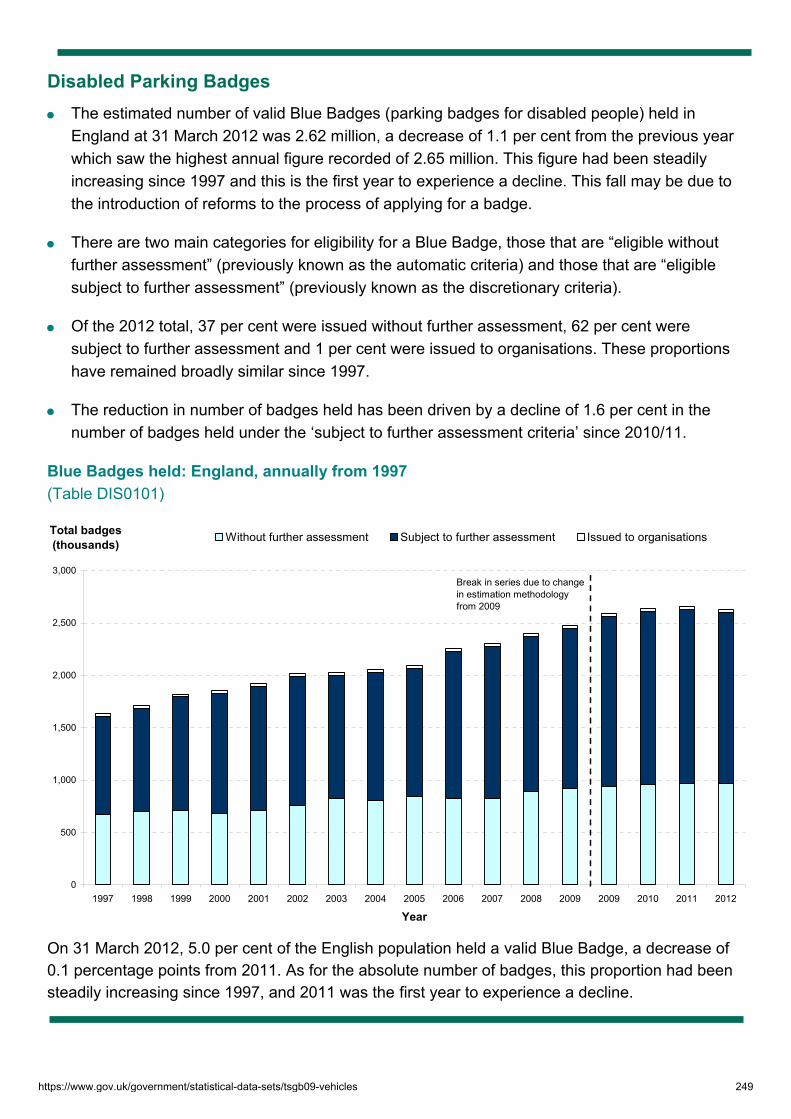
Disabled Parking Badges
The estimated number of valid Blue Badges (parking badges for disabled people) held in England at 31 March 2012 was 2.62 million, a decrease of 1.1 per cent from the previous year which saw the highest annual figure recorded of 2.65 million. This figure had been steadily increasing since 1997 and this is the first year to experience a decline. This fall may be due to the introduction of reforms to the process of applying for a badge.
There are two main categories for eligibility for a Blue Badge, those that are “eligible without further assessment” (previously known as the automatic criteria) and those that are “eligible subject to further assessment” (previously known as the discretionary criteria).
Of the 2012 total, 37 per cent were issued without further assessment, 62 per cent were subject to further assessment and 1 per cent were issued to organisations. These proportions have remained broadly similar since 1997.
The reduction in number of badges held has been driven by a decline of 1.6 per cent in the number of badges held under the ‘subject to further assessment criteria’ since 2010/11.
Blue Badges held: England, annually from 1997 (Table DIS0101)
0
500
1,000
1,500
2,000
2,500
3,000
1997 1998 1999 2000 2001 2002 2003 2004 2005 2006 2007 2008 2009 2009 2010 2011 2012
Year
Total badges (thousands) Without further assessment Subject to further assessment Issued to organisations
Break in series due to change in estimation methodology from 2009
On 31 March 2012, 5.0 per cent of the English population held a valid Blue Badge, a decrease of 0.1 percentage points from 2011. As for the absolute number of badges, this proportion had been steadily increasing since 1997, and 2011 was the first year to experience a decline.
https://www.gov.uk/government/statistical-data-sets/tsgb09-vehicles 249

Detailed statistics (tables and charts) on “vehicle statistics” can be found at https://www.gov.uk/government/organisations/department-for-transport/about/statistics.
Background notes 1. Full guidance on the methods used to compile these statistics and their sources can be found in the TSGB
‘notes and definitions’ here https://www.gov.uk/government/organisations/department-for-transport/series/transport-statistics-great-britain.
2. Further information about the data used to compile the vehicle licensing tables can be found in the ‘technical information’ section here: https://www.gov.uk/government/organisations/department-for-transport/series/vehicle-licensing-statistics
3. Further information about the data used to compile the tables from the National Travel Survey can be found in the ‘technical information’ section here: https://www.gov.uk/government/organisations/department-for-transport/series/national-travel-survey-statistics
4. Further information about the data and methods used to compile the Blue Badge statistics can be found in the ‘technical information’ section here: https://www.gov.uk/government/organisations/department-for-transport/series/disabled-parking-badges-statistics
https://www.gov.uk/government/statistical-data-sets/tsgb09-vehicles 250

Department for Transport statisticsVehicle Licensing Statistics (https://www.gov.uk/government/organisations/department-for-transport/series/vehicle-licensing-statistics)
Table VEH0103 (TSGB0901)
Licensed vehicles by tax class, Great Britain, annually1: 1909 to 2011 Thousands
Year Private cars Other vehicles
Goods vehicles
2,3,4
Motor Cycles, Scooters and
mopeds Buses 5
Special machines
etc 6,9
Other
vehicles 7
Crown and exempt
vehicles 8,9 Total
1909 30 36 24 . . . 1431920 101 228 75 . . . 5911930 349 712 101 15 15 24 2,2721939 488 418 90 31 3 84 3,1481946 560 449 105 146 16 61 3,1071950 1,979 439 439 643 123 262 24 61 3,970
1951 2,095 457 451 725 123 250 26 63 4,1901952 2,221 477 450 812 119 270 29 86 4,4641953 2,446 516 446 889 105 289 30 88 4,8091954 2,733 566 450 977 97 307 32 88 5,2501955 3,109 633 462 1,076 92 326 35 89 5,822
1956 3,437 685 471 1,137 89 336 37 95 6,2871957 3,707 723 473 1,261 87 355 41 96 6,7431958 4,047 772 461 1,300 86 367 46 96 7,1751959 4,416 824 473 1,479 83 383 55 96 7,8091960 4,900 894 493 1,583 84 392 65 101 8,512
1961 5,296 944 508 1,577 82 400 76 106 8,9891962 5,776 1,002 512 1,567 84 401 83 107 9,5321963 6,462 1,092 535 1,546 86 242 88 115 10,3361964 7,190 1,184 551 1,534 86 239 90 120 11,1761965 7,732 1,240 584 1,420 86 417 91 127 11,697
1966 8,210 1,283 577 1,239 85 399 87 142 12,0221967 8,882 1,358 593 1,190 85 416 89 147 12,7601968 9,285 1,388 580 1,082 89 409 92 157 13,0821969 9,672 1,408 547 993 92 398 90 162 13,3621970 9,971 1,421 545 923 93 385 89 121 13,548
1971 10,443 1,452 542 899 96 380 92 126 14,0301972 11,006 1,498 525 866 95 371 95 128 14,5841973 11,738 1,559 540 887 96 373 97 137 15,4271974 11,917 1,547 539 918 96 380 96 149 15,6421975 12,526 1,592 553 1,077 105 384 108 166 16,511
1976 13,184 1,626 563 1,175 110 387 117 156 17,3181977 13,220 1,591 559 1,190 110 393 115 167 17,3451978 13,626 1,597 549 1,194 110 394 111 177 17,7581979 14,162 1,623 561 1,292 111 402 106 359 18,6161980 14,660 1,641 507 1,372 110 397 100 412 19,199
1981 14,867 1,623 489 1,371 110 365 95 427 19,347
1982 15,264 1,624 477 1,370 111 371 91 454 19,7621983 15,543 1,692 488 1,290 113 376 86 621 20,2091984 16,055 1,752 490 1,225 116 375 82 670 20,7651985 16,454 1,805 485 1,148 120 374 78 695 21,159
1986 16,981 1,880 484 1,065 125 371 73 720 21,6991987 17,421 1,952 485 978 129 374 68 744 22,1521988 18,432 2,096 502 912 132 383 83 761 23,3021989 19,248 2,199 505 875 122 384 77 785 24,1961990 19,742 2,247 482 833 115 375 71 807 24,673
1991 19,737 2,215 449 750 109 346 65 840 24,5111992 19,870 2,198 432 684 107 324 59 903 24,5771993 20,102 2,187 428 650 107 318 55 979 24,8261994 20,479 2,192 434 630 107 309 50 1,030 25,2311995 20,505 2,217 421 594 74 274 116 1,169 25,369
1996 21,166.1 2,250.8 412.8 608.5 76.7 253.8 109.6 1,423.5 26,301.91997 21,677.6 2,305.1 414.0 626.0 78.6 249.0 101.1 1,522.4 26,973.81998 22,114.7 2,362.0 412.4 683.9 80.1 243.1 83.9 1,558.1 27,538.41999 22,784.6 2,427.3 414.6 759.6 83.7 241.3 83.3 1,573.3 28,367.62000 23,196.1 2,469.5 417.5 825.2 86.3 241.8 80.1 1,581.0 28,897.6
2001 23,898.8 2,543.8 422.0 881.7 88.6 239.3 78.1 1,594.8 29,747.12002 24,543.4 2,621.8 425.2 941.0 92.3 . 78.3 1,854.6 30,556.72003 24,984.7 2,730.1 425.9 1,004.7 96.1 . 79.1 1,886.7 31,207.42004 25,753.8 2,900.4 434.1 1,059.9 99.9 . 81.5 1,929.3 32,258.92005 26,207.7 3,018.6 432.9 1,075.0 103.0 . 81.9 1,978.2 32,897.4
2006 26,289.8 3,096.3 431.1 1,079.8 103.9 . 81.3 1,988.3 33,070.52007 26,653.4 3,218.9 431.8 1,118.4 106.3 . 82.4 2,039.8 33,651.02008 26,793.8 3,253.4 416.3 1,143.8 107.9 . 80.0 2,088.0 33,883.42009 26,856.5 3,241.0 397.2 1,143.2 108.5 . 75.4 2,136.6 33,958.4
2010 27,017.9 3,258.4 389.8 1,102.3 108.5 . 73.9 2,169.4 34,120.12011 27,039.6 3,293.5 383.9 1,104.9 107.2 . 74.2 2,225.2 34,228.6
1. The annual vehicle census of licensed vehicles has been taken as follows: 1903-1910 at 31 December; 1911-1920 at 31 March; 1921-1925 for the highest quarter; 1926-1938 at 30 September; 1939-1945 at 31 August; 1946-1976 at 30 September; 1977 census results are estimates; 1978 onward at 31 December.2. For years up to 1990, counts within these new taxation classes have been estimated. 3. Includes agricultural vans and lorries, showmen's goods vehicles licensed to draw trailers.4. Excludes electric goods vehicles which are now exempt from licence duty.5. Prior to 1995 this tax class was called 'Public Transport' and taxis and Hackney Carriages were included. Prior to 1969, tram cars were also included.6. Includes agricultural tractors, combine harvesters, mowing machines, digging machines, mobile cranes and works trucks.7. Includes three-wheelers, showmen's haulage and recovery vehicles.8. Includes electric vehicles which during this period were exempt from licence duty and personal and direct export vehicles.9. Special Machines became part of the 'Crown and Exempt' taxation class with effect from January 2002.
Telephone: 020 7944 3077 Source: DVLA/DfTEmail : [email protected] Last updated:: 12 April 2012Notes and definitions (https://www.gov.uk/government/organisations/department-for-transport/series/vehicle-licensing-statistics) Next update: April 2013
2,0341,770
Private and light goods2
53187
1,056
https://www.gov.uk/government/statistical-data-sets/tsgb09-vehicles 251

Department for Transport statisticsVehicle Licensing Statistics (https://www.gov.uk/government/organisations/department-for-transport/series/vehicle-licensing-statistics)
Table VEH0153 (TSGB0902)Motor vehicles registered for the first time by tax class: Great Britain, annually: 1954 to 2011
Thousands
Year Private cars1
Other
vehicles1Goods
vehicles Motor cycles, scooters
and mopeds Buses 2
Special machines
etc 5
Other vehicles 3,4,5 Total
1954 109.6 164.6 5.5 35.2 17.1 718.41955 153.5 185.2 5.6 39.2 22.1 906.5
1956 148.0 142.8 5.1 31.9 23.3 750.81957 140.5 206.1 5.0 39.8 19.9 836.71958 172.6 182.7 4.9 47.2 18.9 981.61959 191.7 331.8 5.1 49.0 29.7 1,252.91960 225.9 256.7 6.4 42.5 32.9 1,369.4
1961 220.2 212.4 6.1 46.4 31.4 1,259.31962 192.3 140.2 5.5 42.8 26.7 1,192.21963 206.4 165.5 6.4 47.9 31.2 1,466.01964 229.3 205.1 6.5 46.1 33.6 1,711.21965 229.4 150.9 6.8 45.4 45.7 1,600.7
1966 227.2 109.4 6.8 48.4 36.4 1,493.61967 221.5 137.7 6.5 53.9 38.9 1,575.21968 231.7 112.0 7.1 57.0 37.2 1,561.91969 1 239.6 85.4 7.1 49.3 33.0 1,401.81969 1 93.8 85.4 7.1 49.3 33.0 1,401.81970 85.2 104.9 7.7 48.8 30.2 1,524.9
1971 74.2 127.9 9.5 37.9 30.0 1,741.61972 74.9 152.5 9.8 47.6 44.1 2,183.71973 82.7 193.6 10.0 49.7 43.0 2,230.31974 68.0 189.8 7.8 45.6 39.6 1,750.41975 67.0 264.8 7.8 48.5 44.6 1,749.9
1976 63.9 270.6 8.7 51.8 41.2 1,838.01977 68.8 251.3 8.8 48.3 39.8 1,862.01978 79.8 225.3 9.1 50.0 41.4 2,151.41979 91.3 285.9 9.1 47.7 44.4 2,369.91980 1 74.7 312.7 8.8 36.7 43.5 2,155.61980 1 54.9 312.7 8.8 36.7 43.5 2,155.8
1981 39.9 271.9 7.5 32.6 34.8 2,030.31982 41.2 231.6 7.1 41.2 39.6 2,103.91983 46.6 174.5 7.3 42.1 47.9 2,307.51984 49.6 145.2 7.2 40.1 64.2 2,238.91985 51.7 125.8 6.8 40.1 55.4 2,309.3
1986 51.4 106.4 8.9 34.8 61.5 2,333.71987 54.0 90.8 8.7 37.7 70.1 2,473.91988 63.4 90.1 9.2 45.2 78.6 2,723.51989 64.5 97.3 8.0 42.5 81.4 2,828.91990 44.4 94.4 7.4 34.2 78.4 2,438.7
1991 28.6 76.5 5.2 26.1 76.6 1,921.51992 28.7 65.6 5.1 24.1 83.9 1,901.81993 32.8 58.4 5.4 30.0 93.8 2,073.91994 41.1 64.6 4.2 35.3 109.7 2,249.01995 48.0 68.9 5.2 33.3 127.1 2,306.5
1996 45.5 89.6 6.5 25.7 149.5 2,410.11997 41.8 121.7 6.6 21.7 161.7 2,597.71998 49.0 144.0 7.0 15.0 157.0 2,740.01999 48.0 168.0 8.0 25.0 174.0 2,766.02000 50.0 183.0 8.0 24.0 176.0 2,871.0
2001 2,431.8 277.9 48.6 177.1 6.8 26.8 168.8 3,137.72002 2,528.8 286.8 44.9 162.2 7.8 . 199.0 3,229.02003 2,497.1 323.5 48.4 157.3 8.4 . 197.1 3,231.92004 2,437.4 347.3 48.0 133.7 8.3 . 210.7 3,185.42005 2,266.3 337.2 51.2 132.3 8.9 . 225.5 3,021.4
2006 2,160.7 338.4 47.9 131.9 7.6 . 227.1 2,913.62007 2,191.5 347.8 41.1 143.0 9.0 . 264.6 2,996.92008 1,891.9 296.4 47.0 138.4 8.3 . 290.2 2,672.22009 1,765.5 193.5 27.0 111.5 7.2 . 266.3 2,371.22010 1,765.3 229.3 27.0 97.1 6.4 . 292.7 2,417.8
2011 1,663.8 264.8 36.9 96.2 5.8 . 314.0 2,381.5
1. Figures for 1969 to 1979 are estimated using the October 1982 tax classes. Figures for 1951 to 1969 refer to earlier classes. From 1980 onwards figures refer to the October 1990 taxation classes. Figures for 1969 and 1980 are given twice, once for the tax regime before and once for the tax regime afterwards. 2. Prior to 1995 this tax class was called 'Public Transport' and taxis and Hackney Carriages were included. Prior to 1969, tram cars were also included.3. Includes crown and exempt vehicles, three wheelers, pedestrian controlled vehicles and showmen's goods vehicles.4. Excludes vehicles officially registered by the armed forces.5. Special Machines became part of the 'Crown and Exempt' taxation class with effect from January 2002. Source: DVLA/DfT
Last updated:: 12 April 2012Telephone: 020 7944 3077 Next update: April 2013Email : [email protected] and definitions (https://www.gov.uk/government/organisations/department-for-transport/series/vehicle-licensing-statistics)
Private and light goods1
386.4500.9
399.7425.4555.3645.6805.0
742.8784.7
1,008.6
1,122.51,190.6
1,065.41,116.71,116.9987.4
1,133.21,248.1
1,462.11,854.81,851.31,399.61,317.2
1,401.81,445.01,745.81,891.51,679.21,699.2
1,643.61,745.51,989.11,932.62,029.5
2,070.72,212.62,437.02,535.22,179.9
1,708.51,694.41,853.41,991.72,024.0
2,430.0
2,093.32,244.32,367.02,342.0
https://www.gov.uk/government/statistical-data-sets/tsgb09-vehicles 252

Department for Transport statisticsVehicle Licensing Statistics (https://www.gov.uk/government/organisations/department-for-transport/series/vehicle-licensing-statistics)
Table VEH0102 (TSGB0903)
Licensed vehicles by body type, Great Britain, annually1: 1994 to 2011
Thousands
Year Cars Motor cycles Light goods Heavy goodsBuses and
coaches
Other
vehicles 2 Total
1994 21,199.2 720.9 2,137.7 420.9 153.7 598.9 25,231.5
1995 21,394.1 702.5 2,122.8 422.9 153.5 573.6 25,369.41996 22,237.5 738.8 2,173.9 429.9 157.6 564.2 26,301.91997 22,831.7 752.4 2,231.2 436.0 160.7 561.8 26,973.81998 23,293.3 813.8 2,278.0 440.8 161.3 551.1 27,538.41999 23,974.9 889.4 2,342.2 459.2 168.1 533.8 28,367.6
2000 24,405.5 953.7 2,382.6 471.5 172.6 511.7 28,897.62001 25,125.9 1,010.0 2,461.4 477.5 171.6 500.8 29,747.12002 25,781.9 1,070.0 2,542.3 485.4 173.0 504.0 30,556.72003 26,240.4 1,134.7 2,652.9 491.1 174.7 513.5 31,207.42004 27,028.1 1,191.2 2,822.4 505.8 177.7 533.7 32,258.9
2005 27,520.4 1,206.4 2,943.4 508.2 178.4 540.6 32,897.42006 27,609.2 1,209.6 3,023.1 508.3 177.0 543.4 33,070.52007 28,000.3 1,248.3 3,148.9 510.8 176.9 565.7 33,651.02008 28,160.7 1,274.6 3,191.4 495.9 175.5 585.3 33,883.42009 28,246.5 1,275.6 3,184.5 477.8 173.7 600.3 33,958.4
2010 28,420.9 1,234.4 3,207.8 470.1 171.2 615.8 34,120.12011 28,467.3 1,238.3 3,248.3 465.5 168.1 641.2 34,228.61. As at 31st December2. Includes rear diggers, lift trucks, rollers, ambulances, Hackney Carriages, three wheelers and agricultural vehicles
Source: DVLA/DfTTelephone: 020 7944 3077 Last updated:: 12 April 2012Email : [email protected] Next update: April 2013
Notes and definitions (https://www.gov.uk/government/organisations/department-for-transport/series/vehicle-licensing-statistics)
https://www.gov.uk/government/statistical-data-sets/tsgb09-vehicles 253
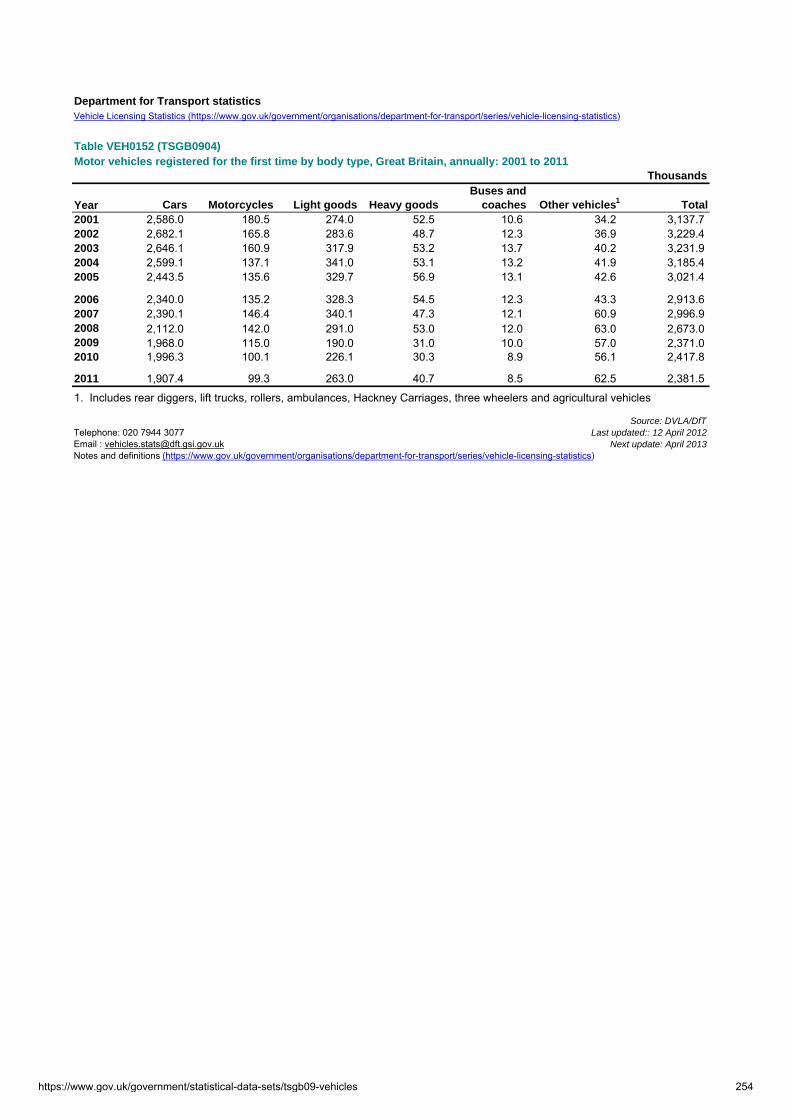
Department for Transport statistics
Table VEH0152 (TSGB0904)Motor vehicles registered for the first time by body type, Great Britain, annually: 2001 to 2011
Thousands
Year Cars Motorcycles Light goods Heavy goodsBuses and
coaches Other vehicles1 Total2001 2,586.0 180.5 274.0 52.5 10.6 34.2 3,137.72002 2,682.1 165.8 283.6 48.7 12.3 36.9 3,229.42003 2,646.1 160.9 317.9 53.2 13.7 40.2 3,231.92004 2,599.1 137.1 341.0 53.1 13.2 41.9 3,185.42005 2,443.5 135.6 329.7 56.9 13.1 42.6 3,021.4
2006 2,340.0 135.2 328.3 54.5 12.3 43.3 2,913.62007 2,390.1 146.4 340.1 47.3 12.1 60.9 2,996.92008 2,112.0 142.0 291.0 53.0 12.0 63.0 2,673.02009 1,968.0 115.0 190.0 31.0 10.0 57.0 2,371.02010 1,996.3 100.1 226.1 30.3 8.9 56.1 2,417.8
2011 1,907.4 99.3 263.0 40.7 8.5 62.5 2,381.5
1. Includes rear diggers, lift trucks, rollers, ambulances, Hackney Carriages, three wheelers and agricultural vehicles
Source: DVLA/DfTTelephone: 020 7944 3077 Last updated:: 12 April 2012Email : [email protected] Next update: April 2013Notes and definitions (https://www.gov.uk/government/organisations/department-for-transport/series/vehicle-licensing-statistics)
Vehicle Licensing Statistics (https://www.gov.uk/government/organisations/department-for-transport/series/vehicle-licensing-statistics)
https://www.gov.uk/government/statistical-data-sets/tsgb09-vehicles 254

Department for Transport statistics
Table VEH0203 (TSGB0905)Cars licensed by propulsion/fuel type, Great Britain, annually: 1994 to 2011
Thousands/Percentages
Year Petrol Diesel Gas1Electric
Hybrid Electric Other2
Total
Total number of cars1994 19,620.9 1,576.2 1.8 0.1 0.0 0.2 21,199.2
1995 19,499.8 1,891.3 2.9 0.1 0.0 0.1 21,394.11996 20,051.6 2,181.6 4.1 0.1 0.0 0.1 22,237.51997 20,384.7 2,440.5 6.2 0.1 0.0 0.1 22,831.71998 20,590.5 2,692.9 9.6 0.2 0.0 0.1 23,293.31999 21,031.0 2,929.9 13.8 0.2 0.0 0.1 23,974.9
2000 21,232.6 3,152.7 20.0 0.2 - - 24,405.52001 21,641.1 3,459.5 24.4 0.3 0.6 0.1 25,125.92002 21,839.5 3,912.4 28.8 0.3 0.9 0.1 25,781.92003 21,805.5 4,399.6 33.7 0.3 1.2 0.1 26,240.42004 21,976.6 5,010.6 37.6 0.4 2.8 0.1 27,028.1
2005 21,876.0 5,596.1 39.5 0.6 8.1 0.1 27,520.42006 21,465.8 6,083.3 42.4 0.8 16.6 0.2 27,609.22007 21,264.4 6,657.4 45.1 1.2 31.8 0.3 28,000.32008 20,899.1 7,163.5 49.6 1.3 46.7 0.4 28,160.72009 20,491.2 7,641.4 50.9 1.5 61.1 0.4 28,246.52010 20,083.1 8,202.7 51.0 1.5 82.1 0.5 28,420.9
2011 19,548.5 8,763.5 50.0 2.6 102.3 0.4 28,467.3
Percentage of cars1994 92.6 7.4 - - 0.0 - 100.0
1995 91.1 8.8 - - 0.0 - 100.01996 90.2 9.8 - - 0.0 - 100.01997 89.3 10.7 - - 0.0 - 100.01998 88.4 11.6 - - 0.0 - 100.01999 87.7 12.2 0.1 - 0.0 - 100.0
2000 87.0 12.9 0.1 - - - 100.02001 86.1 13.8 0.1 - - - 100.02002 84.7 15.2 0.1 - - - 100.02003 83.1 16.8 0.1 - - - 100.02004 81.3 18.5 0.1 - - - 100.0
2005 79.5 20.3 0.1 - - - 100.02006 77.7 22.0 0.2 - 0.1 - 100.02007 75.9 23.8 0.2 - 0.1 - 100.02008 74.2 25.4 0.2 - 0.2 - 100.02009 72.5 27.1 0.2 - 0.2 - 100.02010 70.7 28.9 0.2 - 0.3 - 100.02011 68.7 30.8 0.2 - 0.4 - 100.01. Includes gas, gas bi-fuel, petrol/gas and gas-diesel2. Includes vehicles propelled by steam
Source: DVLA/DfTTelephone: 020 7944 3077 Last updated:: 12 April 2012Email : [email protected] Next update: April 2013Notes and definitions (https://www.gov.uk/government/organisations/department-for-transport/series/vehicle-licensing-statistics)
Vehicle Licensing Statistics (https://www.gov.uk/government/organisations/department-for-transport/series/vehicle-licensing-statistics)
https://www.gov.uk/government/statistical-data-sets/tsgb09-vehicles 255

Dep
artm
ent
for
Tra
nsp
ort
sta
tist
ics
Veh
icle
Lic
ensi
ng S
tatis
tics
(http
s://w
ww
.gov
.uk/
gove
rnm
ent/o
rgan
isat
ions
/dep
artm
ent-f
or-tr
ansp
ort/s
erie
s/ve
hicl
e-lic
ensi
ng-s
tatis
tics)
Tab
le V
EH
0204
(T
SG
B09
06)
Lic
ense
d c
ars,
by
reg
ion
, Gre
at B
rita
in, a
nn
ual
ly:
199
4 to
201
1Th
ousa
nds/
Per
cent
ages
Yea
rN
ort
h E
ast
No
rth
Wes
tY
ork
s &
H
um
ber
Eas
t M
idla
nd
sW
est
Mid
lan
ds
Eas
tL
on
do
nS
ou
th E
ast
So
uth
Wes
tW
ales
Sco
tlan
dN
ot
kno
wn
Gre
at
Bri
tain
Nu
mb
er o
f ca
rs
1994
741.
72,
364.
31,
625.
01,
529.
22,
060.
02,
165.
62,
266.
23,
287.
41,
969.
91,
006.
41,
588.
759
4.7
21,1
99.2
1995
751.
02,
388.
21,
646.
01,
547.
52,
094.
02,
211.
02,
260.
83,
323.
01,
990.
41,
017.
41,
609.
455
5.4
21,3
94.1
1996
781.
62,
495.
11,
704.
01,
606.
92,
176.
92,
293.
32,
336.
83,
464.
52,
105.
21,
067.
31,
678.
252
7.6
22,2
37.5
1997
799.
92,
586.
91,
761.
71,
655.
12,
279.
32,
371.
62,
340.
83,
589.
12,
157.
91,
100.
71,
730.
145
8.5
22,8
31.7
1998
823.
42,
647.
01,
804.
91,
699.
42,
288.
02,
428.
72,
371.
23,
708.
82,
229.
61,
131.
41,
778.
038
2.9
23,2
93.3
1999
843.
12,
692.
71,
857.
91,
741.
62,
319.
92,
492.
72,
402.
83,
813.
82,
307.
81,
169.
31,
826.
950
6.5
23,9
74.9
2000
866.
92,
755.
91,
908.
41,
813.
82,
391.
42,
570.
32,
415.
93,
910.
22,
382.
01,
169.
81,
876.
034
5.1
24,4
05.5
2001
893.
02,
820.
01,
931.
51,
863.
02,
478.
62,
639.
82,
461.
74,
006.
52,
447.
01,
217.
01,
938.
842
8.9
25,1
25.9
2002
921.
92,
875.
92,
000.
01,
926.
62,
562.
32,
694.
52,
473.
74,
103.
12,
494.
61,
269.
41,
993.
546
6.5
25,7
81.9
2003
947.
92,
941.
72,
039.
41,
964.
92,
612.
12,
711.
12,
480.
04,
162.
62,
523.
01,
305.
22,
031.
052
1.5
26,2
40.4
2004
981.
73,
056.
32,
110.
32,
001.
22,
675.
22,
757.
02,
523.
14,
248.
02,
570.
91,
357.
02,
076.
867
0.6
27,0
28.1
2005
1,00
5.9
3,14
1.0
2,16
1.6
2,06
4.6
2,72
3.9
2,81
2.5
2,56
1.9
4,34
4.6
2,61
1.8
1,39
2.1
2,13
9.2
561.
327
,520
.420
061,
009.
63,
178.
52,
162.
92,
070.
72,
673.
12,
817.
52,
560.
14,
374.
42,
618.
01,
399.
92,
156.
858
7.7
27,6
09.2
2007
1,02
4.1
3,19
6.6
2,20
4.2
2,10
9.9
2,71
5.9
2,85
4.4
2,57
8.9
4,43
6.6
2,65
5.2
1,42
0.2
2,20
0.8
603.
528
,000
.320
081,
035.
53,
201.
42,
238.
82,
142.
02,
734.
32,
875.
62,
594.
74,
488.
22,
686.
01,
429.
02,
233.
250
1.9
28,1
60.7
2009
1,03
7.9
3,16
2.1
2,23
8.1
2,14
6.2
2,72
1.4
2,89
6.1
2,55
6.7
4,55
1.6
2,71
8.3
1,42
9.0
2,24
8.5
540.
428
,246
.5
2010
1,03
7.2
3,08
3.7
2,24
1.7
2,15
6.9
2,74
4.3
2,92
1.0
2,55
7.4
4,60
5.6
2,75
0.3
1,43
3.3
2,25
4.5
635.
028
,420
.920
111,
040.
13,
006.
52,
248.
92,
166.
52,
823.
82,
944.
32,
542.
74,
605.
92,
789.
01,
437.
52,
264.
459
7.6
28,4
67.3
Per
cen
tag
e o
f C
ars
1994
3.5
11.2
7.7
7.2
9.7
10.2
10.7
15.5
9.3
4.7
7.5
2.8
100.
0
1995
3.5
11.2
7.7
7.2
9.8
10.3
10.6
15.5
9.3
4.8
7.5
2.6
100.
019
963.
511
.27.
77.
29.
810
.310
.515
.69.
54.
87.
52.
410
0.0
1997
3.5
11.3
7.7
7.2
10.0
10.4
10.3
15.7
9.5
4.8
7.6
2.0
100.
019
983.
511
.47.
77.
39.
810
.410
.215
.99.
64.
97.
61.
610
0.0
1999
3.5
11.2
7.7
7.3
9.7
10.4
10.0
15.9
9.6
4.9
7.6
2.1
100.
0
2000
3.6
11.3
7.8
7.4
9.8
10.5
9.9
16.0
9.8
4.8
7.7
1.4
100.
020
013.
611
.27.
77.
49.
910
.59.
815
.99.
74.
87.
71.
710
0.0
https://www.gov.uk/government/statistical-data-sets/tsgb09-vehicles 256

Lic
ense
d c
ars,
by
reg
ion
, Gre
at B
rita
in, a
nn
ual
ly:
199
4 to
201
1Th
ousa
nds/
Per
cent
ages
2002
3.6
11.2
7.8
7.5
9.9
10.5
9.6
15.9
9.7
4.9
7.7
1.8
100.
020
033.
611
.27.
87.
510
.010
.39.
515
.99.
65.
07.
72.
010
0.0
2004
3.6
11.3
7.8
7.4
9.9
10.2
9.3
15.7
9.5
5.0
7.7
2.5
100.
0
2005
3.7
11.4
7.9
7.5
9.9
10.2
9.3
15.8
9.5
5.1
7.8
2.0
100.
020
063.
711
.57.
87.
59.
710
.29.
315
.89.
55.
17.
82.
110
0.0
2007
3.7
11.4
7.9
7.5
9.7
10.2
9.2
15.8
9.5
5.1
7.9
2.2
100.
020
083.
711
.48.
07.
69.
710
.29.
215
.99.
55.
17.
91.
810
0.0
2009
3.7
11.2
7.9
7.6
9.6
10.3
9.1
16.1
9.6
5.1
8.0
1.9
100.
0
2010
3.6
10.9
7.9
7.6
9.7
10.3
9.0
16.2
9.7
5.0
7.9
2.2
100.
020
113.
710
.67.
97.
69.
910
.38.
916
.29.
85.
08.
02.
110
0.0
Tele
phon
e: 0
20 7
944
3077
Sou
rce:
DV
LA/D
fTE
mai
l : v
ehic
les.
stat
s@d
ft.g
si.g
ov.
uk
Last
upd
ated
:: 12
Apr
il 20
12N
ext u
pdat
e: A
pril
2013
Not
es &
def
initi
ons
(http
s://w
ww
.gov
.uk/
gove
rnm
ent/o
rgan
isat
ions
/dep
artm
ent-f
or-tr
ansp
ort/s
erie
s/ve
hicl
e-lic
ensi
ng-s
https://www.gov.uk/government/statistical-data-sets/tsgb09-vehicles 257

Department for Transport statisticsVehicle Licensing Statistics (https://www.gov.uk/government/organisations/department-for-transport/series/vehicle-licensing-statistics)
Table VEH0506 (TSGB0907)Licensed heavy goods vehicles by weight (tonnes), Great Britain, annually: 1994 to 2011
Thousands/Percentages3.5 to 7 t over 7 to 8 t over 8 to 18 t over 18 to 31 t over 31 to 41 t over 41 t Total Avg weight (t)
Thousands
1994 37.0 133.5 115.0 56.9 77.9 0.7 420.9 17.5
1995 38.7 134.0 110.7 55.4 82.8 1.2 422.9 17.71996 41.3 137.2 108.9 54.0 86.9 1.6 429.9 17.71997 41.4 139.9 106.9 54.0 91.5 2.3 436.0 17.91998 41.6 143.9 103.9 54.4 93.7 3.3 440.8 18.01999 42.3 150.1 105.9 58.0 101.2 1.6 459.2 18.3
2000 40.7 154.5 104.9 60.2 105.7 5.4 471.5 18.72001 39.8 155.5 104.0 61.1 92.0 25.1 477.5 19.22002 40.0 157.4 103.6 61.4 82.9 40.2 485.4 19.52003 41.6 158.5 102.5 61.7 75.2 51.7 491.1 19.72004 44.2 162.7 103.2 63.0 69.7 63.0 505.8 19.9
2005 46.0 161.8 102.8 62.7 64.9 69.9 508.2 20.02006 47.2 159.7 101.6 63.3 61.3 75.3 508.3 20.12007 49.0 157.0 101.4 63.3 59.9 80.2 510.8 20.32008 50.2 149.3 97.7 62.1 56.1 80.6 495.9 20.32009 51.0 141.1 94.3 60.3 51.8 79.3 477.8 20.3
2010 51.2 134.9 93.1 59.2 49.9 81.8 470.1 20.52011 51.9 129.9 92.2 58.9 48.1 84.5 465.5 20.7
Percentages1994 8.8 31.7 27.3 13.5 18.5 0.2 100.0
1995 9.2 31.7 26.2 13.1 19.6 0.3 100.01996 9.6 31.9 25.3 12.6 20.2 0.4 100.01997 9.5 32.1 24.5 12.4 21.0 0.5 100.01998 9.4 32.6 23.6 12.3 21.3 0.7 100.01999 9.2 32.7 23.1 12.6 22.0 0.3 100.0
2000 8.6 32.8 22.3 12.8 22.4 1.2 100.02001 8.3 32.6 21.8 12.8 19.3 5.3 100.02002 8.2 32.4 21.3 12.6 17.1 8.3 100.02003 8.5 32.3 20.9 12.6 15.3 10.5 100.02004 8.7 32.2 20.4 12.5 13.8 12.5 100.0
2005 9.1 31.8 20.2 12.3 12.8 13.8 100.02006 9.3 31.4 20.0 12.5 12.1 14.8 100.02007 9.6 30.7 19.8 12.4 11.7 15.7 100.02008 10.1 30.1 19.7 12.5 11.3 16.2 100.02009 10.7 29.5 19.7 12.6 10.8 16.6 100.0
2010 10.9 28.7 19.8 12.6 10.6 17.4 100.02011 11.2 27.9 19.8 12.7 10.3 18.1 100.0
Source: DVLA/DfTTelephone: 020 7944 3077 Last updated:: 12 April 2012Email : [email protected] Next update: April 2013Notes and definitions (https://www.gov.uk/government/organisations/department-for-transport/series/vehicle-licensing-statistics)
https://www.gov.uk/government/statistical-data-sets/tsgb09-vehicles 258

Department for Tranport statisticsTransport Statistics Great Britain
Table TSGB0908Road vehicle testing scheme (MOT) test results: 2000/01 to 2011/12
Thousands/percentages
2000/01 2001/02 2002/03 2003/04 2004/05 2005/06 2006/07 1 2007/08 2008/09 2009/10 2010/11 2011/12Motorcycles: Tested 567.8 568.4 584.9 745.0 801.0 873.2 902.6 897.9 942.0 948.3 989.6 1,032.4
PRS2 48.5 57.9 70.9 76.1 79.2 85.5 Failed 112.9 113.1 108.2 134.0 166.5 164.1 115.9 118.7 124.7 126.1 126.2 130.5
Initial Failure Rate3 19.9 19.9 18.5 18.0 20.8 18.8 18.2 19.7 20.8 21.3 20.8 20.9
Final Failure Rate4 12.8 13.2 13.2 13.3 12.8 12.6
Cars and other passenger vehicles (up to 12 seats): Tested 22,775.0 22,768.0 22,781.0 22,509.0 20,695.0 22,665.0 24,416.9 24,912.5 25,537.7 26,047.5 26,637.5 26,827.4
PRS2 1,865.0 2,267.6 2,502.5 2,495.0 2,515.7 2,573.3 Failed 7,212.8 7,281.2 7,084.9 6,622.1 5,951.9 7,516.4 6,885.9 7,318.4 7,676.0 8,070.3 8,075.9 8,184.5
Initial Failure Rate3 31.7 32.0 31.1 29.4 28.8 33.2 35.8 38.5 39.9 40.6 39.8 40.1
Final Failure Rate4 28.2 29.4 30.1 31.0 30.3 30.5
Private passenger vehicles (more than 12 seats): Tested 27.0 28.0 27.0 44.00 30.0 46.4 49.4 48.7 49.6 49.5 49.2 48.3
PRS2 2.2 2.6 3.1 3.3 3.5 3.4 Failed 6.64 5.9 5.3 10.8 5.01 12.7 12.5 13.2 14.2 13.9 13.5 13.3
Initial Failure Rate3 24.6 21.0 19.5 24.6 17.0 27.5 29.7 32.4 34.9 34.7 34.5 34.5
Final Failure Rate4 25.4 27.0 28.7 28.1 27.4 27.5
Goods vehicles between 3,000 and 3,500 kg gross weight: Tested 283.0 284.0 376.0 495.0 634.0 437.4 495.3 520.7 541.3 563.8 602.1 608.1
PRS2 26.0 34.8 44.0 47.9 53.1 55.6 Failed 89.6 97.5 132.0 167.3 209.0 190.5 200.3 214.7 223.2 233.8 244.8 247.5
Initial Failure Rate3 35.9 34.4 35.1 33.8 33.0 43.6 45.7 47.9 49.3 50.0 49.5 49.8
Final Failure Rate4 40.4 41.2 41.2 41.5 40.7 40.7
All vehicles: Tested 23,652.8 23,648.4 23,768.9 23,793.0 22,160.0 24,022.0 25,864.2 26,379.9 27,070.6 27,609.1 28,278.3 28,516.2
PRS2 1,941.6 2,362.8 2,620.4 2,622.3 2,651.6 2,717.8 Failed 7,422.0 7,497.7 7,330.4 6,934.2 6,332.4 7,883.8 7,214.7 7,665.0 8,038.1 8,444.1 8,460.4 8,575.7
Initial Failure Rate3 31.4 31.7 30.8 29.1 28.6 32.8 35.4 38.0 39.4 40.1 39.3 39.6 Final Failure Rate4
27.9 29.1 29.7 30.6 29.9 30.1
1. MOT computerised figures are available from 2005/06 but computerisation was only phased in at the vehicle testing stations during that year. This results in the shortfall in volumes for 2005/06 in comparison to later years. Full records are available from 2006/07, and up to 2004/05 a 2% Sample Survey was used. Figures prior to 2006/07 are either incomplete or estimated and should be treated with caution.2. Pass after Rectification at the Station (PRS). This indicates that a vehicle initially failed its test. It was then repaired within one hour of the test, re-tested and passed.3. Initial Failure Rate = (PRS + Failures) / Total Tests 4. Final Failure Rate = Failures / Total Tests
Source: VOSATelephone: 0117 9543382 Last updated: November 2012
Next update: November 2013
This table is outside the scope of National Statistics
Email: [email protected]
https://www.gov.uk/government/statistical-data-sets/tsgb09-vehicles 259

Department for Tranport statisticsTransport Statistics Great Britain
Table TSGB0909Road vehicle testing scheme (MOT): percentage of tests with one or more Fail or PRS1 type RfRs2 in defect group: 2007/08 to 2011/12
Percentage2007/08 2008/09 2009/10 2010/11 2011/12
Motorcycles:
Motorcycle body and structure 0.9 1.0 1.0 0.9 1.0 Motorcycle brakes 5.8 5.9 5.8 5.3 5.1 Motorcycle drive system 1.2 1.4 1.5 1.4 1.4 Motorcycle driving controls 0.4 0.5 0.5 0.4 0.4 Motorcycle fuel and exhaust 1.7 1.7 1.6 1.4 1.3 Motorcycle lighting and signalling 10.8 11.5 11.8 10.8 11.0 Motorcycle reg plates and vin 1.0 1.4 1.9 1.5 1.4 Motorcycle sidecar - - - 0.0 0.0 Motorcycle steering and suspension 5.8 5.7 5.6 4.9 4.8 Motorcycle tyres and wheels 3.7 3.8 3.8 3.6 3.6
Cars and other passenger vehicles (up to 12 seats):
Body and structure 1.8 1.8 1.7 1.4 1.4 Brakes 12.9 12.8 12.9 10.7 10.4 Drivers view of the road 8.0 8.4 8.5 7.7 7.5 Driving controls - - - 0.0 0.0 Fuel and exhaust 7.2 6.9 6.7 5.5 5.2 Lighting and signalling 19.8 20.7 21.0 18.6 18.6 Reasons specific to motor tricycles and quadricycles - - - 0.0 0.0 Registration plates and VIN 1.4 1.5 1.7 1.2 1.0 Road wheels 0.4 0.4 0.4 0.4 0.4 Seat belts 1.9 1.9 2.0 1.7 1.5 Steering 2.9 2.9 3.1 3.2 3.5 Suspension 12.4 12.7 13.4 11.9 12.2 Towbars3 . . 0.1 0.1 0.1 Tyres 9.1 9.2 9.0 8.0 7.8
Private passenger vehicles (more than 12 seats):
Body and structure 5.4 5.5 5.3 4.6 4.6 Brakes 13.0 13.5 13.6 12.1 12.2 Drivers view of the road 6.0 6.4 6.5 6.5 6.2 Driving controls 1.0 2.3 1.5 1.1 1.0 Fuel and exhaust 4.7 4.6 4.3 3.6 3.7 Lighting and signalling 16.0 17.5 17.6 16.7 16.2 Reg plates and vin 0.5 1.1 1.1 0.8 0.6 Road wheels 0.1 0.1 0.1 0.1 0.1 Seat belts 8.1 8.3 8.1 7.1 6.5 Steering 3.3 3.6 3.8 3.6 4.1 Suspension 7.2 7.4 7.4 6.5 6.5 Towbars3 . . 0.2 0.2 0.1 Tyres 3.6 3.9 3.9 3.7 3.7
Goods vehicles between 3,000 and 3,500 kg gross weight:
Body and structure 6.2 6.1 5.8 4.8 4.4 Brakes 25.0 24.8 25.1 22.2 21.5 Drivers view of the road 13.1 13.3 13.1 12.1 11.3 Fuel and exhaust 8.4 7.8 7.2 5.8 5.3 Lighting and signalling 30.6 31.9 32.3 29.5 28.8 Reg plates and vin 2.4 2.5 2.6 1.9 1.6 Road wheels 0.4 0.4 0.4 0.3 0.3 Seat belts 4.6 4.7 4.5 3.6 3.1 Steering 6.4 6.1 6.4 7.0 7.5 Suspension 19.4 18.7 17.8 15.4 15.0 Towbars3 . . 0.5 0.4 0.3 Tyres 8.1 8.0 7.9 7.4 7.21. Pass after Rectification at the Station (PRS). This indicates that a vehicle initially failed its test. It was then repaired within one hour of the test, re-tested and passed.2. RfR = Reason for Rejection3. The testing of towbars only became part of the MOT test on 27 April 2009
Telephone: 0117 9543382 Source: VOSAEmail: [email protected] Last updated: November 2012
Next update: November 2013This table is outside the scope of National Statistics
https://www.gov.uk/government/statistical-data-sets/tsgb09-vehicles 260

Department for Tranport statisticsTransport Statistics Great Britain
Table TSGB0910Road passenger service vehicle testing scheme (PSV tests1), Great Britain: 1999/00 to 2011/12
Numbers/percentage
Year 1999/00 2000/01 2001/022 2002/03 2003/04 2004/05 2005/06 2006/07 2007/08 2008/09 2009/10 2010/11 2011/12First tests: Passed 67,219 67,016 65,899 65,458 67,528 67,425 69,270 69,447 70,777 73,003 73,864 74,109 72,894 Failed 11,216 11,583 14,290 14,515 13,832 13,045 12,086 12,237 11,046 10,725 9,204 8,805 8,534 Total tested 78,435 78,599 80,189 79,973 81,360 80,470 81,356 81,684 81,823 83,728 83,068 82,914 81,428Re-tests: Passed 10,417 10,533 13,207 13,731 13,067 11,608 10,148 10,043 11,072 10,874 9,259 8,732 8,305 Failed 980 1,053 1,265 1,318 1,197 1,076 847 880 889 851 652 545 532 Total tested 11,397 11,586 14,472 15,049 14,264 12,684 10,995 10,923 11,961 11,725 9,911 9,277 8,837Percentage failed: First test 14.3 14.7 17.8 18.1 17.0 16.2 14.9 15.0 13.5 12.8 11.1 10.6 10.5 Re-tests 8.6 9.1 8.7 8.8 8.4 8.5 7.7 8.1 7.4 7.3 6.6 5.9 6.0
All tests 13.6 13.97 16.4 16.7 15.7 15.2 14 14.2 12.72 12.1 10.6 10.1 10.0
1. EEC Directive 77/143 stipulated that all class VI (Public Service Vehicles) in use for more than one year must by 1 January 1983 have undergone a road-worthiness examination and be subject to an annual inspection thereafter. To meet this deadline, statutory testing of class VI vehicles commenced on 1 January 1982.2. Due to revisions of testing policy, from 2001/02 onwards fewer defects are now allowed to be rectified at the testing station, resulting in a decrease in passes, an increase in failures and an increase in re-tests.
Source: VOSATelephone: 0117-543382 Last updated: November 2012Email: [email protected] Next update: November 2013
This table is outside the scope of National Statistics
https://www.gov.uk/government/statistical-data-sets/tsgb09-vehicles 261
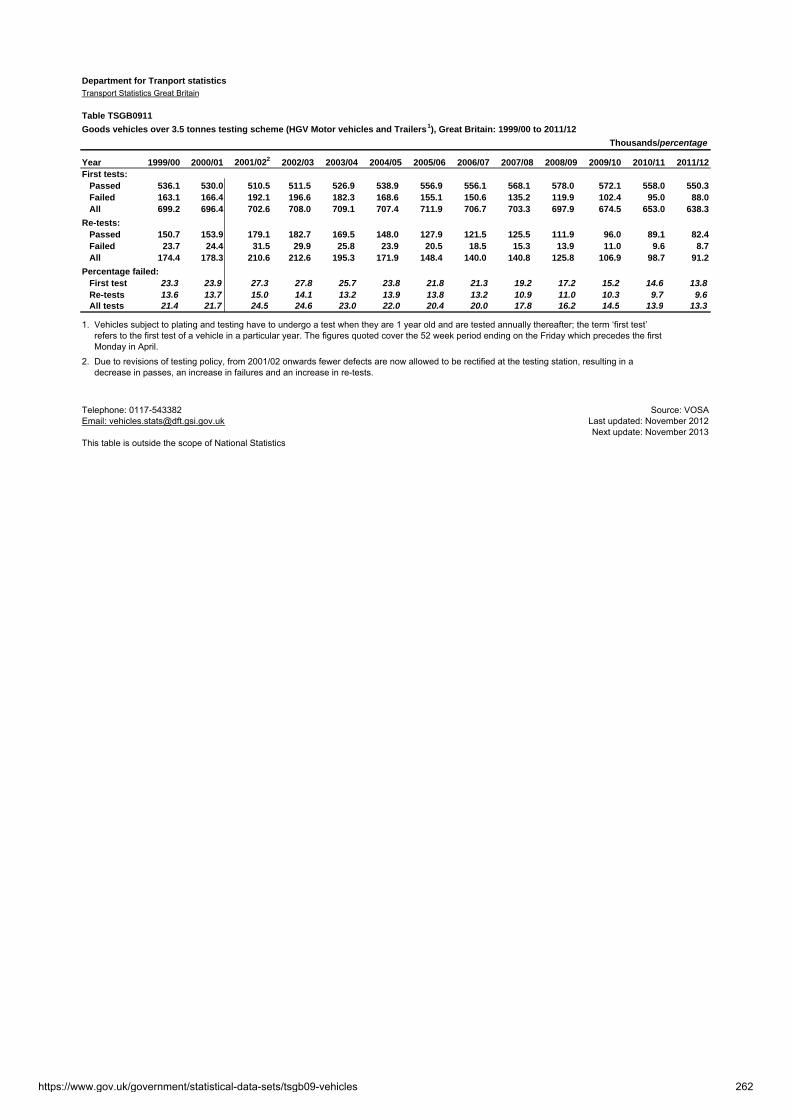
Department for Tranport statisticsTransport Statistics Great Britain
Table TSGB0911
Goods vehicles over 3.5 tonnes testing scheme (HGV Motor vehicles and Trailers1), Great Britain: 1999/00 to 2011/12
Thousands/percentage
Year 1999/00 2000/01 2001/022 2002/03 2003/04 2004/05 2005/06 2006/07 2007/08 2008/09 2009/10 2010/11 2011/12First tests: Passed 536.1 530.0 510.5 511.5 526.9 538.9 556.9 556.1 568.1 578.0 572.1 558.0 550.3 Failed 163.1 166.4 192.1 196.6 182.3 168.6 155.1 150.6 135.2 119.9 102.4 95.0 88.0 All 699.2 696.4 702.6 708.0 709.1 707.4 711.9 706.7 703.3 697.9 674.5 653.0 638.3
Re-tests: Passed 150.7 153.9 179.1 182.7 169.5 148.0 127.9 121.5 125.5 111.9 96.0 89.1 82.4 Failed 23.7 24.4 31.5 29.9 25.8 23.9 20.5 18.5 15.3 13.9 11.0 9.6 8.7 All 174.4 178.3 210.6 212.6 195.3 171.9 148.4 140.0 140.8 125.8 106.9 98.7 91.2
Percentage failed: First test 23.3 23.9 27.3 27.8 25.7 23.8 21.8 21.3 19.2 17.2 15.2 14.6 13.8 Re-tests 13.6 13.7 15.0 14.1 13.2 13.9 13.8 13.2 10.9 11.0 10.3 9.7 9.6 All tests 21.4 21.7 24.5 24.6 23.0 22.0 20.4 20.0 17.8 16.2 14.5 13.9 13.3
1. Vehicles subject to plating and testing have to undergo a test when they are 1 year old and are tested annually thereafter; the term ‘first test’ refers to the first test of a vehicle in a particular year. The figures quoted cover the 52 week period ending on the Friday which precedes the first Monday in April.2. Due to revisions of testing policy, from 2001/02 onwards fewer defects are now allowed to be rectified at the testing station, resulting in a decrease in passes, an increase in failures and an increase in re-tests.
Telephone: 0117-543382 Source: VOSAEmail: [email protected] Last updated: November 2012
Next update: November 2013This table is outside the scope of National Statistics
https://www.gov.uk/government/statistical-data-sets/tsgb09-vehicles 262
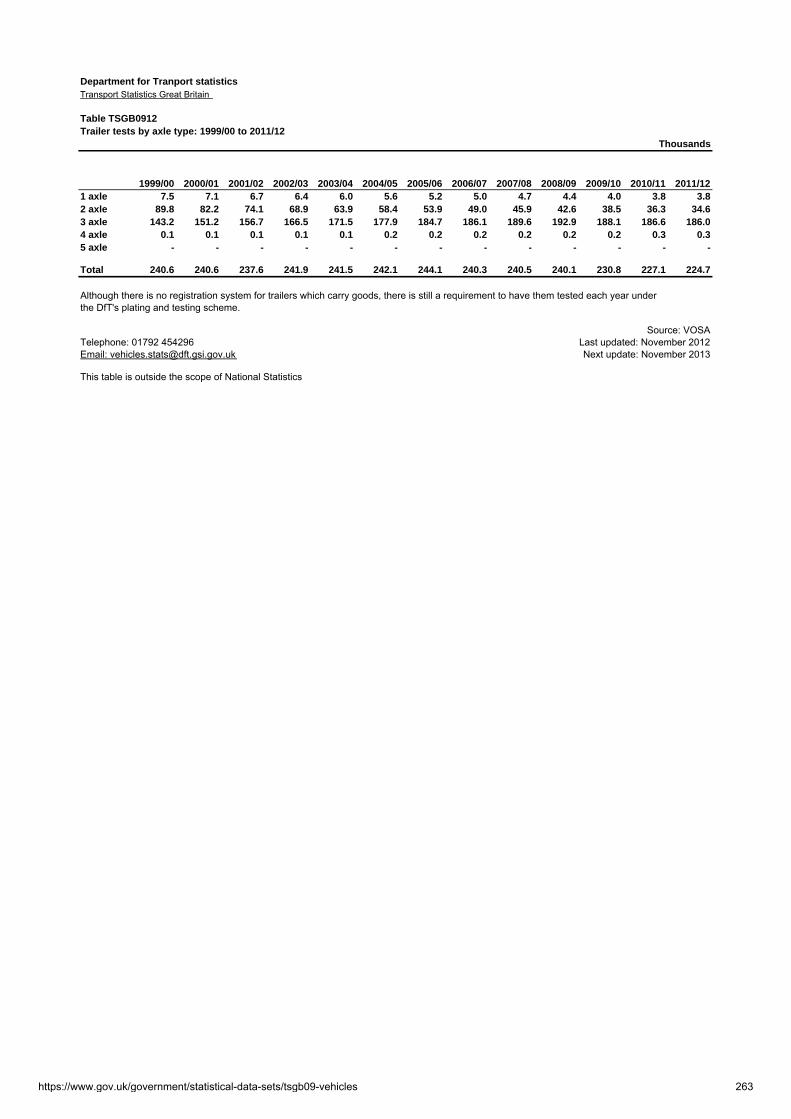
Department for Tranport statisticsTransport Statistics Great Britain
Table TSGB0912Trailer tests by axle type: 1999/00 to 2011/12
Thousands
1999/00 2000/01 2001/02 2002/03 2003/04 2004/05 2005/06 2006/07 2007/08 2008/09 2009/10 2010/11 2011/121 axle 7.5 7.1 6.7 6.4 6.0 5.6 5.2 5.0 4.7 4.4 4.0 3.8 3.82 axle 89.8 82.2 74.1 68.9 63.9 58.4 53.9 49.0 45.9 42.6 38.5 36.3 34.63 axle 143.2 151.2 156.7 166.5 171.5 177.9 184.7 186.1 189.6 192.9 188.1 186.6 186.04 axle 0.1 0.1 0.1 0.1 0.1 0.2 0.2 0.2 0.2 0.2 0.2 0.3 0.35 axle - - - - - - - - - - - - -
Total 240.6 240.6 237.6 241.9 241.5 242.1 244.1 240.3 240.5 240.1 230.8 227.1 224.7
Although there is no registration system for trailers which carry goods, there is still a requirement to have them tested each year under the DfT's plating and testing scheme.
Source: VOSATelephone: 01792 454296 Last updated: November 2012Email: [email protected] Next update: November 2013
This table is outside the scope of National Statistics
https://www.gov.uk/government/statistical-data-sets/tsgb09-vehicles 263

Department for Transport statisticsNational Travel Survey
Table NTS0205 (TSGB0913)Household car availability: Great Britain, 1951 to 2011
Percentage /number
Year No car / van One car / vanTwo or more
cars / vans All householdsCars / vans per
householdCars / vans per
adult (17+)
Unweighted sample size
(households)1951 86 13 1 100 .. .. ..1961 69 29 2 100 .. .. ..1971 48 44 8 100 .. .. ..1981 40 45 15 100 .. .. ..1985/861 38 45 17 100 0.82 0.42 10,2661989/91 33 45 22 100 0.94 0.50 10,7521992/94 33 44 23 100 0.96 0.52 10,2961995/972 30 44 25 100 1.00 0.54 10,4611998/00 28 44 28 100 1.05 0.57 10,4592002 27 44 29 100 1.08 0.58 8,8492003 27 43 31 100 1.10 0.59 9,1962004 26 44 30 100 1.10 0.59 8,9912005 25 43 32 100 1.15 0.61 9,4532006 25 44 32 100 1.15 0.61 9,2612007 25 43 32 100 1.14 0.60 9,2782008 25 43 32 100 1.14 0.60 8,9242009 25 43 32 100 1.14 0.60 9,1282010 25 42 33 100 1.16 0.61 8,7752011 25 43 32 100 1.14 0.60 8,460
1 Figures from 1985/86 are from the National Travel Survey. Earlier years are derived from other household surveys.2 Figures prior to 1995 are based on unweighted data.
Telephone: 020 7944 3097 Source: National Travel SurveyEmail: [email protected] Last updated: December 2012Notes and definitions Next update: July 2013
The figures in this table are National Statistics
Note: The results presented in this table are weighted. The base (unweighted sample size) is shown in the table for information. Weights are applied to adjust for non-response to ensure the characteristics of the achieved sample match the population of Great Britain and for the drop off in trip recording. The survey results are subjectto sampling error.
https://www.gov.uk/government/statistical-data-sets/tsgb09-vehicles 264
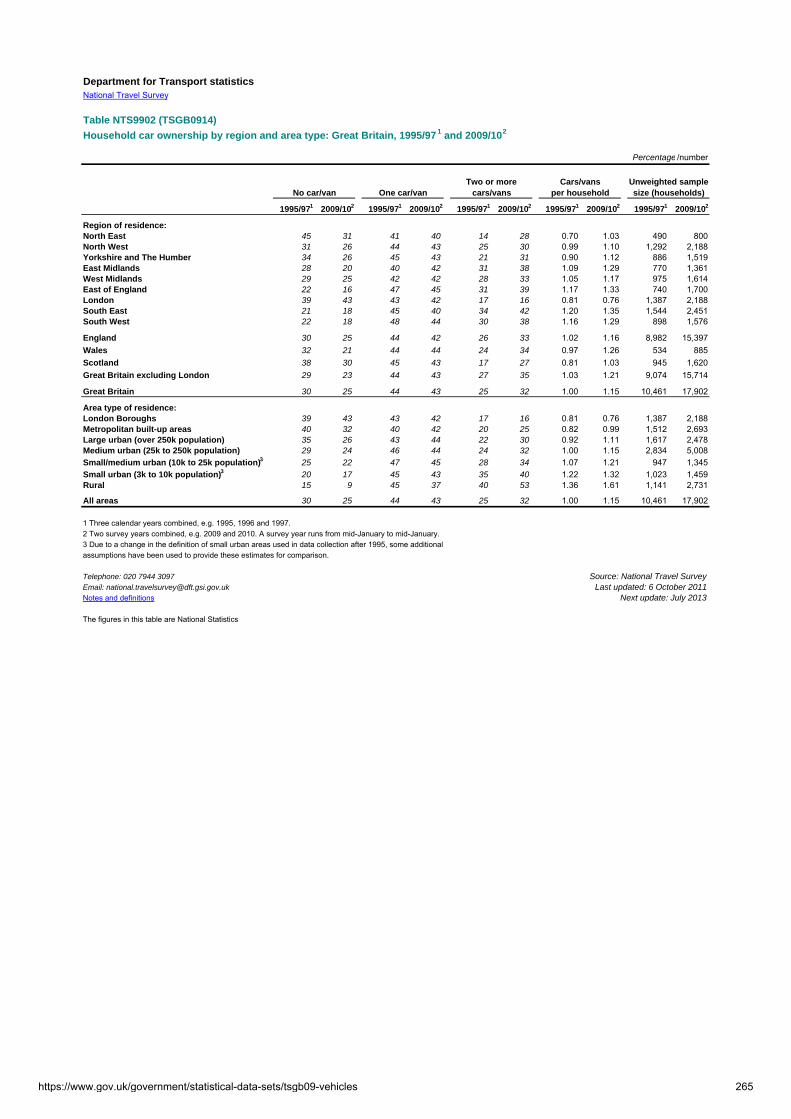
Department for Transport statisticsNational Travel Survey
Table NTS9902 (TSGB0914)
Household car ownership by region and area type: Great Britain, 1995/97 1 and 2009/102
Percentage /number
No car/van One car/vanTwo or more
cars/vansCars/vans
per householdUnweighted sample size (households)
1995/971 2009/102 1995/971 2009/102 1995/971 2009/102 1995/971 2009/102 1995/971 2009/102
Region of residence:North East 45 31 41 40 14 28 0.70 1.03 490 800North West 31 26 44 43 25 30 0.99 1.10 1,292 2,188Yorkshire and The Humber 34 26 45 43 21 31 0.90 1.12 886 1,519East Midlands 28 20 40 42 31 38 1.09 1.29 770 1,361West Midlands 29 25 42 42 28 33 1.05 1.17 975 1,614East of England 22 16 47 45 31 39 1.17 1.33 740 1,700London 39 43 43 42 17 16 0.81 0.76 1,387 2,188South East 21 18 45 40 34 42 1.20 1.35 1,544 2,451South West 22 18 48 44 30 38 1.16 1.29 898 1,576
England 30 25 44 42 26 33 1.02 1.16 8,982 15,397Wales 32 21 44 44 24 34 0.97 1.26 534 885Scotland 38 30 45 43 17 27 0.81 1.03 945 1,620Great Britain excluding London 29 23 44 43 27 35 1.03 1.21 9,074 15,714
Great Britain 30 25 44 43 25 32 1.00 1.15 10,461 17,902
Area type of residence:London Boroughs 39 43 43 42 17 16 0.81 0.76 1,387 2,188Metropolitan built-up areas 40 32 40 42 20 25 0.82 0.99 1,512 2,693Large urban (over 250k population) 35 26 43 44 22 30 0.92 1.11 1,617 2,478Medium urban (25k to 250k population) 29 24 46 44 24 32 1.00 1.15 2,834 5,008Small/medium urban (10k to 25k population)3 25 22 47 45 28 34 1.07 1.21 947 1,345Small urban (3k to 10k population)3 20 17 45 43 35 40 1.22 1.32 1,023 1,459Rural 15 9 45 37 40 53 1.36 1.61 1,141 2,731
All areas 30 25 44 43 25 32 1.00 1.15 10,461 17,902
1 Three calendar years combined, e.g. 1995, 1996 and 1997.2 Two survey years combined, e.g. 2009 and 2010. A survey year runs from mid-January to mid-January.3 Due to a change in the definition of small urban areas used in data collection after 1995, some additionalassumptions have been used to provide these estimates for comparison.
Telephone: 020 7944 3097 Source: National Travel SurveyEmail: [email protected] Last updated: 6 October 2011Notes and definitions Next update: July 2013
The figures in this table are National Statistics
https://www.gov.uk/government/statistical-data-sets/tsgb09-vehicles 265

Department for Transport statisticsNational Travel Survey
Table NTS0201 (TSGB0915)Full car driving licence holders by age and gender: Great Britain, 1975/76 to 2011
Percentage /millions/number
All aged 17+ 17-20 21-29 30-39 40-49 50-59 60-69 70+
Estimated licence holders
(millions)
Unweighted sample size (individuals
aged 17+)
All adults:1975/76 48 28 59 67 60 50 35 15 19.4 17,0641985/86 57 33 63 74 71 60 47 27 24.3 19,8351989/91 64 43 72 77 78 67 54 32 27.8 20,3981992/94 67 48 75 82 79 72 57 33 29.3 19,0301995/971 69 43 74 81 81 75 63 38 30.3 19,4221998/00 71 41 75 84 83 77 67 39 31.4 19,2992002 70 33 67 82 84 81 70 44 31.9 16,1662003 70 29 67 82 83 80 72 44 32.1 16,9942004 70 27 65 82 83 80 72 46 32.2 16,6122005 72 32 66 82 84 82 74 51 33.3 17,6192006 72 34 67 82 84 82 76 50 33.7 17,3452007 71 38 66 81 83 82 75 52 33.8 17,1992008 72 36 64 82 83 83 78 53 34.5 16,6182009 72 36 65 80 84 83 78 54 34.7 17,1162010 73 35 63 81 84 83 79 57 35.3 16,3832011 72 31 63 78 83 82 79 59 35.2 15,841
Males:1975/76 69 36 78 85 83 75 58 32 13.4 8,1131985/86 74 37 73 86 87 81 72 51 15.1 9,3671989/91 80 52 82 88 89 85 78 58 16.7 9,6791992/94 81 54 83 91 88 88 81 59 17.0 8,8621995/971 81 50 80 88 89 89 83 65 17.2 9,2111998/00 82 44 80 89 91 88 83 65 17.4 9,1492002 80 35 71 88 90 89 85 68 17.5 7,6562003 81 33 73 87 90 91 87 69 17.8 8,0962004 79 30 68 87 89 90 86 72 17.7 7,8552005 81 37 69 86 90 90 88 73 18.1 8,3482006 81 37 71 86 89 91 90 76 18.4 8,2712007 80 41 69 86 88 90 87 75 18.4 8,1462008 81 38 67 87 89 91 90 75 18.7 7,9292009 80 37 67 84 89 91 90 76 18.8 8,1202010 80 35 66 86 90 90 89 78 19.0 7,8302011 79 31 68 81 88 90 89 79 18.9 7,515
Females:1975/76 29 20 43 48 37 24 15 4 6.0 8,9511985/86 41 29 54 62 56 41 24 11 9.2 10,4681989/91 49 35 64 67 66 49 33 15 11.1 10,7191992/94 54 42 68 73 70 57 37 16 12.2 10,1681995/971 57 36 67 74 73 62 45 21 13.1 10,2111998/00 60 38 69 78 76 67 53 22 14.0 10,1502002 61 31 62 76 78 73 55 27 14.4 8,5102003 61 25 62 77 77 70 58 26 14.3 8,8982004 61 24 62 77 77 71 58 28 14.5 8,7572005 63 27 62 77 79 73 61 35 15.2 9,2712006 63 31 63 78 79 74 63 31 15.3 9,0742007 63 34 62 76 78 74 63 36 15.4 9,0532008 65 35 61 78 78 75 67 36 15.8 8,6892009 65 35 62 76 79 75 67 37 16.0 8,9962010 66 34 60 77 79 77 69 41 16.3 8,5532011 65 31 59 75 79 75 69 44 16.3 8,326
1 Figures prior to 1995 are based on unweighted data
Telephone: 020 7944 3097 Source: National Travel SurveyEmail: [email protected] Last updated: December 2012Notes and definitions Next update: July 2013
The figures in this table are National Statistics
Note: The results presented in this table are weighted. The base (unweighted sample size) is shown in the table for information. Weights are applied to adjust for non-response to ensure the characteristics of the achieved sample match the population of Great Britain and for the drop off in trip recording. The survey results are subject to sampling error.
https://www.gov.uk/government/statistical-data-sets/tsgb09-vehicles 266

Department for Transport statisticsNational Travel Survey
Table NTS0901 (TSGB0916)
Annual mileage1 of 4-wheeled cars by type and trip purpose: Great Britain, 1995/97 to 2010
Miles/percentage /number
Year Type of carBusiness
mileageCommuting
mileageOther private
mileageTotal
mileageProportion of
cars in sample
Unweighted sample size
(all cars)
1995/97 Company cars 11,890 5,920 5,540 23,340 7 7112010 Company cars 7,490 6,450 5,250 19,190 5 4001995/97 Private cars 900 2,580 5,130 8,610 93 8,7812010 Private cars 570 2,500 4,840 7,910 95 8,5691995/97 All 4-wheeled cars 1,710 2,830 5,160 9,700 100 9,4922010 All 4-wheeled cars 890 2,680 4,860 8,430 100 8,969
YearBusiness
mileageCommuting
mileageOther private
mileageTotal
mileage
Proportion of company cars
in sample
Unweighted sample size
(all cars)1995/97 1,710 2,830 5,160 9,700 7 9,4921998/00 1,590 2,940 5,030 9,550 8 10,0262002 1,250 2,780 5,140 9,170 7 8,5552003 1,230 2,840 5,160 9,230 6 9,0882004 1,140 2,850 5,170 9,160 6 8,7072005 1,090 2,840 5,080 9,010 6 9,5342006 1,040 2,770 4,960 8,770 5 9,4482007 1,070 2,740 5,060 8,870 5 9,2532008 1,020 2,640 5,030 8,690 5 8,9872009 890 2,520 5,010 8,430 4 9,2372010 890 2,680 4,860 8,430 5 8,969
1 Total annual mileage and the purpose split is estimated by the respondent.
Telephone: 020 7944 3097 Source: National Travel SurveyEmail: [email protected] Last updated: 28 July 2011Notes and definitions Next update: July 2013
The figures in this table are National Statistics
https://www.gov.uk/government/statistical-data-sets/tsgb09-vehicles 267

Department for Tranport statisticsTransport Statistics Great Britain
Table TSGB0917Car driving tests, Great Britain: 1999/00 to 2011/12
Thousands/percent
1999/00 2000/01 2001/02 2002/03 2003/04 2004/05 2005/06 2006/07 2007/08 2008/09 2009/10 2010/11 2011/12Applications received 1 1,205 1,263 1,315 1,468 1,526 1,675 1,847 1,883 1,878 1,796 1,590 1,648 1,584Tests conducted 1,130 1,015 1,216 1,344 1,399 1,668 1,834 1,784 1,769 1,717 1,533 1,606 1,569
Tests passed, by sex: Male 256 229 273 300 304 365 411 405 412 408 370 383 374 Female 240 214 254 283 295 340 370 367 370 369 334 361 362 Total 496 443 527 583 598 706 781 773 782 777 703 744 736
Pass rate, by sex: Male 48 48 47 47 46 46 46 46 47 49 49 50 50 Female 40 40 40 40 40 39 40 41 41 42 43 43 44 Total 44 44 43 43 43 42 43 43 44 45 46 46 47
1 These are gross figures and take no account of applications which do not mature into a test due to cancellations etc.
Telephone: 0115-9366666 Source: DSAEmail: [email protected] Last updated: November 2012
Next update: November 2013This table is outside the cope of National Statistics
https://www.gov.uk/government/statistical-data-sets/tsgb09-vehicles 268
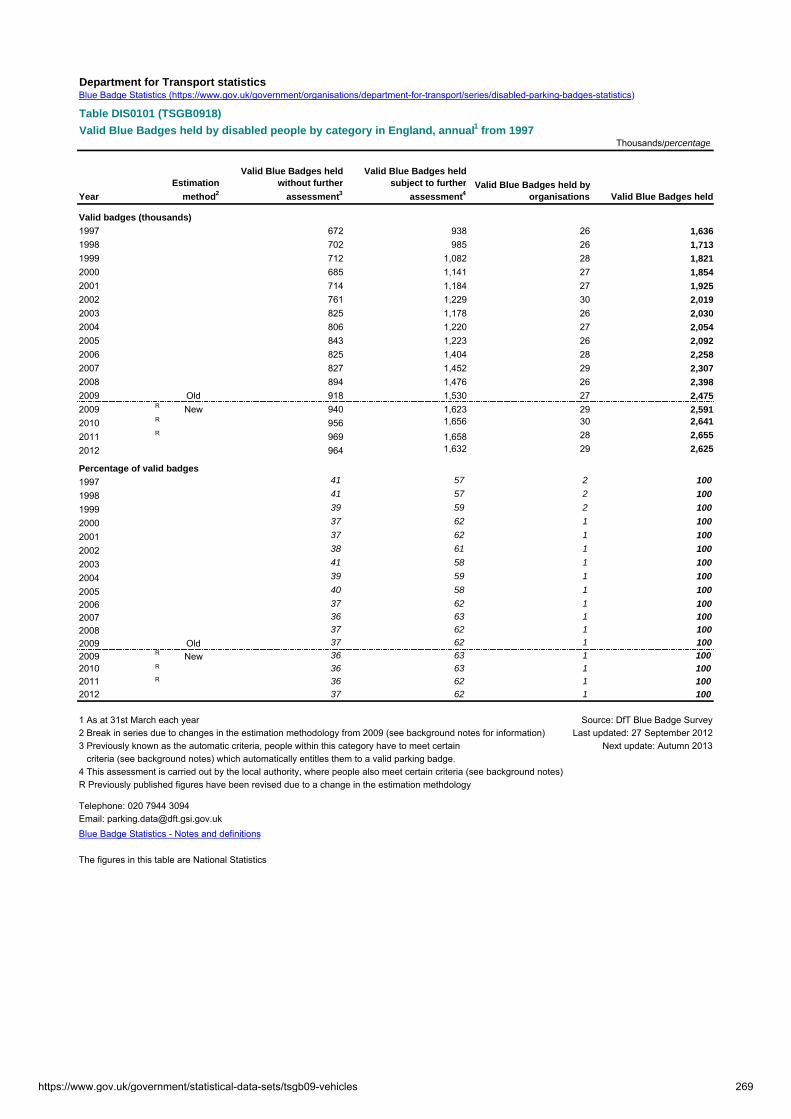
Department for Transport statisticsBlue Badge Statistics (https://www.gov.uk/government/organisations/department-for-transport/series/disabled-parking-badges-statistics)
Table DIS0101 (TSGB0918)
Valid Blue Badges held by disabled people by category in England, annual1 from 1997Thousands/percentage
Year
Estimation
method2
Valid Blue Badges heldwithout further
assessment3
Valid Blue Badges heldsubject to further
assessment4Valid Blue Badges held by
organisations Valid Blue Badges held
Valid badges (thousands)
1997 672 938 26 1,636
1998 702 985 26 1,713
1999 712 1,082 28 1,821
2000 685 1,141 27 1,854
2001 714 1,184 27 1,925
2002 761 1,229 30 2,019
2003 825 1,178 26 2,030
2004 806 1,220 27 2,054
2005 843 1,223 26 2,092
2006 825 1,404 28 2,258
2007 827 1,452 29 2,307
2008 894 1,476 26 2,398
2009 Old 918 1,530 27 2,475
2009 R New 940 1,623 29 2,591
2010 R 956 1,656 30 2,641
2011 R 969 1,658 28 2,655
2012 964 1,632 29 2,625
Percentage of valid badges
1997 41 57 2 100
1998 41 57 2 100
1999 39 59 2 100
2000 37 62 1 100
2001 37 62 1 100
2002 38 61 1 100
2003 41 58 1 100
2004 39 59 1 100
2005 40 58 1 100
2006 37 62 1 100
2007 36 63 1 100
2008 37 62 1 100
2009 Old 37 62 1 100
2009 R New 36 63 1 100
2010 R 36 63 1 100
2011 R 36 62 1 100
2012 37 62 1 100
1 As at 31st March each year Source: DfT Blue Badge Survey2 Break in series due to changes in the estimation methodology from 2009 (see background notes for information) Last updated: 27 September 20123 Previously known as the automatic criteria, people within this category have to meet certain Next update: Autumn 2013 criteria (see background notes) which automatically entitles them to a valid parking badge. 4 This assessment is carried out by the local authority, where people also meet certain criteria (see background notes)R Previously published figures have been revised due to a change in the estimation methdology
Telephone: 020 7944 3094Email: [email protected] Blue Badge Statistics - Notes and definitions
The figures in this table are National Statistics
https://www.gov.uk/government/statistical-data-sets/tsgb09-vehicles 269

Department for Transport statisticsBlue Badge Statistics (https://www.gov.uk/government/organisations/department-for-transport/series/disabled-parking-badges-statistics)
Table DIS0102 (TSGB0919)
Valid Blue Badges held and population measures: England, annual from 19971
Thousands/percentage
Year
Estimation
method2 Valid Blue Badges1 Retired population3
Ratio of retired people to badge
holders
Badge holders as apercentage of the
population
Retired people as apercentage of the
population Total population
1997 1,636 8,895 5.4 : 1 3.4 18.3 48,519 1998 1,713 8,914 5.2 : 1 3.5 18.3 48,665 1999 1,821 8,950 4.9 : 1 3.7 18.3 48,821 2000 1,854 8,975 4.8 : 1 3.8 18.3 49,033 2001 1,925 9,010 4.7 : 1 3.9 18.3 49,233 2002 2,019 9,055 4.5 : 1 4.1 18.3 49,450 2003 2,030 9,110 4.5 : 1 4.1 18.3 49,649 2004 2,054 9,189 4.5 : 1 4.1 18.4 49,863 2005 2,092 9,273 4.4 : 1 4.2 18.5 50,110 2006 2,258 9,370 4.1 : 1 4.5 18.6 50,466 2007 2,307 9,463 4.1 : 1 4.5 18.6 50,764 2008 2,398 9,646 4.0 : 1 4.7 18.9 51,106 2009 Old 2,475 9,842 4.0 : 1 4.8 19.1 51,465 2009 R New 2,591 9,842 3.8 : 1 5.0 19.1 51,465 2010 R 2,641 10,022 3.8 : 1 5.1 19.3 51,810 2011 R 2,655 10,211 3.8 : 1 5.1 19.5 52,234 2012 2,625 10,385 4.0 : 1 5.0 19.7 52,655
1 Blue Badge counts are at 31 March in year shown. Population estimates relate to mid-point of previous calendar year. For 2012, the 2010 based projection for mid-2011 is used.2 Break in series due to changes in the estimation methodology from 2009 (see background notes for information).3 The retired population is defined as men over 65 and women over 60.R Previously published figures have been revised due to a change in the estimation methdology
Source: DfT Blue Badge Survey, Office for National Statistics population estimates and projectionsLast updated: 27 September 2012Next update: Autumn 2013
Telephone: 020 7944 3094Email: [email protected] Badge Statistics - Notes & definitions
The figures in this table are National Statistics
https://www.gov.uk/government/statistical-data-sets/tsgb09-vehicles 270
Transport Statistics Great Britain 2012 Spotlight on Transport Statistics during the London 2012 Olympic Games and Paralympics Spotlight on Transport Statistics during the
London 2012 Olympic Games and Paralympics includes:
Monthly international passengers and sailings at UK ports;
Punctuality, passengers and air transport movements at UK airports;
Average traffic speeds on locally managed ‘A’ roads in the Olympic host boroughs;
Performance against profiles on Highways Agency Strategic Route Network (SRN) Olympic Routes, and
The headline impact on rail journeys including National Rail Games Travel Sales;
The London 2012 Olympic Games and Paralympic Games took place between 27 July – 12 August and 29 August – 9 September respectively, with the Olympic football starting early on 25 July. Much of this chapter compares data for this period to a comparable period in the previous year. These statistics not only measure ‘performance’ of the transport network during the Games, but also the behaviour of non-Games travellers who re-timed or chose not to make journeys. This is not intended to be a comprehensive review of transport performance in London or Great Britain during the Games, but supplements evidence from other sources.
Supporting materials
The Olympic Delivery Authority (ODA) published a report Delivering transport for the London 2012 Games1 in October 2012 which provides an overall picture of how transport for the Games was achieved, what was learned on the way, and the transport legacy. It focuses on the additional projects and programmes – mainly funded by the ODA – that would not have happened without the London 2012 Games being staged.
Transport for London (TfL) will also be dedicating a large part of their annual report Travel in London 5 on how the capital’s transport system performed during the Games. TfL collect much more detailed data for London than DfT. Their report will cover the full range of TfL managed transport. Travel in London 5 will be also be published in mid-December 2012 and will be available on the TfL website at http://www.tfl.gov.uk/corporate/about-tfl/publications/1482.aspx. In light of this, we have not aimed to duplicate TfL’s analysis of transport in London during the Games, but present a spotlight on DfT statistics supplemented with data from the Highways Agency (HA) and the Association of Train Operating Companies (ATOC) that contribute to the wider understanding of how the transport network performed in London and other key sites of interest during the Games period.
1http://www.ice.org.uk/ice_upload/delivering_transport_London_2012.pdf
https://www.gov.uk/government/statistical-data-sets/tsgb10 271

Summary
The number of sea passengers arriving and departing at UK ports was 15 per cent lower in July 2012 t han July 2011 and 10 per cent lower in Augus t 2012 than August 2011. T he number of sailings was also seven per cent lower in July and August 2012 when compared to the previous year.
There were fewer terminal passengers (arrivals and departures) at UK airports in July and August 2012 compared to the same months in 2011: the volume of passengers was reduced by 0.5 million (two per cent) and 0.3 million (one per cent) respectively. The number of air transport movements (ATMs) was also two per cent lower in July, August and September 2012 than in the previous year by 4,000, 3,000 and 5,000 ATMs respectively. The most pronounced feature in arrivals and departures at London Heathrow related to Games family members on Monday 13 August (the day after the closing ceremony). The staging of the Olympic Games had no obvious effect on length of delays at UK airports in July and August.
These results support the findings from the International Passenger Survey which indicate that there were 8.8 million visits to the UK by overseas residents in July – September 2012 (for any purpose)2. This was four per cent lower than in July – September 2011. IPS estimates also suggest that there were 680,000 completed visits to the UK by overseas residents in July – September 2012, either specifically for the 2012 Olympics/Paralympics (participating, working or watching) or primarily for another reason but involving attendance at a ticketed event. This represents eight per cent per of all visits to the UK by overseas residents.
Average speeds on locally managed ‘A’ roads in the six London host boroughs were generally slightly slower (1.7mph) during the Olympic Games than during a comparative period in 2011. Although this varied depending on the time of day, the morning and afternoon peak speeds were still at approximately the same time of day as in the comparable period a year earlier.
Performance against profile for the Olympic Routes on the Highways Agency Strategic Route Network (SRN) was good throughout the period of the Olympic Games, with overall journey speeds being recorded as just 0.5 per cent slower than expected and any substantial delays on specific routes were caused by Road Traffic Collisions and other incidents rather than the weight of traffic on the network.
Estimates from ATOC confirm that there were substantial increases in the number of rail journeys during the Olympics and Paralympics. The overall national impact was estimated to be 21.2 million journeys. Journeys in the London and South East accounted for the majority of this uplift (93 per cent) with long distance journeys accounting for a further five per cent.
2http://www.ons.gov.uk/ons/rel/ott/overseas-travel-and-tourism---monthly-release/september-2012/stb-monthly-overseas-travel-and-tourism--september-2012.html
https://www.gov.uk/government/statistical-data-sets/tsgb10 272
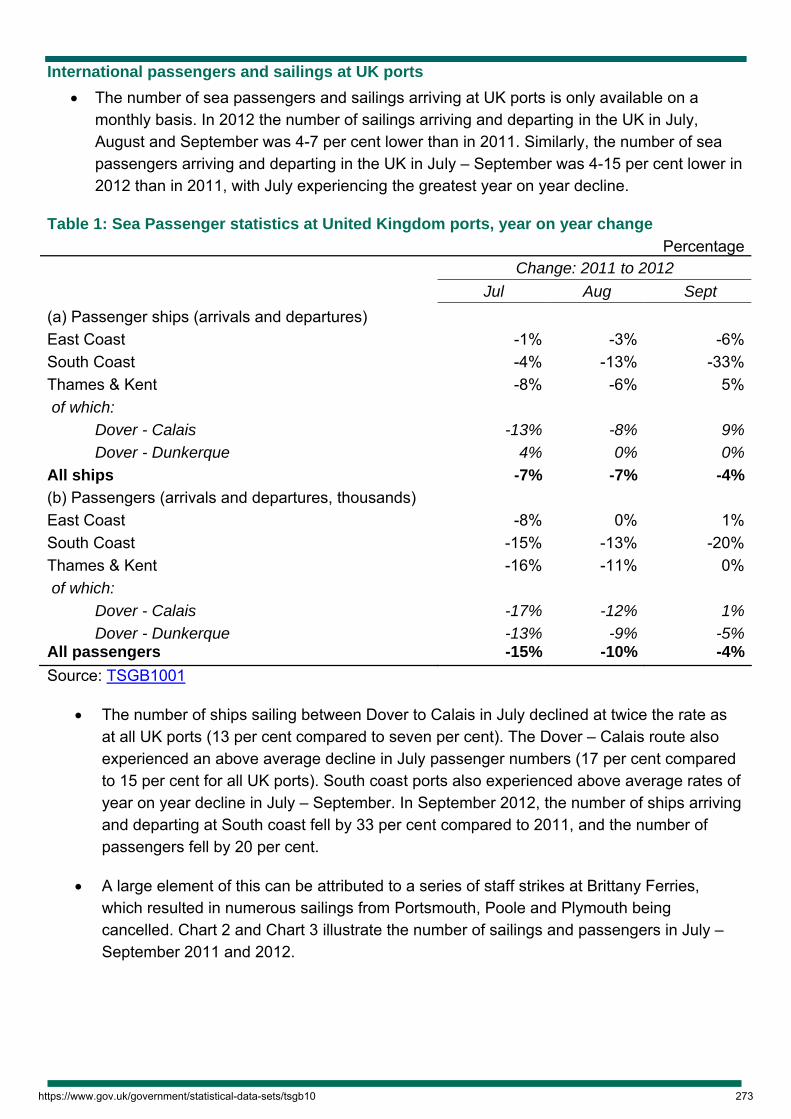
International passengers and sailings at UK ports
The number of sea passengers and sailings arriving at UK ports is only available on a monthly basis. In 2012 the number of sailings arriving and departing in the UK in July, August and September was 4-7 per cent lower than in 2011. Similarly, the number of sea passengers arriving and departing in the UK in July – September was 4-15 per cent lower in 2012 than in 2011, with July experiencing the greatest year on year decline.
Table 1: Sea Passenger statistics at United Kingdom ports, year on year change
Percentage Change: 2011 to 2012
Jul Aug Sept
(a) Passenger ships (arrivals and departures) East Coast -1% -3% -6%South Coast -4% -13% -33%Thames & Kent -8% -6% 5% of which:
Dover - Calais -13% -8% 9%
Dover - Dunkerque 4% 0% 0%
All ships -7% -7% -4%
(b) Passengers (arrivals and departures, thousands) East Coast -8% 0% 1%South Coast -15% -13% -20%Thames & Kent -16% -11% 0% of which:
Dover - Calais -17% -12% 1%
Dover - Dunkerque -13% -9% -5%All passengers -15% -10% -4%
Source: TSGB1001
The number of ships sailing between Dover to Calais in July declined at twice the rate as at all UK ports (13 per cent compared to seven per cent). The Dover – Calais route also experienced an above average decline in July passenger numbers (17 per cent compared to 15 per cent for all UK ports). South coast ports also experienced above average rates of year on year decline in July – September. In September 2012, the number of ships arriving and departing at South coast fell by 33 per cent compared to 2011, and the number of passengers fell by 20 per cent.
A large element of this can be attributed to a series of staff strikes at Brittany Ferries, which resulted in numerous sailings from Portsmouth, Poole and Plymouth being cancelled. Chart 2 and Chart 3 illustrate the number of sailings and passengers in July – September 2011 and 2012.
https://www.gov.uk/government/statistical-data-sets/tsgb10 273

Chart 2: Passenger ships (arrivals and departures at UK ports)
0
1,000
2,000
3,000
4,000
5,000
6,000
7,000
8,000
Jul-11 Aug-11 Sep-11 Jul-12 Aug-12 Sep-12
East Coast South Coast Thames & Kent All ships
Source: TSGB1001
Chart 3: Passengers (arrivals and departures at UK ports)
0
500,000
1,000,000
1,500,000
2,000,000
2,500,000
3,000,000
3,500,000
Jul-11 Aug-11 Sep-11 Jul-12 Aug-12 Sep-12
East Coast South Coast Thames & Kent All passengers
Source: TSGB1001
The number of international sea passengers has been in decline for a number of years although the rate of decline has slowed in recent years (Chart 4). Between 2001 and 2011, the number of sea passengers arriving and departing at UK ports declined by an average
https://www.gov.uk/government/statistical-data-sets/tsgb10 274

of three per cent per annum. This would suggest that the reduced number of passengers (4-15 per cent) in August – September 2011-2012 outstripped this downwards trend.
Chart 4: International sea passengers: index (2001=100)
100104
9693
85 85 8582
78 7976
2001 2002 2003 2004 2005 2006 2007 2008 2009 2010 2011
Data: SPAS0103 UK international short sea passenger movements by overseas country: 1950 – 2011
Passengers, air transport movements and freight at UK airports
The anticipated increase in traffic at UK airports, including airports in the South East, did not materialise (see Table 5). In July and August the total number of terminal passengers (arrivals and departures) was lower in 2012 than in 2011 at UK airports overall, as well as at Heathrow, Stansted and London City.
The total number of arrivals and departures in the UK fell from 23.2million passengers in July 2011, to 22.7million in July 2012 (two per cent) and from 23.2million in August 2011 to 23.0 million in August 2012 (one per cent).
The volumes of passengers at Gatwick and Luton in July – September 2012 were similar to those experienced in 2011. Passenger numbers appear to have recovered in September at Gatwick and Heathrow. Heathrow experienced the highest ever number of passengers in a September 2012, rising by one per cent compared to September 2011, to 6.35 million.
https://www.gov.uk/government/statistical-data-sets/tsgb10 275

Table 5: Terminal passengers at United Kingdom airports: year on year change
Change: 2011 to 2012
Jul Aug Sept
(b) Terminal passengers (arrivals and departures) Gatwick 0% 0% 2%Heathrow -4% -2% 1%London City -7% -2% -2%Luton 0% 0% 0%Stansted -5% -5% -4%All UK airports -2% -1% 0%Source: Civil Aviation Authority, TSGB1002
Changes in air transport movements (ATMs) show a similar pattern to passenger numbers. The main exception is London City which saw a large increase in ATMs in 2012 despite a fall in passenger numbers. This is thought to be due to additional leisure routes at London City increasing the number of flights coinciding with a fall in passengers on traditional business routes which remained open over the summer albeit with low loads.
The total number of ATMs in the UK fell from 194,000 in July 2011 to 189,000 in July 2012 (two per cent) and from 194,000 in August 2011 to 191,000 in August 2012 (two per cent). The number of ATMs at UK airports in September 2012 was also two per cent lower than a year earlier.
Table 6: Air transport movements at United Kingdom airports: year on year change
Change: 2011 to 2012
Jul Aug Sept
(a) Air transport movements (aircraft landings and take-offs) Gatwick 0% -7% 0%Heathrow -1% -2% -2%London City 11% 11% 0%Luton 0% -5% -1%Stansted -4% -7% -6%All UK airports -2% -2% -2%Source: Civil Aviation Authority, TSGB1002
There are a few small peaks in the daily arrivals and departures for the London airports at key times, for example, an increase in departures after the Olympic closing ceremony, but these don’t stand out compared to the daily flows in the same months in 2011.Chart 7 illustrates daily arrivals and departures at Heathrow for the period covering the Olympic Games. There is a clear peak in the number of Games Family Members (GFM) departing from Heathrow on Monday 13 August (the day after the closing ceremony).
https://www.gov.uk/government/statistical-data-sets/tsgb10 276

It is worth noting that the GFM data are estimates based on the London Organising Committee of the Olympic Games’ (LOCOG’s) Arrivals and Departures System (ADS) database.
This held details of GFM’s plans submitted in advance of the Games, but it is likely that not everyone submitted their travel arrangements, or adhered to their submitted travel plans, so these estimates may not be an accurate record of GFM’s travel although they should give a good indication of the daily flows.
Chart 7: Daily arrivals and departures at Heathrow, total passengers and registered Games Family Members, July and August 2012
0
20,000
40,000
60,000
80,000
100,000
120,000
140,000
01-J
ul
08-J
ul
15-J
ul
22-J
ul
29-J
ul
05-A
ug
12-A
ug
19-A
ug
26-A
ug
0
2,000
4,000
6,000
8,000
10,000
12,000
Total arrivals (left hand axis) Total departures (left hand axis)GFM arrivals (right hand axis) GFM departures (right hand axis)
Source: Civil Aviation Authority and LOCOG (ADS)
The Games did not appear to have a marked affect on the punctuality of flights at UK airports (TSGB1003 and Chart 8). Punctuality fluctuated slightly or remained the same at different airports in different months compared to the previous year. It should be noted that delays were relatively low in 2011. Chart 8 illustrates how there is no conclusive direction to the year on year trends for average delays at London airports in July and August 2011-2012.
https://www.gov.uk/government/statistical-data-sets/tsgb10 277

Chart 8: punctuality at London Airports, July and August, 2011 - 2012 (average delay in minutes)
0
5
10
15
20
25
30
35G
atw
ick
(Sch
edul
ed)
Gat
wic
k(C
harte
r)
Hea
thro
w(S
ched
uled
)
Hea
thro
w(C
harte
r)
Lond
on C
ity(S
ched
uled
)
Lond
on C
ity(C
harte
r)
Luto
n(S
ched
uled
)
Luto
n(C
harte
r)
Sta
nste
d(S
ched
uled
)
Sta
nste
d(C
harte
r)
Min
utes
Jul-11 Jul-12 Aug-11 Aug-12
Source: Civil Aviation Authority, TSGB1003
Average traffic speeds on locally managed ‘A’ roads in the Olympic host boroughs
Average speeds on locally managed ‘A’ roads in the six London host boroughs were 1.7 mph slower during the Olympic Games period than during a comparative period in 2011. The difference in average speed during the Olympics for the six host boroughs varied between 0.7 – 4.5 mph slower than in the same period a year earlier depending on the time of day.
Changes in average speeds during the day broadly followed a similar pattern during the Olympics compared to the previous year. That is, the morning and afternoon peak times were much the same. Similar effects on average speeds were observed in other London boroughs, although the reduction in speeds during the Olympic period compared to the previous year was generally greater for the London host boroughs.
To put the reduction in speeds during the Games into context, average speeds for weekdays in the week commencing 9 September 2012, directly after the Paralympics were around 3-4mph lower during the morning and afternoon peaks, compared to during the Olympic period. This is believed to be largely due to the impact of additional traffic relating to school travel.
Chart 9 presents estimated average traffic speeds on locally managed ‘A’ roads in the six London 2012host boroughs on weekdays during the Olympic Games period, by time of day. For comparison, average speeds for the same period in 2011 are also presented.
https://www.gov.uk/government/statistical-data-sets/tsgb10 278

Chart 9: Average speed during the Olympics on locally managed ‘A’ roads for the six London 2012 host boroughs by time of day
10
12
14
16
18
20
22
24
2607
.00
08.0
0
09.0
0
10.0
0
11.0
0
12.0
0
13.0
0
14.0
0
15.0
0
16.0
0
17.0
0
18.0
0
19.0
0
Spe
ed (m
ph)
Olympic period Same period 2011
Source: TSGB1005
Chart 10 presents equivalent data for the duration of the Paralympics. The impact upon the average speed on ‘A’ roads in the host boroughs was negligible during peak hours. However, the mid-late morning traffic (09.15-11.15) was 1.0 - 1.7 mph slower during the Paralympics compared to the same period a year earlier.
Chart 10: Average speed during the Paralympics on locally managed ‘A’ roads for the six London 2012 host boroughs by time of day
10
12
14
16
18
20
22
24
26
07.0
0
08.0
0
09.0
0
10.0
0
11.0
0
12.0
0
13.0
0
14.0
0
15.0
0
16.0
0
17.0
0
18.0
0
19.0
0
Spe
ed (m
ph)
Paralympic period Same period 2011
Source: TSGB1005
https://www.gov.uk/government/statistical-data-sets/tsgb10 279

Performance against profiles on Highways Agency Strategic Route Network (SRN) Olympic Routes
DfT Automatic Traffic Counter (ATC) sample is not used here as it is designed to produce estimates at a national level and as a result have a limited number of Automatic Traffic Counters in London and elsewhere in the country which are used to collect traffic data.
The quality and coverage of data from these ATCs is not sufficiently robust for use on for London or specific Olympic Routes outside of London over a relatively short reference period. This section therefore draws upon analysis by the Highways Agency using their traffic data for the strategic road network on Olympic Routes.
Prior to London 2012, the Highways Agency identified key routes within the Strategic Route Network (SRN) that were deemed key for supporting a successful Olympics. These routes (highlighted in Figure 11) were identified as key to supporting travel to the games and the regular traffic whose daily lives were also likely to be impacted upon.
Figure 11: Highways Agency Strategic Road Network Olympic Routes
Source: Highways Agency
The Highways Agency gauges the performance of its network through a system of rolling profiles which establish a typical journey time for all routes at all times of the day. Through these profiles they are able to assess how well the network is performing. This text focuses on the key Olympic Routes during the period between 23rd July and 13th August.
https://www.gov.uk/government/statistical-data-sets/tsgb10 280

On the whole performance against profile on these routes was good throughout the period of the Olympics. Overall, average journey times were recorded as being just 0.5 per cent slower than expected across the Olympic Network. For example, the profiled journey time from Heathrow to the end of the M4 (as of 12:00 on 23rd July) was 10 minutes. An increase of 0.5 per cent on this would result in an additional journey time of 3 seconds being added to this journey time. It should be noted, however, that this is the average performance of the network and there were many delay causing incidents that did impact upon travellers’ journeys.
In addition to looking at journey times across all Olympic routes, performance against profile has been analysed for five specific routes: two routes to Weymouth; Hertfordshire Park and Ride to junction four of the M11 the M25 and Heathrow to the end of the M4.
Charts 12-14 illustrate how average journey times ‘above profile’ (Journey time versus expected profile>100%) were longer than expected, and journey times ‘below profile’ (Journey time versus expected profile<100%) were shorter than expected.
The routes to Weymouth were from the M5 junction 29 using the A30 and A35. The route from the M25 used the M3, M27 and A31. Both routes to Weymouth performed well and were only under major strain on one day - the 11th August when there was a three vehicle Road Traffic Collision (RTC) that closed the A35 for four hours.
Chart 12: Olympic route performance – Weymouth
85%
90%
95%
100%
105%
110%
115%
120%
125%
23 J
uly
25 J
uly
27 J
uly
29 J
uly
31 J
uly
2 Au
g
4 Au
g
6 Au
g
8 Au
g
10 A
ug
12 A
ugJour
ney
times
vs
expe
cted
pro
file-
Weymouth from M25 Weymouth from the M5
Source: Highways Agency
https://www.gov.uk/government/statistical-data-sets/tsgb10 281

The route from the Hertfordshire Park and Ride begins at junction nine of the M1, joins the M25 and finishes at the end of the M11 at junction four. This remained near profile throughout the Olympic period. There were no significant incidents on this route and journey times were constant.
Chart 13: Olympic route performance – Hertfordshire Park and Ride to the end of the M11
85%
90%
95%
100%
105%
110%
115%
120%
125%23
Jul
y
25 J
uly
27 J
uly
29 J
uly
31 J
uly
2 Au
g
4 Au
g
6 Au
g
8 Au
g
10 A
ug
12 A
ug
Jour
ney
times
vs
expe
cted
pro
file..
Hertfordshire Park and Ride to M11 Junction 4
Source: Highways Agency
The M25 is the busiest part of the Olympic Network and during the games there were eight days where the expected profiles for the routes were considerably exceeded. The Highways Agency managed 18 significant incidents on the M25 that directly contributed to the poor performance experienced on those eight days. In total, these 18 events were on the network for 32.5 hours and were directly responsible for poor journey times on these days. That is, delays were not due to the weight of traffic using the network. The M4 route from Heathrow performed well with no significant incidents.
Chart 14: Olympic route performance – M25 and M4 to Heathrow
85%
90%
95%
100%
105%
110%
115%
120%
125%
23 J
uly
25 J
uly
27 J
uly
29 J
uly
31 J
uly
2 Au
g
4 Au
g
6 Au
g
8 Au
g
10 A
ug
12 A
ug
Jour
ney
times
vs
expe
cted
pro
file..
M25 Performance Heathrow M4 J1-J4a
Source: Highways Agency
https://www.gov.uk/government/statistical-data-sets/tsgb10 282

The last two ‘summer getaway’ weekends in July are usually peak demand days for the SRN which traditionally experiences a substantial spike in traffic on the last two Fridays and Saturdays in July. As illustrated in Chart 15, this effect was less pronounced in July 2012 than the previous year.
For the first weekend3 there were four per cent fewer vehicles on the road compared to 2011 and for the second weekend4 there were six per cent fewer vehicles on the network. This suggests that road users modified their journeys at these crucial getaway periods in 2012, and have either deferred travelling or have decided against travel at this time in 2012.
Chart 15: estimated number of vehicles on the Strategic Route Network on “summer getaway” weekends (Friday and Saturday)
0
50,000
100,000
150,000
200,000
250,000
300,000
350,000
400,000
Fri 0
0:00
02:0
004
:00
06:0
008
:00
10:0
012
:00
14:0
016
:00
18:0
020
:00
22:0
0S
at 0
0.00
02:0
004
:00
06:0
008
:00
10:0
012
:00
14:0
016
:00
18:0
020
:00
22:0
0
Es
tim
ate
d n
um
be
r o
f v
eh
icle
s
Weekend 1 2012 Weekend 2 2012Weekend 1 2011 Weekend 2 2011
Source: Highways Agency
The estimated headline impact on rail journeys including National Rail Games travel sales
This section evaluates the impact of the Games on services on three specific rail sectors: London and the South East, long distance rail services and regional services, as well as National Rail as a whole. All three rail sectors saw sizeable uplifts in Off Peak growth across the Games period, with the greatest overall impact in London and the South East where there were approximately 20 million more journeys (across all ticket types) than would normally be seen at that time of year.
3Weekend 1: 20th-21st July 2012 compared with 22nd-23rd July 2011
4Weekend 2: 27th-28th July 2012 compared with 29th-30th July 2011
https://www.gov.uk/government/statistical-data-sets/tsgb10 283
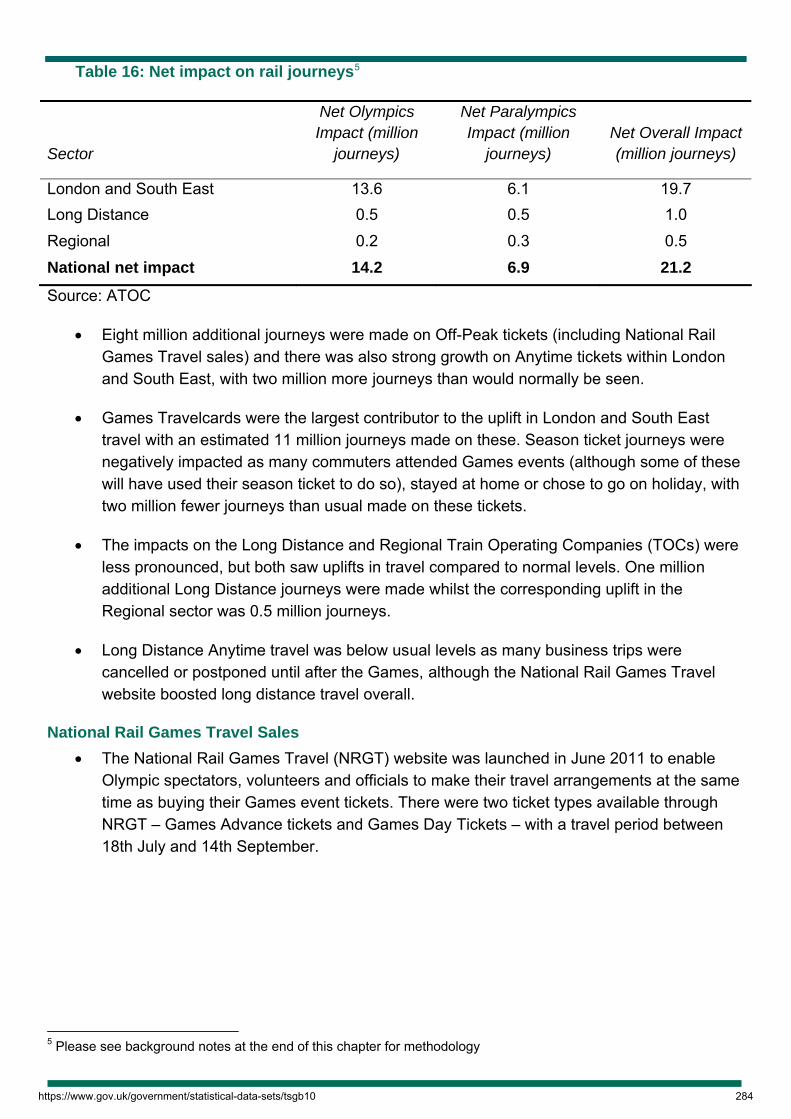
Table 16: Net impact on rail journeys5
Sector
Net Olympics Impact (million
journeys)
Net Paralympics Impact (million
journeys) Net Overall Impact (million journeys)
London and South East 13.6 6.1 19.7 Long Distance 0.5 0.5 1.0 Regional 0.2 0.3 0.5 National net impact 14.2 6.9 21.2
Source: ATOC
Eight million additional journeys were made on Off-Peak tickets (including National Rail Games Travel sales) and there was also strong growth on Anytime tickets within London and South East, with two million more journeys than would normally be seen.
Games Travelcards were the largest contributor to the uplift in London and South East travel with an estimated 11 million journeys made on these. Season ticket journeys were negatively impacted as many commuters attended Games events (although some of these will have used their season ticket to do so), stayed at home or chose to go on holiday, with two million fewer journeys than usual made on these tickets.
The impacts on the Long Distance and Regional Train Operating Companies (TOCs) were less pronounced, but both saw uplifts in travel compared to normal levels. One million additional Long Distance journeys were made whilst the corresponding uplift in the Regional sector was 0.5 million journeys.
Long Distance Anytime travel was below usual levels as many business trips were cancelled or postponed until after the Games, although the National Rail Games Travel website boosted long distance travel overall.
National Rail Games Travel Sales
The National Rail Games Travel (NRGT) website was launched in June 2011 to enable Olympic spectators, volunteers and officials to make their travel arrangements at the same time as buying their Games event tickets. There were two ticket types available through NRGT – Games Advance tickets and Games Day Tickets – with a travel period between 18th July and 14th September.
5 Please see background notes at the end of this chapter for methodology
https://www.gov.uk/government/statistical-data-sets/tsgb10 284
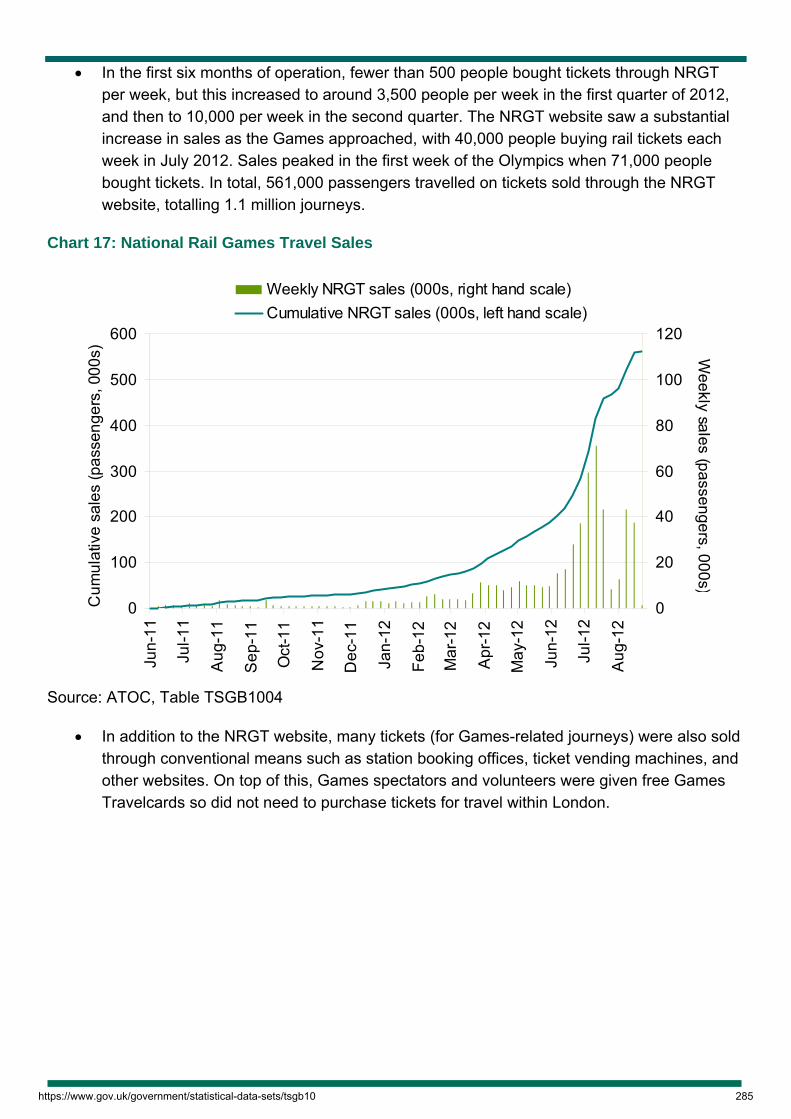
In the first six months of operation, fewer than 500 people bought tickets through NRGT per week, but this increased to around 3,500 people per week in the first quarter of 2012, and then to 10,000 per week in the second quarter. The NRGT website saw a substantial increase in sales as the Games approached, with 40,000 people buying rail tickets each week in July 2012. Sales peaked in the first week of the Olympics when 71,000 people bought tickets. In total, 561,000 passengers travelled on tickets sold through the NRGT website, totalling 1.1 million journeys.
Chart 17: National Rail Games Travel Sales
0
100
200
300
400
500
600
Jun-
11
Jul-1
1
Aug
-11
Sep
-11
Oct
-11
Nov
-11
Dec
-11
Jan-
12
Feb-
12
Mar
-12
Apr
-12
May
-12
Jun-
12
Jul-1
2
Aug
-12
Cum
ulat
ive
sale
s (p
asse
nger
s, 0
00s).
.
0
20
40
60
80
100
120
Weekly sales (passengers, 000s)
Weekly NRGT sales (000s, right hand scale)Cumulative NRGT sales (000s, left hand scale)
Source: ATOC, Table TSGB1004
In addition to the NRGT website, many tickets (for Games-related journeys) were also sold through conventional means such as station booking offices, ticket vending machines, and other websites. On top of this, Games spectators and volunteers were given free Games Travelcards so did not need to purchase tickets for travel within London.
https://www.gov.uk/government/statistical-data-sets/tsgb10 285
Background notes and contacts
Background notes for DfT Maritime Statistics can be found at: https://www.gov.uk/government/organisations/department-for-transport/series/ports-statistics
Enquiries regarding Maritime statistics should be directed to [email protected] or Phone: 020 7944 4131
Background notes for DfT Aviation statistics can be found at: https://www.gov.uk/government/organisations/department-for-transport/series/aviation-statistics
Enquiries regarding Aviation statistics should be directed to [email protected] or Phone: 020 7944 3088
Background notes for the DfT speeds and congestion statistics can be found at: https://www.gov.uk/government/organisations/department-for-transport/series/road-congestion-and-reliability-statistics
Enquiries regarding Congestion statistics should be directed to [email protected] or Phone: 020 7944 6579
For the purposes of this analysis, the Olympic Games period was defined as the period 23 July to 13 August 2012. The same period in 2011 was defined as 25 July to 15 August, containing same number of each day of the week as the Olympic Games period. The Paralympic Games period was defined as 29 August -13 September 2012 and the same period the year earlier was defined as 31 August – 15 September 2011.
The six Olympic host boroughs are Barking & Dagenham, Greenwich, Hackney, Newham, Tower Hamlets and Waltham Forest.
Average speeds in Chart 9 and Chart 10 were estimated using data from weekdays only. It should be noted that the sample used to estimate average speeds may not be representative of traffic. Temporary factors such as road works or bad weather may have influenced the estimates of average speeds.
Background notes for DfT Traffic statistics can be found at: https://www.gov.uk/government/organisations/department-for-transport/series/road-traffic-statistics
Enquiries regarding Traffic Statistics should be directed to [email protected] or Phone: 020 7944 3095.
The analysis and commentary in this section was produced by Paul Trow at the Highways Agency.
https://www.gov.uk/government/statistical-data-sets/tsgb10 286
Background notes for DFT rail statistics can be found at: https://www.gov.uk/government/organisations/department-for-transport/series/rail-statistics
Enquiries regarding Rail statistics should be directed to [email protected] or Phone: 020 7944 2419.
The analysis and commentary in this section was produced by Billy Denyer at ATOC.
Table 16 provides an estimate of the net impact of the Olympics and Paralympics on national rail journeys. The key assumption behind this analysis is that the Olympics and Paralympics periods were ‘on-trend’ without the presence of the Games.
Growth rates during the Games were compared to the Pre-Games trend and any variation was attributed to the Olympics or Paralympics. This analysis must therefore be used with caution. However, this ensures that travel by non-ticket holders (e.g. journeys to London to sample the atmosphere, and journeys made by Games volunteers) is included in the overall impact assessment.
‘Games Travelcards’ and ‘National Rail Games Travel’ sales are included to give a full estimate of the Games impact. We do not know exactly how many journeys were made on Games Travelcards so the journeys have been estimated by dividing the revenue received by the average within-London journey price.
Please note that the Travel Demand Management (TDM) campaign actively shifted and successfully depressed demand in some areas. There will have been considerable variation in the impact within each sector, but we do not have robust enough data to analyse the impact at TOC level.
https://www.gov.uk/government/statistical-data-sets/tsgb10 287
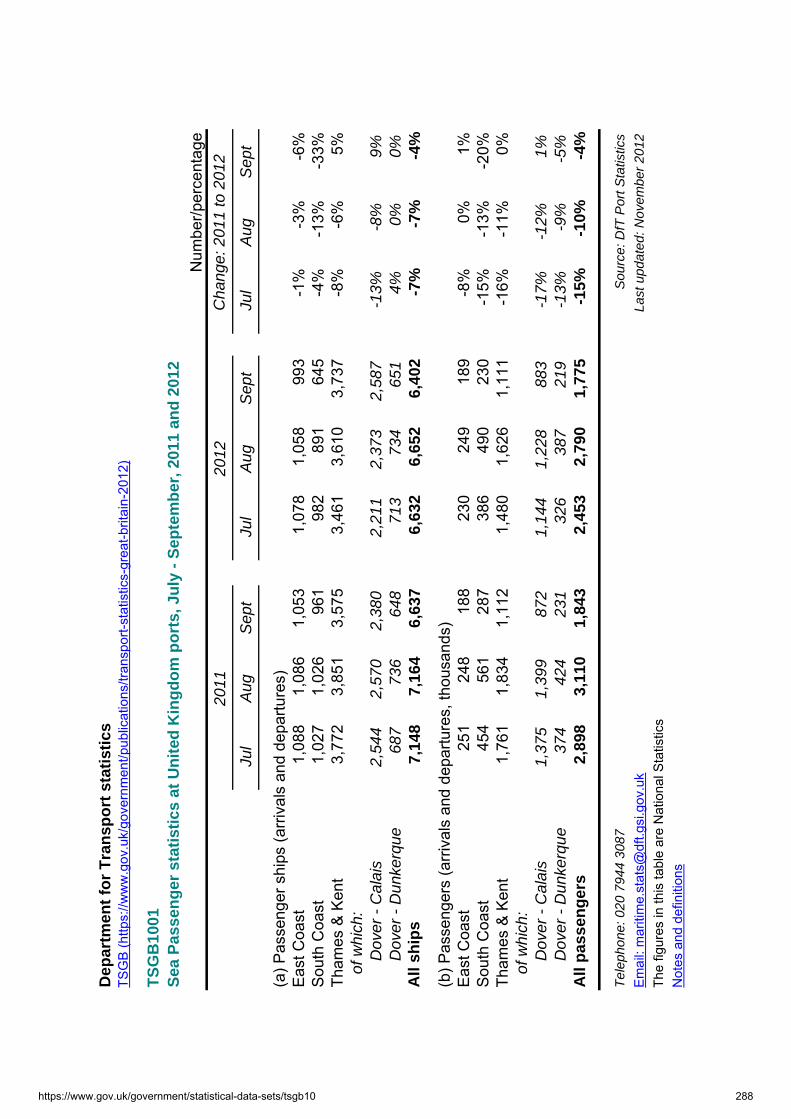
Dep
artm
ent
for
Tra
nsp
ort
sta
tist
ics
TSG
B (h
ttps:
//ww
w.g
ov.u
k/go
vern
men
t/pub
licat
ions
/tran
spor
t-sta
tistic
s-gr
eat-b
ritai
n-20
12)
TS
GB
1001
Sea
Pas
sen
ger
sta
tist
ics
at U
nit
ed K
ing
do
m p
ort
s, J
uly
- S
epte
mb
er, 2
011
and
201
2
Num
ber/p
erce
ntag
e20
1120
12
Jul
Aug
Sep
tJu
lA
ug S
ept
Jul
Aug
Sep
t
(a) P
asse
nger
shi
ps (a
rriv
als
and
depa
rture
s)E
ast C
oast
1,08
81,
086
1,05
31,
078
1,05
899
3-1
%-3
%-6
%S
outh
Coa
st1,
027
1,02
696
198
289
164
5-4
%-1
3%-3
3%Th
ames
& K
ent
3,77
23,
851
3,57
53,
461
3,61
03,
737
-8%
-6%
5%
of w
hich
:
D
over
- C
alai
s2,
544
2,57
02,
380
2,21
12,
373
2,58
7-1
3%-8
%9%
Dov
er -
Dun
kerq
ue68
773
664
871
373
465
14%
0%0%
All
ship
s7,
148
7,16
46,
637
6,63
26,
652
6,40
2-7
%-7
%-4
%
(b) P
asse
nger
s (a
rriv
als
and
depa
rture
s, th
ousa
nds)
Eas
t Coa
st25
124
818
823
024
918
9-8
%0%
1%S
outh
Coa
st45
456
128
738
649
023
0-1
5%-1
3%-2
0%Th
ames
& K
ent
1,76
11,
834
1,11
21,
480
1,62
61,
111
-16%
-11%
0%
of w
hich
:
D
over
- C
alai
s1,
375
1,39
987
21,
144
1,22
888
3-1
7%-1
2%1%
Dov
er -
Dun
kerq
ue37
442
423
132
638
721
9-1
3%-9
%-5
%A
ll p
asse
ng
ers
2,89
83,
110
1,84
32,
453
2,79
01,
775
-15%
-10%
-4%
Tel
epho
ne: 0
20 7
944
3087
Sou
rce:
DfT
Por
t Sta
tistic
s
Em
ail:
mar
itim
e.st
ats@
dft.g
si.g
ov.u
kLa
st u
pdat
ed: N
ovem
ber
2012
The
figur
es in
this
tabl
e ar
e N
atio
nal S
tatis
tics
Not
es a
nd d
efin
ition
s
Cha
nge:
201
1 to
201
2
https://www.gov.uk/government/statistical-data-sets/tsgb10 288

Department for Transport statisticsTSGB (https://www.gov.uk/government/publications/transport-statistics-great-britain-2012)TSGB1002Air traffic at United Kingdom airports, July-September, 2011 and 2012
Number/percentage2011 2012 Change: 2011 to 2012
Jul Aug Sept Jul Aug Sept Jul Aug Sept
(a) Air transport movements (aircraft landings and take-offs)Gatwick 23,933 24,610 22,852 23,896 22,852 22,869 0% -7% 0%Heathrow 41,607 41,166 40,529 41,125 40,529 39,624 -1% -2% -2%London City 5,162 4,957 5,521 5,743 5,521 5,501 11% 11% 0%Luton 7,146 7,106 6,774 7,128 6,774 6,712 0% -5% -1%Stansted 12,954 13,454 12,553 12,496 12,553 11,785 -4% -7% -6%All UK airports 193,963 193,810 186,904 189,489 190,568 182,411 -2% -2% -2%
(b) Terminal passengers (arrivals and departures: thousands)Gatwick 3,632 3,826 3,363 3,631 3,837 3,444 0% 0% 2%Heathrow 6,872 6,585 6,310 6,570 6,459 6,346 -4% -2% 1%London City 282 249 280 263 243 275 -7% -2% -2%Luton 1,020 1,047 937 1,015 1,043 941 0% 0% 0%Stansted 1,879 1,983 1,705 1,781 1,880 1,638 -5% -5% -4%All UK airports 23,241 23,231 21,519 22,732 23,038 21,549 -2% -1% 0%
(c) Freight handled (set down and picked up)Gatwick 7,254 7,247 7,130 9,075 8,434 7,808 25% 16% 10%Heathrow 128,075 120,939 119,087 126,501 121,469 121,135 -1% 0% 2%London City . . . . . . . .Luton 2,308 1,964 2,167 2,518 2,637 2,831 9% 34% 31%Stansted 16,935 16,663 16,975 18,391 19,074 18,470 9% 14% 9%
All UK airports 194,643 186,478 187,202 199,494 191,213 190,603 2% 3% 2%
Telephone: 020 7944 3088Email: [email protected] Notes and definitionsThe figures in this table are outside the scope of National Statistics
https://www.gov.uk/government/statistical-data-sets/tsgb10 289

Department for Transport statisticsTSGB (https://www.gov.uk/government/publications/transport-statistics-great-britain-2012)TSGB1003Punctuality at selected United Kingdom airports, July-August, 2011 and 2012
Average delay (minutes) Sample size (number of matched flights)
2011 2012 2011 2012 2011 2012 2011 2012
London airports Gatwick Scheduled 15 17 14 13 20,498 20,840 20,891 21,332Charter 22 19 17 20 3,231 2,864 3,516 3,136
Heathrow Scheduled 13 14 11 11 41,228 40,825 40,855 40,772Charter * * * * 124 64 100 64
London City Scheduled 6 6 6 4 5,161 5,740 4,948 5,347Charter * * * * 1 0
Luton Scheduled 14 14 13 11 6,381 6,399 6,475 6,422Charter 17 10 31 5 353 347 372 376
Stansted Scheduled 11 10 10 9 11,560 11,059 12,077 11,337Charter 15 6 16 16 469 510 500 572
Regional airports Birmingham Scheduled 11 12 9 11 6,653 6,916 6,499 7,078Charter 17 9 21 9 1,272 1,149 1,302 1,168
Edinburgh Scheduled 10 11 9 9 9,280 9,062 9,189 8,902Charter 29 18 25 14 309 269 219 214
Glasgow Scheduled 10 12 10 9 5,645 5,944 5,628 5,868Charter 32 18 26 24 1,190 1,048 815 747
Manchester Scheduled 15 14 13 14 12,277 12,932 12,411 12,812Charter 20 22 21 22 3,013 2,661 3,046 2,706
Newcastle Scheduled 10 11 10 9 3,466 3,421 3,408 3,351Charter 11 15 15 8 904 839 886 845
Telephone: 020 7944 3088Email: [email protected] Notes and definitionsThe figures in this table are outside the scope of National Statistics
July AugJuly Aug
https://www.gov.uk/government/statistical-data-sets/tsgb10 290

Department for Transport statisticsTSGB (https://www.gov.uk/government/publications/transport-statistics-great-britain-2012)TSGB1004National Rail Games Tickets (NRGT) revenue and sales
Week commencingWeekly NRGT revenue
(£000)Cumulative NRGT
revenue (£m)Weekly NRGT sales
(000s)Cumulative NRGT
sales (000s)
19/06/2011 4.9 0.0 0.1 0.126/06/2011 25.3 0.0 0.7 0.803/07/2011 40.8 0.1 1.2 2.010/07/2011 46.2 0.1 1.3 3.317/07/2011 23.1 0.1 0.7 4.124/07/2011 72.1 0.2 2.1 6.131/07/2011 44.9 0.3 1.3 7.407/08/2011 35.9 0.3 1.1 8.514/08/2011 34.2 0.3 1.0 9.521/08/2011 107.3 0.4 3.4 12.928/08/2011 56.4 0.5 1.8 14.704/09/2011 36.3 0.5 1.3 16.011/09/2011 32.0 0.6 1.0 17.018/09/2011 26.3 0.6 0.8 17.825/09/2011 17.7 0.6 0.6 18.502/10/2011 111.8 0.7 3.5 21.909/10/2011 38.1 0.8 1.3 23.316/10/2011 31.4 0.8 0.9 24.223/10/2011 28.7 0.8 0.9 25.130/10/2011 25.7 0.8 0.9 26.106/11/2011 29.4 0.9 1.0 27.113/11/2011 24.7 0.9 0.9 27.920/11/2011 21.3 0.9 0.7 28.627/11/2011 20.7 0.9 0.7 29.304/12/2011 18.1 1.0 0.7 30.011/12/2011 15.0 1.0 0.5 30.518/12/2011 16.5 1.0 0.5 31.125/12/2011 33.8 1.0 1.2 32.201/01/2012 82.4 1.1 3.1 35.308/01/2012 82.2 1.2 3.0 38.315/01/2012 79.8 1.3 2.9 41.122/01/2012 67.0 1.3 2.4 43.529/01/2012 85.9 1.4 3.2 46.705/02/2012 63.4 1.5 2.2 49.012/02/2012 66.0 1.5 2.4 51.419/02/2012 79.0 1.6 2.6 54.026/02/2012 137.5 1.8 5.2 59.204/03/2012 157.3 1.9 6.3 65.411/03/2012 95.1 2.0 3.8 69.218/03/2012 109.3 2.1 4.0 73.225/03/2012 93.6 2.2 3.9 77.101/04/2012 99.0 2.3 3.7 80.808/04/2012 160.4 2.5 6.6 87.315/04/2012 272.5 2.7 11.3 98.722/04/2012 227.1 3.0 10.0 108.729/04/2012 224.2 3.2 10.1 118.806/05/2012 156.9 3.4 7.7 126.513/05/2012 189.4 3.5 9.4 135.920/05/2012 220.7 3.8 11.9 147.727/05/2012 191.1 4.0 10.0 157.703/06/2012 179.6 4.1 10.1 167.810/06/2012 156.0 4.3 9.4 177.217/06/2012 169.9 4.5 9.7 186.924/06/2012 239.2 4.7 15.2 202.101/07/2012 281.2 5.0 17.0 219.008/07/2012 414.2 5.4 28.0 247.015/07/2012 542.4 5.9 37.2 284.222/07/2012 803.5 6.7 59.2 343.429/07/2012 925.4 7.7 71.3 414.705/08/2012 543.3 8.2 43.4 458.112/08/2012 116.0 8.3 8.2 466.319/08/2012 160.5 8.5 12.6 478.926/08/2012 491.9 9.0 43.0 522.002/09/2012 400.1 9.4 37.4 559.409/09/2012 11.2 9.4 1.2 560.5
Source: Association of Train Operating Companies (ATOC)Telephone: 020 7944 2419Email: [email protected]
https://www.gov.uk/government/statistical-data-sets/tsgb10 291

Department for Transport statisticsTSGB (https://www.gov.uk/government/publications/transport-statistics-great-britain-2012)
Time of dayOlympic Games
period 5
Comparable period
2011 6
Paralympic Games
period 7
Comparable period
2011 8
07.00 19.5 24.0 20.0 21.707.15 18.6 22.4 18.2 19.607.30 18.0 21.2 17.0 18.107.45 18.0 20.6 16.3 16.908.00 18.0 20.4 16.0 16.308.15 18.1 19.8 15.6 15.608.30 18.1 19.8 15.7 15.708.45 18.5 20.5 16.5 16.809.00 19.2 21.5 17.4 18.109.15 19.6 22.1 18.4 19.409.30 19.9 22.5 18.5 20.209.45 20.1 22.5 19.2 20.710.00 20.2 22.8 19.9 21.210.15 20.6 22.7 20.1 21.510.30 20.5 22.6 20.0 21.310.45 20.2 22.5 20.1 21.611.00 20.5 22.4 20.2 21.711.15 20.4 22.2 20.4 21.611.30 20.4 21.9 20.5 21.311.45 20.2 21.7 20.5 21.212.00 20.5 21.7 20.6 21.112.15 20.3 21.6 20.4 21.112.30 20.2 21.4 20.3 20.812.45 20.2 21.4 20.7 20.813.00 20.2 21.4 20.5 21.013.15 20.1 21.4 20.4 21.313.30 20.4 21.6 20.5 21.313.45 20.5 21.5 21.0 21.414.00 20.6 21.6 20.8 21.414.15 20.3 21.6 20.7 21.414.30 20.3 21.6 20.5 21.014.45 20.2 21.5 20.4 20.615.00 20.1 21.4 20.0 20.315.15 19.9 21.1 19.7 20.015.30 19.9 21.1 19.1 19.415.45 19.8 21.0 18.8 18.916.00 19.6 20.9 18.6 19.016.15 19.1 20.4 18.1 18.316.30 19.1 20.2 18.0 17.916.45 19.1 20.3 18.0 18.117.00 18.9 19.8 17.5 17.217.15 18.4 19.2 17.1 16.717.30 18.2 19.2 17.1 16.917.45 18.3 19.0 17.0 16.818.00 18.6 19.5 17.1 17.218.15 19.1 20.1 17.4 17.718.30 19.7 20.8 18.7 18.718.45 20.5 21.8 19.3 19.6
Notes and definitionsEmails: [email protected]: 020 7944 6579 Last updated: December 2012
TSGB1005
7. The Paralympic Games period was defined as 29 August - 13 September8. The comparable period in 2011 was defined as 31 August - 15 September
Average week day speed (miles per hour) on local 'A' roads in the six
London Host Boroughs 1,2,3,4
1. Average speeds in the chart above were estimated using data from weekdays only2. The six Olympic host boroughs are Barking & Dagenham, Greenwich, Hackney, Newham, Tower Hamlets and Waltham Forest3. It should be noted that the sample used to estimate average speeds may not be representative of traffic
4. Temporary factors such as road works or bad weather may have influenced the estimates of average speeds
5. The Olympic games period was defined as the period 23 July to 13 August 2012
6. The comparable period to the Olympics in 2011 was defined as 25 July to 15 August, containing same number of each day of the week as the Olympic games period
https://www.gov.uk/government/statistical-data-sets/tsgb10 292

Scottish Government Transport Publications Scottish Transport Statistics Main Transport Trends Household Transport - some SHS results Transport Across Scotland: some SHS results for parts of Scotland SHS Travel Diary results Travel by Scottish Residents: some NTS results Bus and Coach Statistics Road Accidents Scotland Key Road Accidents Statistics (SHS = Scottish Household Survey; NTS = National Travel Survey) General enquires on Scottish Transport Statistics: Transport Statistics Branch, Scottish Executive, Victoria Quay, Edinburgh, EH6 6QQ Phone: +44 (0)131-244 7256 Fax: +44 (0)131-244 7281 E-mail: [email protected] Internet: www.scotland.gov.uk/Topics/Statistics These publications are available, payment with orders From: Scottish Executive Publication Sales, Blackwell's Bookshop, 53 South Bridge, Edinburgh EH1 1YS Phone: +44 (0)131-622 8283 Fax: +44 (0)131-557 8149
Welsh Government - Llywodraeth Cymru
Transport Publications Road Casualties: Wales Welsh Transport Statistics
Other publications with transport topics Digest of Welsh Local Area Statistics Digest of Welsh Statistics Statistics for Assembly Constituency Areas Digest of Welsh Historical Statistics
These publications are available from: Central Support Unit, Statistical Directorate, Welsh Government, Cathays Park, Cathays, Cardiff CF10 3NQ Phone: +44 (0)29-2082 6960 E-mail: [email protected] Internet: http://wales.gov.uk
Northern Ireland Transport Statistics Available from: Central Statistics and Research Branch Clarence Court, 10-18 Adelaide Street, Belfast BT2 8GB Phone: +44 (0)28 9054 0801 E-mail: [email protected] Internet: http://www.drdni.gov.uk/index/statistics.htm
Transport Statistics Users Group The Transport Statistics Users Group (TSUG) was set up in 1985 as a result of an initiative by the Statistics Users Council and the Chartered Institute for Transport (now known as The Institute of Logistics and Transport). From its inception it has had strong links with the government Departments responsible for transport. The aims of the group are:
To identify problems in the provision and understanding of transport statistics and to discuss solutions with the responsible authorities.
To provide a forum for the exchange of views and information between users and providers. To encourage the use of transport statistics through greater publicity To facilitate a network for sharing ideas, information, and expertise.
The group holds regular seminars on topical subjects connected with the provision and/or use of transport statistics. Recent and upcoming seminars in 2012-13 include:
Walking Government transport data sources Buses Aviation policy Public attitudes to transport Olympic transport review Cycling EC rail study Coping with the results of Growth
A newsletter is sent to all members about four times a year. Corporate membership of the Group is £50, personal membership £22.50, and student membership £10. For further details please visit www.tsug.org.uk or contact: Kirsty Novis Transport for London 11th Floor Palestra 197 Blackfriars Road London SE1 8NJ Tel: 020 3054 1076 Fax: 020 3054 2004 Email: [email protected] The TSUG also produces a Transport Yearbook which contains information on sources from governmental and non-governmental organisations, including some European sources. The yearbook is supplied free to TSUG members. Non-members can purchase a copy from The Stationery Office (TSO).
Scottish, Welsh, Northern Ireland Statistics and TSUG 293

CLIP TRANSPORT STATISTICS CLIP Transport Statistics (CLIP-TS) is a sub-group of the Central and Local (Government) Information Partnership (CLIP), the main forum for discussion between central and local government on statistical matters. Its formal terms of reference are: To act as a forum for consultation between DfT and local authorities on any transport statistics
of interest to either side that are not dealt with by other groups; and on any gaps in the Department's coverage.
To act as a point of contact between local authorities and DfT on statistical matters of common concern, including the statistics needed for the monitoring of Local Transport Plans, Local Indicators, Regional and Local Statistics and other relevant matters.
CLIP-TS comprises of a Local Authority side and a DfT side. The LA side represents the Passenger Transport Authorities, Shire Counties, Unitary Authorities and London Boroughs. Transport for London also attends in observer status. Recent work of the group has centred on the information requirements for the single data list, transport indicators, and national data collections. This and other useful information is shown on the group's website which can be found at: http://www.clip.local.gov.uk/lgv/core/page.do?pageId=31640 Who sits on the group? Darren Stillwell - Statistician, Buses and Local Transport Statistics, Department for Transport (Chair) Paul Syron - Buses and Local Transport Statistics, Department for Transport (Secretary) Claire Horton - Staffordshire County Council (LA Lead) Tim Stamp - Chief Statistician, Statistics Travel and Safety Division, Department for Transport Jay Symonds - Statistician, Statistics Roads and Freight Division, Department for Transport Christine King - South Yorkshire Passenger Transport Executive Keith Rogers - Solihull MBC Colin Shepherd - Transport for London William Bryans - Surrey County Council Graham Amis – Cambridgeshire County Council Tim Harvey – Leeds City Council Keith Dove – Luton Borough Council Graeme Mateer – Suffolk County Council Matthew Jones – Sustrans Jessica Anderson – Tyne and Wear For further information contact; Clare Horton Transport Policy Officer Staffordshire County Council Development Services Directorate Riverway Stafford ST16 3TJ Tel: 01785 276 636 Fax: 01785 276 621 Email: [email protected]
Scottish, Welsh, Northern Ireland Statistics and TSUG 294