Transport, Roads and Traffic · 903.1 billion yen), disaster prevention and safety grants (national...
7
Copyright© 2013 Society of Automotive Engineers of Japan, Inc. All rights reserved 1 Introduction More than half a century has passed since the start of full-scale efforts to build up Japan’s road network. As construction and maintenance requirements have evolved, the national road network has come to play a major role as a foundation supporting the social and eco- nomic activities of the country. Currently, Japan is facing up to a number of serious and unprecedented issues, including actual population decline, a severely aging society, tight financial restric- tions, increasingly severe international competition, and global environmental problems. Unparalleled natural disasters such as the Great East Japan Earthquake have also brought to the surface fragilities in Japan’s national infrastructure that must be addressed. Japan carried out a period of concentrated road con- struction during its years of high economic growth. Roads and road infrastructure, especially bridges, that were built during this time are aging rapidly and are likely to require more repair and renewal work. Mea- sures to extend the lifetime of Japan’s road stock are being implemented to address this issue, but actions by municipalities (i.e., cities, towns, and villages) that hold a large portion of Japan’s road stock have been delayed for engineering or financial reasons. With this background, this article describes the situa- tion and trends of Japan’s roads, road traffic, and trans- portation. 2 Roads 2. 1. Road statistics Table 1 summarizes the current statistics for roads in Japan (1) . As of April 1, 2011, Japan had a total of 1,204,743.5 km of general public roads. This does not in- clude the 7,920.2 km of national expressways. Fig. 1 lists the types, total real lengths, and proportions of each road category. Compared to national expressways, which account for less than 1% of the total length of roads in Japan, municipal roads account for 84.1% of the total length, a large majority. 2. 2. Outline of the road-related budget Table 2 shows an overview of the road related budget in 2013 (2) . The overall policy for implementing the road budget emphasizes the rapid restoration of roads in ar- eas affected by the Great East Japan Earthquake and the building of roads to support restoration efforts, the pro- motion of road construction for core logistics networks and the like that are critical to strengthening Japan’s foundation for growth, as well as the promotion of work to help improve the safety of local societies on school routes and the like. Comparing individual items on a year-to-year basis, the operation and maintenance item under the directly supervised budget increased by 1.17 times from the pre- vious year. This reflects the emphasis being placed on thorough and general safety inspections as well as mea- sures to counter the aging of Japan’s road infrastructure to protect the lives and livelihood of the public. The snow removal item was added to the subsidized programs (9.8 billion yen). As a related effect, the cost of subsidized programs increased by 1.19 times from the previous year. Grants for snow removal had been established as a temporary item but were reinstated for this budget due to strong requests from local authorities Transport, Roads and Traffic Shigeru Inano 1) 1)Ministry of Land, Infrastructure, Transport and Tourism Fig. 1 Proportions of road types by length. 84.1% 0.7% 1.9% 2.6% National expressway National highways (state-managed) National highways (regionally-managed) Prefectural roads Municipal roads 10.7%
Transcript of Transport, Roads and Traffic · 903.1 billion yen), disaster prevention and safety grants (national...
Copyright© 2013 Society of Automotive Engineers of Japan, Inc. All rights reserved
1 Introduction
More than half a century has passed since the start of full-scale efforts to build up Japan’s road network. As construction and maintenance requirements have evolved, the national road network has come to play a major role as a foundation supporting the social and eco-nomic activities of the country.Currently, Japan is facing up to a number of serious
and unprecedented issues, including actual population decline, a severely aging society, tight financial restric-tions, increasingly severe international competition, and global environmental problems. Unparalleled natural disasters such as the Great East Japan Earthquake have also brought to the surface fragilities in Japan’s national infrastructure that must be addressed.Japan carried out a period of concentrated road con-
struction during its years of high economic growth. Roads and road infrastructure, especially bridges, that were built during this time are aging rapidly and are likely to require more repair and renewal work. Mea-sures to extend the lifetime of Japan’s road stock are being implemented to address this issue, but actions by municipalities (i.e., cities, towns, and villages) that hold a large portion of Japan’s road stock have been delayed for engineering or financial reasons.With this background, this article describes the situa-
tion and trends of Japan’s roads, road traffic, and trans-portation.
2 Roads
2. 1. Road statisticsTable 1 summarizes the current statistics for roads
in Japan (1). As of April 1, 2011, Japan had a total of 1,204,743.5 km of general public roads. This does not in-clude the 7,920.2 km of national expressways. Fig. 1 lists the types, total real lengths, and proportions of each road category. Compared to national expressways, which
account for less than 1% of the total length of roads in Japan, municipal roads account for 84.1% of the total length, a large majority.2. 2. Outline of the road-related budgetTable 2 shows an overview of the road related budget
in 2013 (2). The overall policy for implementing the road budget emphasizes the rapid restoration of roads in ar-eas affected by the Great East Japan Earthquake and the building of roads to support restoration efforts, the pro-motion of road construction for core logistics networks and the like that are critical to strengthening Japan’s foundation for growth, as well as the promotion of work to help improve the safety of local societies on school routes and the like.Comparing individual items on a year-to-year basis,
the operation and maintenance item under the directly supervised budget increased by 1.17 times from the pre-vious year. This reflects the emphasis being placed on thorough and general safety inspections as well as mea-sures to counter the aging of Japan’s road infrastructure to protect the lives and livelihood of the public.The snow removal item was added to the subsidized
programs (9.8 billion yen). As a related effect, the cost of subsidized programs increased by 1.19 times from the previous year. Grants for snow removal had been established as a temporary item but were reinstated for this budget due to strong requests from local authorities
Transport, Roads and Traffic
Shigeru Inano1)
1)Ministry of Land, Infrastructure, Transport and Tourism
Fig. 1 Proportions of road types by length.
84.1%
0.7%1.9%
2.6%
National expresswayNational highways (state-managed)National highways (regionally-managed)Prefectural roadsMunicipal roads
10.7%
Copyright© 2013 Society of Automotive Engineers of Japan, Inc. All rights reserved
for national government support in clearing large falls of snow.2. 3. Status of road infrastructure (3)
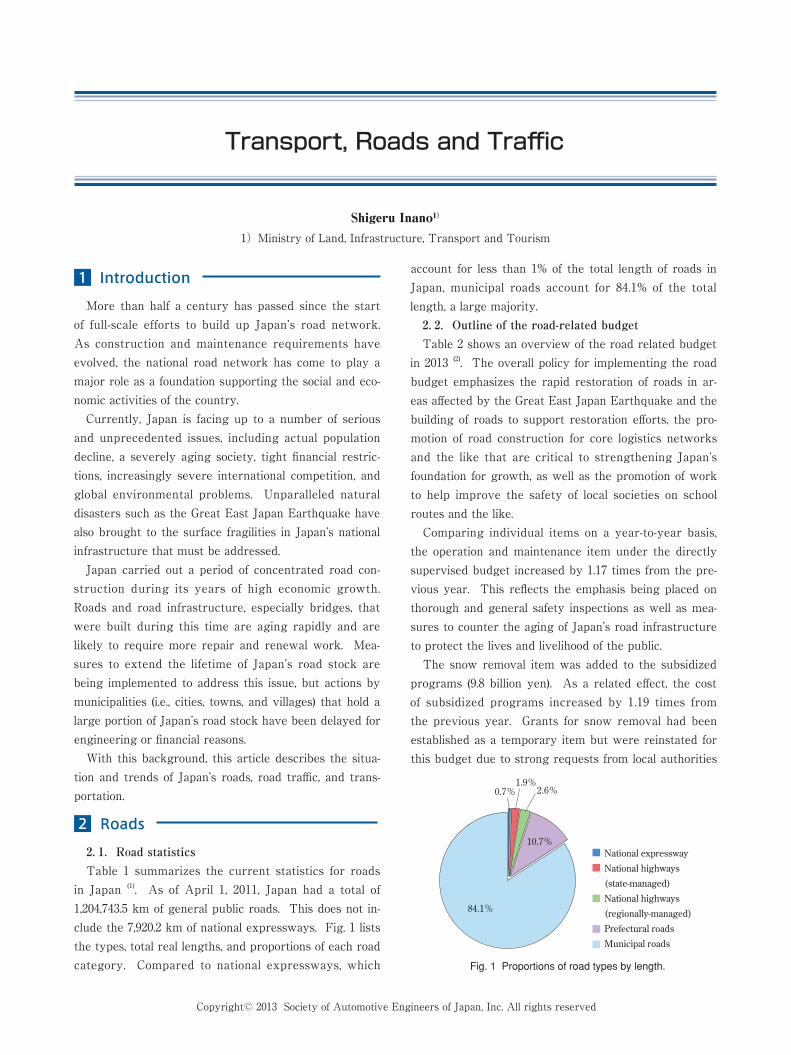
Fig. 2 shows the trends for the year of road bridge
construction and Fig. 3 shows the breakdown of ju-risdiction for these bridges. Japan has approximately 700,000 road bridges with a length of 2 meters or more. The bridge construction peak occurred during Japan’s
Table 1 Road types and statuses.
(As of April 1, 2011)
Category Total real length (km)
Maintained roads
Improved roads Paved roads Roads with at least four lanes
Roads with pavements
Aver-age overall width of road (m)
Aver-age width of road-way (m)
Mainte-nance rate (%)
Length of main-tained
roads (km)
Improve-ment ratio (%)
Length of improved roads (km)
Paved ratio (%)
Length of paved roads (km)
Including simple paving
Ratio (%)
Length (km)
Ratio (%)
Length (km)
Paved ratio (%)
Length of paved roads (km)
National highways (State-managed) (Regionally-managed)National highway totalMain regional roadsGeneral prefectural roadsPrefectural road totalNational and pre-fectural road totalMunicipal roads
Total
23 205.331 909.155 114.457 900.871 442.1129 343.0184 457.4
1 020 286.11 204 743.5
61.969.066.063.354.258.360.6
57.157.7
14 372.322 027.336 399.636 676.138 695.475 372.0111 771.6
583 055.4694 827.0
100.086.191.977.761.468.775.6
57.160.0
23 201.727 461.750 663.444 965.743 877.288 842.9139 506.3
583 055.4722 561.7
98.786.491.673.154.762.971.5
18.626.7
22 909.627 578.550 488.142 340.939 043.481 384.3131 872.4
189 388.4321 260.8
100.099.099.498.195.396.697.4
77.580.5
23 205.331 579.954 785.356 789.168 105.6124 894.7179 679.9
790 493.0970 172.9
24.66.013.86.23.04.47.2
0.51.5
5 705.01 902.97 607.83 598.82 118.65 717.413 325.3
5 312.918 638.2
68.154.360.145.732.138.244.7
8.714.2
15 804.117 311.633 115.726 481.322 927.449 408.782 524.4
88 420.2170 944.6
15.911.213.210.78.89.710.7
5.26.1
9.66.98.06.75.76.16.7
3.84.3
Notes:1 . Excluding national expressways.2 . The maintenance rate and length of maintained roads are estimated figures based on the 2010 Road Traffic Census.3 . For municipal roads, the maintenance rate and length of maintained roads are the improvement ratio and length of improved roads.4 . For the improvement ratio and length of improved roads, prefectural roads and above have a minimum roadway width of 5.5 m.5 . The paved road section includes the figure for roads both including (right column) and excluding (left column) those with a simple paved surface.
6 . A road with at least four lanes must be improved and have a roadway width of at least 13.0 km.7 . Due to the effects of the Great East Japan Earthquake, the data for some municipal roads is from April 4, 2010.
Table 2 2013 road-related budget.
(Unit: 100 million yen)
2013 figure (A)
Budget of previous year (B)
Rate of difference (A/B)
Items under direct supervision 12 029 11 851 1.02
Reconstruction, etc.Operation and maintenanceService expenses
8 4372 5151 078
8 5502 1581 143
0.991.170.94
Subsidized programs 614 516 1.19
Regional high-grade roads, etc.Snow removalGovernment bond redemptions (exclud-ing regional high-grade roads), amount of difference in grants, etc.
4649852
450─66
1.03Increased from zero
0.79
Toll road items, etc. 683 885 0.77
Total 13 327 13 251 1.01
* Other items include the Social Capital Improvement Grant program (national expenditure: 903.1 billion yen), disaster prevention and safety grants (national expenditure: 1,046.0 billion yen), and the like. These can be allotted to road maintenance by local request.
* Additionally, national expenditure for recovery and restoration work after the Great East Japan Earthquake was 138.4 billion yen. The Social Capital Improvement Grant program is also used for this recovery and restoration work and can be allotted to road maintenance by local request.
Notes:1 . Further items include administrative costs (national expenditure: 0.9 billion yen)2 . Individual figures are rounded up and do not match exactly to the totals given.
Copyright© 2013 Society of Automotive Engineers of Japan, Inc. All rights reserved
period of rapid economic growth. Consequently, the av-erage age of bridges in Japan is 35 years. According to Fig. 3, approximately 70% of bridges are under municipal jurisdiction. Roughly 20% of bridges are more than 50 years old, a figure that is predicted to increase to rough-ly 40% in ten years time and roughly 70% in 20 years time.
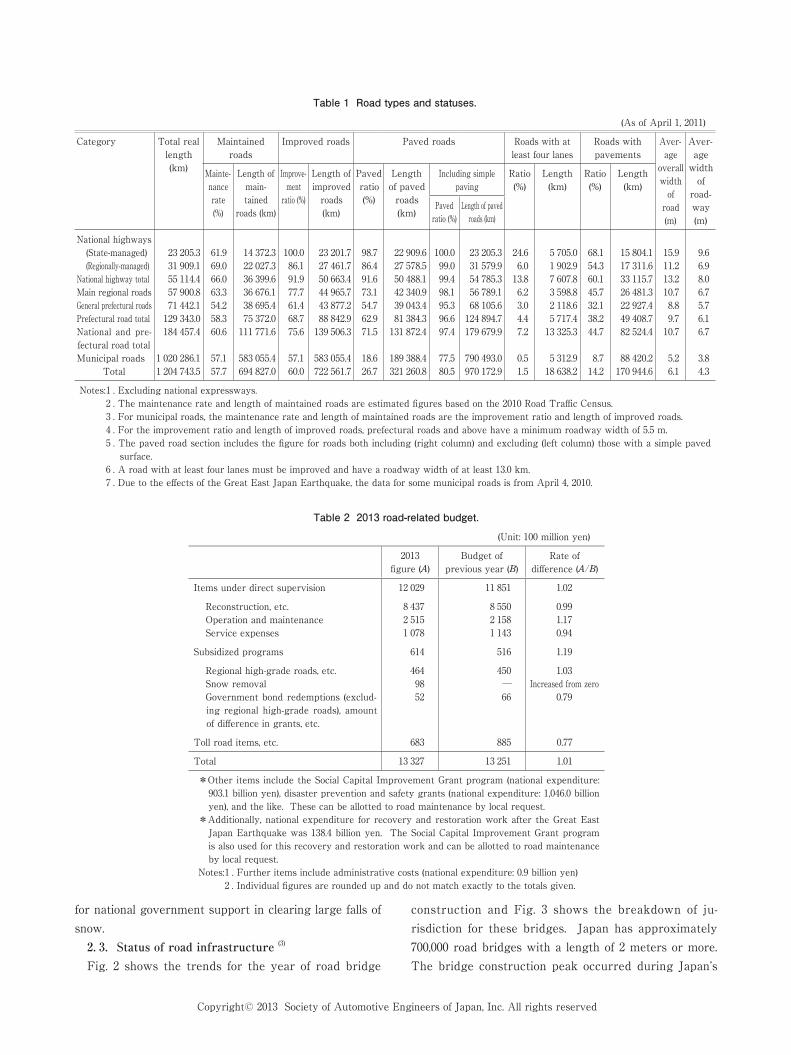
Fig. 4 shows the trends for the year of road tunnel construction and Fig. 5 shows the breakdown of these tunnel. Japan has more than 10,000 tunnels, most of which were built after Japan’s period of rapid economic growth. The average age of tunnels in Japan is 33 years and approximately 50% are under prefectural jurisdic-tion.
Fig. 2 Number of bridges per year of construction.
1980198519901995200020052010
Note: In addition, there are about 301,000 older bridges and the like with no recorded construction date.
Expressway companies MLIT Prefectures Shared MLIT/prefectures Municipalities
Period of rapid economic growth
Average age: 35 years
~192019251930193519401945195019551960196519701975
14 000
12 000
10 000
8 000
6 000
4 000
2 000
0
(Bridges)
Fig. 3 Number of bridges per jurisdiction.
Undermunicipaljurisdiction:
Approx. 480,00068%
Expressway companies2%
Bridges:Approx. 699,000
MLIT4%
Prefectures19%
Shared MLIT/prefectures7%Municipalities
68%
Fig. 4 Number of tunnels per year of construction.
Notes:In addition, there are about 250 older tunnels and the like with no recorded construction date.*No data for 2011 to 2012
Period of rapid economic growth
~192019251930193519401945195019551960196519701975
350
300
250
200
150
100
50
0
Number of tunnels
1980198519901995200020052010
Average age: 33 years
Expressway companies MLIT Prefectures Shared MLIT/prefectures Municipalities
Fig. 5 Number of tunnels per jurisdiction.
Prefectures46%
Tunnels:Approx. 10,300
MLIT13%
Shared MLIT/prefectures3%
Municipalities23%
Expresswaycompanies15%
Under prefecturaljurisdiction:
Approx. 47,00046%
Copyright© 2013 Society of Automotive Engineers of Japan, Inc. All rights reserved
These figures show that prefectures and municipalities are responsible for the vast majority of road infrastruc-ture. The proportion of structures that are still in use more than 50 years after construction is rapidly increas-ing and the whole of Japan’s infrastructure is aging. Re-gardless of jurisdiction, each type of structure must be maintained appropriately, and repair and renewal work carried out as required to ensure that road traffic can use Japan’s road network safely and smoothly. The re-quired organizations and standards must be established to ensure that this occurs.
3 Traffic
3. 1. Traffic volumes and commercial vehicle ratios (4)
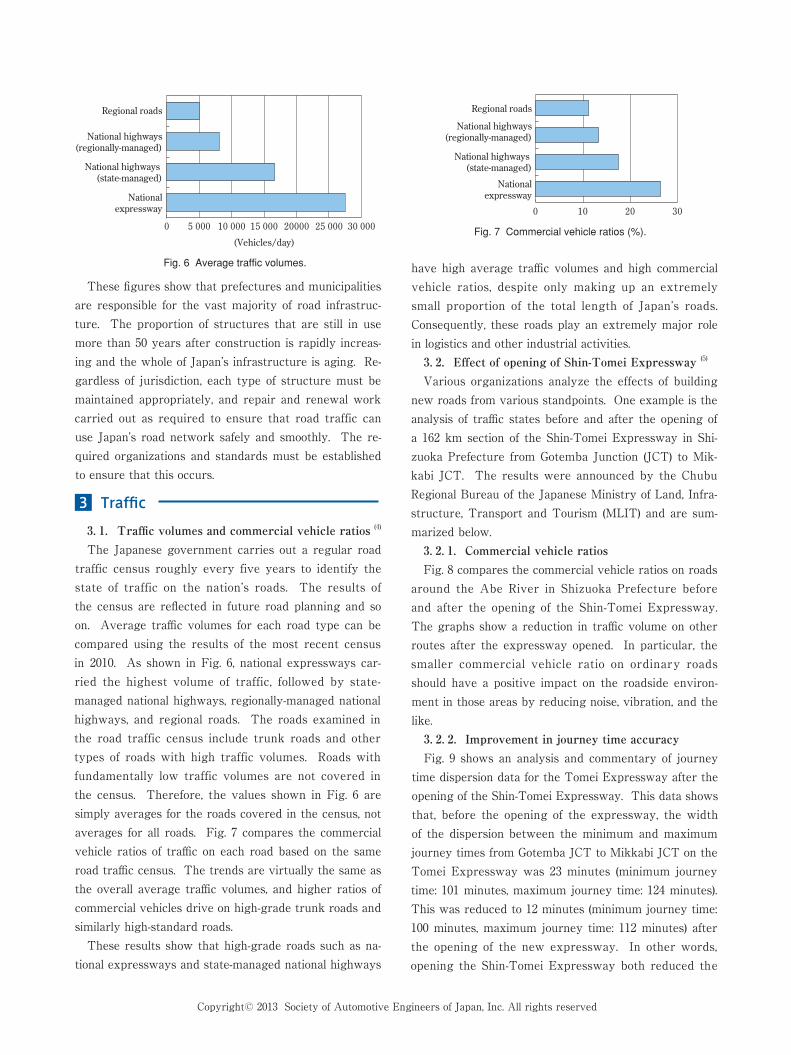
The Japanese government carries out a regular road traffic census roughly every five years to identify the state of traffic on the nation’s roads. The results of the census are reflected in future road planning and so on. Average traffic volumes for each road type can be compared using the results of the most recent census in 2010. As shown in Fig. 6, national expressways car-ried the highest volume of traffic, followed by state-managed national highways, regionally-managed national highways, and regional roads. The roads examined in the road traffic census include trunk roads and other types of roads with high traffic volumes. Roads with fundamentally low traffic volumes are not covered in the census. Therefore, the values shown in Fig. 6 are simply averages for the roads covered in the census, not averages for all roads. Fig. 7 compares the commercial vehicle ratios of traffic on each road based on the same road traffic census. The trends are virtually the same as the overall average traffic volumes, and higher ratios of commercial vehicles drive on high-grade trunk roads and similarly high-standard roads.These results show that high-grade roads such as na-
tional expressways and state-managed national highways
have high average traffic volumes and high commercial vehicle ratios, despite only making up an extremely small proportion of the total length of Japan’s roads. Consequently, these roads play an extremely major role in logistics and other industrial activities.3. 2. Effect of opening of Shin-Tomei Expressway (5)
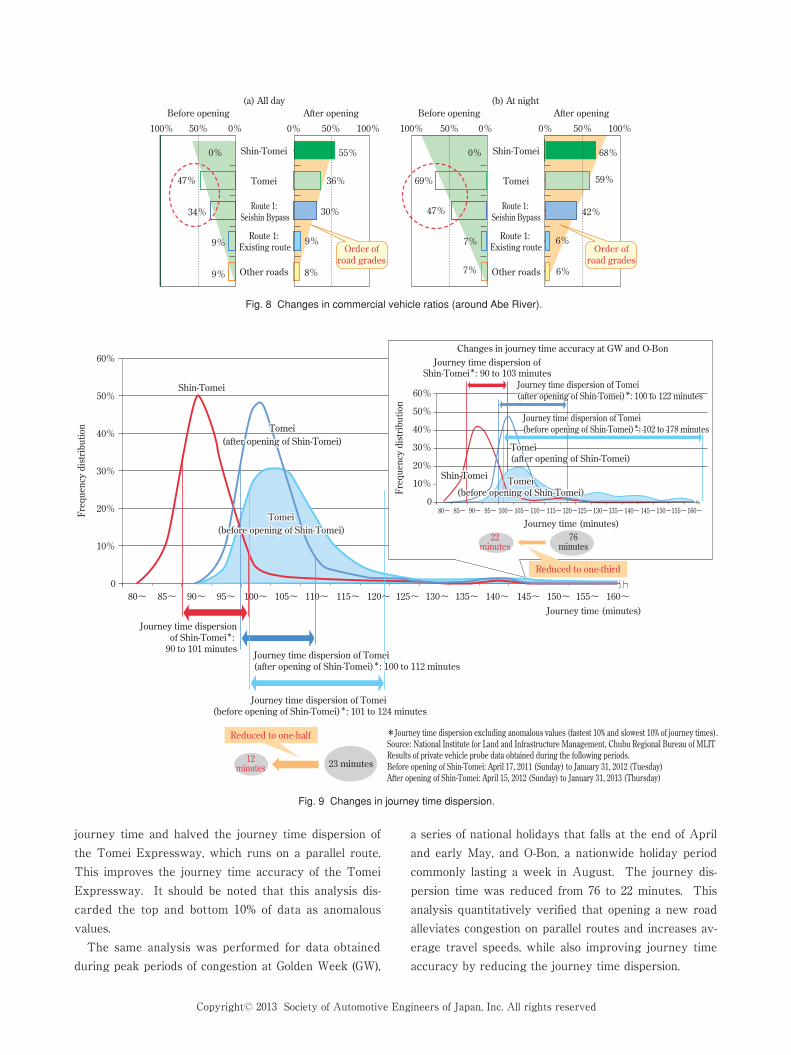
Various organizations analyze the effects of building new roads from various standpoints. One example is the analysis of traffic states before and after the opening of a 162 km section of the Shin-Tomei Expressway in Shi-zuoka Prefecture from Gotemba Junction (JCT) to Mik-kabi JCT. The results were announced by the Chubu Regional Bureau of the Japanese Ministry of Land, Infra-structure, Transport and Tourism (MLIT) and are sum-marized below.3. 2. 1. Commercial vehicle ratiosFig. 8 compares the commercial vehicle ratios on roads
around the Abe River in Shizuoka Prefecture before and after the opening of the Shin-Tomei Expressway. The graphs show a reduction in traffic volume on other routes after the expressway opened. In particular, the smaller commercial vehicle ratio on ordinary roads should have a positive impact on the roadside environ-ment in those areas by reducing noise, vibration, and the like.3. 2. 2. Improvement in journey time accuracyFig. 9 shows an analysis and commentary of journey
time dispersion data for the Tomei Expressway after the opening of the Shin-Tomei Expressway. This data shows that, before the opening of the expressway, the width of the dispersion between the minimum and maximum journey times from Gotemba JCT to Mikkabi JCT on the Tomei Expressway was 23 minutes (minimum journey time: 101 minutes, maximum journey time: 124 minutes). This was reduced to 12 minutes (minimum journey time: 100 minutes, maximum journey time: 112 minutes) after the opening of the new expressway. In other words, opening the Shin-Tomei Expressway both reduced the
Fig. 6 Average traffic volumes.
0 5 000 10 000 15 000 20000 25 000 30 000
Regional roads
National highways (regionally-managed)
National highways (state-managed)
Nationalexpressway
(Vehicles/day)Fig. 7 Commercial vehicle ratios (%).
Regional roads
National highways (regionally-managed)
National highways (state-managed)
Nationalexpressway
0 10 20 30
Copyright© 2013 Society of Automotive Engineers of Japan, Inc. All rights reserved
journey time and halved the journey time dispersion of the Tomei Expressway, which runs on a parallel route. This improves the journey time accuracy of the Tomei Expressway. It should be noted that this analysis dis-carded the top and bottom 10% of data as anomalous values.The same analysis was performed for data obtained
during peak periods of congestion at Golden Week (GW),
a series of national holidays that falls at the end of April and early May, and O-Bon, a nationwide holiday period commonly lasting a week in August. The journey dis-persion time was reduced from 76 to 22 minutes. This analysis quantitatively verified that opening a new road alleviates congestion on parallel routes and increases av-erage travel speeds, while also improving journey time accuracy by reducing the journey time dispersion.
Fig. 8 Changes in commercial vehicle ratios (around Abe River).
Shin-Tomei
Tomei
Route 1: Seishin Bypass
Route 1: Existing route
Other roads
Shin-Tomei
Tomei
Route 1: Seishin Bypass
Route 1: Existing route
Other roads
(a) All dayBefore opening After opening
(b) At nightBefore opening After opening
0%50%100% 0% 50% 100% 0%50%100% 0% 50% 100%
0% 55% 0% 68%
59%
42%
6%
6%
69%
47%
7%
7%
36%
30%
9%
8%
47%
34%
9%
9%
Order ofroad grades
Order ofroad grades
Fig. 9 Changes in journey time dispersion.
60%
50%
40%
30%
20%
10%
080~
Journey time dispersionof Shin-Tomei*: 90 to 101 minutes
Shin-Tomei
Journey time dispersion ofShin-Tomei*: 90 to 103 minutes
Changes in journey time accuracy at GW and O-Bon
Tomei(before opening of Shin-Tomei)
Tomei(before opening of Shin-Tomei)
Tomei(after opening of Shin-Tomei)
Tomei(after opening of Shin-Tomei)
Journey time dispersion of Tomei(after opening of Shin-Tomei)*: 100 to 112 minutesJourney time dispersion of Tomei (after opening of Shin-Tomei)*: 100 to 112 minutes
Journey time dispersion of Tomei (before opening of Shin-Tomei)*: 101 to 124 minutes
85~ 90~ 95~ 100~ 105~ 110~ 115~ 120~ 125~ 130~ 135~ 140~ 145~ 150~ 155~ 160~Journey time (minutes)
60%
50%
40%
30%
20%
10%
080~ 85~ 90~ 95~ 100~105~110~ 115~120~125~130~135~140~ 145~150~155~160~
Journey time (minutes)
Reduced to one-half
Reduced to one-third
12minutes 23 minutes
*Journey time dispersion excluding anomalous values (fastest 10% and slowest 10% of journey times).Source: National Institute for Land and Infrastructure Management, Chubu Regional Bureau of MLIT Results of private vehicle probe data obtained during the following periods.Before opening of Shin-Tomei: April 17, 2011 (Sunday) to January 31, 2012 (Tuesday)After opening of Shin-Tomei: April 15, 2012 (Sunday) to January 31, 2013 (Thursday)
Tomei(before opening of Shin-Tomei)
Tomei(before opening of Shin-Tomei)
Journey time dispersion of Tomei (before opening of Shin-Tomei)*: 102 to 178 minutesJourney time dispersion of Tomei (before opening of Shin-Tomei)*: 102 to 178 minutes
Journey time dispersion of Tomei(after opening of Shin-Tomei)*: 100 to 122 minutesJourney time dispersion of Tomei(after opening of Shin-Tomei)*: 100 to 122 minutes
Frequency distribution
Frequency distribution
22minutes
76minutes
Shin-TomeiShin-Tomei
Tomei(after opening of Shin-Tomei)Tomei(after opening of Shin-Tomei)
Copyright© 2013 Society of Automotive Engineers of Japan, Inc. All rights reserved
In the near future, it should be possible to perform this kind of detailed road traffic journey time accuracy analysis throughout the whole year as vehicle navigation systems with communication functions become more widespread, enabling the measurement of travel speed and other data in all time periods.
4 Transport
4. 1. Net National Freight Circulation Survey (6)
4. 1. 1. Outline of SurveyMLIT carries out the Net National Freight Circula-
tion Survey to obtain statistics on freight transportation throughout Japan. The aim of this survey is to obtain data about the movement of freight from the standpoint of shippers to identify the net circulation of goods from the point of shipment to the point of delivery via any points of re-loading. The survey has been carried out once every five years from 1970. Two types of surveys are carried out; the Yearly Survey and the Three-Day Survey. The 2010 Yearly Survey was performed from April 2009 to March 2010 to obtain an outline of freight shipments in that period. The 2010 Three-Day Survey was carried out over three days in October 2010 to iden-tify detailed information about the circulation of particu-lar shipments. Consequently, the 2010 Yearly Survey provides an image of Japan’s logistics immediately before the Great East Japan Earthquake.The survey targets the major freight-moving business-
es: mining, manufacturing, wholesaling, and warehous-ing. It extracts data from around 11% of approximately 610,000 businesses. In addition to surveying individual companies, MLIT also asks for the cooperation of indus-try groups, truck cooperatives, the headquarters of ma-jor transport companies, and the like.4. 1. 2. Annual trendsThe total volume of freight transported within Japan
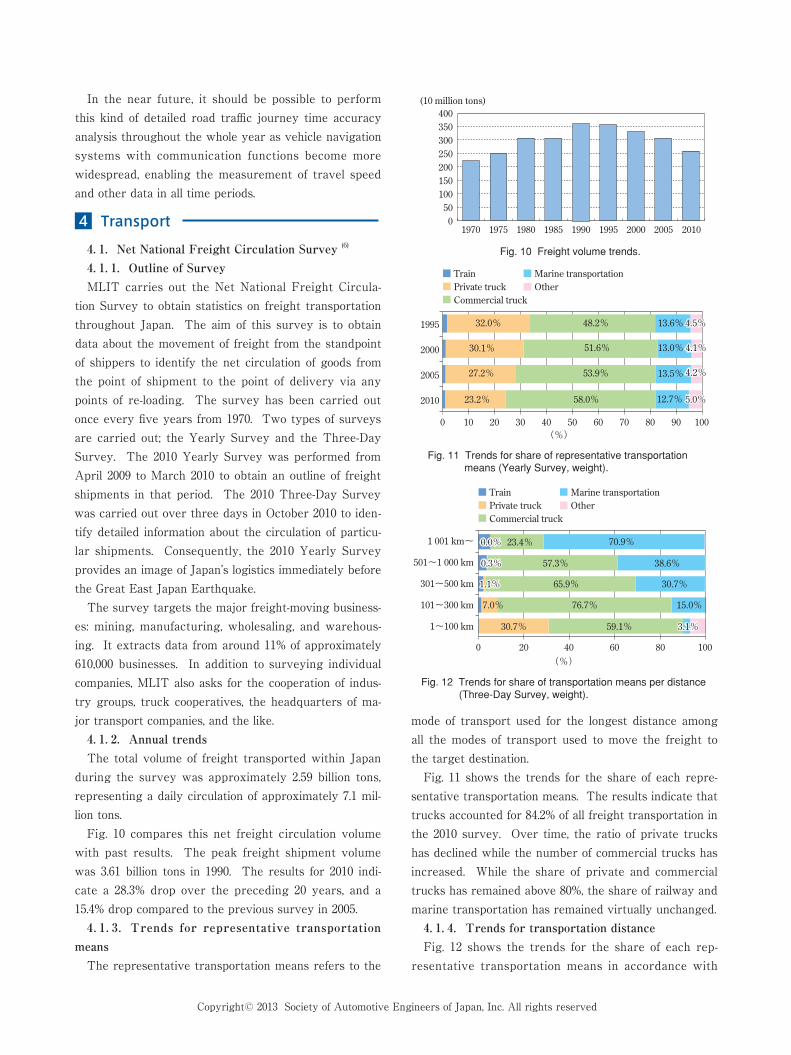
during the survey was approximately 2.59 billion tons, representing a daily circulation of approximately 7.1 mil-lion tons.Fig. 10 compares this net freight circulation volume
with past results. The peak freight shipment volume was 3.61 billion tons in 1990. The results for 2010 indi-cate a 28.3% drop over the preceding 20 years, and a 15.4% drop compared to the previous survey in 2005.4. 1. 3. Trends for representative transportation
meansThe representative transportation means refers to the
mode of transport used for the longest distance among all the modes of transport used to move the freight to the target destination.Fig. 11 shows the trends for the share of each repre-
sentative transportation means. The results indicate that trucks accounted for 84.2% of all freight transportation in the 2010 survey. Over time, the ratio of private trucks has declined while the number of commercial trucks has increased. While the share of private and commercial trucks has remained above 80%, the share of railway and marine transportation has remained virtually unchanged.4. 1. 4. Trends for transportation distanceFig. 12 shows the trends for the share of each rep-
resentative transportation means in accordance with
Fig. 10 Freight volume trends.
050100150200250300350400
(10 million tons)
1970 1975 1980 1985 1990 1995 2000 2005 2010
Fig. 11 Trends for share of representative transportation means (Yearly Survey, weight).
0 10
1995
2000
2005
2010
20 30 40 50 60 70 80 90 100
TrainPrivate truckCommercial truck
Marine transportationOther
(%)
32.0% 48.2% 13.6% 4.5%
4.1%
4.2%
5.0%
4.5%
30.1% 51.6% 13.0% 4.1%
27.2% 53.9% 13.5% 4.2%
23.2% 58.0% 12.7% 5.0%
0 20 40 60 80 100
TrainPrivate truckCommercial truck
Marine transportationOther
Fig. 12 Trends for share of transportation means per distance (Three-Day Survey, weight).
1 001 km~
501~1 000 km
301~500 km
101~300 km
1~100 km
0.0%
0.3%
1.1%
0.0%
0.3%
1.1%
7.0%
30.7% 59.1% 3.1%3.1%
76.7% 15.0%
65.9% 30.7%
57.3% 38.6%
23.4% 70.9%
(%)
Copyright© 2013 Society of Automotive Engineers of Japan, Inc. All rights reserved
transportation distance. As the transportation distance becomes longer, the share of trucks decreases and the share of marine transportation increases. In particular, the share of private trucks drops dramatically as the distance increases. In contrast, commercial trucks main-tain a 23.4% share even when the distance exceeds 1,000 km. The“other”category in Figs. 11 and 12 refers to extremely short distance means of transportation such as pipelines, belt conveyors, and the like for carrying freight from one storage area to another in neighboring facilities, and so on.4. 2. Inter-Regional Travel Survey (7)
Japan carries out the Inter-Regional Travel Survey to quantitatively and comprehensively identify the state of passenger travel on major transportation systems. This survey examines inter-prefectural travel on major transportation systems using passenger questionnaires and data obtained from transportation businesses. This survey has been carried out once every five years from 1990.The number of yearly travelers in 2010 was approxi-
mately 1.6 billion, equivalent to 13 trips per person each year. This remained virtually unchanged from the re-
sults of the previous survey in 2005 (Fig. 13).Fig. 14 shows the ratio of transportation means per
distance. For distances under 300 km, the ratio of pas-senger vehicles and the like is high. Between 300 and 700 km, the ratio of train journeys is high. Over 700 km, airplanes are the main means of transportation.
References( 1 ) Road Bureau, Ministry of Land, Infrastructure, Transport and
Tourism: ROADS IN JAPAN 2012( 2 ) Road Bureau, Ministry of Land, Infrastructure, Transport and
Tourism: Road Bureau related 2013 Budget Summary, January 29, 2013
( 3 ) Materials at Road Maintenance Technology Subcommittee, Panel on Infrastructure Development (Distributed on January 28, 2013)
( 4 ) Road Bureau, Ministry of Land, Infrastructure, Transport and Tourism: Result of 2012 Road Traffice Census
( 5 ) Shin-Tomei Expressway Effect Adjustment Committee (Shizuoka Prefecture), Press Release “The Opening of Shin-Tomei Express-way has Increased the Overall Satisfaction Rating on the Roads in the Prefecture”, April 10, 2013
( 6 ) Policy Bureau, Ministry of Land, Infrastructure, Transport and Tourism: The Result of on Net National Freight Circulation Sur-vey
( 7 ) Policy Bureau, Ministry of Land, Infrastructure, Transport and Tourism: The Outline of The 5th Inter-Regional Travel Survey
Fig. 13 Inter-regional travel.
200590(5.5) 76(4.7)
279(17.2)
263(16.2)
1 209(74.7) 1 247
(76.8)
Passenger vehicle, etc.
Route bus
Passenger ship
Train
Airplane
2010
1 600
1 400
1 200
1 000
800
600
400
200
0
(Million people/year)
Fig. 14 Ratio of transportation per distance.
Airplane Train Passenger ship Route bus Passenger vehicle, etc.
0%
3.2 95.6
10.1
16.3 80.4
2.62.6
12.4
41.4
85.7
43.7
69.1
45.2
10.8
10.0
15.3
2.72.7
49.4
87.6
Less than 100 km 23%
45%
12%
10%
5%
2%
3%
100 to less than200 km
200 to less than300 km
300 to less than500 km
500 to less than700 km
700 to less than1,000 km
1,000 km and over
20% 40% 60% 80% 100%Ratio of journeylengths in total


![[Overview of the consolidated financial results] · [Overview of the consolidated financial results] We posted revenue of 4,524.5 billion yen, up 214.7 billion yen from the previous](https://static.fdocuments.net/doc/165x107/5ed81d306ce43d1ebd3ca094/overview-of-the-consolidated-financial-results-overview-of-the-consolidated-financial.jpg)