Transport Phenomena in Direct Methanol Fuel Cells ... · Transport Phenomena in Direct Methanol...
372
Transport Phenomena in Direct Methanol Fuel Cells: Modelling and Experimental studies VÂNIA SOFIA BROCHADO DE OLIVEIRA Dissertation presented for the Doctor of Philosophy degree in Chemical And Biological Engineering at the Faculty of Engineering, University of Porto, Portugal This thesis was supervised by Doctor Alexandra Maria Pinheiro da Silva Ferreira Rodrigues Pinto, Departamento de Engenharia Química, Faculdade de Engenharia da Universidade do Porto Cento de Estudos de Fenómenos de Transporte Departamento de Engenharia Química Faculdade de Engenharia Universidade do Porto August, 2009
Transcript of Transport Phenomena in Direct Methanol Fuel Cells ... · Transport Phenomena in Direct Methanol...

Transport Phenomena in Direct Methanol Fuel Cells:
Modelling and Experimental studies
VÂNIA SOFIA BROCHADO DE OLIVEIRA
Dissertation presented for the Doctor of Philosophy degree
in Chemical And Biological Engineering
at the Faculty of Engineering, University of Porto, Portugal
This thesis was supervised by
Doctor Alexandra Maria Pinheiro da Silva Ferreira Rodrigues Pinto, Departamento de
Engenharia Química, Faculdade de Engenharia da Universidade do Porto
Cento de Estudos de Fenómenos de Transporte
Departamento de Engenharia Química
Faculdade de Engenharia
Universidade do Porto
August, 2009

ii

iii
Abstract
The main goal of this thesis was the experimental and modelling study of an active feed
Direct Methanol Fuel Cell (DMFC) working close to ambient conditions. Bearing in
mind that the passive DMFC systems emerge as a solution for portable applications, the
study was extended for passive feed DMFCs.
A steady state, one dimensional model accounting for coupled heat and mass transfer
processes along with the electrochemical reactions occurring in the fuel cell was
developed both for the active and passive feed DMFC. These simplified models using
low CPU and rapidly implemented reproduce with satisfactory accuracy experimental
data.
An experimental set-up to determine the cell polarization and power curves was
implemented. «In-house» developed active and passive feed DMFCs with 25 cm2 of
active area were designed. A detailed experimental characterization of the active DMFC
working close to room temperature is provided as well as some results with the passive
cell.
The experimental polarization and power density curves were successfully compared
with the model predictions and when it was possible, the results were explained under
the light of the model predictions for oxygen concentration profiles and for methanol
and water crossover. Both models were also validated with published data.
The effect of operating conditions (such as methanol feed concentration and fuel and air
flow rates) and of design parameters (active area, diffusion layer materials and
thickness, catalyst loading and membrane thickness) on the fuel cell performance was
evaluated. Particular attention was devoted to the influence of these parameters on
methanol and water crossover. The models predict the correct trends of the effect of the
different parameters on these two cross flows and consequently on cell performance.
The influence of different anode and cathode flow field designs on the active feed
DMFC was also studied.
The developed models were intensively used to set-up optimized conditions leading to
enhanced performances both for active and passive DMFCs. Tailored Membrane
Electrode Assemblies (MEAs) with different structures and combinations of membrane
thicknesses, diffusion layers and catalyst loadings were designed and tested in order to
select optimal working conditions with high methanol concentrations and relatively low

iv
water and methanol crossover levels, situation with increased interest in portable
applications.
The results reported in this work are relevant for the design, optimization and operation
of both active and passive Direct Methanol Fuel Cell systems.
Keywords: Direct methanol fuel cell, Modelling, Heat and mass transfer, Methanol
crossover, Water crossover, High methanol concentrations, Tailored MEAs
v
Resumo
O presente trabalho teve como objectivo o estudo experimental e de modelação de uma
célula de combustível com injecção directa e activa de metanol operando em condições
próximas das ambientais. Tendo em conta a importância crescente dos sistemas com
alimentação directa e passiva de metanol como solução para as aplicações portáteis
devido à sua simplicidade, optou-se por estender o estudo a células de metanol com
alimentação passiva.
No decurso do trabalho, foi desenvolvido um modelo matemático quer para a célula
activa quer passiva, em estado estacionário e a uma dimensão incorporando o transporte
de calor e massa bem como as reacções electroquímicas que ocorrem no ânodo e no
cátodo da célula de combustível. Estes modelos simplificados, com baixo tempo de
CPU e de rápida implementação reproduzem satisfatoriamente os dados experimentais
obtidos.
Foi desenvolvida neste estudo uma instalação experimental (incluindo uma estação de
medida para células com injecção directa de metanol e um sistema de controlo de
temperatura) para a determinação experimental das curvas de polarização e de potência.
Várias células com uma área activa de 25 cm2 foram concebidas e construídas ao longo
do trabalho. Apresenta-se um estudo experimental detalhado para a célula activa e
alguns resultados para a célula passiva.
As curvas de polarização e de potência experimentais foram comparadas com sucesso
com as previsões dos modelos e sempre que possível os resultados foram explicados à
luz das previsões para os perfis de concentração do oxigénio e para o atravessamento de
metanol e de água através da membrana. Ambos os modelos foram também validados
com dados da literatura.
O efeito das condições de operação (tais como a concentração de metanol na
alimentação ao ânodo e os caudais de solução de metanol e ar), bem como de
parâmetros de configuração (área activa, materiais que constituem as camadas de
difusão e espessura da membrana polimérica), no desempenho da célula activa e passiva
foi estudado detalhadamente. Dedicou-se particular atenção à influência dos diferentes
parâmetros no atravessamento de metanol e de água através da membrana que
condicionam a eficiência da célula de combustível.

vi
A influência da geometria dos canais distribuidores do combustível e oxidante na
eficiência da célula foi igualmente estudada.
Os modelos desenvolvidos foram intensivamente utilizados para estabelecer condições
de operação optimizadas que conduzem ao desenvolvimento de células (e pilhas) com
melhores desempenhos, tanto em sistemas de alimentação activa como passiva. Foram
propostas e testadas diferentes MEAs (conjuntos de membrana, camadas catalíticas e
camadas de difusão) com diferentes configurações, originando desempenhos
optimizados que permitem operar com elevadas concentrações de metanol, mantendo-se
em níveis relativamente baixos os fluxos de metanol e água através da membrana. Estas
condições de operação são de extremo interesse em aplicações portáteis das pilhas de
metanol directo.
Os resultados obtidos nesta tese são de relevância e utilidade significativas para o
design e construção de novas DMFCs, para a optimização de condições de operação e
para a validação de modelos matemáticos.
Palavras-chave: Célula de Combustível de Metanol Directo, Modelação, Transporte de
Calor e Massa, Atravessamento de Metanol, Atravessamento de Água, Concentrações
Elevadas de Metanol, MEAs

vii
Resumé
L’objectif de cette thèse est l’étude expérimentale et de modélisation d’une pîle à
combustible à utilisation directe et active du méthanol (Direct Methanol Fuel Cells:
DMFC) fonctionnant en conditions proches de la température ambiante. Une fois que
l’importance des systhèmes avec alimentation passive de méthanol comme une solution
d’interêt pour les applications portables, est de plus en plus haute, on a décidé d’étudier
aussi les piles de méthanol passives.
On a dévelopé um modèle mathématique pour la pile active et pour la pile passive en
régime permanent, à une dimension, qui intègre le transfert de chaleur et masse bien
comme les réactions electrochimiques de l’anode et du cathode. Ces modèles simplifiés
avec un temps de CPU baisse et de mise en oeuvre rapide, reproduisent convenablement
les données expérimentales.
Une instalation éxpérimentale a été mise en œuvre dans ce travail pour obtenir les
courbes courant-tension et de puissance. Différentes piles DMFC avec un surface
active de 25 cm2 ont été conçues et construites pendant le déroulement du travail. Un
étude experimentale détaillée pour la pile d’alimentation active est présenté bien comme
quelques résultats obtenus avec la célule passive
Les courbes expérimentales courant-tension et de puissance ont été comparées avec les
prévisions des modèles et, si possible les résultats ont été expliqués par rapport aux
prévisions des profiles de concentration d’oxygène et de l’écoulement du méthanol et de
l’eau à travers la membrane échangeuse de protons. Les deux modèles ont aussi été
validés avec des données expérimentales trouvées dans la littérature.
L’effet des conditions d’opération (concentration de méthanol et débits de méthanol et
air) et de plusieurs paramètres de configuration (surface active, matériaux qui
constituent les couches de diffusion et épaisseur de la membrane échangeuse de
protons) dans la performance de la pile active et passive á été étudié en détail. On a
dévoué une attention particulière à l’étude de l’influence des différents paramètres dans
l’écoulement de méthanol et eau qui passent à travers la membrane et qui influencent le
fonctionnement et performance de la pile.
L’influence de la géométrie des canaux de distribution de méthanol et air dans la
performance de la pile a été également étudiée.
viii
Les modèles développés on été utilisés pour établir des conditions d’opération
optimisées qui conduisent au développement de piles avec meilleures performances,
autant en systèmes d’alimentation active que passive. Différentes MEAs (groupe
membrane, couches catalytiques et couches de diffusion) avec différentes
configurations et résultant en performances optimisées qui permettent de travailler avec
hautes concentrations de méthanol et qui maintiennent le cross-over de méthanol et eau
dans des niveaux basses, on été proposées. Ces conditions d’opération sont d’extrême
importance dans les applications portables des DMFC.
Les résultats présentés dans ce travail sont déterminants pour de design et construction
de nouvelles piles DMFC, pour l’optimisation de conditions d’opération et pour la
validation de travaux de simulation numérique en ce type de piles à combustible.
Mots Clés: Pile à combustible à utilisation directe du méthanol, Modélisation, Transfert
de Chaleur et Masse, Méthanol cross-over, Cross-over de l’Eau, Hautes Concentrations
de Méthanol, MEAs

ix
To Bruno, mother, father, Ana and
to the memory of a Great man, my grandfather, Pinto

x

xi
Acknowledgements
This may be the most difficult part… since I am not, for sure, the best person in finding
the right words concerning the acknowledgments to my family and friends. I would like
to say that during these four years, I had the opportunity to meet so many wonderful
persons and I am grateful to all of them.
To Bruno, my marvellous husband, who always supported and believed in me. His
love, patience, help and understanding during these years have been determinant for the
development of my work and for the concretization of my dream. For everything we
have shared, my deepest gratitude and love. Without your support everything would be
more difficult.
To my Mother and Father who have always supported me and made sacrifices for
giving me all possible advantages in my life. They always have been and will be my
inspiration. For all your love I will give you all my love.
To Ana, my lovely sister, for all the friendship and love and for being the best gift that I
have received from my parents. You are simple the best!!!
Most important, I am grateful to my supervisor Dr. Alexandra Pinto, for believing in
me and for giving me the opportunity to do this interesting PhD. For your supervision,
support and friendship during these four years. It was a pleasure to work with you and
find out the amazing person you are. Your enthusiasm and knowledge is enormous and
inspires everyone that works with you.
I would like to thank to Prof. Fernando Martins for his help in the simulation studies.
I also, want to thank to all my friends from E319, João, Herney, Sofia, Klara , Filipa ,
Joana, Daniela, Marta, Pedro, Tiago, Renato, in Faculty of Engineering in Oporto
University (FEUP).
Particularly, to you Daniela for your support, friendship and help during these four
years. I wish you all the luck for your PhD and I hope we can work together in the
future. I believe that you will make it!!!

xii
To, Joana, Marta , Sofia and Eliana, for your support, friendship, help and good
advices during these years. I will never forget you!!!
I would like to thank the partial support of “Fundação para a Ciência e Tecnologia
(FCT)” through project POCTI/EQU/47054/2002 is gratefully acknowledged. POCI
(FEDER) also supported this work via CEFT. I also like to thank FCT the financial
support of my scholarship, ref. SFRH/BD/18681/2004, making this thesis possible and
the concretization of my dream.
Finally, to all the people who made this thesis possible.
xiii
List of publications
1. Oliveira, V.B, Falcão, D.S., Rangel, C.M. and Pinto, A.M.F.R., A comparative
study of approaches to direct methanol fuel cells modelling, International Journal of
Hydrogen Energy 32 (2007) 415-424.
2. Oliveira, V.B, Falcão, D.S., Rangel, C.M. and Pinto, A.M.F.R., Heat and mass
transfer effects in a direct methanol fuel cell: A 1D model, International Journal of
Hydrogen Energy, Vol. 33, Issue 17, July 2008 3818-3828.
3. Oliveira, V.B, Rangel, C.M. and Pinto, A.M.F.R., Modelling and experimental
studies on a Direct Methanol Fuel Cell working under low methanol crossover and
high methanol concentrations, International Journal of Hydrogen Energy 34 (2009)
6443-6451.
4. Oliveira, V.B, Rangel, C.M. and Pinto, A.M.F.R., Water management in direct
Methanol Fuel Cells, International Journal of Hydrogen Energy (2009),
doi:10.1016/j.ijhydene.2009.07.111
5. Oliveira, V.B, Rangel, C.M. and Pinto, A.M.F.R., Performance of a Direct Methanol
Fuel Cell operating near ambient conditions, submitted to Journal of Fuel Cell
Science and Technology.
6. Oliveira, V.B, Rangel, C.M. and Pinto, A.M.F.R., Effect of anode and cathode flow
field design on the performance of a direct methanol fuel cell, submitted to
Chemical Engineering Journal.
7. Oliveira, V.B, Rangel, C.M. and Pinto, A.M.F.R., One-dimensional and non-
isothermal model for a passive DMFC, submitted to International Journal of Heat
and Mass Transfer.
8. Oliveira, V.B, Rangel, C.M. and Pinto, A.M.F.R., Water management in a passive
DMFC, submitted to Journal of Power Sources.

xiv

xv
Table of Contents
Chapter 1 ......................................................................................................................... 1
1. INTRODUCTION ................................................................................................. 1
1.1. Fuel cells ............................................................................................................... 1
1.2. Fuel cells in society ............................................................................................... 2
1.3. History of fuel cells ............................................................................................... 4
1.4. Fuel cell description .............................................................................................. 6
1.5. Fuel cell types ....................................................................................................... 8
1.5.1. Polymer Electrolyte Membrane Fuel Cell (PEMFC) .............................. 9
1.5.2. Direct Methanol Fuel Cell (DMFC) ........................................................ 9
1.5.3. Alkaline Fuel Cell (AFC) ...................................................................... 10
1.5.4. Phosphoric Acid Fuel Cell (PAFC) ....................................................... 11
1.5.5. Molten Carbonate Fuel Cell (MCFC) ................................................... 11
1.5.6. Solid Oxide Fuel Cell (SOFC) .............................................................. 12
1.6. Advantages and disadvantages ........................................................................... 13
1.7. Applications ........................................................................................................ 15
1.7.1. Transportation ....................................................................................... 15
1.7.2. Stationary power ................................................................................... 16
1.7.3. Portable power ...................................................................................... 17
Chapter 2 ....................................................................................................................... 19
2. DIRECT METHANOL FUEL CELLS: STATE-OF-THE-ART ........................ 19
2.1. Introduction ......................................................................................................... 19
2.2. Operating principle of the DMFC ....................................................................... 20
2.3. Fundamentals of a DMFC................................................................................... 22
2.3.1. Cell components .................................................................................... 22
2.3.2. Thermodynamics and polarization curve .............................................. 25
2.3.3. Methanol oxidation and oxygen reduction kinetics .............................. 28
2.4. Two-phase flow phenomena ............................................................................... 33
2.4.1. Gaseous carbon dioxide in anode .......................................................... 33
2.4.2. Liquid water transport in the cathode .................................................... 37
2.5. Mass transport phenomena ................................................................................. 38
2.5.1. Methanol crossover ............................................................................... 38

xvi
2.5.2. Water management ................................................................................ 47
2.6. Single cell performance – Polarization behaviour .............................................. 50
2.6.1. Operating conditions.............................................................................. 51
2.6.1.1. Methanol concentration ................................................................... 51
2.6.1.2. Fuel cell temperature ....................................................................... 52
2.6.1.3. Methanol and air flow rate ............................................................... 52
2.6.1.4. Air pressure...................................................................................... 53
2.6.2. Configuration parameters ...................................................................... 53
2.6.2.1. Flow field design ............................................................................. 53
2.6.2.2. Catalyst loading ............................................................................... 56
2.6.2.3. Diffusion Layers .............................................................................. 58
2.7. Mathematical Modelling ..................................................................................... 59
2.7.1. Analytical models .................................................................................. 60
2.7.2. Semi-empirical models .......................................................................... 62
2.7.3. Mechanistic models ............................................................................... 63
2.8. Passive DMFC ..................................................................................................... 66
2.9. Applications ........................................................................................................ 72
2.10. Summary and Scope of the present work ............................................................ 74
Chapter 3 ........................................................................................................................ 77
3. MODEL FORMULATION FOR AN ACTIVE FEED DMFC ........................... 77
3.1. General model structure ...................................................................................... 77
3.2. Model assumptions .............................................................................................. 79
3.3. Governing equations and Boundary conditions – Anode and Cathode .............. 80
3.3.1. Mass transport........................................................................................ 80
3.3.2. Heat transport ........................................................................................ 85
3.4. Cell performance ................................................................................................. 89
3.5. Analytical solutions ............................................................................................. 90
3.5.1. Mass transport........................................................................................ 90
3.5.2. Heat transport ........................................................................................ 94
3.6. Results and discussion ......................................................................................... 97
3.7. Concluding remarks .......................................................................................... 105
Chapter 4 ...................................................................................................................... 107
4. EXPERIMENTAL SETUP FOR AN ACTIVE FEED DMFC ......................... 107
4.1. Fuel cell design .................................................................................................. 107
xvii
4.1.1. End Plates ............................................................................................ 109
4.1.2. Insulating Plates .................................................................................. 109
4.1.3. Connector plates .................................................................................. 110
4.1.4. Monopolar plates ................................................................................. 110
4.1.5. Membrane Electrode Assembly (MEA) .............................................. 112
4.1.6. Diffusion layers ................................................................................... 112
4.2. Methanol Test Kit Testing Unit ........................................................................ 114
4.2.1. Methanol handling system .................................................................. 116
4.2.2. Gas handling system ........................................................................... 118
4.2.3. Loadbank system ................................................................................. 119
4.3. Fuel cell heater control system ......................................................................... 121
4.4. Experimental procedure .................................................................................... 121
Chapter 5 ..................................................................................................................... 123
5. EXPERIMENTAL AND MODELLING STUDIES OF AN ACTIVE FEED
DMFC ........................................................................................................................... 123
5.1. Results and Discussion ..................................................................................... 124
5.1.1. Effect of diffusion layers ..................................................................... 125
5.1.2. Effect of operating conditions ............................................................. 127
5.1.2.1. Effect of methanol concentration .................................................. 128
5.1.2.2. Effect of fuel cell temperature ....................................................... 133
5.1.2.3. Effect of methanol flow rate ......................................................... 138
5.1.2.4. Effect of air flow rate .................................................................... 143
5.1.3. Effect of design parameters ................................................................. 147
5.1.3.1. Effect of anode diffusion layer material ........................................ 147
5.1.3.2. Effect of cathode diffusion layer material ..................................... 154
5.1.3.3. Effect of membrane thickness ....................................................... 160
5.1.3.4. Effect of Catalyst loading .............................................................. 167
5.1.3.5. Effect of anode flow field ............................................................. 175
5.1.3.6. Cathode flow field ......................................................................... 180
5.1.4. Tailored MEAs (Membrane Electrode Assemblies) ........................... 185
5.2. Concluding remarks .......................................................................................... 189
Chapter 6 ..................................................................................................................... 193
6. PASSIVE FEED DIRECT METHANOL FUEL CELL ................................... 193
6.1. Model Formulation for a passive feed DMFC .................................................. 194

xviii
6.1.1. General model structure ....................................................................... 194
6.1.2. Model assumptions .............................................................................. 195
6.1.3. Governing equations and Boundary conditions ................................... 196
6.1.3.1. Mass transport................................................................................ 196
6.1.3.2. Heat transport ................................................................................ 202
6.1.4. Cell performance ................................................................................. 205
6.1.5. Analytical solutions - Mass transport .................................................. 206
6.2. Experimental Setup for a passive feed DMFC .................................................. 211
6.2.1. Fuel cell design .................................................................................... 211
6.2.1.1. End Plates ...................................................................................... 213
6.2.1.2. Insulating Plates ............................................................................. 214
6.2.1.3. Connector plates ............................................................................ 215
6.2.1.4. Membrane Electrode Assembly (MEA) and diffusion layers ....... 215
6.2.2. Methanol Test Kit Testing Unit ........................................................... 216
6.2.3. Experimental procedure ....................................................................... 216
6.3. Experimental and Modelling studies for a passive feed DMFC ....................... 216
6.3.1. Results and Discussion ........................................................................ 216
6.3.1.1. Model validation ............................................................................ 217
6.3.1.2. Water Management in a Passive DMFC – model simulations ...... 225
6.3.1.3. Tailored MEAs .............................................................................. 234
6.3.1.4. Active feed DMFC vs. Passive feed DMFC.................................. 236
6.3.2. Concluding remarks ............................................................................. 238
Chapter 7 ...................................................................................................................... 241
7. CONCLUSIONS AND SUGGESTIONS FOR FUTURE WORK ................... 241
7.1 Conclusions ....................................................................................................... 241
7.2 Suggestions for future work .............................................................................. 244
Chapter 8 ...................................................................................................................... 245
8. References .......................................................................................................... 245
Appendix A: Uncertainty analysis ................................................................................ 263
Appendix B: Physical Properties and Parameters ......................................................... 271
Appendix C: Experimental Results of an active feed DMFC ....................................... 285

xix
List of Figures
Figure 1.1 – Schematic representation of a fuel cell generating electricity from a fuel. ............................... 1
Figure 1.2 – Schematic representation of hydrogen economy. ..................................................................... 4
Figure 1.3 – Cross section of general fuel cell. ............................................................................................. 6
Figure 1.4 – Schematic representation of fuel cell polarization curve. ......................................................... 8
Figure 1.5 – Examples of fuel cell applications (Courtesy of Honda, Ballard, Samsung, Shell,
Jadoo, Motorola, Suzuki, Company's XX25, Pearl Hydrogen, Yamaha, DaimlerChrysler and Plug
Power Inc.) .................................................................................................................................................. 15
Figure 2.1 – Operating principle of a DMFC. ............................................................................................. 20
Figure 2.2 – Schematic representation of a direct methanol fuel cell MEA. .............................................. 22
Figure 2.3 – Schematic representation of the Nafion chemical structure. ................................................... 23
Figure 2.4 – Anode catalyst layer (a) and cathode catalyst layer (b) microstructures, taken from
reference [1]. ............................................................................................................................................... 24
Figure 2.5 – Micrographs of commercially available carbon paper (a) and carbon cloth (b), taken
from reference [1]. ...................................................................................................................................... 25
Figure 2.6 – Schematic representation of a typical DMFC polarization curve. .......................................... 27
Figure 2.7 – A photograph of a transparent DMFC, taken from reference [37]. ....................................... 35
Figure 2.8 – Bubble behaviour on the anode side using hydrophobic carbon paper (a) and
hydrophilic carbon cloth (b), taken from reference [37]. ............................................................................ 35
Figure 2.9 – Water drop behaviour on the cathode side using carbon paper (a) and ELAT carbon
cloth (b), taken from reference [37]. ........................................................................................................... 38
Figure 2.10 – Representation of the most commonly used DMFC flow fields. .......................................... 54
Figure 2.11 – DMFC model categorization based on areas of investigation. ............................................. 60
Figure 2.12 – Schematic representation of conventional design of a passive DMFC. ................................ 68
Figure 2.13 – Direct Methanol Fuel Cell applications (Courtesy Toshiba, Samsung, Motorola,
Suzuki, Company's XX25, Yamaha, DaimlerChrysler, DoCoMo and Fujitsu, Intermec, Panasonic,
Volkswagen). .............................................................................................................................................. 73
Figure 3.1 – Schematic representation of a DMFC ..................................................................................... 78
Figure 3.2 – Predicted methanol concentration profiles in the cell for different current densities.
Operating conditions: temperature 70 ºC, pressure 1 atm, qAF = 0.33 cm3/s and qCF = 1.67 cm3/s. ............ 98
Figure 3.3 – Model prediction for methanol crossover for different methanol feed concentrations.
Operating conditions: temperature 70 ºC, pressure 1 atm, qAF = 0.33 cm3/s and qCF = 1.67 cm3/s. ............ 99

xx
Figure 3.4 – Predicted water concentration distribution in the cell at different current densities: (a)
anode and membrane and (b) cathode. Operating conditions: methanol concentration 0.5M,
temperature 70 ºC, pressure 1 atm, qAF = 0.33 cm3/s and qCF = 1.67 cm3/s. ............................................ 100
Figure 3.5 – Model predictions of the net water transport coefficient for different methanol
concentrations. Operating conditions: temperature 70 ºC, pressure 1 atm, qAF = 0.33 cm3/s and qCF
= 1.67 cm3/s. ............................................................................................................................................ 101
Figure 3.6 – Influence of methanol concentration on the net water transport coefficient at different
current densities. Operating conditions: temperature 70 ºC, pressure 1 atm, qAF = 0.33 cm3/s and
qCF = 1.67 cm3/s. ...................................................................................................................................... 102
Figure 3.7 – Prediction for the temperature distribution in the cell at different current densities.
Operating conditions: methanol concentration 0.5M, pressure 1 atm, qAF = 0.33 cm3/s and qCF =
1.67 cm3/s. ................................................................................................................................................ 103
Figure 3.8 – Comparison of the presented model predictions and the model developed by Brenda
et al.; dots: experimental data from [120], lines: model predictions. Operating conditions:
methanol concentration 0.1M, temperature 70 ºC, pressure 1 atm, qAF = 0.33 cm3/s and qCF = 1.67
cm3/s. ........................................................................................................................................................ 104
Figure 3.9 – Comparison of the model predictions of polarization curves for different methanol
concentrations; dots: experimental data from [120], lines: model predictions. Operating conditions:
temperature 70 ºC, pressure 1 atm, qAF = 0.33 cm3/s and qCF = 1.67 cm3/s. ............................................ 105
Figure 4.1 – 3D CAD drawing of the active feed DMFC. ....................................................................... 108
Figure 4.2 – Photograph of an «in-house» designed DMFC. ................................................................... 109
Figure 4.3 – Photograph of an end plate (aluminium) ............................................................................. 109
Figure 4.4 – Photograph of an isolating plate (rubber). ........................................................................... 110
Figure 4.5 – Photograph of a connector plate. ......................................................................................... 110
Figure 4.6 – Photograph of a Membrane Electrode Assembly (MEA) .................................................... 112
Figure 4.7 – Photograph of Diffusion layers. ........................................................................................... 113
Figure 4.8 – Photograph of experimental setup. ...................................................................................... 114
Figure 4.9 – Schematic diagram of the experimental set-up. ................................................................... 115
Figure 4.10 – Schematic diagram of the methanol handling system. ....................................................... 117
Figure 4.11 – MTK software panel with methanol control option. .......................................................... 118
Figure 4.12 – Schematic diagram of the gas handling system. ................................................................ 119
Figure 4.13 – MTK software panel with air control option. .................................................................... 119
Figure 4.14 – MTK software panel with electronic load option. ............................................................. 120

xxi
Figure 4.15 – Photograph of a fuel cell with heater resistance. ................................................................ 121
Figure 4.16 – Photograph of the front panel of the digital controller. ...................................................... 121
Figure 5.1 – Influence of gas diffusion layers on a) cell performance and b) power density for
different methanol concentrations. Operating conditions: methanol flow rate 8 ml/min, air flow
rate 3.6 l/min and fuel cell temperature 20ºC. Gas diffusion layers materials: carbon cloth at the
anode and ELAT (E-TEK) at the cathode. ................................................................................................ 126
Figure 5.2 – Influence of gas diffusion layers on a) cell performance and b) power density for
different methanol concentrations. Operating conditions: methanol flow rate 3 ml/min, air flow
rate 3.6 l/min and fuel cell temperature 20ºC. Gas diffusion layers materials: carbon cloth at the
anode and ELAT (E-TEK) at the cathode. ................................................................................................ 127
Figure 5.3 – Effect of methanol concentration on a) cell performance and b) power density.
Operating conditions: methanol flow rate 8 ml/min, air flow rate 3.6 l/min and fuel cell
temperature 20ºC. ..................................................................................................................................... 130
Figure 5.4 – Model predictions for the methanol crossover for different methanol feed
concentrations. Operating conditions: methanol flow rate 8 ml/min, air flow rate 3.6 l/min and fuel
cell temperature 20ºC. ............................................................................................................................... 131
Figure 5.5 – Comparison of model predictions on cell performance and power density; dots:
experimental data, lines: model predictions. Operating conditions: methanol flow rate 8 ml/min, air
flow rate 3.6 l/min and fuel cell temperature 20ºC. .................................................................................. 132
Figure 5.6 – Model prediction for net water transport coefficient for different methanol feed
concentrations. Operating conditions: methanol flow rate 8 ml/min, air flow rate 3.6 l/min and fuel
cell temperature 20ºC. ............................................................................................................................... 133
Figure 5.7 – Effect of fuel cell temperature on a) cell performance and b) power density. Operating
conditions: methanol flow rate 8 ml/min, air flow rate 3.6 l/min and methanol concentration
0.75M. ....................................................................................................................................................... 135
Figure 5.8 – Model predictions for the anode overpotential for different fuel cell temperatures.
Operating conditions: methanol flow rate 8 ml/min, air flow rate 3.6 l/min and methanol
concentration 0.75M. ................................................................................................................................ 136
Figure 5.9 – Model predictions for the cathode overpotential for different fuel cell temperatures.
Operating conditions: methanol flow rate 8 ml/min, air flow rate 3.6 l/min and methanol
concentration 0.75M. ................................................................................................................................ 136
Figure 5.10 – Model predictions for the methanol crossover for different methanol feed
concentrations. Operating conditions: methanol flow rate 8 ml/min, air flow rate 3.6 l/min and
methanol concentration 0.75M. ................................................................................................................ 137
xxii
Figure 5.11 – Model predictions for net water transport coefficient for different fuel cell
temperatures. Operating conditions: methanol flow rate 8 ml/min and air flow rate 3.6 l/min,
methanol concentration 0.75M. ................................................................................................................ 137
Figure 5.12 – Comparison of model predictions on cell performance and power density; dots:
experimental data, lines: model predictions. Operating conditions: methanol concentration 0.75M,
methanol flow rate 8 ml/min and air flow rate 3.6 l/min. ......................................................................... 138
Figure 5.13 – Effect of methanol flow rate on a) cell performance and b) power density. Operating
conditions: methanol concentration 0.75M, fuel cell temperature 20ºC and air flow rate 3.6 l/min. ....... 139
Figure 5.14 – Predicted methanol concentration profiles in the anode catalyst layer (thickness
0.0023 cm) for different methanol flow rates. Operating conditions: methanol concentration
0.75M, air flow rate 3.6 l/min and a current density of 0.03 A/cm2. ........................................................ 140
Figure 5.15 – Model predictions for the methanol crossover for different methanol flow rates.
Operating conditions: air flow rate 3.6 l/min, methanol concentration 0.75M and fuel cell
temperature 20ºC. ..................................................................................................................................... 141
Figure 5.16 – Model predictions for net water transport coefficient for different methanol flow
rates. Operating conditions: air flow rate 3.6 l/min, methanol concentration 0.75M and fuel cell
temperature 20ºC. ..................................................................................................................................... 142
Figure 5.17 – Comparison of model predictions on cell performance and power density; dots:
experimental data, lines: model predictions. Operating conditions: methanol concentration 0.75M,
fuel cell temperature 20ºC and air flow rate 3.6 l/min. ............................................................................ 142
Figure 5.18 – Effect of air flow rate on a) cell performance and b) power density. Operating
conditions: methanol concentration 0.75M, fuel cell temperature 20ºC, methanol flow rate 8
ml/min. ..................................................................................................................................................... 144
Figure 5.19 – Predicted oxygen concentration profile in the cathode catalyst layer (thickness
0.0023 cm) for different air flow rates. Operating conditions: methanol concentration 0.75M,
methanol flow rate 8 ml/min a current density of 0.03 A/cm2. ................................................................ 145
Figure 5.20 – Model prediction for net water transport coefficient for different air flow rates.
Operating conditions: methanol flow rate 8 ml/min, methanol concentration 0.75M and fuel cell
temperature 20ºC. ..................................................................................................................................... 146
Figure 5.21 – Comparison of model predictions on cell performance and power density; dots:
experimental data, lines: model predictions. Operating conditions: methanol concentration 0.75M,
fuel cell temperature 20ºC and methanol flow rate 8 ml/min. .................................................................. 146
Figure 5.22 – Effect of anode diffusion layer material on a) cell performance and b) power density.
Operating conditions: methanol concentration 0.75M, air flow rate 3.6 l/min and fuel cell
temperature 20ºC. Design parameters: Nafion 117 and ELAT (E-TEK) at the cathode gas diffusion
layer. ........................................................................................................................................................ 149

xxiii
Figure 5.23 – Predicted methanol concentration profile in the anode catalyst layer (thickness
0.0023 cm) for different anode gas diffusion layer materials. Operating conditions: methanol
concentration 0.75M, methanol flow rate 3 ml/min, air flow rate 3.6 l/min and fuel cell
temperature 20ºC. Design parameters: Nafion 117 and ELAT (E-TEK) at the cathode gas diffusion
layer. ......................................................................................................................................................... 150
Figure 5.24 – Comparison of model predictions on a) cell performance and b) power density; dots:
experimental data, lines: model predictions. Operating conditions: methanol concentration 0.75M
and 5M, methanol flow rate 3 ml/min and air flow rate 3.6 l/min. Design parameters: Nafion 117
and ELAT (E-TEK) at the cathode gas diffusion layer. ............................................................................ 151
Figure 5.25 – Model predictions for the methanol crossover for different anode gas diffusion layer
materials. Operating conditions: methanol concentration 5M, methanol flow rate 3 ml/min, air
flow rate 3.6 l/min and fuel cell temperature 20ºC. Design parameters: Nafion 117 and ELAT (E-
TEK) at the cathode gas diffusion layer.................................................................................................... 152
Figure 5.26 – Model predictions for net water transport coefficient for different anode gas
diffusion layer materials. Operating conditions: methanol concentration 5M, methanol flow rate 3
ml/min, air flow rate 3.6 l/min and fuel cell temperature 20ºC. Design parameters: Nafion 117 and
ELAT (E-TEK) at the cathode gas diffusion layer. .................................................................................. 153
Figure 5.27 – Effect of anode diffusion layer material on a) cell performance and b) power density.
Operating conditions: methanol concentration 0.75M, methanol flow rate 8 ml/min and air flow
rate 3.6 l/min. Design parameters: Nafion 117 and ELAT (E-TEK) at the cathode gas diffusion
layer. ......................................................................................................................................................... 154
Figure 5.28 – Effect of cathode diffusion layer material on a) cell performance and b) power
density. Operating conditions: methanol concentration 0.75M, methanol flow rate 8 ml/min and
cell temperature 20ºC. Design parameters: Nafion117 and carbon cloth as anode gas diffusion
layer. ......................................................................................................................................................... 156
Figure 5.29 – Comparison of model predictions on a) cell performance and b) power density; dots:
experimental data, lines: model predictions. Operating conditions: methanol concentration 0.75M
and 5M, methanol flow rate 3 ml/min and air flow rate 3.6 l/min. Design parameters: Nafion 117
and carbon cloth as anode gas diffusion layer. ......................................................................................... 157
Figure 5.30 – Predicted oxygen concentration profile in the cathode catalyst layer (thickness
0.0023 cm) for different cathode gas diffusion layer materials. Operating conditions: methanol
concentration 5M, methanol flow rate 3 ml/min, air flow rate 3.6 l/min and fuel cell temperature
20ºC. Design parameters: Nafion 117 and carbon cloth as anode gas diffusion layer. ............................. 158
Figure 5.31 – Model predictions for net water transport coefficient for different cathode gas
diffusion layer materials. Operating conditions: methanol concentration 5M, methanol flow rate 3
ml/min, air flow rate 3.6 l/min and fuel cell temperature 20ºC. Design parameters: Nafion 117 and
carbon cloth as anode gas diffusion layer. ................................................................................................ 159

xxiv
Figure 5.32 – Effect of cathode diffusion layer material on a) cell performance and b) power
density. Operating conditions: methanol concentration 0.75M, methanol flow rate 8 ml/min and air
flow rate 3.6 l/min. Design parameters: Nafion 117 and carbon cloth as anode gas diffusion layer. ...... 160
Figure 5.33 – Effect of membrane thickness on a) cell performance and b) power density.
Operating conditions: methanol concentration 0.75M, air flow rate 3.6 l/min and cell temperature
20ºC.......................................................................................................................................................... 162
Figure 5.34 – Model predictions for the methanol crossover for different membrane thicknesses.
Operating conditions: methanol concentration 0.75M and 5M, methanol flow rate 3 ml/min, air
flow rate 3.6 l/min and fuel cell temperature 20ºC. ................................................................................. 163
Figure 5.35 – Effect of membrane thickness on a) cell performance and b) power density.
Operating conditions: air flow rate 3.6 l/min, methanol flow rate 3 ml/min and cell temperature
20ºC.......................................................................................................................................................... 164
Figure 5.36 – Model predictions for the net water transport coefficient for different membrane
thicknesses. Operating conditions: methanol concentration 0.75M and 5M, methanol flow rate 3
ml/min, air flow rate 3.6 l/min and fuel cell temperature 20ºC. ............................................................... 165
Figure 5.37 – Effect of membrane thickness on a) cell performance and b) power density.
Operating conditions: methanol concentration 0.75M, methanol flow rate 8 ml/min and air flow
rate 3.6 l/min. ........................................................................................................................................... 166
Figure 5.38 – Comparison of model predictions on a) cell performance and b) power density; dots:
experimental data, lines: model predictions. Operating conditions: methanol concentration 0.75M
and 5M, methanol flow rate 3 ml/min and air flow rate 3.6 l/min. .......................................................... 167
Figure 5.39 – Effect of catalyst loading on a) cell performance and b) power density. Operating
conditions: methanol concentration 0.75M, air flow rate 3.6 l/min and cell temperature 20ºC.
Design parameters: catalyst loading SL (4 mg/cm2) and HL (8 mg/cm2). ............................................... 169
Figure 5.40 – Model predictions for the anode overpotential for different catalyst loadings.
Operating conditions: methanol flow rate 3 ml/min, air flow rate 3.6 l/min and methanol
concentration 0.75M. Design parameters: catalyst loading SL (4 mg/cm2) and HL (8 mg/cm2). ............ 170
Figure 5.41 – Model predictions for the cathode overpotential for different catalyst loadings.
Operating conditions: methanol flow rate 3 ml/min, air flow rate 3.6 l/min and methanol
concentration 0.75M. Design parameters: catalyst loading SL (4 mg/cm2) and HL (8 mg/cm2). ............ 170
Figure 5.42 – Effect of catalyst loading on a) cell performance and b) power density. Operating
conditions: air flow rate 3.6 l/min, methanol flow rate 3 ml/min and cell temperature 20ºC. Design
parameters: catalyst loading SL (4 mg/cm2) and HL (8 mg/cm2). ........................................................... 171
Figure 5.43 – Model predictions for the methanol crossover for different catalyst loadings.
Operating conditions: methanol concentration 0.75M and 5M, methanol flow rate 3 ml/min, air
flow rate 3.6 l/min and fuel cell temperature 20ºC. Design parameters: catalyst loading SL (4
mg/cm2) and HL (8 mg/cm2). ................................................................................................................... 172
xxv
Figure 5.44 – Model predictions for the net water transport coefficient for different catalyst
loadings. Operating conditions: methanol concentration 0.75M and 5M, methanol flow rate 3
ml/min, air flow rate 3.6 l/min and fuel cell temperature 20ºC. Design parameters: catalyst loading
SL (4 mg/cm2) and HL (8 mg/cm2). .......................................................................................................... 173
Figure 5.45 – Effect of catalyst loading on a) cell performance and b) power density. Operating
conditions: methanol concentration 0.75M, methanol flow rate 8 ml/min and air flow rate 3.6
l/min. Design parameters: catalyst loading SL (4 mg/cm2) and HL (8 mg/cm2). ...................................... 174
Figure 5.46 – Comparison of model predictions on a) cell performance and b) power density; dots:
experimental data, lines: model predictions. Operating conditions: methanol concentration 0.75M
and 5M, methanol flow rate 3 ml/min and air flow rate 3.6 l/min. Design parameters: catalyst
loading SL (4 mg/cm2) and HL (8 mg/cm2). ............................................................................................. 175
Figure 5.47 – Effect of anode flow field design on a) cell performance and b) power density.
Operating conditions: methanol concentration 0.75M, air flow rate 3.6 l/min and cell temperature
20ºC. ......................................................................................................................................................... 177
Figure 5.48 – Effect of anode flow field design on a) cell performance and b) power density.
Operating conditions: air flow rate 3.6 l/min, methanol flow rate 3 ml/min and cell temperature
20ºC. ......................................................................................................................................................... 178
Figure 5.49 – Effect of anode flow field design on a) cell performance and b) power density.
Operating conditions: methanol concentration 0.75M, methanol flow rate 8 ml/min and air flow
rate 3.6 l/min. ............................................................................................................................................ 180
Figure 5.50 – Effect of cathode flow field design on a) cell performance and b) power density.
Operating conditions: methanol concentration 0.75M, methanol flow rate 8 ml/min and cell
temperature 20ºC. ..................................................................................................................................... 182
Figure 5.51 – Effect of cathode flow field design on a) cell performance and b) power density.
Operating conditions: air flow rate 3.6 l/min, methanol flow rate 3 ml/min and cell temperature
20ºC. ......................................................................................................................................................... 183
Figure 5.52 – Effect of cathode flow field design on a) cell performance and b) power density.
Operating conditions: methanol concentration 0.75M, methanol flow rate 8 ml/min and air flow
rate 3.6 l/min. ............................................................................................................................................ 185
Figure 5.53 – Comparison of model predictions on cell performance and power density; dots:
experimental data, lines: model predictions. Operating conditions: methanol concentration 5M,
methanol flow rate 3 ml/min, air flow rate 3.6 l/min and fuel cell temperature 20ºC. .............................. 187
Figure 5.54 – Model prediction for the methanol crossover for different MEAs. Operating
conditions: Operating conditions: methanol concentration 5M, methanol flow rate 3 ml/min, air
flow rate 3.6 l/min and fuel cell temperature 20ºC. .................................................................................. 188

xxvi
Figure 5.55 – Model prediction for the net water transport coefficient for different MEAs.
Operating conditions: methanol concentration 5M, methanol flow rate 3 ml/min, air flow rate 3.6
l/min and fuel cell temperature 20ºC. ....................................................................................................... 189
Figure 6.1 – Schematic representation of a passive DMFC. ................................................................... 194
Figure 6.2 – 3D CAD drawing of the passive feed DMFC.. .................................................................... 212
Figure 6.3 – Photograph of an «in-house» designed passive feed DMFC. .............................................. 213
Figure 6.4 – Anode end plate (acrylic) (a) photograph, (b) 3D CAD drawing. ....................................... 214
Figure 6.5 – Cathode end plate (acrylic) (a) photograph, (b) 3D CAD drawing. ..................................... 214
Figure 6.6 – Photograph of the isolating plates. ....................................................................................... 214
Figure 6.7 – Photograph of the connector plates. ..................................................................................... 215
Figure 6.8 – Comparison of the model predictions of a) polarization curves and b) power for
different methanol concentrations; dots: experimental data, lines: model predictions. ............................ 218
Figure 6.9 – Comparison of the model predictions of a) polarization curves and b) power for
different methanol concentrations; dots: experimental data, lines: model predictions. ............................ 219
Figure 6.10 – Comparison of the model predictions for different 1M and 3M methanol
concentrations; dots: experimental published data [160], lines: model predictions. ................................ 220
Figure 6.11 – Model prediction for methanol crossover for different methanol feed concentrations. ..... 221
Figure 6.12 – Predicted methanol concentration profiles in the cell for different current densities.
Operating conditions: methanol concentration 3M. ................................................................................. 222
Figure 6.13 – Predicted water concentration distribution in the cell at different current densities.
Operating conditions: methanol concentration 3M. ................................................................................. 222
Figure 6.14 – Model predictions of the net water transport coefficient, α, for different methanol
concentrations. ......................................................................................................................................... 223
Figure 6.15 – Influence of methanol concentration on the net water transport coefficient at
different current densities. ........................................................................................................................ 224
Figure 6.16 – Prediction for the temperature distribution in the cell at different current densities.
Operating conditions: methanol concentration 3M. ................................................................................. 225
Figure 6.17 – Influence of methanol concentration on net water transport coefficient. ........................... 226
Figure 6.18 – Influence of anode gas diffusion layer structure on a) fuel cell performance and b)
net water transport coefficient. Operating conditions: methanol concentration 5M. ............................... 228
Figure 6.19 – Influence of cathode gas diffusion layer structure on a) fuel cell performance and b)
net water transport coefficient. Operating conditions: methanol concentration 5M. ............................... 229
xxvii
Figure 6.20 – Influence of anode catalyst layer loadings on a) fuel cell performance and b) net
water transport coefficient. Operating conditions: methanol concentration 5M. ...................................... 231
Figure 6.21 – Influence of cathode catalyst layer loadings on a) fuel cell performance and b) net
water transport coefficient. Operating conditions: methanol concentration 5M. ...................................... 232
Figure 6.22 – Influence of MEA thickness on a) fuel cell performance and b) net water transport
coefficient. Operating conditions: methanol concentration 5M. ............................................................... 234
Figure 6.23 – Influence of MEA properties on a) fuel cell performance and b) net water transport
coefficient for commercial Nafion 117 and tailored Nafion 212. Operating conditions: methanol
concentration 5M. ..................................................................................................................................... 236
Figure 6.24 – Comparison of the experimental results, for a) polarization curves and b) power,
with different reactants feeding. Structural parameters: Nafion 115. Structural parameters: anode
and cathode diffusion layer 30% wet-proofed carbon cloth type A, anode catalyst loading 4mg/cm2
Pt/Ru, cathode catalyst loading 4mg/cm2 Pt. Operating conditions: temperature 20ºC, methanol
flow rate 3 ml/min and air flow rate 3.6 l/min. ......................................................................................... 238
Figure C.1 – Effect of methanol concentration on a) cell performance. Operating conditions:
methanol flow rate 8 ml/min and air flow rate 3.6 l/min. ......................................................................... 286
Figure C.2 – Effect of methanol concentration on a) cell performance. Operating conditions:
methanol flow rate 3 ml/min and air flow rate 3.6 l/min. ......................................................................... 286
Figure C.3 – Effect of methanol concentration on a) cell performance. Operating conditions:
methanol flow rate 3 ml/min and air flow rate 1 l/min. ............................................................................ 287
Figure C.4 – Effect of fuel cell temperature on a) cell performance. Operating conditions:
methanol flow rate 8 ml/min and air flow rate 3.6 l/min. ......................................................................... 288
Figure C.5 – Effect of fuel cell temperature on a) cell performance. Operating conditions:
methanol flow rate 3 ml/min and air flow rate 3.6 l/min. ......................................................................... 288
Figure C.6 – Effect of fuel cell temperature on a) cell performance. Operating conditions:
methanol flow rate 3 ml/min and air flow rate 1 l/min. ............................................................................ 289
Figure C.7 – Effect of methanol flow rate on a) cell performance. Operating conditions: methanol
concentration 0.25M and air flow rate 3.6 l/min. ...................................................................................... 290
Figure C.8– Effect of methanol flow rate on a) cell performance. Operating conditions: methanol
concentration 0.75M and air flow rate 3.6 l/min. ...................................................................................... 290
Figure C.9 – Effect of methanol flow rate on a) cell performance. Operating conditions: methanol
concentration 0.75M and air flow rate 1 l/min. ......................................................................................... 291
Figure C.10 – Effect of air flow rate on a) cell performance. Operating conditions: methanol
concentration 0.25M and methanol flow rate 8 ml/min. ........................................................................... 292
xxviii
Figure C.11 – Effect of air flow rate on a) cell performance. Operating conditions: methanol
concentration 0.75M and methanol flow rate 8 ml/min. .......................................................................... 292
Figure C.12 – Effect of air flow rate on a) cell performance. Operating conditions: methanol
concentration 0.75M and methanol flow rate 3 ml/min. .......................................................................... 293
Figure C.13– Effect of anode diffusion layer material on a) cell performance. Operating
conditions: methanol concentration 0.75M, air flow rate 3.6 l/min and cell temperature 20ºC.
Design parameters: Nafion117. ................................................................................................................ 294
Figure C.14 – Effect of anode diffusion layer material on a) cell performance. Operating
conditions: methanol concentration 0.75M, methanol flow rate 8 ml/min and cell temperature
20ºC. Design parameters: Nafion117. ...................................................................................................... 295
Figure C.15 – Effect of anode diffusion layer material on a) cell performance. Operating
conditions: methanol flow rate 3 ml/min, air flow rate 3.6 l/min and cell temperature 20ºC. Design
parameters: Nafion117. ............................................................................................................................ 295
Figure C.16 – Effect of anode diffusion layer material on a) cell performance. Operating
conditions: methanol concentration 0.75M, methanol flow rate 8 ml/min and air flow rate 3.6
l/min. Design parameters: Nafion117. ..................................................................................................... 296
Figure C.17 – Effect of anode diffusion layer material on a) cell performance. Operating
conditions: methanol concentration 0.75M, air flow rate 3.6 l/min and cell temperature 60ºC.
Design parameters: Nafion117. ................................................................................................................ 296
Figure C.18 – Effect of anode diffusion layer material on a) cell performance. Operating
conditions: methanol concentration 0.75M, methanol flow rate 3 ml/min and cell temperature
60ºC. Design parameters: Nafion117. ...................................................................................................... 297
Figure C.19 – Effect of anode diffusion layer material on a) cell performance. Operating
conditions: methanol concentration 2M, air flow rate 3.6 l/min and cell temperature 20ºC. Design
parameters: Nafion117. ............................................................................................................................ 297
Figure C.20 – Effect of anode diffusion layer material on a) cell performance. Operating
conditions: methanol concentration 2M, methanol flow rate 3 ml/min and cell temperature 20ºC.
Design parameters: Nafion117. ................................................................................................................ 298
Figure C.21 – Effect of anode diffusion layer material on a) cell performance. Operating
conditions: methanol concentration 0.75M, air flow rate 3.6 l/min and cell temperature 20ºC.
Design parameters: Nafion212. ................................................................................................................ 298
Figure C.22 – Effect of anode diffusion layer material on a) cell performance. Operating
conditions: methanol concentration 0.75M, methanol flow rate 8 ml/min and cell temperature
20ºC. Design parameters: Nafion212. ...................................................................................................... 299

xxix
Figure C.23 – Effect of anode diffusion layer material on a) cell performance. Operating
conditions: methanol flow rate 3 ml/min, air flow rate 3.6 l/min and cell temperature 20ºC. Design
parameters: Nafion117. ............................................................................................................................. 299
Figure C.24 – Effect of anode diffusion layer material on a) cell performance. Operating
conditions: methanol concentration 0.75M, methanol flow rate 8 ml/min and air flow rate 3.6
l/min. Design parameters: Nafion212. ...................................................................................................... 300
Figure C.25 – Effect of anode diffusion layer material on a) cell performance. Operating
conditions: methanol concentration 0.75M, air flow rate 3.6 l/min and cell temperature 60ºC.
Design parameters: Nafion212. ................................................................................................................ 300
Figure C.26– Effect of anode diffusion layer material on a) cell performance. Operating
conditions: methanol concentration 0.75M, methanol flow rate 3 ml/min and cell temperature
60ºC. Design parameters: Nafion212. ....................................................................................................... 301
Figure C.27 – Effect of anode diffusion layer material on a) cell performance. Operating
conditions: methanol concentration 2M, air flow rate 3.6 l/min and cell temperature 20ºC. Design
parameters: Nafion212. ............................................................................................................................. 301
Figure C.28 – Effect of anode diffusion layer material on a) cell performance. Operating
conditions: methanol concentration 2M, methanol flow rate 3 ml/min and cell temperature 20ºC.
Design parameters: Nafion212. ................................................................................................................ 302
Figure C.29 – Effect of cathode diffusion layer material on a) cell performance. Operating
conditions: methanol concentration 0.75M, air flow rate 3.6 l/min and cell temperature 20ºC.
Design parameters: Nafion117. ................................................................................................................ 303
Figure C.30 – Effect of cathode diffusion layer material on a) cell performance. Operating
conditions: methanol concentration 0.75M, methanol flow rate 8 ml/min and cell temperature
20ºC. Design parameters: Nafion117. ....................................................................................................... 303
Figure C.31 – Effect of cathode diffusion layer material on a) cell performance. Operating
conditions: air flow rate 3.6 l/min, methanol flow rate 3 ml/min and cell temperature 20ºC. Design
parameters: Nafion117. ............................................................................................................................. 304
Figure C.32 – Effect of cathode diffusion layer material on a) cell performance. Operating
conditions: methanol concentration 0.75M, methanol flow rate 8 ml/min and air flow rate 3.6
l/min. Design parameters: Nafion117. ...................................................................................................... 304
Figure C.33 – Effect of cathode diffusion layer material on a) cell performance. Operating
conditions: methanol concentration 0.75M, air flow rate 3.6 l/min and cell temperature 60ºC.
Design parameters: Nafion117. ................................................................................................................ 305
Figure C.34 – Effect of cathode diffusion layer material on a) cell performance. Operating
conditions: methanol concentration 0.75M, methanol flow rate 3 ml/min and cell temperature
60ºC. Design parameters: Nafion117. ....................................................................................................... 305
xxx
Figure C.35 – Effect of cathode diffusion layer material on a) cell performance. Operating
conditions: methanol concentration 2M, air flow rate 3.6 l/min and cell temperature 20ºC. Design
parameters: Nafion117. ............................................................................................................................ 306
Figure C.36 – Effect of cathode diffusion layer material on a) cell performance. Operating
conditions: methanol concentration 2M, methanol flow rate 3 ml/min and cell temperature 20ºC.
Design parameters: Nafion117. ................................................................................................................ 306
Figure C.37 – Effect of cathode diffusion layer material on a) cell performance. Operating
conditions: methanol concentration 0.75M, air flow rate 3.6 l/min and cell temperature 20ºC.
Design parameters: Nafion212. ................................................................................................................ 307
Figure C.38 – Effect of cathode diffusion layer material on a) cell performance. Operating
conditions: methanol concentration 0.75M, methanol flow rate 8 ml/min and cell temperature
20ºC. Design parameters: Nafion212. ...................................................................................................... 307
Figure C.39 – Effect of cathode diffusion layer material on a) cell performance. Operating
conditions: air flow rate 3.6 l/min, methanol flow rate 3 ml/min and cell temperature 20ºC. Design
parameters: Nafion212. ............................................................................................................................ 308
Figure C.40 – Effect of cathode diffusion layer material on a) cell performance and b) power.
Operating conditions: methanol concentration 0.75M, methanol flow rate 8 ml/min and air flow
rate 3.6 l/min. Design parameters: Nafion212. ........................................................................................ 308
Figure C.41 – Effect of cathode diffusion layer material on a) cell performance and b) power.
Operating conditions: methanol concentration 0.75M, air flow rate 3.6 l/min and cell temperature
60ºC. Design parameters: Nafion212. ...................................................................................................... 309
Figure C.42 – Effect of cathode diffusion layer material on a) cell performance and b) power.
Operating conditions: methanol concentration 0.75M, methanol flow rate 3 ml/min and cell
temperature 60ºC. Design parameters: Nafion212. .................................................................................. 309
Figure C.43 – Effect of cathode diffusion layer material on a) cell performance and b) power.
Operating conditions: methanol concentration 2M, air flow rate 3.6 l/min and cell temperature
20ºC. Design parameters: Nafion212. ...................................................................................................... 310
Figure C.44 – Effect of cathode diffusion layer material on a) cell performance and b) power.
Operating conditions: methanol concentration 2M, methanol flow rate 3 ml/min and cell
temperature 20ºC. Design parameters: Nafion212. .................................................................................. 310
Figure C.45 – Effect of membrane thickness on a) cell performance and b) power. Operating
conditions: methanol concentration 0.75M, air flow rate 3.6 l/min and cell temperature 20ºC. .............. 311
Figure C.46 – Effect of membrane thickness on a) cell performance and b) power. Operating
conditions: methanol concentration 0.75M, methanol flow rate 8 ml/min and cell temperature
20ºC.......................................................................................................................................................... 312

xxxi
Figure C.47 – Effect of membrane thickness on a) cell performance and b) power. Operating
conditions: air flow rate 3.6 l/min, methanol flow rate 3 ml/min and cell temperature 20ºC. .................. 312
Figure C.48 – Effect of membrane thickness on a) cell performance and b) power. Operating
conditions: methanol concentration 0.75M, methanol flow rate 8 ml/min and air flow rate 3.6
l/min. ......................................................................................................................................................... 313
Figure C.49 – Effect of membrane thickness on a) cell performance and b) power. Operating
conditions: methanol concentration 0.75M, air flow rate 3.6 l/min and cell temperature 60ºC. ............... 313
Figure C.50 – Effect of membrane thickness on a) cell performance and b) power. Operating
conditions: methanol concentration 0.75M, methanol flow rate 3 ml/min and cell temperature
60ºC. ......................................................................................................................................................... 314
Figure C.51 – Effect of membrane thickness on a) cell performance and b) power. Operating
conditions: methanol concentration 2M, air flow rate 3.6 l/min and cell temperature 20ºC. .................... 314
Figure C.52 – Effect of membrane thickness on a) cell performance and b) power. Operating
conditions: methanol concentration 2M, methanol flow rate 3 ml/min and cell temperature 20ºC. ......... 315
Figure C.53 – Effect of catalyst loading on a) cell performance and b) power. Operating
conditions: methanol concentration 0.75M, air flow rate 3.6 l/min and cell temperature 20ºC. ............... 316
Figure C.54– Effect of catalyst loading on a) cell performance and b) power. Operating conditions:
methanol concentration 0.75M, methanol flow rate 8 ml/min and cell temperature 20ºC. ....................... 316
Figure C.55 – Effect of catalyst loading on a) cell performance and b) power. Operating
conditions: air flow rate 3.6 l/min, methanol flow rate 3 ml/min and cell temperature 20ºC. .................. 317
Figure C.56 – Effect of catalyst loading on a) cell performance and b) power. Operating
conditions: methanol concentration 0.75M, methanol flow rate 8 ml/min and air flow rate 3.6
l/min. ......................................................................................................................................................... 317
Figure C.57 – Effect of catalyst loading on a) cell performance and b) power. Operating
conditions: methanol concentration 0.75M, air flow rate 3.6 l/min and cell temperature 60ºC. ............... 318
Figure C.58 – Effect of catalyst loading on a) cell performance and b) power. Operating
conditions: methanol concentration 0.75M, methanol flow rate 3 ml/min and cell temperature
60ºC. ......................................................................................................................................................... 318
Figure C.59 – Effect of catalyst loading on a) cell performance and b) power. Operating
conditions: methanol concentration 2M, air flow rate 3.6 l/min and cell temperature 20ºC. .................... 319
Figure C.60 – Effect of catalyst loading on a) cell performance and b) power. Operating
conditions: methanol concentration 2M, methanol flow rate 3 ml/min and cell temperature 20ºC. ......... 319
Figure C.61 – Effect of anode flow field design on a) cell performance and b) power. Operating
conditions: methanol concentration 0.75M, air flow rate 3.6 l/min and cell temperature 20ºC. ............... 320

xxxii
Figure C.62 – Effect of anode flow field design on a) cell performance and b) power. Operating
conditions: methanol concentration 0.75M, methanol flow rate 8 ml/min and cell temperature
20ºC.......................................................................................................................................................... 321
Figure C.63 – Effect of anode flow field design on a) cell performance and b) power. Operating
conditions: air flow rate 3.6 l/min, methanol flow rate 3 ml/min and cell temperature 20ºC. ................. 321
Figure C.64 – Effect of anode flow field design on a) cell performance and b) power. Operating
conditions: methanol concentration 0.75M, methanol flow rate 8 ml/min and air flow rate 3.6
l/min. ........................................................................................................................................................ 322
Figure C.65 – Effect of anode flow field design on a) cell performance and b) power. Operating
conditions: methanol concentration 0.75M, air flow rate 3.6 l/min and cell temperature 60ºC. .............. 322
Figure C.66 – Effect of anode flow field design on a) cell performance and b) power. Operating
conditions: methanol concentration 0.75M, methanol flow rate 3 ml/min and cell temperature
60ºC.......................................................................................................................................................... 323
Figure C.67 – Effect of anode flow field design on a) cell performance and b) power. Operating
conditions: methanol concentration 2M, air flow rate 3.6 l/min and cell temperature 20ºC. ................... 323
Figure C.68 – Effect of anode flow field design on a) cell performance and b) power. Operating
conditions: methanol concentration 2M, methanol flow rate 3 ml/min and cell temperature 20ºC. ........ 324
Figure C.69 – Effect of cathode flow field design on a) cell performance and b) power. Operating
conditions: methanol concentration 0.75M, air flow rate 3.6 l/min and cell temperature 20ºC. .............. 325
Figure C.70 – Effect of cathode flow field design on a) cell performance and b) power. Operating
conditions: methanol concentration 0.75M, methanol flow rate 8 ml/min and cell temperature
20ºC.......................................................................................................................................................... 325
Figure C.71 – Effect of cathode flow field design on a) cell performance and b) power. Operating
conditions: air flow rate 3.6 l/min, methanol flow rate 3 ml/min and cell temperature 20ºC. ................. 326
Figure C.72 – Effect of cathode flow field design on a) cell performance and b) power. Operating
conditions: methanol concentration 0.75M, methanol flow rate 8 ml/min and air flow rate 3.6
l/min. ........................................................................................................................................................ 326
Figure C.73 – Effect of cathode flow field design on a) cell performance and b) power. Operating
conditions: methanol concentration 0.75M, air flow rate 3.6 l/min and cell temperature 60ºC. .............. 327
Figure C.74 – Effect of cathode flow field design on a) cell performance and b) power. Operating
conditions: methanol concentration 0.75M, methanol flow rate 3 ml/min and cell temperature 60ºC .... 327
Figure C.75 – Effect of cathode flow field design on a) cell performance and b) power. Operating
conditions: methanol concentration 2M, air flow rate 3.6 l/min and cell temperature 20ºC. ................... 328
Figure C.76 – Effect of cathode flow field design on a) cell performance and b) power. Operating
conditions: methanol concentration 2M, methanol flow rate 3 ml/min and cell temperature 20ºC. ........ 328

xxxiii
List of Tables
Table 1.1 – Major characteristics of different fuel cell types. ....................................................................... 8
Table 2.1 – Comparison of different flow fields used in DMFCs ............................................................... 56
Table 3.1 – Values for the parameters used in the model equations. .......................................................... 96
Table 3.2 – Comparison between model predictions, for the net water transport coefficient, and
experimental data from Liu et al. [175] and absolute deviation for 60 ºC, Nafion212 at 0.15 A/cm2. ..... 103
Table 4.1 – Different elements of a fuel cell ............................................................................................. 108
Table 4.2 – Different flow field designs used. .......................................................................................... 111
Table 4.3 – Specifications of MTK [179]. ................................................................................................ 116
Table 5.1 – Set of DMFC characteristics used to analyse the effect of the operating conditions on
the cell performance.................................................................................................................................. 128
Table 5.2 – Set of operating conditions used to analyse the effect of methanol concentration on the
cell performance. ...................................................................................................................................... 128
Table 5.3 – Set of operating conditions used to analyse the effect of cell temperature on the cell
performance. ............................................................................................................................................. 133
Table 5.4 – Set of operating conditions used to analyse the effect of methanol flow rate on the cell
performance. ............................................................................................................................................. 138
Table 5.5 – Set of operating conditions used to analyse the effect of air flow rate on the cell
performance. ............................................................................................................................................. 143
Table 5.6 – Set of operating conditions used to analyse the effect of design parameters on the cell
performance. ............................................................................................................................................. 147
Table 5.7 – Structural characteristics of the common materials used as gas diffusion layers [177,
178]. .......................................................................................................................................................... 148
Table 6.1 – Values for the parameters used in the model equations. ........................................................ 210
Table 6.2 – Different elements of the passive feed DMFC. ...................................................................... 213
Table A.1 – Values of parameters and uncertainties regarding the methanol concentration for the
active feed DMFC. .................................................................................................................................... 264
Table A.2 – Values of parameters and uncertainties regarding the methanol concentration for the
passive feed DMFC. ................................................................................................................................. 265
Table A.3 – Values of parameters and uncertainties regarding the air flow rate. ..................................... 266
Table A.4 – Values of parameters and uncertainties regarding the current. ............................................. 267

xxxiv
Table A.5 – Values of parameters and uncertainties regarding the potential. .......................................... 268
Table A.6 – Values of parameters and uncertainties regarding the fuel cell power. ................................ 269
Table A.7 – Values of parameters and uncertainties regarding the fuel cell temperature. ....................... 269
Table A.8 – Values of parameters and uncertainties regarding the methanol solution temperature. ....... 270
Table B.1 – Densities ............................................................................................................................... 271
Table B.2 – Specific Heat ........................................................................................................................ 272
Table B.3 – Thermal conductivities ......................................................................................................... 273
Table B.4 – Standard enthalpies of formation .......................................................................................... 273
Table B.5 – Standard Gibbs free energy .................................................................................................. 274
Table B.6 – Viscosities ............................................................................................................................ 274
Table B.7 – Liquid molar volumes........................................................................................................... 275
Table B.8 – Parachors values ................................................................................................................... 275
Table B.9 – Diffusion volumes ................................................................................................................ 275
Table B.10 – Tortuosity ........................................................................................................................... 276
Table B.11 – Porosities of the common materials used as gas diffusion layers. ...................................... 278
Table C.1 – Set of operating conditions used to analyse the effect of methanol concentration on the
cell performance. ...................................................................................................................................... 285
Table C.2 – Set of operating conditions used to analyse the effect of cell temperature on the cell
performance. ............................................................................................................................................ 287
Table C.3 – Set of operating conditions used to analyse the effect of methanol flow rate on the cell
performance. ............................................................................................................................................ 289
Table C.4 – Set of operating conditions used to analyse the effect of air flow rate on the cell
performance. ............................................................................................................................................ 291
Table C.5 – Set of operating conditions used to analyse the effect of design parameters on the cell
performance. ............................................................................................................................................ 293
Table C.6 – Set of design parameters used to analyse the effect of the diffusion layer material on
the cell performance. ................................................................................................................................ 294
Table C.7 – Set of design parameters used to analyse the effect of the diffusion layer material on
the cell performance. ................................................................................................................................ 302
Table C.8 – Set of design parameters used to analyse the effect of the membrane thickness on the
cell performance. ...................................................................................................................................... 311

xxxv
Table C.9 – Set of design parameters used to analyse the effect of the catalyst loading on the cell
performance. ............................................................................................................................................. 315
Table C.10 – Set of design parameters used to analyse the effect of the anode flow field on the cell
performance. ............................................................................................................................................. 320
Table C.11 – Set of design parameters used to analyse the effect of the cathode flow field on the
cell performance. ...................................................................................................................................... 324

xxxvi

xxxvii
Nomenclature
a specific surface area of the anode, cm-1
SA total surface area of the channels, cm2
aA active area, cm2
1A total area without the holes, cm2
holesA total area of the holes, cm2
C concentration, mol/cm3
refOC ,2 reference concentration of oxygen, mol/cm3
Cp specific heat, J/(molK)
TE ∂∂ / rate of change of electromotive force, V/K
D diffusion coefficient, cm2/s
effD effective diffusion coefficient, cm2/s
CellE thermodynamic equilibrium potential, V
e width of the channel, cm
F Faraday´s constant, 96500 C/mol
G Gibbs free energy, J/mol
g gravitational acceleration, cm2/s
H enthalpy of reaction, J/mol
hmass mass transfer coefficient, cm/s
hheat heat transfer coefficient, W/(cm2K)
CellI cell current density, A/cm2
OHCHI 3 leakage current density due to methanol crossover, A/cm2
OHCHrefI 3
,0 exchange current density of methanol, A/cm2
2
,0O
refI exchange current density of oxygen, A/cm2
Aj volumetric current density, A/cm3
k constant in the rate expression (2.21)
92−K partition coefficients
K thermal conductivity, W/(cmK)
L length of the active area, cm

xxxviii
n number of electrons
channelsn number of channels
dn electro-osmotic drag coefficient of water
N molar flux, mol/(cm2s)
airP pressure of air in cathode, atm
q flow rate, cm3/s
ACQ heat generated in AC, W/cm2
CCQ heat generated in CC, W/cm2
AFQ heat transfer to the anode stream, W/cm2
CFQ heat transfer to the cathode stream, W/cm2
Q heat transfer, W/cm2
R ideal law gas constant, 8.314 J/(molK)
RCell internal resistance of the fuel cell, cm2/S
Rcond conduction resistance, K/W
Rconv convection resistance, K/W
Rtotal total thermal resistance, K/W
Τ temperature, K
OHCHU 3 thermodynamic equilibrium potential of methanol oxidation, V
2OU thermodynamic equilibrium potential of oxygen oxidation, V
V volume, ml or l
VCell cell voltage, V
w length of the channels, cm
Wactual actual electric work, W
Wmaximum maximum work, W
OHCHx 3 mole fraction of methanol, mol/mol
x coordinate direction normal across the cell, cm
Y parameter
Greek

xxxix
∆ variation
α net water transport coefficient
Aα anodic transfer coefficient
Cα cathodic transfer coefficient
β coefficient of volume expansion, 1/K
δ thickness, cm or uncertainty (Appendix A)
ε porosity
η overpotential, V or total energy efficiency (eq. 2.8)
fuelη fuel efficiency
revη thermodynamic efficiency
voltaicη voltaic efficiency
κ ionic conductivity of the membrane, S/cm
λ constant in the rate expression, mol/cm3
µ dynamic viscosity, g/(cms)
ν kinematic viscosity, cm2/s
ρ density, g/cm3
2Oυ stoichiometric coefficients of oxygen in the cathode reaction
OH2υ stoichiometric coefficients of water in the cathode reaction
2,Ocrossυ stoichiometric coefficients of oxygen in the undesired cathode
reaction OHcross 2,υ stoichiometric coefficients of water in the undesired cathode
reaction OHCH3ξ electro-osmotic drag coefficient of methanol
Subscripts
A anode
air air
C cathode
Cell fuel cell
CH3OH methanol
fin fin

xl
final final
i species i
initial initial
j species j
H2O water
O2 oxygen
Superscripts
0 feed conditions
AAP anode aluminum/acrylic plate
ACP anode copper plate
AC anode catalyst layer
AD anode diffusion layer
AF anode flow channel
ARP anode rubber plate
CAP cathode aluminum/acrylic plate
CC cathode catalyst layer
CCP cathode copper plate
CD cathode diffusion plate
CF cathode flow channel
CRP cathode rubber plate
G graphite
l plate l
M membrane
t plate t

xli
Acronyms 1D One dimension
2D Two dimensions
3D Three dimensions
AAP Anode Aluminum Plate
AC Anode Catalyst
ACP Anode Copper Plate
AD Anode Diffusion
AF Anode Compartment or Anode Flow Channel
AFC Alkaline Fuel Cell
ARP Anode Rubber Plate
BPPO Bromomenthylated poly(2,6-dimethyl-1,4-phennylene oxide)
CAD Computer Aided Design
CAP Cathode Aluminum Plate
CC Cathode Catalyst
CCP Cathode Copper Plate
CD Cathode diffusion
CEFT Centro de estudos de Fenómenos de Transporte
CF Cathode Compartment or Cathode Flow Channel
CFD Computational Fluid Dynamics
CRP Cathode Rubber Plate
CS Crosslinked Chitosan
CSTR Continuous Stirred Tank Reactor
DFC Direct Fuel Cell
DMFC Direct Methanol Fuel Cell
DPS Diphenylsilicate
FCT Fundação para a Ciência e a Tecnologia
FEDER Fundo Europeu de Desenvolvimento Regional
FEUP Faculdade de Engenharia da Universidade do Porto
GDL Gas Diffusion Layer
GE General Electric
HL High Loading

xlii
LB Loadbank
LDH Layered Double Hydroxides
MCFC Molten Carbonate Fuel Cell
MEA Membrane Electrode Assemblies
MFC Mass Flow controller
MFF Mixed Flow Field
MHS Methanol Handling System
MMT Montmorillonite
MP Micropump
MPL Microporous Layer
MSFF Multi Serpentine Flow Field
MTK Methanol Test Kit
NASA National Aeronautics and Space Administration
PAFC Phosphoric Acid Fuel Cell
PBI Phosphoric Acid-doped Polybenzimidazole
PEM Polymer Electrolyte Membrane
PEMFC Polymer Electrolyte Membrane Fuel Cell
PF Pore-Filling
PFF Parallel Flow Field
POP Sulphonate substituted Polyoxiphenylenes
PTFE Polytretrafluoroethylene (Teflon)
SFF Single Serpentine Flow Field
SL Standard loading
SOFC Solid Oxide Fuel Cell
SPEEK Sulfonated poly(etheretherketone)
SPI Sulfonated Polyimide
TC Thermocouple
xliii
Motivation, objectives and thesis layout
Fuel cells are extensively being studied today because of their potential as an alternate
energy converter for a wide range of applications. Fuel cells have unique technological
attributes: efficiency, absence of moving parts and very low emissions. In particular, the
proton-exchange membrane (PEM) fuel cells (FCs) are today in the focus of interest as
one of the most promising developments in power converters. Among the different
types of PEMFCs the Direct Methanol Fuel Cells (DMFCs) are being investigated with
a high degree of motivation as portable power sources due to their higher power density,
instant recharging and smaller size than batteries. Representing the market segment
closest to achieve widespread use by consumers, the small power Direct Methanol Fuel
Cells (in particular the micro DMFCs) will probably induce them to believe and accept
the fuel cells as an emerging technology, contributing in this way for an energetic
paradigm shift.
The main motivation of the present work was to intensively study small power direct
methanol fuel cells operating close to ambient conditions bearing in mind the portable
applications of this type of fuel cells. An integrated approach was followed toward
DMFC optimization: the development of a mathematical model incorporating the main
transfer processes as well as the electrochemical reactions, to validate the model and in
a last step to use the model to set–up optimized conditions leading to enhanced fuel cell
performances.
This PhD thesis results from the work carried out at CEFT (Centro de Estudos de
Fenómenos de Transporte) in the Chemical Engineering Department of Faculty of
Engineering in Oporto University (FEUP), throughout the period between February
2005 and August 2009.
The initial goals of this work were the modelling and experimental studies on an «in-
house» active feed direct methanol fuel cell (DMFC). Based on recent state-of-the-art,
concerning the DMFC development, it was verified that the passive feed DMFC
systems were, probably, the first to be commercialized. In this way, work with a
designed passive feed DMFC was also developed.
xliv
This thesis is organized in seven principal Chapters. The first Chapter considers a
general introduction concerning the fuel cells, with a systematic description of the
different fuel cell types.
Chapter 2 is devoted to the description of the direct methanol fuel cells and to the
review of the state-of-the-art focused in experimental and modelling studies. The
advances in new materials and new designs for DMFCs in order to achieve the best fuel
cell performance are described. Recent work and advances in passive DMFCs are also
presented.
The Chapters 3, 4 and 5, are devoted to the active feed direct methanol fuel cell. In
Chapter 3, the developed mathematical model for an active feed DMFC is presented.
The general model structure, the major model assumptions and the governing equations
and boundary conditions concerning the mass and the heat transport are described.
In Chapter 4 the experimental setup and experimental procedure as well as the active
feed fuel cell design are provided.
In Chapter 5, the experimental results obtained with the designed active feed DMFC are
presented as well as the model predictions for the polarization and power density
curves.
In Chapter 6 the results of the study of a designed passive feed direct methanol fuel cell
are presented: model development, experimental setup, experimental results and cell
optimization.
Finally, the main conclusions of the present work are summarized and lines of possible
future work are suggested in Chapter 7.

1
CHAPTER 1 1. INTRODUCTION
In this Chapter, basic elements involved in Fuel Cells systems are described. A brief
explanation of the importance of fuel cells in our society and a historic perspective
of fuel cells is also, provided. A brief overview of the different fuel cell types, major
characteristics and advantages and disadvantages is presented as well as, market
perspectives for fuel cells.
1.1. Fuel cells
A fuel cell is an electrochemical device that continuously converts chemical energy into
electric energy as long as fuel and oxidant are supplied (Fig. 1.1). Fuel cells therefore
have similarities both to batteries and to engines. With batteries, fuel cells share the
electrochemical nature of power generation process and with engines, they share the
continuously work consuming a fuel of some type. A fuel cell operates quietly and
efficiently and when hydrogen is used as fuel it generates only power and water a so-
called zero emission engine. A difference between a fuel cell and a battery is that a fuel
cell generates by-products and the system is required to manage those. A battery also
generates some heat but at a much lower rate that usually does not require any special or
additional equipment.
Figure 1.1 – Schematic representation of a fuel cell generating electricity from a fuel.

Chapter 1: Introduction
2
A fuel cell can convert over than 90% of the chemical energy of a fuel into electricity.
Typical reactants for fuel cells are hydrogen and oxygen, however neither of them has
to be in its pure form. Hydrogen may be present either in a mixture with other gases,
such as carbon dioxide, nitrogen and carbon monoxide, or in hydrocarbons such as
natural gas and methane, or even in liquid hydrocarbons such as methanol. Ambient air
contains enough oxygen to be used as oxidant in fuel cells.
1.2. Fuel cells in society
There are two major problems with using fossil fuels, which meet about 80% of the
world energy demand. The first problem is that they are limited in amount and sooner
will be depleted. This means that there will be a disparity between demand and
availability of fossil fuels. The second problem is that fossil fuels, coal, oil and natural
gas are causing serious environmental problems, such as consumption and pollution of
water, air pollution, ozone layer depletion, climate change melting of ice, creation of
toxic wastes, damages in plants and animal life and global warming. Using nuclear fuels
as an alternative, poses serious safety risks due to the amount of radiation contained in
their products. Renewable energy resources emerge as a solution for this global issue.
Renewable energy resources can provide many immediate environmental benefits by
avoiding the impacts caused by using fossil fuels as energy sources and risks and can
help conserve fossil resources for future generations. Of course, renewable energy also
has environmental impacts. For example, biomass plants produce some emissions, and
fuel can be harvested at unsustainable rates. Wind farms change the landscape, and
some have harmed birds. Hydroprojects, if their impacts are not mitigated, can greatly
affect wildlife and ecosystems. However, these impacts are generally much smaller and
more localized than those of fossil and nuclear fuels. Care must nevertheless be taken to
mitigate them. Despite the advantages of using renewable energy these sources are
insufficient to produce the amount of world energy demanded which has been growing
exponentially. As a result fuel cells appear as an efficiently and environmentally
friendly solution and a complement to renewable energy. Fuel cells can provide
increased efficiency, greater scaling flexibility, reduced emissions and other advantages
compared to conventional power technologies.
Transport Phenomena in Direct Methanol Fuel Cells: Modelling and Experimental Studies
3
Early in the 1970s Hydrogen Energy System had been proposed as a solution for the
problems caused by using fossil fuels to produce energy. Since then, during the last
quarter of last century, through research and development work in universities and
research laboratories around the world, foundations of the Hydrogen Energy System
have been established.
Hydrogen is an excellent energy carrier with many unique properties. It is the lightest,
most efficient and cleanest fuel. Through electrochemical processes, the hydrogen can
be converted to electricity in fuel cells with higher efficiencies than conversion of fossil
fuels to mechanical energy in internal combustion engines or to electrical energy in
thermal power plants. This unique property of hydrogen has made hydrogen fuel cells
the power plant of choice for car companies and power plants companies. It is possible
that during the next years fuel cells can replace the heat engines as hydrogen replaces
fossil fuels. However, the feasibility of hydrogen as energy carrier depends on price
advantage, production costs, transport, logistic and storage.
The concept of hydrogen economy is not new, many scientist in the beginning of the
20th century described the production, storage and application possibilities of hydrogen.
As shown schematically in Fig. 1.2, hydrogen fuel cells are coupled with electrolysers
and renewable energy technologies to provide a completely closed-loop, pollution free
energy economy. When the sun is shining or the wind is blowing, the electricity
produced from solar and wind energy would be used to power cities directly while
production extra hydrogen on the side via electrolysis. Anytime the wind stops or night
falls, however, the fuel cells could be dispatched to provide on-demand power by
converting the stored hydrogen into electricity. While the hydrogen economy does not
become a reality, it is important to realize that fuel cells have found, and will continue
to find niche applications. These applications should continue to drive forward progress
for decades to come.
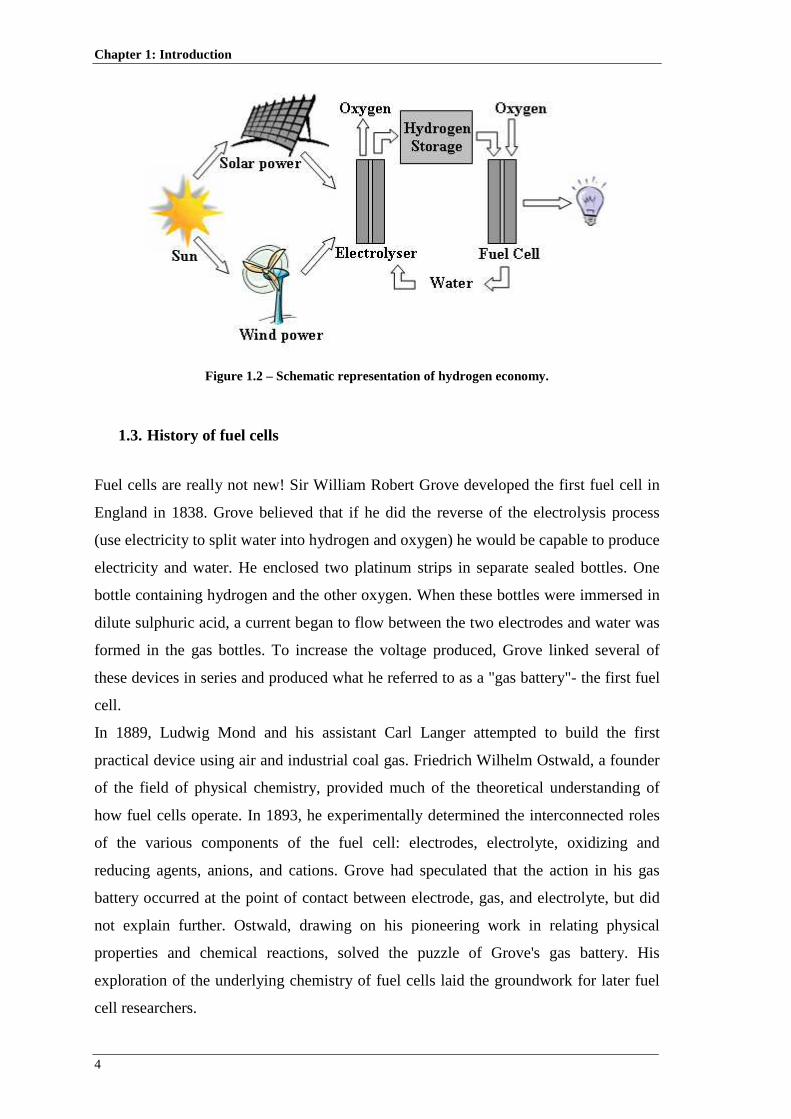
Chapter 1: Introduction
4
Figure 1.2 – Schematic representation of hydrogen economy.
1.3. History of fuel cells
Fuel cells are really not new! Sir William Robert Grove developed the first fuel cell in
England in 1838. Grove believed that if he did the reverse of the electrolysis process
(use electricity to split water into hydrogen and oxygen) he would be capable to produce
electricity and water. He enclosed two platinum strips in separate sealed bottles. One
bottle containing hydrogen and the other oxygen. When these bottles were immersed in
dilute sulphuric acid, a current began to flow between the two electrodes and water was
formed in the gas bottles. To increase the voltage produced, Grove linked several of
these devices in series and produced what he referred to as a "gas battery"- the first fuel
cell.
In 1889, Ludwig Mond and his assistant Carl Langer attempted to build the first
practical device using air and industrial coal gas. Friedrich Wilhelm Ostwald, a founder
of the field of physical chemistry, provided much of the theoretical understanding of
how fuel cells operate. In 1893, he experimentally determined the interconnected roles
of the various components of the fuel cell: electrodes, electrolyte, oxidizing and
reducing agents, anions, and cations. Grove had speculated that the action in his gas
battery occurred at the point of contact between electrode, gas, and electrolyte, but did
not explain further. Ostwald, drawing on his pioneering work in relating physical
properties and chemical reactions, solved the puzzle of Grove's gas battery. His
exploration of the underlying chemistry of fuel cells laid the groundwork for later fuel
cell researchers.

Transport Phenomena in Direct Methanol Fuel Cells: Modelling and Experimental Studies
5
Scientists and engineers soon learned that they would have to overcome many hurdles if
this new technology was to be commercialized. By the end of the nineteen century, the
internal combustion engine was emerging and the widespread exploitation of fossil fuels
sent the fuel cell the way of scientific curiosity.
Francis Thomas Bacon wrote a major Chapter in the fuel cell story. In 1932, he
resurrected the machine developed by Mond and Langer and implemented a number of
modifications to the original design. He replaced the platinum electrodes by less
expensive nickel gauze. He also substituted the sulphuric acid electrolyte for alkali
potassium hydroxide, a substance less corrosive to the electrodes. This device, which he
named the "Bacon Cell," was in essence the first alkaline fuel cell. After 27 years Bacon
produced a truly workable fuel cell. In 1959, Bacon demonstrated a machine capable of
producing 5 kW of power, enough to power a welding machine.
In 1955 a scientist working at General Electric (GE) modified the original fuel cell
design. Willard Thomas Grubb used a sulphonated polystyrene ion-exchange membrane
as the electrolyte. Three years later another GE chemist, Leonard Niedrach, devised a
way of depositing platinum onto this membrane, which ultimately became known as the
"Grubb-Niedrach fuel cell." GE and NASA developed this technology together resulting
in its use on the Gemini space project. This was the first commercial use of a fuel cell.
In the early 1960s, aircraft engine manufacturer Pratt & Whitney licensed the Bacon
patents for the Alkaline Fuel Cell. With the goal of reducing the weight and designing a
longer-lasting fuel cell than the GE PEM design, Pratt & Whitney improved the original
Bacon design. As a result, Pratt & Whitney won a contract from NASA to supply these
fuel cells to the Apollo spacecraft. Alkali cells have ever since been used on most
subsequent manned United States space missions, including those of the Space Shuttle.
The oil embargos of 1973 and 1979 helped to push along the research effort of the fuel
cell as the United States Government was looking for a way to become less dependent
on petroleum imports. A number of companies and government organizations began
serious research into overcoming the obstacles to widespread commercialization of fuel
cells. Throughout the 1970s and 1980s, a large research effort was devoted to
developing the materials needed, identifying the optimum fuel source and drastically
reducing the cost of this technology. During the 1980s, fuel cell technology began to be
tested by utilities and automobile manufacturers. Technical breakthroughs during the
decade included the development of the first marketable fuel cell powered vehicle in
1993 by the Canadian company, Ballard.
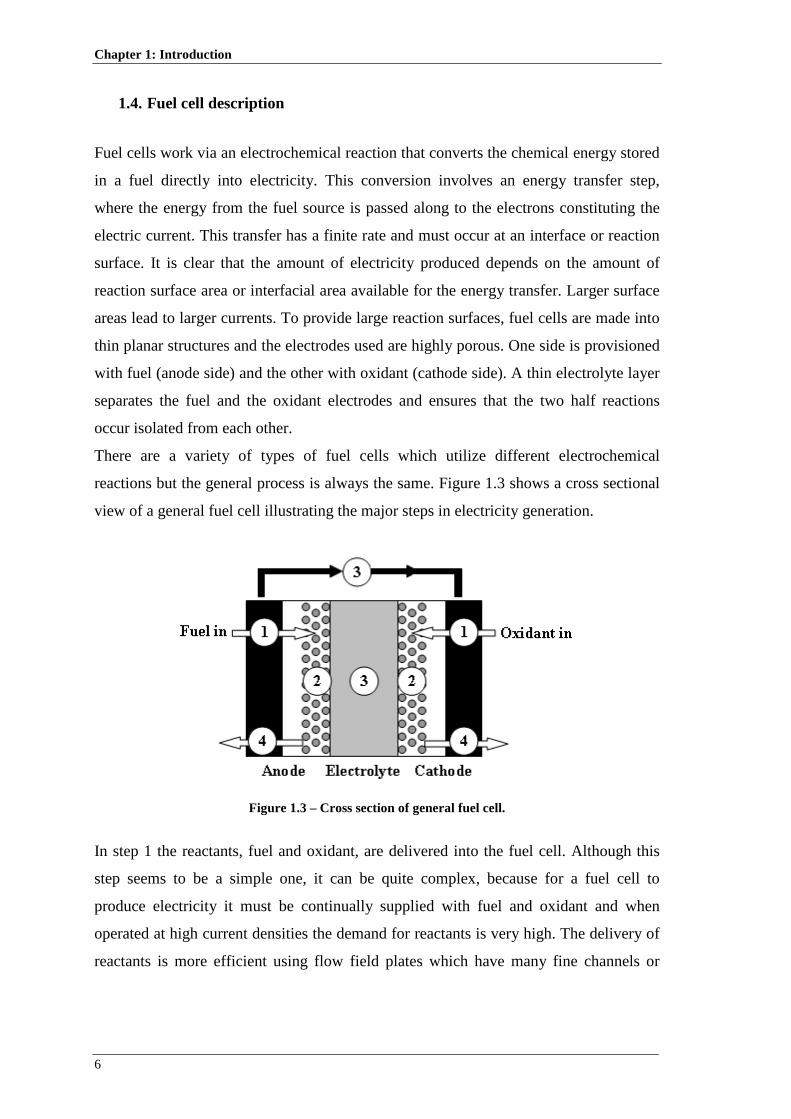
Chapter 1: Introduction
6
1.4. Fuel cell description
Fuel cells work via an electrochemical reaction that converts the chemical energy stored
in a fuel directly into electricity. This conversion involves an energy transfer step,
where the energy from the fuel source is passed along to the electrons constituting the
electric current. This transfer has a finite rate and must occur at an interface or reaction
surface. It is clear that the amount of electricity produced depends on the amount of
reaction surface area or interfacial area available for the energy transfer. Larger surface
areas lead to larger currents. To provide large reaction surfaces, fuel cells are made into
thin planar structures and the electrodes used are highly porous. One side is provisioned
with fuel (anode side) and the other with oxidant (cathode side). A thin electrolyte layer
separates the fuel and the oxidant electrodes and ensures that the two half reactions
occur isolated from each other.
There are a variety of types of fuel cells which utilize different electrochemical
reactions but the general process is always the same. Figure 1.3 shows a cross sectional
view of a general fuel cell illustrating the major steps in electricity generation.
Figure 1.3 – Cross section of general fuel cell.
In step 1 the reactants, fuel and oxidant, are delivered into the fuel cell. Although this
step seems to be a simple one, it can be quite complex, because for a fuel cell to
produce electricity it must be continually supplied with fuel and oxidant and when
operated at high current densities the demand for reactants is very high. The delivery of
reactants is more efficient using flow field plates which have many fine channels or

Transport Phenomena in Direct Methanol Fuel Cells: Modelling and Experimental Studies
7
grooves to carry the gas flow and distribute it over the surface of the fuel cell. The
shape, size and pattern flow channels can influence the performance of the fuel cell.
In step 2 the electrochemical reactions take place at the electrodes. The current
generated by the fuel cell is directly related to how fast the electrochemical reactions
proceed. Fast electrochemical reactions result in a high current output from the fuel cell.
To increase the speed and efficiency of the electrochemical reactions, catalysts are used.
The electrochemical reactions occurring in the previous step either produce or consume
ions and electrons. The ions and electrons produced in one electrode must be consumed
at the other one. In step 3 the ions are conducted through the electrolyte and electrons
through the external circuit. In addition to electricity, all fuel cell reactions will generate
at least one product and heat. If these products are not removed they will accumulate
over time preventing the new fuel and oxidant from being able to react. In step 4 the
products formed in the electrochemical reactions are removed from the fuel cell.
An ideal fuel cell would supply any amount of current while maintaining a constant
voltage determined by thermodynamics. In real fuel cells, however, the actual voltage
output is less than the ideal thermodynamically predicted voltage due to irreversible
losses. There are three major types of losses (activation, ohmic and mass transport
region) each of these associated with one of the basic steps mentioned above. Each type
of losses can be the predominant loss factor depending on the cell voltage and current
density. The activation loss is due to electrochemical reaction since the reactions take
more energy to catalyze than in the ideal case. The activation barrier is the major factor
contributing to inefficiency when operating a cell at high voltage and low current
density. In the middle of operating range the predominant loss is the Ohmic loss and is
due to ionic and electronic conduction. At very high current densities, the major loss is
the concentration loss due to mass transport. An example of a fuel cell polarization
curve with the three losses is provided in Fig. 1.4.

Chapter 1: Introduction
8
Figure 1.4 – Schematic representation of fuel cell polarization curve.
1.5. Fuel cell types
Fuel cells are classified by their electrolyte material. At the present time, there are
several types of fuel cells that are being developed for different applications. While all
different fuel cells types are based upon the same underlying electrochemical principles,
they all operate at different range of temperature, incorporate different materials and
often differ in their fuel tolerance and performance characteristics, as shown in Table
1.1.
Table 1.1 – Major characteristics of different fuel cell types.
Fuel cell type Electrolyte
Charge carrier
Operating temperature Fuel compatibility
PEMFC Polymer membrane H+ 20-80ºC Hydrogen
DMFC Polymer membrane H+ 20-80ºC Methanol
AFC Liquid potassium
hydroxide OH- 60-220ºC Hydrogen
PAFC Liquid phosphoric
acid H+ 200ºC Hydrogen
MCFC Molten carbonate CO32- 650ºC Hydrogen and Methane
SOFC Ceramic O2- 600-1000ºC Hydrogen, Methane
and Carbon monoxide

Transport Phenomena in Direct Methanol Fuel Cells: Modelling and Experimental Studies
9
1.5.1. Polymer Electrolyte Membrane Fuel Cell (PEMFC)
Polymer Electrolyte Membrane fuel cells use a polymer membrane as the electrolyte.
This polymer is permeable to protons who are the ionic charge carriers. The fuel used in
this type of fuel cells is hydrogen and the oxidant pure oxygen or from the air. At the
anode, the hydrogen molecule is split into hydrogen ions (protons) and electrons. The
protons pass through the electrolyte to the cathode while the electrons flow through an
external circuit and produce electric power. Oxygen is supplied to the cathode and
combines with the electrons and the protons to produce water. The reactions at the
electrodes are as follows:
Anode reaction: −+ +→ eHH 222 (1.1)
Cathode reaction: OHeHO 22 222
1 →++ −+ (1.2)
Overall reaction: OHOH 2222
1 →+ (1.3)
Compared to other types of fuel cells, PEMFCs generate more power for a given
volume or weight of fuel cell making them compact and lightweight. The operation
temperature is less than 100ºC, which allows rapid star-up. Since this type of fuel cells
uses a solid material as electrolyte, the sealing of the anode and cathode gases is simpler
and therefore less expensive to manufacture. The solid electrolyte has fewer problems
with corrosion thus leading to a longer cell and stack life. Due to their advantages
PEMFCs are believed to be the best type of fuel cell as the vehicular power source to
replace the Otto and Diesel internal combustion engines.
1.5.2. Direct Methanol Fuel Cell (DMFC)
Direct methanol fuel cell is similar to the PEMFC since the electrolyte is a polymer and
the charge carrier is the hydrogen ion (proton). However the DMFC draws hydrogen
from liquid methanol eliminating the need of a reformer. In this point of work no further

Chapter 1: Introduction
10
information is given about DMFC since Chapter 2 is devoted to an extensive
explanation of this type of fuel cell.
1.5.3. Alkaline Fuel Cell (AFC)
Alkaline fuel cells use an electrolyte that is an aqueous solution of potassium hydroxide
(KOH) retained in a porous stabilized matrix. The concentration of the solution can be
varied with the fuel cell operating temperature, which ranges from 65 to 220ºC. The
charge carrier for an AFC is the hydroxyl ion (HO-) that passes through the electrolyte
from the cathode to the anode where it reacts with hydrogen to produce water and
electrons. Water formed at the anode migrates back to the cathode to regenerate
hydroxyl ions. The reactions in this type of fuel cell produce electricity and heat. The
reactions that take place on the anode and cathode side are:
Anode reaction: −− +→+ eOHOHH 222 22 (1.4)
Cathode reaction: −− →++ OHeOHO 222
122 (1.5)
Overall reaction: OHOH 2222
1 →+ (1.6)
Alkaline fuel cells are one of the most developed technologies and, as referred above,
have been used since the mid-1960s by NASA in the Apollo and Space Shuttle
programs.
AFCs are the cheapest fuel cells to manufacture because the catalyst that is required at
the electrodes can be any of a number of different materials that are relatively
inexpensive compared to the catalysts required for other types of fuel cells. Their
sensitivity to poisoning, which requires use of pure or cleansed hydrogen and oxygen, is
an insuperable obstacle at the present time. Conversely, AFCs operate at relatively low
temperatures and are among the most efficient fuel cells, characteristics that would
enable a quick starting power source and high fuel efficiency, respectively.
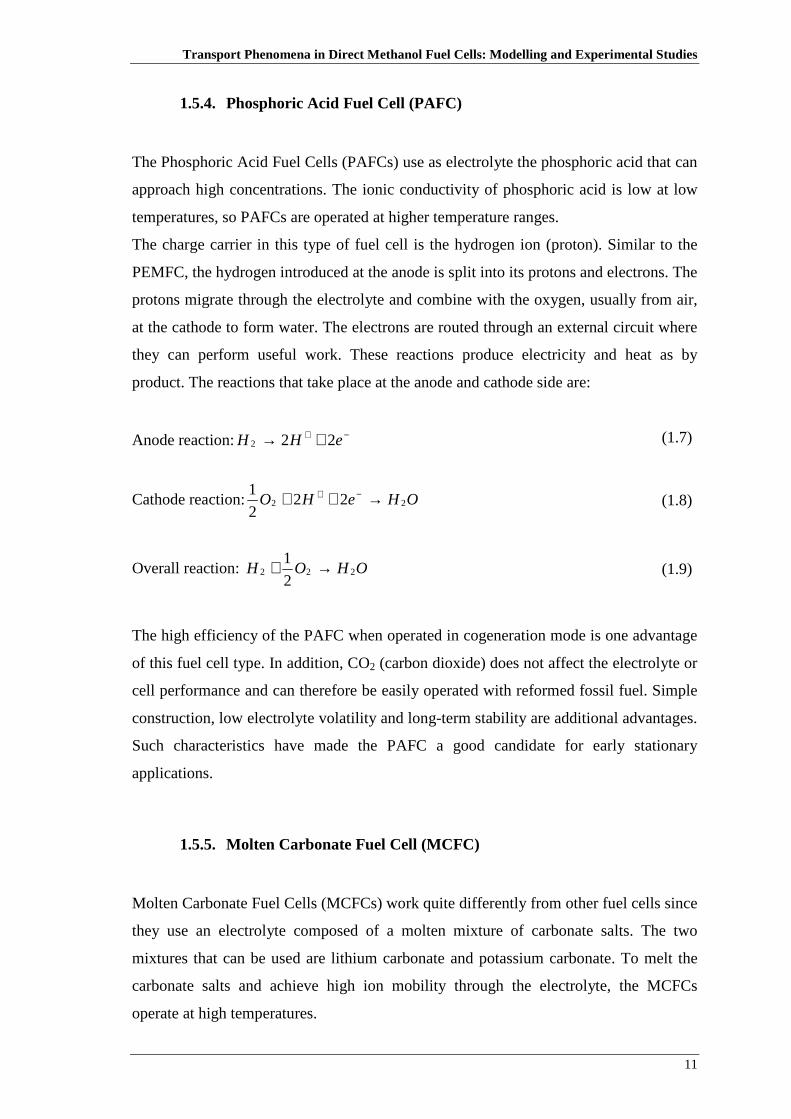
Transport Phenomena in Direct Methanol Fuel Cells: Modelling and Experimental Studies
11
1.5.4. Phosphoric Acid Fuel Cell (PAFC)
The Phosphoric Acid Fuel Cells (PAFCs) use as electrolyte the phosphoric acid that can
approach high concentrations. The ionic conductivity of phosphoric acid is low at low
temperatures, so PAFCs are operated at higher temperature ranges.
The charge carrier in this type of fuel cell is the hydrogen ion (proton). Similar to the
PEMFC, the hydrogen introduced at the anode is split into its protons and electrons. The
protons migrate through the electrolyte and combine with the oxygen, usually from air,
at the cathode to form water. The electrons are routed through an external circuit where
they can perform useful work. These reactions produce electricity and heat as by
product. The reactions that take place at the anode and cathode side are:
Anode reaction: −+ +→ eHH 222 (1.7)
Cathode reaction: OHeHO 22 222
1 →++ −+ (1.8)
Overall reaction: OHOH 2222
1 →+ (1.9)
The high efficiency of the PAFC when operated in cogeneration mode is one advantage
of this fuel cell type. In addition, CO2 (carbon dioxide) does not affect the electrolyte or
cell performance and can therefore be easily operated with reformed fossil fuel. Simple
construction, low electrolyte volatility and long-term stability are additional advantages.
Such characteristics have made the PAFC a good candidate for early stationary
applications.
1.5.5. Molten Carbonate Fuel Cell (MCFC)
Molten Carbonate Fuel Cells (MCFCs) work quite differently from other fuel cells since
they use an electrolyte composed of a molten mixture of carbonate salts. The two
mixtures that can be used are lithium carbonate and potassium carbonate. To melt the
carbonate salts and achieve high ion mobility through the electrolyte, the MCFCs
operate at high temperatures.

Chapter 1: Introduction
12
When heated these salts melt and become conductive to carbonate ions (CO32-). These
ions flow from the cathode to the anode where they combine with hydrogen to give
water, carbon dioxide and electrons. These electrons pass through an external circuit
back to the cathode, generating electricity and heat. The reactions that take place on the
anode and cathode side are as follows:
Anode reaction: −− ++→+ eCOOHHCO 222223 (1.10)
Cathode reaction: −− →++ 2322 2
2
1COeOCO (1.11)
Overall reaction: OHOH 2222
1 →+ (1.12)
The Molten Carbonate Fuel Cell (MCFC) is in the class of high temperature fuel cells.
At the higher operating temperature, fuel reforming of natural gas can occur internally,
eliminating the need for an external fuel processor. Additional advantages include the
ability to use standard materials for construction, such as stainless steel sheet, and allow
the use of nickel-based catalysts on the electrodes. The by-product heat, from an
MCFC, can be used to generate high pressure steam that can be used in many industrial
and commercial applications. However, the high temperature requires significant time
to reach operating conditions and responds slowly to changing power demands. These
characteristics make MCFCs more suitable for constant power applications. The
carbonate electrolyte can also cause electrode corrosion problems. Furthermore, since
CO2 is consumed at the cathode and transferred to the anode, introduction of CO2 and
its control in air stream becomes an important issue for achieving optimum
performance.
1.5.6. Solid Oxide Fuel Cell (SOFC)
The Solid Oxide Fuel Cell (SOFC) is currently the highest temperature fuel cell in
development. To operate at such high temperatures, the electrolyte is a thin, solid
ceramic material (solid oxide) that is conductive to oxygen ions (O2-), the charge carrier
in the SOFC. At the cathode, the oxygen molecules from the air are split into oxygen
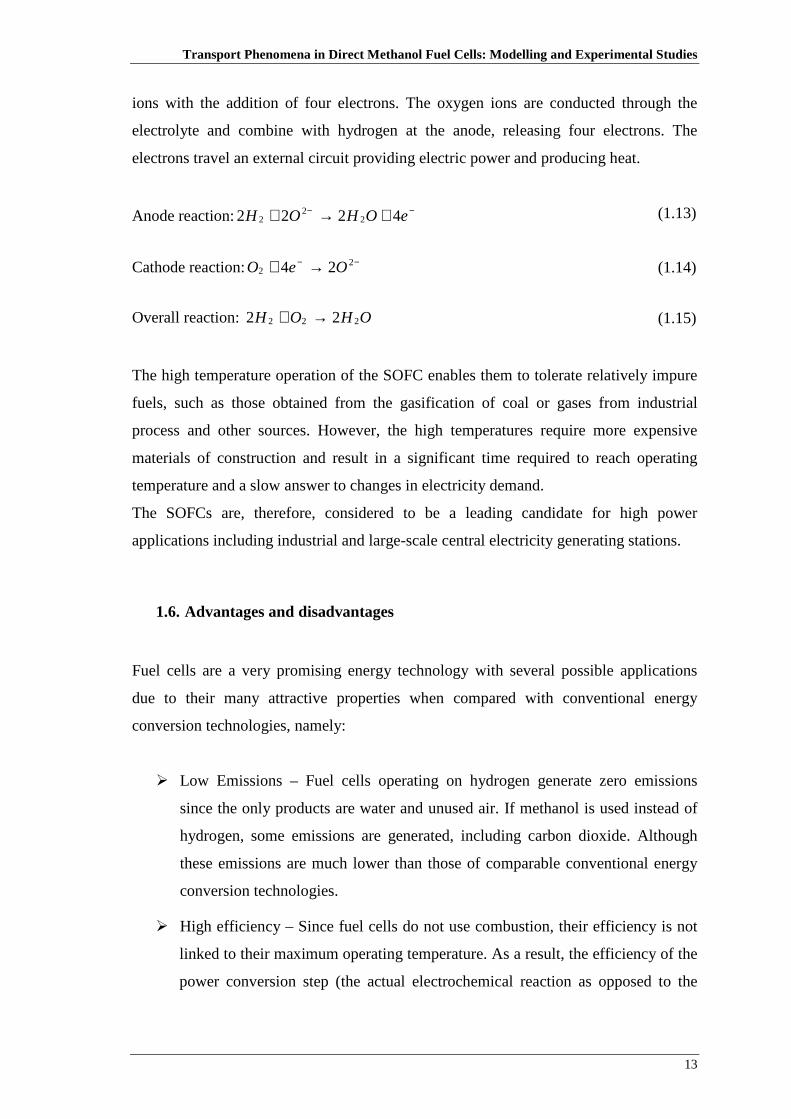
Transport Phenomena in Direct Methanol Fuel Cells: Modelling and Experimental Studies
13
ions with the addition of four electrons. The oxygen ions are conducted through the
electrolyte and combine with hydrogen at the anode, releasing four electrons. The
electrons travel an external circuit providing electric power and producing heat.
Anode reaction: −− +→+ eOHOH 4222 22
2 (1.13)
Cathode reaction: −− →+ 2
2 24 OeO (1.14)
Overall reaction: OHOH 222 22 →+ (1.15)
The high temperature operation of the SOFC enables them to tolerate relatively impure
fuels, such as those obtained from the gasification of coal or gases from industrial
process and other sources. However, the high temperatures require more expensive
materials of construction and result in a significant time required to reach operating
temperature and a slow answer to changes in electricity demand.
The SOFCs are, therefore, considered to be a leading candidate for high power
applications including industrial and large-scale central electricity generating stations.
1.6. Advantages and disadvantages
Fuel cells are a very promising energy technology with several possible applications
due to their many attractive properties when compared with conventional energy
conversion technologies, namely:
Low Emissions – Fuel cells operating on hydrogen generate zero emissions
since the only products are water and unused air. If methanol is used instead of
hydrogen, some emissions are generated, including carbon dioxide. Although
these emissions are much lower than those of comparable conventional energy
conversion technologies.
High efficiency – Since fuel cells do not use combustion, their efficiency is not
linked to their maximum operating temperature. As a result, the efficiency of the
power conversion step (the actual electrochemical reaction as opposed to the

Chapter 1: Introduction
14
actual combustion reaction) can be significantly higher than that of thermal
engines.
Refuelling time – Fuel cell systems do not require recharging. Rather, fuel cell
systems must be refuelled, which is faster than charging a battery and can
provide greater range depending on the size of the storage tank.
No moving parts and long life – Since fuel cells does not have any moving parts,
it may be expected to exhibit a long life.
Modular – fuel cells are modular so more power may be generated simply by
adding more cells. Mass produced fuel cells may be significantly less expensive
than traditional power plants.
Size and weight – fuel cells may be made in a variety of sizes which makes them
useful in a variety of applications, from powering electronic devices to powering
entire buildings.
Despite their numerous advantages fuel cells presented some disadvantages:
Hydrogen – Hydrogen which is of such benefit environmentally when used in a
fuel cell, is also its greatest liability because it is difficult to manufacture and
store. Current manufacturing processes are expensive and energy intensive, and
often derive ultimately from fossil fuels.
Contaminants sensitivity – Fuel cells require relatively pure fuel, free of specific
contaminants. These contaminants can deactivate the fuel cell catalyst
effectively destroying its ability to operate.
High cost catalyst – Fuel cells suitable for automotive applications typically
require the use of a platinum catalyst to promote the power generation reaction
and platinum is a rare and expensive metal.
New technology – Fuel cells are an emerging technology. So the reductions in
cost, weight and size along with increases in reliability and lifetime are needed.

Transport Phenomena in Direct Methanol Fuel Cells: Modelling and Experimental Studies
15
1.7. Applications
As the understanding and technology for fuel cells grow, and the concern over world
petroleum reserves and the environmental impact of its combustion increases, fuel cells
emerge as one of the possible solutions to provide clean energy production. Since fuel
cells can be stacked to increase energy output depending on the demand, they have a
wide range of uses. There are three main sectors of applications where fuel cells could
play an important role in the future: transportation, stationary power, and portable
power (Fig. 1.5).
Figure 1.5 – Examples of fuel cell applications (Courtesy of Honda, Ballard, Samsung, Shell, Jadoo,
Motorola, Suzuki, Company's XX25, Pearl Hydrogen, Yamaha, DaimlerChrysler and Plug Power
Inc.)
1.7.1. Transportation
A key commercial application of fuel cells is to possibly replace the internal combustion
engine in transportation applications. A great deal of excitement and potential lies in the
market opportunity for fuel cell vehicles. Today, all of the major automobile
manufacturers and several related companies are developing prototype fuel cell vehicles
Chapter 1: Introduction
16
to investigate this possibility. Some of the companies involved in the area are
DaimlerChrysler, Ford, General Motors, Honda, Hyundai, Mazda, Mitsubishi Motors,
Nissan, PSA Peugeot, Citroen, Renault and Toyota Motor Corporation. There are many
vehicles in various stages of demonstration and development. Since Ballard revealed the
world's first fuel cell bus in 1993, approximately twenty five fuel cell buses have been
built and operated worldwide. Fuel cells can also be used in trucks, scooters, bicycles,
utility vehicles (wheel chair), golf carts, airplanes, space shuttles, space orbiters and
locomotives. In the shipping area, development work is underway in the area of
propulsion as well as auxiliary power for cruise ships, powered barges, ferry boats,
offshore supply boats, push-tow boats, oceangoing tugs, submersibles, and even
submarine tankers. Fuel cells have also been suggested for use as power sources for
ports, offshore oil platforms, underwater facilities, and for refrigeration on
containerships. For transportation applications of fuel cells, one of the most important
developments involves fuel handling and fuel processing. For example, the proton
exchange membrane fuel cell (PEMFC), which is considered to be the primary
candidate for transportation propulsion applications, needs a pure, clean hydrogen fuel.
Therefore, stringent requirements must be placed on the processing of transportation
fuels like gasoline and methanol to eliminate compounds that could poison the cells.
The development of compact, efficient, cost-effective, high purity, hydrogen producing
reformer technology is a key requirement. An alternative strategy to relieve the need for
on-board reformation of liquid transportation fuels is the storage and direct use of
hydrogen. This approach will require significant advances in the storage of hydrogen
using metal hydrides, carbon nano-tubes, or crash-worthy, high pressure hydrogen tank
technology. A significant development of the hydrogen supply infrastructure would be
needed as well.
1.7.2. Stationary power
Fuel cells could potentially produce electricity for homes, commercial, institutions, and
industry through stationary power plants. Sizes range from 1 kilowatt to several
megawatts (enough to power institutions or factories). Some fuel cell developers for
stationary applications are Avista Labs (PEMFC), Ebara Ballard (PEMFC), Fuel Cell
Energy (MCFC), Fuel Cell Technologies (SOFC), GE Microgen (PEMFC), General

Transport Phenomena in Direct Methanol Fuel Cells: Modelling and Experimental Studies
17
Motors (PEMFC), H Power (PEMFC), Idatech (PEMFC), Matsushita Electric Industrial
Co Ltd (PEMFC), Nuvera (PEMFC), Plug Power, Inc. (PEMFC) and UTC Fuel Cells
(PAFC, PEMFC). In residential applications, small fuel cell power plants could be
installed for the production of both electricity and heat or hot water for homes
utilization. Industrial applications refering to general group of large-scale applications
that typically incorporate multiple buildings include universities and colleges, prisons,
government or military facilities. In these applications, the ability to generate electricity
and heat onsite has multiple benefits including the utilization of heat for air cooling,
laundry facilities, cafeteria facilities, preheating water for onsite boilers. Commercial
application refers to applications that are connected to a business. Examples include an
apartment building or complex, an office building, strip mall or a hotel. Stationary
power applications of fuel cells will require the development of low-cost, reliable, and
efficient power inverter and grid interface technology. Power inversion is required to
convert the direct current power produced ordinarily by the fuel cell stack into the
alternating current on the utility grid. Also, control technology is needed to achieve
reliable and cost-effective operation of fuel cells and to produce high-quality power.
The balance of plant considerations such as pumps, valves, piping, controls, and power
electronics require advancement in reliability, cost, and optimization for fuel cell
applications.
1.7.3. Portable power
Fuel cells will change the telecommunication world, powering cellular phones, laptops
and palm pilots hours longer than batteries. Companies have already demonstrated fuel
cells that can power cell phones for 30 days without recharging and laptops for 20
hours. Other applications for fuel cells include pagers, video recorders, portable power
tools, and low power remote devices such as hearing aids, smoke detectors, burglar
alarms, hotel locks and meter readers. Most of the portable applications have used
PEMFC although nowadays the Direct Methanol Fuel Cells is an area of intense
research and development. Some companies involved in the area of portable fuel cells
are Casio, Direct Methanol Fuel Cell Corporation, Hitachi, MTI Micro Fuel Cells,
Motorola, Panasonic, Samsung Advanced Institute of Technology, Sanyo, Smart Fuel
Cells and Toshiba.

Chapter 1: Introduction
18

19
CHAPTER 2 2. DIRECT METHANOL FUEL CELLS: STATE-OF-THE-ART
This Chapter starts with a brief introduction recalling the Direct Methanol Fuel Cell
Technology. Then the basic fundamentals of an active feed DMFC and of a passive
feed DMFC are presented. An intensive review on the recent work done in active
and passive DMFC experimental and modelling studies is described. Finally
examples of DMFC applications are reported.
The contents of this Chapter were partially published in Oliveira, V.B, Falcão, D.S.,
Rangel, C.M. and Pinto, A.M.F.R., “A comparative study of approaches to direct
methanol fuel cells modelling”, International Journal of Hydrogen Energy, Vol. 32,
Issue 3, March 2007 415-424.
2.1. Introduction
Within the last years, the interest in fuel cells of all types has increased dramatically,
due to high efficiencies, nonexistence of gaseous pollutants (sulphur dioxide and
various nitrogen oxides), simplicity and absence of moving parts leading to the
conclusion that a one possible alternative for internal combustion engines was found.
Particular attention was devoted to the polymer electrolyte membrane fuel cells
(PEMFCs). Hydrogen emerges as the best fuel for the cell in terms of operating the fuel
cell itself, although the production, storage and distribution of this fuel are complex
issues. Alternatively, the direct fuel cells (DFCs) which use fuels (in liquid or vapour
form) directly without a reforming step have gained increasing importance. The most
commonly used liquid fuels in direct fuel cells are methanol, ethanol and formic acid.
Although hydrogen can be used as a direct fuel, these liquid fuels usually have much
higher volumetric energy density and are much easier to store, transport and distribute.
DFCs usually have a compact design and potentially can offer up to 10 times the energy
density of rechargeable batteries. In addition, DFCs can be designed to operate at
ambient temperature, which significantly reduces thermal management challenges for
small systems. These advantages make the technology attractive to the rapid growing

Chapter 2: Direct Methanol Fuel Cells
20
need for portable power sources which should include micro and small DFCs. The
major disadvantages of using direct fuel cells are the slow anode kinetics arising from a
multi-step fuel oxidation process at the anode, and the fuel crossover from the anode to
the cathode. The crossover not only lowers the fuel utilization, but also degrades the
cathode performance and generates extra heat. The slow anode kinetics results in higher
anodic overpotentials. Among different fuel options, methanol is an attractive one
because it is a liquid at room temperature, has limited toxicity, high energy density, is
easy to handle, relatively easy to distribute and has low cost since it can be generated
from natural gas, coal, or biomass. Due to its important characteristics, the direct
methanol fuel cells (DMFCs) have received in the last years the most extensive
attention and efforts compared to other types of fuel cells.
2.2. Operating principle of the DMFC
A direct methanol fuel cell (DMFC) is an electrochemical cell that generates electricity
based on the oxidation of methanol and reduction of oxygen using a polymer membrane
as the electrolyte. This polymer is permeable to protons who are the ionic charge
carrier. Figure 2.1 shows schematically a typical direct methanol fuel cell, comprising
an anode flow channel (AF), an anode diffusion layer (AD), an anode catalyst layer
(AC), a membrane (M), a cathode catalyst layer (CC), a cathode diffusion layer (CD)
and a cathode flow channel (CF).
Figure 2.1 – Operating principle of a DMFC.
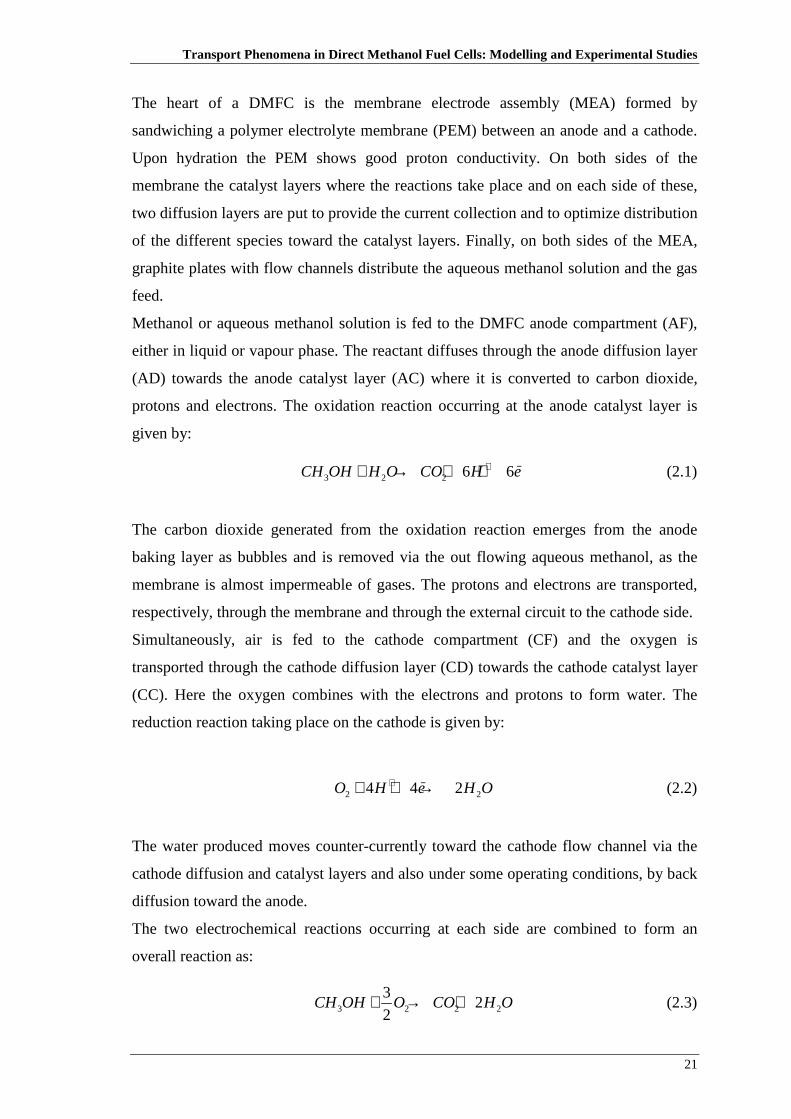
Transport Phenomena in Direct Methanol Fuel Cells: Modelling and Experimental Studies
21
The heart of a DMFC is the membrane electrode assembly (MEA) formed by
sandwiching a polymer electrolyte membrane (PEM) between an anode and a cathode.
Upon hydration the PEM shows good proton conductivity. On both sides of the
membrane the catalyst layers where the reactions take place and on each side of these,
two diffusion layers are put to provide the current collection and to optimize distribution
of the different species toward the catalyst layers. Finally, on both sides of the MEA,
graphite plates with flow channels distribute the aqueous methanol solution and the gas
feed.
Methanol or aqueous methanol solution is fed to the DMFC anode compartment (AF),
either in liquid or vapour phase. The reactant diffuses through the anode diffusion layer
(AD) towards the anode catalyst layer (AC) where it is converted to carbon dioxide,
protons and electrons. The oxidation reaction occurring at the anode catalyst layer is
given by:
3 2 2 6 6CH OH H O CO H e+ −+ → + + (2.1)
The carbon dioxide generated from the oxidation reaction emerges from the anode
baking layer as bubbles and is removed via the out flowing aqueous methanol, as the
membrane is almost impermeable of gases. The protons and electrons are transported,
respectively, through the membrane and through the external circuit to the cathode side.
Simultaneously, air is fed to the cathode compartment (CF) and the oxygen is
transported through the cathode diffusion layer (CD) towards the cathode catalyst layer
(CC). Here the oxygen combines with the electrons and protons to form water. The
reduction reaction taking place on the cathode is given by:
2 24 4 2O H e H O+ −+ + → (2.2)
The water produced moves counter-currently toward the cathode flow channel via the
cathode diffusion and catalyst layers and also under some operating conditions, by back
diffusion toward the anode.
The two electrochemical reactions occurring at each side are combined to form an
overall reaction as:
3 2 2 2
32
2CH OH O CO H O+ → + (2.3)

Chapter 2: Direct Methanol Fuel Cells
22
The operation temperature of a DMFC is less than 100ºC, which allows rapid start-up.
2.3. Fundamentals of a DMFC
The present section deals with the fundamental transport processes of methanol, water
and heat, essential in DMFCs. The basic transport phenomena, along with
electrochemical kinetics are critical to address the four technical challenges in a DMFC:
i) low rate of methanol oxidation kinetics on the anode, ii) methanol crossover through
the membrane, iii) water management and iv) heat management.
2.3.1. Cell components
As referred, the heart of a DMFC is the membrane electrode assembly (MEA). A
schematic representation of a direct methanol fuel cell MEA is shown in Fig. 2.2,
consisting of:
a diffusion layer (AD) and a catalyst layer (AC) at the anode side;
a polymer electrolyte membrane (M);
a catalyst layer (CC) and a diffusion layer (CD) at the cathode side.
Figure 2.2 – Schematic representation of a direct methanol fuel cell MEA.
The most important component of a PEM fuel cell, specifically a DMFC, is the polymer
electrolyte membrane (PEM) which must have a relatively high proton conductivity,
must be a barrier to the mixing of fuel and reactant gases and must be chemically and
mechanically stable in the fuel cell environment. Typically, the membranes for DMFCs

Transport Phenomena in Direct Methanol Fuel Cells: Modelling and Experimental Studies
23
are made of perfluorocarbon-sulfonic acid ionomer which results from the combination
of tetrafluorethylene with perfluorosulfonate monomers. The perfluorinated sulfonic
acid membranes were developed by DuPont and sold under the commercial name of
Nafion. Figure 2.3 shows the chemical structure of a Nafion membrane.
Figure 2.3 – Schematic representation of the Nafion chemical structure.
The SO3H (sulfonic acid) group is ionically bonded and so the end of the chain is an
SO3- ion with H+ ion. This is the reason why this structure is called ionomer. The groups
SO3- are responsible for creating hydrophilic regions, thus absorbing relatively large
amounts of water. The H+ ions movement within the well hydrated regions makes these
materials proton conductive. Nafion membranes are available in several thicknesses and
are marked with a letter N, followed by a 3 or 4 digit number. The last one or two digits
represent the membrane thickness in mills, for example N117 has 7 mills (0.178 mm).
As already referred, on either side of the membrane are placed the anode and cathode
catalyst layer. In the reactions occurring in a DMFC, gaseous and liquid reactants,
electrons and protons are presented. The reactions take place in a portion of the catalyst
surface where all three species have access. Electrons travel through electrically
conductive solids, protons through ionomer and the reactants through the voids.
Therefore the electrode must be porous to allow the reactants to travel to the reaction
sites. At the same time the products formed in the electrochemical reactions must be
effectively removed to allow the reactants access.
The most common used catalysts in DMFCs are Pt/Ru on the anode side and Pt on the
cathode side. The microstructure of the catalyst layer is very important for the kinetics
of the electrochemical reaction and for the diffusion of species. Figure 2.4 shows an
example of the microstructures of the DMFC anode and cathode, respectively, where
high surface areas for electrochemical reactions are clearly visible.
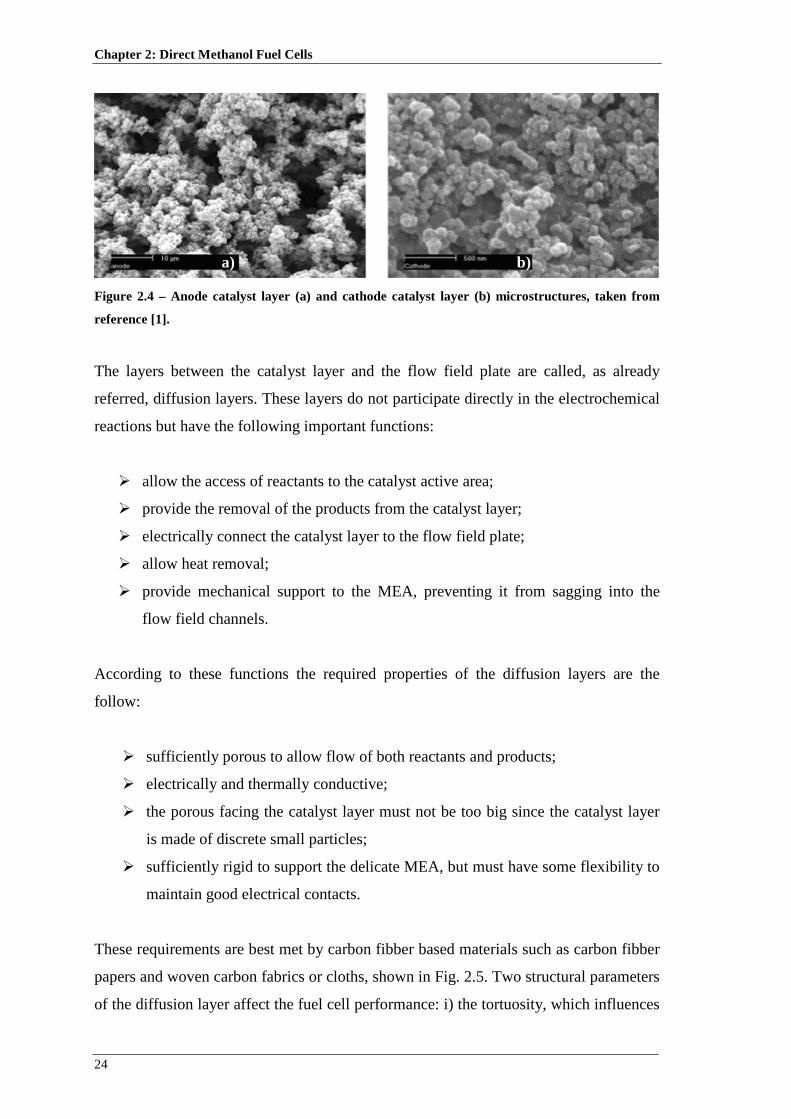
Chapter 2: Direct Methanol Fuel Cells
24
Figure 2.4 – Anode catalyst layer (a) and cathode catalyst layer (b) microstructures, taken from
reference [1].
The layers between the catalyst layer and the flow field plate are called, as already
referred, diffusion layers. These layers do not participate directly in the electrochemical
reactions but have the following important functions:
allow the access of reactants to the catalyst active area;
provide the removal of the products from the catalyst layer;
electrically connect the catalyst layer to the flow field plate;
allow heat removal;
provide mechanical support to the MEA, preventing it from sagging into the
flow field channels.
According to these functions the required properties of the diffusion layers are the
follow:
sufficiently porous to allow flow of both reactants and products;
electrically and thermally conductive;
the porous facing the catalyst layer must not be too big since the catalyst layer
is made of discrete small particles;
sufficiently rigid to support the delicate MEA, but must have some flexibility to
maintain good electrical contacts.
These requirements are best met by carbon fibber based materials such as carbon fibber
papers and woven carbon fabrics or cloths, shown in Fig. 2.5. Two structural parameters
of the diffusion layer affect the fuel cell performance: i) the tortuosity, which influences
a) b)

Transport Phenomena in Direct Methanol Fuel Cells: Modelling and Experimental Studies
25
the species transport and ii) the surface properties, the wettability and roughness,
controlling the droplet/bubble attachment or coverage on the diffusion layer surface.
Carbon cloth is more porous and less tortuous than carbon paper, although carbon paper
has excellent electronic conductivity. Diffusion media are generally made hydrophobic
to avoid flooding in their bulk since the hydrophobic character allows the excess water
in the cathode catalyst layer to be expelled from the cell. To fulfill these goals,
typically, the gas diffusion layers are PTFE (polytetrafluoroethylene) treated. Although,
the anode diffusion layer of a DMFC should be hydrophilic to facilitate the mass
transfer of the dilute methanol solution to the anode. One approach to transform the
anode diffusion layer more hydrophilic is to partially fill the pores of the carbon porous
media with certain metal oxide compounds (for example: aluminum oxide or niobium
oxide).
Figure 2.5 – Micrographs of commercially available carbon paper (a) and carbon cloth (b), taken
from reference [1].
2.3.2. Thermodynamics and polarization curve
The thermodynamic equilibrium potential of a DMFC can be calculated as follows [1]:
G H T SE
nF nF
∆ ∆ − ∆∆ = − = − (2.4)
where n represents the number of electrons involved (equal to 6), F is the Farady
constant, the ∆G, ∆H and ∆S values at 25ºC and 1 atm are, respectively, -704 kJ/kg, -
727 kJ/kg and -77 kJ/kgK. For the liquid feed DMFC the thermodynamic cell potential
is 1.21 V.
a) b)
Chapter 2: Direct Methanol Fuel Cells
26
The thermodynamic efficiency of a fuel cell is defined as the ratio of maximum possible
electrical work to the total chemical energy:
100 100rev
G nF E
H Hη ∆ ∆= × = − ×
∆ ∆ (2.5)
The theoretical thermodynamic efficiency of DMFC reaches 97% at 25ºC. However the
real energy efficiency is much lower after accounting for the inherent losses in a fuel
cell: voltage and fuel losses. The voltaic efficiency is defined as the ratio of the actual
electric work and the maximum possible work and can be written as:
max
100 100 100 100actual Cell Cell Cellvoltaic
imum
W nFE nFE E
W G nF E Eη − −= × = × = × = ×
∆ − ∆ ∆ (2.6)
where ECell is the cell voltage at a current of I. If the cell is running at 0.5 V, then the
voltaic efficiency is 41%. This low efficiency is caused by substantial overpotentials
existed in the anode and cathode of a DMFC.
The fuel efficiency, due to methanol crossover, is defined as:
3
100Cellfuel
cell CH OH
I
I Iη = ×
+ (2.7)
where ICell is the cell current and OHCHI 3 is the current caused by methanol crossover.
The total electric energy efficiency of a DMFC is given by:
fuel voltaic revη η η η= × × (2.8)
The energy efficiency of the PEMFC is relatively higher due to its negligible fuel
crossover and overpotential for hydrogen oxidation on the anode. In order to achieve
higher energy efficiency in DMFC it is necessary to control the methanol crossover.
The waste heat produced in the DMFC is given by:

Transport Phenomena in Direct Methanol Fuel Cells: Modelling and Experimental Studies
27
( )3Cell CH PHCell Cell
Cell Cell Cell Cell
H I II EQ I E I E
nFη−∆ +×= − × = − × (2.9)
where the first term, on the right hand side, represents the chemical energy of methanol
consumed power generation and by crossover and the second the electric energy
generated.
As was mentioned before the thermodynamic equilibrium cell potential for a DMFC is
1.21 V, although the real open circuit voltage is much lower than this, largely due to the
methanol crossover. Figure 2.6 shows a polarization curve (voltage (V) vs. current
density (A/cm2)) of a typical DMFC.
Figure 2.6 – Schematic representation of a typical DMFC polarization curve.
The activation region or kinetic control region is dictated by slow methanol oxidation
kinetics at the anode as well as slow oxygen reduction kinetics at the cathode. The area
where the cell voltage decreases nearly linearly is recognized as the ohmic control
region. As the membrane in DMFC is usually well hydrated, the voltage loss in this
region is minimal. The last part of the curve is referred to as the mass transport control
region, where either methanol transport on the anode side results in a mass transport
limiting current, or the oxygen supply at the cathode becomes a limiting step.

Chapter 2: Direct Methanol Fuel Cells
28
2.3.3. Methanol oxidation and oxygen reduction kinetics
Combined with the methanol crossover, slow anode kinetics lead to a decreasing power
density, which in a DMFC is three to four times lower than in a hydrogen fuel cell.
While the anodic oxidation of hydrogen is a well understood fast reaction, the anodic
methanol oxidation is more complex. Although the thermodynamic characteristics are
similar to the hydrogen reaction, the methanol electro-oxidation reaction is a slower
process and involves the transfer of six electrons to the electrode for complete oxidation
to carbon dioxide.
Many studies on the oxidation of small organic molecules at low temperatures have
been carried out [2-13]. Most of these studies have been carried out in a half-cell
configuration and on smooth electrode surfaces, in order to establish the best
electrocatalyst composition. These investigations were combined with spectroscopic
techniques in order to elucidate the oxidation mechanism and to investigate the
irreversibly adsorbed species on the electrode surface. During these studies, it was
concluded that almost all electro-oxidation reactions involving low molecular weight
organic molecules, such as CO (carbon monoxide) and CH3OH (methanol), require the
presence of Pt-based (Platinum based) materials displaying a high enough stability and
activity to be attractive as catalysts. A second common aspect to these molecules is that
all these electro-oxidation reactions give rise to the formation of strongly adsorbed CO
species in linear or bridge-bonded form.
As was mentioned before, the electro-oxidation of methanol to carbon dioxide requires
the transfer of six electrons, but it is highly unlikely that these electrons will transfer
simultaneously. It is also unlikely that partial electron transfer will lead to the formation
of a range of stable solution intermediates. Clearly, there must be surface adsorbed
species present on the surface of the platinum electrocatalyst across its useful potential
range, and it is these species which are responsible for the poor catalytic activity of
platinum towards methanol electro-oxidation. The assumed mechanisms for methanol
oxidation on Pt based catalyst were reviewed by Parsons et al. [13] and can be divided
in two major steps: i) adsorption of methanol followed by several steps of
dehydrogenation/deprotonation and ii) dissociation of water to provide oxygen that
allows the adsorbed carbon containing intermediates to generate carbon dioxide. A
scheme for the first step is given by [14]:
Transport Phenomena in Direct Methanol Fuel Cells: Modelling and Experimental Studies
29
3 2 1CH OH Pt PtCH OH H e+ −+ → + + (2.10)
2 1CH OH Pt PtCHOH H e+ −+ → + + (2.11)
1CHOH Pt PtCHO H e+ −+ → + + (2.12)
A surface rearrangement of methanol oxidation intermediates gives carbon monoxide as
follows:
1PtCHO Pt C O H e+ −→ − ≡ + + (2.13)
In the absence of promoting element, water discharge occurs at high anodic
overpotentials on Pt with the formation of adsorbed OH species:
2 1Pt H O PtOH H e+ −+ → + + (2.14)
Finally the reaction that produces carbon dioxide:
22 1PtOH PtCO Pt CO H e+ −+ → + + + (2.15)
On a pure Pt surface, the dissociative chemisorption of water on Pt is the rate
determining step at low voltages, precisely in the potential region which is of technical
interest [15]. As a result, an active catalyst for methanol oxidation should give rise to
water discharging at low potentials, to unstable CO chemisorption and should also
catalyze the oxidation of carbon monoxide. The additions of secondary materials that
can combine with platinum are seen as a mean to improve the electrocatalytic behavior
of electrodes, either by minimizing the poisoning reaction or by enhancing the main
oxidation reaction. Some of the advanced materials that have been developed display
enhanced activities and the most likely possible explanations for this are: i) the metal
modifies the electronic properties of the catalyst, weakening the chemical bond between
platinum and the surface intermediate and ii) the second element increases OH
adsorption on the catalyst surface, at lower overpotentials, and decreases the adsorption
strength of the poisoning species.
Much research efforts are being rendered on catalysts to find one which can avoid the
poisoning effect of the CO species [16, 17]. One of the most important and most

Chapter 2: Direct Methanol Fuel Cells
30
investigated secondary materials is Ruthenium (Ru). A bimetallic alloy consisting of Pt
and Ru supported on carbon has thus far been one of the major research interests on
catalyst for direct methanol fuel cells. Other materials such as Sn (Tin), Os (Osmium),
W (Tungsten), Mo (Molybdenum) and other metals have also been investigated for
methanol oxidation and CO poisoning [18-23] and have been found to have a promoting
effect on the catalytic activity for methanol oxidation. For all these species it was found
that the determining factor for promotion is the formation of adsorbed oxygen
containing species, which is needed for the oxidation of intermediate adsorbates, on the
secondary metal at potentials lower than for platinum.
According to the mechanism mentioned above it is accepted that Pt sites in Pt/Ru alloys
are involved in both the methanol dehydrogenation step and in the strong chemisorption
of methanol residues. At low electrode potentials, water discharging occurs on Ru sites
with the formation of Ru-OH groups at the catalyst surface:
2 1Ru H O RuOH H e+ −+ → + + (2.16)
Finally the reaction producing carbon dioxide:
2 1RuOH PtCO Ru Pt CO H e+ −+ → + + + + (2.17)
The nature of the catalyst support, catalyst particle size and the atomic ratio between
platinum (Pt) and ruthenium (Ru) are important factors that affect the anode catalyst
performance. Arico et al. [24] and Ren et al. [25] found that thinner support layers and
even unsupported catalyst lead to better performances. The authors also found that
smaller particles and higher surface areas are beneficial for the process. Contrarily, the
atomic ratio between platinum and ruthenium seems to have a lower influence. For
higher operating temperatures, the optimal performance has been found with atomic
ratios in the region of 1:1. For lower temperatures a higher relative platinum content
seems to be beneficial.
As was mentioned and explained before, most of the studies conclude that the reaction
can proceed according to multiple mechanisms. However, it is commonly accepted that
the more significant reactions are the adsorption of methanol and the oxidation of

Transport Phenomena in Direct Methanol Fuel Cells: Modelling and Experimental Studies
31
carbon monoxide adsorbed. So the following reaction mechanism, similar to the one
used by Meyers et al. [26], was used in the present work.
( )3 3 adsCH OH Pt CH OH+ → (2.18)
( ) ( )3 4 4ads ads
CH OH CO H e+ −→ + + (2.19)
( ) 2 2 2 2ads
CO H O CO H e+ −+ → + + (2.20)
This mechanism does not segregate the electrochemical oxidation of water reaction
from the electrochemical oxidation of carbon monoxide. This assumption does not
change the kinetic expression appreciably and is applicable for Pt/Ru catalyst where the
oxidation of water on Ru occurs much faster than the oxidation of carbon monoxide.
The kinetic expression used to described the methanol oxidation reaction is taken from
Meyers et al. [26] as
33
3
0, exp
exp
ACCH OHCH OH A A
Cell refAC ACA ACH OH
AC
kC FI aI dx
RTFC
RT
α ηα ηλ
=
+
∫ (2.21)
where CellI is the cell current density, a is the specific surface area of the anode, 30,CH OH
refI
is the exchange current density of methanol, k and λ are constants in the rate
expression, 3
ACCH OHC is the methanol concentration at the anode catalyst layer, Aα is the
anodic transfer coefficient, Aη is the anode overpotential, ACT is the temperature on the
anode catalyst layer and R is the ideal law gas constant.
At the cathode, the reduction of oxygen to water usually takes place on platinum
catalysts, pure or supported in carbon black. Although these catalysts are the most
widely used in low temperature fuel cells, due to their intrinsic activity and stability,
there is still great interest in the development of more active, selective and less
expensive electrocatalysts for the cathode reaction. However, there are a few options
that can be investigated to reduce the costs and to improve the electrocatalytic activity
of Pt, especially in the presence of methanol crossover. One of them is to increase Pt
utilization, this can be achieved either by increasing its dispersion on carbon and the
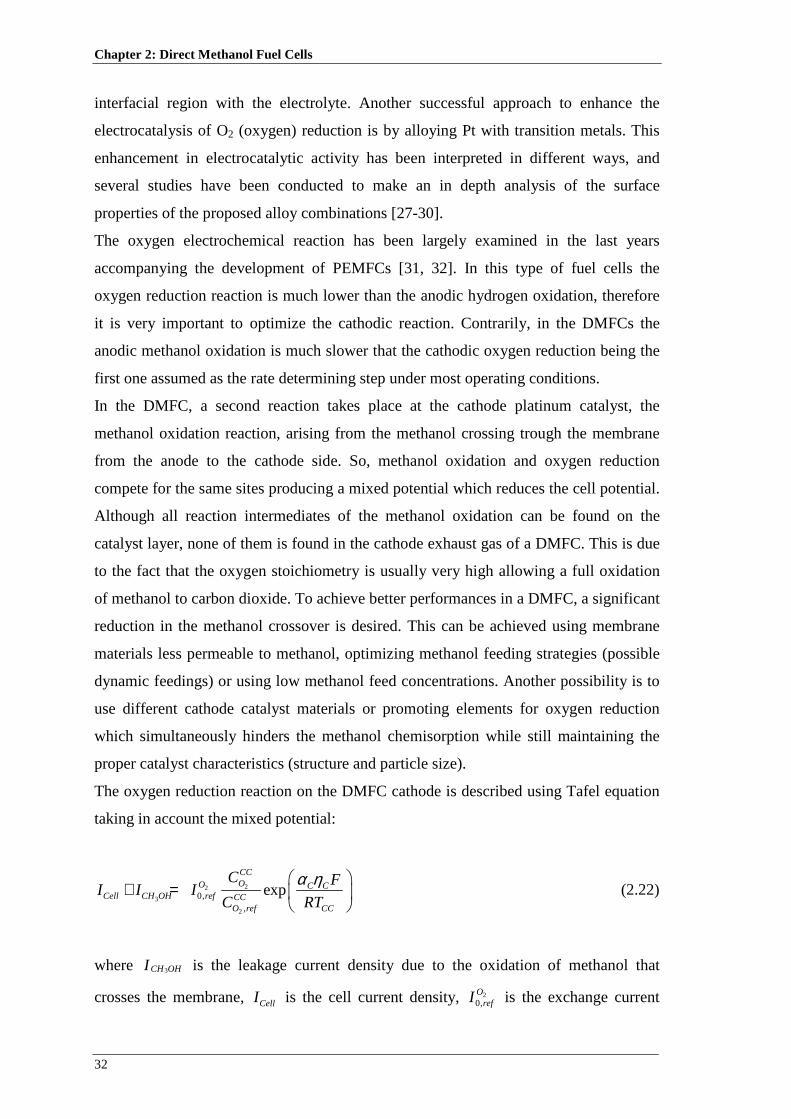
Chapter 2: Direct Methanol Fuel Cells
32
interfacial region with the electrolyte. Another successful approach to enhance the
electrocatalysis of O2 (oxygen) reduction is by alloying Pt with transition metals. This
enhancement in electrocatalytic activity has been interpreted in different ways, and
several studies have been conducted to make an in depth analysis of the surface
properties of the proposed alloy combinations [27-30].
The oxygen electrochemical reaction has been largely examined in the last years
accompanying the development of PEMFCs [31, 32]. In this type of fuel cells the
oxygen reduction reaction is much lower than the anodic hydrogen oxidation, therefore
it is very important to optimize the cathodic reaction. Contrarily, in the DMFCs the
anodic methanol oxidation is much slower that the cathodic oxygen reduction being the
first one assumed as the rate determining step under most operating conditions.
In the DMFC, a second reaction takes place at the cathode platinum catalyst, the
methanol oxidation reaction, arising from the methanol crossing trough the membrane
from the anode to the cathode side. So, methanol oxidation and oxygen reduction
compete for the same sites producing a mixed potential which reduces the cell potential.
Although all reaction intermediates of the methanol oxidation can be found on the
catalyst layer, none of them is found in the cathode exhaust gas of a DMFC. This is due
to the fact that the oxygen stoichiometry is usually very high allowing a full oxidation
of methanol to carbon dioxide. To achieve better performances in a DMFC, a significant
reduction in the methanol crossover is desired. This can be achieved using membrane
materials less permeable to methanol, optimizing methanol feeding strategies (possible
dynamic feedings) or using low methanol feed concentrations. Another possibility is to
use different cathode catalyst materials or promoting elements for oxygen reduction
which simultaneously hinders the methanol chemisorption while still maintaining the
proper catalyst characteristics (structure and particle size).
The oxygen reduction reaction on the DMFC cathode is described using Tafel equation
taking in account the mixed potential:
22
3
2
0,,
expCCOO C C
Cell CH OH ref CCO ref CC
C FI I I
C RT
α η + =
(2.22)
where OHCHI 3 is the leakage current density due to the oxidation of methanol that
crosses the membrane, CellI is the cell current density, 20,O
refI is the exchange current

Transport Phenomena in Direct Methanol Fuel Cells: Modelling and Experimental Studies
33
density of oxygen, 2
CCOC is the oxygen concentration on the cathode catalyst layer,
2 ,CCO refC is the reference concentration of oxygen, Cα is the cathodic transfer coefficient,
Cη is the cathode overpotential and CCT is the temperature on the cathode catalyst layer.
2.4. Two-phase flow phenomena
To ensure continuity and stabilization of the electrochemical reaction in an operating
DMFC, the carbon dioxide gas and the liquid water must be removed rapidly and
efficiently to allow fresh fuel and oxygen to arrive at the catalyst layers. At the anode
and cathode, carbon dioxide gas and liquid water can adhere to the surface of the
diffusion layer and block the pores, which in turns hinder the diffusion of fuel and
oxidant to the catalyst layers. This can lead to a severe cell performance loss. Hence,
investigation on the two-phase flow will serve as a guide for the improvement of the
performance of DMFC [33-46].
Flow visualization is an effective way to investigate quantitatively and qualitatively the
dynamic behaviour of carbon dioxide gas bubbles in the anode channels and liquid
water bubbles in the cathode of an operating DMFC. Although the number of papers
published on DMFC has grown, few research works have been reported in visualization
experiments due to its difficulty of implementation.
2.4.1. Gaseous carbon dioxide in anode
On the anode side of a DMFC, carbon dioxide is produced as a result of the methanol
oxidation reaction. If the carbon dioxide cannot be removed efficiently from the surface
of the gas diffusion layer (AD) it remains covering this surface and consequently induce
a decrease of the effective mass transfer area. In addition, flow blockage results,
particularly in channels of small dimensions as required for micro or compact portable
DMFCs. Therefore, gas management on the anode side is an important and critical issue
in DMFC design. Argyropoulos et al. [33, 34] were perhaps among the first to observe
the two-phase flow pattern in the anode of a DMFC. They used acrylic cells and a high
speed video camera for visually investigate the carbon dioxide gas evolution process
inside an operating DMFC environment. The effect of operating conditions on the gas
management using different gas diffusion layers (carbon cloth and carbon paper), flow

Chapter 2: Direct Methanol Fuel Cells
34
channel designs, cell sizes and exhaust manifold configurations was studied. The
visualization studies showed that carbon paper has a relatively low ability to gas
removal. Increasing the methanol solution inlet flow rate was beneficial for gas
removal. Increasing the current density leads to a higher gas production and in the
formation of gas slugs, especially for low flow rates, which can block the channels and
lower the cell performance. The new flow channels design, proposed by the authors,
based on a heat exchanger concept was more effective for gas management and gave a
more uniform flow distribution in the channels than a simple parallel flow channel. This
study was, however, undertaken under low cell performance. A few years later,
Nordlund et al. [35] developed a visual DMFC, comprising a transparent anode and a
cathode endplate with an integrated heat exchanger and a picture analysis methodology.
They took the data analysis a step further, since they presented a methodology to
acquire good visual data and to perform a high-quality and time effective analysis. In
particular, they demonstrated how a visual cell in combination with digital video
recordings and picture analysis can be used to give valuable insight into two-phase flow
in the anode of a DMFC. Bewer et al. [36] developed a new method to analyse the
interaction of the flow distribution and the bubble generation in an aqueous medium.
The method is based on the decomposition of hydrogen peroxide solution to oxygen and
water in aqueous media at the presence of a catalyst. By using an appropriate hydrogen
peroxide concentration, the gas evolution rate can be set to the same order of magnitude
as in real DMFC. This method can simulate the bubble formation in the anode
compartment of a DMFC without any electrical current. The current density to be
simulated can be adjusted by an appropriate setting of the hydrogen peroxide
concentration independently of ohmic losses. As no current conducting parts are needed,
the whole cell can be made of a transparent material (perspex) to ensure a complete
visibility of the flow. The cell has a simple modular design in which different manifold
and flow fields can be tested. Lu et al. [37] developed a carefully designed transparent
DMFC to visualize, in situ, the bubble flow in the anode of a DMFC. Figure 2.7 shows
a picture of the transparent fuel cell used in their work.

Transport Phenomena in Direct Methanol Fuel Cells: Modelling and Experimental Studies
35
Figure 2.7 – A photograph of a transparent DMFC, taken from reference [37].
Normally, the transparent cells used in the visualization studies are constructed with a
pair of stainless steel plates mated with a polycarbonate plate, forming a window to
allow direct observation of flow behaviour. The polycarbonate plate is concave in
design while the stainless steel plate had a matching convex pattern to avoid flow
leakage. The channels are machined through the stainless steel plate and the surface that
contacts with the MEA are coated with Cr (Chromium) and Au (Gold) to minimize the
contact resistance.
They used two types of MEAs based on Nafion 112 to investigate the effects of the
backing pore structure and wettability on cell polarization and two-phase flow
dynamics. One employed hydrophobic carbon paper backing material and the other
hydrophilic carbon cloth. For the hydrophobic carbon paper they observed that carbon
dioxide bubbles nucleate at certain locations and form large and discrete bubble slugs in
the channel (see Fig. 2.8, a)). For the hydrophilic carbon cloth it was shown that bubbles
are produced more uniformly and of smaller size (see Fig. 2.8, b)).
Figure 2.8 – Bubble behaviour on the anode side using hydrophobic carbon paper (a) and
hydrophilic carbon cloth (b), taken from reference [37].
a) b)

Chapter 2: Direct Methanol Fuel Cells
36
Yang et al. [38, 39] used a transparent DMFC to investigate experimentally the effect of
the single serpentine (SFF) and parallel flow fields (PFF) on the cell performance and
on carbon dioxide bubble behaviour. They found that the DMFCs equipped with SFFs
leads to better performances than those with PFFs. It was also found that gas bubbles
blocked the flow channels in the PFF at low methanol solution flow rates and high
current densities. Since fuel cells with PFFs had poor performance they focused their
work on studying the effects of various SFF design parameters, including open ratio and
channel length, on cell performance.
More recently, Liao et al. [40] presented a study where a transparent DMFC was
constructed to visualize the two-phase flow of aqueous methanol solution and carbon
dioxide bubbles by using a high-speed video camera. The dynamic behaviour of carbon
dioxide gas bubbles including emergence, growth, coalescence and removal was
recorded in situ, and polarization curves were obtained to provide a fundamental
understanding of the relationship between the behaviour of carbon dioxide gas bubbles
and the cell performance. A series of parametric studies, including aqueous methanol
solution flow rate, temperature, concentration and cell pressure difference between the
anode and the cathode was presented in order to evaluate the effects of these parameters
on carbon dioxide gas bubbles behaviour and on cell performance. It was observed that
gas bubbles first emerge around the corner on the porous diffusion layer and the channel
ribs and formed large gas slugs by growth and coalescence in the channel. The cell
performance was improved with increasing aqueous methanol flow rates, feed
temperature, feed concentration and pressure gradient between the anode and cathode.
Experimental observation in a small DMFC test cell done by Lundin et al. [41]
indicated that the rate of bubble formation can be reduced by increasing the fuel flow
because more liquid is available for the carbon dioxide to dissolve in. The authors also
found that potassium hydroxide and lithium hydroxide added to the fuel eliminate in
situ carbon dioxide gas formation at low concentrations, because of the consequent
greatly increased solubility. They presented a model that explains the rate of carbon
dioxide gas formation at the anode of a DMFC including a function of the cells output
current, operating temperature, operating pressure, fuel flow rate, and the solubility of
carbon dioxide in fuel solution, which is also a strong function of temperature.

Transport Phenomena in Direct Methanol Fuel Cells: Modelling and Experimental Studies
37
A better understanding of the basic transport phenomena of carbon dioxide on the
anode side achieved through combined flow visualization studies and transport
simulations is essential to overcome this challenge and to inspire new design concepts.
2.4.2. Liquid water transport in the cathode
Another important aspect of the DMFC is the possibility of water flooding at the
cathode pores and channel structure due to water transport through the membrane and to
the water production by the cathode reaction. The formation of water within the cathode
catalyst layer and its transport through the cathode diffusion layer add another mass
transport resistance for oxygen on its flow towards the reaction zone, and therefore
reduces the limiting cell current with respect to the cathodic reactions. The importance
of flooding at the cathode side in PEMFCs has been emphasized in literature [42-44].
Similarly, water flooding on the cathode side of a DMFC was identified as a critical
issue by Mench et al. [45]. A proper water level of water at the cathode side is
necessary to hydrate the polymer membrane, increasing in this way the proton
conductivity. However, a too large amount of water in the cathode side leads to water
flooding at the pores decreasing the cathode performance. In order to accurately predict
critical operation conditions to avoid flooding, visualization of the cathode side is
essential to yield fundamental physics behind the flooding occurrence. As described
above, Lu et al. [37] developed a carefully designed transparent DMFC (Fig. 2.7) to
visualize, in situ, the bubble flow in the anode of a DMFC and the cathode flooding.
The authors used two types of gas diffusion layers (GDLs), carbon paper and ELAT
carbon cloth (formed of carbon cloth type A and treated with Pt on one side). Flow
visualization of cathode flooding indicates that more water droplets appear upon the
carbon paper GDL surface than upon the single-side ELAT GDL, due mainly to the
higher hydrophobicity of the latter material at elevated temperatures, as shown in Fig.
2.9.
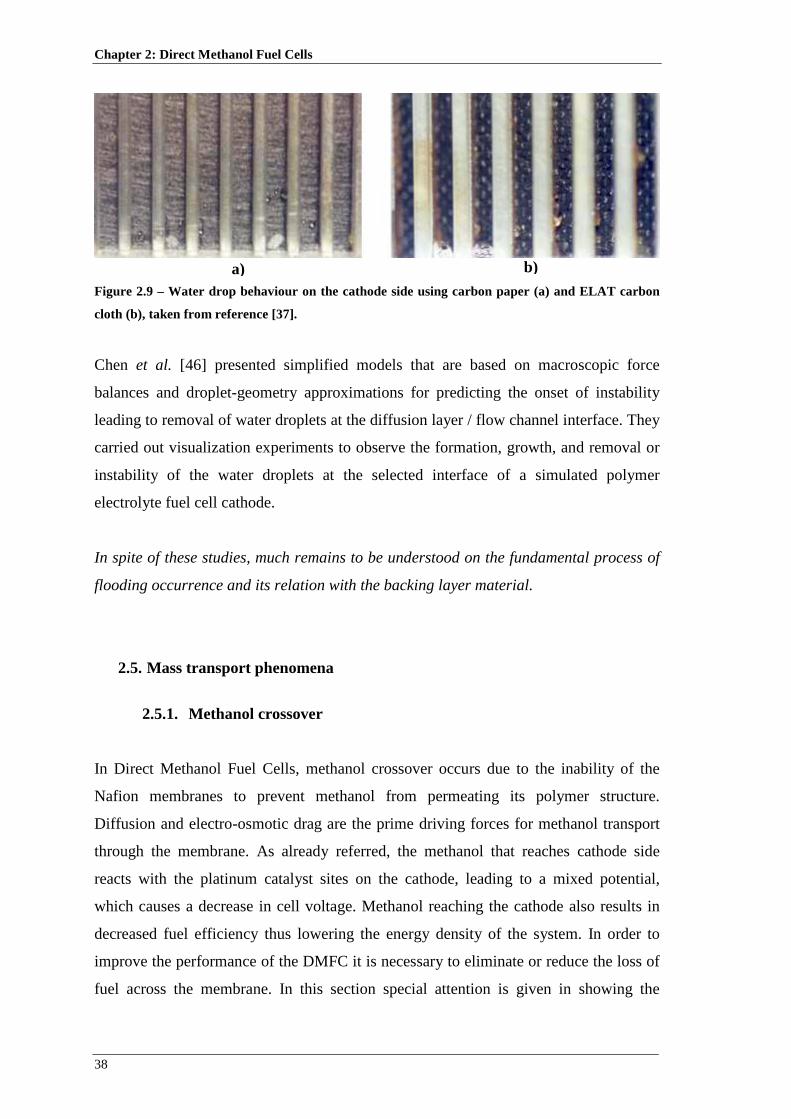
Chapter 2: Direct Methanol Fuel Cells
38
Figure 2.9 – Water drop behaviour on the cathode side using carbon paper (a) and ELAT carbon
cloth (b), taken from reference [37].
Chen et al. [46] presented simplified models that are based on macroscopic force
balances and droplet-geometry approximations for predicting the onset of instability
leading to removal of water droplets at the diffusion layer / flow channel interface. They
carried out visualization experiments to observe the formation, growth, and removal or
instability of the water droplets at the selected interface of a simulated polymer
electrolyte fuel cell cathode.
In spite of these studies, much remains to be understood on the fundamental process of
flooding occurrence and its relation with the backing layer material.
2.5. Mass transport phenomena
2.5.1. Methanol crossover
In Direct Methanol Fuel Cells, methanol crossover occurs due to the inability of the
Nafion membranes to prevent methanol from permeating its polymer structure.
Diffusion and electro-osmotic drag are the prime driving forces for methanol transport
through the membrane. As already referred, the methanol that reaches cathode side
reacts with the platinum catalyst sites on the cathode, leading to a mixed potential,
which causes a decrease in cell voltage. Methanol reaching the cathode also results in
decreased fuel efficiency thus lowering the energy density of the system. In order to
improve the performance of the DMFC it is necessary to eliminate or reduce the loss of
fuel across the membrane. In this section special attention is given in showing the
a) b)

Transport Phenomena in Direct Methanol Fuel Cells: Modelling and Experimental Studies
39
studies found in the literature on the methanol crossover and its influence on the
performance of a DMFC. Some possible solutions to solve this problem are presented.
There are a few experimental methods to determine the methanol crossover from the
anode to the cathode side. Verbrugge [47] measured the methanol diffusivity of Nafion
equilibrated with sulphuric acid at room temperature by using a radioactive tracer
method. Kauranen and Skou [48] developed an approach for the measurement of the
permeability of methanol in proton exchange membranes equilibrated with a supporting
liquid electrolyte at elevated temperatures. The time responses of anodic peak currents
on two working electrodes allowed the estimation of the permeability of a Nafion 117
perfluorosulfate membrane. Tricoli et al. [49] studied the proton conductivities and
methanol crossover rate in two commercially available, partially fluorinated
membranes. The methanol crossover rate was monitored by measuring the steady state
current at the cathode when methanol was introduced into the anode. Hikita et al. [50]
determined the methanol crossover rates by continuously measuring the concentration
of methanol, carbon monoxide and carbon dioxide in the exhaust gas of the cathode.
A common method to measure the methanol crossover in a DMFC is the analysis of the
carbon dioxide content of the cathode exhaust. However it is necessary to point out that
during the operation of a DMFC a large amount of carbon dioxide is produced in the
anodic reaction and some of this can diffuse partially to the cathode side. In this case the
amount of carbon dioxide present in the cathode exhaust is a contribution of the carbon
dioxide resulting from the methanol crossover oxidation at the cathode side and of the
carbon dioxide that passes through the membrane to the cathode side. In their work,
Dohle et al. [51] describe a method to separate the two contributions under real DMFC
operating conditions and clearly define the amount of carbon dioxide due to methanol
oxidation on the cathode side. Ramya and Dhathathreyan [52] directly measured
methanol flux rates across Nafion membranes by an electrochemical method, like cyclic
voltammetry and chronoamperometry. The membrane permeability was measured by
this technique for various methanol concentrations. The authors found that the
permeability of methanol is dependent on the concentration of methanol, the
permeability increases with an increase on the methanol concentration.
The need to evaluate methanol crossover by an easier and faster method than
conventional carbon dioxide analysis method has become significant. A potentiometric
method has been reported by Munichandraiah et al. [53], showing that the slope (dE/dt),
of ECell versus t (time) curve, is proportional to the crossover rate. Methanol crossover

Chapter 2: Direct Methanol Fuel Cells
40
rate has been calculated from the time required to reach the equilibrium concentration of
methanol on either side of the polymer electrolyte membrane.
Jiang and Chu [54] estimated the amount of methanol crossover more accurately with a
method of gravimetric determination of barium carbonate to analyse the amount of
carbon dioxide. The equivalent current of methanol crossover was calculated from the
discharge current of the fuel cell and the sum of dry barium carbonate precipitate
collected at the anode and the cathode exhaust. With the method proposed by the
authors, the common experimental deviation of measuring methanol crossover caused
by carbon dioxide permeation through the polymeric electrolyte membrane can be
corrected. In the work presented by Kin et al. [55], the methanol crossover rate of PEM
and the efficiency of DMFC were estimated by measuring the transient voltage and the
current at the DMFC when methanol was introduced into the anode. The proposed
method simply yields an estimate of the methanol crossover rate of PEM and the
efficiency of a DMFC and does not require fitting analyses. Han and Liu [56]
determined the methanol crossover rate in a DMFC by measuring the carbon dioxide
concentration at the cathode exit in real time, at different inlet methanol concentrations
and various operating conditions. Park et al. [57] presented a practical way of
characterizing the mass transport phenomena of membrane electrode assemblies
(MEAs) through mass balance research in DMFC systems. This method could be used
to measure methanol utilization efficiency, the water transport coefficient and the
methanol to electricity conversion rate of a MEA in DMFCs. The research on the
DMFC MEA design was performed with the aim of reducing methanol and water
crossover maintaining high power characteristics. By varying material properties, the
critical design parameters were identified for high methanol utilization improving
power density through systematic experiments.
Due to the impact of methanol crossover on the DMFC performance, its effects have
been studied in the literature under various operating conditions, such as, methanol
concentration, cathode air pressure, temperature, fuel flow rate, membrane thickness
and equivalent weight and catalyst morphology.
In their work, Kauranen and Skou [48] studied the influence of the temperature in
methanol permeability and found an increase of the crossover rate with temperature.
Ravikumar and Shukla [58] found that in despite of the fact that the increase in
temperature increases the methanol crossover, the increase of temperature also leads to
an improvement of cell performance, since the ohmic resistance and polarization
Transport Phenomena in Direct Methanol Fuel Cells: Modelling and Experimental Studies
41
reduce. The authors also found that the cathode electrode performance is significantly
lowered at higher methanol concentration leading to a decrease in cell performance,
since higher methanol concentrations result in higher rates of methanol transport
through the membrane.
In their work, Cruickshank and Scott [59] studied the effects of methanol concentration
and oxygen pressure in cell performance and found that higher methanol concentrations
lead to a lower cell performance and attributed this to the fuel crossover phenomena.
They also found that pressurising the oxygen reduced the methanol crossover leading to
higher methanol concentrations. Küver and Vielstich [60] studied the effects of
methanol concentration, fuel cell temperature and catalyst loading in cell performance.
A new catalyst support was found showing a good performance with a smaller noble
metal loading. Scott et al. [61] investigated the effect of cell temperature, air cathode
pressure and methanol concentration on the power performance on a small-scale
DMFC. Higher power densities were achieved at higher temperatures and cathode air
pressures. They concluded that the selection of methanol concentration, to obtain
maximum power density, depends upon the current density. Gurau and Smotkin [62]
measured the methanol crossover by gas chromatography as a function of temperature,
fuel flow rate and methanol concentration. Gogel et al. [63] presented investigations to
determine the dependence of the performance of direct methanol fuel cells and the
methanol crossover rate on the operating conditions, on the structure of the electrodes
and on the noble metal loading. It was shown that performance and methanol
permeation depend strongly on cell temperature and cathode air flow. Also, methanol
permeation can be reduced significantly by varying the anode structure, but the changed
electrode structure also leads to somewhat lower power densities. The metal loading
was varied at the anode and cathode, affecting the cell performance. Furthermore, the
differences between supported and unsupported catalysts were compared. They also,
discussed the optimum conditions for the DMFC operation considering the various
important factors. Du et al. [64] developed a half-cell consisting of a normal direct
methanol fuel cell (DMFC) cathode and a membrane contacting with an electrolyte
solution to investigate the effect of methanol crossover on the cathode behaviour. Open
circuit potentials, cyclic voltammetry profiles, polarization curves and electrochemical
impedance spectroscopy, resulting from the oxygen reduction reaction with/without the
effect of methanol oxidation reaction, were measured. The steady-state results
confirmed that the presence of methanol at the cathode led to a significant poisoning

Chapter 2: Direct Methanol Fuel Cells
42
effect on the oxygen reduction reaction, especially when the DMFC operates at higher
methanol concentrations and discharges at lower potentials. Ramya and Dhathathreyan
[65] investigated the methanol permeability when the membrane was processed at a
high temperature. Their work took into consideration the conductivity of the membrane
and the methanol permeability studied as a function of processing temperature for the
membrane. Reduced methanol permeability was observed when the membranes were
processed at temperatures much above the glass transition temperature but below the
degradation temperature of the membranes. The permeability of methanol decreased
despite of the thickness of the membrane on processing. Recently, Park et al. [57]
performed parametric investigations to reveal the effects of operating conditions of fuel
cell systems such as methanol concentration, fuel/air stoichiometry, operating current,
and cell temperature. The methanol utilization efficiency and methanol to electricity
conversion rate were strongly affected by temperature, current density, methanol
concentration, and the stoichiometry of fuel and air.
As the fuel crossover causes considerable cell voltage losses in the DMFC, different
approaches to minimise or eliminate methanol crossover have been carried out from
different points of view. An alternative is the membrane technology trying to obtain a
new methanol-impermeably polymer electrolyte [66-85].
Pu et al. [66] studied a composite electrolyte where a film of a methanol impermeable
protonic conductor, such as a metal hybrid, was sandwiched between proton permeable
electronic insulators, such as Nafion. They studied different electrolyte systems where
membrane was Nafion 115 with a metal hybrid Pd (Palladium), and the influence of
interfaces modification with Pt via various techniques. The results obtained showed that
the methanol crossover was smaller than in the Nafion polymer and that the higher
performance was obtained with the system (N/Pt/Pd/Pt/N), where N is the Nafion 115
membrane, treated by palladization and followed by platinization using electrochemical
methods common to the preparation of hydrogen reference electrodes.
Wainright et al. [67] studied the conductivity, water content and methanol vapour
permeability of the phosphoric acid-doped polybenzimidazole (PBI). Experimental
results confirmed the low methanol crossover in a PEM fuel cell employing a doped
polybenyimidazole membrane. One year later, Wang et al. [68] used the same
membranes and studied the methanol crossover and the performance of a DMFC. They
observed that the methanol crossover rate increased with a decrease in the water
methanol ratio in the anode feed stream. These authors, however, found that methanol

Transport Phenomena in Direct Methanol Fuel Cells: Modelling and Experimental Studies
43
crossover increased with increasing current density and decreased when temperature
increased. They present in their work, the influence of increasing different operating
parameters in the methanol crossover and in the performance of DMFCs using acid
doped PBI membranes.
Küver and Kamloth [69] studied the methanol crossover in substituted and crosslinked
POP membranes (sulphonate substituted polyoxiphenylenes) using differential
electrochemical mass spectrometry. They compared the results with those obtained with
different commercial membranes and it was found that the superiority of POP
membranes was evident, with respect to methanol permeation, and especially attractive
since the POP film was only 0.2 to 0.3 mm thick.
In his work, Tricoly [70] investigated the influence of doping poly(perfluorosulfonated
acid) membranes with cessium in several degrees on the methanol permeability at room
temperature and found that the membrane permeability can be drastically reduced by an
appropriate doping cessium ions.
Choi et al. [71] reported a new method for reducing methanol crossover by a plasma
etching and palladium-sputtering on the Nafion membrane surface. The plasma etching
of Nafion membrane increases the roughness of the membrane surface and decreases
the methanol permeability. The sputtering of palladium on the plasma-etched membrane
was found to further decrease the methanol crossover.
Hobson et al. [72] introduced a thin barrier layer of PBI at the Nafion 117 surface by
screen printing and a reduction on methanol permeability was shown whilst maintaining
proton conductivity at a level comparable to that of the parent material. Uchida et al.
[73] presented a new polymer electrolyte membrane where platinum nanocrystals were
highly dispersed in a Nafion 117 film to catalyse the oxidation of the methanol
crossover with oxygen. An increase in the cathode potential was observed resulting
from the reduced amount of methanol reaching the cathode.
In order to reduce the methanol crossover from the anode to the cathode side in direct
methanol fuel cells (DMFC), Yang et al. [74] fabricated and characterized multilayered
membranes containing a thin layer of sulfonated poly(etheretherketone) (SPEEK) with
different sulfonation levels and thickness and two outer layers of recast Nafion. With a
comparable polarization loss in DMFC, the multilayered membranes show a significant
reduction in methanol crossover compared to the native Nafion membranes since, the
thin middle layer of SPEEK blocks the methanol permeation effectively without
adversely increasing the cell resistance significantly.
Chapter 2: Direct Methanol Fuel Cells
44
Bettelheim et al. [75] report a study consisting on the use of
tetra(orthoaminophenyl)porphyrin as the methanol barrier when electropolymerized on
a direct methanol fuel cell cathode. Using an electrochemical quartz cristal
microbalance and atomic force microscopy techniques the authors showed a reduction
on methanol permeability.
Lee et al. [76] incorporated layered double hydroxides (LDH) into polyelectrolyte
membranes in order to investigate the electrochemical reaction processes affected by
transport rates of methanol and protons in direct methanol fuel cell applications.
Depending on different ion exchange capacities and its LDH compositions, the
polyelectrolyte membranes gave different methanol diffusion coefficients and proton
conductivities. Decreasing the methanol diffusion coefficient, the open circuit voltage
increased and the overall performance of DMFC was improved by incorporating LDH
nanoparticles.
In their work, Tang et al. [77] prepared multi-layer self-assembly Nafion membranes
(MLSA Nafion membranes) by alternately assembling charged Pd particles and Nafion
ionomers onto Nafion membranes. The drastic decrease of methanol crossover
demonstrated the feasibility of the proposed process, especially if 3 double layer of Pt
particles and Nafion ionomers was self-assembled. In this condition, slightly adverse
effects on the proton conductivity of the original Nafion membrane occurred but the
methanol crossover had a considerable decrease.
Mu et al. [78] prepared charged Au nanoparticles by refluxing a solution of hydrogen
tetrachloroaurate trihydrate and protective cationic agents in ethanol/water. The charged
Au nanoparticles were self-assembled onto the Nafion 212 membrane surface as
methanol barriers. All the self-assembled PEMs had higher performance than original
Nafion 212 membrane and had higher performances due to the decrease of the methanol
permeation current density and acceptable membrane area resistances.
Liang et al. [79] synthesized organically modified silicate microparticles, known as
diphenylsilicate (DPS), and showed that the synthesized DPS has a nano-layered
microstructure. The authors utilized this material as filler for fabricating Nafion/DPS
composite membranes for mitigating the problem of methanol crossover in direct
methanol fuel cells. The DMFC performance tests demonstrated that the use of the
Nafion/DPS composite membranes resulted in a lower rate of methanol crossover,
higher open-circuit voltage and better cell performance than the pure Nafion membrane,
especially when working with a higher methanol concentration.

Transport Phenomena in Direct Methanol Fuel Cells: Modelling and Experimental Studies
45
Jung et al. [80] examined methanol crossover through Pt/Ru/Nafion composite
membranes for the direct methanol fuel cell. The composite membrane was
characterized by inductively coupled plasma-mass spectroscopy and thermo-gravimetric
analysis. The methanol permeability and proton conductivity of the composite
membranes were measured by gas chromatography and impedance spectroscopy,
respectively. The proton conductivity of the composite membrane decreased with
increasing number of Pt/Ru particles embedded in the pure Nafion membrane, while the
level of methanol permeation was retarded. The Pt/Ru particles embedded in the Nafion
membrane act as a barrier against methanol crossover by the chemical oxidation of
methanol on embedded Pt/Ru particles and by reducing the proton conduction pathway.
Higuchi et al. [81] developed novel cross-linked sulfonated polyimide (c-SPI)
membrane as an electrolyte for direct methanol fuel cells (DMFCs). The cross-linked
SPI (c-SPI) was found to exhibit fairly low methanol permeation rate with sufficiently
high proton conductivity as the electrolyte membrane for DMFCs.
Yamauchi et al. [82] compared the performance of the membrane electrode assembly
for direct methanol fuel cells (DMFCs) composed of a pore-filling polymer electrolyte
membrane (PF membrane) with that composed of a commercial Nafion 117 membrane.
The use of a PF membrane allows the application of a highly concentrated methanol
solution as a fuel without decreasing either the DMFC performance or the energy
density. In addition, the reduction of methanol crossover in the MEA using the PF
membrane allows a lower amount of cathode catalyst to be used, and the low electro-
osmosis of the PF membrane decreases the flow rate of the cathode gas without
flooding, which also generates a more compact DMFC system.
Gosalawit et al. [83] proposed Nafion and Montmorillonite (MMT) functionalized with
Krytox nanocomposite membrane (Krytox–MMT–Nafion) for DMFC applications.
When compared with normal Nafion membranes the new membrane shows a reduction
on methanol crossover rate.
Zhong et al. [84] focused their work on the modification of sulfonated
poly(etheretherketone) (SPEEK) by coating a crosslinked chitosan (CS) layer on the
surface of SPEEK membrane, in order to decrease the methanol crossover. In
comparison to the pure SPEEK and Nafion 117 membranes, the composite membranes
showed significantly stronger methanol barrier property.
Wu et al. [85] developed a series of proton-conducting membranes for direct methanol
fuel cell (DMFC) applications via sulfonation of bromomethylated poly(2,6-dimethyl-

Chapter 2: Direct Methanol Fuel Cells
46
1,4-phenylene oxide) (BPPO) base membranes. Besides the low manufacture cost, the
membranes exhibited an excellent control on methanol crossover and swelling, and a
sound balance with high proton conductivities.
Since the methanol crossover is one of the major problems in DMFC, it is interesting to
have simple models that describe this phenomenon to check the new membrane
materials reducing time and experimental work. In the last years some work has been
done in order to develop models that can describe and estimate the methanol flux across
the membrane in DMFC [59, 86, 87].
Cruickshank and Scott [59] presented a simplified model to describe the methanol
permeation from the anode to the cathode side, through Nafion 117 membranes. The
model was also used to predict the DMFC cell voltage characteristics depending on
some key parameters obtained from measuring the permeation rates of methanol and
water across the membrane.
Barragán and Heinzel [86] described a simple model to easily estimate the methanol
diffusion coefficient through the membrane of a DMFC from open circuit voltage
measurements using Nafion membranes as electrolyte.
In their work, Sandhu et al. [87] developed a direct methanol fuel cell (DMFC) mass
flux model to predict the fluid phase superficial velocity, methanol and water molar
fluxes, and the chemical species (methanol and water) dimensionless concentration
profiles in the polymer electrolyte membrane, Nafion 117, of a DMFC. They concluded
that the methanol crossover flux decreases with a decrease in the methanol
concentration at the anode side. This decrease in the methanol concentration at the
anode side of the DMFC can result from a low concentration of methanol in the fuel fed
to the anode channel or from a higher reaction rate at a higher temperature resulting in a
higher current density.
Despite of the work done in understanding the methanol crossover phenomena, this
mechanism is still unclear. Some correlations are used based on the assumption that
methanol is dragged by the protons like water is dragged by the protons. More work is
needed to clarify this issue.
The investigations found in literature show that methanol is readily transported across
Nafion membranes and in order to minimize the effects of methanol crossover,
alternative membrane materials have been sought. Nafion membranes still are the most

Transport Phenomena in Direct Methanol Fuel Cells: Modelling and Experimental Studies
47
usually used as solid polymer electrolyte in DMFCs, since they are commercially
available and have lower costs when compared to new ones.
An alternative to new membrane technology, in order to minimize the methanol
crossover rate, is to improve the activity of methanol electro-oxidation catalysts, to use
different catalyst loadings and to employed different diffusion layers materials with
different thicknesses. This approach was followed in the present work.
2.5.2. Water management
In order to compete with traditional batteries, the most important requirement of a
portable DMFC system must be a higher energy density. Recent studies [87-96] indicate
that the water management is a critical challenge for DMFCs to accomplish the
desirable energy levels. The amount and disposition of water within the fuel cell
strongly affects efficiency and reliability. As was described in the last section, another
important challenge to overcome in DMFC that employ Nafion membranes is the
methanol crossover, which results in a fuel loss and decrease the overall cell voltage due
to a mixed potential at the cathode. To solve this problem, the anode fuel solution
should be very dilute, requiring a large amount of water to be carried in the system and
thereby reducing the energy content of fuel mixture. The presence of a large amount of
water floods the cathode and reduces its performance. So, an important engineering
issue is to remove water from the cathode to avoid severe flooding and subsequently
supply water to the anode to make up water loss due to water crossover through the
membrane. Low water flux through the membrane is desirable for DMFCs, as the anode
does not require an excessive amount of water replenishment and the cathode is less
susceptible to severe flooding.
Formally, the water flux through the membrane, caused by diffusion and electro-
osmosis, can be quantified in terms of net a water transfer coefficient (α−alfa value).
The ideal value of this net water transfer coefficient is a negative value [90], which
means that no water is necessary from the anode feed and the water needed to oxidize
methanol comes from the water produced at the cathode side.
Izenson and Hill [88] presented the basic design relationships that govern the water
balance in a PEM fuel cell. Specific calculations were presented, based on data from
hydrogen/air and direct methanol fuel cells and they showed how the water balance
Chapter 2: Direct Methanol Fuel Cells
48
operating point depends on the cell operating parameters and on the sensitivity to design
conditions.
Lu et al. [89] reported a novel DMFC design based on a cathode gas-diffusion layer
coated with a microporous layer to build up the hydraulic pressure on the cathode side
and on a thin membrane, Nafion 112, to promote water back-flow under this difference
in hydraulic pressure. Such MEAs exhibit extraordinarily low water flux through the
polymer membrane. The importance of the experimental work reported by the authors is
the fact that commercially available Nafion membranes and MEA materials were used
and the cell operated with ambient air without pressurization.
Sandhu et al. [87] developed a mass flux model to predict the fluid phase superficial
velocity, methanol and water molar fluxes, and the chemical species (methanol and
water) dimensionless concentration profiles in the polymer electrolyte membrane,
Nafion 117, of a DMFC. This model can be used to generate the numerical data as a
function of different variables, such as the pressure difference across the membrane,
methanol concentration, temperature, and position in the membrane.
In their work, Liu et al. [90] described a new MEA design intended to achieve,
simultaneously, low water crossover, low methanol crossover and high power density.
They performed extensive experimental parametric studies to elucidate the effects of
material properties, MEA fabrication processes and operating conditions. They
observed that the important material properties are the membrane thickness and
structure of the cathode gas diffusion media. The authors suggest that the key operating
parameters are the methanol crossover and the cathode stoichiometry, cell temperature
and current density.
Liu and Wang [91] based on a 3D two-phase model numerically investigated an
interfacial liquid coverage model applied at the interface between the cathode backing
layer and flow channel and its effects on the net water transport coefficient distribution
in a DMFC were explored under typical operating conditions for portable applications.
The authors showed that interfacial liquid coverage has a profound effect on the net
water transport coefficient through the membrane by affecting water diffusion and
hydraulic permeation.
Shi et al. [92] analyzed water transport phenomenon in PEM and the mechanism of
occurrence and development of a two-phase countercurrent flow with corresponding
transport phenomenon in the PEM. A one-dimensional steady state model of heat and
mass transfer in porous media system with internal volumetric ohmic heating was

Transport Phenomena in Direct Methanol Fuel Cells: Modelling and Experimental Studies
49
developed and simulated numerically to analyze water transport characteristics in the
PEM.
Xu and Zhao [93] proposed a measurement method enabling an in situ determination of
the water-crossover flux through the membrane in a DMFC. With this method the
authors investigated the effects of various design and geometric parameters as well as
operating conditions, such as the properties of cathode gas diffusion layer, membrane
thickness, cell current density, cell temperature, feed methanol concentration, and
oxygen flow rate, etc., on the water crossover through the membrane in a DMFC.
The water transport and the degree of cathode flooding in DMFCs appear to be
significantly different from those occurring in PEFCs. Therefore, it is critical to
optimize the cathode microporous (MPL) for DMFCs such that the anode water loss can
be reduced and the cell performance can be upgraded. In their work, Xu et al [94]
experimentally investigated the effects of both the PTFE loading in the cathode backing
layer as well as in the microporous layer (MPL) and the carbon loading in the MPL on
both water transport and cell performance. The experimental data showed that with the
presence of a hydrophobic MPL in the cathode backing layer, the water-crossover flux
through the membrane decreased slightly with an increase in the PTFE loading in the
backing layer. However, a higher PTFE loading in the backing layer not only lowered
cell performance, but also resulted in an unstable discharging process. It was found that
the PTFE loading in the MPL had a small effect on the water crossover flux, but its
effect on cell performance was substantial. The experimental results further showed that
increasing the carbon loading in the MPL significantly lowered the water-crossover
flux, but a too high carbon loading would decrease the cell performance as the result of
the increased oxygen transport resistance [94]. The most common GDLs commercially
available do not have MPL layers.
Xu et al. [95] developed a one-dimensional, isothermal two-phase mass transport model
to investigate the water transport through the MEA. The liquid and gas two-phase mass
transport in the porous anode and cathode was formulated based on classical multiphase
flow theory in porous media. At the anode and cathode catalyst layers, the simultaneous
three-phase (liquid and vapour in pores as well as dissolved phase in the electrolyte)
water transport was considered and the phase exchange of water was modelled with
finite-rate interfacial exchanges between different phases. This model enables
quantification of the water flux corresponding to each of the three water transport
mechanisms through the membrane, such as diffusion, electro-osmotic drag, and
Chapter 2: Direct Methanol Fuel Cells
50
convection. This model allows the numerical investigation of the effects of MEA design
parameters on the water crossover and cell performance under various operating
conditions.
Liu et al. [96] experimentally studied various anode diffusion media to reduce the water
crossover in a DMFC. A two-phase water transport model was also employed to
theoretically study the effects of those structures on water transport and saturation level
in a DMFC anode. It was found that wettability of the anode microporous layer (MPL)
has a dramatic effect on water crossover or on the water transport coefficient (α)
through the membrane. Under different current densities, the MEA with a hydrophobic
anode MPL had consistently low α values, several times smaller than those with a
hydrophilic MPL or without an anode MPL. A modelling study of anode water transport
revealed that the liquid saturation in the anode was significantly lowered with the
increase of the anode MPL contact angle, which was thus identified as a key parameter
to minimize water crossover in a DMFC.
The literature review concerning the water management in a DMFC indicates that some
efforts have been made for studying water transport through Nafion type of membranes
used in DMFCs. However, most of previous studies have generally been limited to the
cases without taking account the effects of MEA design and geometric parameters as
well as operating conditions. A general understanding of water crossover through the
membrane that is integrated with the MEA for DMFCs is far less understood. In order
to evaluate the water transport effect on DMFCs performance it is necessary to use
different MEAs structures, with different membrane thicknesses, diffusion layers
materials and thicknesses and catalyst layers properties. The development of
mathematical model describing the water transport is, also, fundamental to better
evaluate its effects on fuel cell performance.
2.6. Single cell performance – Polarization behaviour
The direct methanol fuel cell is a multiphase system involving simultaneous mass,
charge and energy transfer. All these processes are intimately coupled, resulting in a
need to search for optimal cell design, such as flow field design, and operating
conditions (cell temperature, methanol concentration, cathode pressure and methanol
Transport Phenomena in Direct Methanol Fuel Cells: Modelling and Experimental Studies
51
and air flow rate). A good understanding of this complex, interacting phenomena is thus
essential and can most likely be achieved through a combined mathematical modelling
and detailed experimental approach.
2.6.1. Operating conditions
An understanding of the interdependence of the operating conditions emerges as an
important role in optimizing the performance of a DMFC. In fact, some work had been
done in order to achieve optimal performances [97-105].
2.6.1.1. Methanol concentration
The effect of the methanol concentration on the DMFC performance generally reflects
two phenomena. Increases on the methanol concentration lead to an increase on the
coverage of the electrocatalyst sites by methanolic species, but also increase the
concentration gradient between the anode and cathode side with a consequent increase
in the crossover through the Nafion membrane. This requires a delicate balance among
the effects of methanol oxidation kinetics and methanol crossover in order to enhance
the performance of a DMFC. Another point that should be accounted for is the fact that
the polarization behaviour in the mass transfer region is directly related to the methanol
concentration, so an increase in the limiting current density is achieved with an increase
in methanol concentration. Generally, almost all the experimental studies reported in
literature [97, 99, 100, 104, 105] showed that there is a general increase in the limiting
current with increase in concentration whilst at low current densities higher methanol
concentrations cause a reduction in voltage at a fixed current density. As previously
referred, the open-circuit voltage is much lower than the thermodynamic equilibrium
cell voltage as a result of methanol crossover. At low current densities and high feed
methanol concentrations the cell performance is lower. This is due to the fact that higher
methanol concentrations result in higher values of methanol crossover. At the cathode
side, methanol reacts with the oxygen to form a mixed potential. Hence, a higher
methanol concentration leads to a higher mixed potential, causing thereby a lower cell
performance. It is also reported in literature that the best performance is achieved with 1
to 2M methanol concentration, since usually methanol concentrations higher than these
values generate higher values of methanol crossover.
Chapter 2: Direct Methanol Fuel Cells
52
2.6.1.2. Fuel cell temperature
Most of the experimental studies were performed with high temperatures [97-105]
because higher temperatures lead to an increase in cell performance, since the
electrochemical kinetics at the anode and cathode is favoured by increasing temperature.
However, higher cell temperatures also have negative effects: the rate of methanol
crossover and the water loss from the anode to the cathode increase with temperature
and the membrane stability and the oxygen partial pressure decrease with temperature.
The effective influence of the cell temperature is, in this way, a result of both positive
effect of temperature on the electrode kinetics and the combined negative effects.
The increase of temperature also increases the open-circuit voltage and reduces the
activation overvoltage according to the Arrhenius relation, thus resulting in a higher
performance. However, if the operation temperature is similar to the boiling temperature
of the solution, the cell performance decreases, since small bubbles of the vapour
formed in the catalyst layer and diffusion layer may obstruct the fuel transport [99,103].
2.6.1.3. Methanol and air flow rate
Efficient removal of carbon dioxide gas bubbles and liquid water produced on the anode
and cathode side, respectively, must be maintained to allow reactants to reach catalyst
sites. Removal of carbon dioxide slugs and prevention of cathode “flooding” can be
attained by increasing flow rates. However, increasing flow rates requires more
pumping power. A very high flow rate at the cathode will dry out the polymer
membrane, decreasing proton conductivity and hence cell performance.
According to several experimental studies [98, 99, 104, 105], the cell voltage and power
slightly increases with the anode flow rate up to a certain value, after which a gradual
decrease in the limiting current is seen as the flow rate increases. This is due to the fact
that an increase in the anode flow rate is, under certain conditions, accompanied by an
increase in the static pressure in the flow field. A higher static pressure tends to
increase the methanol crossover towards the cathode, leading to a decrease in the cell
performance [105].
The cell performance and cell power also increase with the air flow rate up to a certain
value. From this optimum value on, any further increase on the air flow rate has no
significant impact on the cell performance and power. When the cell is operating under
Transport Phenomena in Direct Methanol Fuel Cells: Modelling and Experimental Studies
53
lower air flow rate the oxygen concentration decreases along the cathode flow channels
resulting in lower cell voltage and power. When the air flow rate is high enough, any
further increase will only slightly change the oxygen concentration profile, with a
negligible effect on the cell performance [103, 104].
2.6.1.4. Air pressure
In most experimental studies performed in the last years [98-100, 102] high pressure
operation was chosen in order to achieve a high performance. A reduction in the air
pressure in the cathode of a DMFC will reduce cell performance due to a reduction in
the cathode potential, which may be accentuated by the effect of methanol crossover
from the cathode. The crossover of methanol can be, slightly reduced by a high cathode
air pressure. However, some works [103, 105] suggested a high performance even at
atmospheric pressure by optimizing the structures and compositions of the electrodes.
This less severe condition is favourable especially for portable applications.
2.6.2. Configuration parameters
To improve the levels of performance in DMFCs there are an increased interest in
reducing mass transport limitations, reduction of the kinetic and ohmic limitations. In
this regard, some work has been done in order to improve the design of the reactant
flow fields [39, 98, 99, 103, 106, 107], the catalyst loading [63, 99, 103] and the
characteristics of the backing layer in terms of composition and thickness [63, 94, 98,
108, 109].
2.6.2.1. Flow field design
Once the reactants enter the cell, they must be distributed over the entire active area.
This is typically accomplished through a flow field, which may be in a form of channels
covering the entire area in some pattern or porous structures. The main task of these is
to guarantee distribution of fuel and oxidant over the reaction surface area as well as the
removal of products from the cell. Different types of flow fields for DMFCs have been
presented in the literature [39, 98, 99, 103, 106, 107]. The most commonly used are
parallel, serpentine, spot (or grid), and interdigitated channels as shown in Fig. 2.10.

Chapter 2: Direct Methanol Fuel Cells
54
Figure 2.10 – Representation of the most commonly used DMFC flow fields.
The flow field most widely employed in direct methanol fuel cells is based on the
serpentine configuration. In such a configuration, the reactant is constrained to flow in a
zigzag way along parallel channels which are machined in a graphite plate. In general,
different flow field designs have advantages and disadvantages associated with their
application. Proper selection of flow fields with respect to the DMFCs operational and
application conditions can help to achieve cost and performance goals.
The parallel and the spot flow field design generally give comparable performance,
although at higher current densities, a higher cell voltage at the same current densities is

Transport Phenomena in Direct Methanol Fuel Cells: Modelling and Experimental Studies
55
obtained when the cell uses the parallel design [98]. This may be partly due to an
increased cell resistance resulting from a reduced contact with the MEA in the spot
design. The results also suggest that the mass transfer limiting current for methanol
oxidation was reached earlier in the spot design. Although the use of a spot design
shows good results there are certain practical limitations with this design, such as, the
fabrication which is more difficult and thus more expensive. Under operation there is a
risk of puncturing of the MEA which occurs more frequently if the spots are not
precisely aligned on the cathode and anode sides.
In the serpentine flow field the reactant is constrained to flow along parallel channels
and the reactant molecules have access to the catalytic sites through diffusion across the
diffusion/backing layers. In the interdigitated design the reactant is forced to enter into
the electrode pores and exit from them under a pressure gradient. In this way the flow is
no more governed by a diffusion mechanism but becomes a forced-convection
mechanism. According to Aricò et al. [106] the interdigitated flow field significantly
enhances mass transport and membrane humidification, in a DMFC, allowing higher
maximum power outputs compared to the serpentine flow field. The DMFC equipped
with serpentine flow field showed however lower methanol crossover, higher fuel
utilization and a slightly large efficiency at low current densities. When comparing the
serpentine and parallel flow field the results presented in the literature [39,107] showed
that a DMFC equipped with the serpentine flow field showed better performance than
those with the parallel flow field. It is also been found that gas bubbles blocked the flow
channels in the parallel flow field at lower methanol flow rates and higher current
densities. This phenomenon was never found in the serpentine flow field conditions
tested in the work done by Yang et al. [39]. Since the serpentine flow field exhibited a
better performance than the parallel flow field they focused their studied on the effects
of the open ratio and channel length of the serpentine flow field on the cell performance
and pressure drop. The studies indicated that the open ratio and flow channel length
have important effects on the cell performance and pressure drop. When designing a
serpentine flow field, caution has to be taken to ensure an optimal open ratio and flow
channel length.
A comparison of these different flow fields, in terms of advantages and disadvantages is
given in Table 2.1.

Chapter 2: Direct Methanol Fuel Cells
56
Table 2.1 – Comparison of different flow fields used in DMFCs
Flow field Advantages Disadvantages References
Parallel Low pressure drops
Inhomogeneous reactant
distribution and difficult
product removal
[39,98,107]
Spot Similar to parallel flow
field
Similar to parallel flow
field and high cell
resistance due to a reduced
contact to the MEA
[98]
Serpentine
Helpful to remove reaction
products and to enhance
two-phase mass transport
High pressure drops
between the inlet and outlet [39,107]
Interdigitated
Enhanced mass transport
and membrane
humidification
High methanol crossover
and high pressure
difference required between
channels
[106]
2.6.2.2. Catalyst loading
As was mentioned in section 2.3.3, the common catalyst layers used in DMFC are made
by Pt/Ru on the anode side and Pt on the cathode side. In order to achieve high power
densities in a DMFC, some work has been done in order to evaluate the influence of the
anode and cathode catalyst loading on the cell performance [63, 99, 103]. There are also
some reports in literature on supported, normally carbon-supported and unsupported
catalyst compositions [63].
It should be noted that there are two essential properties of the electrode that may be
affected when changing the catalyst loading: electronic conductivity and electrode
thickness.
According to references [63, 99, 103] the cell performance increases with the Pt/Ru
loading up to a certain value, after which any further increase on loading has a slightly
reduction on the cell performance. At low current densities the activation overvoltage is

Transport Phenomena in Direct Methanol Fuel Cells: Modelling and Experimental Studies
57
a major portion in the total overvoltage at the anode, so the increase in the Pt/Ru loading
reduces the activation overvoltage at the anode, increasing the cell performance. With
the increasing Pt/Ru the thickness of the catalyst layer increases and therefore the mass
transfer resistance through this layer becomes greater. In spite of this, the cell
performance increases with the metal loading because the thicker anode catalyst layer
creates a higher resistance to methanol transport thereby controlling the rate of
methanol reaching the membrane and reducing the methanol crossover. This reduction
leads to a reduction of the parasite current formed, due to the oxidation of methanol at
the cathode side and consequently the cell performance increases. At high current
densities and with a loading above a critical value, the cell performance decreases,
suggesting that the concentration overvoltage caused by the mass transfer of methanol
through the thicker catalyst layer at the anode significantly increases.
On the cathode side a reduction on the noble metal loading leads to a decrease in the
cell performance [63]. The reduction of the cathode catalyst layer leads to a reduction
on active surface area, an increase on resistivity and consequently a decrease in
electronic conductivity. An increase on the catalyst loading also causes an increase in
electrode thickness. A thicker electrode conducts to a higher mass transport resistance
but, on the other hand, may also be advantageous at the cathode, since mixed potential
formation may be avoided to some extent. In a thicker electrode not all the catalyst
particles may be reached by the permeated methanol flux, so more active sites are free
for oxygen reduction reaction.
With carbon supported materials the loading can be reduced without a decrease of the
electronic conductivity of the electrode. However, the use of carbon supported catalyst
with a much lower bulk density is associated with a higher thickness of the active layer
which is an important parameter for the cell performance. A thicker electrode may lead
to a higher mass transport resistance of methanol leading to a decrease of the fuel cell
performance. On the other hand, this resistance may be also an advantage at the cathode
side since mixed potential formation may be avoided in some extend. So, the use of
carbon supported catalysts and their optimization in the electrode structure has the
potential to significantly reduce metal loading which will contribute to the cost
reduction in DMFCs [63].

Chapter 2: Direct Methanol Fuel Cells
58
2.6.2.3. Diffusion Layers
The operation of the DMFC requires that the methanol has good access to the anode
while the carbon dioxide gas generated is able to move away freely from the catalyst
sites on the catalyst surface. Ideally, these flows should be isolated such that discrete
paths for gas flow and for liquid flow exist, rather than a two phase flow with gas
bubbles moving against a liquid flow, induced by the anode reaction and the electro-
osmotic transport of water and methanol. The simplest way to approach this ideal is to
make the carbon surface hydrophobic adding Teflon to the diffusion layer. The cathode
of the DMFC may be similarly affected by possible problems of flooding, but in
comparison to the anode this is a less critical issue. Some work has been done in order
to explore the effect of Teflon (PTFE) content on the cell performance [63, 94, 98, 108,
109]. According to the work developed in this area, the DMFCs using untreated anode
diffusion layers produce the poorest performance. The PTFE content decreases the
methanol crossover leading to an increase in the open circuit voltage and the cell
performance. The presence of PTFE, also, increases the internal resistance of the cell
which leads to a decrease of the cell performance for PTFE contents above 30%
[98,108].
In their work, Xu et al. [94] used carbon paper as anode diffusion layer and studied the
effect of the anode diffusion layer thickness on the cell performance. The increase in
carbon paper thickness leads to an increase on the cell performance and the carbon
paper with the medium thickness (Toray-090 (TGPH090), 0.26 mm) gave the best
performance in the entire current density region. At low current densities, a further
increase in carbon paper thickness (TGPH120, 0.35 mm) leads to a cell performance
similar as that for TGPH090, while at high current densities the cell performance
dropped rapidly. The experimental results presented by the authors shown that when a
too thin carbon paper was used the voltages generated by the fuel cell were low in the
entire current density region. On the other hand, when a too thick carbon paper was
used, the fuel cell yielded a low limiting current density. Therefore, it can be concluded
that exists an optimal carbon paper thickness that results in the best performance.
Thicker gas diffusion layers lead to lower methanol concentration at the anode catalyst
layer surface, since the diffusion path is longer. As the current density is dependent on
the methanol surface concentration, lower performances are obtained for thicker anodes.
However thicker gas diffusion layers limits, also, the amount of methanol that crosses

Transport Phenomena in Direct Methanol Fuel Cells: Modelling and Experimental Studies
59
the membrane leading to an increase in fuel cell performance. More work should be
done in order to evaluate these two opposite effects on DMFC performance.
The power and cell voltage of the DMFC has been considerably increased in the last
years, but it must be further increased by improving the anode catalyst activity and the
electrode structure. Similarly, the air stoichiometry was significantly reduced, but it is
still too high for practical systems in terms of energy losses for air management. High
flow rates are required to remove the large amounts of water and methanol diffusing
through the membrane in particular for high methanol concentrations and high values
of current densities. Therefore, the development of a specific membrane electrode
assembly by changing the catalyst layer loading, gas diffusion layer properties and
membrane thickness, with a low methanol and water crossover, will be the key issue for
development a reasonable DMFC system. These parameters could increase the cell
voltage and reduce the air stoichiometry necessary for portable applications.
2.7. Mathematical Modelling
Fuel cell modelling has received much attention over the last decade in an attempt to
better understand the phenomena occurring within the cell. Different types of
approaches are available in literature [110], [111]. Analytical models are an adequate
tool to understand the effect of basic variables on fuel cell performance. Many
simplifying assumptions are made concerning variable profiles within the cell to
develop an approximate analytical voltage versus current density correlation. Semi-
empirical models allow designers and engineers to predict the fuel cell performance as a
function of different operating conditions (such as pressure, temperature or fuel
concentration) using simple empirical equations. Mechanistic models are transport
models using differential and algebraic equations whose derivation is based in the
electro-chemistry and physics governing the phenomena taking place in the cell. These
equations are numerically solved by different methods. These models while involving
extensive calculations, accurately predict the flux and concentration of multiple species
in the cell. Mechanistic or theoretical models can be subcategorized as multi-domain
(sets of equations for each region of the DMFC) or single-domain (or unified) models
(all the regions of interest are combined in a unique domain).

Chapter 2: Direct Methanol Fuel Cells
60
Single fuel cell models aim to describe quantitatively interactions among the several
physical and electrochemical phenomena occurring along the different layers and may
be classified in one of the three types enounced (analytical, semi-empirical and
mechanistic). Figure 2.11 categorizes the thirty nine models reviewed according to the
features studied (dimension, polarization, transport phenomena, thermal effects,
concentration effects, catalyst utilization, flow channels geometry, methanol crossover,
two phase flow effects, dynamic effects and fuel cell stacks).
0
4
8
12
16
20
24Two-phase flow
Flow field
Dynamic
Stacks
Thermal
PolarizationTransport
Crossover
Catalyst
3 Dimensions
2 Dimensions
1 Dimension
Mechanistic Analytical Semi-Empirical
[119,129,144,146-148,150]
[129,136,143,145,146,148-150,153]
Concentration [5,26,112,113,114,117,119,120,122,127-129,131,134-137,140,141,143-151,153]
[122,123,151]
[123,132,136]
[132,151]
[5,26,59,112-123,125-129,131,132,134-137,140-151,153][5,26,112,113-115,118-120,122,125,127-129,131,132,134-137,140-151,153]
[5,59,112-114,119-122,126,127,131,132,134,135,140,141,143,146,148-151]
[5,26,112,113,114,117-122,127,134,135,137,140,141,143-146,148,150,151]
[147]
[119,128,135,144-146,149]
[5,26,59,112-118,120-123,125-127,129,131,132,134,136,137,140-143,149-151,153]
Figure 2.11 – DMFC model categorization based on areas of investigation.
2.7.1. Analytical models
Models described in references [59, 112-120] are examples of analytical modeling.
They all rely on many simplifying assumptions, but most of them have the merit of
predicting voltage losses for simple designs and they can be useful for rapid calculations
in these systems. Some of these models are not «purely» analytical since they
incorporate one or more empirical correlations.
Scott et al. [112] developed a simple model to evaluate cell performance describing
mass transport in the porous electrode structures and the potential and concentration
distributions in the electrode regions. The model also incorporates the influence of

Transport Phenomena in Direct Methanol Fuel Cells: Modelling and Experimental Studies
61
methanol crossover from anode to cathode based on a combination of diffusion, electro-
osmotic drag and pressure.
Cruickshank and Scott [59] present a simplified model to predict the DMFC cell voltage
characteristics depending on some key parameters obtained from measured permeation
rates of methanol and water through Nafion 117 membranes.
Sundmacher and Scott [113] developed a steady state, isothermal cell model accounting
for the essential mass transfer and charge transport processes in the different fuel cell
layers.
Kulikovsky [114-116] has reported analytical models but employing a semi-empirical
approach to account for the limiting current behavior. The general expression for the
voltage-current curve is based on exact solution for the catalyst layer reaction and
includes the over potential due to transport limitation in diffusion backing layer and the
one due to methanol crossover. Some of the model parameters are obtained by fitting
experimental data.
Scott and Argyropoulos [117, 118] presented a one-dimensional model to predict the
current and potential distribution in a porous electrode of a DMFC which accounts for
internal limitations of mass transport. Some difficulties arise when one tries to
implement this model since the results obtained by the authors can not be reproduced.
There is an error on the model development (equation 33 of reference [118]) as was
pointed out by Kulikovsky [152].
Guo and Ma [119] reported a two-dimensional analytical model to describe
electrochemical reactions on the anode and cathode and main transport phenomena in
the fuel cell including methanol crossover, diffusion of reactants in porous media layers
and fluid flow in the reactants distributor. In fact, the model is one-dimensional since
the authors neglect the transport in the channel direction (y – direction in Fig. 2.1). This
simple model was in agreement with the experimental data reported (T=90oC, methanol
concentration in the range 0.125M to 0.625M especially for current densities higher
than 0.01 A/cm2). This model was in the present study tested out of these operation
conditions and the discrepancy between predictions and experimental is higher namely
for low values of current densities, relatively low values of temperature and high
methanol concentration.
Garcia et al. [120] provided a very interesting model accounting for the kinetics of the
multi-step methanol oxidation reaction at the anode, the diffusion and crossover of
methanol and the mixed potential of the oxygen on the cathode due to methanol

Chapter 2: Direct Methanol Fuel Cells
62
crossover. Some of the kinetic and diffusional parameters are estimated by adjusting the
model to experimental data. This model has the merit of being rapidly implemented and
therefore it is suitable for inclusion in real-time system level DMFC calculations. This
«semi-analytical» model was selected for a more deep study in the next section.
2.7.2. Semi-empirical models
Most empirical performance models combine theoretically differential and algebraic
equations with empirical determined correlations. The great advantage of these models
is their simple structure and the small computational effort to perform calculations.
However the estimated parameters from the experimental data are normally specific to
certain types of cell and valid for a limited range of operating conditions. The models
are very useful to perform quick predictions for existing designs but fail to predict
innovative ones.
The number of semi-empirical models developed for DMFCs is limited [121-126].
Kauranen and Skou [121] reported a model describing both the oxygen reduction and
the methanol oxidation in the cathode of a DMFC and concluded that the oxygen
reduction current is reduced in the presence of methanol oxidation due to surface
poisoning.
Sundmacher et al. [122] observed that pulsed methanol feeding could achieve a
significant increase of the time averaged cell voltage and a considerable reduction of the
methanol consumption in the fuel cell. The model was able of describing quantitatively
the behavior of the cell.
Simouglou et al. [123, 124] developed an empirical model using statistical methods and
providing one step-ahead predictions of the dynamic voltage response from
measurements of cell voltage and current density for the fuel cell that the authors
designed in order to fit the model.
Argyropoulos et al. [125] presented a model to predict the cell voltage versus current
density for a liquid feed DMFC. The model is based on a semi-empirical approach in
which methanol oxidation and oxygen reduction kinetics are combined with effective
mass transport coefficients for the fuel cell electrodes. The implementation of this
simple model presents some difficulties since the obtained results are not in accordance
with those of the authors. For example the effect of temperature in the polarization
Transport Phenomena in Direct Methanol Fuel Cells: Modelling and Experimental Studies
63
curve is unexpected since an increase in temperature leads to a decrease in the cell
voltage for a given current density.
Dohle and Wipperman [126] developed a model to predict polarization curves and the
permeability of methanol trough a DMFC based on a set of parameters adjusted from
experiments performed in a wide range of operating conditions.
This semi-empirical model was selected for a more profound study in the next section.
2.7.3. Mechanistic models
The mechanistic models account for the detailed fundamental phenomena such as heat,
momentum, multi-component mass transport and electrochemical processes. Since the
pioneering woks of Scott et al. [127] and Kulikovsky et al. [128] considerable effort has
been devoted to the development of mechanistic models for DMFCs.
Most of the mechanistic models developed for DMFCs were solved using the multi-
domain approach. In the past three or four years with the introduction of CFD methods
to fuel cell modelling the single-domain approach begun to be used [147]. The single-
domain approach is appropriate to be used in multidimensional modelling since in this
case there is no need of using the internal boundary conditions or continuity condition at
each interface which could become cumbersome in 2D or 3D dimensions. The single-
domain approach lends therefore to be implemented in commercial CFD codes.
Most of the developed models are one-dimensional, analysing the different phenomena
across the fuel cell. More recently, various two-dimensional models [135, 144, 145,
148] have been developed. In a 2D model based on current conservation equations,
Kulikovski [135] concluded that, near the fuel channel, transport of methanol is
determined mainly by a pressure gradient. In the active layers and in the membrane
diffusion transport dominates. “Shaded” zones, where there is a lack of methanol appear
in front of the current collectors.
Krewer et al. [147] presented a 3D model but only concerning the anode of a DMFC.
The authors studied the residence time behaviour and concentration distribution in a
simplified rhomboidal anode flow bed. The simulation results compared well with
experimental results.
The electrochemical reactions taking place at a DMFC are exothermic. Heat can be also
produced by irreversibilities in the cell (ohmic or activation losses). Heat removal is a
critical issue for fuel cells. Depending on whether the temperature profile is simulated

Chapter 2: Direct Methanol Fuel Cells
64
or not, fuel cell models can be categorized as isothermal or non-isothermal.
Argyropoulos et al. [132] developed a thermal energy one-dimensional mechanistic
model for a DMFC stack based on the differential thermal energy equation. The model
allows the assessment of the effect of operating parameters such as fuel and oxidant
inlet temperature, flowrate, pressure and current density and also of some design
parameters (active area, material properties and geometry) in the cell temperature along
the stack. Recently, Shultz and Sundmacher [151] developed a non-isothermal, one-
dimensional, dynamic model using the multi-domain approach. In this model, mass
transport within the different porous structures of the DMFC was described using the
generalised Stefan-Maxwell equations. For the membrane, an activity model based on
the Flory-Huggins approach is used accounting for swelling phenomena, non-idealities
and phase equilibria between the pore liquid inside the PEM and the fluids inside both
of the catalysts layers. The model showed good agreement to experimental data
obtained by the authors, concerning methanol crossover and steady state current-voltage
characteristics.
The performance of fuel cell strongly depends on the flow field effects directly related
to a non-uniform flow distribution in both the flow field plates. The main factors that
influence the flow distribution are the hydraulic resistance, the flow field plate design
and the temperature profiles. Some of the mechanistic reviewed models have
incorporated flow field effects [26, 127, 129, 137, 144, 146, 147, 148]. Argyropoulos et
al. [129] investigated the pressure drop in the anode and cathode flow fields. They
established an equation to determine the pressure drop of the two-phase flow.
Until now there is no reported study on a single model accounting for both flow and
temperature distribution and also only simple geometries of the flow field plate have
been considered.
In the early stages of fuel cell modelling (and DMFC modelling) only single phase flow
was considered. Dohle et al. [134] developed a one dimensional model for a vapour fed
DMFC. Kulikovski et al [128, 135] extended their hydrogen fuel cell model to both the
vapour fed and liquid fed DMFC. In all of these models only one phase was considered.
Recently several works have been devoted to the study of two-phase flows in fuel cells
[127, 129, 131, 136, 145, 146, 148, 149, 150, 153]. Among these, Wang and Wang
[146] is the most comprehensive two-phase flow model for direct methanol fuel cells. In
addition to the anode and cathode electrochemical reactions the model considers
convection and diffusion of both gas and liquid phases in the backing layers and flow

Transport Phenomena in Direct Methanol Fuel Cells: Modelling and Experimental Studies
65
channels. This model using the multi-domain approach fully accounts for the mixed
potential effect of methanol oxidation at the cathode as a result of methanol crossover.
The model was solved numerically using CFD. One of the main contributions of this
work is the two-phase flow modelling of the anode. The authors considered that the gas
phase at the anode is saturated with water and methanol and the liquid phase is saturated
with CO2. The gas phase concentration of the three species and the carbon dioxide
concentration in the liquid phase can be determined by thermodynamic equilibrium
relationships.
Current two-phase models assume that both the liquid and gas phases are continuous.
However there is no visualization evidence of this picture. Experimental studies are
needed to visualize the evolution process of two-phase flow both in the anode and the
cathode flow channels to further develop mathematical models.
A significant number of the DMFC mechanistic models incorporate the influence of
methanol crossover. Some of these models such as Dohle et al. [134] and Kulikovsky et
al. [128, 135] consider that the methanol crossing the membrane is completely
consumed in the cathode catalyst layer. Wang and Wang [146] considered the complete
oxidation of methanol at the cathode and assumed that the current density for methanol
crossover is dictated by the crossover flux. The authors concluded in their work that the
methanol crossover is driven diffusion, convection caused by pressure gradient and
electro-osmosis. The three contributions occur differently under different operating
conditions. Methanol transport is dominated by molecular diffusion at zero and small
current densities. At high current densities the methanol crossover flux becomes small
and both diffusion and electro-osmosis contribute to the crossover. The mechanism of
methanol transport trough the membrane is unclear. Some correlations are used based
on the assumption that methanol is dragged by the proton like water is dragged by the
protons. More work is needed to clarify this issue.
Analytical, semi-empirical and mechanistic models for direct methanol fuel cells have
been reviewed. In spite of the modelling work on DMFCs developed in the past few
years, a number of unresolved issues demand for intensive research. One of the most
important areas to investigate is the numerical modelling of two-phase flows (both in
the anode and the cathode) and also parallel experimental studies on visualization of
these phenomena. Improved and validated mechanistic models namely using the single-
domain approach are required to enable better design of fuel cells. Some of the simpler

Chapter 2: Direct Methanol Fuel Cells
66
models (either analytical or semi-empirical) can be used under some conditions. The
validity of semi-empirical models is limited to a narrow corridor of operating
conditions. Semi-empirical models give quick predictions for existing designs but fail to
predict innovative ones. Analytical models predict voltage losses for simple designs and
they can be useful for rapid calculations in these systems.
In addition, much effort should be directed towards the development of a coupled model
for methanol, water and heat transport processes simultaneously in a DMFC. Such
models are extremely useful for the discovery of unique design and operation regimes of
the DMFC system for portable application, where the high energy density entails using
highly concentrated methanol (preferably pure methanol), maintaining low water and
methanol crossover, and improving high-voltage performance.
2.8. Passive DMFC
Energy needs for portable electronics are rising rapidly in the past few years due to the
increasing functionalities of portable devices, especially cell phones. Nowadays the cell
phones incorporate graphics and games, internet service, instant messaging and are
helpful even to find a restaurant or museum. Conventional batteries are soon becoming
inadequate for the increasing power and complexity of portable electronics and
computers. The lifetime of portable devices is still limited to how long they can operate
as truly portable by the quantity of energy that can be stored within the batteries. Fuel
cell systems and particularly direct methanol fuel cell (DMFC) are being considered as
a possible solution to replace the current battery as the dominant power provider for
portable application. The passive and particularly the micro-DMFC are capable of
replacing the conventional batteries, due to their high energy density and inherent
simplicity of operation with methanol as the liquid fuel. This system is smaller, better,
less costly, environmentally safer and much more efficient and can be used either in the
plane, train, and car or in remote areas where there is no electricity. The refuelling of
the passive DMFC is fast and the fuel can last several months. The product is cost
competitive due to the large market size and economies of scale.
The fuel and oxidant can be supplied to a DMFC in an active and a passive way. Active
systems use extra components such as a pump or blower, a fan for cooling, reactant and
product control, which allows the operation of a DMFC at favourable conditions with
Transport Phenomena in Direct Methanol Fuel Cells: Modelling and Experimental Studies
67
respect to temperature, pressure, concentration and flow rate. As was described before,
this improves flow mass transport and electrochemical activity, therefore higher current
density and power can be achieved. This type of system supply has greater costs and
lower system energy density so, it is better suited for large fuel cells. Passive systems
use natural capillary forces, diffusion, convection (air breathing) and evaporation to
achieve all processes without any additional power consumption. They usually operate
at low current densities resulting in reduced cooling loads, less water management
issue, less heat production and lower required fuel delivery rate. Therefore, by using a
well designed compact architecture, a passive system is more suitable for portable
power sources.
The passive fuel cell system must be made small and compact for portable applications,
and each application has different power, voltage and geometric design requirements.
Significant effort for future commercialization has to be put in developing systems that
can achieve the optimum balance of cost, efficiency, reliability and durability. However,
miniaturization is not a simple scaling down of the larger system. Furthermore, each
component of the fuel cell must be redesigned with an eye towards miniaturization.
As was mentioned before, in the passive feed system the fuel pump and air blower are
eliminated. The fuel is supplied to the anode from a fuel reservoir built in the anode and
the air to the cathode, normally by natural convection (Fig. 2.12). However, this simple
design causes lower system performance due to the difficulty in getting a continuous
and homogeneous supply of reactants to the anode and cathode. The lack of flowing
force to remove the bubbles that constantly build up from the formation of carbon
dioxide, in the anode reaction, will also hinder further oxidation of fuel at the anode
surface. At the cathode, water droplet tends to build up and block the active surface,
thus reducing the oxygen supply.

Chapter 2: Direct Methanol Fuel Cells
68
Figure 2.12 – Schematic representation of conventional design of a passive DMFC.
System control associated with water and methanol management adds considerable
complexity to passive DMFC systems, particularly those being developed for portable
applications. It is desirable to recycle the water produced at cathode to anode for
dilution of fuel, but there is very little information disclosed by established fuel cell
manufacturers on their advanced prototypes.
In a passive DMFC, the anode suffers from high activation overpotentials due to the
slow kinetics of methanol oxidation reaction. This negative effect limits the rate of
electrode reactions, which reduces the cell voltage and severely affects the voltage
efficiency of the system. In practice, methanol oxidation at anode is promoted most
effectively by platinum-based electro-catalyst. A passive DMFC generally needs higher
loading of catalyst due to the slow kinetics of methanol electro oxidation reaction and
severe methanol crossover to the cathode side. Unfortunately, the noble metal used as
catalyst in this type of fuel cells is high in cost, and this tends to discourage the progress
commercialization of portable DMFCs.
The most important challenges to overcome in passive systems are the methanol
crossover rate and the thermal and water management.
Methanol crossover in passive DMFC is a fundamental problem to overcome in order to
stimulate the development of this system. High concentration of methanol provides a
higher achievable energy density, but it also causes severe methanol crossover through
the membrane and results in a mixed potential at the cathode generating, therefore, a
low cell performance. As already referred, methanol crossover has two negative

Transport Phenomena in Direct Methanol Fuel Cells: Modelling and Experimental Studies
69
consequences: self-discharge of methanol, which provides additional heat instead of
electricity, and drastic reduction of the cathode voltage. Other important factor is the
temperature rise in the cell due to the oxidation the methanol at the cathode that releases
heat. Moreover, the actual practical electrochemical energy recoverable from a passive
DMFC system is much lower than the theoretical value, since from the total energy
involved a small percentage can be expected as electricity, while the rest is converted
into heat. The heat produced has to be dissipated, or else the accumulated heat in the
system might be a strong disadvantage for compact portable systems.
Some work has been done in order to evaluate the effect of methanol concentration,
methanol crossover and the heat and water management on the cell performance [154-
161].
The passive feed systems have lower power densities, also, due to the inability to handle
the excess water evolved at the cathode and crossed from the anode. The presence of a
large amount of water floods the cathode and reduces its performance. So, a very
important engineering issue is to remove water from the cathode to avoid severe
flooding and subsequently supply water to the anode to make up water loss due to water
crossover through the membrane. As already referred in section 2.5.2, the water flux
through the membrane, caused by diffusion and electro-osmosis, can be quantified in
terms of a net water transport coefficient (α value). The ideal value of this net water
transport coefficient is a negative value, which means that no water is needed from the
anode and the water needed to oxidize methanol comes from the water produced on the
cathode side. The magnitude and spatial distribution of the net water transport
coefficient are very important for the design of innovative water management strategies
in DMFCs, but with particular interest in micro DMFCs. Some studies on water
management for a passive feed DMFC have been performed [162-165].
Kim et al. [162] propose a new MEA structure to effectively reduce the methanol
crossover by adopting a composite membrane. The structure was carefully designed to
enhance water back diffusion through the membrane by using diffusion layers with
hydrophilic nano-particles developed by the authors. Both novel structure and
conventional structure were built and tested, and the results were compared to evaluate
the effectiveness of the new structure. The water back diffusion was measured and the
novel MEA proposed showed an impressive improvement compared with the
conventional structure.

Chapter 2: Direct Methanol Fuel Cells
70
Song et al. [163] studied the water crossover behaviour in air-breathing DMFC with
varying structural variables of membrane electrode assembly, such as the existence of a
microporous layer in the cathode diffusion layer, hydrophobicity of the cathode backing
layer, and membrane thickness. They observed that water crossover from anode to
cathode was lowered by the introduction of the microporous layer in the cathode
backing layer, the reduction of hydrophobicity of the cathode backing layer and the
reduction of the membrane thickness. They also found that the methanol crossover was
lowered when reducing water crossover. The MEA designed for low water crossover
revealed improved stability under continuous operation.
In their work, Jewett et al. [164] examined the effects of the membrane thickness, water
management system, air management system and gas diffusion electrodes on the water
balance coefficient (this coefficient relates the amount of water used per methanol used
in mole quantities), fuel utilization efficiency, energy efficiency and power density.
When the water balance coefficient is equal to zero, the system is losing 2 mol of water
for every 1 mol of methanol consumed (the net product of 2 mol created by the
reaction), which is water neutral operation. This is the ideal state for the cell to operate
in. When the water balance coefficient is negative, there is an excess amount of water
being lost or consumed, more than 2 mol of water used per mole of methanol used.
When the water balance coefficient is positive, there is an excess amount of water being
retained by the system, less than 2 mol of water used per mole of methanol used. This is
the goal at which an external supply of water is not required. The authors used two
different membranes, Nafion 117 and Nafion 112 and they found that Nafion 117 cells
had grater water balance coefficients, higher fuel utilization efficiency and greater
energy efficiency.
Scharfer et al. [165] presented the measurement of the concentration profiles of water
and methanol in Nafion membranes by means of confocal Raman spectroscopy with
high spatial resolution. The experimental results showed that the measurement
technique is suited to investigate the water and methanol transport within fuel cell
membranes. They verified the influence of the air flow rate, the temperature and the
methanol concentration solution on the concentration profiles of water and methanol
using Nafion membranes. They found that the methanol concentration profiles changed
with the air flow rate, with temperature and, as expected, were dependent on the
methanol concentration. The water concentration profiles showed a dependency on the

Transport Phenomena in Direct Methanol Fuel Cells: Modelling and Experimental Studies
71
air flow rate and almost no dependency on the temperature and on the methanol
concentration.
Despite the number of modelling studies in DMFCs only a few simulate passive
DMFCs [166-169] and only two of them take into account thermal effects [166, 169].
Since thermal management is a key issue in the portable DMFC system it is important
to develop new models accounting for this effect and that can be a simple computer-
aided tool to the design and optimization of passive direct methanol fuel cells.
Chen et al. [166] presented a one-dimensional model to describe a passive liquid-feed
direct methanol fuel cell combining the effects of heat and mass transfer. The model
provides the temperature profile along the different layers of a passive DMFC.
More recently, Chen et al. [169] presented a two-dimensional two-phase thermal model
for passive direct methanol fuel cells (DMFC). The inherently coupled heat and mass
transport, along with the electrochemical reactions occurring in the passive DMFC are
modelled based on the unsaturated flow theory in porous media. The model is solved
numerically using a home-written computer code to investigate the effects of various
operating and geometric design parameters, including methanol concentration as well as
the open ratio and channel and rib width of the current collectors, on the cell
performance.
These two models [166, 169] have the disadvantages of considering the catalyst layers
as interfaces, so it is not possible to obtain the temperature and concentration profiles in
these layers, and the authors assumed that the anode side is well insulated so no heat is
lost from the anode side. This assumption may be very unrealistic in a passive DMFC
working in a portable system.
As was discussed above, many challenges exist for passive DMFC systems. Low water
crossover, low methanol crossover and high power densities are essential requirements
of a direct methanol fuel cell for portable applications. It is extremely important to
develop new MEAs designs intended to achieve all three goals simultaneously.
Extensive parametric studies should be performed to elucidate the effects of material
properties, MEA fabrication processes and operating conditions in passive feed
systems. It is, also, crucial to develop new models accounting for the effects of coupled
heat and mass transfer, along with the electrochemical reactions, preferably consisting
of a simple computer-aided tool to the design and optimization of passive direct
methanol fuel cells. Further research and development in this area could significantly

Chapter 2: Direct Methanol Fuel Cells
72
improve power and energy density, efficiency, cost and reliability for DMFC portable
applications.
2.9. Applications
The direct methanol fuel cells (DMFCs) can be used in everything that uses a battery,
like mobile phones, laptops or CD players. Like the other types of fuel cells, DMFC
technology is a great source of clean alternative energy and has the advantage of using a
liquid fuel eliminating the need of fuel reformer, high operation pressures and
temperatures and of lowering the system size and weight.
The opportunities and demand for direct methanol fuel cells in stationary applications
are also extraordinary. More than 2500 fuel cell systems have been installed all over the
world providing primary or backup power. Producing immediate stationary,
decentralized power by using direct methanol fuel cell technology for every electrical
need can reduce energy costs by 20% to 40% over conventional energy service. Direct
methanol fuel cells are ideal for power generation, either connected to the electric grid
to provide supplemental power and backup assurance for critical areas, or installed as a
grid-independent generator for on-site service in areas that are inaccessible by power
lines. DMFCs generators can be used to provide hot water or space heating for a
residential. These types of fuel cells are, also, being incorporated into buses, trains,
scooters and golf carts. Luxury liners and tankers, yachts and fishing boats can power
themselves across the oceans using DMFCs having on-board power for personal
comforts without the dreadful noise and fumes of combustion generators. Furthermore,
the use of methanol, a biodegradable fuel, will rescue our oceans from the pollution
caused by the dumping of other fuels.
Possibly the most wide uses for direct methanol fuel cells are in the area of portable
power since this technology will change the telecommuting world, powering laptops
and palm pilots hours longer than batteries and allowing up to a month of talk time on a
mobile phone. Other applications for DMFC fuel cells include pagers, video recorders,
portable power tools, and low power remote devices such as hearing aids, smoke
detectors, burglar alarms, hotel locks and meter readers (Fig. 2.13).

Transport Phenomena in Direct Methanol Fuel Cells: Modelling and Experimental Studies
73
Figure 2.13 – Direct Methanol Fuel Cell applications (Courtesy Toshiba, Samsung, Motorola,
Suzuki, Company's XX25, Yamaha, DaimlerChrysler, DoCoMo and Fujitsu, Intermec, Panasonic,
Volkswagen).

Chapter 2: Direct Methanol Fuel Cells
74
2.10. Summary and Scope of the present work
The fundamental transport processes of methanol, water and heat occurring in DMFCs
have been reviewed, along with a summary of recent DMFC models and experimental
studies. Significant challenges still exist before a DMFC can be ready to
commercialization and compete with the traditional batteries. A better understanding of
the basic transport phenomena achieved through combined flow visualization studies
and transport simulations is essential to overcome these challenges and to encourage
new design concepts. Material problems remain as an issue in DMFC research and
development, but in this area (membrane and catalyst properties) already notable efforts
are made by various groups and companies.
Some effort is being directed towards the development of DMFC mathematical models
describing the transport phenomena occurring in the DMFC, although only a few
models describe all the inside phenomena processes. In general, these models account
for the effects of the two-phase flow and multicomponent transport in channels and
porous regions (backing layers, catalyst layers, and membrane) along with the
electrochemical reaction presented in a DMFC. They also included the mixed potential
effect of methanol oxidation at the cathode as a result of methanol crossover and can be
solved numerically using CFD (Computational Fluid Dynamics). These models can be
used to investigate the effects of various operating and structural parameters on cell
performance, however the practical usefulness of CFD models is relatively low
(computing times, for example, are still prohibitive). It is necessary to developed “old
fashioned” analytical and semi-empirical models (using applied mathematical
techniques and computing power) to obtain useful, reduced models. Despite all the
work done in DMFC modelling, there is still the need for reliable mathematical models
of complete fuel cells coupling, simultaneously, methanol, water and heat transport
processes in a DMFC. Such models are helpful for the discovery of new cell designs
and operation regimes of the DMFC system. One of the objectives of the present work
is the development of a model considering the effects of coupled heat and mass transfer,
along with the electrochemical reactions occurring in an active and passive feeding
DMFC. The model should be used to predict the methanol, oxygen, carbon dioxide and
water concentration profiles in the anode, cathode and membrane as well as to estimate
the methanol and water crossover and the temperature profile across the cell. The
model, describing the active feed DMFC, should allow the assessment of the effect of

Transport Phenomena in Direct Methanol Fuel Cells: Modelling and Experimental Studies
75
operating parameters (such as methanol and oxygen feed concentration, flow-rate and
current density) and the design parameters (channel geometry, active area and material
properties) on the temperature and concentration profiles along the cell and
consequently on the cell performance. The model for the passive feed DMFC should,
also, allow the assessment of the effect of methanol concentration and material
properties on the temperature and concentration profiles along the cell and on the cell
performance. To further understand the physical and chemical phenomena occurring
inside the DMFC, steady-state experiments were carried out and were used to validate
the developed models. The models were, also, used to provide suitable operating ranges
adequate to different applications for different operating conditions and variable MEA
structures.
There is a lack of work published on DMFCs operating at atmospheric pressure and low
temperatures and these less severe conditions are favourable especially for portable
applications. It is also a main objective of this to work study the effect of operating
conditions, such as methanol feed concentration, methanol and air flow rate, and the
effect of configuration parameters, such as gas diffusion media, catalyst loading,
membrane thickness, and flow field designs on the cell performance of an active feed
DMFC at ambient conditions (atmospheric pressure and ambient temperature).

Chapter 2: Direct Methanol Fuel Cells
76

77
CHAPTER 3 3. MODEL FORMULATION FOR AN ACTIVE FEED DMFC
The necessity of formulation of adequate mathematical models is based on the need
to reach a deeper understanding of internal processes (reactions, mass transport, heat
transport) which can not be observed directly in experiments or the possibility to
apply mathematical optimisation methods to obtain hints as to where further
technical improvements may be required or beneficial, and, finally, for the
development of optimal control and operating strategies.
In this chapter the development of a semi-analytical one-dimensional model
considering the effects of coupled heat and mass transfer, along with the
electrochemical reactions occurring in an active feeding DMFC are presented. The
main objective is to produce a simplified model describing the main heat and mass
transfer effects in a DMFC reproducing with satisfactory accuracy experimental
data.
The contents of this Chapter were partially published in Oliveira, V.B, Falcão, D.S.,
Rangel, C.M. and Pinto, A.M.F.R., “Heat and mass transfer effects in a direct
methanol fuel cell: A 1D model”, International Journal of Hydrogen Energy, Vol.
33, Issue 17, July 2008, 3818-3828.
3.1. General model structure
A schematic representation of an active-feed direct methanol fuel cell, with all the
layers considered in the model, is shown in Fig. 3.1, consisting of
• an aluminium plate (AAP), a rubber plate (ARP), a copper plate (ACP), a
graphite plate with flow channels (AF), a diffusion layer (AD) and a catalyst
layer (AC) at the anode side;
• a polymer electrolyte membrane (M);

Chapter 3: Model Formulation for an active feed DMFC
78
• a catalyst layer (CC), a diffusion layer (CD), a graphite plate with flow channels
(CF), a copper plate (CCP), a rubber plate (CRP) and an aluminium plate (CAP)
at the cathode side.
Figure 3.1 – Schematic representation of a DMFC
In an active-feed DMFC the fuel, methanol or an aqueous methanol solution, is supplied
to the reaction zone by a liquid pump and the oxidant, air, by a mass flow controller.
From the AD through the AC and from the AC through the M, methanol solution is
transported primarily by diffusion. In a similar way the transport of oxygen on the CD
and CC is enhanced by diffusion. After the electrochemical reaction of methanol
oxidation, which takes place in the AC, the carbon dioxide produced moves
countercurrently toward the AF via the AD and AC. At sufficiently high current
densities carbon dioxide emerges in the form of gas bubbles from the surface of the AC.
In the CC, oxygen reacts with protons and electrons generating water. The water
produced in CC moves counter-currently toward the CF via the CD and CC and also
under some operating conditions, by back diffusion toward the anode.

Transport Phenomena in Direct Methanol Fuel Cells: Modelling and Experimental Studies
79
3.2. Model assumptions
The direct methanol fuel cell is a multiphase system involving simultaneous mass,
charge and energy transfer. To make this complex system simpler it is here prescribed
as a one-dimensional transport (along the x direction) with the following simplifications
and assumptions:
• the fuel cell is assumed to operate under steady-state conditions;
• the transport of heat and mass through the gas diffusion and catalyst layers is
assumed to be a diffusion-predominated process and the convection effect is
negligible;
• mass transport in the diffusion layers and membrane is described using effective
Fick models;
• the thermal energy model is based on the differential thermal energy
conservation equation (Fourier’s law);
• pressure gradient across the layers is negligible;
• only the liquid phase is considered in the anode side, so carbon dioxide remains
dissolved in solution;
• gaseous methanol and water are considered in the cathode;
• solutions are considered ideal and dilute;
• local equilibrium at interfaces is represented by partition functions;
• the catalyst layers are assumed to be a macro-homogeneous porous electrode so
reactions in these layers are modelled as a homogeneous reaction;
• anode kinetics is described by step mechanism, with a rate expression similar to
the used by Meyers et al. [26];
• the anodic and cathodic overpotentials are constant through the catalyst layers;
• cathode kinetics is described by Tafel equation;

Chapter 3: Model Formulation for an active feed DMFC
80
• methanol and water transport through the membrane is assumed to be due to the
combined effect of the concentration gradient between the anode and the
cathode and the electro-osmosis force;
• the anode and cathode flow channels are treated as a continuous stirred tank
reactor (CSTR). Accordingly, the composition and temperature inside the flow
channels are uniform and equal to their values at the channel outlet;
• the heat generation by electrochemical reactions occurring in the catalyst layers
is considered;
• when compared with the heat generated by electrochemical reactions and
overpotential, the heat released by Joule Effects is ignored;
• the contact thermal resistance between the graphite plates and the gas diffusion
layers is negligible;
• the anode and the cathode streams are acting as heat transfer fluids so they
remove heat from the cell at their outlet temperatures;
• the temperatures of the external walls of the cell (T1 and T14 in Fig. 3.1) are
known;
• the heat flux generated in the catalyst layers is assumed to be constant.
3.3. Governing equations and Boundary conditions – Anode and Cathode
3.3.1. Mass transport
Anode reaction:
Methanol oxidation: −+ ++→+ eHCOOHOHCH 66223 (3.1)
Cathode reaction:
Oxygen reduction: OHeHO 22 244 →++ −+ (3.2)
Methanol oxidation: OHCOOOHCH 2223 22
3 +→+ (3.3)

Transport Phenomena in Direct Methanol Fuel Cells: Modelling and Experimental Studies
81
The anode flow channels are treated as a continuous stirred tank reactor (CSTR), so the
methanol and water flux are described by
( )AFjjS
AF
j CCA
qN −= 0 (3.4)
where j represents methanol or water and
wenA channelsS ××= (3.5)
where nchannels is the channel number and e and w are the width and length of the
channels, respectively.
In the anode diffusion and catalyst layer, the methanol and water flux are related to the
concentration gradient by assuming Fickian diffusion [171] with an effective diffusivity
ADeffjD , in the AD and ACeff
jD , in the AC. The methanol and water flux can be
determined from:
dx
dCDN
ADjADeff
jj,−= , j represents methanol or water (3.6)
and
dx
dCDN
ACjACeff
jj,−= , j represents methanol or water (3.7)
The concentration at the AF/AD and AD/AC interfaces is given by assuming local
equilibrium with a partition coefficient K4 and K5, respectively. The boundary
conditions for Eq. (3.6) and (3.7) are (see Fig. 3.1)
AFj
ADj CKCxxAt 44 : == , j represents methanol or water (3.8)
ADj
ACj
ACj CKCCxxAt 5,55 : === , j represents methanol or water (3.9)
ACj
ACj CCxxAt ,66 : == , j represents methanol or water (3.10)
Chapter 3: Model Formulation for an active feed DMFC
82
In fuel cells, all the fluxes can be related to a single characteristic flux, the current
density or charge flux of the fuel cell. In the DMFC, the methanol flux is related to the
current density and the permeation flux of methanol through the membrane, (M OHCHN3
),
by:
MOHCH
CellOHCH N
F
IN
33 6+= (3.11)
At the anode side, the water flux is related to the current density and to the net water
transport coefficient, α (defined as the ratio of the net water flux though the membrane
from the anode to the cathode normalized by protonic flux), by:
( )16
2 += αF
IN Cell
OH (3.12)
The transport of methanol and water through the membrane is assumed to be due to the
combined effect of the concentration gradient and the electro-osmosis force. The fluxes
can be determined from:
F
I
dx
dCDN Cell
OHCH
MOHCHMeff
OHCHM
OHCH 3
3
33
, ξ+−= (3.13)
F
In
dx
dCD
F
IN Cell
d
MOHMeff
OHCellM
OH +−== 2
22
,
6α
(3.14)
The electro-osmotic drag ( OHCH3ξ , dn ), in equations (3.13) and (3.14), is defined as the
number of methanol or water molecules dragged by the hydrogen ions moving through
the membrane.
The net water transport coefficient, α, can be calculated using the equation (3.14).
The concentration at the AC/membrane interface is given by assuming local equilibrium
with a partition coefficient K6. The boundary conditions for the integration of equations
(3.13) and (3.14) is given by
ACj
Mj CKCxxAt ,666 : == , j represents methanol or water (3.15)

Transport Phenomena in Direct Methanol Fuel Cells: Modelling and Experimental Studies
83
In the cathode catalyst layer, the methanol, water and oxygen flux are related to the
concentration gradient by assuming Fickian diffusion [171] with an effective
diffusivity CCeffjD , . The flux can be determined from:
dx
dCDN
CCjCCeff
jj,−= , j represents methanol, water or oxygen (3.16)
It is here considered that the entire methanol crossing the membrane reacts at the
cathode catalyst layer so the concentration at the CC/CD interface is zero. It is assumed
that there is no oxygen crossover, so the oxygen concentration in CC/M interface is
zero. The concentration of water and methanol at the membrane/CC interface and the
concentration of water and oxygen at the CC/CD interface are given by assuming local
equilibrium with a partition coefficient K7 and K8, respectively. The boundary
conditions for Eq. (3.16) are:
Mj
CCj
CCj CKCCxxAt ,77,77 : === , j represents methanol or water and 0
2,7 =CCOC (3.17)
0:38 ≅= CCOHCHCxxAt , CC
OHCC
OH CC22 ,8= and CC
OCCO CC
22 ,8= (3.18)
At the cathode catalyst layer, the oxygen reacts with the electrons and protons to
produce water. However, part of oxygen fed is consumed due to methanol crossover to
form an internal current and a mixed potential. Therefore the oxygen flux is related to
the current density and the permeation flux of methanol through the membrane by
MOHCHOcross
CellOO N
F
IN
3222 ,4
υυ += (3.19)
where
12 =Oυ and 23
2, =Ocrossυ
At the cathode side, the water flux is related to the water production from the oxygen
reduction reaction and methanol crossover oxidation and to the net water flux
transported from the anode to the cathode by:
Chapter 3: Model Formulation for an active feed DMFC
84
MOH
MOHCHOHcross
CellOHOH NN
F
IN
23222 ,4
++= υυ (3.20)
where
22 =OHυ , 22, =OHcrossυ
In the cathode diffusion layer the oxygen and water flux are related to the concentration
gradient by
dx
dCDN
CDiCDeff
ii,−= , i represents oxygen or water vapour (3.21)
where CDeffiD , is the effective diffusion coefficient of oxygen and water in the CD.
The concentration at the CF/CD and CD/CC interfaces is given by assuming local
equilibrium with a partition coefficient K9 and K8. The boundary conditions for Eq.
(3.21) are
CCii
CDi CKCxxAt ,8,88 : == (3.22)
CDii
CFi CKCxxAt ,99 : == (3.23)
Like at the anode side, the cathode flow channels are treated as a continuous stirred tank
reactor (CSTR), so the oxygen and water vapour flux are described by
( )CFiiS
CF
i CCA
qN −= 0 (3.24)
where i represents oxygen or water vapour and
wenA channelsS ××= (3.25)
If dry air is fed to the cathode, the water vapour feed concentration (02OHC ) is zero.
To account for the effect of methanol crossover on the cathode overpotential it is
assumed that the methanol crossing the membrane completely reacts electrochemically
at the cathode. In this way the internal current (OHCHI 3 ) due to methanol oxidation can
be written as

Transport Phenomena in Direct Methanol Fuel Cells: Modelling and Experimental Studies
85
MOHCHOHCH FNI
33 6= (3.26)
where the methanol flux in the membrane (MOHCHN
3) is obtained from Eq. (3.13).
The volumetric current density expression for methanol oxidation is taken from Meyers
et al [26] as
+=
AC
AA
AC
AAACOHCH
ACOHCHOHCH
refART
F
RT
FC
kCaIj
ηαηαλ
expexp
3
33
,0 (3.27)
The current density is related to the volumetric current density using the following
equation
6 6
33
5 53
0, exp
exp
ACx xCH OHCH OH A A
Cell A refAC ACA Ax xCH OH
AC
kC FI j dx aI dx
RTFC
RT
α ηα ηλ
= =
+
∫ ∫ (3.28)
Equation (3.28) is used to calculate the anode overpotential for a given CellI , assuming
Aη as constant in the anode catalyst layer AC.
At the cathode, the electrochemical reaction is modelled using Tafel equation for the
oxygen reduction taking in account the mixed potential. The cathode overpotential can
then be determined from:
=+CC
CC
CCrefO
CCOO
refOHCHCellRT
F
C
CIII
ηαexp
,
,0
2
223 (3.29)
3.3.2. Heat transport
Based on the simplifications and assumptions described previously the following
overall heat transfer equation can be proposed (see Fig. 3.1):
CFAFCCAC QQQQQQ +++=+ 21 (3.30)

Chapter 3: Model Formulation for an active feed DMFC
86
where QAF and QCF represent the heat transferred to the anode and cathode stream. The
total heat generated in the DMFC is equal to the heat losses to the surrounding
environment at the anode and cathode side plus the heat removed by the anode and
cathode fuel streams.
Complementarly, the following heat transfer balances can be written:
AFQQQ −= 31 (3.31)
CFQQQ −= 42 (3.32)
35 QQQ AC −= (3.33)
54 QQQ CC += (3.34)
The energy balance for the anode and cathode streams, considering a steady-flow
system with one inlet and one outlet, where the changes in kinetic and potential energies
are negligible and there is no work interaction, are, respectively,
( )AFS
AFAFAFAF TT
A
CpqQ −= 5
ρ (3.35)
( )CFS
CFCFCFCF TT
A
CpqQ −= 10
ρ (3.36)
where AFρ and CFρ are the densities of the anode and cathode streams and AFCp and
CFCp the specific heats for anode and cathode streams, respectively.
At the anode, heat generated by the electrochemical reaction in the AC is given by
∆−∆−=
F
GHIIQ AA
CellACellAC
6η (3.37)
In this equation the first term represents the heat due to the activation and mass transfer
overpotentials at the anode and the second term represents the entropy change of the
anodic electrochemical reaction, with AH∆ denoting the anodic reaction enthalpy and
AG∆ the Gibbs free energy. This equation can be rewritten as:

Transport Phenomena in Direct Methanol Fuel Cells: Modelling and Experimental Studies
87
( )1 2 298ACCell A ACQ I Tη β β= − − − (3.38)
where
( )001
6AA
Cell GHF
I ∆−∆=β , (3.39)
( )OHOHCHCOCell CpCpCpF
I232
62 −−=β (3.40)
and
276 TT
TAC+= (3.41)
In a similar way, the heat generated at the CC, can be determined from
∆−∆−+=
F
GHIIIQ CC
CellCOHCHCellCC
4)(
3η (3.42)
where the first term represents the heat due to the activation and mass transfer
overpotentials and mixed potential caused by methanol crossover through the cathode
and the second term represents the entropy change of the cathodic electrochemical
reaction, with CH∆ denoting the cathodic reaction enthalpy and CG∆ , the Gibbs free
energy. This equation can be rewritten as
( ) ( )298433 −−−+= CCCOHCHCellCC TIIQ ββη (3.43)
where
( )003
4CC
Cell GHF
I ∆−∆=β , (3.44)
( )2224
4 OOHCell CpCpF
I −=β (3.45)
and
298 TT
TCC+= (3.46)

Chapter 3: Model Formulation for an active feed DMFC
88
In the anode aluminium, rubber and copper plates and diffusion layer the heat flux
1Q and 3Q can be related to the temperature gradient across each layer, using the
Fourier’s law, as
dx
dTKQ l−= (3.47)
where l represents AAP, ARP, ACP or AD
At the cathode side, the heat fluxes2Q , 4Q and 5Q can be related to the temperature
gradient across the CAP, CRP, CCP, CD and M layers as
dx
dTKQ t−= (3.48)
where t represents CAP, CRP, CCP, CD or M.
Anode and Cathode flow channel
In a single cell DMFC the graphite plate has flow channels machined on only one
surface, the surface contacting with the diffusion layer (Fig. 3.1). The establishment of
the heat transport equations involved the consideration of sections 1 and 2 in the
graphite plate. Section 2 is treated as a finned surface exchanging heat with the cannel
fluid [172] and can be found in Appendix B (10.5). If we consider that the heat removed
by the anode or cathode stream is equal to the symmetric heat transfer from the fin (Eq.
3.49), we can relate the heat flux in section 1 and section 2.
( )// 5/10
AF CFfin channels fin fin A CQ Q n hA T Tη= − = − (3.49)
where h represents the heat transfer coefficient, see Appendix B (10.6).
In section 1 the heat is transferred by conduction and the resulting equations are:
dx
dTKQ G−=1 (3.50)

Transport Phenomena in Direct Methanol Fuel Cells: Modelling and Experimental Studies
89
dx
dTKQ G−=2 (3.51)
Anode and Cathode catalyst layer
The differential equations describing the temperature profiles in these layers are:
ACAC
AC
K
Q
dx
Td
δ=
2
2
(3.52)
CCCC
CC
K
Q
dx
Td
δ=
2
2
(3.53)
where ACQ and CCQ are, respectively, the heat generated in the anode catalyst layer and
cathode catalyst layer.
The boundary conditions for Eq. (3.52) and (3.53) are the temperatures at the walls (T6,
T7, T8 and T9).
For these layers. Fourier’s law gives
dx
dTKQxxAt AC−== 35 : (3.54)
dx
dTKQxxAt CC−== 57 : (3.55)
where dx
dT is calculated using the temperature profile obtained from the integration of
equations (3.52) and (3.53).
3.4. Cell performance
The determination of methanol and oxygen concentrations at the catalyst layers, the
temperature profiles and the anodic and cathodic overpotentials from the model
equations enables prediction of the cell voltage, which can be expressed as:
CellCellCACellCell RIEV −−−= ηη (3.56)

Chapter 3: Model Formulation for an active feed DMFC
90
where
∂∂∆+−=T
ETUUE OHCHOCell 32 , (3.57)
Aη and Cη are the anode and cathode overpotencials and the membrane resistanceCellR
is given by
κδ M
CellR = (3.58)
where Mδ is membrane thickness and κ is the ionic conductivity of the membrane.
3.5. Analytical solutions
3.5.1. Mass transport
The methanol and water concentration profile in AF can be obtained combining Eqs.
(3.4) and (3.11) or (3.4) and (3.12):
+−= MOHCH
Cell
AF
S
OHCHAF
OHCH NF
I
q
ACC
333 60 (3.59)
( )2 2
0, 16
SAF AF CellH O H O AF
A IC C
q Fα= − + (3.60)
Combining equations (3.6), (3.8) and (3.11) or (3.12) yields the concentration profile in
AD. To obtain the concentration profile in AC we combine Eqs. (3.7), (3.9) and (3.11)
or (3.12). The solutions are respectively:
( ) ( )xxD
Nxx
FD
ICKC
ADeffOHCH
MOHCH
ADeffOHCH
CellAFOHCH
ADOHCH −+−+= 4,4,4
3
3
3
33 6 (3.61)

Transport Phenomena in Direct Methanol Fuel Cells: Modelling and Experimental Studies
91
( ) ( )xxFD
ICKC
ADeffOH
CellAFOH
ADOH −++= 4,4
2
22 6
1α (3.62)
( ) ( )xxD
Nxx
FD
ICC
ACeffOHCH
MOHCH
ACeffOHCH
CellACOHCH
ACOHCH −+−+= 5,5,,5
3
3
3
33 6 (3.63)
( ) ( )xxFD
ICC
ACeffOH
CellACOH
ACOH −++= 5,,5
2
22 6
1α (3.64)
The concentration of methanol and water through the membrane can be obtained by
using Eqs. (3.13) and (3.14):
( )xxD
F
IN
CKCMeffOHCH
CellOHCHMOHCH
ACOHCH
MOHCH −
−+= 6,,66
3
3
3
33
ξ
(3.65)
( ) ( )xxFD
Ixx
FD
ICKC
MeffOH
Cell
MeffOH
CellACOH
MOH −−−+= 6,6,,66
22
22
5.2
6 (3.66)
Combining Eqs. (3.13), (3.15) and (3.17) we obtained an expression to calculate the
methanol flux through the membrane:
( )F
ICCK
DN CellOHCHM
OHCHAC
OHCHM
MeffOHCHM
OHCH3
33
3
3 ,7,66
, ξδ
+−= (3.67)
The concentration of methanol, water and oxygen through the CC can be obtained
combining Eqs. (3.16), (3.17) and (3.18):
( ) ( )xxD
Nxx
FD
ICC
CCeffOHCH
MOHCH
CCeffOHCH
CellCCOHCH
CCOHCH −+−−= 7,7,,7
3
3
3
33 6 (3.68)
( )
++−+=F
I
F
I
F
I
D
xxCC OHCHCellCell
CCeffOH
CCOH
CCOH 3
5.0
63
2
22 ,
7,7
α (3.69)
Chapter 3: Model Formulation for an active feed DMFC
92
( ) ( )xxD
Nxx
FD
ICC
CCeffO
MOHCH
CCeffO
CellCCO
CCO −+−+= 8,8,,8
2
3
2
22 2
3
4 (3.70)
Combining equations (3.19), (3.21) and (3.22) or (3.20), (3.21), and (3.22) we obtained
the concentration profile in CD:
( ) ( )xxD
Nxx
FD
ICKC
CDeffO
MOHCH
CDeffO
CellCCOO
CDO −+−+= 8,8,,8,8
2
3
2
222 2
3
4 (3.71)
( )
++−+=F
I
F
I
F
I
D
xxCKC OHCHCellCell
CDeffOH
CCOHOH
CDOH 3
5.0
63
2
222 ,
8,8,8
α (3.72)
The concentration of oxygen and water through the CF can be obtained using Eqs.
(3.19) and (3.24) or (3.20) and (3.24):
+−= MOHCH
Cell
CF
S
OCFO N
F
I
q
ACC
322 2
3
40 (3.73)
3
2 2
0, 0.5
6 3
SCH OHCF CF Cell Cell
H O H O CF
II IAC C
q F F F
α = + + +
(3.74)
From the solutions above we obtain a expression to calculate the ACOHCHC
3,6 , MOHCHC
3,7 ,
CCOC
2,8 and α:
M
MeffOHCH
M
MOHCH
MeffOHCHCellOHCHCell
OHCHAC
OHCH CKD
CCD
F
CI
F
CICKK
C
δ
δξ
16,
,71,
11045
,6
3
333
3
3
1
6
+
+−−= (3.75)
where:
AF
S
ACeffOHCH
AC
ADeffOHCH
AD
q
KKA
DD
KC 54
,,
51
33
−+= δδ (3.76)

Transport Phenomena in Direct Methanol Fuel Cells: Modelling and Experimental Studies
93
7,
,
7,
,66,
7,
7,
,7
3
3
3
33
3
3
3
3
1
6
KD
D
KD
CKD
KFD
I
KFD
I
C
CCeffOHCH
M
CCMeffOHCH
CCeffOHCH
M
ACOHCH
CCMeffOHCH
CCeffOHCH
CCCellOHCH
CCeffOHCH
CCCell
MOHCH
δδ
δδδξδ
+
++−= (3.77)
2
3
43
22
2
2
22
,9,8
0
,7
MOHCHCell
OO
OCCO
NC
F
IC
KK
CC ++= (3.78)
where:
2222 ,9,8,8,2
OOCF
S
OCDeff
O
CD
KKq
A
KDC −= δ
(3.79)
( )F
ICCKKKC Cell
OHM
OH 6
130456,6 22
+−= α (3.80)
where:
ACeffOH
AC
ADeffOH
AD
AF
S
D
K
D
KK
q
AKKKC
,
5
,
564563
22
δδ ++= (3.81)
4,9,7,8
0
,7 3263
222
2
2C
F
I
F
I
F
I
KoKK
CC OHCHCellCell
OHOHH
OHMOH
+++= α (3.82)
where:
2 2 2 2 3 2 2 2
4 , ,8, 7, 7, 8, 9, 7,
CD CC S
eff CD eff CC CFH O H O H O H O CH OH H O H O H O
AC
K K D K D q K K K
δ δ= + + (3.83)
dM
MOH
MOH
Cell
MeffOH n
CC
I
FD6
6222 ,6,7
,
+
−−=
δα (3.84)

Chapter 3: Model Formulation for an active feed DMFC
94
3.5.2. Heat transport
Solving equation (3.47) for T1 and T4 we obtained:
( )1,
141
TR
TTQ
−= (3.85)
where 1,TR is the total thermal resistance
3211, RRRRT ++= (3.86)
and 321 ,, RRR are the thermal resistance of AAP, ARP and ACP
11 ,
AAP
xR
K= (3.87)
2 12 ,
ARP
x xR
K
−= (3.88)
3 23
ACP
x xR
K
−= (3.89)
The solution to Eqs. (3.31), (3.33), (3.35), (3.38), (3.48), (3.49) and (3.85) is:
( )( ) ( ) ( )AFACACell
T
AF
TTAR
TTTI
R
TA
TAAAT
−−−−−−−=−−+
516
8721
2,
12
1215
298ββη
(3.90)
where
2 2 ,11
AFH O H O
S
q CpA
A
ρ= , (3.91)
2 channels fin finA n hAη= , (3.92)
,2 ,1 ,T T Section IR R R= + (3.93)
7 66
M
x xR
K
−= and (3.94)

Transport Phenomena in Direct Methanol Fuel Cells: Modelling and Experimental Studies
95
AF
AISection
K
xxR 3−= (3.95)
2,TR is the total thermal resistance, 6R is the thermal resistance of the membrane and
ISectionR is the total thermal resistance of section I.
Solving Eqs. (3.33), (3.38) and (3.48) and (3.34), (3.43) and (3.48) the following
equations are obtained:
( ) ( )6
8721
4
56 298R
TTTI
R
TTACACell
−−−−−=− ββη (3.96)
where 4R is the thermal resistance of AD
ADK
xxR 45
4−= (3.97)
and
( ) ( ) ( )6
8743
8
109 2983
R
TTTII
R
TTCCCOHCHCell
−+−−−+=− ββη (3.98)
where 8R is the thermal resistance of CD
CDK
xxR 89
8−= (3.99)
The model simulations presented in this Chapter and in Chapter 5 were obtained based
on the parameters listed in Table 3.1. The physical properties and the expressions used
to calculate the effective diffusion coefficients, porosities, effective thermal
conductivities can be found in Appendix B (B.1, B.2, B.3 and B.4).
Is should be mentioned that all the parameters used were carefully chosen from recent
literature, namely reference exchange current density and transfer coefficients. In
numerous published works, there are numerous values for the same parameter, and it

Chapter 3: Model Formulation for an active feed DMFC
96
seems that some authors use the parameters that better fit their experimental results that
could be or not the most adequate to their operating/design conditions.
Table 3.1 – Values for the parameters used in the model equations.
Parameter Value Reference
2OU 1.24 V [120]
OHCHU 3 0.03 V [120]
TE ∂∂ / -1.4 × 10⁻⁴V/K [166]
κ 0.036 S/cm [120] Mδ 0.018 cm [120] AFδ , CFδ , tionIIsecδ , e 0.20 cm real value ADδ , CDδ 0.015 cm [120] ACδ , CCδ 0.0023 cm [120] ADε , CDε 0.71 [173]
ACε 0.81 [173] CCε 0.86 [173]
a 1000 cm-1 [120]
OHCHrefI 3
,0 ( )( )( )TR /1353/1/35570exp10425.9 3 −× − A/cm2 [166]
2
,0O
refI ( )( )( )TR /1353/1/73200exp10222.4 6 −× − A/cm2 [166]
k 4105.7 −× [120]
λ 9108.2 −× mol/cm3 [120]
Aα 0.52 [120]
Cα 1.55 [120]
64−K , OHK 2,98− 0.8 assumed
2,98 OK − 1.25 assumed
7K 0.001 assumed AFq 0.33 cm3/s real value CFq 1.67 cm3/s real value
channelsn 15 real value
w 5 cm real value
airP 1 atm [120]

Transport Phenomena in Direct Methanol Fuel Cells: Modelling and Experimental Studies
97
CCCDeffOD ,,
2 ( ) ( )[ ]PTCCCD ××× − 772.27/108.5 475.1, 5.2
ε cm2/s [174]
ACADeffOHCHD ,,
3 ( ) ( )[ ]485.9/10608.7 2
5.2 7, ××× −OH
ACAD T µε cm2/s [174] CCeffOHCHD ,
3 ( ) ( )[ ]PTCC ××× − 904.33/108.5 475.15.2
ε cm2/s [174]
MeffOHCHD ,
3 ( )( )T/1333/12436exp109.4 6 −×× − cm2/s [120] ACADeff
OHD ,,2
( ) ( )[ ]833.5/10295.6 3
5.2 7, ××× −OHCH
ACAD T µε cm2/s [174] CCCDeff
OHD ,,2
( ) ( )[ ]PTCCCD ××× − 523.25/102.6 475.1, 5.2
ε cm2/s [174] Meff
OHD ,2
( )( )T/1303/12060exp100.2 6 −×× − cm2/s [87]
OHCH3ξ OHCHx 35.2 × [120]
dn ( )( )T/1333/11029exp9.2 −× [166]
CAPAAP δδ , 2 cm real value CRPARP δδ , 0.1 cm real value CCPACP δδ , 0.05 cm real value
Itionsecδ 0.15 cm real value MK 0.0043 W/cmK [173]
ADK 41.95 6.57 10 T−+ × W/mK [173] CDK 51.71 2.96 10 T−+ × W/mK [173] ACK ( ) ( )41 86.7 0.341 9.26 10AC ACε ε −− × + + × W/mK [173] CCK ( ) ( )51 71 0.0034 7.60 10CC CCε ε −− × + + × W/mK [173]
AFT , 1T , 14T 343 K real value
CFT 293 K real value
3.6. Results and discussion
The developed model coupling the heat and mass transfer processes occurring in the
DMFC is rapidly implemented with simple numerical tools: Matlab and Excel. In this
section, examples of model predictions obtained after implementation of the model are
presented. The conditions chosen to generate the simulations are similar to those used
by Brenda et al. [120] in their experiments. This work was selected since the authors
give a complete characterization of the MEA structure, reporting data essential to use in
the present model. The cell used by them had an active area of 25 cm2 with a Nafion
117 membrane. They used E-TEK 40% Platinum/C as both anode and cathode gas

Chapter 3: Model Formulation for an active feed DMFC
98
diffusion layers. The anode catalyst loading was 3 mg/cm2 of Pt/Ru and the cathode
catalyst loading was 1 mg/cm2 of Pt.
Predicted methanol concentration profiles across de anode and membrane, are depicted
in Figure 3.2, when the cell is feed with a 0.5M methanol solution at current densities of
50, 100 and 150 mA/cm2. The concentration profile at the anode flow channel is
constant because it is treated as a CSTR. In the other layers, the methanol concentration
decreases due to mass transfer diffusion, methanol consumption in the catalyst layer and
the methanol crossover. The slope of the concentration profile in the membrane is
higher for the lower current density showing a higher methanol crossover for this
condition.
0
0.1
0.2
0.3
0.4
0.5
0.18 0.2 0.22 0.24
x (cm)
0.05 A/cm2 0.10 A/cm2 0.15 A/cm2
AF AD AC M
Met
ha
no
l co
ncen
tratio
n (
mo
l/dm3 )
A/cm2
A/cm2
A/cm2
Figure 3.2 – Predicted methanol concentration profiles in the cell for different current densities.
Operating conditions: temperature 70 ºC, pressure 1 atm, qAF = 0.33 cm3/s and qCF = 1.67 cm3/s.
Figure 3.3 shows the predictions of the methanol crossover as a function of current
density for different methanol feed concentrations. At the cathode, the methanol that
crosses the membrane reacts with oxygen in a corrosion reaction. Therefore the leakage
current formed due to methanol oxidation represents fuel losses. Expressing the
methanol crossover in terms of a leakage current gives a more understanding idea of the
effect of the loss in efficiency due to methanol crossover. As can be seen in Fig. 3.3, the
leakage current can be reduced by running the cell at low methanol concentrations and
high current densities. The leakage current goes to zero at the limiting current density
value for all concentrations. This provides a check that the transport equations, used in
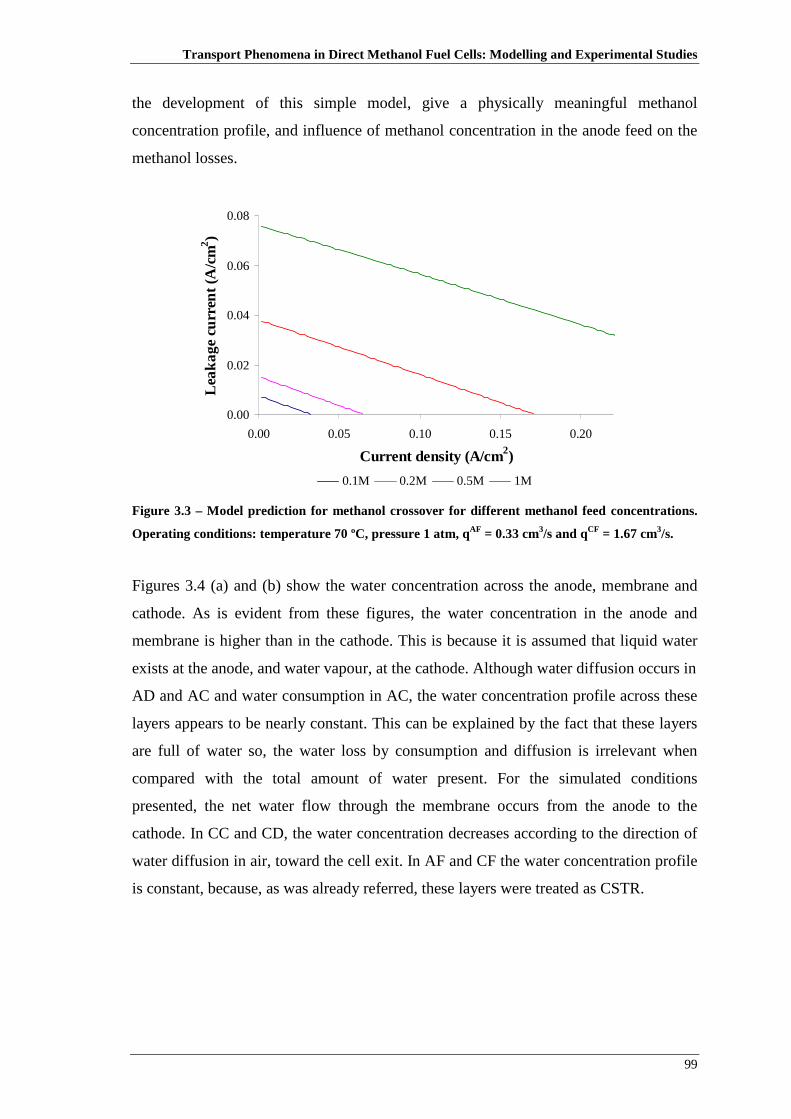
Transport Phenomena in Direct Methanol Fuel Cells: Modelling and Experimental Studies
99
the development of this simple model, give a physically meaningful methanol
concentration profile, and influence of methanol concentration in the anode feed on the
methanol losses.
0.00
0.02
0.04
0.06
0.08
0.00 0.05 0.10 0.15 0.20
Current density (A/cm2)
Lea
kage
cu
rren
t (A
/cm2 )
0.1M 0.2M 0.5M 1M Figure 3.3 – Model prediction for methanol crossover for different methanol feed concentrations.
Operating conditions: temperature 70 ºC, pressure 1 atm, qAF = 0.33 cm3/s and qCF = 1.67 cm3/s.
Figures 3.4 (a) and (b) show the water concentration across the anode, membrane and
cathode. As is evident from these figures, the water concentration in the anode and
membrane is higher than in the cathode. This is because it is assumed that liquid water
exists at the anode, and water vapour, at the cathode. Although water diffusion occurs in
AD and AC and water consumption in AC, the water concentration profile across these
layers appears to be nearly constant. This can be explained by the fact that these layers
are full of water so, the water loss by consumption and diffusion is irrelevant when
compared with the total amount of water present. For the simulated conditions
presented, the net water flow through the membrane occurs from the anode to the
cathode. In CC and CD, the water concentration decreases according to the direction of
water diffusion in air, toward the cell exit. In AF and CF the water concentration profile
is constant, because, as was already referred, these layers were treated as CSTR.

Chapter 3: Model Formulation for an active feed DMFC
100
0
10
20
30
40
50
60
0.18 0.19 0.2 0.21 0.22 0.23 0.24
x (cm)
Wat
er c
once
ntra
tion
(mol
/dm3 )
0.05 A/cm2 0.10 A/cm2 0.15 A/cm2
AF AD AC M
a)A/cm2 A/cm2A/cm2
0.0000
0.0005
0.0010
0.0015
0.0020
0.0025
0.0030
0.0035
0.21 0.26 0.31 0.36 0.41 0.46
x (cm)
Wa
ter
conc
entra
tion
(mo
l/dm3 )
0.05 A/cm2 0.10 A/cm2 0.15 A/cm2
CCCD CF
A/cm2 A/cm2 A/cm2b)
Figure 3.4 – Predicted water concentration distribution in the cell at different current densities: (a)
anode and membrane and (b) cathode. Operating conditions: methanol concentration 0.5M,
temperature 70 ºC, pressure 1 atm, qAF = 0.33 cm3/s and qCF = 1.67 cm3/s.
Model predictions of the net water transport coefficient, α, are presented in Figure 3.5
as a function of current density for different methanol feed concentrations. It should be
remembered that positive α corresponds to a net water flow from anode to cathode
while negative α indicates that the net flow occurs in the opposite side. Figure 3.5
shows that for all the methanol concentrations used the values of α are positive,
although they are higher for low feed methanol concentrations. This occurs because for
low methanol feed concentrations there is almost always a higher water concentration at

Transport Phenomena in Direct Methanol Fuel Cells: Modelling and Experimental Studies
101
the anode side, especially for the lower values of current density. The transport of water
due to electroosmotic drag and diffusion towards the cathode is dominant. For high
methanol concentrations in the gas feed and low current densities the water production
in the cathode gives higher water concentrations in the cathode side. Therefore the
water transport from the anode to the cathode is lower corresponding to small values of
α. As already explained in Chapter 2, working under low or even negative values of α,
(corresponding to a low water crossover) may be essential to enable operation of a
DMFC under high concentration of methanol in the feed solution, increasing therefore
the power density of the cell.
0
5
10
15
20
25
30
35
40
0.00 0.05 0.10 0.15 0.20
Current density (A/cm2)
net
wa
ter
trans
po
rt co
effic
ient
0.5M 1M 2M
Figure 3.5 – Model predictions of the net water transport coefficient for different methanol
concentrations. Operating conditions: temperature 70 ºC, pressure 1 atm, qAF = 0.33 cm3/s and qCF
= 1.67 cm3/s.
In Figure 3.6, model predictions of α as a function of methanol feed concentration for
different current densities are presented. It is evident that the methanol concentration
has a large impact on the α values. High methanol concentrations result in low values of
α. It is also evident that for higher values of the current density the impact of methanol
concentration decreases. The model predicts the correct trends of the influence of the
current density on water crossover. The trends predicted by the model are in accordance
to the ones proposed by the authors Liu et al. [90]. The developed model can be used to
perform further studies with different MEA structures to set-up operating conditions
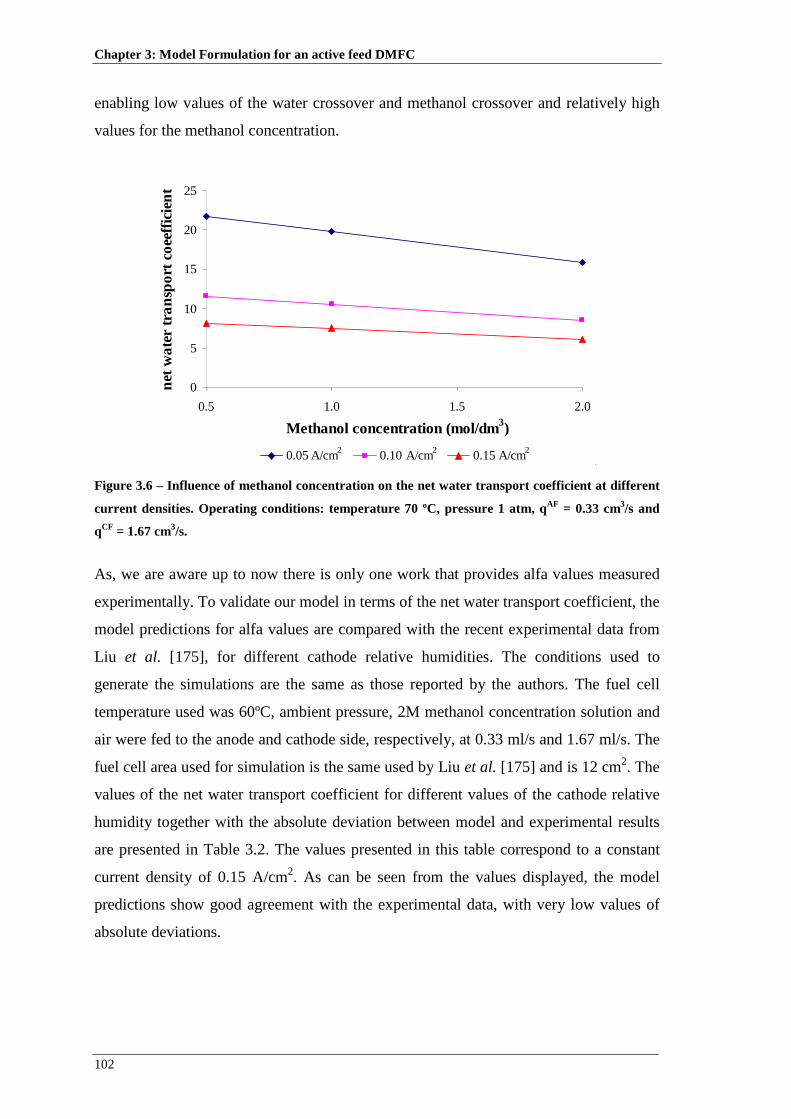
Chapter 3: Model Formulation for an active feed DMFC
102
enabling low values of the water crossover and methanol crossover and relatively high
values for the methanol concentration.
0
5
10
15
20
25
0.5 1.0 1.5 2.0
Methanol concentration (mol/dm3)
net
wa
ter
tran
spo
rt co
eeffi
cien
t
0.05 A/cm2 0.10 A/cm2 0.15 A/cm2A/cm2A/cm2A/cm2
Figure 3.6 – Influence of methanol concentration on the net water transport coefficient at different
current densities. Operating conditions: temperature 70 ºC, pressure 1 atm, qAF = 0.33 cm3/s and
qCF = 1.67 cm3/s.
As, we are aware up to now there is only one work that provides alfa values measured
experimentally. To validate our model in terms of the net water transport coefficient, the
model predictions for alfa values are compared with the recent experimental data from
Liu et al. [175], for different cathode relative humidities. The conditions used to
generate the simulations are the same as those reported by the authors. The fuel cell
temperature used was 60ºC, ambient pressure, 2M methanol concentration solution and
air were fed to the anode and cathode side, respectively, at 0.33 ml/s and 1.67 ml/s. The
fuel cell area used for simulation is the same used by Liu et al. [175] and is 12 cm2. The
values of the net water transport coefficient for different values of the cathode relative
humidity together with the absolute deviation between model and experimental results
are presented in Table 3.2. The values presented in this table correspond to a constant
current density of 0.15 A/cm2. As can be seen from the values displayed, the model
predictions show good agreement with the experimental data, with very low values of
absolute deviations.

Transport Phenomena in Direct Methanol Fuel Cells: Modelling and Experimental Studies
103
Table 3.2 – Comparison between model predictions, for the net water transport coefficient, and
experimental data from Liu et al. [175] and absolute deviation for 60 ºC, Nafion212 at 0.15 A/cm2.
RH, %
(Relative Humidity) Data from Liu et al. [175] Model Absolute deviation
0 0.70 0.72 0.02
30 0.48 0.48 0.00
50 0.25 0.26 0.01
70 -0.15 -0.16 0.01
100 -0.70 -0.70 0.00
Figure 3.7 shows the temperature distribution in the active section of the cell for a feed
methanol concentration of 0.5M methanol solution and operating at different current
densities. The data points represent the temperatures at the several layer interfaces. It is
seen from Fig. 3.7 that, under the presented operating conditions, the temperature in the
anode side is lower than that in the cathode. This is because the heat generation rate by
the anodic overpotential is less than the endothermic heat demanded by the
electrochemical reaction of methanol oxidation. As a result some heat has to be taken
from the cathode.
343.3
343.5
343.7
343.9
344.1
344.3
344.5
344.7
344.9
0.19 0.20 0.21 0.22 0.23 0.24 0.25 0.26
x (cm)
Tem
per
atu
re (
K)
0.05 A/cm2 0.10 A/cm2 0.15 A/cm2
AD AC M CC CD
A/cm2 A/cm2 A/cm2
Figure 3.7 – Prediction for the temperature distribution in the cell at different current densities.
Operating conditions: methanol concentration 0.5M, pressure 1 atm, qAF = 0.33 cm3/s and qCF =
1.67 cm3/s.
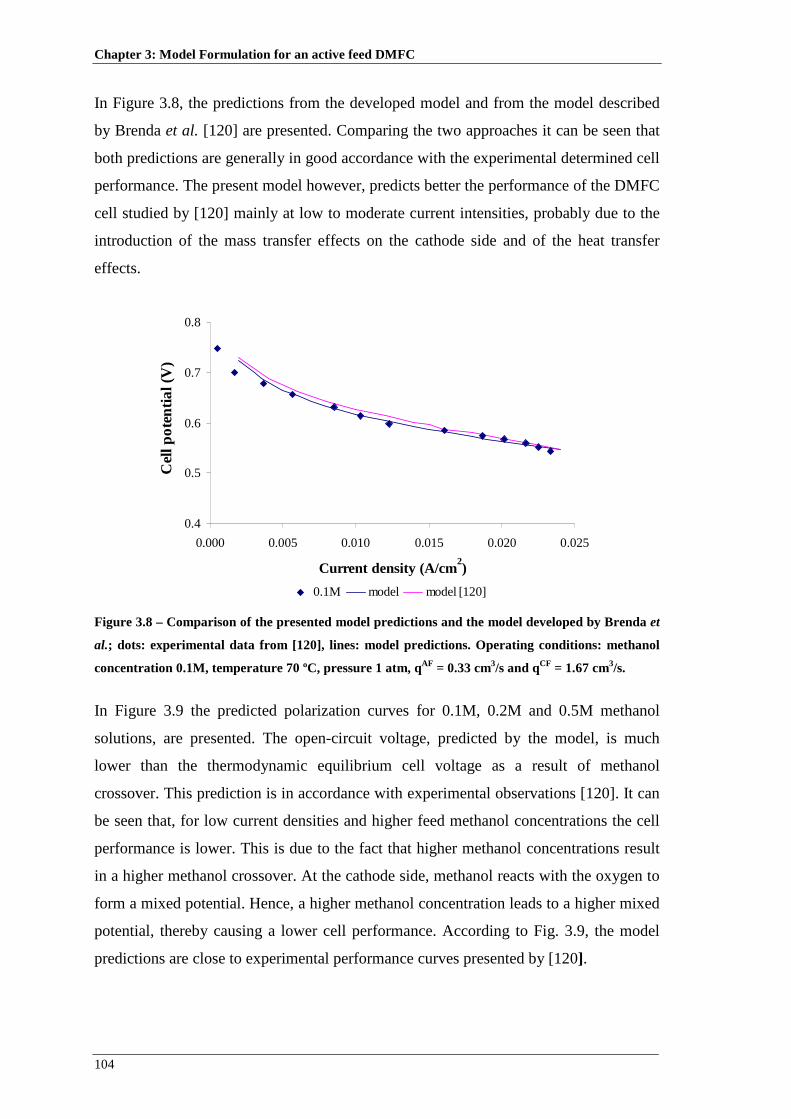
Chapter 3: Model Formulation for an active feed DMFC
104
In Figure 3.8, the predictions from the developed model and from the model described
by Brenda et al. [120] are presented. Comparing the two approaches it can be seen that
both predictions are generally in good accordance with the experimental determined cell
performance. The present model however, predicts better the performance of the DMFC
cell studied by [120] mainly at low to moderate current intensities, probably due to the
introduction of the mass transfer effects on the cathode side and of the heat transfer
effects.
0.4
0.5
0.6
0.7
0.8
0.000 0.005 0.010 0.015 0.020 0.025
Current density (A/cm2)
Cel
l po
tent
ial (
V)
0.1M model model [120]
Figure 3.8 – Comparison of the presented model predictions and the model developed by Brenda et
al.; dots: experimental data from [120], lines: model predictions. Operating conditions: methanol
concentration 0.1M, temperature 70 ºC, pressure 1 atm, qAF = 0.33 cm3/s and qCF = 1.67 cm3/s.
In Figure 3.9 the predicted polarization curves for 0.1M, 0.2M and 0.5M methanol
solutions, are presented. The open-circuit voltage, predicted by the model, is much
lower than the thermodynamic equilibrium cell voltage as a result of methanol
crossover. This prediction is in accordance with experimental observations [120]. It can
be seen that, for low current densities and higher feed methanol concentrations the cell
performance is lower. This is due to the fact that higher methanol concentrations result
in a higher methanol crossover. At the cathode side, methanol reacts with the oxygen to
form a mixed potential. Hence, a higher methanol concentration leads to a higher mixed
potential, thereby causing a lower cell performance. According to Fig. 3.9, the model
predictions are close to experimental performance curves presented by [120].
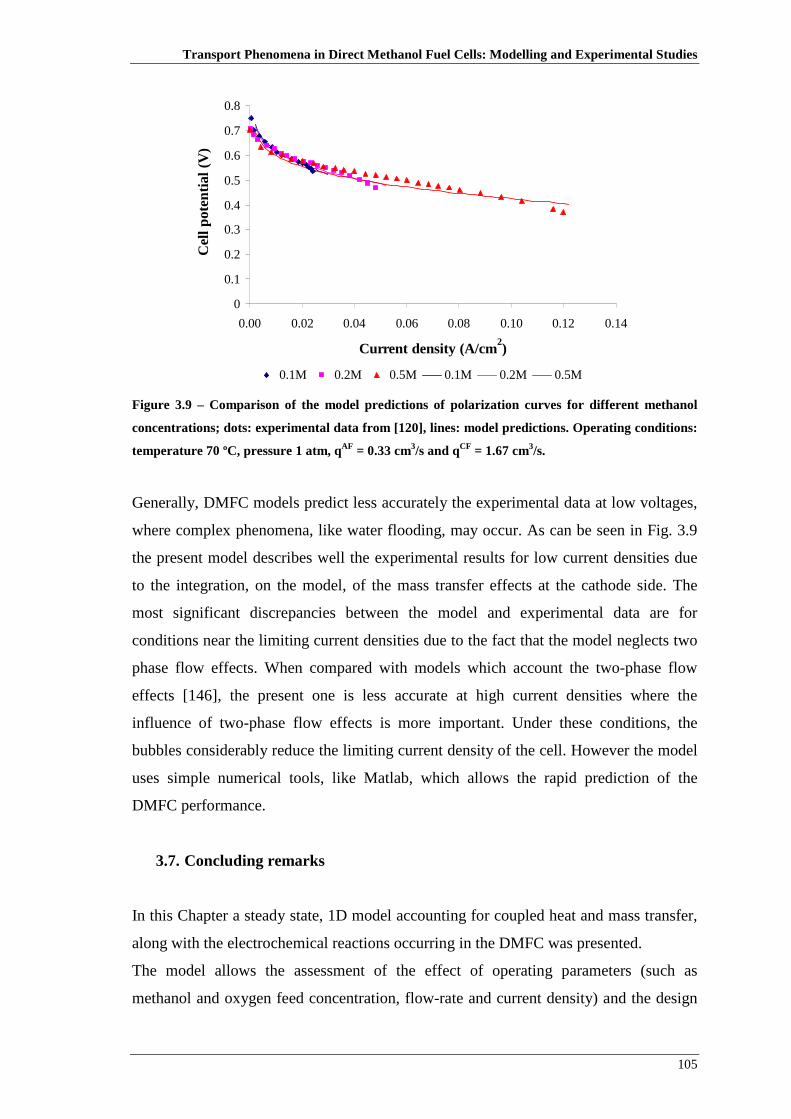
Transport Phenomena in Direct Methanol Fuel Cells: Modelling and Experimental Studies
105
0
0.1
0.2
0.3
0.4
0.5
0.6
0.7
0.8
0.00 0.02 0.04 0.06 0.08 0.10 0.12 0.14
Current density (A/cm2)
Cel
l pot
entia
l (V
)
0.1M 0.2M 0.5M 0.1M 0.2M 0.5M Figure 3.9 – Comparison of the model predictions of polarization curves for different methanol
concentrations; dots: experimental data from [120], lines: model predictions. Operating conditions:
temperature 70 ºC, pressure 1 atm, qAF = 0.33 cm3/s and qCF = 1.67 cm3/s.
Generally, DMFC models predict less accurately the experimental data at low voltages,
where complex phenomena, like water flooding, may occur. As can be seen in Fig. 3.9
the present model describes well the experimental results for low current densities due
to the integration, on the model, of the mass transfer effects at the cathode side. The
most significant discrepancies between the model and experimental data are for
conditions near the limiting current densities due to the fact that the model neglects two
phase flow effects. When compared with models which account the two-phase flow
effects [146], the present one is less accurate at high current densities where the
influence of two-phase flow effects is more important. Under these conditions, the
bubbles considerably reduce the limiting current density of the cell. However the model
uses simple numerical tools, like Matlab, which allows the rapid prediction of the
DMFC performance.
3.7. Concluding remarks
In this Chapter a steady state, 1D model accounting for coupled heat and mass transfer,
along with the electrochemical reactions occurring in the DMFC was presented.
The model allows the assessment of the effect of operating parameters (such as
methanol and oxygen feed concentration, flow-rate and current density) and the design

Chapter 3: Model Formulation for an active feed DMFC
106
parameters (channel geometry, active area and material properties) on the temperature
and concentration profiles along the cell and consequently on the cell performance.
Special attention is devoted to the effects of different parameters such as the methanol
feed concentrations and the current density on the water balance between the anode and
cathode in the DMFC. The model predicts the correct trends of the influence of these
parameters and is in accordance with the trends proposed by Liu et al. [90, 175].
With this easily to implement model, suitable operating conditions can be set-up for
tailored MEAs in order to work at a high methanol concentration level without the
sacrifice of performance. The presented model can be a useful tool to improve DMFC
understanding and to optimize fuel cell design as will be presented in Chapter 5. Since
the developed model is rapidly implemented with simple numerical tools like, Matlab
and Excel it can be used in real-time system level DMFC calculations.

107
CHAPTER 4 4. EXPERIMENTAL SETUP FOR AN ACTIVE FEED DMFC
For the experimental investigations of the liquid feed direct methanol fuel cells
(DMFCs), an active feed DMFC was used. The different cell geometries which have
been designed constructed and tested as well as the necessary equipment and
facilities for running the tests are presented in this chapter.
4.1. Fuel cell design
The in house fuel cell was designed bearing in mind the following basic demands:
use of standard state of the art materials which are available on the market;
high flexibility, i. e. easy change of flow fields, exchange media connections;
easy handling in terms of assembly and connections;
The cell consists of the following elements (Fig. 4.1):
three-layer membrane electrode assembly (MEA)
diffusion layers consisting of carbon-fibber-based porous materials
monopolar plates with flow fields
connector plates for electrical contacting
insulating plates
end plates

Chapter 4: Experimental Setup for an active feed DMFC
108
Figure 4.1 – 3D CAD drawing of the active feed DMFC.
The fuel cell specifications, namely the cell components, their quantities and
dimensions and the materials used, are presented in Table 4.1.
Table 4.1 – Different elements of a fuel cell
Fuel cell – Specifications
Cell active area 25 cm2
Total cell area 100 cm2
Cell components Material Quantity Dimensions (cm)
Monopolar plates graphite 2 10x10x0.35
Connector plates gold plated copper 2 10x10x0.05
End plates aluminium 2 10x10x1
Isolating plates rubber 2 10x10x0.1
Anode catalyst layer Platinum/Ruthenium 4 mg/cm2
or 8 mg/cm2 1 5x5x(#)
Cathode catalyst layer Platinum black 4 mg/cm2
or 8 mg/cm2 1 5x5x(#)
Membrane Nafion 117, 115, 212 1 5x5x(*)
Diffusion layers Carbon paper, carbon cloth or ELAT 2 5x5x(*)
(#) this dimension depends of the catalyst loading; (*) this dimension depends on the used material.

Transport Phenomena in Direct Methanol Fuel Cells: Modelling and Experimental Studies
109
Figure 4.2 – Photograph of an «in-house» designed DMFC.
4.1.1. End Plates
For bracing the cell and applying the desired tension on the cell elements, 10 mm thick
aluminium plates are used (Fig. 4.3). Both end plates are connected by a total of 8 bolts
(diameter 6.2 mm), running through plastic bushes to prevent electrical contact between
the end plates. As a standard, the cell is assembled applying a torque of 5 Nm on the
bolts.
Figure 4.3 – Photograph of an end plate (aluminium)
4.1.2. Insulating Plates
To avoid electrical contact between connector plates and the respective end plates, and
to ensure an even pressure distribution over the monopolar plates, rubber plates
(thickness 1 mm) are put between the connectors and end plates, respectively (Fig. 4.4).

Chapter 4: Experimental Setup for an active feed DMFC
110
Figure 4.4 – Photograph of an isolating plate (rubber).
4.1.3. Connector plates
For the electrical connection of the graphite monopolar plates, gold plated copper plates
of 0.5 mm thickness are used (Fig. 4.5). Also all further electrical connectors are gold
plated to ensure minimal ohmic resistances at various connection points.
Figure 4.5 – Photograph of a connector plate.
4.1.4. Monopolar plates
The monopolar plates are made from graphite supplied by Schunk Portugal, Lda. The
necessary flowbed structures for the reactant distribution over the MEA surface are
millcut into the plates. The flowbed area is 25 cm2. The table 4.2 shows the different
flow field configurations used in the present work.

Transport Phenomena in Direct Methanol Fuel Cells: Modelling and Experimental Studies
111
Table 4.2 – Different flow field designs used.
Design 1
Number of channels 15
Type of channels Serpentine (SFF)
Channel length 50 mm
Channel depth 2 mm
Channel width 2 mm
Channel ribs 1.5 mm
Design 2
Number of channels 15
Type of channels Multiserpentine (MSFF)
(3 serpentine channels)
Channel length 50 mm
Channel depth 2 mm
Channel width 2 mm
Channel ribs 1.5 mm
Design 3
Number of channels 14
Type of channels Mixed (MFF)
(serpentine and parallel)
Channel length -----
Channel depth 2 mm
Channel width 2 mm
Channel ribs 1.7 mm
The influence of the flow field is treated in the present work. A serpentine flow field
was selected, as based configuration for all the tests, following the generally accepted
idea that this design results in a better cell performance facilitating the removal of
reaction products, such as carbon dioxide on the anode and water on the cathode side,
and enhancing two-phase mass transport [39, 106, 107]. The flow fields, consisting of
machined one-pass serpentine grooves blocks, were identical for both anode and
cathode.

Chapter 4: Experimental Setup for an active feed DMFC
112
4.1.5. Membrane Electrode Assembly (MEA)
In the remaining text, the abbreviation MEA always refers to a membrane coated with
catalyst layers but without diffusion layers. The MEA’s used were supplied by
Lynntech and had an active area of 25cm2 (5x5cm) and a total area of 110.67cm2
(10.52x10.52cm). The membranes tested were made by Nafion 117, 115 e 212.
Unsupported platinum black and platinum-ruthenium were used as catalyst (Fig. 4.6).
The catalyst was Pt/Ru on the anode side with a loading of 4 mg/cm2 and Pt on the
cathode side with a loading of 4 mg/cm2.
Figure 4.6 – Photograph of a Membrane Electrode Assembly (MEA)
An important physical parameter of the catalyst layer is the porosity and it can be
calculated from the catalyst loading, the ink composition and some physical properties
of the used materials. The calculation is presented in the Appendix B. The porosity
values obtained are high, which is of course desired to a certain degree to achieve as
many accessible catalyst sites as possible for the fluid phases.
4.1.6. Diffusion layers
Different types of diffusion layers are usually used in DMFCs: carbon paper and carbon
cloth. As already referred, some authors [89, 90] report the use of these two materials
coated with a highly hydrophobic microporous layer (MPL) enhancing fuel cell
performance through a minimised water crossover. The most common GDLs
commercially available do not have MPL layers. Bearing in mind that the one purpose
of this work was the optimization of a DMFC using the materials available
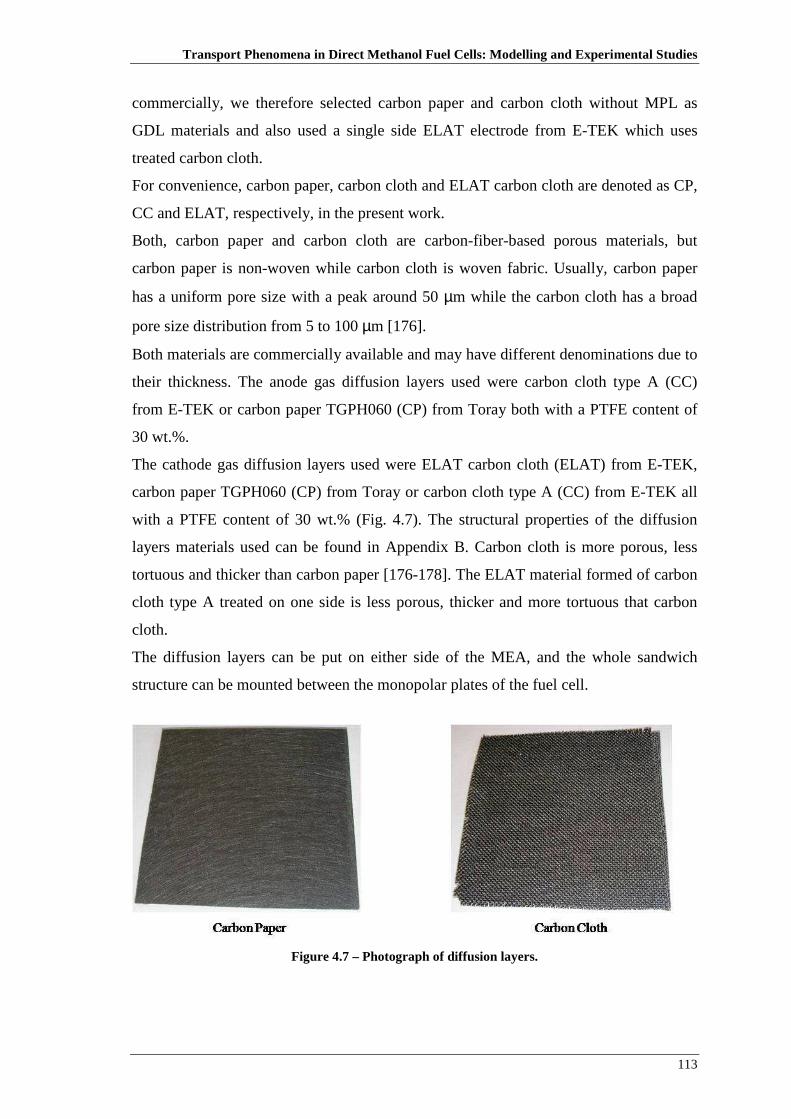
Transport Phenomena in Direct Methanol Fuel Cells: Modelling and Experimental Studies
113
commercially, we therefore selected carbon paper and carbon cloth without MPL as
GDL materials and also used a single side ELAT electrode from E-TEK which uses
treated carbon cloth.
For convenience, carbon paper, carbon cloth and ELAT carbon cloth are denoted as CP,
CC and ELAT, respectively, in the present work.
Both, carbon paper and carbon cloth are carbon-fiber-based porous materials, but
carbon paper is non-woven while carbon cloth is woven fabric. Usually, carbon paper
has a uniform pore size with a peak around 50 µm while the carbon cloth has a broad
pore size distribution from 5 to 100 µm [176].
Both materials are commercially available and may have different denominations due to
their thickness. The anode gas diffusion layers used were carbon cloth type A (CC)
from E-TEK or carbon paper TGPH060 (CP) from Toray both with a PTFE content of
30 wt.%.
The cathode gas diffusion layers used were ELAT carbon cloth (ELAT) from E-TEK,
carbon paper TGPH060 (CP) from Toray or carbon cloth type A (CC) from E-TEK all
with a PTFE content of 30 wt.% (Fig. 4.7). The structural properties of the diffusion
layers materials used can be found in Appendix B. Carbon cloth is more porous, less
tortuous and thicker than carbon paper [176-178]. The ELAT material formed of carbon
cloth type A treated on one side is less porous, thicker and more tortuous that carbon
cloth.
The diffusion layers can be put on either side of the MEA, and the whole sandwich
structure can be mounted between the monopolar plates of the fuel cell.
Figure 4.7 – Photograph of diffusion layers.

Chapter 4: Experimental Setup for an active feed DMFC
114
4.2. Methanol Test Kit Testing Unit
The test unit used for experiments with DMFCs was developed and bought to Fideris
Incorporated. In one compact unit, the Methanol Test Kit (MTK) testing unit contains
six subsystems: methanol handling system, oxidant gas handling system, fuel cell heater
control system (optional), linear electronic load, I/O capabilities and the hardwired
emergency stop system. To obtain the highest performance of the fuel cell test
equipment, Fideris Incorporated recommends operation of all equipment using the
FCPower software. This software package has been written especially for the fuel cell
researcher to provide complete control of all aspects of fuel cell testing. Figure 4.8 and
4.9 show a schematic of laboratory-scale test facility.
Figure 4.8 – Photograph of the experimental setup.

Transport Phenomena in Direct Methanol Fuel Cells: Modelling and Experimental Studies
115
Figure 4.9 – Schematic diagram of the experimental set-up.
The major specifications of the Methanol Test Kit unit are displayed in Table 4.3.

Chapter 4: Experimental Setup for an active feed DMFC
116
Table 4.3 – Specifications of MTK [179].
Methanol handling system
Liquid reactant control Micropump: Magnetic drive gear pump Series 180
Maximum pump rate 85 ml/min
Maximum temperature 95ºC
Heating system capacity 400 W
Cooling system capacity 350 W
External reservoir capacity 1 Liter
Gas handling system
Reactant gas control Computer controlled mass flow control of oxidant
Maximum gas flow 10 l/min
Inlet gas pressure range 80-200 psi
Loadbank system
Type MOSFET variable resistance loadbank
Measurement Power, Voltage e Current
Control modes Constant, Pulse e Ramp
Maximum current rating 50 A
Maximum voltage rating 20 V
Maximum power rating 100 W
Nominal short circuit resistance < 2.2 mΩ
Corrosion protection All critical components are gold plated
Electrical Requirments
Voltage 120/230-240 VAC (field changeable)
Frequency 50-60 Hz
Power rating 800 W
Software
Software recommended by Fideris: FCPower
4.2.1. Methanol handling system
As shown in Fig. 4.10 the methanol handling system includes an external reservoir
equipped with a low level float which will set a software alarm after a low level timeout

Transport Phenomena in Direct Methanol Fuel Cells: Modelling and Experimental Studies
117
period. A computer controlled variable speed recirculating pump is used to pump the
methanol solution from the reservoir through the handling system and fuel cell and
return it to the reservoir. The pump used is a magnetic drive gear pump which allows a
maximum methanol solution rate of 85 ml/min. Included in the recirculating loop are a
heater equipped with over temperature protection and a cooling system which can cool
the methanol solution to ambient temperature. An external thermocouple allows the
measurement of the methanol solution as it enters the fuel cell. The user can enable the
methanol flow and methanol heater. These systems are enabled when their respective
box is checked (Fig. 4.11). The recirculation pump speed can be set up to the maximum
speed as well as the temperature set point for the methanol solution can be set from
ambient to 95ºC.
Figure 4.10 – Schematic diagram of the methanol handling system.

Chapter 4: Experimental Setup for an active feed DMFC
118
Figure 4.11 – MTK software panel with methanol control option.
4.2.2. Gas handling system
To supply the fuel cell with an oxidant gas, the MTK is equipped with a gas handling
system. A pressure switch is included to ensure sufficient pressure is available, and a
computer controlled solenoid valve allows for the oxidant gas to enter the system. An
internal pressure regulator controls the pressure of the gas, which is necessary for
accurate metering of the gas through the mass flow controller (MFC) (Fig. 4.12). The
regulated inlet pressure is displayed on the front of the unit. The computer controlled
MFC allows a metered amount of gas, as set on the computer, to be supplied to the fuel
cell. The user can enable de gas flow and set the gas flow rate by imputing the desired
MFC flow rate in the space provided. The gas flow rate can be set to a maximum of 10
l/min. The user can set the gas control mode to either constant mode or stoichiometric
mode. All the experiments were conducted at constant mode (Fig. 4.13).

Transport Phenomena in Direct Methanol Fuel Cells: Modelling and Experimental Studies
119
Figure 4.12 – Schematic diagram of the gas handling system.
Figure 4.13 – MTK software panel with air control option.
4.2.3. Loadbank system
The loadbank subsystem acts as a large variable power resistor. With the control
software, the user controls the amount of impedance by selecting either how much
current is passed through the loadbank, the voltage across the loadbank or power
dissipated by the loadbank. To meet the requirements of any given experiment, the user
can also set upper and lower limits on the current, voltage and power. The computer
constantly monitors both current and voltage and these parameters are used to calculate
and track the amount of power that the loadbank is dissipating at any one time. The
computer program will not permit the power to exceed 100 W. The set points for the
control parameters can be previously chosen. The set points are used when running in
constant mode (Fig. 4.14).

Chapter 4: Experimental Setup for an active feed DMFC
120
Figure 4.14 – MTK software panel with electronic load option.
The current, voltage and power are known as control parameters. The loadbank has
three different control modes to choose from constant, pulse and ramp mode.
Constant mode – to run in constant mode, set the control mode to constant,
select the desired control parameter and enter the appropriate set point. Only the
set point for the control parameter is used.
Pulse mode – to run in pulse mode, set the control mode to pulse, select the
desired control parameter and enter the pulse high and pulse low values for the
selected control parameter. It is also necessary to set the pulse high time and
pulse low time (in seconds). The pulse width can be up to 1000s.
Ramp mode – to run in ramp mode, set the control mode to ramp, select the
desired control parameter and enter the ramp initial and ramp final values for the
selected control parameter. The parameter can be increasing or decreasing. The
ramp period must be set (in seconds) with a lower limit of 0.5 and an upper limit
of 1000.
All the experiments were conducted at constant mode
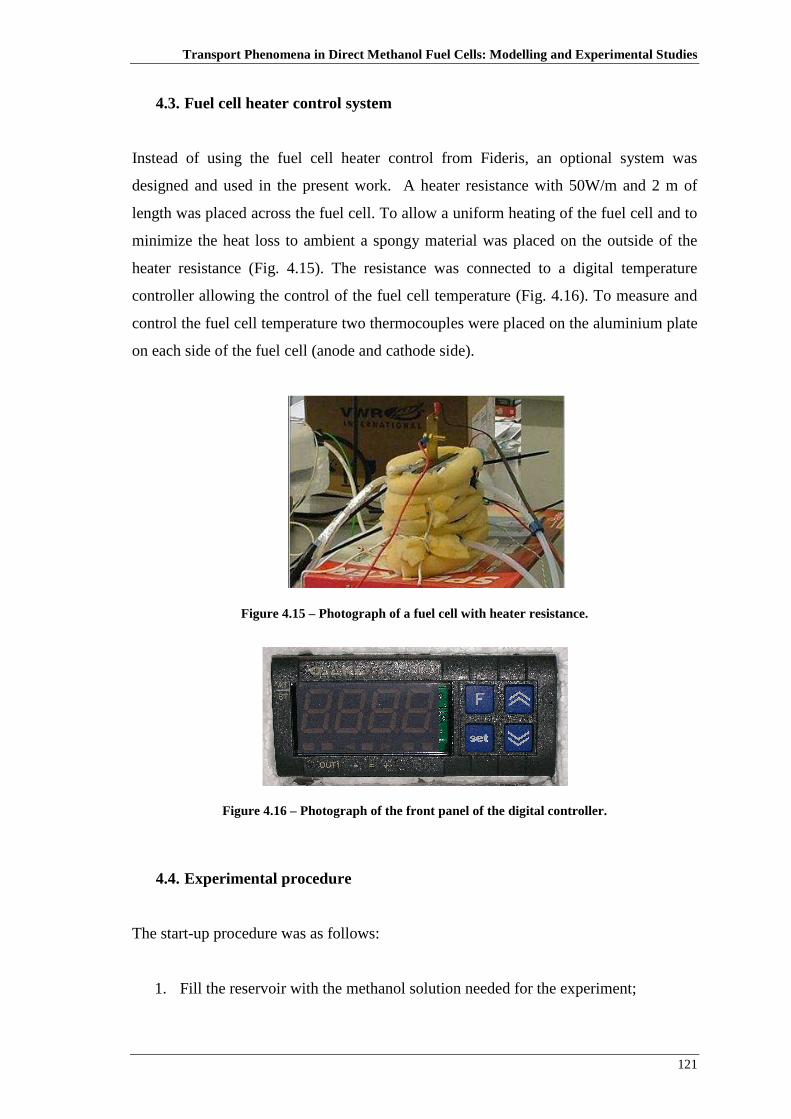
Transport Phenomena in Direct Methanol Fuel Cells: Modelling and Experimental Studies
121
4.3. Fuel cell heater control system
Instead of using the fuel cell heater control from Fideris, an optional system was
designed and used in the present work. A heater resistance with 50W/m and 2 m of
length was placed across the fuel cell. To allow a uniform heating of the fuel cell and to
minimize the heat loss to ambient a spongy material was placed on the outside of the
heater resistance (Fig. 4.15). The resistance was connected to a digital temperature
controller allowing the control of the fuel cell temperature (Fig. 4.16). To measure and
control the fuel cell temperature two thermocouples were placed on the aluminium plate
on each side of the fuel cell (anode and cathode side).
Figure 4.15 – Photograph of a fuel cell with heater resistance.
Figure 4.16 – Photograph of the front panel of the digital controller.
4.4. Experimental procedure
The start-up procedure was as follows:
1. Fill the reservoir with the methanol solution needed for the experiment;

Chapter 4: Experimental Setup for an active feed DMFC
122
2. Turn on the oxidant gas supply for the system and verify that it is held in the
operating range required for the test unit;
3. Turn on computer, the MTK unit and the FCPower software;
4. Set the methanol temperature, methanol flow rate and air flow rate value;
5. Set the fuel cell temperature value.
6. The cell was operated galvanostatically, so the current applied range values was
0 to maximum current allowed by the fuel cell, with a step of 0.1A. At open
circuit conditions the cell was operated fifteen minutes and at the other values of
current applied, the cell was operated three minutes to reach the steady state.
7. For each value of current applied the cell voltage was measured and power was
calculated;
8. Turn off the MTK system;
9. Close the FCPower software;
10. Turn off the gas supply.

123
CHAPTER 5
5. EXPERIMENTAL AND MODELLING STUDIES OF AN
ACTIVE FEED DMFC
A detailed experimental study on the performance of an «in-house» developed
DMFC with 25 cm2 of active membrane area, working near ambient pressure is
described. As was mentioned before there are several operating and design
parameters that affect the fuel cell performance. The operating parameters studied
were the methanol feed concentration, methanol and air flow rate and cell
temperature. The effect of design parameters such as membrane thickness, catalyst
loading, flow field design and diffusion layers material and thickness was, also,
studied. The experimental polarization curves are successfully compared with the
predictions of the steady state, one-dimensional model accounting for coupled heat
and mass transfer, along with the electrochemical reactions occurring in the DMFC
presented in Chapter 3. The operating conditions studied were selected bearing in
mind the present state of the art of DMFCs. As referred previously, there are few
studies on this type of fuel cells operating with high methanol concentrations, with
different membranes and gas diffusion layers and most of them were performed
under high temperature and pressure. However, less severe conditions (ambient
temperature and pressure) are favourable especially for portable applications. The
main goal is to systematically vary commercial MEA materials and check their
influence on fuel cell performance. The influence of the different parameters on the
cell performance is explained under the light of the predictions from the developed
model. Tailored MEAs (membrane electrode assemblies), with different structures
and combinations of gas diffusion layers (GDL), were designed and tested in order
to select optimal working conditions at high methanol concentration levels without
significant performance losses. Model predictions of the effect of different
parameters on the water management in an active feed DMFC are also, presented.
The contents of this Chapter conducted to the preparation and submission of
papers: Oliveira, V.B, Rangel, C.M. and Pinto, A.M.F.R., “Performance of a Direct
Methanol Fuel Cell operating near ambient conditions” submitted to Journal of

Chapter 5: Experimental and modelling studies of an active feed DMFC
124
Fuel Cell Science and Technology and Oliveira, V.B, Rangel, C.M. and Pinto,
A.M.F.R., “Effect of anode and cathode flow field design on the performance of a
direct methanol fuel cell” submitted to Chemical Engineering Journal.
The contents of this Chapter were partially published in Oliveira, V.B, Rangel, C.M.
and Pinto, A.M.F.R., “Modelling and experimental studies on a Direct Methanol
Fuel Cell working under low methanol crossover and high methanol
concentrations”, International Journal of Hydrogen Energy 34 (2009) 6443-6451
and Oliveira, V.B, Rangel, C.M. and Pinto, A.M.F.R., “Water management in direct
Methanol Fuel Cells” International Journal of Hydrogen Energy (2009)
doi:10.1016/j.ijhydene.2009.07.111.
5.1. Results and Discussion
The performance of the design fuel cell was determined by a set of tests in order to
obtain the cell polarization and power density curves. The test consisted of applying a
load to the cell, measuring the corresponding voltage value (recall Chapter 4) and then
calculating the cell power.
For each set of operating conditions, tests were performed until obtaining at least two
similar results. Tests were accepted if differences between corresponding readings were
below 5%.
Active direct methanol fuel cells characteristically require high stoichiometric flow
rates in order to optimize their performance. A relatively high anode stoichiometry is
needed to prevent the CO2 gas clogging. At the cathode side excessive high humidity
effects are believed to induce GDL flooding at low air flow rates near stoichiometry.
Following suggestions of previous works [38, 180] an anode stoichiometry (for 150
mA/ cm2) between 15 and 40 and a cathode stoichiometry of around 6 were used.
In each section presented in the following parts of this chapter, due to the large amount
of tests performed and results obtained, a sub-set of conditions was selected and is
presented. The remaining results can be found in Appendix C.
Whenever is possible, and as already mentioned, the experimental results were
explained under the light of the developed model (Chapter 3).
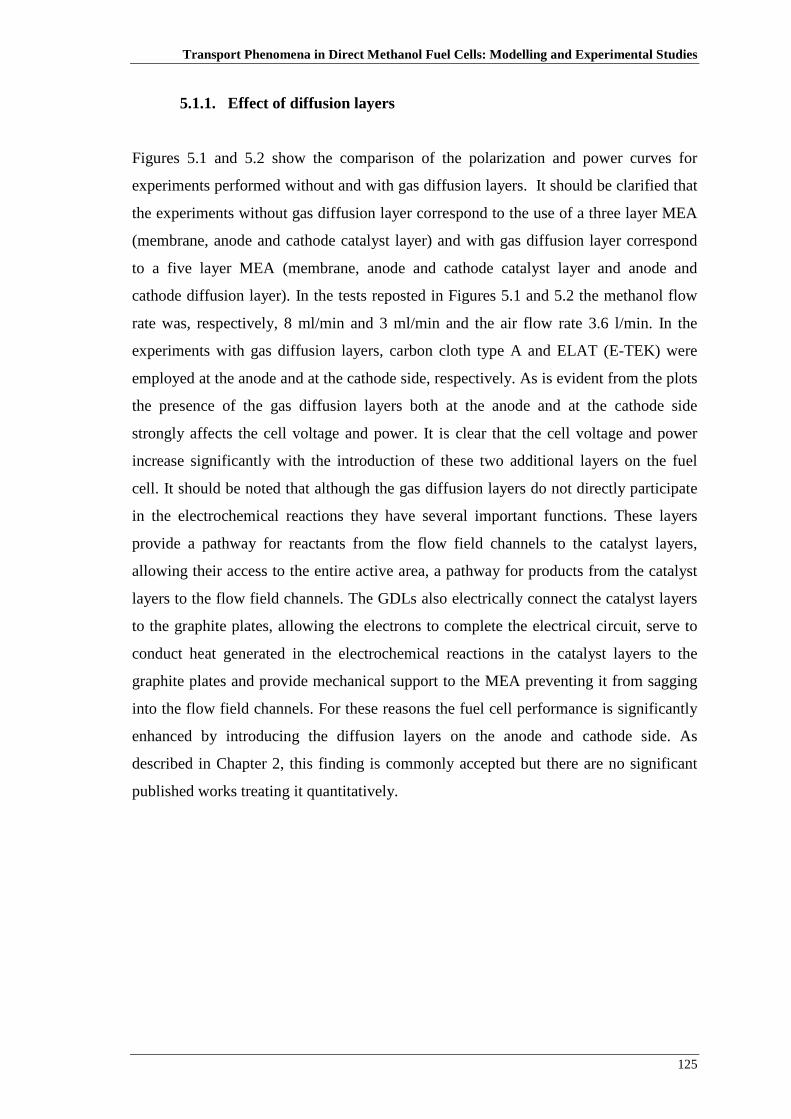
Transport Phenomena in Direct Methanol Fuel Cells: Modelling and Experimental Studies
125
5.1.1. Effect of diffusion layers
Figures 5.1 and 5.2 show the comparison of the polarization and power curves for
experiments performed without and with gas diffusion layers. It should be clarified that
the experiments without gas diffusion layer correspond to the use of a three layer MEA
(membrane, anode and cathode catalyst layer) and with gas diffusion layer correspond
to a five layer MEA (membrane, anode and cathode catalyst layer and anode and
cathode diffusion layer). In the tests reposted in Figures 5.1 and 5.2 the methanol flow
rate was, respectively, 8 ml/min and 3 ml/min and the air flow rate 3.6 l/min. In the
experiments with gas diffusion layers, carbon cloth type A and ELAT (E-TEK) were
employed at the anode and at the cathode side, respectively. As is evident from the plots
the presence of the gas diffusion layers both at the anode and at the cathode side
strongly affects the cell voltage and power. It is clear that the cell voltage and power
increase significantly with the introduction of these two additional layers on the fuel
cell. It should be noted that although the gas diffusion layers do not directly participate
in the electrochemical reactions they have several important functions. These layers
provide a pathway for reactants from the flow field channels to the catalyst layers,
allowing their access to the entire active area, a pathway for products from the catalyst
layers to the flow field channels. The GDLs also electrically connect the catalyst layers
to the graphite plates, allowing the electrons to complete the electrical circuit, serve to
conduct heat generated in the electrochemical reactions in the catalyst layers to the
graphite plates and provide mechanical support to the MEA preventing it from sagging
into the flow field channels. For these reasons the fuel cell performance is significantly
enhanced by introducing the diffusion layers on the anode and cathode side. As
described in Chapter 2, this finding is commonly accepted but there are no significant
published works treating it quantitatively.
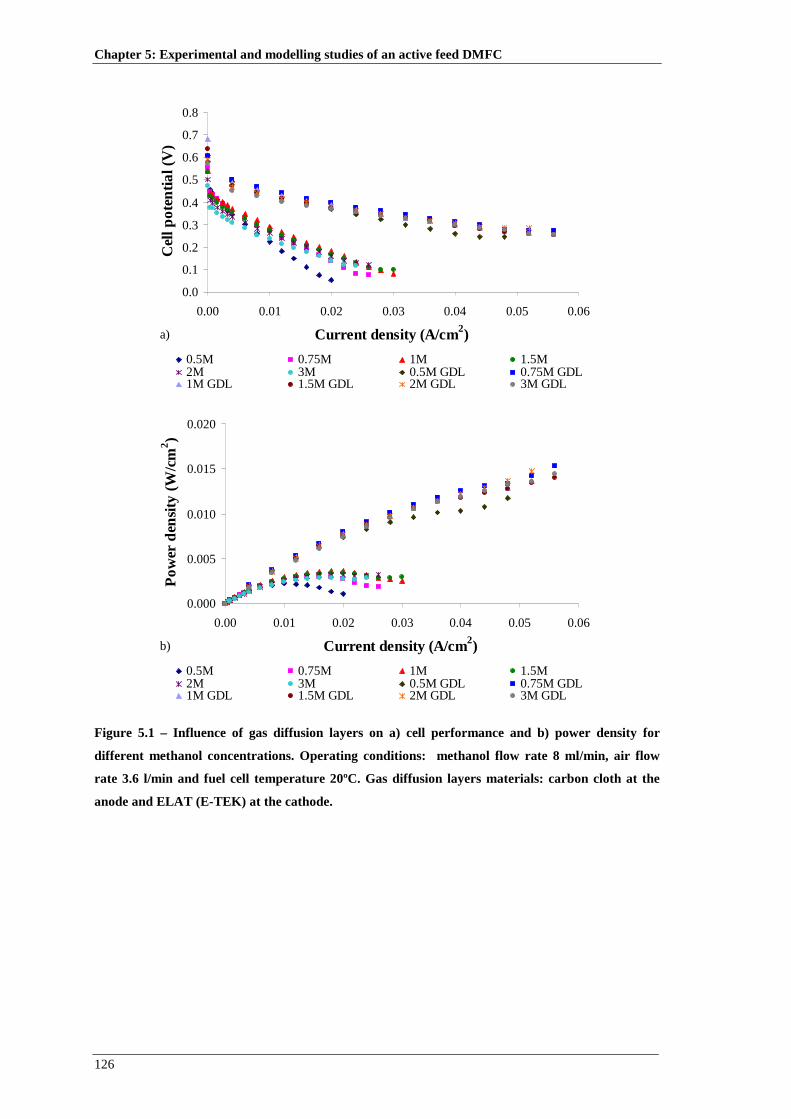
Chapter 5: Experimental and modelling studies of an active feed DMFC
126
0.0
0.1
0.2
0.3
0.4
0.5
0.6
0.7
0.8
0.00 0.01 0.02 0.03 0.04 0.05 0.06
Current density (A/cm2)
Cel
l po
ten
tial (
V)
0.5M 0.75M 1M 1.5M2M 3M 0.5M GDL 0.75M GDL1M GDL 1.5M GDL 2M GDL 3M GDL
a)
0.000
0.005
0.010
0.015
0.020
0.00 0.01 0.02 0.03 0.04 0.05 0.06
Current density (A/cm2)
Po
wer
den
sity
(W
/cm2 )
0.5M 0.75M 1M 1.5M2M 3M 0.5M GDL 0.75M GDL1M GDL 1.5M GDL 2M GDL 3M GDL
b)
Figure 5.1 – Influence of gas diffusion layers on a) cell performance and b) power density for
different methanol concentrations. Operating conditions: methanol flow rate 8 ml/min, air flow
rate 3.6 l/min and fuel cell temperature 20ºC. Gas diffusion layers materials: carbon cloth at the
anode and ELAT (E-TEK) at the cathode.
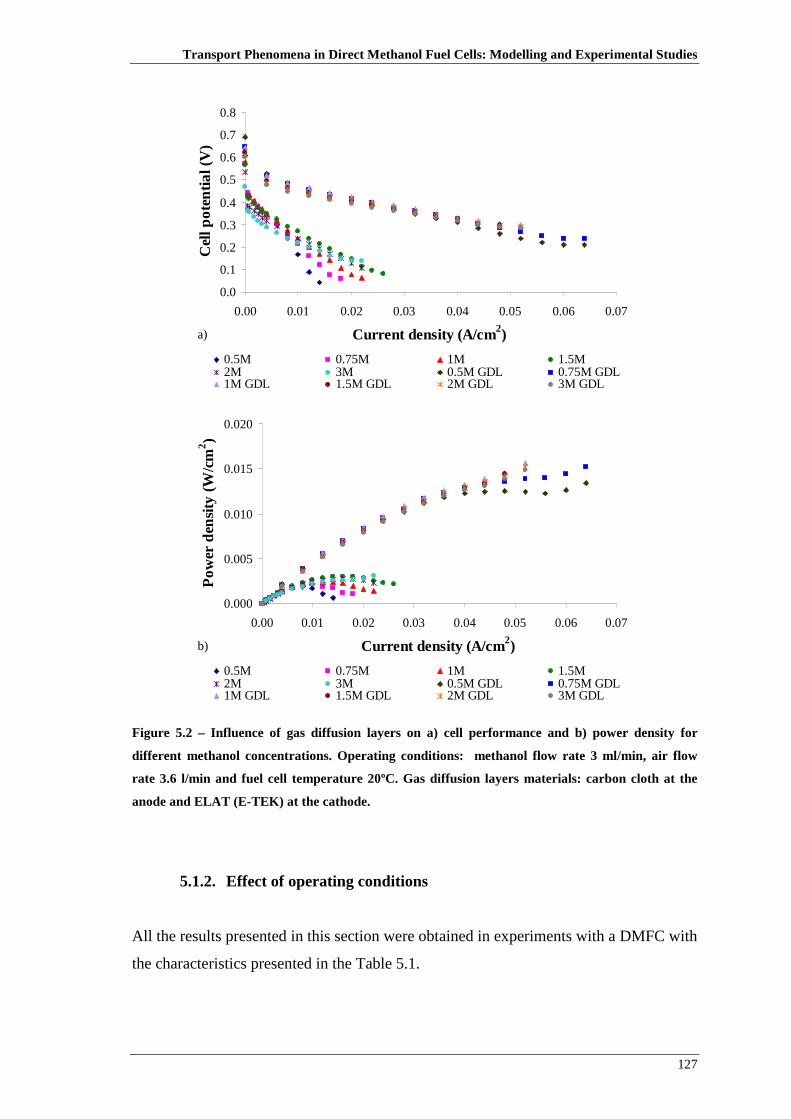
Transport Phenomena in Direct Methanol Fuel Cells: Modelling and Experimental Studies
127
0.0
0.1
0.2
0.3
0.4
0.5
0.6
0.7
0.8
0.00 0.01 0.02 0.03 0.04 0.05 0.06 0.07
Current density (A/cm2)
Cel
l po
ten
tial (
V)
0.5M 0.75M 1M 1.5M2M 3M 0.5M GDL 0.75M GDL1M GDL 1.5M GDL 2M GDL 3M GDL
a)
0.000
0.005
0.010
0.015
0.020
0.00 0.01 0.02 0.03 0.04 0.05 0.06 0.07
Current density (A/cm2)
Po
wer
den
sity
(W
/cm2 )
0.5M 0.75M 1M 1.5M2M 3M 0.5M GDL 0.75M GDL1M GDL 1.5M GDL 2M GDL 3M GDL
b)
Figure 5.2 – Influence of gas diffusion layers on a) cell performance and b) power density for
different methanol concentrations. Operating conditions: methanol flow rate 3 ml/min, air flow
rate 3.6 l/min and fuel cell temperature 20ºC. Gas diffusion layers materials: carbon cloth at the
anode and ELAT (E-TEK) at the cathode.
5.1.2. Effect of operating conditions
All the results presented in this section were obtained in experiments with a DMFC with
the characteristics presented in the Table 5.1.

Chapter 5: Experimental and modelling studies of an active feed DMFC
128
Table 5.1 – Set of DMFC characteristics used to analyse the effect of the operating conditions on the
cell performance.
Diffusion layer Anode Carbon cloth type A
Cathode ELAT (E-TEK)
Catalyst loading Anode 4 mg/cm2 Pt/Ru
Cathode 4 mg/cm2 Pt
Flow field design Anode Serpentine
Cathode Serpentine
Membrane Nafion 117
5.1.2.1. Effect of methanol concentration
The set of operating conditions selected to study the effect of the methanol
concentration on the fuel cell performance is displayed in Table 5.2
Table 5.2 – Set of operating conditions used to analyse the effect of methanol concentration on the
cell performance.
OHCHC3
(M) OHCHq3
(ml/min) qair (l/min) Cell temperature (ºC)
0.25
8 3.6 20
0.5 0.75
1 1.5 2 3
0.25
3 3.6 20
0.5 0.75
1 1.5 2 3 5
0.25
3 1 20
0.5 0.75
1 1.5 2 3
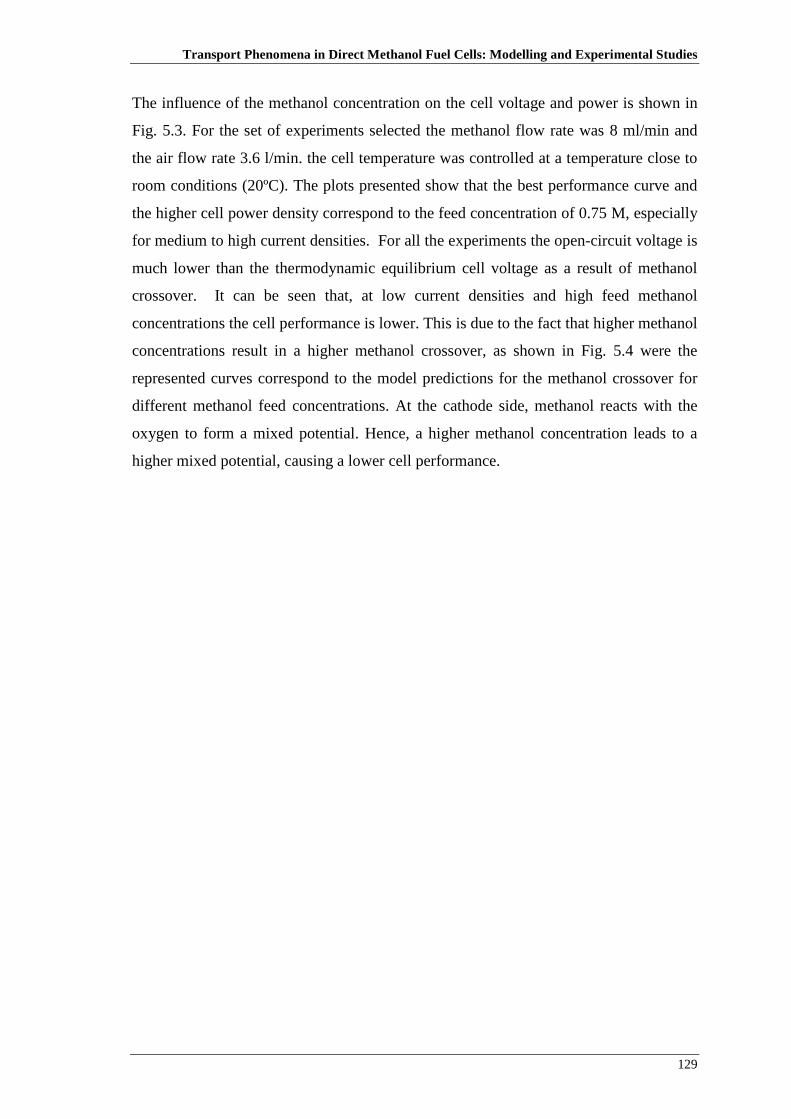
Transport Phenomena in Direct Methanol Fuel Cells: Modelling and Experimental Studies
129
The influence of the methanol concentration on the cell voltage and power is shown in
Fig. 5.3. For the set of experiments selected the methanol flow rate was 8 ml/min and
the air flow rate 3.6 l/min. the cell temperature was controlled at a temperature close to
room conditions (20ºC). The plots presented show that the best performance curve and
the higher cell power density correspond to the feed concentration of 0.75 M, especially
for medium to high current densities. For all the experiments the open-circuit voltage is
much lower than the thermodynamic equilibrium cell voltage as a result of methanol
crossover. It can be seen that, at low current densities and high feed methanol
concentrations the cell performance is lower. This is due to the fact that higher methanol
concentrations result in a higher methanol crossover, as shown in Fig. 5.4 were the
represented curves correspond to the model predictions for the methanol crossover for
different methanol feed concentrations. At the cathode side, methanol reacts with the
oxygen to form a mixed potential. Hence, a higher methanol concentration leads to a
higher mixed potential, causing a lower cell performance.

Chapter 5: Experimental and modelling studies of an active feed DMFC
130
0.0
0.1
0.2
0.3
0.4
0.5
0.6
0.7
0.8
0.00 0.01 0.02 0.03 0.04 0.05 0.06
Current density (A/cm2)
Cel
l po
ten
tial (
V)
0.25 M 0.5 M 0.75 M 1 M 1.5 M 2 M 3 M
a)
0.000
0.005
0.010
0.015
0.020
0.00 0.01 0.02 0.03 0.04 0.05 0.06
Current density (A/cm2)
Po
wer
den
sity
(W
/cm2 )
0.25 M 0.5 M 0.75 M 1 M 1.5 M 2 M 3 M
b)
Figure 5.3 – Effect of methanol concentration on a) cell performance and b) power density.
Operating conditions: methanol flow rate 8 ml/min, air flow rate 3.6 l/min and fuel cell temperature
20ºC.

Transport Phenomena in Direct Methanol Fuel Cells: Modelling and Experimental Studies
131
0.0E+00
1.0E-08
2.0E-08
3.0E-08
4.0E-08
5.0E-08
6.0E-08
7.0E-08
0.00 0.01 0.02 0.03 0.04 0.05 0.06
Current density (A/cm2)
Met
ha
no
l cro
sso
ver
(mo
l/s.c
m2 )
0.25 M 0.5 M 0.75 M 1 M 1.5 M 2 M 3 M
Figure 5.4 – Model predictions for the methanol crossover for different methanol feed
concentrations. Operating conditions: methanol flow rate 8 ml/min, air flow rate 3.6 l/min and fuel
cell temperature 20ºC.
The developed model is also used to predict the polarization and power curves for two
different methanol feed concentration (0.75M and 2M), as presented in Fig. 5.5 together
with the experimental data. As is evident from the plots, the model describes very well
the experimental results for low current densities due to the integration, on the model, of
the mass transfer effects at the cathode side. The most significant discrepancies between
the two curves are for conditions near the limiting current densities due to the fact that
the model neglects two-phase flow effects. These effects are more important in these
conditions.
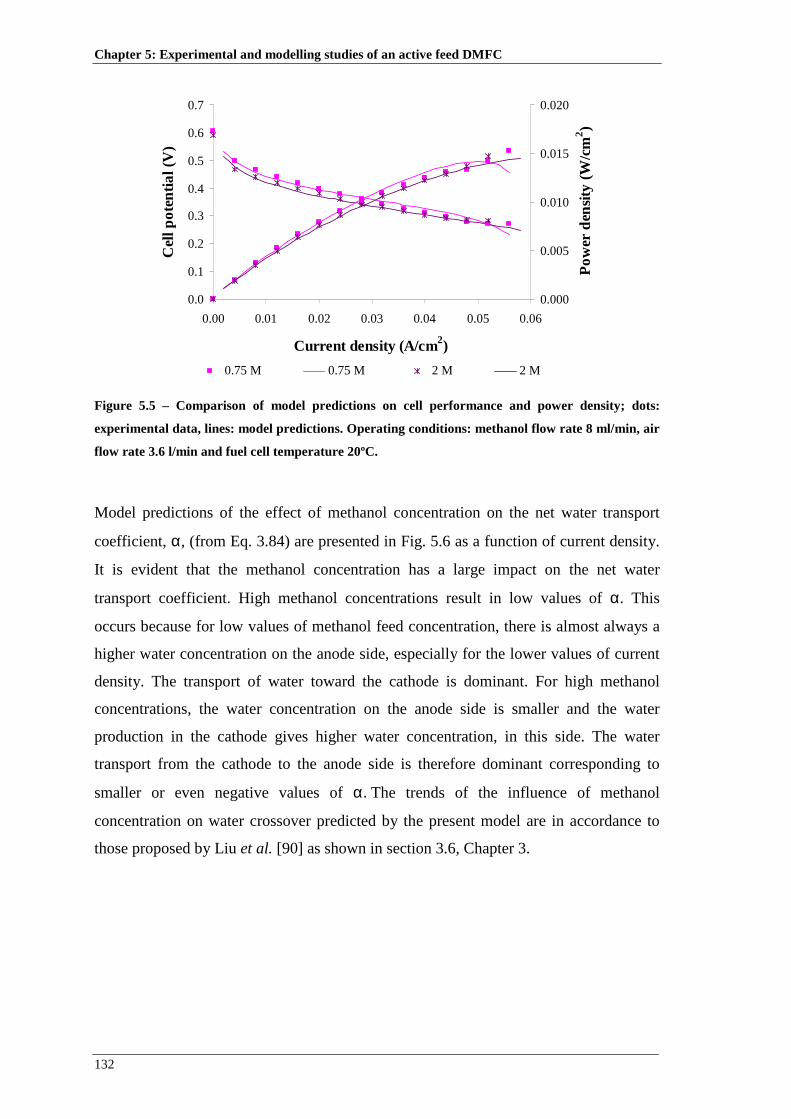
Chapter 5: Experimental and modelling studies of an active feed DMFC
132
0.0
0.1
0.2
0.3
0.4
0.5
0.6
0.7
0.00 0.01 0.02 0.03 0.04 0.05 0.06
Current density (A/cm2)
Cel
l po
tent
ial (
V)
0.000
0.005
0.010
0.015
0.020
Po
wer
den
sity
(W
/cm2 )
0.75 M 0.75 M 2 M 2 M
Figure 5.5 – Comparison of model predictions on cell performance and power density; dots:
experimental data, lines: model predictions. Operating conditions: methanol flow rate 8 ml/min, air
flow rate 3.6 l/min and fuel cell temperature 20ºC.
Model predictions of the effect of methanol concentration on the net water transport
coefficient, α, (from Eq. 3.84) are presented in Fig. 5.6 as a function of current density.
It is evident that the methanol concentration has a large impact on the net water
transport coefficient. High methanol concentrations result in low values of α. This
occurs because for low values of methanol feed concentration, there is almost always a
higher water concentration on the anode side, especially for the lower values of current
density. The transport of water toward the cathode is dominant. For high methanol
concentrations, the water concentration on the anode side is smaller and the water
production in the cathode gives higher water concentration, in this side. The water
transport from the cathode to the anode side is therefore dominant corresponding to
smaller or even negative values of α. The trends of the influence of methanol
concentration on water crossover predicted by the present model are in accordance to
those proposed by Liu et al. [90] as shown in section 3.6, Chapter 3.
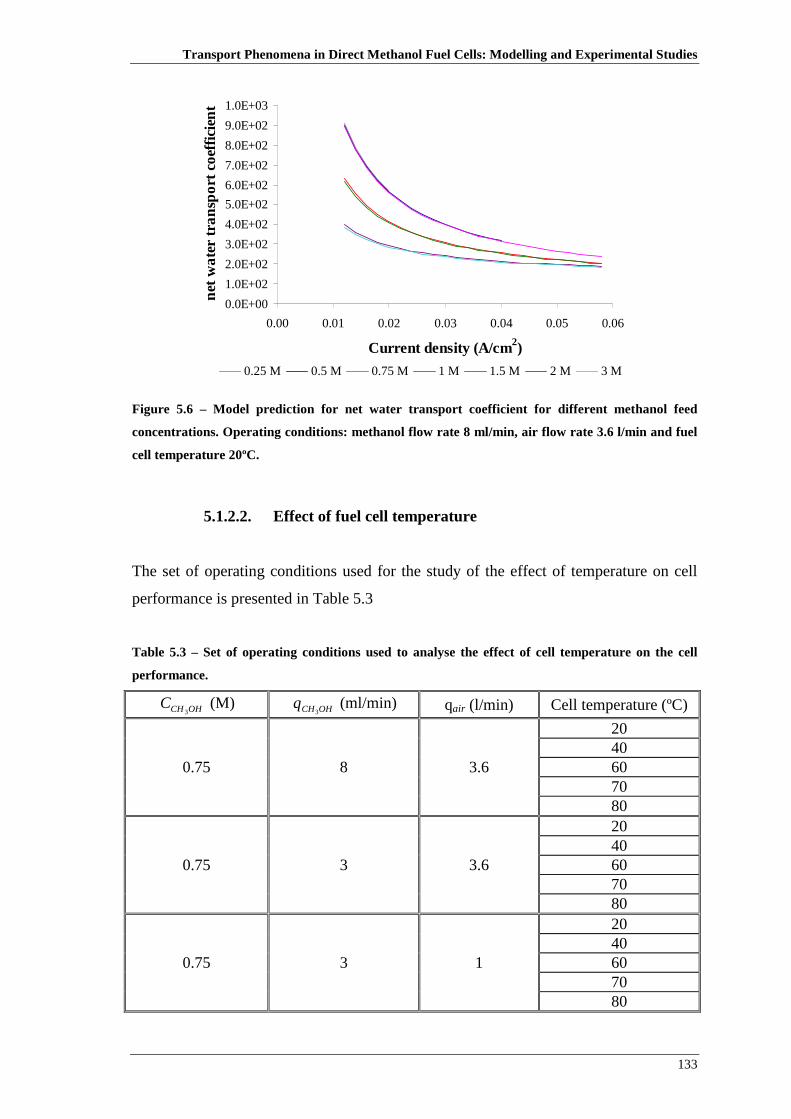
Transport Phenomena in Direct Methanol Fuel Cells: Modelling and Experimental Studies
133
0.0E+00
1.0E+02
2.0E+02
3.0E+02
4.0E+02
5.0E+02
6.0E+02
7.0E+02
8.0E+02
9.0E+02
1.0E+03
0.00 0.01 0.02 0.03 0.04 0.05 0.06
Current density (A/cm2)
net
wa
ter
tran
spo
rt co
effic
ien
t
0.25 M 0.5 M 0.75 M 1 M 1.5 M 2 M 3 M
Figure 5.6 – Model prediction for net water transport coefficient for different methanol feed
concentrations. Operating conditions: methanol flow rate 8 ml/min, air flow rate 3.6 l/min and fuel
cell temperature 20ºC.
5.1.2.2. Effect of fuel cell temperature
The set of operating conditions used for the study of the effect of temperature on cell
performance is presented in Table 5.3
Table 5.3 – Set of operating conditions used to analyse the effect of cell temperature on the cell
performance.
OHCHC3
(M) OHCHq3
(ml/min) qair (l/min) Cell temperature (ºC)
0.75 8 3.6
20 40 60 70 80
0.75 3 3.6
20 40 60 70 80
0.75 3 1
20 40 60 70 80

Chapter 5: Experimental and modelling studies of an active feed DMFC
134
The polarization and power density curves are plotted in Figures 5.7 a) and b) for a
methanol feed concentration of 0.75M a methanol flow rate of 8 ml/min, an air flow rate
of 3.6 l/min for different temperatures.
The maximum temperature used was 80ºC, since the operation of a DMFC with
temperatures close to the boiling temperature of the methanol solution decreases the
methanol concentration and consequently the fuel cell performance due to the formation
of methanol vapour bubbles obstructing the fuel pathway.
As can be seen from the plots the fuel cell performance and power density increases
with increasing temperature, due to an enhancement of the electrochemical kinetics on
the anode and cathode side. The open circuit voltage also increases with temperature
according to the Arrhenius relation due to a reduction in the activation overvoltage.
According to equations (2.21) and (2.22) presented in section 2.3.3, an enhanced
electrochemical kinetics of the methanol oxidation and oxygen reduction leads to a
decrease of the anode and cathode overpotential, as can be confirmed by the model
predictions in, respectively, Fig. 5.8 and Fig. 5.9. A decrease on the anode and cathode
overpotential leads to an increase of the fuel cell performance and power.
However, increasing the fuel cell temperature can have negative impacts on the cell
performance, due to an increase on the methanol crossover as put in evidence in Fig.
5.10. Higher temperatures generate, also, an increase on the water crossover as shown
by the model predictions in Fig. 5.11. The additional water on the cathode side increases
the liquid water fraction in both the cathode catalyst and diffusion layer, causing an
increase in the concentration polarization. The membrane stability also decreases with
an increase of fuel cell temperature and the oxygen partial pressure decreases with an
increase of fuel cell temperature, due to an increase of water vapour partial pressure,
which causes both decreases in open cell potential and increases the concentration
overpotential.
The effect of temperature on fuel cell performance is the result of both positive effects
on kinetics and the combined negative effects. According to Fig. 5.7 for the set of
operating conditions studied, the positive effect on the kinetics is more significant that
the referred negative effects of temperature. It should be mentioned that for other set of
cooperating conditions the results may be different, since the negative effects of
temperature could be dominant leading to a decrease of fuel cell performance with an
increase on fuel cell temperature.
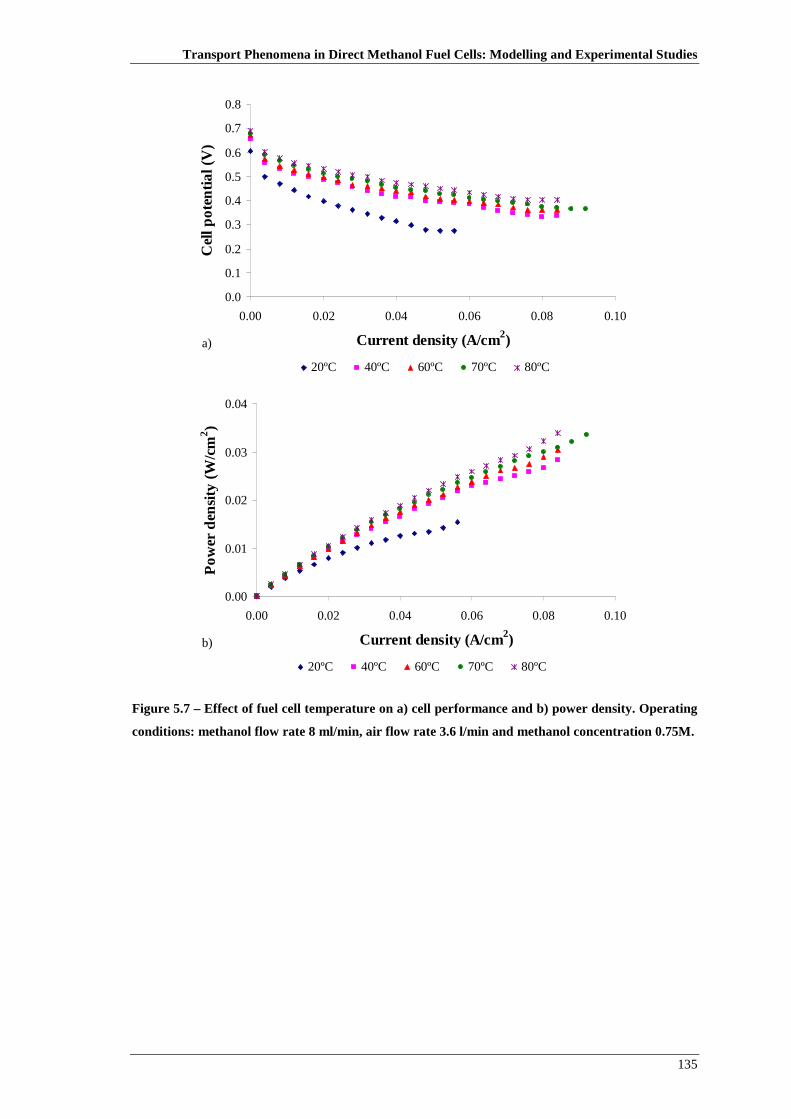
Transport Phenomena in Direct Methanol Fuel Cells: Modelling and Experimental Studies
135
0.0
0.1
0.2
0.3
0.4
0.5
0.6
0.7
0.8
0.00 0.02 0.04 0.06 0.08 0.10
Current density (A/cm2)
Cel
l po
ten
tial (
V)
20ºC 40ºC 60ºC 70ºC 80ºC
a)
0.00
0.01
0.02
0.03
0.04
0.00 0.02 0.04 0.06 0.08 0.10
Current density (A/cm2)
Po
wer
den
sity
(W
/cm2 )
20ºC 40ºC 60ºC 70ºC 80ºC
b)
Figure 5.7 – Effect of fuel cell temperature on a) cell performance and b) power density. Operating
conditions: methanol flow rate 8 ml/min, air flow rate 3.6 l/min and methanol concentration 0.75M.

Chapter 5: Experimental and modelling studies of an active feed DMFC
136
0.0
0.1
0.2
0.3
0.4
0.5
0.6
0.7
0.00 0.01 0.02 0.03 0.04 0.05 0.06
Current density (A/cm2)
an
od
e ov
erp
ote
ntia
l ( ηη ηηA)
20ºC 40ºC 60ºC 70ºC 80ºC
Figure 5.8 – Model predictions for the anode overpotential for different fuel cell temperatures.
Operating conditions: methanol flow rate 8 ml/min, air flow rate 3.6 l/min and methanol
concentration 0.75M.
0.28
0.30
0.32
0.34
0.36
0.00 0.01 0.02 0.03 0.04 0.05 0.06
Current density (A/cm2)
cath
od
e o
verp
ote
ntia
l ( ηη ηηC)
20ºC 40ºC 60ºC 70ºC 80ºC
Figure 5.9 – Model predictions for the cathode overpotential for different fuel cell temperatures.
Operating conditions: methanol flow rate 8 ml/min, air flow rate 3.6 l/min and methanol
concentration 0.75M.
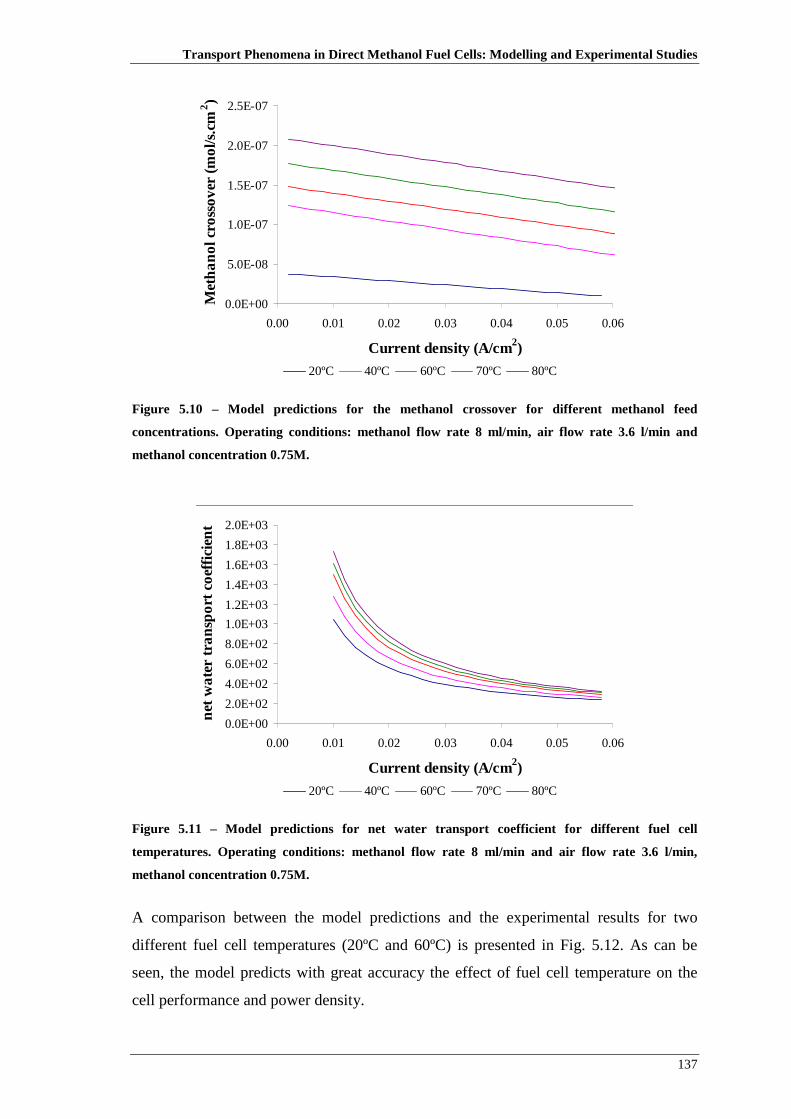
Transport Phenomena in Direct Methanol Fuel Cells: Modelling and Experimental Studies
137
0.0E+00
5.0E-08
1.0E-07
1.5E-07
2.0E-07
2.5E-07
0.00 0.01 0.02 0.03 0.04 0.05 0.06
Current density (A/cm2)
Met
ha
no
l cro
sso
ver
(mo
l/s.c
m2 )
20ºC 40ºC 60ºC 70ºC 80ºC
Figure 5.10 – Model predictions for the methanol crossover for different methanol feed
concentrations. Operating conditions: methanol flow rate 8 ml/min, air flow rate 3.6 l/min and
methanol concentration 0.75M.
0.0E+00
2.0E+02
4.0E+02
6.0E+02
8.0E+02
1.0E+03
1.2E+03
1.4E+03
1.6E+03
1.8E+03
2.0E+03
0.00 0.01 0.02 0.03 0.04 0.05 0.06
Current density (A/cm2)
net
wa
ter
tran
spo
rt co
effic
ien
t
20ºC 40ºC 60ºC 70ºC 80ºC
Figure 5.11 – Model predictions for net water transport coefficient for different fuel cell
temperatures. Operating conditions: methanol flow rate 8 ml/min and air flow rate 3.6 l/min,
methanol concentration 0.75M.
A comparison between the model predictions and the experimental results for two
different fuel cell temperatures (20ºC and 60ºC) is presented in Fig. 5.12. As can be
seen, the model predicts with great accuracy the effect of fuel cell temperature on the
cell performance and power density.
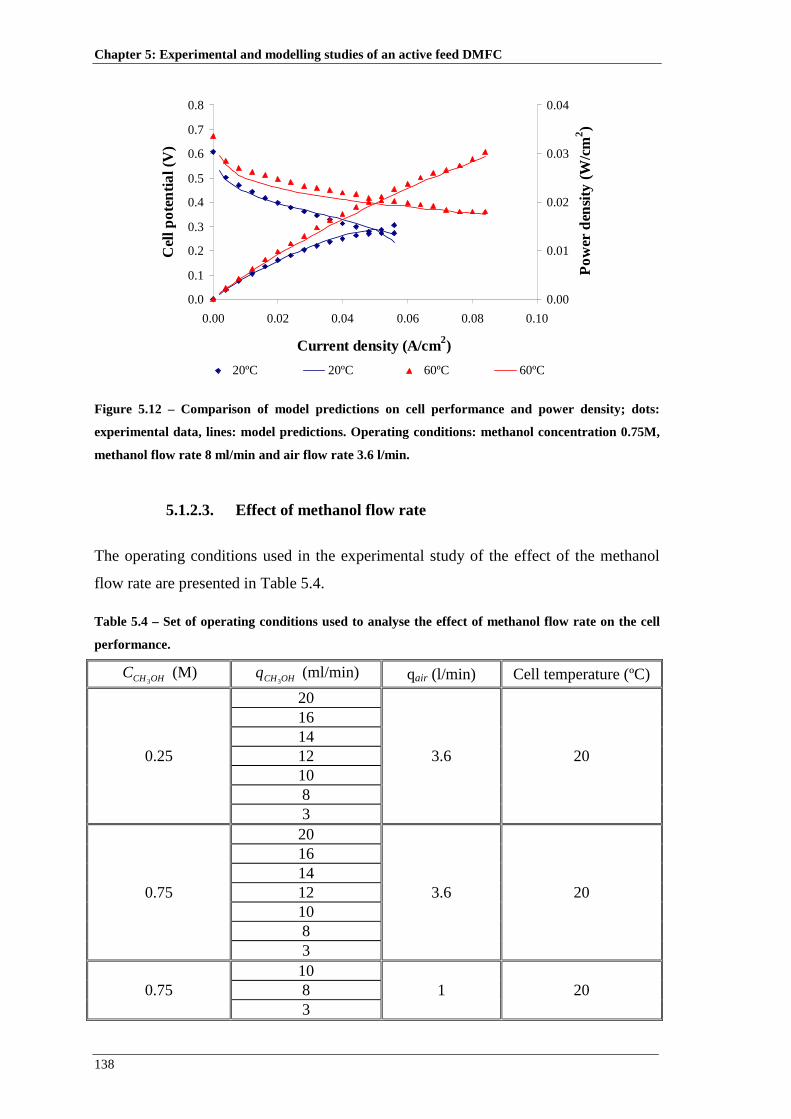
Chapter 5: Experimental and modelling studies of an active feed DMFC
138
0.0
0.1
0.2
0.3
0.4
0.5
0.6
0.7
0.8
0.00 0.02 0.04 0.06 0.08 0.10
Current density (A/cm2)
Cel
l po
ten
tial (
V)
0.00
0.01
0.02
0.03
0.04
Po
wer
den
sity
(W
/cm2 )
20ºC 20ºC 60ºC 60ºC
Figure 5.12 – Comparison of model predictions on cell performance and power density; dots:
experimental data, lines: model predictions. Operating conditions: methanol concentration 0.75M,
methanol flow rate 8 ml/min and air flow rate 3.6 l/min.
5.1.2.3. Effect of methanol flow rate
The operating conditions used in the experimental study of the effect of the methanol
flow rate are presented in Table 5.4.
Table 5.4 – Set of operating conditions used to analyse the effect of methanol flow rate on the cell
performance.
OHCHC3
(M) OHCHq3
(ml/min) qair (l/min) Cell temperature (ºC)
0.25
20
3.6 20
16 14 12 10 8 3
0.75
20
3.6 20
16 14 12 10 8 3
0.75 10
1 20 8 3

Transport Phenomena in Direct Methanol Fuel Cells: Modelling and Experimental Studies
139
Figure 5.13 shows the results of a sub-set of experiments for different anode flow rates,
using a methanol concentration of 0.75 M and an air flow rate of 3.6 l/min. As can be
seen from the plots, the cell voltage and power slightly increase with the anode feed
flow rate. For this set of operation conditions, higher methanol flow rates lead to a high
methanol concentration along the flow channels and consequently high methanol
concentration in the catalyst layer, facilitating the anode reactivity. Also, higher flow
rates are more efficient in carbon dioxide bubbles removal at the anode side [180],
leading the pathway free for the fuel and consequently more fuel reaches the anode
catalyst layer.
0.0
0.1
0.2
0.3
0.4
0.5
0.6
0.7
0.8
0.00 0.01 0.02 0.03 0.04 0.05 0.06 0.07
Curren density (A/cm2)
Cel
l po
ten
tial (
V)
20 ml/min 16 ml/min 14 ml/min 12 ml/min 10 ml/min 8 ml/min 3 ml/min
a)
0.000
0.005
0.010
0.015
0.020
0.00 0.01 0.02 0.03 0.04 0.05 0.06 0.07
Curren density (A/cm2)
Po
wer
den
sity
(W
/cm2 )
20 ml/min 16 ml/min 14 ml/min 12 ml/min 10 ml/min 8 ml/min 3 ml/min
b)
Figure 5.13 – Effect of methanol flow rate on a) cell performance and b) power density. Operating
conditions: methanol concentration 0.75M, fuel cell temperature 20ºC and air flow rate 3.6 l/min.

Chapter 5: Experimental and modelling studies of an active feed DMFC
140
The model predictions of the methanol concentration profiles in the anode catalyst layer
are presented in Fig. 5.14 for the same set of experiments (corresponding to a current
density of 0.03 A/cm2). The curves represented in the figure show that higher methanol
flow rates lead to a high methanol concentration in the catalyst layer. These predicted
methanol concentration profiles explain the relative position of the curves represented in
Fig. 5.13.
0.255
0.260
0.265
0.270
0.275
0.280
0.285
0.290
0.295
0.0000 0.0005 0.0010 0.0015 0.0020 0.0025
x (cm)
Met
ha
no
l co
nce
ntra
tion
(M
)
20 ml/min 16 ml/min 14 ml/min 12 ml/min10 ml/min 8 ml/min 3 ml/min
Figure 5.14 – Predicted methanol concentration profiles in the anode catalyst layer (thickness
0.0023 cm) for different methanol flow rates. Operating conditions: methanol concentration 0.75M,
air flow rate 3.6 l/min and a current density of 0.03 A/cm2.
Model predictions of the methanol crossover for the different values of methanol flow
rate are presented in Fig. 5.15 as a function of current density. As can be seen, higher
methanol flow rates result in higher values of methanol concentration on the cathode
catalyst layer and slightly higher methanol crossover rates. However, for the range of
flow rates studies, the impact on the methanol crossover is not significant.
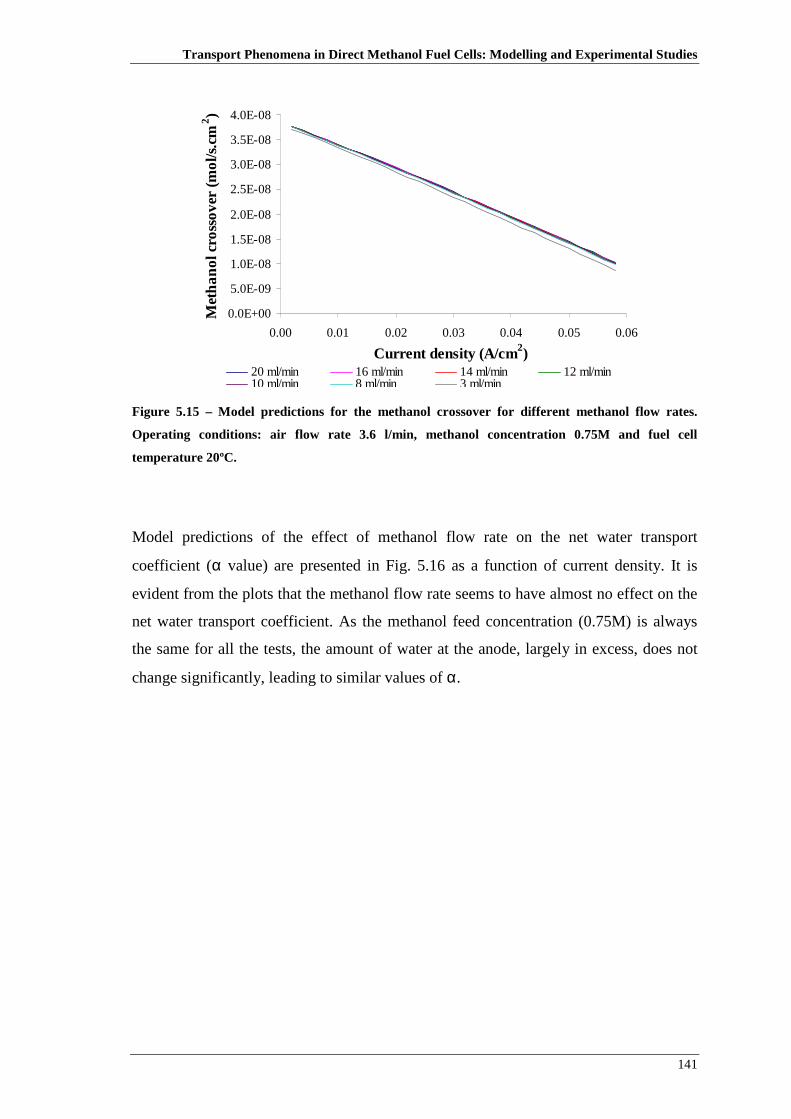
Transport Phenomena in Direct Methanol Fuel Cells: Modelling and Experimental Studies
141
0.0E+00
5.0E-09
1.0E-08
1.5E-08
2.0E-08
2.5E-08
3.0E-08
3.5E-08
4.0E-08
0.00 0.01 0.02 0.03 0.04 0.05 0.06
Current density (A/cm2)
Met
ha
no
l cro
sso
ver
(mo
l/s.c
m2 )
20 ml/min 16 ml/min 14 ml/min 12 ml/min10 ml/min 8 ml/min 3 ml/min
Figure 5.15 – Model predictions for the methanol crossover for different methanol flow rates.
Operating conditions: air flow rate 3.6 l/min, methanol concentration 0.75M and fuel cell
temperature 20ºC.
Model predictions of the effect of methanol flow rate on the net water transport
coefficient (α value) are presented in Fig. 5.16 as a function of current density. It is
evident from the plots that the methanol flow rate seems to have almost no effect on the
net water transport coefficient. As the methanol feed concentration (0.75M) is always
the same for all the tests, the amount of water at the anode, largely in excess, does not
change significantly, leading to similar values of α.
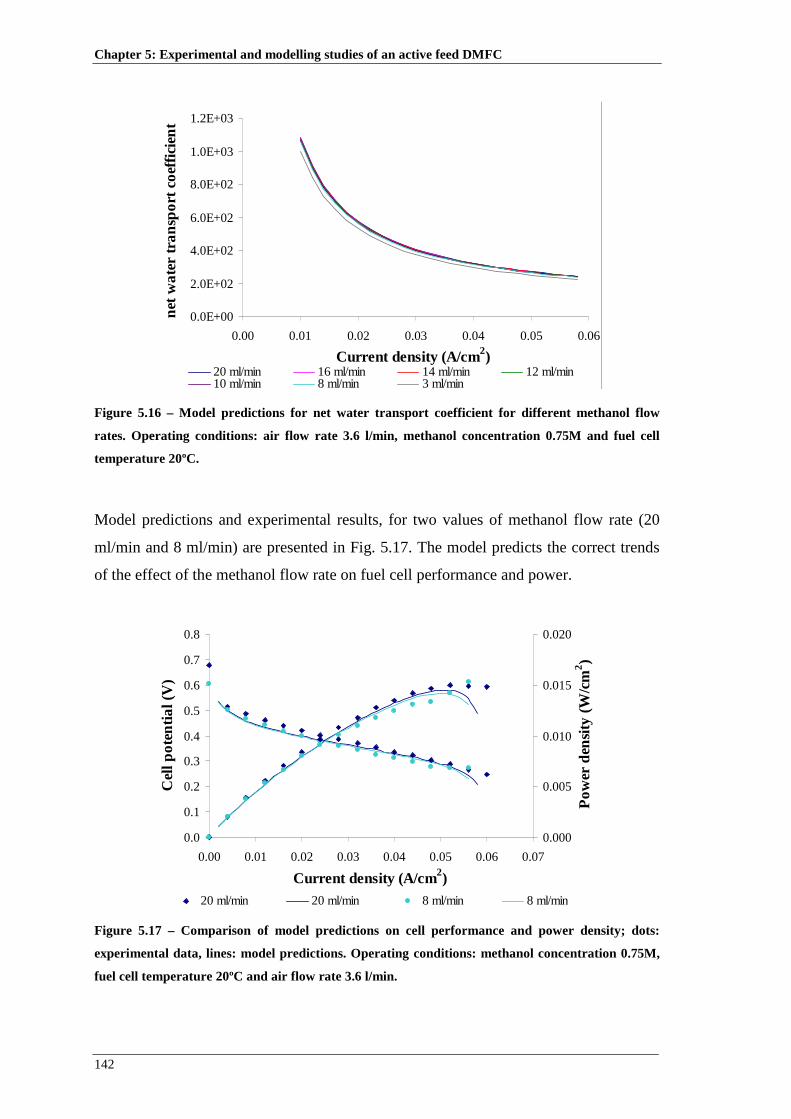
Chapter 5: Experimental and modelling studies of an active feed DMFC
142
0.0E+00
2.0E+02
4.0E+02
6.0E+02
8.0E+02
1.0E+03
1.2E+03
0.00 0.01 0.02 0.03 0.04 0.05 0.06
Current density (A/cm2)
net
wa
ter
tran
spo
rt co
effic
ien
t
20 ml/min 16 ml/min 14 ml/min 12 ml/min10 ml/min 8 ml/min 3 ml/min
Figure 5.16 – Model predictions for net water transport coefficient for different methanol flow
rates. Operating conditions: air flow rate 3.6 l/min, methanol concentration 0.75M and fuel cell
temperature 20ºC.
Model predictions and experimental results, for two values of methanol flow rate (20
ml/min and 8 ml/min) are presented in Fig. 5.17. The model predicts the correct trends
of the effect of the methanol flow rate on fuel cell performance and power.
0.0
0.1
0.2
0.3
0.4
0.5
0.6
0.7
0.8
0.00 0.01 0.02 0.03 0.04 0.05 0.06 0.07
Current density (A/cm2)
Cel
l po
ten
tial (
V)
0.000
0.005
0.010
0.015
0.020
Po
wer
den
sity
(W
/cm2 )
20 ml/min 20 ml/min 8 ml/min 8 ml/min Figure 5.17 – Comparison of model predictions on cell performance and power density; dots:
experimental data, lines: model predictions. Operating conditions: methanol concentration 0.75M,
fuel cell temperature 20ºC and air flow rate 3.6 l/min.

Transport Phenomena in Direct Methanol Fuel Cells: Modelling and Experimental Studies
143
5.1.2.4. Effect of air flow rate
The operating conditions used in the experimental study to evaluate the effect of the air
flow rate on fuel cell performance presented are in Table 5.5.
Table 5.5 – Set of operating conditions used to analyse the effect of air flow rate on the cell
performance.
OHCHC3
(M) OHCHq3
(ml/min) qair (l/min) Cell temperature (ºC)
0.25 8
3.6
20 2 1
0.75 0.5
0.75 8
3.6
20 2
1.5 1
0.75 3
3.6
20 2 1
0.75 0.5
The plots in Fig. 5.18 show the effect of the air flow rate on the cell performance and
power density. The experiments correspond to a methanol concentration of 0.75 M and
a methanol flow rate of 8 ml/min. For the set of air flow rates studied, it seems that the
cell performance and cell power slightly increase with an increase of the air flow rate.
When the cell is operating under lower air flow rate the oxygen concentration decreases
along the cathode flow channels resulting in lower cell voltage and power. Higher air
flow rates also lead to a more efficient water droplets removal on the cathode side and
consequently a higher oxygen concentration on the cathode catalyst layer. When large
amounts of droplets are presented on the cathode side, they may obstruct the oxygen
molecules to reach the catalyst layer, reducing the oxygen concentration and the fuel
cell performance and power. When the air flow rate is high enough, any further increase
will only slightly change the oxygen concentration profile, with a negligible effect on
the cell performance.

Chapter 5: Experimental and modelling studies of an active feed DMFC
144
0.0
0.1
0.2
0.3
0.4
0.5
0.6
0.7
0.8
0.00 0.01 0.02 0.03 0.04 0.05 0.06
Current density (A/cm2)
Cel
l po
ten
tial (
V)
3.6 l/min 2 l/min 1.5 l/min 1 l/min
a)
0.000
0.005
0.010
0.015
0.020
0.00 0.01 0.02 0.03 0.04 0.05 0.06
Current density (A/cm2)
Po
wer
den
sity
(W
/cm2 )
3.6 l/min 2 l/min 1.5 l/min 1 l/min
b)
Figure 5.18 – Effect of air flow rate on a) cell performance and b) power density. Operating
conditions: methanol concentration 0.75M, fuel cell temperature 20ºC, methanol flow rate 8
ml/min.
The model predictions of the oxygen concentration profile in the cathode diffusion layer
are presented in Fig. 5.19 for the same set experiments (corresponding to a current
density of 0.03 A/cm2). As can be seen, from the plotted curves, the higher air flow
rates lead to a slightly higher oxygen concentration in the catalyst layer, leading to
slightly better performance.

Transport Phenomena in Direct Methanol Fuel Cells: Modelling and Experimental Studies
145
0.0E+00
2.1E-03
4.2E-03
6.3E-03
8.4E-03
0.0000 0.0005 0.0010 0.0015 0.0020 0.0025
x (cm)
Oxy
gen
co
nce
ntra
tion
(M
)
3.6 l/min 2 l/min 1.5 l/min 1 l/min Figure 5.19 – Predicted oxygen concentration profile in the cathode catalyst layer (thickness 0.0023
cm) for different air flow rates. Operating conditions: methanol concentration 0.75M, methanol
flow rate 8 ml/min a current density of 0.03 A/cm2.
Model predictions of the effect of air flow rate on the net water transport coefficient (α
value) are presented in Fig. 5.20 as a function of current density. An increase of the air
flow rate leads to an increase of the values of the net water transport coefficient. Higher
air flow rates remove higher quantities of water produced at the cathode decreasing the
water concentration and contributing to an increase of the water gradient across the
membrane. In this way, due to the water diffusion mechanism, more water is
transported form the anode to the cathode side.

Chapter 5: Experimental and modelling studies of an active feed DMFC
146
0.0E+00
2.0E+02
4.0E+02
6.0E+02
8.0E+02
1.0E+03
1.2E+03
0.00 0.01 0.02 0.03 0.04 0.05 0.06
Current density (A/cm2)
net
wa
ter
tran
spo
rt co
effic
ien
t
3.6 l/min 2 l/min 1.5 l/min 1 l/min Figure 5.20 – Model prediction for net water transport coefficient for different air flow rates.
Operating conditions: methanol flow rate 8 ml/min, methanol concentration 0.75M and fuel cell
temperature 20ºC.
Model predictions and experimental results, for two values of air flow rate (3.6 l/min
and 1 l/min) are presented in Fig. 5.21, showing that the model predicts the correct
trends of the effect of the air flow rate on fuel cell performance and power.
0.0
0.1
0.2
0.3
0.4
0.5
0.6
0.7
0.00 0.01 0.02 0.03 0.04 0.05 0.06
Current density (A/cm2)
Cel
l po
ten
tial (
V)
0.000
0.005
0.010
0.015
0.020
Po
wer
den
sity
(W
/cm2 )
3.6 l/min 3.6 l/min 1 l/min 1 l/min Figure 5.21 – Comparison of model predictions on cell performance and power density; dots:
experimental data, lines: model predictions. Operating conditions: methanol concentration 0.75M,
fuel cell temperature 20ºC and methanol flow rate 8 ml/min.

Transport Phenomena in Direct Methanol Fuel Cells: Modelling and Experimental Studies
147
5.1.3. Effect of design parameters
A systematic study to elucidate the effect of design parameters such as diffusion layer
material and thickness, catalyst loading, membrane thickness and anode and cathode
flow field design on the performance of a DMFC, is presented. The set of operating
conditions used is summarized in Table 5.6.
Table 5.6 – Set of operating conditions used to analyse the effect of design parameters on the cell
performance.
OHCHC3
(M) OHCHq3
(ml/min) qair (l/min) Cell temperature (ºC)
0.75
20 3.6
20
8 3.6
8 1
3 3.6
8 3.6
60
3 3.6
3 1
2
8 3.6
20 3 3.6
3 1
5 3 3.6 20
5.1.3.1. Effect of anode diffusion layer material
The set of conditions displayed on Table 5.6 was used in the experiments performed to
study the impact of the anode diffusion layer on the cell performance. As in the
previous sections a sub-set of tests was selected.
Several material and design parameters of the anode diffusion layer affect the fuel cell
performance: i) layer thickness; ii) the tortuosity, which influences the species transport
and iii) the surface properties, the wettability and roughness, controlling the
droplet/bubble attachment or coverage on the diffusion layer surface. Differences in
porosity, permeability, pore size distribution, surface wettability and liquid retention of
the two diffusion media result in different two-phase flow and transport characteristics.

Chapter 5: Experimental and modelling studies of an active feed DMFC
148
As already referred, the two types of gas diffusion layers commonly used as anode
diffusion layer in DMFCs are carbon cloth and carbon paper. Carbon paper has a
microscopically complex fibrous structure with pore size distribution ranging from a
few microns to tens of microns with a large fraction of blocked passages. Carbon cloth,
in other hand, is a woven structure and is generally coarser than carbon paper. Carbon
cloth is more porous and less tortuous than carbon paper [177, 178].
Some structural properties of the diffusion layers materials used are presented in Table
5.7. As can be seen carbon cloth is more porous, less tortuous and thicker than carbon
paper [177, 178]. The ELAT material formed of carbon cloth type A treated on one side
is less porous, thicker and more tortuous that carbon cloth.
Table 5.7 – Structural characteristics of the common materials used as gas diffusion layers [177,
178].
Material Porosity Tortuosity Thickness (cm)
Carbon cloth (type A) 0.83 1.11 0.035
Carbon paper (TGPH060) 0.78 2.75 0.019
Single-side ELAT 0.80 1.5 0.040
The flow fields used was the serpentine design in both sides of the fuel cell. The
membrane used was Nafion 117 and Nafion 212 (DuPont) the catalyst was Pt/Ru on the
anode side with a loading of 4 mg/cm2 and Pt on the cathode side with a loading of 4
mg/cm2. The anode gas diffusion layers used were carbon cloth type A (CC) from E-
TEK or carbon paper TGPH060 (CP) from Toray both with a PTFE content of 30 wt.%.
The influence of the anode gas diffusion layer material on the cell performance for three
different methanol flow rates (20 ml/min, 8 ml/min and 3 ml/min) is shown in Fig. 5.22.
The methanol feed concentration used was 0.75M, the air flow rate 3.6 l/min and the
fuel cell temperature 20ºC.
On the anode side, gaseous carbon dioxide is produced by the anode reaction and must
be removed from the diffusion layer by the anode flow. If the carbon dioxide bubbles
cannot be removed from the catalyst surface they cover the surface decreasing therefore
the effective mass transfer area.
As can be seen from Fig. 5.22, for the set of conditions studied the cell performance and
power curves are enhanced using the carbon cloth as the anode diffusion layer. Since

Transport Phenomena in Direct Methanol Fuel Cells: Modelling and Experimental Studies
149
carbon cloth has a pore structure with a low tortuosity and a rough textural surface,
bubbles tend to detach from the surface maintaining the area for reactant diffusion
relatively free from bubbles [33, 34]. The texture of the carbon paper surface with a
highly tortuous structure enhances the interactions between the bubbles and the solid.
Hence the gas remains attached to the surface leading to a blockage of the flow channels
and lowering the methanol concentration at the catalyst layer (see Fig. 5.23).
0.0
0.1
0.2
0.3
0.4
0.5
0.6
0.7
0.8
0.9
0.00 0.01 0.02 0.03 0.04 0.05 0.06 0.07 0.08
Current density (A/cm2)
Cel
l po
ten
tial (
V)
20 ml/min; CP 20 ml/min; CC 8 ml/min; CP8 ml/min; CC 3 ml/min; CP 3 ml/min; CC
a)
0.000
0.005
0.010
0.015
0.020
0.00 0.01 0.02 0.03 0.04 0.05 0.06 0.07 0.08
Current density (A/cm2)
Po
wer
den
sity
(W
/cm2 )
20 ml/min; CP 20 ml/min; CC 8 ml/min; CP8 ml/min; CC 3 ml/min; CP 3 ml/min; CC
b)
Figure 5.22 – Effect of anode diffusion layer material on a) cell performance and b) power density.
Operating conditions: methanol concentration 0.75M, air flow rate 3.6 l/min and fuel cell
temperature 20ºC. Design parameters: Nafion 117 and ELAT (E-TEK) at the cathode gas diffusion
layer.

Chapter 5: Experimental and modelling studies of an active feed DMFC
150
0.000
0.050
0.100
0.150
0.200
0.250
0.300
0.0000 0.0005 0.0010 0.0015 0.0020 0.0025
x (cm)
Met
an
ol c
on
cen
tratio
n (
M)
CP CC Figure 5.23 – Predicted methanol concentration profile in the anode catalyst layer (thickness 0.0023
cm) for different anode gas diffusion layer materials. Operating conditions: methanol concentration
0.75M, methanol flow rate 3 ml/min, air flow rate 3.6 l/min and fuel cell temperature 20ºC. Design
parameters: Nafion 117 and ELAT (E-TEK) at the cathode gas diffusion layer.
The influence of the anode gas diffusion layer material on the cell performance for two
different methanol concentrations (0.75M and 5M) is shown in Fig. 5.24. Model
predictions and experimental results are, also, presented. The methanol flow rate used
was 3 ml/min, the air flow rate 3.6 l/min and the fuel cell temperature 20ºC. As can be
seen by the plots the model predicts the correct trends of the effect of the anode gas
diffusion layer material on fuel cell performance and power density for the different
methanol concentration levels.
As can be seen from Fig. 5.24, for high methanol concentrations (5M), the cell
performance is enhanced using the carbon paper as the anode diffusion layer. When a
DMFC is operated with high methanol concentrations large amounts of methanol
crossover are generated. Since the carbon paper is less porous than carbon cloth, it
limits the amount of methanol that reaching the catalyst layer and consequently the
methanol that crosses the membrane. The use of carbon paper will probably induce less
significant levels of methanol crossover. This effect is shown in Fig. 5.25 confirming
that the methanol crossover rate through the membrane is lower when carbon paper is
used as anode diffusion layer material. Lower methanol crossover rates lead to higher
fuel cell performances. The carbon paper GDL also exhibits a lower thickness (table
5.7) which, as already mentioned, corresponds to a lower mass transfer resistance. As

Transport Phenomena in Direct Methanol Fuel Cells: Modelling and Experimental Studies
151
both materials have the same PTFE content the wettability is probably similar and
therefore does not explain the differences in cell performance.
0.0
0.1
0.2
0.3
0.4
0.5
0.6
0.7
0.8
0.9
0.00 0.01 0.02 0.03 0.04 0.05 0.06 0.07 0.08
Current density (A/cm2)
Cel
l Pot
entia
l (V
)
0.75 M;CP 0.75 M; CP 0.75 M; CC 0.75 M; CC5 M; CP 5 M; CP 5 M; CC 5 M; CC
a)
0.000
0.005
0.010
0.015
0.020
0.00 0.01 0.02 0.03 0.04 0.05 0.06 0.07 0.08
Current density (A/cm2)
Po
wer
den
sity
(W
/cm2 )
0.75 M;CP 0.75 M; CP 0.75 M; CC 0.75 M; CC5 M; CP 5 M; CP 5 M; CC 5 M; CC
b)
Figure 5.24 – Comparison of model predictions on a) cell performance and b) power density; dots:
experimental data, lines: model predictions. Operating conditions: methanol concentration 0.75M
and 5M, methanol flow rate 3 ml/min and air flow rate 3.6 l/min. Design parameters: Nafion 117
and ELAT (E-TEK) at the cathode gas diffusion layer.

Chapter 5: Experimental and modelling studies of an active feed DMFC
152
0.0E+00
1.0E-08
2.0E-08
3.0E-08
4.0E-08
5.0E-08
6.0E-08
0.00 0.01 0.02 0.03 0.04 0.05 0.06
Current density (A/cm2)
Met
an
ol c
ross
over
(m
ol/s
.cm2 )
CP CC Figure 5.25 – Model predictions for the methanol crossover for different anode gas diffusion layer
materials. Operating conditions: methanol concentration 5M, methanol flow rate 3 ml/min, air flow
rate 3.6 l/min and fuel cell temperature 20ºC. Design parameters: Nafion 117 and ELAT (E-TEK)
at the cathode gas diffusion layer.
Model predictions of the effect of the anode gas diffusion layer material on the net
water transport coefficient are shown in Fig. 5.26. The plots of the figure show that for a
given value of the current density, lower values of α are obtained for the thinner GDL
material (carbon paper). These results show that there is a tendency to an enhancement
of the transport toward the anode for low thicknesses of the GDL.
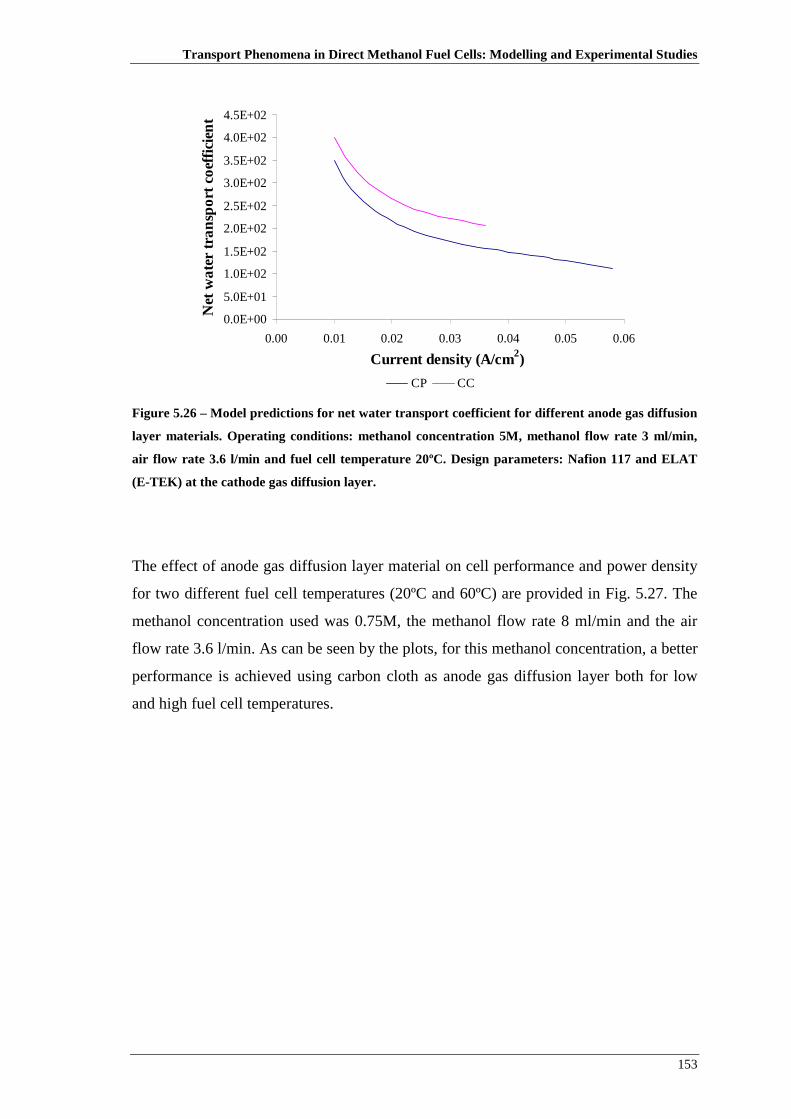
Transport Phenomena in Direct Methanol Fuel Cells: Modelling and Experimental Studies
153
0.0E+00
5.0E+01
1.0E+02
1.5E+02
2.0E+02
2.5E+02
3.0E+02
3.5E+02
4.0E+02
4.5E+02
0.00 0.01 0.02 0.03 0.04 0.05 0.06
Current density (A/cm2)
Net
wa
ter
tran
spo
rt co
effic
ien
t
CP CC Figure 5.26 – Model predictions for net water transport coefficient for different anode gas diffusion
layer materials. Operating conditions: methanol concentration 5M, methanol flow rate 3 ml/min,
air flow rate 3.6 l/min and fuel cell temperature 20ºC. Design parameters: Nafion 117 and ELAT
(E-TEK) at the cathode gas diffusion layer.
The effect of anode gas diffusion layer material on cell performance and power density
for two different fuel cell temperatures (20ºC and 60ºC) are provided in Fig. 5.27. The
methanol concentration used was 0.75M, the methanol flow rate 8 ml/min and the air
flow rate 3.6 l/min. As can be seen by the plots, for this methanol concentration, a better
performance is achieved using carbon cloth as anode gas diffusion layer both for low
and high fuel cell temperatures.
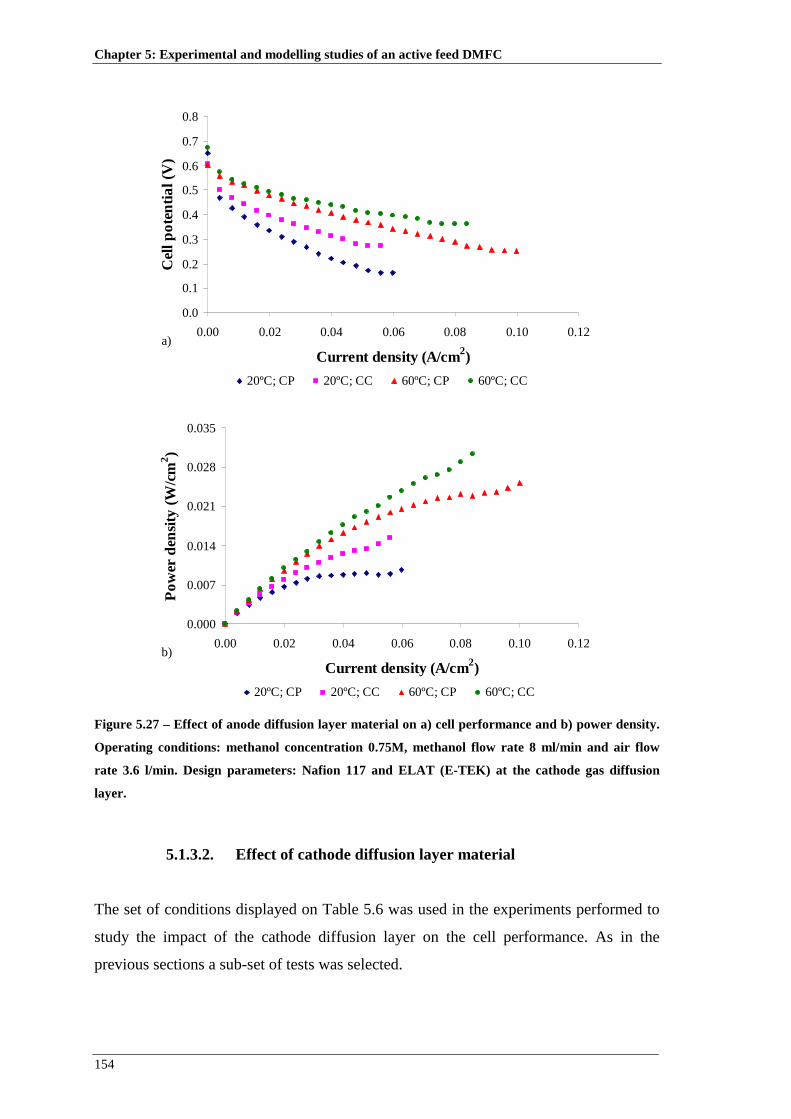
Chapter 5: Experimental and modelling studies of an active feed DMFC
154
0.0
0.1
0.2
0.3
0.4
0.5
0.6
0.7
0.8
0.00 0.02 0.04 0.06 0.08 0.10 0.12
Current density (A/cm2)
Cel
l po
ten
tial (
V)
20ºC; CP 20ºC; CC 60ºC; CP 60ºC; CC
a)
0.000
0.007
0.014
0.021
0.028
0.035
0.00 0.02 0.04 0.06 0.08 0.10 0.12
Current density (A/cm2)
Po
wer
den
sity
(W
/cm2 )
20ºC; CP 20ºC; CC 60ºC; CP 60ºC; CC
b)
Figure 5.27 – Effect of anode diffusion layer material on a) cell performance and b) power density.
Operating conditions: methanol concentration 0.75M, methanol flow rate 8 ml/min and air flow
rate 3.6 l/min. Design parameters: Nafion 117 and ELAT (E-TEK) at the cathode gas diffusion
layer.
5.1.3.2. Effect of cathode diffusion layer material
The set of conditions displayed on Table 5.6 was used in the experiments performed to
study the impact of the cathode diffusion layer on the cell performance. As in the
previous sections a sub-set of tests was selected.

Transport Phenomena in Direct Methanol Fuel Cells: Modelling and Experimental Studies
155
The materials selected to study the effect of the cathode diffusion layer on the cell
performance were ELAT carbon cloth (ELAT) from E-TEK, carbon paper TGPH060
(CP) from Toray or carbon cloth type A (CC) from E-TEK all with a PTFE content of
30 wt.%. In all tests, carbon cloth type A was used as anode diffusion layer. The
structural properties of the diffusion layers materials used are presented in Table 5.7.
The flow field used was the serpentine design in both sides of the fuel cell. The
membrane used was Nafion 117 and Nafion 212 (DuPont) the catalyst was Pt/Ru on the
anode side with a loading of 4 mg/cm2 and Pt on the cathode side with a loading of 4
mg/cm2.
Figures 5.28 a) and b) show, respectively, the cell polarization and power density curves
for two different air flow rates (3.6 l/min and 1 l/min), a methanol feed concentration of
0.75M, a methanol flow rate of 8 ml/min a the fuel cell temperature of 20ºC. It seems
clear that the carbon cloth material shows the best performance. It should be noted that
the variation in performance with different gas diffusion media at the cathode results
from the cell internal resistance and the ability of facilitate the oxygen transport. The
carbon cloth electrode has an increased capacity to remove the liquid water, as reported
by Liu et al. [90] probably due to a boarder distribution of pore sizes contributing
therefore to avoid severe flooding at the cathode catalyst layer. Decreasing the water
coverage on the cathode diffusion layer surface will benefit the oxygen access to the
catalyst site. Also when compared to carbon paper, the carbon cloth with its low
tortuosity imposes a lower transport resistance with higher oxygen concentration. When
compared to carbon cloth, the ELAT diffusion layer has a slightly lower performance
probably due to a higher tortuosity. Due to the importance of oxygen polarization under
high current densities, the differences in performance and power for the curves are
higher at these conditions.

Chapter 5: Experimental and modelling studies of an active feed DMFC
156
0.0
0.1
0.2
0.3
0.4
0.5
0.6
0.7
0.8
0.00 0.01 0.02 0.03 0.04 0.05 0.06 0.07 0.08
Current density (A/cm2)
Cel
l po
ten
tial (
V)
3.6 l/min; CC 3.6 l/min; CP 3.6 l/min; ELAT1 l/min; CC 1 l/min; CP 1 l/min; ELAT
a)
0.000
0.005
0.010
0.015
0.020
0.00 0.01 0.02 0.03 0.04 0.05 0.06 0.07 0.08
Current density (A/cm2)
Po
wer
den
sity
(W
/cm2 )
3.6 l/min; CC 3.6 l/min; CP 3.6 l/min; ELAT1 l/min; CC 1 l/min; CP 1 l/min; ELAT
b)
Figure 5.28 – Effect of cathode diffusion layer material on a) cell performance and b) power
density. Operating conditions: methanol concentration 0.75M, methanol flow rate 8 ml/min and cell
temperature 20ºC. Design parameters: Nafion117 and carbon cloth as anode gas diffusion layer.
The influence of the cathode gas diffusion layer material on the cell performance for
two different methanol concentrations (0.75M and 5M) is shown in Fig. 5.29. Model
predictions and experimental results are, also, presented. The methanol flow rate used
was 3 ml/min, the air flow rate 3.6 l/min and the fuel cell temperature 20ºC. As can be
seen by the plots the model predicts the correct trends of the effect of the cathode gas
diffusion layer material on fuel cell performance and power density. The more
significant discrepancies occur for high current densities and when carbon paper is used,
corresponding to conditions where two-phase flow effects are more important.

Transport Phenomena in Direct Methanol Fuel Cells: Modelling and Experimental Studies
157
The plots confirm that the cell performance is enhanced using the carbon cloth as
cathode diffusion layer, at higher methanol concentrations. Under these conditions the
increased capacity of carbon cloth for water removal is even more important to facilitate
the oxygen access to the active catalyst sites. This leads to a higher oxygen
concentration on the cathode catalyst layer and consequently higher fuel cell
performances, as can be seen in Fig. 5.30, where model predictions for the oxygen
concentration profile at the cathode catalyst layer are plotted, for a methanol feed
concentration of 5M and a current density of 0.03 A/cm2.
0.0
0.1
0.2
0.3
0.4
0.5
0.6
0.7
0.00 0.01 0.02 0.03 0.04 0.05 0.06 0.07 0.08
Current density (A/cm2)
Cel
l pot
entia
l (V
)
0.75 M;CP 0.75 M; CP 0.75 M; ELAT 0.75 M; ELAT0.75 M; CC 0.75 M; CC 5 M; CP 5 M; CP5 M; ELAT 5 M; ELAT 5 M; CC 5 M; CC
a)
0.000
0.005
0.010
0.015
0.020
0.00 0.01 0.02 0.03 0.04 0.05 0.06 0.07 0.08
Current density (A/cm2)
Po
wer
den
sity
(W
/cm2 )
0.75 M;CP 0.75 M; CP 0.75 M; ELAT 0.75 M; ELAT0.75 M; CC 0.75 M; CC 5 M; CP 5 M; CP5 M; ELAT 5 M; ELAT 5 M; CC 5 M; CC
b)
Figure 5.29 – Comparison of model predictions on a) cell performance and b) power density; dots:
experimental data, lines: model predictions. Operating conditions: methanol concentration 0.75M
and 5M, methanol flow rate 3 ml/min and air flow rate 3.6 l/min. Design parameters: Nafion 117
and carbon cloth as anode gas diffusion layer.

Chapter 5: Experimental and modelling studies of an active feed DMFC
158
0.000
0.001
0.002
0.003
0.004
0.005
0.006
0.007
0.008
0.009
0.0000 0.0005 0.0010 0.0015 0.0020 0.0025
x (cm)
oxy
gen
co
nce
ntra
tion
(M
)
CP ELAT CC Figure 5.30 – Predicted oxygen concentration profile in the cathode catalyst layer (thickness 0.0023
cm) for different cathode gas diffusion layer materials. Operating conditions: methanol
concentration 5M, methanol flow rate 3 ml/min, air flow rate 3.6 l/min and fuel cell temperature
20ºC. Design parameters: Nafion 117 and carbon cloth as anode gas diffusion layer.
The model predictions of the net water transport coefficient (α) are presented in Fig.
5.31 for the three cathode gas diffusion layer materials tested (carbon cloth, ELAT and
carbon paper) and contribute to better explain the results shown in the previous Figures.
For the conditions studied, the net water transport coefficient is toward the cathode
(since all α values are positive) which means that a large amount of water is present at
the anode side. The net water transport coefficient is higher when the cell is operating
using carbon cloth as cathode gas diffusion layer which means that the water
concentration on this side is smaller and the gradient between the anode and cathode
side higher. In this situation more water is transported from the anode to the cathode
side. These results are in accordance with experiments, since, as already mentioned, the
carbon cloth remove efficiently the water from the cathode side, decreasing the water
concentration at this side.

Transport Phenomena in Direct Methanol Fuel Cells: Modelling and Experimental Studies
159
0.0E+00
1.0E+02
2.0E+02
3.0E+02
4.0E+02
5.0E+02
0.00 0.01 0.02 0.03 0.04 0.05 0.06 0.07 0.08
Current density (A/cm2)
Net
wa
ter
tran
spo
rt co
effic
ien
t
CP ELAT CC Figure 5.31 – Model predictions for net water transport coefficient for different cathode gas
diffusion layer materials. Operating conditions: methanol concentration 5M, methanol flow rate 3
ml/min, air flow rate 3.6 l/min and fuel cell temperature 20ºC. Design parameters: Nafion 117 and
carbon cloth as anode gas diffusion layer.
The effect of cathode gas diffusion layer material on cell performance and power
density for two different fuel cell temperatures (20ºC and 60ºC) are provided in Fig.
5.32, for a methanol concentration of 0.75M. As can be seen by the plots, for low fuel
cell temperatures the worst performance is achieved using carbon paper as cathode gas
diffusion layer due to its poorest ability to remove the water and the carbon dioxide
from the cathode side. Regarding the higher fuel cell temperatures, the three materials
used have similar performances as power densities curves. In these conditions, some
water passes to the vapour phase, reducing the amount of liquid water, and it seems that
the flooding may me avoid in some extend so the water removal problems are less
important.

Chapter 5: Experimental and modelling studies of an active feed DMFC
160
0.0
0.1
0.2
0.3
0.4
0.5
0.6
0.7
0.8
0.00 0.02 0.04 0.06 0.08 0.10 0.12 0.14
Current density (A/cm2)
Cel
l po
ten
tial (
V)
20ºC; CC 20ºC; CP 20ºC; ELAT60ºC; CC 60ºC; CP 60ºC; ELAT
a)
0.00
0.01
0.02
0.03
0.04
0.00 0.02 0.04 0.06 0.08 0.10 0.12 0.14
Current density (A/cm2)
Po
wer
den
sity
(W
/cm2 )
20ºC; CC 20ºC; CP 20ºC; ELAT60ºC; CC 60ºC; CP 60ºC; ELAT
b)
Figure 5.32 – Effect of cathode diffusion layer material on a) cell performance and b) power
density. Operating conditions: methanol concentration 0.75M, methanol flow rate 8 ml/min and air
flow rate 3.6 l/min. Design parameters: Nafion 117 and carbon cloth as anode gas diffusion layer.
5.1.3.3. Effect of membrane thickness
The set of operating conditions displayed on Table 5.6 was used in the experiments
performed to study the impact of the membrane thickness on the cell performance.
In this section, results from experiments using three different Nafion membranes with
different thicknesses (Nafion 117 0.0187 cm, Nafion 115 0.0153 cm and Nafion 212
0.0051 cm) are presented. In all cases, carbon cloth type A was used as both anode and

Transport Phenomena in Direct Methanol Fuel Cells: Modelling and Experimental Studies
161
cathode diffusion layers. The flow field design and the catalyst load used were the same
employed in the previous reported tests.
Figure 5.33 a) and b) shows, respectively, the cell polarization and power density curves
for the three Nafion membranes and two different methanol flow rates (20 ml/min and 3
ml/min). The methanol feed concentration used was 0.75M, the air flow rate 3.6 l/min
and the fuel cell temperature 20ºC. For the set of conditions studied the cell
performance and power curves are enhanced using thicker Nafion membranes for very
low and relative high current densities. It should be noted that methanol transport
through the cell is enhanced or diminished by using different membrane thicknesses.
Figure 5.34 shows the methanol crossover rate through the different membranes used.
As expected, thicker membranes generate lower methanol crossover rates, which lead to
an increase in the fuel cell performance. As can be seen in Fig. 5.33 the fuel cell
performance is similar when Nafion 117 and Nafion 115 membranes are used. This is
probably due to the fact that although the Nafion 115 generates a slightly higher
methanol crossover it has a lower internal mass transfer resistance, due to its lower
thickness. For intermediate current densities, the differences in cell performances are
lower because within this operation range the higher methanol crossover through Nafion
212 membrane is compensated by a lower internal cell mass transfer resistance (lower
thickness). The plots from Fig. 5.33 also show higher performances for higher methanol
flow rates (recall section 5.1.2.3).

Chapter 5: Experimental and modelling studies of an active feed DMFC
162
0.0
0.1
0.2
0.3
0.4
0.5
0.6
0.7
0.8
0.00 0.01 0.02 0.03 0.04 0.05 0.06 0.07 0.08
Current density (A/cm2)
Cel
l po
ten
tial (
V)
20 ml/min; Nafion 117 20 ml/min; Nafion 115 20 ml/min; Nafion 212
3 ml/min; Nafion 117 3 ml/min; Nafion 115 3 ml/min; Nafion 212
a)
0.000
0.005
0.010
0.015
0.020
0.00 0.01 0.02 0.03 0.04 0.05 0.06 0.07 0.08
Current density (A/cm2)
Po
wer
den
sity
(W
/cm2 )
20 ml/min; Nafion 117 20 ml/min; Nafion 115 20 ml/min; Nafion 212
3 ml/min; Nafion 117 3 ml/min; Nafion 115 3 ml/min; Nafion 212
b)
Figure 5.33 – Effect of membrane thickness on a) cell performance and b) power density. Operating
conditions: methanol concentration 0.75M, air flow rate 3.6 l/min and cell temperature 20ºC.
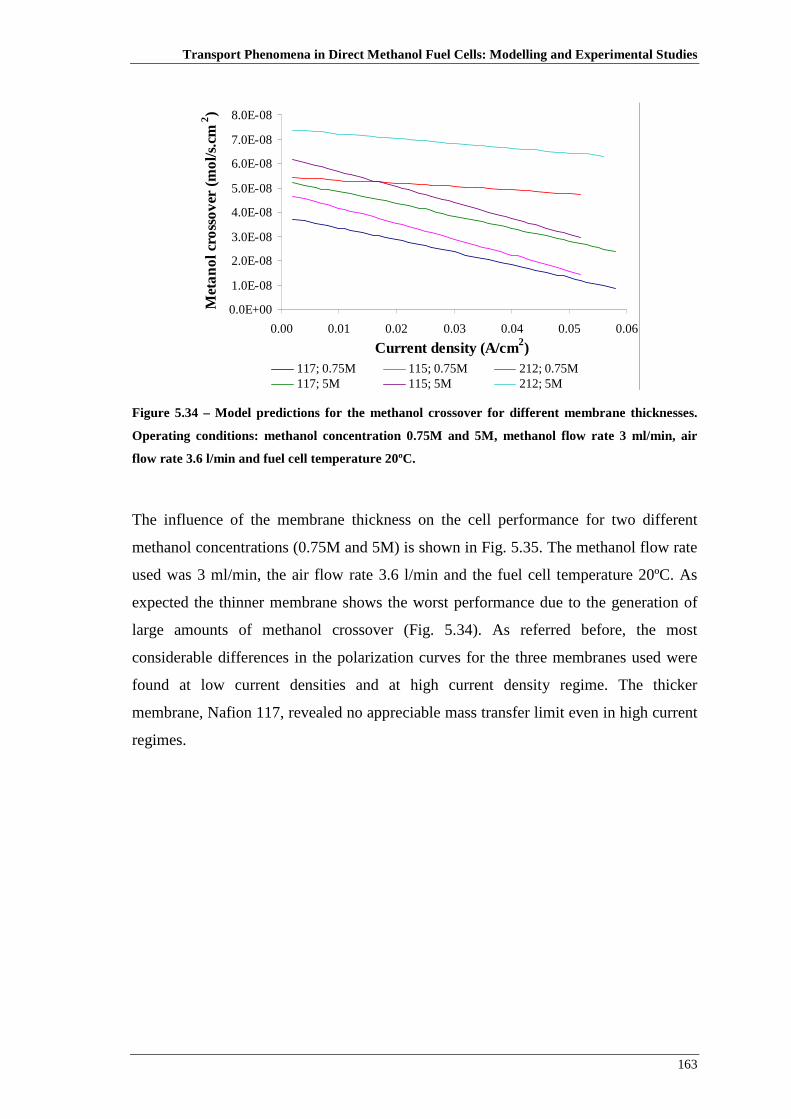
Transport Phenomena in Direct Methanol Fuel Cells: Modelling and Experimental Studies
163
0.0E+00
1.0E-08
2.0E-08
3.0E-08
4.0E-08
5.0E-08
6.0E-08
7.0E-08
8.0E-08
0.00 0.01 0.02 0.03 0.04 0.05 0.06
Current density (A/cm2)
Met
an
ol c
ross
ove
r (m
ol/s
.cm2 )
117; 0.75M 115; 0.75M 212; 0.75M117; 5M 115; 5M 212; 5M
Figure 5.34 – Model predictions for the methanol crossover for different membrane thicknesses.
Operating conditions: methanol concentration 0.75M and 5M, methanol flow rate 3 ml/min, air
flow rate 3.6 l/min and fuel cell temperature 20ºC.
The influence of the membrane thickness on the cell performance for two different
methanol concentrations (0.75M and 5M) is shown in Fig. 5.35. The methanol flow rate
used was 3 ml/min, the air flow rate 3.6 l/min and the fuel cell temperature 20ºC. As
expected the thinner membrane shows the worst performance due to the generation of
large amounts of methanol crossover (Fig. 5.34). As referred before, the most
considerable differences in the polarization curves for the three membranes used were
found at low current densities and at high current density regime. The thicker
membrane, Nafion 117, revealed no appreciable mass transfer limit even in high current
regimes.

Chapter 5: Experimental and modelling studies of an active feed DMFC
164
0.0
0.1
0.2
0.3
0.4
0.5
0.6
0.7
0.8
0.00 0.01 0.02 0.03 0.04 0.05 0.06 0.07 0.08
Current density (A/cm2)
Cel
l po
ten
tial (
V)
0.75 M; Nafion 117 0.75 M; Nafion 115 0.75 M; Nafion 212
5 M; Nafion 117 5 M; Nafion 115 5 M; Nafion 212
a)
0.000
0.005
0.010
0.015
0.020
0.00 0.01 0.02 0.03 0.04 0.05 0.06 0.07 0.08
Current density (A/cm2)
Po
wer
den
sity
(W
/cm2 )
0.75 M; Nafion 117 0.75 M; Nafion 115 0.75 M; Nafion 212
5 M; Nafion 117 5 M; Nafion 115 5 M; Nafion 212
b)
Figure 5.35 – Effect of membrane thickness on a) cell performance and b) power density. Operating
conditions: air flow rate 3.6 l/min, methanol flow rate 3 ml/min and cell temperature 20ºC.
The model predictions of the net water transport coefficient (α) are presented in Fig.
5.36 for the three Nafion membranes (Nafion 117, Nafion 115 and Nafion 212). For the
conditions studied, the net water transport coefficient has positive values indicating that
the water transport is toward the cathode. When comparing the values of α for identical
values of current density and different membrane thicknesses, lower values of α are
obtained with the thinner membrane, because the resistance of water back-flow from the
cathode to the anode via hydraulic permeation is much reduced in this case. This is a

Transport Phenomena in Direct Methanol Fuel Cells: Modelling and Experimental Studies
165
very important result bearing in mind the operation of a DMFC under high methanol
concentration.
0.0E+00
2.0E+02
4.0E+02
6.0E+02
8.0E+02
1.0E+03
1.2E+03
0.00 0.01 0.02 0.03 0.04 0.05 0.06
Current density (A/cm2)
Net
wa
ter
tra
nsp
ort
coef
ficie
nt
117; 0.75M 115; 0.75M 212; 0.75M117; 5M 115; 5M 212; 5M
Figure 5.36 – Model predictions for the net water transport coefficient for different membrane
thicknesses. Operating conditions: methanol concentration 0.75M and 5M, methanol flow rate 3
ml/min, air flow rate 3.6 l/min and fuel cell temperature 20ºC.
The effect of membrane thickness on cell performance and power density for two
different fuel cell temperatures (20ºC and 60ºC) are provided in Fig. 5.37. As expected,
the worst performances are achieved using Nafion 212 membranes for low and high fuel
cell temperatures.
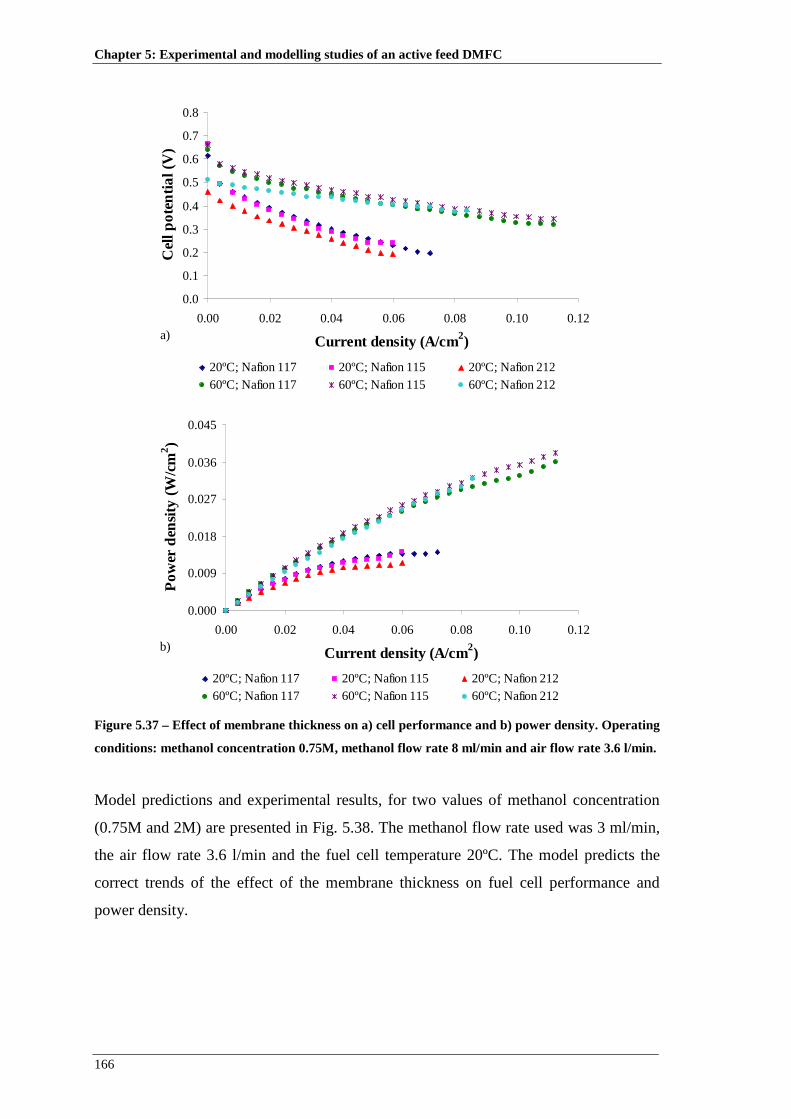
Chapter 5: Experimental and modelling studies of an active feed DMFC
166
0.0
0.1
0.2
0.3
0.4
0.5
0.6
0.7
0.8
0.00 0.02 0.04 0.06 0.08 0.10 0.12
Current density (A/cm2)
Cel
l po
ten
tial (
V)
20ºC; Nafion 117 20ºC; Nafion 115 20ºC; Nafion 21260ºC; Nafion 117 60ºC; Nafion 115 60ºC; Nafion 212
a)
0.000
0.009
0.018
0.027
0.036
0.045
0.00 0.02 0.04 0.06 0.08 0.10 0.12
Current density (A/cm2)
Po
wer
den
sity
(W
/cm2 )
20ºC; Nafion 117 20ºC; Nafion 115 20ºC; Nafion 21260ºC; Nafion 117 60ºC; Nafion 115 60ºC; Nafion 212
b)
Figure 5.37 – Effect of membrane thickness on a) cell performance and b) power density. Operating
conditions: methanol concentration 0.75M, methanol flow rate 8 ml/min and air flow rate 3.6 l/min.
Model predictions and experimental results, for two values of methanol concentration
(0.75M and 2M) are presented in Fig. 5.38. The methanol flow rate used was 3 ml/min,
the air flow rate 3.6 l/min and the fuel cell temperature 20ºC. The model predicts the
correct trends of the effect of the membrane thickness on fuel cell performance and
power density.
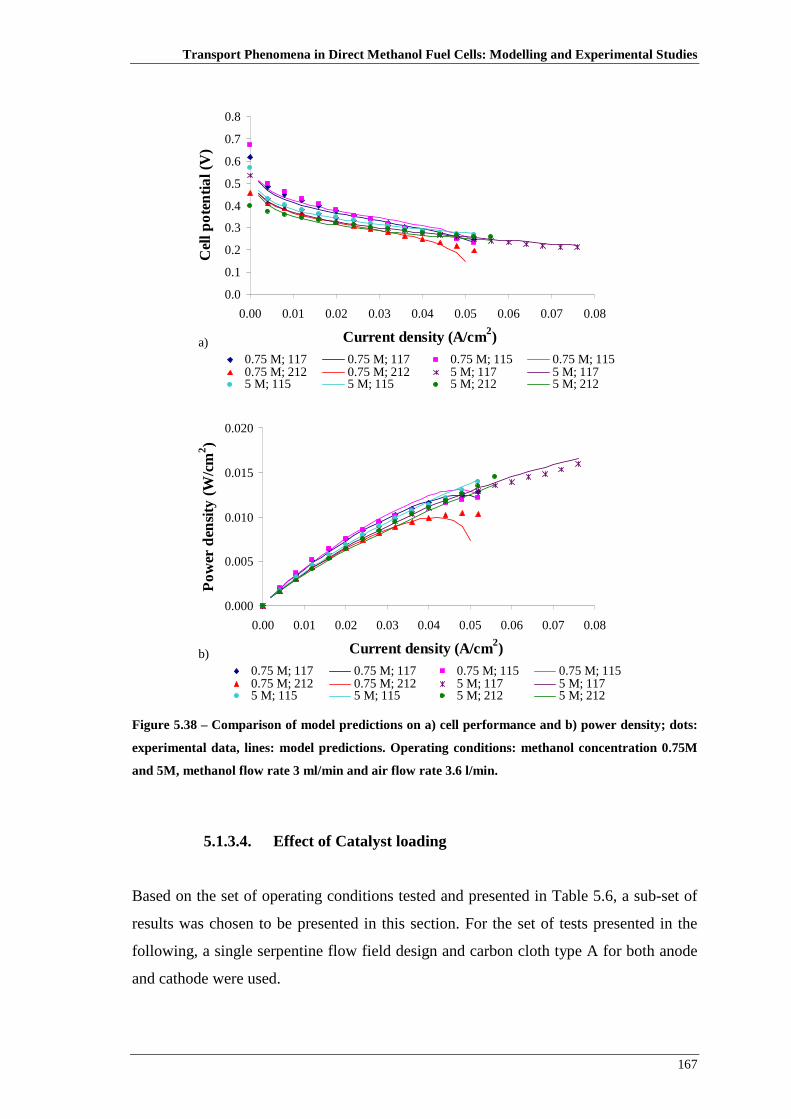
Transport Phenomena in Direct Methanol Fuel Cells: Modelling and Experimental Studies
167
0.0
0.1
0.2
0.3
0.4
0.5
0.6
0.7
0.8
0.00 0.01 0.02 0.03 0.04 0.05 0.06 0.07 0.08
Current density (A/cm2)
Cel
l po
ten
tial (
V)
0.75 M; 117 0.75 M; 117 0.75 M; 115 0.75 M; 1150.75 M; 212 0.75 M; 212 5 M; 117 5 M; 1175 M; 115 5 M; 115 5 M; 212 5 M; 212
a)
0.000
0.005
0.010
0.015
0.020
0.00 0.01 0.02 0.03 0.04 0.05 0.06 0.07 0.08
Current density (A/cm2)
Po
wer
den
sity
(W
/cm2 )
0.75 M; 117 0.75 M; 117 0.75 M; 115 0.75 M; 1150.75 M; 212 0.75 M; 212 5 M; 117 5 M; 1175 M; 115 5 M; 115 5 M; 212 5 M; 212
b)
Figure 5.38 – Comparison of model predictions on a) cell performance and b) power density; dots:
experimental data, lines: model predictions. Operating conditions: methanol concentration 0.75M
and 5M, methanol flow rate 3 ml/min and air flow rate 3.6 l/min.
5.1.3.4. Effect of Catalyst loading
Based on the set of operating conditions tested and presented in Table 5.6, a sub-set of
results was chosen to be presented in this section. For the set of tests presented in the
following, a single serpentine flow field design and carbon cloth type A for both anode
and cathode were used.
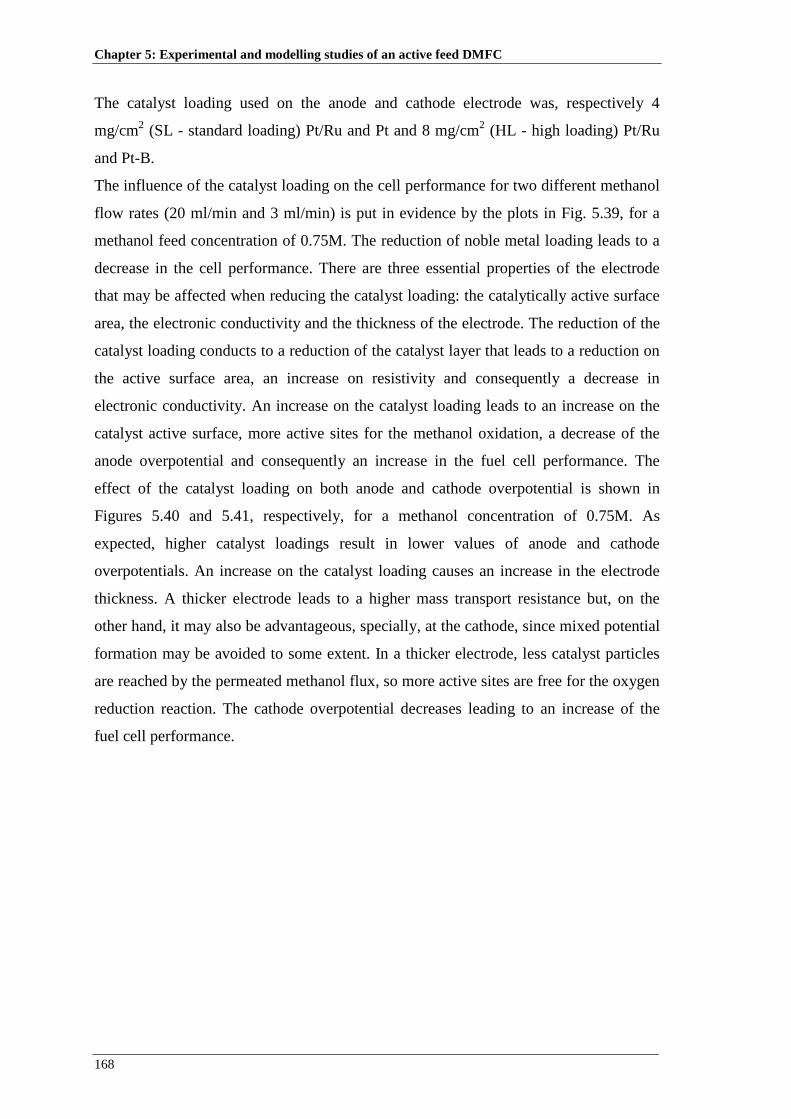
Chapter 5: Experimental and modelling studies of an active feed DMFC
168
The catalyst loading used on the anode and cathode electrode was, respectively 4
mg/cm2 (SL - standard loading) Pt/Ru and Pt and 8 mg/cm2 (HL - high loading) Pt/Ru
and Pt-B.
The influence of the catalyst loading on the cell performance for two different methanol
flow rates (20 ml/min and 3 ml/min) is put in evidence by the plots in Fig. 5.39, for a
methanol feed concentration of 0.75M. The reduction of noble metal loading leads to a
decrease in the cell performance. There are three essential properties of the electrode
that may be affected when reducing the catalyst loading: the catalytically active surface
area, the electronic conductivity and the thickness of the electrode. The reduction of the
catalyst loading conducts to a reduction of the catalyst layer that leads to a reduction on
the active surface area, an increase on resistivity and consequently a decrease in
electronic conductivity. An increase on the catalyst loading leads to an increase on the
catalyst active surface, more active sites for the methanol oxidation, a decrease of the
anode overpotential and consequently an increase in the fuel cell performance. The
effect of the catalyst loading on both anode and cathode overpotential is shown in
Figures 5.40 and 5.41, respectively, for a methanol concentration of 0.75M. As
expected, higher catalyst loadings result in lower values of anode and cathode
overpotentials. An increase on the catalyst loading causes an increase in the electrode
thickness. A thicker electrode leads to a higher mass transport resistance but, on the
other hand, it may also be advantageous, specially, at the cathode, since mixed potential
formation may be avoided to some extent. In a thicker electrode, less catalyst particles
are reached by the permeated methanol flux, so more active sites are free for the oxygen
reduction reaction. The cathode overpotential decreases leading to an increase of the
fuel cell performance.
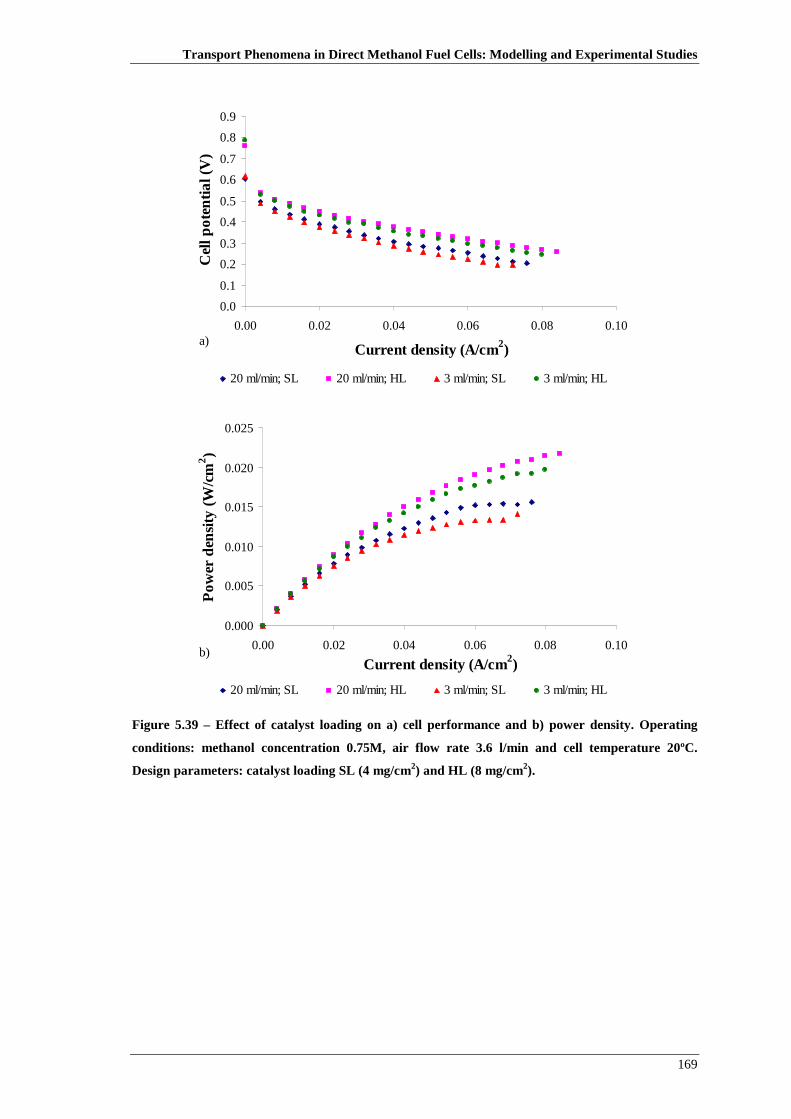
Transport Phenomena in Direct Methanol Fuel Cells: Modelling and Experimental Studies
169
0.0
0.1
0.2
0.3
0.4
0.5
0.6
0.7
0.8
0.9
0.00 0.02 0.04 0.06 0.08 0.10
Current density (A/cm2)
Cel
l po
ten
tial (
V)
20 ml/min; SL 20 ml/min; HL 3 ml/min; SL 3 ml/min; HL
a)
0.000
0.005
0.010
0.015
0.020
0.025
0.00 0.02 0.04 0.06 0.08 0.10
Current density (A/cm2)
Po
wer
den
sity
(W
/cm2 )
20 ml/min; SL 20 ml/min; HL 3 ml/min; SL 3 ml/min; HL
b)
Figure 5.39 – Effect of catalyst loading on a) cell performance and b) power density. Operating
conditions: methanol concentration 0.75M, air flow rate 3.6 l/min and cell temperature 20ºC.
Design parameters: catalyst loading SL (4 mg/cm2) and HL (8 mg/cm2).

Chapter 5: Experimental and modelling studies of an active feed DMFC
170
0.0E+00
1.0E-01
2.0E-01
3.0E-01
4.0E-01
5.0E-01
6.0E-01
7.0E-01
0.00 0.01 0.02 0.03 0.04 0.05 0.06
Current density (A/cm2)
an
od
e ov
erp
ote
ntia
l ( ηη ηηA)
SL HL Figure 5.40 – Model predictions for the anode overpotential for different catalyst loadings.
Operating conditions: methanol flow rate 3 ml/min, air flow rate 3.6 l/min and methanol
concentration 0.75M. Design parameters: catalyst loading SL (4 mg/cm2) and HL (8 mg/cm2).
3.1E-01
3.2E-01
3.3E-01
3.4E-01
3.5E-01
3.6E-01
3.7E-01
3.8E-01
0.00 0.01 0.02 0.03 0.04 0.05 0.06
Current density (A/cm2)
cath
od
e o
verp
ote
ntia
l ( ηη ηηC)
SL HL Figure 5.41 – Model predictions for the cathode overpotential for different catalyst loadings.
Operating conditions: methanol flow rate 3 ml/min, air flow rate 3.6 l/min and methanol
concentration 0.75M. Design parameters: catalyst loading SL (4 mg/cm2) and HL (8 mg/cm2).
The influence of the catalyst loading for three different methanol concentrations
(0.75M, 2M and 5M) is shown in Fig. 5.42. A better performance is obtained, as
expected, for the highest value of catalyst loading, for the three values of methanol
concentration tested.

Transport Phenomena in Direct Methanol Fuel Cells: Modelling and Experimental Studies
171
The model predictions for the methanol crossover are presented in Fig. 5.43 for the
methanol concentration of 0.75 M and 5M for the two levels of catalyst loading. With
the increasing catalyst loading, the thickness of the catalyst layer increase and therefore
the mass transfer resistance through this layer becomes greater. In spite of this, the cell
performance increases with the metal loading because the thicker anode catalyst layer
creates a higher resistance to methanol transport thereby controlling the rate of
methanol reaching the membrane and reducing the methanol crossover as is well
brought out by the curves shown in the figure. This reduction leads to a reduction of the
parasite current formed due to the oxidation of methanol at the cathode side and
consequently the cell performance increases.
0.0
0.1
0.2
0.3
0.4
0.5
0.6
0.7
0.8
0.9
0.00 0.02 0.04 0.06 0.08 0.10
Current density (A/cm2)
Cel
l po
ten
tial (
V)
0.75 M; SL 0.75 M; HL 2 M; SL 2 M; HL 5 M; SL 5 M; HL
a)
0.000
0.005
0.010
0.015
0.020
0.025
0.00 0.02 0.04 0.06 0.08 0.10
Current density (A/cm2)
Po
wer
den
sity
(W
/cm2 )
0.75 M; SL 0.75 M; HL 2 M; SL 2 M; HL 5 M; SL 5 M; HL
b)
Figure 5.42 – Effect of catalyst loading on a) cell performance and b) power density. Operating
conditions: air flow rate 3.6 l/min, methanol flow rate 3 ml/min and cell temperature 20ºC. Design
parameters: catalyst loading SL (4 mg/cm2) and HL (8 mg/cm2).
Chapter 5: Experimental and modelling studies of an active feed DMFC
172
0.0E+00
1.0E-08
2.0E-08
3.0E-08
4.0E-08
5.0E-08
6.0E-08
0.00 0.01 0.02 0.03 0.04 0.05 0.06
Current density (A/cm2)
Met
an
ol c
ross
ove
r (m
ol/s
.cm2 )
SL; 0.75M HL; 0.75M SL; 5M HL; 5M Figure 5.43 – Model predictions for the methanol crossover for different catalyst loadings.
Operating conditions: methanol concentration 0.75M and 5M, methanol flow rate 3 ml/min, air
flow rate 3.6 l/min and fuel cell temperature 20ºC. Design parameters: catalyst loading SL (4
mg/cm2) and HL (8 mg/cm2).
The model predictions of the net water transport coefficient (α) are presented in Fig.
5.44 for the two catalyst loadings tested (SL (4 mg/cm2) and HL (8 mg/cm2)), and for
the methanol concentrations of 0.75M and 5M. For the conditions studied, the net water
transport coefficient has positive values meaning that the water transport is toward the
cathode. When comparing the values of α for identical values of current density and
different catalyst loadings, the values of α are slightly lower for the HL catalyst loading,
probably because higher loadings on the cathode side lead to more active sites free for
the oxygen reduction reaction and more intense water formation decreasing the water
concentration gradient between the anode and cathode side.

Transport Phenomena in Direct Methanol Fuel Cells: Modelling and Experimental Studies
173
0.0E+00
2.0E+02
4.0E+02
6.0E+02
8.0E+02
1.0E+03
1.2E+03
0.00 0.01 0.02 0.03 0.04 0.05 0.06
Current density (A/cm2)
Net
wa
ter
tran
spo
rt co
effic
ien
t
SL; 0.75M HL; 0.75M SL; 5M HL; 5M Figure 5.44 – Model predictions for the net water transport coefficient for different catalyst
loadings. Operating conditions: methanol concentration 0.75M and 5M, methanol flow rate 3
ml/min, air flow rate 3.6 l/min and fuel cell temperature 20ºC. Design parameters: catalyst loading
SL (4 mg/cm2) and HL (8 mg/cm2).
The effect of catalyst loading, for two different fuel cell temperatures (20ºC and 60ºC)
and two catalyst loadings, on cell performance are provided in Fig. 5.45. As expected,
the lower performances are achieved using the lower catalyst loadings for the lower and
higher fuel cell temperatures.

Chapter 5: Experimental and modelling studies of an active feed DMFC
174
0.0
0.1
0.2
0.3
0.4
0.5
0.6
0.7
0.8
0.9
0.00 0.02 0.04 0.06 0.08 0.10 0.12
Current density (A/cm2)
Cel
l po
ten
tial (
V)
20ºC; SL 20ºC; HL 60ºC; SL 60ºC; HL
a)
0.00
0.01
0.02
0.03
0.04
0.05
0.00 0.02 0.04 0.06 0.08 0.10 0.12
Current density (A/cm2)
Po
wer
den
sity
(W
/cm2 )
20ºC; SL 20ºC; HL 60ºC; SL 60ºC; HL
b)
Figure 5.45 – Effect of catalyst loading on a) cell performance and b) power density. Operating
conditions: methanol concentration 0.75M, methanol flow rate 8 ml/min and air flow rate 3.6 l/min.
Design parameters: catalyst loading SL (4 mg/cm2) and HL (8 mg/cm2).
Finally, the comparison between model predictions and experimental results, for two
values of methanol concentration (0.75M and 5M) and for the two catalyst loadings
tested are presented in Fig. 5.46, showing once again that the model predicts the correct
trends of the effect of the catalyst loading on fuel cell performance and power density.

Transport Phenomena in Direct Methanol Fuel Cells: Modelling and Experimental Studies
175
0.0
0.1
0.2
0.3
0.4
0.5
0.6
0.7
0.8
0.9
0.00 0.02 0.04 0.06 0.08 0.10
Current density (A/cm2)
Cel
l po
ten
tial (
V)
0.75 M; SL 0.75 M; SL 0.75 M; HL 0.75 M; HL5 M; SL 5 M; SL 5 M; HL 5M; HL
a)
0.000
0.005
0.010
0.015
0.020
0.025
0.00 0.02 0.04 0.06 0.08 0.10
Current density (A/cm2)
Po
wer
den
sity
(W
/cm2 )
0.75 M; SL 0.75 M; SL 0.75 M; HL 0.75 M; HL5 M; SL 5 M; SL 5 M; HL 5 M; HL
b)
Figure 5.46 – Comparison of model predictions on a) cell performance and b) power density; dots:
experimental data, lines: model predictions. Operating conditions: methanol concentration 0.75M
and 5M, methanol flow rate 3 ml/min and air flow rate 3.6 l/min. Design parameters: catalyst
loading SL (4 mg/cm2) and HL (8 mg/cm2).
5.1.3.5. Effect of anode flow field
In this section, the results from the experimental study of the effect of the anode flow
field design on the fuel cell performance are presented, based on the set of operating
conditions tested and presented in Table 5.6.

Chapter 5: Experimental and modelling studies of an active feed DMFC
176
Three anode flow fields (single serpentine (SFF), multi-serpentine (MSFF) and an
original design mixed serpentine and parallel (MFF)) were tested by keeping the same
cathode flow field the single serpentine design. The membrane used in all the tests was
Nafion 117, the anode and cathode catalyst loading was 4 mg/cm2 and the anode and
cathode diffusion layers were carbon cloth type A.
The data plotted in Fig. 5.47 were obtained in experiments with a 0.75M methanol
solution fed at three flow rates (3, 8 and 20 ml/min) and at a fixed fuel cell temperature
of 20ºC and an air flow rate of 3.6 l/min. As is evident from this figure, for the same
methanol flow rate the performance of the fuel cell equipped with MFF is slightly better
than that with SFF and much better than that with MSFF. The SFF has as the advantage
of forcing the reactant flow to traverse the entire active area of the corresponding
electrode thereby eliminating areas of stagnant flow. However, this channel layout
results in a relatively long reactant flow path, hence a substantial pressure drop and
significant concentration gradients from the flow inlet and outlet. Although the MSFF
design reduce the reactant pressure drop relative to a single serpentine design, the
reactant pressure drop through each of the serpentine channels remains relatively high
due to the relatively long flow path of each channel, thus the reactant concentration
changes significantly from the flow inlet region to the exit region. The MFF design is
divided in several sections with separate inlet and outlet, and each of flow sectors has
parallel flow channels, which are further sub-divided into few sets of channels
connected in series. This design gives combined advantages from grid, parallel and
serpentine design since it generates lower pressure drops preventing the formation of
stagnant flow areas, distributing reactants more uniformly with higher average reactant
concentrations. The advantages of the MFF, mentioned before, are slightly more
important when the fuel cell is operating at high current densities, were the anode
produces a large amount of carbon dioxide bubbles. The bubbles formation raises the
pressure drop, so it is advantageous to use a design minimizing additional pressure
drops.
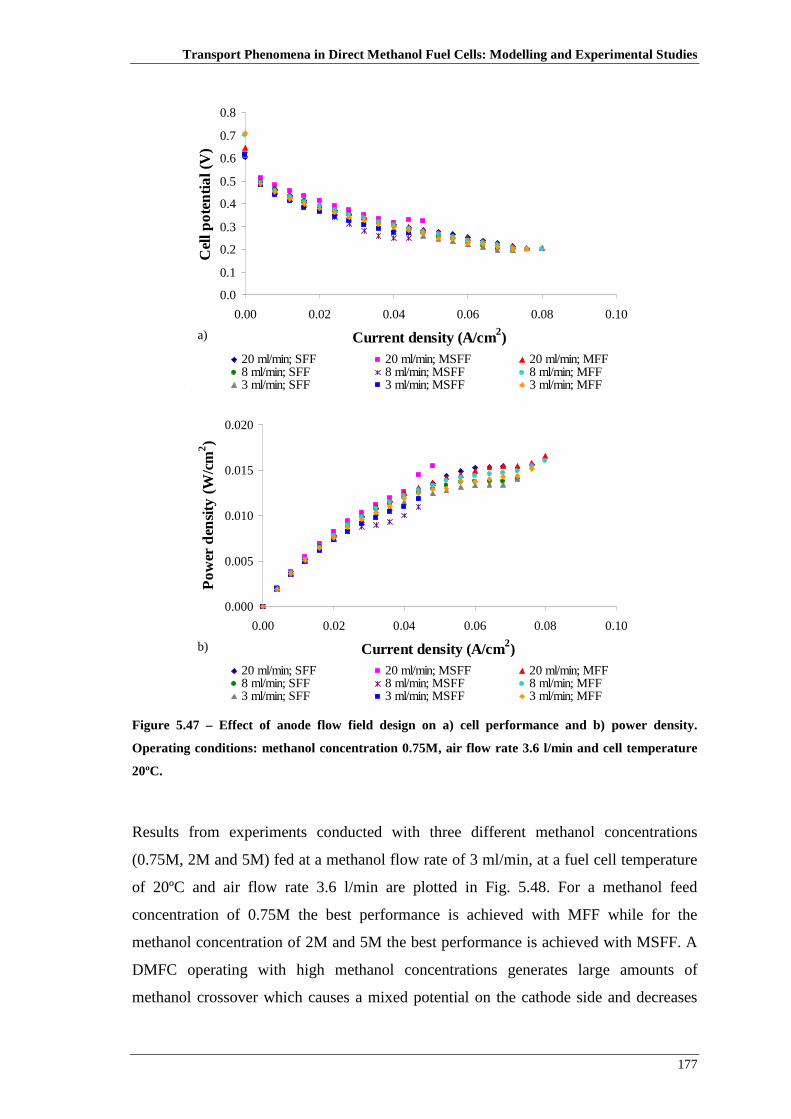
Transport Phenomena in Direct Methanol Fuel Cells: Modelling and Experimental Studies
177
0.0
0.1
0.2
0.3
0.4
0.5
0.6
0.7
0.8
0.00 0.02 0.04 0.06 0.08 0.10
Current density (A/cm2)
Cel
l po
ten
tial (
V)
20 ml/min; SFF 20 ml/min; MSFF 20 ml/min; MFF8 ml/min; SFF 8 ml/min; MSFF 8 ml/min; MFF3 ml/min; SFF 3 ml/min; MSFF 3 ml/min; MFF
a)
0.000
0.005
0.010
0.015
0.020
0.00 0.02 0.04 0.06 0.08 0.10
Current density (A/cm2)
Po
wer
den
sity
(W
/cm2 )
20 ml/min; SFF 20 ml/min; MSFF 20 ml/min; MFF8 ml/min; SFF 8 ml/min; MSFF 8 ml/min; MFF3 ml/min; SFF 3 ml/min; MSFF 3 ml/min; MFF
b)
Figure 5.47 – Effect of anode flow field design on a) cell performance and b) power density.
Operating conditions: methanol concentration 0.75M, air flow rate 3.6 l/min and cell temperature
20ºC.
Results from experiments conducted with three different methanol concentrations
(0.75M, 2M and 5M) fed at a methanol flow rate of 3 ml/min, at a fuel cell temperature
of 20ºC and air flow rate 3.6 l/min are plotted in Fig. 5.48. For a methanol feed
concentration of 0.75M the best performance is achieved with MFF while for the
methanol concentration of 2M and 5M the best performance is achieved with MSFF. A
DMFC operating with high methanol concentrations generates large amounts of
methanol crossover which causes a mixed potential on the cathode side and decreases

Chapter 5: Experimental and modelling studies of an active feed DMFC
178
the fuel cell performance. So, it seems that the use of a MSFF with reduced pressure
drop when compared to the SFF and reduced dead zones when compared to the MFF, is
favorable for high methanol feed concentrations.
0.0
0.1
0.2
0.3
0.4
0.5
0.6
0.7
0.8
0.00 0.01 0.02 0.03 0.04 0.05 0.06 0.07 0.08
Current density (A/cm2)
Cel
l po
ten
tial (
V)
0.75 M; SFF 0.75 M; MSFF 0.75 M; MFF2 M; SFF 2M; MSFF 2 M; MFF5 M; SFF 5 M; MSFF 5 M; MFF
a)
0.000
0.005
0.010
0.015
0.020
0.00 0.01 0.02 0.03 0.04 0.05 0.06 0.07 0.08
Current density (A/cm2)
Po
wer
den
sity
(W
/cm2 )
0.75 M; SFF 0.75 M; MSFF 0.75 M; MFF2 M; SFF 2M; MSFF 2 M; MFF5 M; SFF 5 M; MSFF 5 M; MFF
b)
Figure 5.48 – Effect of anode flow field design on a) cell performance and b) power density.
Operating conditions: air flow rate 3.6 l/min, methanol flow rate 3 ml/min and cell temperature
20ºC.
The polarization and power curves represented in Fig. 5.49 concern experiments with a
methanol feed concentration of 0.75M, a methanol flow rate of 8 ml/min a air flow rate
3.6 l/min and two different fuel cell temperatures (20ºC and 60ºC). For a DMFC
operating at 20ºC, similar performances are achieved with the SFF and the MFF designs

Transport Phenomena in Direct Methanol Fuel Cells: Modelling and Experimental Studies
179
with a slight better performance for the latter. These results are explained by the same
reason mentioned previously, related to the fact that this design combines the
advantages from the grid, the parallel and the serpentine designs, generates low pressure
drops and enhances two-phase mass transport, allowing a efficient removal of the
reaction products. For 60ºC the three designs used as anode flow channels (SFF, MSFF
and MFF) give similar performances for low current densities. For high current
densities the MFF and the SFF have slightly better performance than the MSFF. An
increase on fuel cell temperature leads to an increase of the electrochemical reaction
rate, more methanol is oxidized at the anode side and more carbon dioxide is formed.
The MSFF design with a relatively long flow path of each channel and a corresponding
reactant pressure drop generates a less uniform distribution of reactant which may cause
the appearance of a less uniform distribution of bubbles. It seems that this non
homogeneity induces a slower gas removal for higher temperatures.

Chapter 5: Experimental and modelling studies of an active feed DMFC
180
0.0
0.1
0.2
0.3
0.4
0.5
0.6
0.7
0.8
0.00 0.02 0.04 0.06 0.08 0.10 0.12
Current density (A/cm2)
Cel
l po
ten
tial (
V)
20ºC; SFF 20ºC; MSFF 20ºC; MFF60ºC; SFF 60ºC; MSFF 60ºC; MFF
a)
0.00
0.01
0.02
0.03
0.04
0.00 0.02 0.04 0.06 0.08 0.10 0.12
Current density (A/cm2)
Po
wer
den
sity
(W
/cm2 )
20ºC; SFF 20ºC; MSFF 20ºC; MFF60ºC; SFF 60ºC; MSFF 60ºC; MFF
b)
Figure 5.49 – Effect of anode flow field design on a) cell performance and b) power density.
Operating conditions: methanol concentration 0.75M, methanol flow rate 8 ml/min and air flow
rate 3.6 l/min.
5.1.3.6. Cathode flow field
Based on the set of operating conditions tested and presented in table 5.6, the three
cathode flow field designs were tested by keeping the same anode flow field having a
single serpentine flow field (SFF).

Transport Phenomena in Direct Methanol Fuel Cells: Modelling and Experimental Studies
181
The design of the cathode flow field affects the air mass transfer rate and the drainage.
If the water is not efficiently removed from the cathode at a sufficient rate, flooding
may occur and transport of reactants is hindered [181].
Although in the anode side the advantages of the MFF seems to be superior that the
disadvantages, in the cathode side the opposite is found since the performance for all the
conditions tested using the MFF is lower. Figures 5.50, 5.51 and 5.52 show the
polarization and power curves for the three different cathode flow fields.
Polarization and power curves obtained from experiments with 0.75M methanol
solution fed at 8 ml/min, at a fixed fuel cell temperature of 20ºC and two air flow rates
(1 l/min and 3.6 l/min), are presented in Fig. 5.50. For the same air flow rate, the best
performance is obtained when the multi-serpentine flow field (MSFF) is used, probably
because this design has the advantages of the serpentine designs at the cathode side,
ensuring adequate water removal by the gas flow through the several channels and no
formation of stagnant areas at the cathode surface due to water accumulation. These
results are in accordance with the simulation results obtained by Jung et al. [179]. The
effect of the methanol flow rate is as expected: higher performances for higher methanol
flow rates.

Chapter 5: Experimental and modelling studies of an active feed DMFC
182
0.0
0.1
0.2
0.3
0.4
0.5
0.6
0.7
0.00 0.01 0.02 0.03 0.04 0.05 0.06 0.07 0.08
Current density (A/cm2)
Cel
l po
ten
tial (
V)
3.6 l/min; SFF 3.6 l/min; MSFF 3.6 l/min; MFF1 l/min; SFF 1 l/min; MSFF 1 l/min; MFF
a)
0.000
0.005
0.010
0.015
0.020
0.00 0.01 0.02 0.03 0.04 0.05 0.06 0.07 0.08
Current density (A/cm2)
Po
wer
den
sity
(W
/cm2 )
3.6 l/min; SFF 3.6 l/min; MSFF 3.6 l/min; MFF1 l/min; SFF 1 l/min; MSFF 1 l/min; MFF
b)
Figure 5.50 – Effect of cathode flow field design on a) cell performance and b) power density.
Operating conditions: methanol concentration 0.75M, methanol flow rate 8 ml/min and cell
temperature 20ºC.
The data plotted in Fig. 5.51 were obtained in experiments with 0.75M, 2M and 5M
methanol solution fed at 3 ml/min, at a fixed fuel cell temperature of 20ºC and an air
flow rates 3.6 l/min. For a methanol feed concentration of 0.75M the best performance
is achieved with MSFF while for the methanol concentrations of 2M and 5M the higher
performances are achieved with MSFF and SFF. When a DMFC operates with a 0.75M
methanol solution, a large amount of water is present at the anode side and the net water
flux tends to be toward the cathode side generating more accumulation of water at the
cathode side. Since the MSFF is a design which allows an efficient water removal this
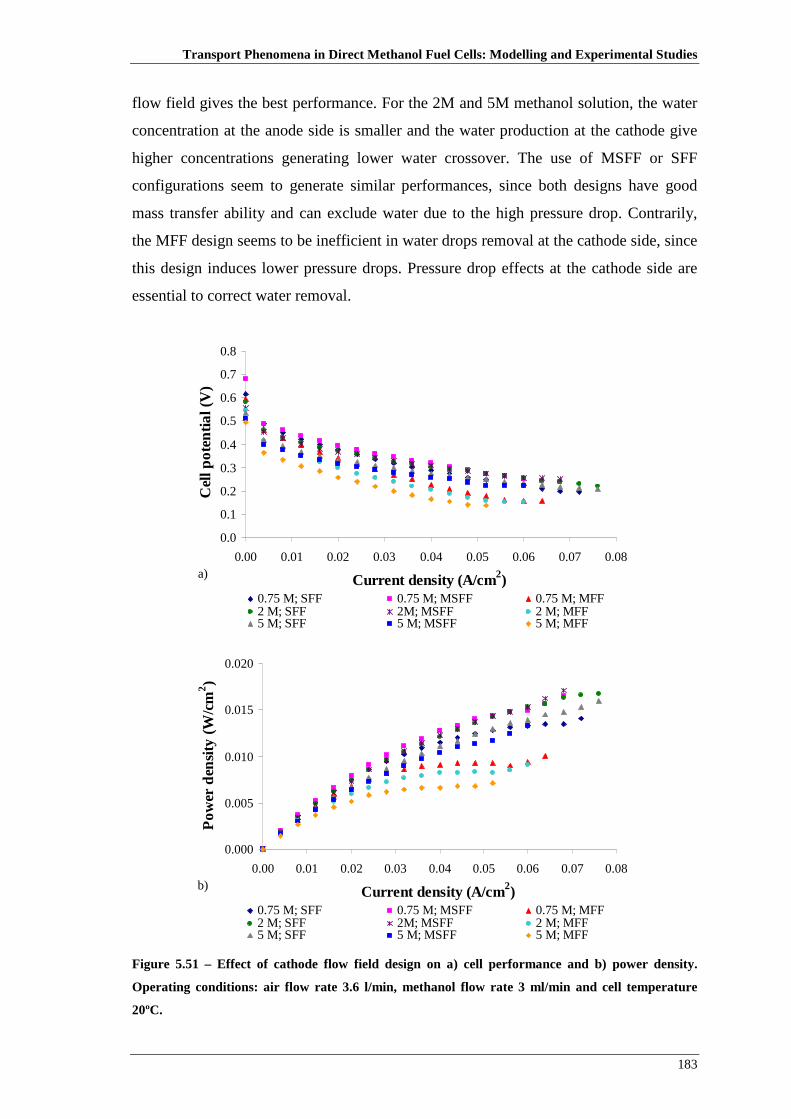
Transport Phenomena in Direct Methanol Fuel Cells: Modelling and Experimental Studies
183
flow field gives the best performance. For the 2M and 5M methanol solution, the water
concentration at the anode side is smaller and the water production at the cathode give
higher concentrations generating lower water crossover. The use of MSFF or SFF
configurations seem to generate similar performances, since both designs have good
mass transfer ability and can exclude water due to the high pressure drop. Contrarily,
the MFF design seems to be inefficient in water drops removal at the cathode side, since
this design induces lower pressure drops. Pressure drop effects at the cathode side are
essential to correct water removal.
0.0
0.1
0.2
0.3
0.4
0.5
0.6
0.7
0.8
0.00 0.01 0.02 0.03 0.04 0.05 0.06 0.07 0.08
Current density (A/cm2)
Cel
l po
ten
tial (
V)
0.75 M; SFF 0.75 M; MSFF 0.75 M; MFF2 M; SFF 2M; MSFF 2 M; MFF5 M; SFF 5 M; MSFF 5 M; MFF
a)
0.000
0.005
0.010
0.015
0.020
0.00 0.01 0.02 0.03 0.04 0.05 0.06 0.07 0.08
Current density (A/cm2)
Po
wer
den
sity
(W
/cm2 )
0.75 M; SFF 0.75 M; MSFF 0.75 M; MFF2 M; SFF 2M; MSFF 2 M; MFF5 M; SFF 5 M; MSFF 5 M; MFF
b)
Figure 5.51 – Effect of cathode flow field design on a) cell performance and b) power density.
Operating conditions: air flow rate 3.6 l/min, methanol flow rate 3 ml/min and cell temperature
20ºC.

Chapter 5: Experimental and modelling studies of an active feed DMFC
184
Results from experiments conducted with a methanol feed concentration of 0.75M, a
methanol flow rate of 8 ml/min a air flow rate 3.6 l/min and two different fuel cell
temperatures (20ºC and 60ºC), are plotted in Fig. 5.52. As can be seen from the plots
both MSFF and SFF give enhanced performances. For 20ºC a better performance is
achieved using MSFF as cathode flow field design, while for 60ºC a slight better
performance is achieved using SFF. These results can be explained under the light of
the pressure effects on water removal, as explained above. The serpentine design due to
the pressure-driven mass flow in the channels allows a correct water removal and forces
the reactant flow to traverse the entire active area thereby eliminating areas of stagnant
flow. The use of MFF shows the worst performance due to the fact that oxygen and
water may flow in one or more of the many channels resulting in a bad distribution of
reactant It should, also, be mentioned that the amount of water in the cathode side is
smaller for 60ºC than for 20ºC, since at this temperature more water vaporizes and is
removed by the gas stream. In this way a fuel cell operating at 60ºC should have less
problems of flooding, so the single serpentine flow fields seems to be more adequate in
this conditions, leading to the best performance.
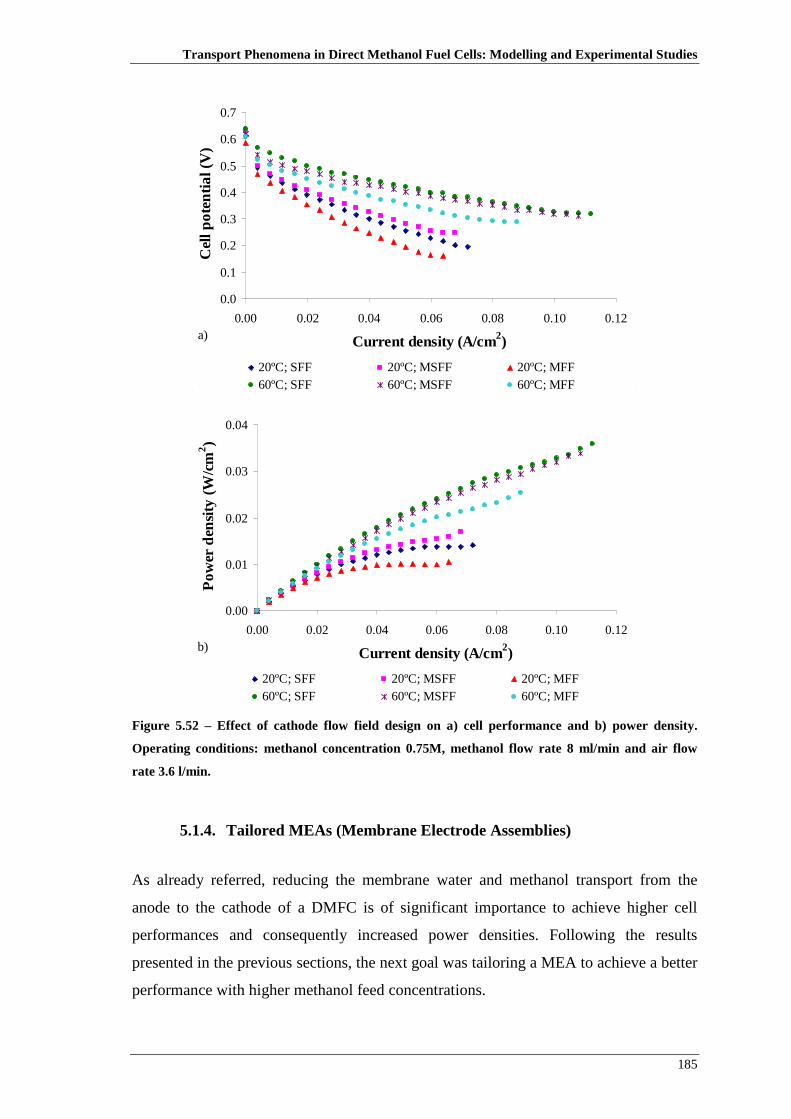
Transport Phenomena in Direct Methanol Fuel Cells: Modelling and Experimental Studies
185
0.0
0.1
0.2
0.3
0.4
0.5
0.6
0.7
0.00 0.02 0.04 0.06 0.08 0.10 0.12
Current density (A/cm2)
Cel
l po
ten
tial (
V)
20ºC; SFF 20ºC; MSFF 20ºC; MFF60ºC; SFF 60ºC; MSFF 60ºC; MFF
a)
0.00
0.01
0.02
0.03
0.04
0.00 0.02 0.04 0.06 0.08 0.10 0.12
Current density (A/cm2)
Po
wer
den
sity
(W
/cm2 )
20ºC; SFF 20ºC; MSFF 20ºC; MFF60ºC; SFF 60ºC; MSFF 60ºC; MFF
b)
Figure 5.52 – Effect of cathode flow field design on a) cell performance and b) power density.
Operating conditions: methanol concentration 0.75M, methanol flow rate 8 ml/min and air flow
rate 3.6 l/min.
5.1.4. Tailored MEAs (Membrane Electrode Assemblies)
As already referred, reducing the membrane water and methanol transport from the
anode to the cathode of a DMFC is of significant importance to achieve higher cell
performances and consequently increased power densities. Following the results
presented in the previous sections, the next goal was tailoring a MEA to achieve a better
performance with higher methanol feed concentrations.
Chapter 5: Experimental and modelling studies of an active feed DMFC
186
One membrane named commercial Nafion 117 was considered with 30 wt% carbon
cloth type A (E-TEK) as gas diffusion layer on the anode and ELAT (E-TEK) on the
cathode side with 4mg/cm2 Pt/Ru and Pt as catalyst load for anode and cathode
respectively. One tailored MEA with a thinner membrane Nafion 212, a 30% wet-
proofed carbon paper TGPH060 as anode gas diffusion layer and a 30% wet-proofed
carbon cloth type A as cathode gas diffusion layer and 4 mg/cm2 Pt/Ru and Pt as
catalyst load for anode and cathode respectively was also proposed.
A methanol feed concentration of 5M was used to check if it is possible to work with
high methanol concentration without significant sacrifice of fuel cell performance. As
verified in the previous results with high methanol concentrations and thinner
membranes, the net water transport coefficient toward the cathode is reduced. A single
serpentine flow field design was used both for anode and cathode sides.
The next three figures emerge as a result of the analyses made previously to predict the
influence of different operating conditions and configuration parameters on the cell
performance, on the net water transport coefficient and on the methanol crossover.
Figure 5.53 shows the experimental and predicted polarization and power density
curves for the two types of MEAs, using the selected methanol concentration of 5M.
The tailored MEA has a slightly better performance and power density especially for
medium to high current densities. This is due to the fact that in this region,
concentration overpotential is a major portion in the total overvoltage so a decrease in
membrane thickness leads to a reduction on mass transfer resistance. Working with
thinner membranes has advantages such as the lower cost and the possibility of working
with a favorable water transport direction. Decreasing the membrane thickness enhances
back transport of water, from the cathode to the anode, an essential operating condition
when working with high methanol concentrations [89, 90]. According to the suggestions
of Liu et al. [90], it is possible to reduce the methanol crossover using thinner
membranes and thicker gas diffusion layers.

Transport Phenomena in Direct Methanol Fuel Cells: Modelling and Experimental Studies
187
0.0
0.1
0.2
0.3
0.4
0.5
0.6
0.00 0.01 0.02 0.03 0.04 0.05 0.06
Current density (A/cm2)
Cel
l Po
ten
tial (
V)
0.000
0.004
0.008
0.012
0.016
Po
wer
den
sity
(W
/cm2 )
commercial commercial tailored tailored
Figure 5.53 – Comparison of model predictions on cell performance and power density; dots:
experimental data, lines: model predictions. Operating conditions: methanol concentration 5M,
methanol flow rate 3 ml/min, air flow rate 3.6 l/min and fuel cell temperature 20ºC.
Model predictions of the methanol crossover for the two MEAs tested (commercial and
tailored) are presented in Fig. 5.54 as a function of current density. As can be seen, and
as already mentioned, higher methanol crossover rates are achieved using commercial
membranes. The tailored membranes are thinner which conducts to a higher methanol
crossover, but the anode diffusion layer material used is carbon paper and this material
was found to limit the amount of methanol that reaches the cathode side. In overall, the
tailored MEA can reduce the methanol crossover rate and enhance the fuel cell
performance. With this MEA modification it is possible to work a DMFC with high
methanol concentrations and low methanol crossover rates. This is one of the major
goals on the DMFC development.
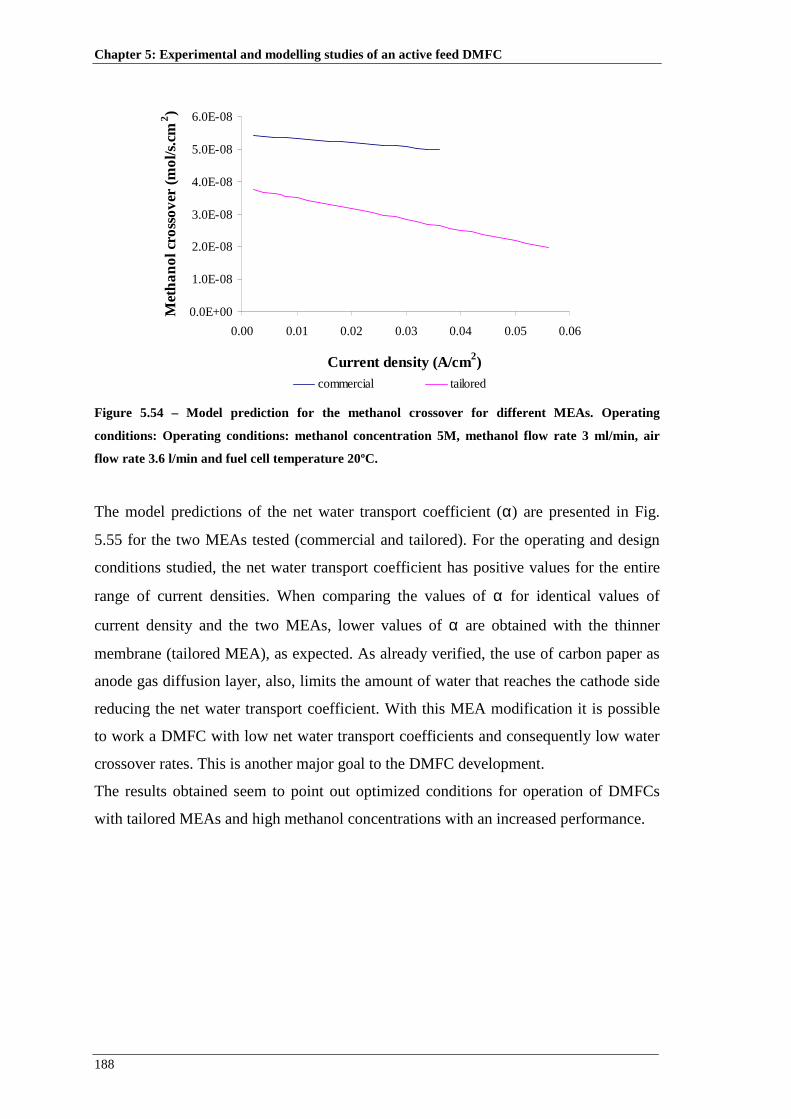
Chapter 5: Experimental and modelling studies of an active feed DMFC
188
0.0E+00
1.0E-08
2.0E-08
3.0E-08
4.0E-08
5.0E-08
6.0E-08
0.00 0.01 0.02 0.03 0.04 0.05 0.06
Current density (A/cm2)
Met
ha
no
l cro
sso
ver
(mo
l/s.c
m2 )
commercial tailored Figure 5.54 – Model prediction for the methanol crossover for different MEAs. Operating
conditions: Operating conditions: methanol concentration 5M, methanol flow rate 3 ml/min, air
flow rate 3.6 l/min and fuel cell temperature 20ºC.
The model predictions of the net water transport coefficient (α) are presented in Fig.
5.55 for the two MEAs tested (commercial and tailored). For the operating and design
conditions studied, the net water transport coefficient has positive values for the entire
range of current densities. When comparing the values of α for identical values of
current density and the two MEAs, lower values of α are obtained with the thinner
membrane (tailored MEA), as expected. As already verified, the use of carbon paper as
anode gas diffusion layer, also, limits the amount of water that reaches the cathode side
reducing the net water transport coefficient. With this MEA modification it is possible
to work a DMFC with low net water transport coefficients and consequently low water
crossover rates. This is another major goal to the DMFC development.
The results obtained seem to point out optimized conditions for operation of DMFCs
with tailored MEAs and high methanol concentrations with an increased performance.

Transport Phenomena in Direct Methanol Fuel Cells: Modelling and Experimental Studies
189
0.0E+00
5.0E+01
1.0E+02
1.5E+02
2.0E+02
2.5E+02
3.0E+02
3.5E+02
4.0E+02
4.5E+02
0.00 0.01 0.02 0.03 0.04 0.05 0.06
Current density (A/cm2)
Net
wa
ter
tran
spo
rt co
effic
ien
t
commercial tailored Figure 5.55 – Model prediction for the net water transport coefficient for different MEAs.
Operating conditions: methanol concentration 5M, methanol flow rate 3 ml/min, air flow rate 3.6
l/min and fuel cell temperature 20ºC.
5.2. Concluding remarks
The performance of a direct methanol fuel cell operating near atmospheric pressure has
been studied to systematically evaluate the effects of operating parameters such as
methanol concentration, fuel cell temperature, methanol and air flow rates and design
parameters on the DMFC performance.
The effect of the design parameters such as the anode gas diffusion layer media, the
cathode gas diffusion layer media, the membrane thickness, the catalyst loading and the
anode and cathode flow field design on the direct methanol fuel cell performance and
power, has been, also, experimentally investigated. Most of the obtained results were
explained under the light of the predictions of the methanol crossover rate, the methanol
and oxygen concentration profiles, the net water transport coefficient and the anode and
cathode overpotential from the developed and validated model presented in Chapter 3.
Based on the results presented in this chapter it can be concluded that the fuel cell
performance significantly increases with the introduction of the gas diffusion layers. For
this specific cell design and operating conditions the optimum methanol concentration is
0.75 M with air as oxidant. Higher values of methanol and air flow rates have a positive
effect on cell voltage and power. The effect of the air flow rate is less pronounced than

Chapter 5: Experimental and modelling studies of an active feed DMFC
190
the impact of methanol flow rate. Regarding the design parameters it was found that the
choice of material to be used as anode gas diffusion layer depends on the methanol
concentration. Using carbon paper instead of carbon cloth for anode diffusion layer
increases the cell performance for higher methanol concentration levels. In opposite for
low methanol concentration, the use of carbon cloth instead of carbon paper increases
the fuel performance. When a fuel cell is operated with high methanol concentration,
large amounts of methanol crossover are generated. Since carbon paper is less porous
than carbon cloth limits the amount of methanol that crosses the membrane reducing in
some extend the major loss on performance when working a fuel cell with high
methanol concentrations. For the cathode side, using carbon cloth instead of carbon
paper and ELAT as gas diffusion layer increases the cell performance. Increasing the
membrane thickness leads to a lower methanol crossover rate through the membrane
increasing the fuel cell performance. Thicker anode catalyst layers create a higher
resistance to methanol diffusion reducing the methanol crossover. Thicker cathode
catalyst layers enable an increase of the number of catalyst particles available for the
oxygen reduction.
The effect of anode and cathode flow field design on the direct methanol fuel cell
performance, operating near ambient pressure, has been, also, experimentally
investigated. It has been shown that various flow field designs have a large impact on
the fuel cell performance and power due to their different ability to provide fuel and
remove produced water and carbon dioxide. Based on the results of these experiments,
for this specific cell design and operating conditions, it can be concluded that the fuel
cell performance significantly increases with the use of MFF as the anode flow field
design and MSFF as the cathode flow field design. For the three values of methanol
flow rate tested, for low values of fuel cell temperature and low values of methanol
concentration the use of MFF as anode flow field design has a positive effect on cell
voltage and power. For high values of fuel cell temperature the three anode flow field
designs used show similar performances. For high values of methanol feed
concentrations, an important operating condition for portable applications, the use of
MSFF as the anode flow field design conducts to a better performance. Similarly, for
the two values of air flow rate tested, for low values of fuel cell temperature and low
values of methanol concentration the use of MSFF as cathode flow field design has a
positive effect on cell voltage and power. For high values of fuel cell temperature the
Transport Phenomena in Direct Methanol Fuel Cells: Modelling and Experimental Studies
191
use of SFF as cathode flow field design conducts to a better performance. For higher
values of methanol concentration the use of SFF and MSFF as cathode flow field design
shows similar performances. The results presented can be used for the validation of
CDF models.
Reducing the membrane water and methanol transport from the anode to the cathode of
a DMFC is of significant importance to achieve higher cell performances and
consequently increased power densities, especially for portable applications. Based on
the experimental results, a tailored MEA was proposed to achieve low methanol and
water crossover and high power density, operating at high methanol concentrations. The
resulting MEA provides a basic element for future DMFC systems using high
concentration or pure methanol.

Chapter 5: Experimental and modelling studies of an active feed DMFC
192

193
CHAPTER 6 6. PASSIVE FEED DIRECT METHANOL FUEL CELL
The imminent introduction of the passive DMFCs in the market strongly motivated
the development of the work presented in this chapter.
As was mentioned before, models are a fundamental tool for the design process of
fuel cells and fuel cell systems. Based on the model developed for the active feed
direct methanol fuel cell, a steady state, one-dimensional, multi-component and
thermal model is described and applied to simulate the operation of a passive direct
methanol fuel cell. The model takes into account the thermal and mass transfer
effects, along with the electrochemical reactions occurring in the passive DMFC.
The model can be used to predict the methanol, oxygen, carbon dioxide and water
concentration profiles in the anode, cathode and membrane as well as to estimate the
methanol and water crossover and the temperature profile across the cell. The model
was validated with data from experiments conducted in an «in-house» designed
passive DMFC and with recent published data [160]. For the experimental studies of
the passive feed direct methanol fuel cells (DMFCs), the necessary equipment and
facilities for running the tests were installed. The last part of the experimental setup
section describes the passive feed DMFC designed and constructed for this work.
Steady state experiments at ambient pressure, close to room temperature at different
methanol concentrations were carried out. The effect of design parameters (such as
the membrane thickness, catalyst loading, diffusion layers materials and
thicknesses) on the fuel cell performance and net water transport coefficient was
studied under the light of the developed model for the passive DMFC.
The contents of this Chapter conducted to the preparation and submission of two
papers: Oliveira, V.B, Rangel, C.M. and Pinto, A.M.F.R., “One-dimensional and
non-isothermal model for a passive DMFC” submitted to International Journal of
Heat and Mass Transfer and Oliveira, V.B, Rangel, C.M. and Pinto, A.M.F.R.,
“ Water management in a passive DMFC” submitted to Journal of Power Sources.

Chapter 6: Passive feed Direct methanol fuel cell
194
6.1. Model Formulation for a passive feed DMFC
6.1.1. General model structure
A schematic representation of a passive feed direct methanol fuel cell is shown in Fig.
6.1, consisting of
• an acrylic plate (AAP) containing the fuel tank, a copper plate (ACP), a diffusion
layer (AD) and a catalyst layer (AC) at the anode side;
• a polymer electrolyte membrane (M);
• a catalyst layer (CC), a diffusion layer (CD), a copper plate (CCP), and an acrylic
plate (CAP) at the cathode side.
Figure 6.1 – Schematic representation of a passive DMFC.
In a passive-feed DMFC the fuel, methanol or an aqueous methanol solution, and the
oxidant are supplied to the reaction zone by natural convection. From the ACP through
the AD and from the AC through the M, methanol solution is transported primarily by
diffusion. In a similar way the transport of oxygen on the CCP, CD and CC is enhanced
by diffusion. After being produced by methanol oxidation, which takes place in the AC,
the carbon dioxide produced moves counter-currently toward the fuel tank. At
sufficiently high current densities carbon dioxide emerges in the form of gas bubbles
from the surface of the AC. In the CC, oxygen reacts with protons and electrons

Transport Phenomena in Direct Methanol Fuel Cells: Modelling and Experimental Studies
195
generating water. The water produced in CC moves counter-currently toward the open
channels of the CCP and also under some operating conditions, by back diffusion
toward the anode.
6.1.2. Model assumptions
As already referred, the direct methanol fuel cell is a multiphase system involving
simultaneous mass, charge and energy transfer. Following the modelling studies
presented in Chapter 3 for the active feed DMFC a one-dimensional model is presented
now, for the passive feed DMFC, with the following simplifications and assumptions:
• the fuel cell is assumed to operate under steady-state conditions;
• the transport of heat and mass through the gas diffusion and catalyst layers is
assumed to be a diffusion-predominated process and the convection effect is
negligible;
• mass transport in the diffusion layers and membrane is described using effective
Fick models;
• the thermal energy model is based on the differential thermal energy conservation
equation (Fourier’s law);
• pressure gradient across the layers is negligible;
• only the liquid phase is considered in the anode side, so carbon dioxide remains
dissolved in solution;
• gaseous methanol and water are considered in the cathode;
• solutions are considered ideal and dilute;
• local equilibrium at interfaces is represented by partition functions;
• the catalyst layers are assumed to be macro-homogeneous porous electrodes so
reactions in these layers are modelled as a homogeneous reaction;
• anode kinetics is described by step mechanism, with a rate expression similar to the
used by Meyers et al. [26];
• the anodic and cathodic overpotential is constant through the catalyst layers;

Chapter 6: Passive feed Direct methanol fuel cell
196
• cathode kinetics is described by Tafel equation;
• methanol and water transport through the membrane is assumed to be due to the
combined effect of the concentration gradient between the anode and the cathode
and the electro-osmosis force;
• on the anode side, the heat and mass transfer of methanol from the bulk solution to
the ACP is assumed to be driven by natural convection;
• on the cathode side, the heat and mass are transfer between the CCP and the ambient
by natural convection;
• the heat generation by electrochemical reactions occurring in the catalyst layers is
considered;
• when compared with the heat generated by electrochemical reactions and
overpotential, the heat released by joule effects is ignored;
• the temperatures of the external walls of the cell (T0 and T9 in Fig. 6.1) are known;
• the heat flux generated in the catalyst layers is assumed to be constant.
The major differences between the two models (active and passive feed DMFC) regard
the end plate, current collector plate and the flow field channels. The passive feed does
not have the flow field layer. The end plates are made by different materials and the
current collector plates have holes. In the passive feed systems, and as already referred,
the fuel and the oxidant supply is made by natural convection instead of forced
convection (active feed) having the two models, for this reason, different correlations
and equations.
6.1.3. Governing equations and Boundary conditions – Anode and Cathode
6.1.3.1. Mass transport
Anode reaction:
Methanol oxidation: −+ ++→+ eHCOOHOHCH 66223 (6.1)

Transport Phenomena in Direct Methanol Fuel Cells: Modelling and Experimental Studies
197
Cathode reaction:
Oxygen reduction: OHeHO 22 244 →++ −+ (6.2)
Methanol oxidation: OHCOOOHCH 2223 22
3 +→+ (6.3)
The transport processes of methanol and water from the fuel tank to the ACP are
described by
( )AAPjj
AAPjmassj CChN −= 0
, (6.4)
where j represents methanol or water and the AAPjmassh , represents the mass transfer
coefficient of the species j
In the anode copper plate, diffusion and catalyst layer, the methanol and water flux are
related to the corresponding concentration gradients by assuming Fickian diffusion
[171] with an effective diffusivity ACPeffjD , in the ACP, ADeff
jD , in the AD and ACeffjD , in
the AC. The methanol and water fluxes can be determined from:
dx
dCDN
ACPjACPeff
jj,−= , j represents methanol or water, (6.5)
dx
dCDN
ADjADeff
jj,−= , j represents methanol or water (6.6)
and
dx
dCDN
ACjACeff
jj,−= , j represents methanol or water (6.7)
The concentration at the AAP/ACP, ACP/AD and AD/AC interfaces is given by
assuming local equilibrium with partition coefficients K2, K3 and K4, respectively. The
boundary conditions for Eq. (6.5), (6.6) and (6.7) are (see Fig. 6.1)

Chapter 6: Passive feed Direct methanol fuel cell
198
AAPj
ACPj CKCxxAt 2,22 : == , j represents methanol or water (6.8)
ACPj
ADj CKCxxAt ,33,33 : == , j represents methanol or water (6.9)
ADj
ACj CKCxxAt ,44,44 : == , j represents methanol or water (6.10)
ACj
ACj CCxxAt ,55 : == , j represents methanol or water (6.11)
In fuel cells, all the fluxes can be related to a single characteristic flux, the current
density or charge flux of the fuel cell. In the DMFC, the methanol flux is related to the
current density and the permeation flux of methanol through the membrane, (M OHCHN3
),
by:
MOHCH
CellOHCH N
F
IN
33 6+= (6.12)
At the anode side, the water flux is related to the current density and to the net water
transport coefficient, α (defined, as before, as the ratio of the net water flux though the
membrane from the anode to the cathode normalized by the protonic flux), by:
( )16
2 += αF
IN Cell
OH (6.13)
As well as for the model presented in Chapter 3, the transport of methanol and water
through the membrane is assumed to be due to the combined effect of the concentration
gradient and the electro-osmosis force. The fluxes can be determined from:
F
I
dx
dCDN Cell
OHCH
MOHCHMeff
OHCHM
OHCH 3
3
33
, ξ+−= (6.14)
F
In
dx
dCD
F
IN Cell
d
MOHMeff
OHCellM
OH +−== 2
22
,
6α (6.15)
The electro-osmotic drag ( OHCH3ξ , dn ), in equations (6.14) and (6.15), is defined as the
number of methanol or water molecules dragged by the hydrogen ions moving through
the membrane.

Transport Phenomena in Direct Methanol Fuel Cells: Modelling and Experimental Studies
199
The net water transport coefficient, α, can be calculated using the equation (6.15).
The concentration at the AC/membrane interface is given by assuming local equilibrium
with a partition coefficient K5. The boundary conditions for the integration of equations
(6.14) and (6.15) is given by
ACj
Mj CKCxxAt ,55,55 : == , j represents methanol or water (6.16)
In the cathode catalyst layer, the methanol, water and oxygen flux are related to the
concentration gradient by assuming Fickian diffusion [171] with an effective
diffusivity CCeffjD , . The flux can be determined from:
dx
dCDN
CCjCCeff
jj,−= , j represents methanol, water or oxygen (6.17)
As for the active feed DMFC it is here considered that the entire methanol crossing the
membrane reacts at the cathode catalyst layer so the concentration at the CC/CD
interface is zero. It is assumed that there is no oxygen crossover, so the oxygen
concentration in CC/M interface is zero. The concentration of water and methanol at the
membrane/CC interface and the concentration of water and oxygen at the CC/CD
interface are given by assuming local equilibrium with a partition coefficient K6 and K7,
respectively. The boundary conditions for Eq. (6.17) are:
Mj
CCj CKCxxAt ,66,66 : == , j represents methanol or water and 0
2,6 =CCOC (6.18)
0:37 ≅= CCOHCHCxxAt , CC
OHCC
OH CC22 ,7= and CC
OCCO CC
22 ,7= (6.19)
At the cathode catalyst layer, the oxygen reacts with the electrons and protons to
produce water. However, part of oxygen fed is consumed due to methanol crossover to
form an internal current and a mixed potential. Therefore the oxygen flux is related to
the current density and the permeation flux of methanol through the membrane by
MOHCHOcross
CellOO N
F
IN
3222 ,4
υυ += (6.20)

Chapter 6: Passive feed Direct methanol fuel cell
200
where
12 =Oυ and 23
2, =Ocrossυ
At the cathode side, the water flux is related to the water production from the oxygen
reduction reaction and methanol crossover oxidation and to the net water flux
transported from the anode to the cathode by:
MOH
MOHCHOHcross
CellOHOH NN
F
IN
23222 ,4
++= υυ (6.21)
where
22 =OHυ , 22, =OHcrossυ
In the cathode diffusion layer and cathode copper plate the oxygen and water fluxes are
related to the corresponding concentration gradients by
dx
dCDN
CDiCDeff
ii,−= , i represents oxygen or water vapour (6.22)
dx
dCDN
CCPiCCPeff
ii,−= , i represents oxygen or water vapour (6.23)
where CDeffiD , and CCPeff
iD , are the effective diffusion coefficients of oxygen and water in
the CD and CCP.
The concentration at the CC/CD and CD/CCP interfaces is given by assuming local
equilibrium with a partition coefficient K7 and K8. The boundary conditions for Eq.
(6.22) and (6.23) are
CCii
CDi CKCxxAt ,7,7,77 : == , i represents oxygen or water vapour (6.24)
CDii
CCPi CKCxxAt ,8,8,88 : == , i represents oxygen or water vapour (6.25)
Like at the anode side, the transport process of oxygen from the air to the CCP is
described by

Transport Phenomena in Direct Methanol Fuel Cells: Modelling and Experimental Studies
201
( )CCPii
Cimassi CChN ,9
0, −= (6.26)
where i represents oxygen and C imassh , represents the mass transfer coefficient of the
species i
It is assumed that the air at the CCP is in a saturated state, then the water vapour feed
concentration ( 0,8 2OHC ) is equal to water vapour concentration (sat
OHC ,0,8 2
) and can be
determined from the saturated pressure of moist air.
To account for the effect of methanol crossover on the cathode overpotential it is
assumed that the methanol crossing the membrane completely reacts electrochemically
at the cathode. In this way the internal current (OHCHI 3 ) due to methanol oxidation can
be written as
MOHCHOHCH FNI
33 6= (6.27)
where the methanol flux in the membrane (MOHCHN
3) is obtained from Eq. (6.14).
The volumetric current density expression for methanol oxidation is taken from Meyers
et al. [26] as
+=
AC
AA
AC
AAACOHCH
ACOHCHOHCH
refART
F
RT
FC
kCaIj
ηαηαλ
expexp
3
33
,0 (6.28)
The current density is related to the volumetric current density using the following
equation
6 6
33
51 53
0, exp
exp
ACx xCH OHCH OH A A
Cell A refAC ACA Ax xCH OH
AC
kC FI j dx aI dx
RTFC
RT
α ηα ηλ
= =
+
∫ ∫ (6.29)
Equation (6.29) is used to calculate the anode overpotential for a givenCellI , assuming
Aη as constant in the anode catalyst layer AC.

Chapter 6: Passive feed Direct methanol fuel cell
202
At the cathode, the electrochemical reaction is modelled using Tafel equation for the
oxygen reduction taking in account the mixed potential. The cathode overpotential can
then be determined from:
=+CC
CC
CCrefO
CCOO
refOHCHCellRT
F
C
CIII
ηαexp
,
,0
2
223 (6.30)
The mass transfer coefficient in Eq. (6.4) can be determined from [172]:
( )( )2
27/816/9
6/1
/492.01
387.0825.0
+
×+==Sc
Ra
D
LhSh mass (6.31)
where Ra is the Rayleigh number ( ScGrRa ×= ), Sc the Schmidt number ( DSc /ν= )
and Gr is the Grashof number
∆=2
3
νC
CLgGr .
6.1.3.2. Heat transport
Based on the simplifications and assumptions described previously, the following
overall heat transfer equation can be proposed (see Fig. 6.1):
21 QQQQ CCAC +=+ (6.32)
The total heat generated in the DMFC is equal to the heat losses to the surrounding
environment at the anode and cathode.
Complementarly, the following heat transfer balances can be written:
13 QQQ AC −= (6.33)
32 QQQ CC += (6.34)
At the anode, heat generated by the electrochemical reaction in the AC is given by
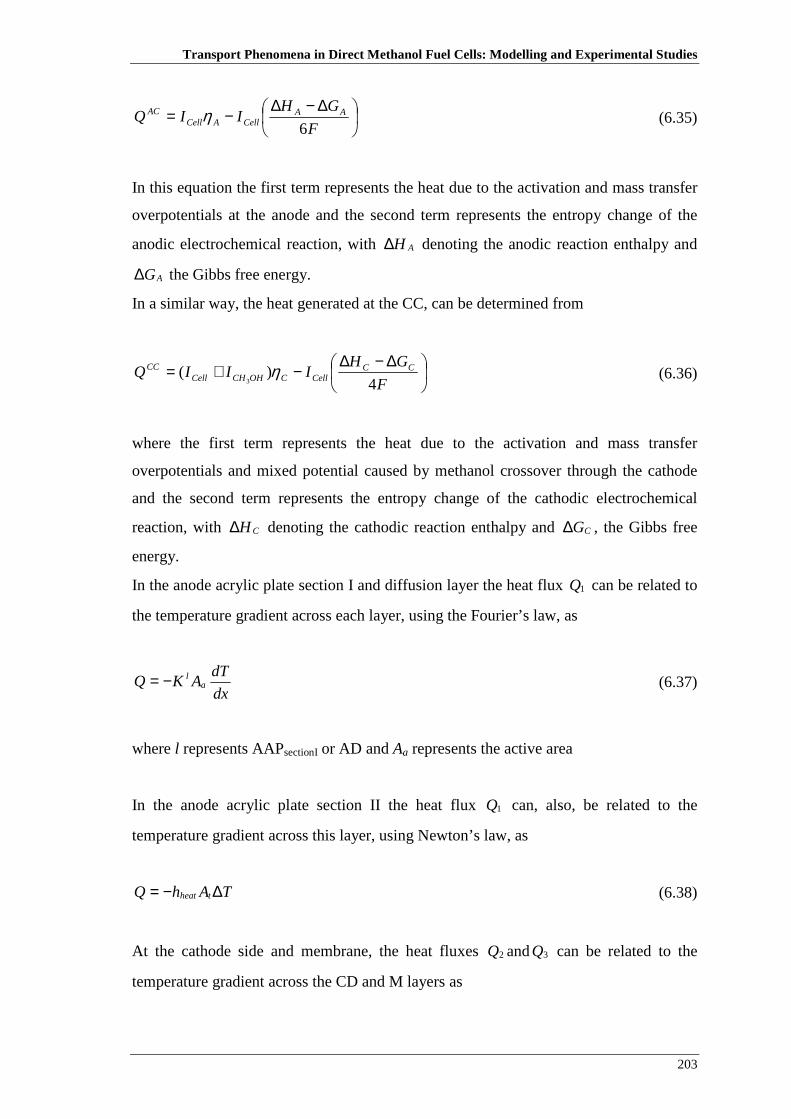
Transport Phenomena in Direct Methanol Fuel Cells: Modelling and Experimental Studies
203
∆−∆−=
F
GHIIQ AA
CellACellAC
6η (6.35)
In this equation the first term represents the heat due to the activation and mass transfer
overpotentials at the anode and the second term represents the entropy change of the
anodic electrochemical reaction, with AH∆ denoting the anodic reaction enthalpy and
AG∆ the Gibbs free energy.
In a similar way, the heat generated at the CC, can be determined from
∆−∆−+=
F
GHIIIQ CC
CellCOHCHCellCC
4)(
3η (6.36)
where the first term represents the heat due to the activation and mass transfer
overpotentials and mixed potential caused by methanol crossover through the cathode
and the second term represents the entropy change of the cathodic electrochemical
reaction, with CH∆ denoting the cathodic reaction enthalpy and CG∆ , the Gibbs free
energy.
In the anode acrylic plate section I and diffusion layer the heat flux 1Q can be related to
the temperature gradient across each layer, using the Fourier’s law, as
dx
dTAKQ a
l−= (6.37)
where l represents AAPsectionI or AD and Aa represents the active area
In the anode acrylic plate section II the heat flux 1Q can, also, be related to the
temperature gradient across this layer, using Newton’s law, as
TAhQ theat ∆−= (6.38)
At the cathode side and membrane, the heat fluxes 2Q and 3Q can be related to the
temperature gradient across the CD and M layers as
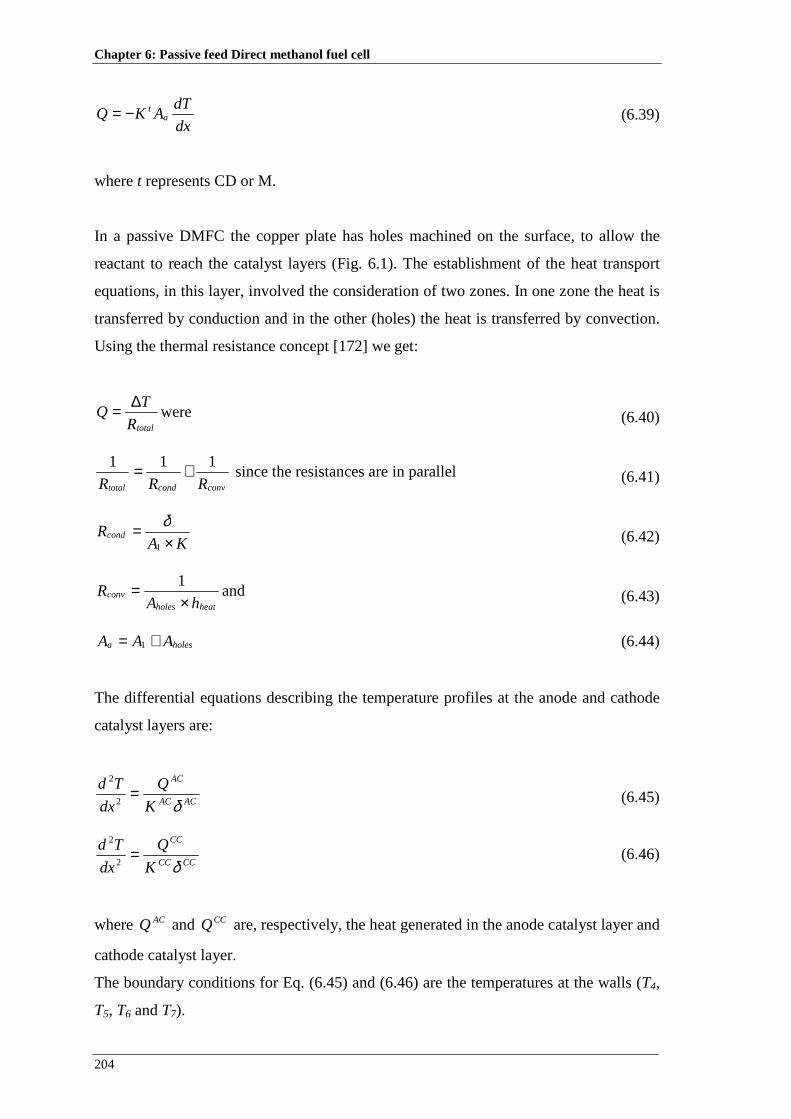
Chapter 6: Passive feed Direct methanol fuel cell
204
dx
dTAKQ a
t−= (6.39)
where t represents CD or M.
In a passive DMFC the copper plate has holes machined on the surface, to allow the
reactant to reach the catalyst layers (Fig. 6.1). The establishment of the heat transport
equations, in this layer, involved the consideration of two zones. In one zone the heat is
transferred by conduction and in the other (holes) the heat is transferred by convection.
Using the thermal resistance concept [172] we get:
totalR
TQ
∆= were (6.40)
convcondtotal RRR
111 += since the resistances are in parallel (6.41)
KARcond
×=
1
δ (6.42)
heatholesconv
hAR
×= 1
and (6.43)
holesa AAA += 1 (6.44)
The differential equations describing the temperature profiles at the anode and cathode
catalyst layers are:
ACAC
AC
K
Q
dx
Td
δ=
2
2
(6.45)
CCCC
CC
K
Q
dx
Td
δ=
2
2
(6.46)
where ACQ and CCQ are, respectively, the heat generated in the anode catalyst layer and
cathode catalyst layer.
The boundary conditions for Eq. (6.45) and (6.46) are the temperatures at the walls (T4,
T5, T6 and T7).

Transport Phenomena in Direct Methanol Fuel Cells: Modelling and Experimental Studies
205
For these layers. Fourier’s law gives
dx
dTAKQxxAt a
AC−== 14 : (6.47)
dx
dTAKQxxAt a
CC−== 36 : (6.48)
where dx
dT is calculated using the temperature profile obtained from the integration of
equations (6.45) and (6.46).
Finally, the heat transfer from the AAP section I and CCP to the ambient air can be
described using the Newton’s law as
TAhQ theat ∆−= (6.49)
The heat transfer coefficient, due to natural convection (Eq. 6.38), can be determined
from [172]:
( )( )2
27/816/9
6/1
Pr/492.01
387.0825.0
+
×+== Ra
K
LhNu heat (6.50)
where Ra is the Rayleigh number ( Pr×= GrRa ), Pr the Prandtl number ( K/Pr ν= ),
Gr is the Grashof number
∆=2
3
νβ TLg
Gr and L is the length of the active area, cm.
6.1.4. Cell performance
The determination of methanol and oxygen concentrations at the catalyst layers, the
temperature profiles and the anodic and cathodic overpotentials from the model
equations enables prediction of the cell voltage, which can be expressed as:
CellCellCACellCell RIEV −−−= ηη (6.51)
where

Chapter 6: Passive feed Direct methanol fuel cell
206
∂∂∆+−=T
ETUUE OHCHOCell 32 , (6.52)
Aη and Cη are the anode and cathode overpotencials and the membrane resistanceCellR
is given by
κδ M
CellR = (6.53)
where Mδ is membrane thickness and κ is the ionic conductivity of the membrane.
6.1.5. Analytical solutions - Mass transport
The methanol and water concentration profiles in AAP (section II) can be obtained
combining Eqs. (6.4) and (6.12) or (6.4) and (6.13):
+−= MOHCH
Cell
AAPOHCHmass
OHCHAAP
OHCH NF
I
hCC
3
3
33 6
1
,
0 (6.54)
( )16
2
22
,
0 +−= αFh
ICC
AAPOHmass
CellOH
AAPOH (6.55)
Combining equations (6.5), (6.8) and (6.12) or (6.13) yields the concentration profile in
holes section of the ACP. The concentration profiles in the AD are obtained by
combining Eqs. (6.6), (6.9) and (6.12) or (6.13). The solutions are:
( ) ( )xxD
Nxx
FD
ICKC
ADeffOHCH
MOHCH
ADeffOHCH
CellAAPOHCH
ACPOHCH −+−+= 2,2,2
3
3
3
33 6 (6.56)
( ) ( )xxFD
ICKC
ADeffOH
CellAAPOH
ACPOH −++= 2,2
2
22 6
1α (6.57)
Transport Phenomena in Direct Methanol Fuel Cells: Modelling and Experimental Studies
207
( ) ( )xxD
Nxx
FD
ICKC
ADeffOHCH
MOHCH
ADeffOHCH
CellACPOHCH
ADOHCH −+−+= 3,3,,33
3
3
3
33 6 (6.58)
( ) ( )xxFD
ICKC
ADeffOH
CellACPOH
ADOH −++= 3,,33
2
22 6
1α (6.59)
The methanol and water concentration profile in the AC can be obtained combining
Eqs. (6.7), (6.10) and (6.12) or (6.7), (6.10) and (6.13):
( ) ( )xxD
Nxx
FD
ICKC
ACeffOHCH
MOHCH
ACeffOHCH
CellADOHCH
ACOHCH −+−+= 4,4,,44
3
3
3
33 6 (6.60)
( ) ( )xxFD
ICKC
ACeffOH
CellADOH
ACOH −++= 4,,44
2
22 6
1α (6.61)
The concentration of methanol and water through the membrane can be obtained by
using Eqs. (6.12) and (6.16) or (6.13) and (6.16):
( )xxD
F
IN
CKCMeffOHCH
CellOHCHMOHCH
ACOHCH
MOHCH −
−+= 5,,55
3
3
3
33
ξ
(6.62)
( ) ( )xxFD
ndIxx
FD
ICKC
MeffOH
Cell
MeffOH
CellACOH
MOH −−−+= 5,5,,55
22
22 6 (6.63)
Combining Eqs. (6.12), (6.16) and (6.18) leads to an expression to calculate the
methanol flux through the membrane:
( )F
ICCK
DN CellOHCHM
OHCHAC
OHCHM
MeffOHCHM
OHCH3
33
3
3 ,6,55
, ξδ
+−= (6.64)
The concentration of methanol, water and oxygen through the CC can be obtained by
combining Eqs. (6.17), (6.18), (6.19), (6.20) and (6.21):
Chapter 6: Passive feed Direct methanol fuel cell
208
( ) ( )xxD
Nxx
FD
ICC
CCeffOHCH
MOHCH
CCeffOHCH
CellCCOHCH
CCOHCH −+−−= 6,6,,6
3
3
3
33 6 (6.65)
( )
++−+=F
I
F
I
F
I
D
xxCC OHCHCellCell
CCeffOH
CCOH
CCOH 3
5.0
63
2
22 ,
6,6
α (6.66)
( ) ( )xxD
Nxx
FD
ICC
CCeffO
MOHCH
CCeffO
CellCCO
CCO −+−+= 7,7,,7
2
3
2
22 2
3
4 (6.67)
Combining equations (6.21), (6.22) and (6.24) or (6.20), (6.22), and (6.24) gives the
concentration profile in CD.
( ) ( )xxD
Nxx
FD
ICKC
CDeffO
MOHCH
CDeffO
CellCCOO
CDO −+−+= 7,7,,7,7
2
3
2
222 2
3
4 (6.68)
( )
++−+=F
I
F
I
F
I
D
xxCKC OHCHCellCell
CDeffOH
CCOHOH
CDOH 3
5.0
63
2
222 ,
7,7,7
α (6.69)
The concentration of oxygen and water through the CCP can be obtained using Eqs.
(6.21), (6.23) and (6.25), (6.20) or (6.23) and (6.25):
( ) ( )xxD
Nxx
FD
ICKC
CDeffO
MOHCH
CCPeffO
CellCDOO
CCPO −+−+= 8,8,,8,8
2
3
2
222 2
3
4 (6.70)
( )
++−+=F
I
F
I
F
I
D
xxCKC OHCHCellCell
CCPeffOH
CDOHOH
CCPOH 3
5.0
63
2
222 ,
8,8,8
α (6.71)
From the solutions above a expression to calculate the ACOHCHC
3,5 , MOHCHC
3,6 , CCOC
2,7 , MOHC
2,5 ,
MOHC
2,6 and α is obtained:
Transport Phenomena in Direct Methanol Fuel Cells: Modelling and Experimental Studies
209
M
MeffOHCH
M
MOHCH
MeffOHCHCellOHCHCell
OHCHAC
OHCH CKD
CCD
F
CI
F
CICKKK
C
δ
δξ
15,
,61,
110234
,5
3
333
3
3
1
6
+
+−−= (6.72)
where:
ACPOHCHmass
ACPeffOHCH
ACP
ADeffOHCH
AD
ACeffOHCH
AC
h
KKK
D
KK
D
K
DC
3333 ,
234
,
34
,
4
,1 +++= δδδ (6.73)
6,
,
6,
,55,
6,
6,
,6
3
3
3
33
3
3
3
3
1
6
KD
D
KD
CKD
KFD
I
KFD
I
C
CCeffOHCH
M
CCMeffOHCH
CCeffOHCH
M
ACOHCH
CCMeffOHCH
CCeffOHCH
CCCellOHCH
CCeffOHCH
CCCell
MOHCH
δδ
δδδξδ
+
++−= (6.74)
2
3
43
22
2
2
22
,7,8
0
,7
MOHCHCell
OO
OCCO
NC
F
IC
KK
CC ++=
(6.75)
where:
22222222 ,7,8,,7,8,
,7,2
1
OOCCP
OmassOOCCPeff
O
CCP
OCDeff
O
CD
KKhKKDKDC −+= δδ
(6.76)
( )F
ICCKKKC Cell
OHM
OH 6
130432,5 22
+−= α (6.77)
where:
ACeffOH
AC
ADeffOH
AD
ACPeffOH
ACP
ACPOHmass D
K
D
KK
D
KKK
h
KKKKC
,
5
,
54
,
345
,
23453
2222
δδδ +++= (6.78)
46,7,8
,6 3263
22
2
2C
F
I
F
I
F
I
KKK
CC
OHCHCellCell
OHOH
satOHM
OH
+++=
α (6.79)
where:

Chapter 6: Passive feed Direct methanol fuel cell
210
CCeffOHCH
CC
CDeffOHOH
CD
DKDKKC
,6
,6,7
4
322
δδ += (6.80)
and
dM
MOH
MOH
Cell
MeffOH n
CC
I
FD6
6222 ,5,6
,
+
−−=
δα (6.81)
The model simulations presented in Chapter 6 section 6.3 were obtained based on the
parameters listed in Table 6.1 and presented in Appendix B.
Table 6.1 – Values for the parameters used in the model equations.
Parameter Value Reference
2OU 1.24 V [120]
OHCHU 3 0.03 V [120]
TE ∂∂ / -1.4 × 10⁻⁴V/K [166]
κ 0.036 S/cm [120]
Mδ 0.018 cm [120]
IItionIAAP ,secδ 0.50 cm real value
ADδ , CDδ 0.015 cm real value
ACδ , CCδ 0.0023 cm real value
ADε , CDε 0.71 [173]
ACε 0.81 [173]
CCε 0.86 [173]
a 1000 cm-1 [120]
OHCHrefI 3
,0 ( )( )( )TR /1353/1/35570exp10425.9 3 −× − A/cm2 [166]
2
,0O
refI ( )( )( )TR /1353/1/73200exp10222.4 6 −× − A/cm2 [166]
k 4105.7 −× [120]
λ 9108.2 −× mol/cm3 [120]
Aα 0.52 [120]
Cα 1.55 [120]

Transport Phenomena in Direct Methanol Fuel Cells: Modelling and Experimental Studies
211
52−K , OHK 2,87− 0.8 assumed
2,87 OK − 1.25 assumed
6K 0.001 assumed
L 5 cm real value
CCCDeffOD ,,
2 ( ) ( )[ ]PTCCCD ××× − 772.27/108.5 475.1, 5.2
ε cm2/s [174]
CCPeffOD ,
2 ( ) ( )[ ]PT ××× − 772.27/108.5 475.1 cm2/s [174]
ACPeffOHCHD ,
3 ( ) ( )[ ]485.9/10608.7 2
7 ××× −OHT µ cm2/s [174]
ACADeffOHCHD ,,
3 ( ) ( )[ ]485.9/10608.7 2
5.2 7, ××× −OH
ACAD T µε cm2/s [174]
CCeffOHCHD ,
3 ( ) ( )[ ]PTCC ××× − 904.33/108.5 475.15.2
ε cm2/s [174]
MeffOHCHD ,
3 ( )( )T/1333/12436exp109.4 6 −×× − cm2/s [120]
ACPeffOHD ,
2 ( ) ( )[ ]833.5/10295.6 3
7 ××× −OHCHT µ cm2/s [174]
ACADeffOHD ,,
2 ( ) ( )[ ]833.5/10295.6 3
5.2 7, ××× −OHCH
ACAD T µε cm2/s [174] CCCDeff
OHD ,,2
( ) ( )[ ]PTCCCD ××× − 523.25/102.6 475.1, 5.2
ε cm2/s [174] Meff
OHD ,2
( )( )T/1303/12060exp100.2 6 −×× − cm2/s [87]
OHCH3ξ OHCHx 35.2 × [120]
dn ( )( )T/1333/11029exp9.2 −× [166]
CCPACP δδ , 0.05 cm real value
MK 0.0043 W/cmK [173]
ADK 41.95 6.57 10 T−+ × W/mK [173]
CDK 51.71 2.96 10 T−+ × W/mK [173]
ACK ( ) ( )41 86.7 0.341 9.26 10AC ACε ε −− × + + × W/mK [173]
CCK ( ) ( )51 71 0.0034 7.60 10CC CCε ε −− × + + × W/mK [173]
6.2. Experimental Setup for a passive feed DMFC
6.2.1. Fuel cell design
A passive feed DMFC was «in-house» developed following the basic demands:
use of standard state of the art materials available on the market;
high flexibility, i. e. easy change exchange media connections;
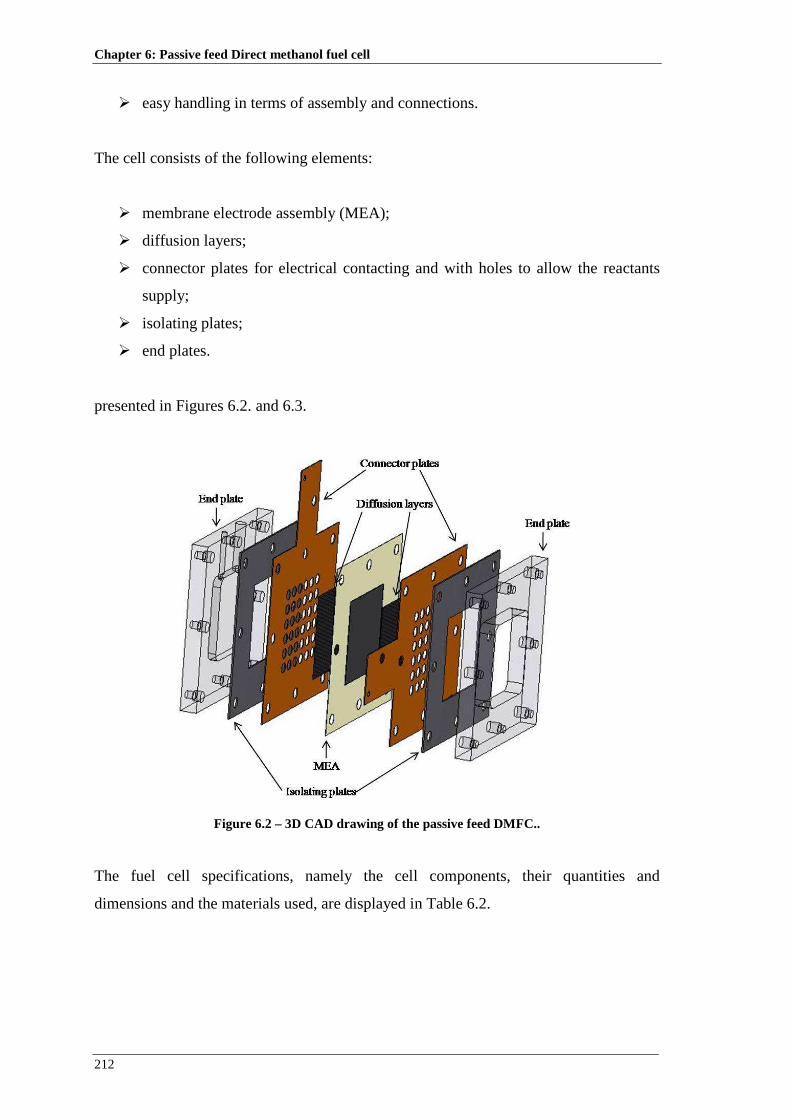
Chapter 6: Passive feed Direct methanol fuel cell
212
easy handling in terms of assembly and connections.
The cell consists of the following elements:
membrane electrode assembly (MEA);
diffusion layers;
connector plates for electrical contacting and with holes to allow the reactants
supply;
isolating plates;
end plates.
presented in Figures 6.2. and 6.3.
Figure 6.2 – 3D CAD drawing of the passive feed DMFC..
The fuel cell specifications, namely the cell components, their quantities and
dimensions and the materials used, are displayed in Table 6.2.

Transport Phenomena in Direct Methanol Fuel Cells: Modelling and Experimental Studies
213
Table 6.2 – Different elements of the passive feed DMFC.
Fuel cell – Specifications
Cell active area 25 cm2
Total cell area 100 cm2
Cell components Material Quantity Dimensions (cm)
Connector plates gold plated copper 2 10x10x0.05
End plates acrylic 2 10x10x1
Isolating plates rubber 2 10x10x0.1
Anode catalyst layer Platinum/Ruthenium 4 mg/cm2 1 5x5x0.0023
Cathode catalyst layer Platinum black 4 mg/cm2 1 5x5x0.0023
Membrane Nafion 117 and 115 1 5x5x(*)
Diffusion layers carbon cloth 2 5x5x0.035
(*) this dimension depends on the material used.
Figure 6.3 – Photograph of an «in-house» designed passive feed DMFC.
6.2.1.1. End Plates
Two 10 mm thick acrylic plates are used for bracing the cell and apply the desired
tension on the cell elements, (Fig. 6.4 and Fig. 6.5). Both end plates are connected by a
total of 8 bolts (diameter 6.2 mm), running through plastic bushes to prevent electrical
contact between the end plates. As a standard, the cell is assembled applying a torque of
5 Nm on the bolts. The anode end plate, contacting with the copper plate, contains a
chamber with 5 mm were the methanol solution is introduced (Fig. 6.4).

Chapter 6: Passive feed Direct methanol fuel cell
214
Figure 6.4 – Anode end plate (acrylic) (a) photograph, (b) 3D CAD drawing.
Figure 6.5 – Cathode end plate (acrylic) (a) photograph, (b) 3D CAD drawing.
6.2.1.2. Insulating Plates
To avoid electrical contact between connector plates and the end plates, a rubber plate
(thickness 1 mm) is placed between both plates. This rubber plate has a hole in the
centre, 5 cm x 5 cm, to allow the flow of the reactants (Fig. 6.6).
Figure 6.6 – Photograph of the isolating plates.

Transport Phenomena in Direct Methanol Fuel Cells: Modelling and Experimental Studies
215
6.2.1.3. Connector plates
For the electrical connection two gold plated copper plates of 0.5 mm thickness are
used. Also all the electrical connectors are gold plated to ensure minimal ohmic
resistances at various connection points. The connector plate has 36 holes in the centre,
5 cm x 5 cm, with a diameter of 6 mm to allow the reactants supply (Fig. 6.7).
Figure 6.7 – Photograph of the connector plates.
6.2.1.4. Membrane Electrode Assembly (MEA) and diffusion layers
As before, the abbreviation MEA always refers to the membrane coated with catalyst
layers but without diffusion layers. The MEAs used were similar to those used in the
active feed DMFC with an active area of 25 cm2 (5 cm x 5 cm) and a total area of 100
cm2. The membranes tested were made by Nafion 117 and 115. Unsupported platinum
black and platinum-ruthenium were used as catalyst (recall Fig. 4.6).
Carbon cloth and carbon paper (recall Fig. 4.7) were used both as anode and cathode
diffusion layers. To achieve a higher hydrophobicity these layers are coated with PTFE
with a content of 30 wt%.
The diffusion layers are put on both sides of the MEA, and the whole sandwich
structure mounted between the connector plates of the fuel cell. The physical properties
of all the materials used can be found in the Appendix B.
Chapter 6: Passive feed Direct methanol fuel cell
216
6.2.2. Methanol Test Kit Testing Unit
The test unit used for the active feed DMFC (described in section 4.2) was also
employed for the passive DMFC, although in this case only with the loadbank
subsystem acting as a large variable power resistor as described in detailed in section
4.2.3.
6.2.3. Experimental procedure
The start-up procedure performance was:
1. The fuel cell tank in the AAP (regarding the Figures 6.3 and 6.4) was filled with
the methanol solution needed for the experiment;
2. The computer, the MTK unit and the FCPower software were turned on;
3. The cell was operated galvanostatically, so the current applied range values was
0 to maximum current allowed by the fuel cell, with a step of 0.1A. At the open
circuit conditions the cell was operated fifteen minutes and at the other values of
current applied, the cell was operated three minutes until reaching the steady
state conditions.
4. For each value of current applied, the cell voltage was measured and the power
calculated;
5. The MTK system was turned off;
6. The FCPower software was closed.
6.3. Experimental and Modelling studies for a passive feed DMFC
6.3.1. Results and Discussion
As in the experimental studies reported in Chapter 5, for each set of operating
conditions, different tests were performed until obtaining agreement.

Transport Phenomena in Direct Methanol Fuel Cells: Modelling and Experimental Studies
217
6.3.1.1. Model validation
In this section, examples of model predictions obtained after implementation of the
model are presented. The conditions chosen to generate the simulations are similar to
those used by the authors in the experiments.
To validate the model developed for a passive feed DMFC a set of experiments was
performed with five different methanol concentrations, 1M, 2M, 3M, 4M and 5M, using
a Nafion 115 membrane. A 30 wt% carbon cloth type A (E-TEK) gas diffusion layer
was used on the anode and on the cathode side. An anode catalyst loading of 4 mg/cm2
Pt/Ru and a cathode catalyst loading of 4 mg/cm2 Pt was used. Since in passive DMFC
systems the temperature rises with time due to the electrochemical reactions, in order to
minimize this effect on the results presented in this section all the experiments were
conducted at a controlled temperature, ensuring a constant temperature value during
each experiment.
In Fig. 6.8, the predicted polarization curves for 1M to 5M methanol solutions are
presented. The open-circuit voltage is much lower than the thermodynamic equilibrium
cell voltage as a result of methanol crossover. The fuel cell performance increases with
an increase of the methanol feed concentration. As can be seen in Fig. 6.8, the present
model describes well the experimental results for all the range of current densities due
to the integration, on the model, of the mass transfer effects at the cathode side.
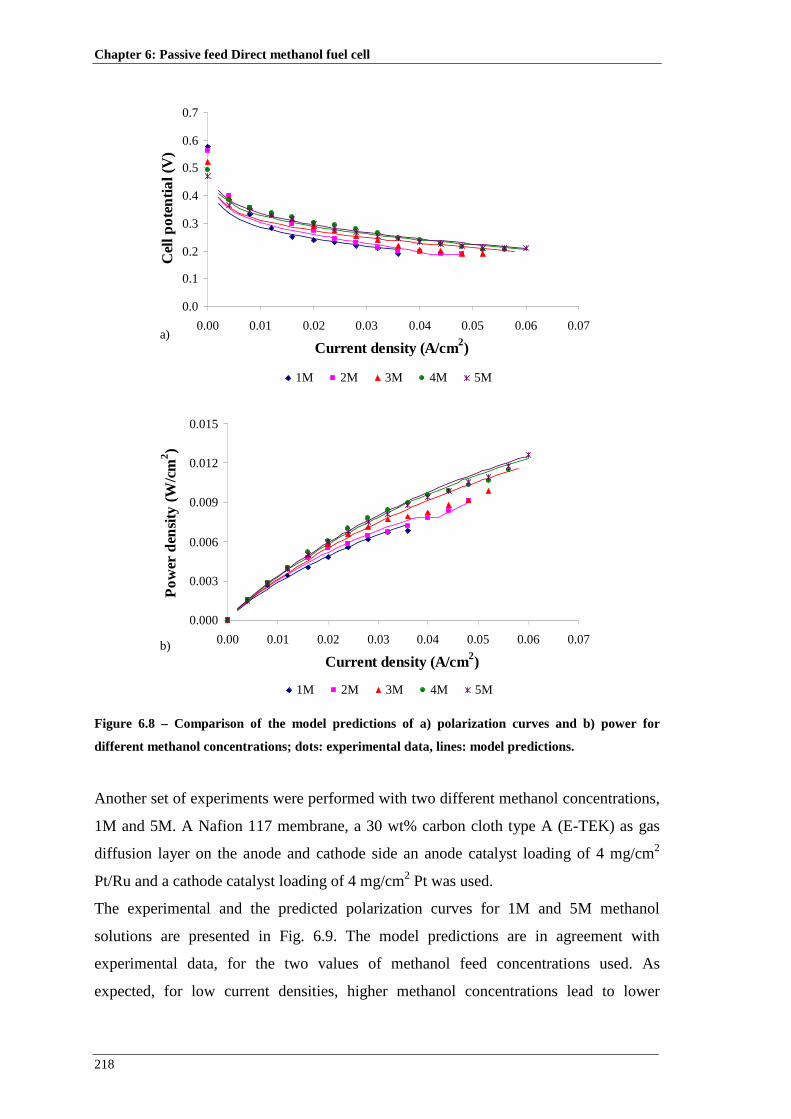
Chapter 6: Passive feed Direct methanol fuel cell
218
0.0
0.1
0.2
0.3
0.4
0.5
0.6
0.7
0.00 0.01 0.02 0.03 0.04 0.05 0.06 0.07
Current density (A/cm2)
Cel
l po
ten
tial (
V)
1M 2M 3M 4M 5M
a)
0.000
0.003
0.006
0.009
0.012
0.015
0.00 0.01 0.02 0.03 0.04 0.05 0.06 0.07
Current density (A/cm2)
Po
wer
den
sity
(W
/cm2 )
1M 2M 3M 4M 5M
b)
Figure 6.8 – Comparison of the model predictions of a) polarization curves and b) power for
different methanol concentrations; dots: experimental data, lines: model predictions.
Another set of experiments were performed with two different methanol concentrations,
1M and 5M. A Nafion 117 membrane, a 30 wt% carbon cloth type A (E-TEK) as gas
diffusion layer on the anode and cathode side an anode catalyst loading of 4 mg/cm2
Pt/Ru and a cathode catalyst loading of 4 mg/cm2 Pt was used.
The experimental and the predicted polarization curves for 1M and 5M methanol
solutions are presented in Fig. 6.9. The model predictions are in agreement with
experimental data, for the two values of methanol feed concentrations used. As
expected, for low current densities, higher methanol concentrations lead to lower

Transport Phenomena in Direct Methanol Fuel Cells: Modelling and Experimental Studies
219
performances due to higher methanol crossover. The methanol that crosses the
membrane reacts with the oxygen, at the cathode side, to form a mixed potential. Higher
methanol concentration leads to a higher mixed potential, thereby causing a lower cell
performance. For high current densities the more concentrated methanol solution shows
a better performance, due to an enhance on the methanol oxidation reaction and
consequently a decrease on the anode overpotential.
0.0
0.1
0.2
0.3
0.4
0.5
0.6
0.00 0.01 0.02 0.03 0.04 0.05 0.06
Current density (A/cm2)
Cel
l po
ten
tial (
V)
0.000
0.003
0.006
0.009
0.012
Po
wer
den
sity
(W
/cm2 )
1M 5M
Figure 6.9 – Comparison of the model predictions of a) polarization curves and b) power for
different methanol concentrations; dots: experimental data, lines: model predictions.
In Fig. 6.10, data from Pan [160] were used to validate the model. This work was
chosen since the operating and design parameters used were similar to those reported in
the present work. In Fig. 6.10, the predicted polarization curves for 1M and 3M
methanol solutions, for a fuel cell temperature of 25ºC, are presented. Model predictions
are close to experimental data presented by Pan [160].

Chapter 6: Passive feed Direct methanol fuel cell
220
0.0
0.1
0.2
0.3
0.4
0.5
0.6
0.7
0.00 0.02 0.04 0.06 0.08 0.10
Current density (A/cm2)
Cel
l po
ten
tial (
V)
1M [160] 3M [160]
Figure 6.10 – Comparison of the model predictions for different 1M and 3M methanol
concentrations; dots: experimental published data [160], lines: model predictions.
Figure 6.11 shows the predictions of the methanol crossover as a function of current
density for different methanol concentrations. As already referred the methanol that
crosses the membrane reacts with oxygen on the cathode side forming a mixed potential
and consequently a parasite current. This parasite current named leakage current
represents fuel losses. According to Eq. (6.27), the methanol crossover can be expressed
in terms of a leakage current witch gives a more understanding idea of the effect of the
loss in efficiency due to methanol crossover. As can be seen in Fig. 6.11, and as
expected, the leakage current increases with methanol concentration and decreases with
current density. In this way, the leakage current and consequently the methanol
crossover can be reduced by running the cell at low methanol concentrations and high
current densities.

Transport Phenomena in Direct Methanol Fuel Cells: Modelling and Experimental Studies
221
0.00
0.02
0.04
0.06
0.08
0.10
0.12
0.14
0.00 0.01 0.02 0.03 0.04 0.05 0.06 0.07
Current density (A/cm2)
Lea
kage
cu
rren
t (A
/cm
2 )
1M 2M 3M 4M 5M
Figure 6.11 – Model prediction for methanol crossover for different methanol feed concentrations.
Predicted methanol concentration profiles across de anode and membrane, are depicted
in Fig. 6.12, when the cell is feed with a 3M methanol solution at current densities of
10, 30 and 50 mA/cm2. During the time considered for the analysis, the concentration
profile at the methanol reservoir in the anode acrylic plate slightly decreases near the
interface with the copper plate due to the fact that the diffusion of methanol occurs by
natural convection (see Eq. (6.4)). In the other layers, the methanol concentration
decreases due to mass transfer diffusion, methanol consumption in the catalyst layer and
the methanol crossover through the membrane toward the cathode side. As can be seen
by the plots of the concentration profile in the membrane presented in this figure, the
methanol crossover rate in the membrane decreases with the increase of current density.

Chapter 6: Passive feed Direct methanol fuel cell
222
0.0
0.5
1.0
1.5
2.0
2.5
3.0
0.45 0.49 0.53 0.57 0.61
x (cm)
Met
ha
no
l co
nce
ntra
tion
(M
)
0.01 A/cm2 0.03 A/cm2 0.03 A/cm2
AAP ACP AD AC M
A/cm2 A/cm2 A/cm2
Figure 6.12 – Predicted methanol concentration profiles in the cell for different current densities.
Operating conditions: methanol concentration 3M.
Figure 6.13 shows the water concentration across de anode and membrane. As is
evident from this figure, water diffusion occurs in ACP, AD, AC and M and water
consumption in AC, so the water concentration profile decreases across these layers.
The slope of the concentration profile in the membrane is higher than in the other layers
showing a significant water crossover toward the cathode side.
0
5
10
15
20
25
30
35
40
45
50
0.45 0.49 0.53 0.57 0.61
x (cm)
Wa
ter
con
cen
tratio
n (
M)
0.01 A/cm2 0.03 A/cm2 0.03 A/cm2
AAP ACP AD AC M
A/cm2 A/cm2 A/cm2
Figure 6.13 – Predicted water concentration distribution in the cell at different current densities.
Operating conditions: methanol concentration 3M.
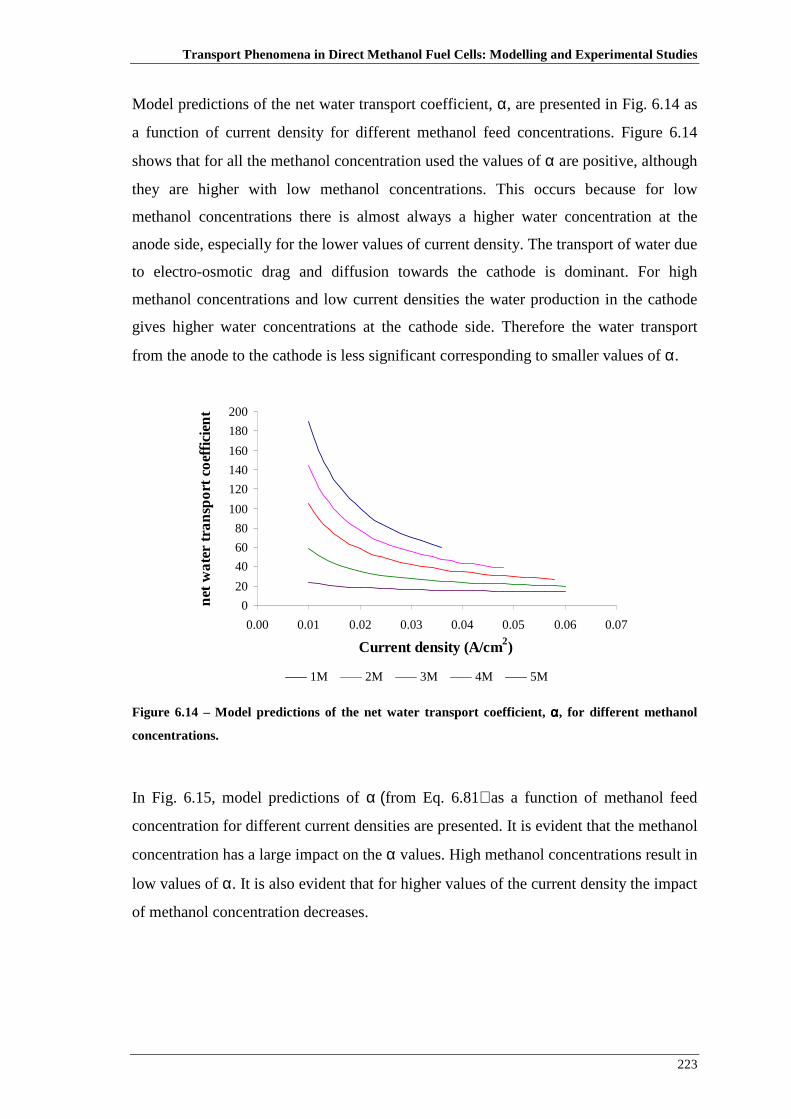
Transport Phenomena in Direct Methanol Fuel Cells: Modelling and Experimental Studies
223
Model predictions of the net water transport coefficient, α, are presented in Fig. 6.14 as
a function of current density for different methanol feed concentrations. Figure 6.14
shows that for all the methanol concentration used the values of α are positive, although
they are higher with low methanol concentrations. This occurs because for low
methanol concentrations there is almost always a higher water concentration at the
anode side, especially for the lower values of current density. The transport of water due
to electro-osmotic drag and diffusion towards the cathode is dominant. For high
methanol concentrations and low current densities the water production in the cathode
gives higher water concentrations at the cathode side. Therefore the water transport
from the anode to the cathode is less significant corresponding to smaller values of α.
0
20
40
60
80
100
120
140
160
180
200
0.00 0.01 0.02 0.03 0.04 0.05 0.06 0.07
Current density (A/cm2)
net
wa
ter
tran
spo
rt co
effic
ien
t
1M 2M 3M 4M 5M
Figure 6.14 – Model predictions of the net water transport coefficient, αααα, for different methanol
concentrations.
In Fig. 6.15, model predictions of α (from Eq. 6.81) as a function of methanol feed
concentration for different current densities are presented. It is evident that the methanol
concentration has a large impact on the α values. High methanol concentrations result in
low values of α. It is also evident that for higher values of the current density the impact
of methanol concentration decreases.

Chapter 6: Passive feed Direct methanol fuel cell
224
0
20
40
60
80
100
120
140
160
180
200
0 1 2 3 4 5
Methanol concentration (M)
net
wa
ter
tran
spo
rt co
effic
ien
t
0.01 A/cm2 0.02 A/cm2 0.03 A/cm2A/cm2 A/cm2 A/cm2
Figure 6.15 – Influence of methanol concentration on the net water transport coefficient at different
current densities.
Figure 6.16 shows the temperature distribution in the active section of the cell (anode
diffusion and catalyst layer, membrane and cathode catalyst and diffusion layer) for a
methanol concentration of 3M and operating at different current densities. For the three
values of current density chosen, the temperature in the anode side is higher. This is
because the heat generation rate by the anodic overpotential is higher than the
endothermic heat demanded by the electrochemical reaction of methanol oxidation.
With an increase in current density the difference between the anode and the cathode
side increases as is evident in Fig. 6.16.

Transport Phenomena in Direct Methanol Fuel Cells: Modelling and Experimental Studies
225
292.8
293.0
293.2
293.4
293.6
293.8
294.0
294.2
294.4
1.05 1.07 1.09 1.11 1.13 1.15
x (cm)
Tem
per
atu
re (
K)
0.01 A/cm2 0.03 A/cm2 0.03 A/cm2
AD AC M CC CD
A/cm2 A/cm2 A/cm2
Figure 6.16 – Prediction for the temperature distribution in the cell at different current densities.
Operating conditions: methanol concentration 3M.
6.3.1.2. Water Management in a Passive DMFC – model simulations
As already referred the water management is a key issue on the passive DMFCs. In the
following, the results of a simulation study using a developed model for passive
DMFCs are presented. Particular attention is paid to the water distribution across the
cell. The influence of methanol concentration, membrane thicknesses, gas diffusion
layers properties and catalyst loading on the net water transport coefficient and on the
cell performance is put in evidence. As a result of these modelling results, a tailored
MEA was proposed to achieve low methanol and water crossover and high power
density, operating at high methanol concentrations. The model was validated with an
«in-house» designed passive DMFC.
Model predictions of the net water transport coefficient, α, (from Eq. 6.81) are
presented in Fig. 6.17 as a function of current density, for the two methanol feed
concentrations studied (1M and 5M). As can be seen from the plots, the methanol
concentration has a large influence on the water crossover (α values). Low values of α
are achieved using high methanol concentrations. This may be explained by the fact that
lower methanol feed concentrations result in higher water concentrations on the anode
side. The concentration gradient of water between the anode and cathode side is higher,
so the transport of water toward the cathode tends to be dominant. For higher methanol

Chapter 6: Passive feed Direct methanol fuel cell
226
concentrations the amount of water present on the anode side is smaller and the water
production in the cathode gives higher water concentrations in this side. In this
situation, the water transport from the anode to the cathode is still dominant but, since
the water concentration gradient is smaller the values of α are smaller.
0
20
40
60
80
100
120
140
0.00 0.01 0.02 0.03 0.04 0.05 0.06
Current density (A/cm2)
net
wa
ter
tran
spo
rt co
effic
ien
t
1M 5M
Figure 6.17 – Influence of methanol concentration on net water transport coefficient.
To analyse the effect of the anode gas diffusion layer material and thickness on fuel cell
performance and on the net water transport coefficient two different materials were
used: carbon cloth and carbon paper, both materials with a PTFE content of 30%.
Regarding the carbon cloth, Type A (E-TEK), thickness of 0.35 mm and carbon cloth
Type C (E-TEK), thickness of 0.65 mm were used in the simulations. For carbon paper,
Toray TGPH-030, thickness of 0.09 mm and Toray TGPH-090, thickness of 0.026 mm
were considered in the model predictions.
Carbon paper and carbon cloth with relatively high pore sizes enhance the mass transfer
across the anode and contribute for a uniformly distribution of reactants over the entire
electrode. Both, materials are carbon-fiber-based porous materials, but carbon paper is
non-woven while carbon cloth is woven. Carbon cloth is more porous, less tortuous than
carbon paper. The differences in porosity, permeability, pore size distributions, surface
wettability and liquid retention between these two materials result in different two-
phase flow and transport characteristics.

Transport Phenomena in Direct Methanol Fuel Cells: Modelling and Experimental Studies
227
Figure 6.18 a) and b) shows, respectively, the effect of the anode gas diffusion layer
material on the fuel cell performance and on the net water transport coefficient. The
plots from the figure show that a slightly better performance is obtained with carbon
cloth as the anode gas diffusion layer (GDL), probably due to a thicker thickness of this
layer relatively to the carbon paper. Thicker gas diffusion layers lead to lower values of
methanol and water crossover due to the fact that thicker electrodes had higher mass
transport resistances reducing the amount of water and methanol reaching the
membrane. As the cell performance is dependent on the methanol crossover, lower
performances are obtained for thinner anodes. The plots of the figure 6.18 b) show that
lower values of α are obtained for the thicker GDL material. These results show that the
use of thicker gas diffusion layers leads to an enhancement of the water transport
toward the anode decreasing the values of α.
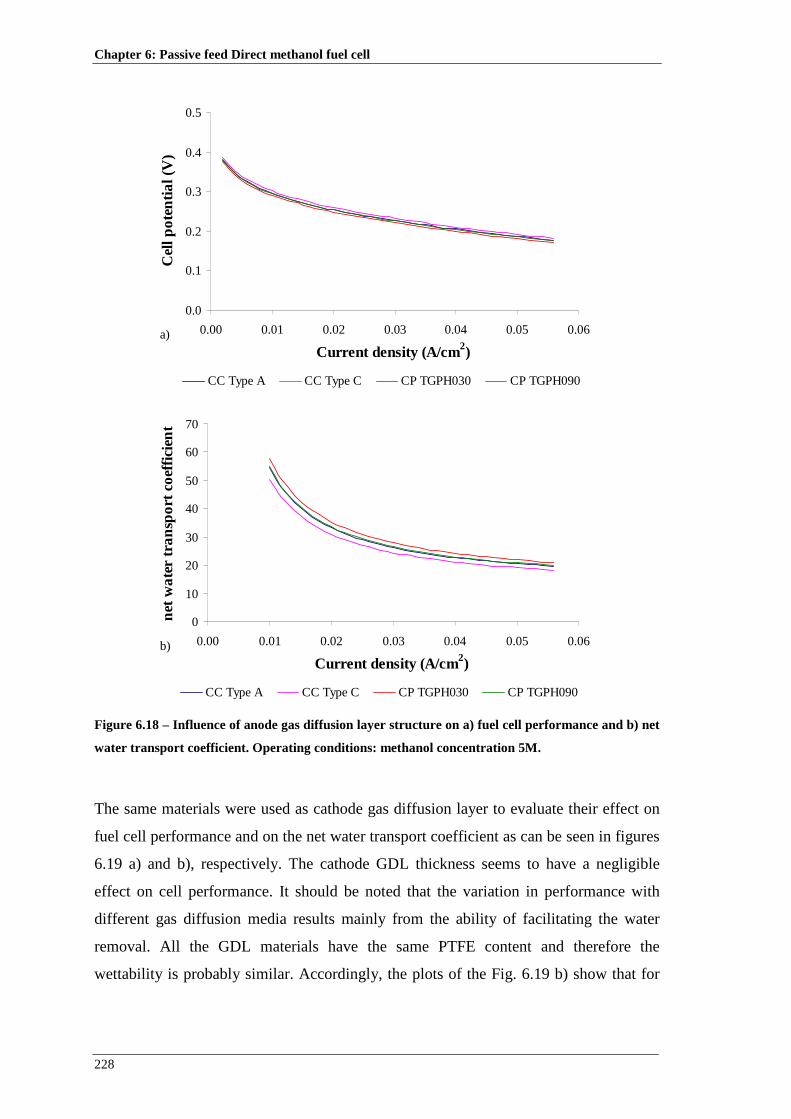
Chapter 6: Passive feed Direct methanol fuel cell
228
0.0
0.1
0.2
0.3
0.4
0.5
0.00 0.01 0.02 0.03 0.04 0.05 0.06
Current density (A/cm2)
Cel
l po
ten
tial (
V)
CC Type A CC Type C CP TGPH030 CP TGPH090
a)
0
10
20
30
40
50
60
70
0.00 0.01 0.02 0.03 0.04 0.05 0.06
Current density (A/cm2)
net
wa
ter
tran
spo
rt co
effic
ien
t
CC Type A CC Type C CP TGPH030 CP TGPH090
b)
Figure 6.18 – Influence of anode gas diffusion layer structure on a) fuel cell performance and b) net
water transport coefficient. Operating conditions: methanol concentration 5M.
The same materials were used as cathode gas diffusion layer to evaluate their effect on
fuel cell performance and on the net water transport coefficient as can be seen in figures
6.19 a) and b), respectively. The cathode GDL thickness seems to have a negligible
effect on cell performance. It should be noted that the variation in performance with
different gas diffusion media results mainly from the ability of facilitating the water
removal. All the GDL materials have the same PTFE content and therefore the
wettability is probably similar. Accordingly, the plots of the Fig. 6.19 b) show that for
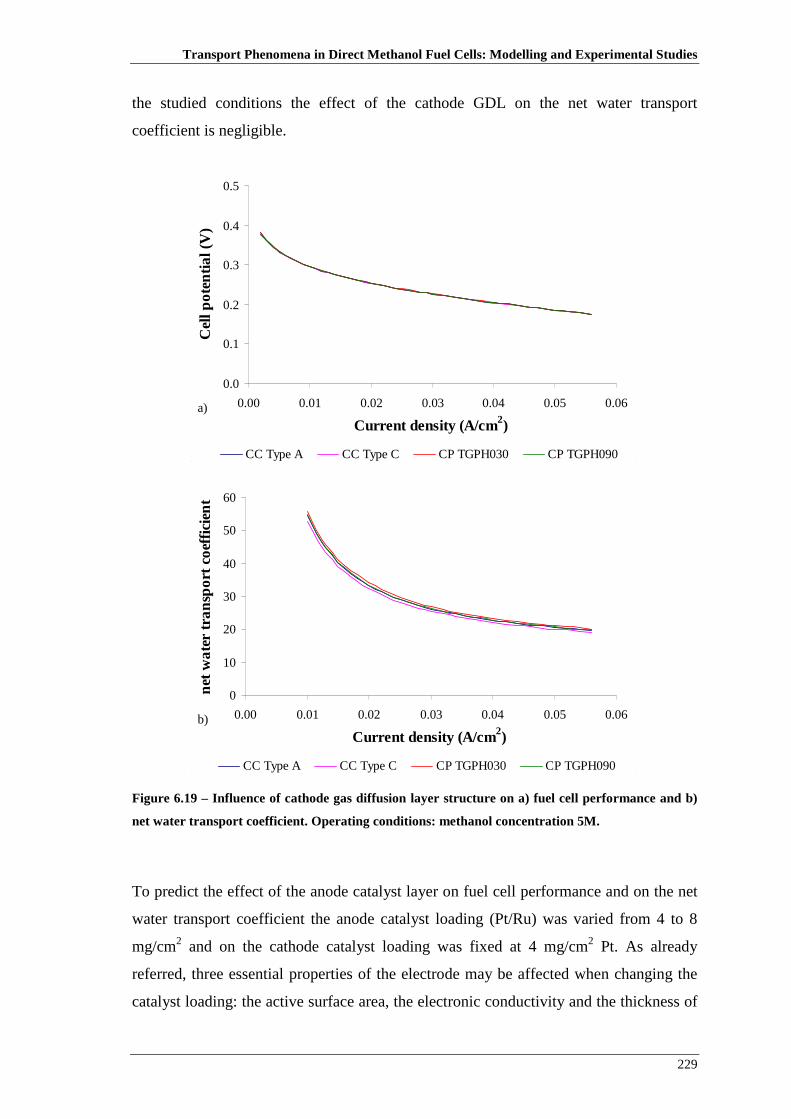
Transport Phenomena in Direct Methanol Fuel Cells: Modelling and Experimental Studies
229
the studied conditions the effect of the cathode GDL on the net water transport
coefficient is negligible.
0.0
0.1
0.2
0.3
0.4
0.5
0.00 0.01 0.02 0.03 0.04 0.05 0.06
Current density (A/cm2)
Cel
l po
ten
tial (
V)
CC Type A CC Type C CP TGPH030 CP TGPH090
a)
0
10
20
30
40
50
60
0.00 0.01 0.02 0.03 0.04 0.05 0.06
Current density (A/cm2)
net
wa
ter
tran
spo
rt co
effic
ien
t
CC Type A CC Type C CP TGPH030 CP TGPH090
b)
Figure 6.19 – Influence of cathode gas diffusion layer structure on a) fuel cell performance and b)
net water transport coefficient. Operating conditions: methanol concentration 5M.
To predict the effect of the anode catalyst layer on fuel cell performance and on the net
water transport coefficient the anode catalyst loading (Pt/Ru) was varied from 4 to 8
mg/cm2 and on the cathode catalyst loading was fixed at 4 mg/cm2 Pt. As already
referred, three essential properties of the electrode may be affected when changing the
catalyst loading: the active surface area, the electronic conductivity and the thickness of
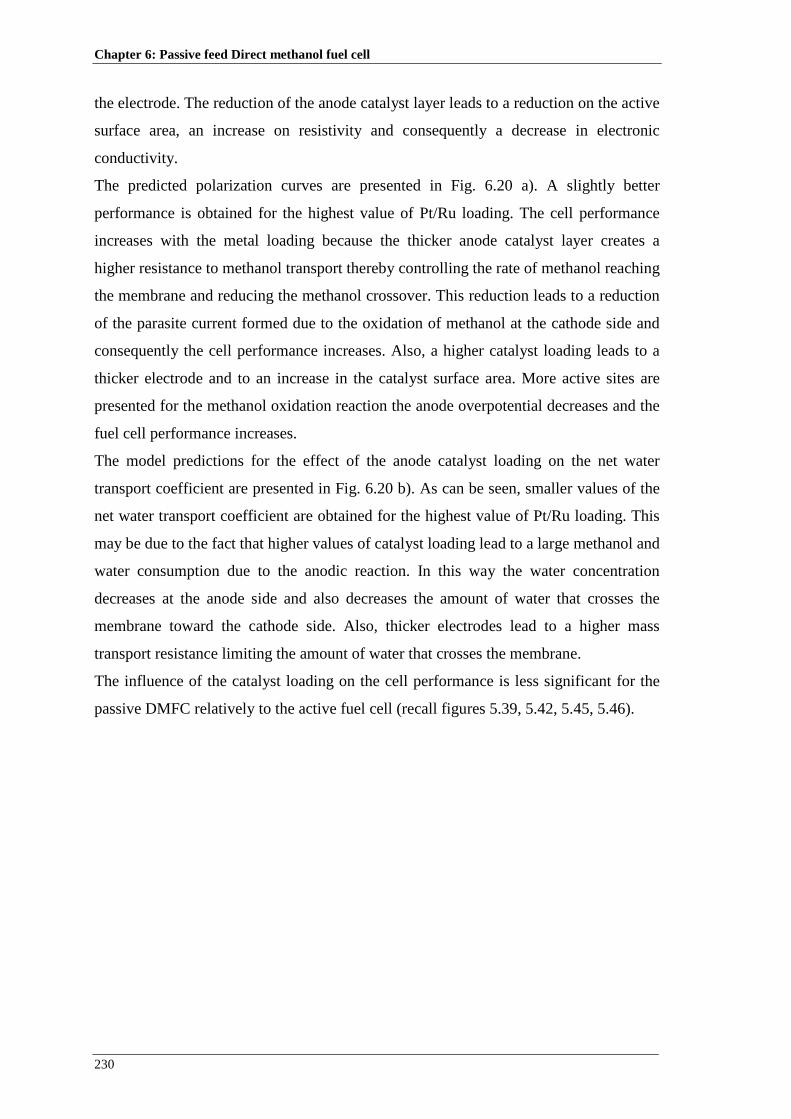
Chapter 6: Passive feed Direct methanol fuel cell
230
the electrode. The reduction of the anode catalyst layer leads to a reduction on the active
surface area, an increase on resistivity and consequently a decrease in electronic
conductivity.
The predicted polarization curves are presented in Fig. 6.20 a). A slightly better
performance is obtained for the highest value of Pt/Ru loading. The cell performance
increases with the metal loading because the thicker anode catalyst layer creates a
higher resistance to methanol transport thereby controlling the rate of methanol reaching
the membrane and reducing the methanol crossover. This reduction leads to a reduction
of the parasite current formed due to the oxidation of methanol at the cathode side and
consequently the cell performance increases. Also, a higher catalyst loading leads to a
thicker electrode and to an increase in the catalyst surface area. More active sites are
presented for the methanol oxidation reaction the anode overpotential decreases and the
fuel cell performance increases.
The model predictions for the effect of the anode catalyst loading on the net water
transport coefficient are presented in Fig. 6.20 b). As can be seen, smaller values of the
net water transport coefficient are obtained for the highest value of Pt/Ru loading. This
may be due to the fact that higher values of catalyst loading lead to a large methanol and
water consumption due to the anodic reaction. In this way the water concentration
decreases at the anode side and also decreases the amount of water that crosses the
membrane toward the cathode side. Also, thicker electrodes lead to a higher mass
transport resistance limiting the amount of water that crosses the membrane.
The influence of the catalyst loading on the cell performance is less significant for the
passive DMFC relatively to the active fuel cell (recall figures 5.39, 5.42, 5.45, 5.46).

Transport Phenomena in Direct Methanol Fuel Cells: Modelling and Experimental Studies
231
0.0
0.1
0.2
0.3
0.4
0.5
0.00 0.01 0.02 0.03 0.04 0.05 0.06
Current density (A/cm2)
Cel
l po
ten
tial (
V)
4 mg/cm2 8 mg/cm2
a)
mg/cm2mg/cm2
0
10
20
30
40
50
60
0.00 0.01 0.02 0.03 0.04 0.05 0.06
Current density (A/cm2)
net
wa
ter
tran
spo
rt co
effic
ien
t
4 mg/cm2 8 mg/cm2
b)
mg/cm2mg/cm2
Figure 6.20 – Influence of anode catalyst layer loadings on a) fuel cell performance and b) net water
transport coefficient. Operating conditions: methanol concentration 5M.
The model predictions of cell performance for different cathode catalyst loadings are
presented in Fig. 6.21 a). Two values were used for the cathode catalyst loading (Pt) 4
and 8 mg/cm2. The other electrode, anode side, was fixed at 4 mg/cm2 Pt/Ru. From the
plots, it is evident that lower cathode catalyst loadings lead to a slight decrease in the
fuel cell performance. This is due to the fact that the reduction of the cathode catalyst
layer leads to a reduction on the active surface area. An increase on the catalyst loading
causes an increase on the active surface area and an enhanced of the oxygen reduction
reaction. This may be very advantageous at the cathode, since mixed potential
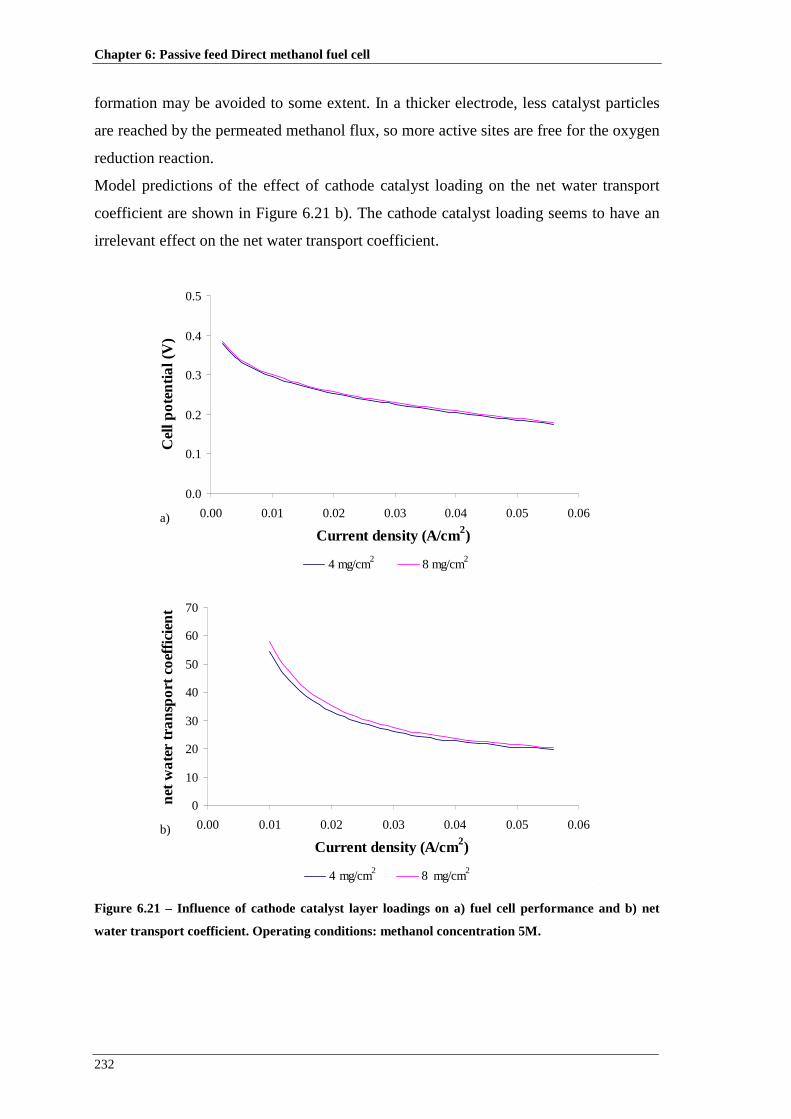
Chapter 6: Passive feed Direct methanol fuel cell
232
formation may be avoided to some extent. In a thicker electrode, less catalyst particles
are reached by the permeated methanol flux, so more active sites are free for the oxygen
reduction reaction.
Model predictions of the effect of cathode catalyst loading on the net water transport
coefficient are shown in Figure 6.21 b). The cathode catalyst loading seems to have an
irrelevant effect on the net water transport coefficient.
0.0
0.1
0.2
0.3
0.4
0.5
0.00 0.01 0.02 0.03 0.04 0.05 0.06
Current density (A/cm2)
Cel
l po
ten
tial (
V)
4 mg/cm2 8 mg/cm2
a)
mg/cm2mg/cm2
0
10
20
30
40
50
60
70
0.00 0.01 0.02 0.03 0.04 0.05 0.06
Current density (A/cm2)
net
wa
ter
tran
spo
rt co
effic
ien
t
4 mg/cm2 8 mg/cm2
b)
mg/cm2mg/cm2
Figure 6.21 – Influence of cathode catalyst layer loadings on a) fuel cell performance and b) net
water transport coefficient. Operating conditions: methanol concentration 5M.
Transport Phenomena in Direct Methanol Fuel Cells: Modelling and Experimental Studies
233
To evaluate the effect of the membrane thickness, a Nafion 117 membrane (thickness of
0.18 mm) a Nafion 115 membrane (thickness of 0.127 mm) and a Nafion 212
membrane (thickness of 0.051 mm) were used in the model predictions.
Figure 6.22 a) and b) shows the effect of the membrane thickness on the fuel cell
performance and on the net water transport coefficient, respectively. The Nafion 115
membrane had a slight better performance than Nafion 117 and a much better
performance than Nafion 212. It should be noted that thinner membranes have lower
performances because they have higher methanol loss through crossover, in spite of
lower ohmic resistances. In this way, the effect of the membrane thickness on the fuel
cell performance must be a combined effect of the positive and the negative effects. For
this condition and for the Nafion 115 membrane, it seems that the positive effect on the
ohmic loss is more relevant that the negative effect of methanol crossover.
When comparing the values of the net water transport coefficient for identical values of
current density and different membrane thicknesses, lower values of the net water
transport coefficient are obtained with the thinner membrane, because the resistance of
water back-flow from the cathode to the anode via hydraulic permeation is much
reduced in this case. The trends of the influence of membrane thickness on water
crossover predicted in this paper are in accordance to the ones proposed by Song et al.
[163] and Jewett et al. [164].

Chapter 6: Passive feed Direct methanol fuel cell
234
0.0
0.1
0.2
0.3
0.4
0.5
0.00 0.01 0.02 0.03 0.04 0.05 0.06
Current density (A/cm2)
Cel
l po
ten
tial (
V)
Nafion 117 Nafion 115 Nafion 212
a)
0
10
20
30
40
50
60
0.00 0.01 0.02 0.03 0.04 0.05 0.06
Current density (A/cm2)
net
wa
ter
tran
spo
rt co
effic
ien
t
Nafion 117 Nafion 115 Nafion 212
b)
Figure 6.22 – Influence of MEA thickness on a) fuel cell performance and b) net water transport
coefficient. Operating conditions: methanol concentration 5M.
6.3.1.3. Tailored MEAs
Based on the results and major conclusions of the previous section, the next goal is to
propose a tailored MEA in order to achieve higher fuel cell performances with higher
methanol concentrations, and lower methanol and water crossover rates.
One membrane named commercial Nafion 117 is considered with a 30 wt% carbon
cloth type A (E-TEK) as gas diffusion layer on the anode and cathode side, with
4mg/cm2 Pt/Ru and 4 mg/cm2 Pt as catalyst load for anode and cathode, respectively.

Transport Phenomena in Direct Methanol Fuel Cells: Modelling and Experimental Studies
235
One tailored MEA with a thinner membrane, Nafion 212 had a 30 wt% carbon cloth
type C (E-TEK) as gas diffusion layer on the anode and cathode side, an anode catalyst
loading of 8 mg/cm2 Pt/Ru and a cathode catalyst loading of 8 mg/cm2 Pt.
Figures 6.23 a) and b) show the cell performance and the net water transport coefficient
for the two MEAs, using a methanol concentration of 5M. As can be seen, for all the
range of current densities studied, the tailored MEA has a better performance and a
lower value of the net water transport coefficient. The general significant increase on
performance when using thinner membranes is possible because a higher catalyst
loading and a thicker GDL both on the anode and cathode side were used. A thicker
GDL and catalyst layer on the anode side act as a methanol and water barrier decreasing
the methanol and water crossover and, consequently, increasing the current density.
Thicker cathode catalyst layer enable an increase of the number of catalyst particles
available for the oxygen reduction. Thinner membranes, also, allow operating a passive
DMFC with low values of net water transport coefficients which is the goal to an
adequate water management in passive DMFCs. The results obtained seem to point out
optimized conditions for operation of passive DMFCs with tailored MEAs and high
methanol concentrations with an increased performance and are in accordance to those
reported in literature [163, 164].

Chapter 6: Passive feed Direct methanol fuel cell
236
0.0
0.1
0.2
0.3
0.4
0.5
0.00 0.01 0.02 0.03 0.04 0.05 0.06
Current density (A/cm2)
Cel
l po
ten
tial (
V)
commercial Nafion 117 tailored Nafion 212
a)
0
10
20
30
40
50
60
0.00 0.01 0.02 0.03 0.04 0.05 0.06
Current density (A/cm2)
net
wa
ter
tran
spo
rt co
effic
ien
t
commercial Nafion 117 tailored Nafion 212
b)
Figure 6.23 – Influence of MEA properties on a) fuel cell performance and b) net water transport
coefficient for commercial Nafion 117 and tailored Nafion 212. Operating conditions: methanol
concentration 5M.
6.3.1.4. Active feed DMFC vs. Passive feed DMFC
The performance of the DMFC is strongly dependent on the mode of reactants supply,
and it is generally accepted that active DMFCs performance is higher than passive ones
due to higher mass transport rates in the cells.
The comparison between active and passive DMFC cell performance and power density
is displayed in Fig. 6.24. The active DMFC was operated with a methanol flow rate of 3
ml/min and air flow rate 3.6 l/min. For the two values of methanol feed concentration
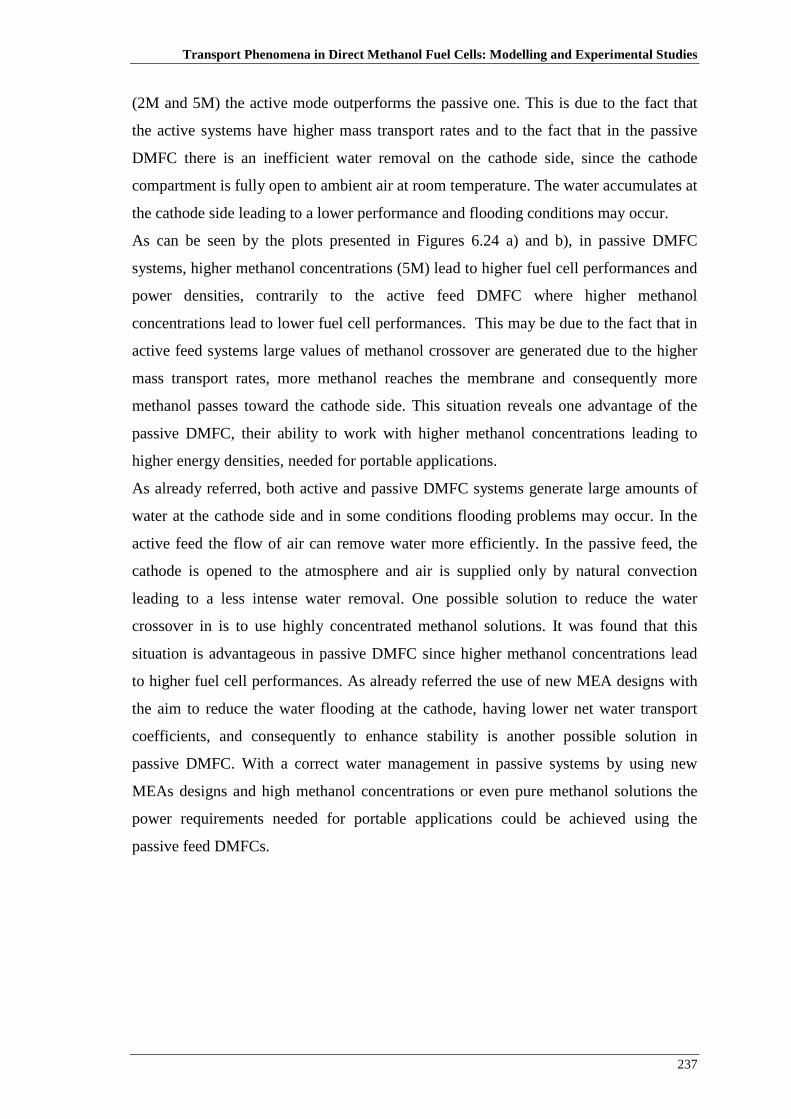
Transport Phenomena in Direct Methanol Fuel Cells: Modelling and Experimental Studies
237
(2M and 5M) the active mode outperforms the passive one. This is due to the fact that
the active systems have higher mass transport rates and to the fact that in the passive
DMFC there is an inefficient water removal on the cathode side, since the cathode
compartment is fully open to ambient air at room temperature. The water accumulates at
the cathode side leading to a lower performance and flooding conditions may occur.
As can be seen by the plots presented in Figures 6.24 a) and b), in passive DMFC
systems, higher methanol concentrations (5M) lead to higher fuel cell performances and
power densities, contrarily to the active feed DMFC where higher methanol
concentrations lead to lower fuel cell performances. This may be due to the fact that in
active feed systems large values of methanol crossover are generated due to the higher
mass transport rates, more methanol reaches the membrane and consequently more
methanol passes toward the cathode side. This situation reveals one advantage of the
passive DMFC, their ability to work with higher methanol concentrations leading to
higher energy densities, needed for portable applications.
As already referred, both active and passive DMFC systems generate large amounts of
water at the cathode side and in some conditions flooding problems may occur. In the
active feed the flow of air can remove water more efficiently. In the passive feed, the
cathode is opened to the atmosphere and air is supplied only by natural convection
leading to a less intense water removal. One possible solution to reduce the water
crossover in is to use highly concentrated methanol solutions. It was found that this
situation is advantageous in passive DMFC since higher methanol concentrations lead
to higher fuel cell performances. As already referred the use of new MEA designs with
the aim to reduce the water flooding at the cathode, having lower net water transport
coefficients, and consequently to enhance stability is another possible solution in
passive DMFC. With a correct water management in passive systems by using new
MEAs designs and high methanol concentrations or even pure methanol solutions the
power requirements needed for portable applications could be achieved using the
passive feed DMFCs.

Chapter 6: Passive feed Direct methanol fuel cell
238
0.0
0.1
0.2
0.3
0.4
0.5
0.6
0.7
0.00 0.01 0.02 0.03 0.04 0.05 0.06 0.07
Current density (A/cm2)
Cel
l po
ten
tial (
V)
2M passive feed 2M active feed 5M passive feed 5M active feed
a)
0.000
0.004
0.008
0.012
0.016
0.020
0.00 0.01 0.02 0.03 0.04 0.05 0.06 0.07
Current density (A/cm2)
Po
wer
den
sity
(W
/cm2 )
2M passive feed 2M active feed 5M passive feed 5M active feed
b)
Figure 6.24 – Comparison of the experimental results, for a) polarization curves and b) power, with
different reactants feeding. Structural parameters: Nafion 115. Structural parameters: anode and
cathode diffusion layer 30% wet-proofed carbon cloth type A, anode catalyst loading 4mg/cm2
Pt/Ru, cathode catalyst loading 4mg/cm2 Pt. Operating conditions: temperature 20ºC, methanol
flow rate 3 ml/min and air flow rate 3.6 l/min.
6.3.2. Concluding remarks
Reducing the methanol and water crossover from the anode to the cathode side on a
passive DMFC is of significant importance to improve cell performances and obtained
higher power densities. Thus, it is crucial to better understand the mechanism of water
and methanol crossover through the membrane used for this type of fuel cells.
Transport Phenomena in Direct Methanol Fuel Cells: Modelling and Experimental Studies
239
The model developed for the active DMFC was adapted to the passive DMFC and was
presented in this chapter.
The model can be used to predict the methanol, oxygen and water concentration profiles
in the anode, cathode and membrane, as well as to estimate the methanol and water
crossover and the temperature profile across the cell. Polarization curves are
numerically simulated and successfully compared with experiments for different
methanol feed concentrations. The model predicts with accuracy the influence of the
methanol feed concentration on the cell performance and the correct trends of the
current density and methanol feed concentration, on methanol and water crossover. The
model is rapidly implemented and is therefore suitable for inclusion in real-time system
level DMFC calculations. Due to its simplicity the model can be used to help seek for
possibilities of optimizing the cell performance of a passive DMFC by studying impacts
from variations of the design parameters such as membrane thickness, catalyst loading,
diffusion layers type and thicknesses.
Changes in the structure of the diffusion layers, in the catalyst loadings and membrane
thicknesses were found to be effective ways to control water crossover. Increasing the
thickness of catalyst layer by increasing the catalyst loading could contribute to lower
the loss in performance due to methanol crossover. Decreasing the membrane thickness
leads to a lower net water transport coefficient as the result of the enhanced transport of
water, from the cathode to the anode. Thicker anode gas diffusion layers seem to have a
better performance due to low methanol and water crossover. Higher methanol
concentrations lead to lower fuel cell performances due to higher methanol crossover,
but generate higher performances for high current densities. Also, higher methanol
concentrations lead to a decrease on the net water transport coefficient. Finally a
tailored MEA is proposed to achieve low methanol and water crossover and high power
density. A thick anode diffusion and catalyst layer to reduce methanol and water
crossover, a thicker cathode to enhance oxygen reaction and thinner membranes to
reduce ohmic losses are suggested. The results presented provide very useful and actual
information for future passive DMFC systems using high concentration or pure
methanol.

Chapter 6: Passive feed Direct methanol fuel cell
240
241
CHAPTER 7 7. CONCLUSIONS AND SUGGESTIONS FOR FUTURE WORK
The main objective of this thesis was to gain a detailed understanding of the transport
phenomena occurring in a direct methanol fuel cell together with the electrochemical
reactions occurring at the anode and cathode.
One main motivation of the work was to compensate for the lack of experimental
characterization of DMFCs (both active and passive feed) operating under conditions
close to ambient pressure and temperature, bearing in mind the portable applications of
this type of fuel cells.
The fulfilment of the work objectives involved the following steps:
• development of a mathematical model both for active and passive feed DMFCs;
• implementation of an experimental rig (comprising an acquired fuel cell station
and a temperature control system) and the design and construction of direct
methanol fuel cells (both active and passive feed);
• validation of the developed models both with data from literature and with
experimentally obtained results;
• intensive use of the developed models to set-up optimizing conditions leading to
enhanced fuel cell performances (both for active and passive feed).
Conclusions from the several parts of this research and recommendations for future
work are discussed below.
7.1 Conclusions
A steady state, 1D model accounting for coupled heat and mass transfer was developed,
firstly for an active feed DMFC and afterward adapted for a passive feed fuel cell.
Emphasis was put on a reduced model, with an easily extendable structure and a
detailed modelling of heat and mass transfer phenomena. The model allows the
assessment of the effect of operating conditions (such as methanol feed concentration,
methanol and air flow rates and current density) and of design parameters (active area

Chapter 7: Conclusions and Suggestions for Future Work
242
and material properties) on temperature and concentration profiles and consequently on
cell performance. Special attention was devoted to the influence of these parameters
both on methanol and water crossover, two fundamental issues on DMFC development.
The models predict the correct trends of the effects of the different parameters on these
two important flows.
Both models (for active and passive DMFCs) describe well the experimental results for
low to medium current densities, due to the integration, on the model, of the mass
transfer effects at the cathode side. The most significant discrepancies between the
model and experimental conditions occur near the limiting current densities, and for
active feed DMFC, due to the fact that the model neglects two-phase flow effects.
Under these conditions, the carbon dioxide bubbles, on the anode side, and water
droplets, on the cathode side, considerably reduce the limiting current density of the
cell. However the model uses simple numerical tools, like Matlab, which allows the
rapid prediction of the DMFC performance and can be a useful tool to improve DMFC
understanding and to optimize fuel cell design.
The obtained results in the detailed experimental study of the active feed DMFC were in
accordance with the general trends accepted by the scientific DMFC community:
• The fuel cell performance significantly increased with the introduction of the
diffusion layers, meaning that a five layer MEA is much more efficient than a
three layer one;
• The optimal methanol concentration was found to be 0.75M, higher methanol
concentrations resulted in lower cell performances due to higher values of the
generated methanol crossover;
• For the conditions studied the fuel cell performance and power density increased
with increasing temperature due to an enhancement of the electrochemical
kinetics on the anode and cathode side;
• High values of methanol and air flow rates have a positive impact on fuel cell
performance. The impact of the air flow rate is less significant under the
operating conditions studied;
• Regarding the choice of the anode diffusion layer material, higher performances
are obtained for lower methanol concentration if carbon cloth is used while for

Transport Phenomena in Direct Methanol Fuel Cells: Modelling and Experimental Studies
243
higher methanol concentration the best option is carbon paper. For the cathode
diffusion layer the use of carbon cloth is adequate;
• Thicker membranes generate lower values of methanol crossover, increasing the
fuel cell performance;
• Thicker anode and cathode catalyst layers lead to an increase in fuel cell
performance.
The effect of the anode and cathode flow field design on the active feed DMFC
performance was also studied. It was concluded that the fuel cell performance
significantly increase with the use of an original design, the MFF (mixed flow field) as
the anode flow field and MSFF (multi serpentine flow field) as the cathode flow field
design. These results can be very useful for the validation of CDF models.
Reducing the membrane water and methanol crossover is essential to achieve increased
power densities, a fundamental requirement for commercialization of portable DMFCs.
Based on the experimental results, a tailored MEA was proposed to achieve low
methanol and water crossover and high power density, operating at high methanol
concentrations. The resulting MEA provides a basic element for future DMFC systems
using high concentration or pure methanol.
The results obtained with the passive feed DMFC showed that changes in the structure
of the diffusion layers, in the catalyst loadings and membrane thickness, constitute
effective ways of control water and methanol crossover. In particular, decreasing the
membrane thickness and working with high methanol concentrations lead to a lower net
water transport coefficient resulting from the enhanced transfer of water from the
cathode to the anode. Thicker anode gas diffusion layers seem to contribute to increase
performance due to the ability of generating low methanol crossover values. Increasing
the thickness of the catalyst layer by increasing the catalyst loading could, also, result in
a decrease in the loss of performance due to methanol crossover. Based on these
findings, a tailored MEA was proposed to achieve low methanol and water crossover,
providing a basic element for passive DMFCs, and capability of working at high
concentration or even pure methanol.

Chapter 7: Conclusions and Suggestions for Future Work
244
7.2 Suggestions for future work
Regarding the modelling of DMFCs it is necessary to move one step forward in cell
optimization and develop a CFD tool (both for active and passive feed cells) in order to
explore the two-phase flows effects occurring both at the anode and cathode. The model
needs to be validated with carefully designed visualization studies. The CFD tool will
enable the optimization of the flow channels configuration to incorporate in new cells
together with the tailored MEA proposed by using the simpler numerical tool developed
in the present work.
In parallel to the model refinement, more experimental work, especially, for the passive
feed fuel cell is needed. Further studies must be performed namely under completely
uncontrolled temperature conditions and using higher methanol concentrations.
Innovative gas-liquid separators, at the anode side, should also be tested.
One of the main gains of this work was to systematically vary commercial MEA
materials and check their influence on the cell performance of a DMFC operating close
to room temperature. An interesting suggestion for future work should be the further
modification of some structural properties of the gas diffusion layer following some
recent published studies, such as for example the introduction of the so called
microporous layers (MPL) and to test these novel MEA designs both experimentally
and numerically.

245
CHAPTER 8 8. References
[1] G.Q. Lu and C.Y. Wang, Two-phase microfluidics, mass and heat transport in direct
methanol fuel cells, New Developments in Heat Transfer, Chapter 9, pp. 317-358,
2005.
[2] L.J. Burchamand and I.E. Wachs, The origin of the support effect in supported
metal oxide catalysts: in situ infrared and kinetic studies during methanol oxidation,
Catalysis Today 49 (1999) 467-484.
[3] A.S. Lin, A.D. Kowalak and W.E. O'Grady, Studies of the role of water in the
electrocatalysis of methanol oxidation, Journal of Power Sources 58 (1996) 67-72.
[4] L. Liu, C. Pu, R. Viswanathan, Q. Fan, R. Liu and E.S. Smotkin, Carbon supported
and unsupported Pt–Ru anodes for liquid feed direct methanol fuel cells,
Electrochimica Acta 43 (1998) 3657-3663.
[5] S.F. Baxter, V.S. Battaglia and R.E. White, Methanol Fuel Cell Model: Anode,
Journal of the Electrochemical Society 146 (1999) 437-447.
[6] G.T. Burstein, C.J. Barnett, A.R. Kucernak and K.R. Williams, Aspects of the
anodic oxidation of methanol, Catalysis Today 38 (1997) 425-437.
[7] A. Hamnett, Mechanism and electrocatalysis in the direct methanol fuel cell,
Catalysis Today 38 (1997) 445-457.
[8] J. Sobkowski, K. Franaszczuk and K. Dobrowolska, Effect of anions and pH on the
adsorption and oxidation of methanol on a platinum electrode, Journal of
Electroanalytical Chemistry 330 (1992) 529-540.
[9] H. Matsui and A. Kunugi, The scheme of methanol oxidation at a platinum
electrode in an acid solution, Journal of Electroanalytical Chemistry 292 (1990)
103-113.
[10] X.H. Xia, T. Iwasita, F. Ge and W. Vielstich, Structural effects and reactivity in
methanol oxidation on polycrystalline and single crystal platinum, Electrochimica
Acta 41 (1996) 711-718.

Chapter 8: References
246
[11] C. He, H. R. Kunz and J. M. Fenton, Evaluation of Platinum-Based Catalysts for
Methanol Electro-oxidation in Phosphoric Acid Electrolyte, Journal of the
Electrochemical Society 144 (1997) 970-979.
[12] M. Watanabe, S. Saegusa and P. Stonehart, High platinum electrocatalyst
utilizations for direct methanol oxidation, Journal of Electroanalytical Chemistry
271 (1989) 213-220.
[13] R. Parsons and T. Vandernoot, The oxidation of small organic molecules: A
survey of recent fuel cell related research, Journal of Electroanalytical Chemistry
257 (1988) 9-45.
[14] M. P. Hogarth and G. A. Hards, Direct Methanol Fuel Cells: Technological
advances and further requirements, Platinum Metals Review 40 (1996) 150-159.
[15] K. Chandrasekaran, J. C. Wass, and J. O' M. Bockris, The Potential Dependence
of Intermediates in Methanol Oxidation Observed in the Steady State by FTIR
Spectroscopy, Journal of the Electrochemical Society 137 (1990) 518-524.
[16] Y. Morimoto and E. B. Yeager, Comparison of methanol oxidations on Pt, Pt/Ru
and PtSn electrodes, Journal of Electroanalytical Chemistry 444 (1998) 95-100.
[17] A. B. Anderson, E. Grantscharova and S. Seong, Systematic Theoretical Study of
Alloys of Platinum for Enhanced Methanol Fuel Cell Performance, Journal of the
Electrochemical Society 143 (1996) 2075-2082.
[18] K.L. Ley, R. Liu, C. Pu, Q. Fan, N. Leyarovska, C. Segre and E.S. Smotkin,
Methanol Oxidation on Single-Phase Pt/Ru-Os Ternary Alloys, Journal of the
Electrochemical Society 144 (1997) 1543-1548.
[19] L. Liu, R. Viswanathan, R. Liu and E.S. Smotkin, Methanol Oxidation on Nafion
Spin-Coated Polycrystalline Platinum and Platinum Alloys, Electrochemical and
Solid State Letters 1 (1998) 123-125.
[20] N.A. Hampson, M.J. Willars and B.D. McNicol, The methanol-air fuel cell: A
selective review of methanol oxidation mechanisms at platinum electrodes in acid
electrolytes, Journal of Power Sources 4 (1979) 191-201.
[21] A. Hamnett and B.J. Kennedy, Bimetallic carbon supported anodes for the direct
methanol-air fuel cell, Electrochimica Acta 33 (1988) 1613-1618.
Transport Phenomena in Direct Methanol Fuel Cells: Modelling and Experimental Studies
247
[22] A.S. Arico, Z. Poltarzewski, H. Kim, A. Morana, N. Giordano and V. Antonucci,
Investigation of a carbon-supported quaternary Pt/Ru-Sn-W catalyst for direct
methanol fuel cells, Journal of Power Sources 55 (1995) 159-166.
[23] M. Götz and H. Wendt, Binary and ternary anode catalyst formulations including
the elements W, Sn and Mo for PEMFCs operated on methanol or reformate gas,
Electrochimica Acta 43 (1998) 3637-3644.
[24] A.S. Arico, P. Creti, E. Modica, G. Monforte, V. Baglio and V. Antonucci,
Investigation of direct methanol fuel cells based on unsupported Pt–Ru anode
catalysts with different chemical properties, Electrochimica Acta 45 (2000) 4319-
4328.
[25] X. Ren, P. Zelenay, S. Thomas, J. Davey and S. Gottesfeld, Recent advances in
direct methanol fuel cells at Los Alamos National Laboratory, Journal of Power
Sources 86 (2000) 111-116.
[26] J.P. Meyers and J. Newman, Simulation of the Direct Methanol Fuel Cell-II.
Modeling and Data Analysis of Transport and Kinetic Phenomena, Journal of the
Electrochemical Society 149 (2002) A718-A728.
[27] S. Mukerjee, S. Srinivasan, Enhanced electrocatalysis of oxygen reduction on
platinum alloys in proton exchange membrane fuel cells, Journal of
Electroanalytical Chemistry 357 (1993) 201-224.
[28] M.T. Paffet, G.J. Beery, S.Gottesfeld, Oxygen Reduction at Pt0.65Cr0.35, Pt0.2Cr0.8
and Roughened Platinum, Journal of the Electrochemical Society 153 (1988)
1431-1436.
[29] M. Watanabe, K. Tsurumi, T. Mizukami, T. Nakamura, P. Stonehart, Activity and
Stability of Ordered and Disordered Co-Pt Alloys for Phosphoric Acid Fuel Cells,
Journal of the Electrochemical Society 141 (1994) 2659-2668.
[30] A. Freund, J. Lang, T. Lehman, K. A. Starz, Improved Pt alloy catalysts for fuel
cells, Catalysis Today 27 (1996) 279-283.
[31] M. Eikerling and A.A. Kornyshev, Modelling the performance of the cathode
catalyst layer of polymer electrolyte fuel cells, Journal Electroanalytical
Chemistry 453 (1998) 89-106.

Chapter 8: References
248
[32] K. Broka and P. Ekdunge, Oxygen and hydrogen permeation properties and water
uptake of Nafion 117 membrane and recast film for PEM fuel cell, Journal of
Applied Electrochemistry 27 (1997) 281-289.
[33] P. Argyropoulos, K. Scott and W.M. Taama, Gas evolution and power
performance in direct methanol fuel cells, Journal of Applied Electrochemistry 29
(1999) 661-669.
[34] P. Argyropoulos, K. Scott and W.M. Taama, Carbon dioxide evolution patterns in
direct methanol fuel cells, Electrochimica Acta 29 (1999) 661-669.
[35] J. Nordlund, C. Picard, E. Birgersson, M. Vynnycky and G. Lindbergh, The
design and usage of a visual direct methanol fuel cell, Journal of Applied
Electrochemistry 34 (2004) 763-770.
[36] T. Bewer, T. Beckmann, H. Dohle, J. Mergel and D. Stolten, Novel method for
investigation of two-phase flow in liquid feed direct methanol fuel cells using an
aqueous H2O2 solution, Journal of Power Sources 125 (2004) 1-9.
[37] G.Q. Lu and C.Y. Wang, Electrochemical and flow characterization of a direct
methanol fuel cell, Journal of Power Sources 134 (2004) 33-40.
[38] H. Yang, T.S. Zhao and Q, Ye, In situ visualization study of CO2 gas bubble
behaviour in DMFC anode flow fields, Journal of Power Sources 139 (2005) 79-
90.
[39] H. Yang and T.S. Zhao, Effect of anode flow field design on the performance of
liquid feed direct methanol fuel cells, Electrochimica Acta 50 (2005) 3243-3252
[40] Q. Liao, X. Zhu, X. Zheng and Y. Ding, Visualization study on the dynamics of
CO2 bubbles in anode channels and performance of a DMFC, Journal of Power
Sources 171 (2007) 644-651.
[41] M.D. Lundin and M.J. McCready, Reduction of carbon dioxide gas formation at
the anode of a direct methanol fuel cell using chemically enhanced solubility,
Journal of Power Sources 172 (2007) 553-559.
[42] T.E. Springer, T.A. Zawodzinski and S. Gottesfeld, Polymer electrolyte fuel cell
model, Journal of the Electrochemical Society 138 (1991) 2334-2341.

Transport Phenomena in Direct Methanol Fuel Cells: Modelling and Experimental Studies
249
[43] Z.H. Wang, C.Y. Wang and K.S. Chen, Two.phase flow and transport in the air
cathode of proton exchange membrane fuel cells, Journal of Power Sources 94
(2001) 40-50.
[44] X.G. Yang, F.Y. Zhang, A. Lubawy and C.Y. Wang, Visualization of liquid water
transport in a polymer electrolyte fuel cell, Electrochemical and Solid State Letters
7 (11) (2004) A408-A411.
[45] M.M. Mench and C.Y. Wang, An in situ method for determination of current
distribution in PEM fuel cells applied to a direct methanol fuel cell, Journal of the
Electrochemical Society 150 (2003) 79-85.
[46] K.S. Chen, M.A. Hickner and D.R. Noble, Simplified models for predicting the
onset of liquid water droplet instability at the gas diffusion layer/gas flow channel
interface, International Journal of Energy Research 29 (2005) 1113-1132.
[47] M.W. Verbrugge, Methanol diffusion in perfluorinated ion-exchange membranes,
Journal of the Electrochemical Society 136 (1989) 417-423.
[48] P.S. Kauranen and E. Skou, Methanol permeability in perfluorosulfonate proton
exchange membranes at elevated temperatures, Journal of Applied
Electrochemistry 26 (1996) 909-917.
[49] V. Tricoli, N. Carretta and M. Bartolozzi, A comparative investigation of proton
and methanol transport in fluorinated ionomeric membranes, Journal of the
Electrochemical Society 147 (2000) 1286-1290.
[50] S. Hikita, K. Yamane and Y. Nakajima, Measurement of methanol crossover in
direct methanol fuel cell, JSAE Review 22 (2001) 151-156.
[51] H. Dohle, J. Divisek, J. Mergel, H.F. Oetjen, C. Zingler and D. Stolten, Recent
developments of the measurement of the methanol permeation in a direct
methanol fuel cell, Journal of Power Sources 105 (2002) 274-282.
[52] K. Ramya, K.S. Dhathathreyan, Direct methanol fuel cells: determination of fuel
crossover in a polymer electrolyte membrane, Journal of Electroanalytical
Chemistry 542 (2003) 109-115.
[53] N. Munichandraiah, K. McGrath, G. Prakash, R. Aniszfeld and G. Olah, A
potentiometric method of monitoring methanol crossover through polymer

Chapter 8: References
250
electrolyte membranes of direct methanol fuel cells, Journal of Power Sources 117
(2003) 98-101.
[54] R. Jiang and D. Chu, Comparative studies of methanol crossover and cell
performance for a DMFC, Journal of the Electrochemical Society 151 (2004) 69-
76.
[55] T.H. Kin, W.Y. Shieh, C.C. Yang and George Yu, Estimating the methanol
crossover rate of PEM and the efficiency of DMFC via a current transient
analysis, Journal of Power Sources 161 (2006) 1183-1186.
[56] J. Han, H. Liu, Real time measurements of methanol crossover in a DMFC,
Journal of Power Sources 164 (2007) 166–173.
[57] J.Y. Park, J.H. Lee, S. Kang, J. Sauk and I. Song, Mass balance research for high
electrochemical performance direct methanol fuel cells with reduced methanol
crossover at various operating conditions, Journal of Power Sources 178 (2008)
181-187.
[58] M.K. Ravikumar, A.K. Shukla, Effect of methanol crossover in a liquid-feed
polymer-electrolyte direct methanol fuel cell, Journal of the Electrochemical
Society 143 (1996) 2601-2606.
[59] J. Cruickshank and K. Scott, The degree and effect of methanol crossover in the
direct methanol fuel cell, Journal of Power Sources 70 (1998) 40-47.
[60] A. Küver, W. Vielstich, Investigation of methanol crossover and single electrode
performance during PEMDMFC operation: A study using a solid polymer
electrolyte membrane fuel cell system, Journal of Power Sources 74 (1998) 211-
218.
[61] K. Scott, W.M. Taama, P. Argyropoulos and K. Sundmacher, The impact of mass
transport and methanol crossover on the direct methanol fuel cell, Journal of
Power Sources 83 (1999) 204-216.
[62] B. Gurau and E.S. Smotkin, Methanol crossover in direct methanol fuel cells: a
link between power and energy density, Journal of Power Sources 112 (2002)
339-352.
[63] V. Gogel, T. Frey, Z. Yongsheng, K.A. Friedrich, L. Jörissen and J. Garche,
Performance and methanol permeation of direct methanol fuel cells: dependence
Transport Phenomena in Direct Methanol Fuel Cells: Modelling and Experimental Studies
251
on operating conditions and on electrode structure, Journal of Power Sources 127
(2004) 172-180.
[64] C.Y. Du, T.S. Zhao and W.W. Yang, Effect of methanol crossover on the cathode
behaviour of a DMFC: A half-cell investigation, Electrochimica Acta 52 (2007)
5266–5271.
[65] K. Ramya and K.S. Dhathathreyan, Methanol crossover studies on heat-treated
Nafion membranes, Journal of Membrane Science 311 (2008) 121–127.
[66] C. Pu, W. Huang, K.L. Ley and E.S. Smotkin, A methanol impermeable proton
conducting composite electrolyte system, Journal of the Electrochemical Society
142 (1995) L119-L120.
[67] J.S. Wainright, J.-T. Wang, D. Weng, R.F. Savinell and M. Litt, Acid-Doped
Polybenzimidazoles: A new polymer electrolyte, Journal of the Electrochemical
Society 142 (1995) L121-L123.
[68] J.T. Wang, J.S. Wainright, R.F. Savinell and M. Litt, A direct methanol fuel cell
using acid-doped polybenzimidazole as polymer electrolyte, Journal of Applied
Electrochemistry 26 (1996) 751-756.
[69] A. Küver and K. Potje-Kamloth, Comparative study of methanol crossover across
electropolymerized and commercial proton exchange membrane electrolytes for
the acid direct methanol fuel cell, Electrochimica Acta 43 (1998) 2527-2535.
[70] V. Tricoli, Proton and methanol transport in poly(perfluorosulfonate) membranes
containing Cs+ and H+ cations, Journal of the Electrochemical Society 145 (1998)
3798-3801.
[71] W. C. Choi, J. D. Kim and S. I. Woo, Modification of proton conducting
membrane for reducing methanol crossover in a direct-methanol fuel cell, Journal
of Power Sources 96 (2001) 411-414.
[72] L.J. Hobson, Y. Nakano, H. Ozu and S. Hayase, Targeting improved DMFC
performance, Journal of Power Sources 104 (2002) 79-84.
[73] H. Uchida, Y. Mizuno and M. Watanabe, Suppression of methanol crossover and
distribution of ohmic resistance in Pt- dispersed PEMs under DMFC operation,
Journal of the Electrochemical Society 149 (2002) A682-A687.

Chapter 8: References
252
[74] B. Yang and A. Manthiram, Multilayered membranes with suppressed fuel
crossover for direct methanol fuel cells, Electrochemistry Communications 6
(2004) 231–236.
[75] A. Bettelheim, L. Soifer and E. Korin, Electropolymerized porphyrin films as
methanol barriers in direct methanol fuel cells, Journal of Electroanalytical
Chemistry 571 (2004) 265-272.
[76] K. Lee, J.H. Nam, J.H. Lee, Y. Lee, S.M. Cho, C.H. Jung, H.G. Choi, Y.Y.
Chang, Y.U. Kwon and J.D. Nam, Methanol and proton transport control by using
layered double hydroxide nanoplatelets for direct methanol fuel cell,
Electrochemistry Communications 7 (2005) 113–118
[77] H. Tang, M. Pan, S. Jiang, Z. Wan and R. Yuan, Self-assembling multi-layer Pd
nanoparticles onto Nafion membrane to reduce methanol crossover, Colloids and
Surfaces A: Physicochem. Eng. Aspects 262 (2005) 65–70.
[78] S. Mu, H. Tang, Z. Wan, M. Pan and R. Yuan, Au nanoparticles self-assembled
onto Nafion membranes for use as methanol-blocking barriers, Electrochemistry
Communications 7 (2005) 1143–1147.
[79] Z.X. Liang, T.S. Zhao and J. Prabhuram, Diphenylsilicate-incorporated Nafion®
membranes for reduction of methanol crossover in direct methanol fuel cells,
Journal of Membrane Science 283 (2006) 219–224.
[80] E.H. Junga, U.H. Jungb, T.H.Yanga, D.H. Peaka, D.H. Junga and S.H. Kim,
Methanol crossover through Pt/Ru/Nafion composite membrane for a direct
methanol fuel cell, International Journal of Hydrogen Energy 32 (2007) 903 – 907.
[81] E. Higuchi, N. Asano, K. Miyatake, H. Uchida and Masahiro Watanabe,
Distribution profile of water and suppression of methanol crossover in sulfonated
polyimide electrolyte membrane for direct methanol fuel cells, Electrochimica
Acta 52 (2007) 5272–5280.
[82] A. Yamauchi, T. Ito and T. Yamaguchi, Low methanol crossover and high
performance of DMFCs achieved with a pore-filling polymer electrolyte
membrane, Journal of Power Sources 174 (2007) 170–175.

Transport Phenomena in Direct Methanol Fuel Cells: Modelling and Experimental Studies
253
[83] R. Gosalawit, S. Chirachanchai, S. Shishatskiy and S.P. Nunes, Krytox–
Montmorillonite–Nafion® nanocomposite membrane for effective methanol
crossover reduction in DMFCs, Solid State Ionics 178 (2007) 1627–1635.
[84] S. Zhong, X. Cui, T. Fu and H. Na, Modification of sulfonated poly(etherether
ketone) proton exchange membrane for reducing methanol crossover, Journal of
Power Sources 180 (2008) 23-28.
[85] D. Wu, R. Fu, T. Xu, L. Wu and W. Yang, A novel proton-conductive membrane
with reduced methanol permeability prepared from bromomethylated poly(2,6-
dimethyl-1,4-phenylene oxide) (BPPO), Journal of Membrane Science 310 (2008)
522–530.
[86] V.M. Barragán and A. Heinzel, Estimation of the membrane methanol diffusion
coefficient from the open circuit voltage measurements in a direct methanol fuel
cell, Journal of Power Sources 104 (2002) 66-72.
[87] S.S. Sandhu, R.O. Crowther and J.P. Fellner, Prediction of methanol and water
fluxes through a direct methanol fuel cell polymer electrolyte membrane,
Electrochimica Acta 50 (2005) 3985-3991.
[88] M.G. Izenson and R. W. Hill, Water balance in PEM and direct methanol fuel
cells, Journal of Fuel Cell Science and Technology 2 (2005) 1-8.
[89] G.Q. Lu, F.Q. Liu and C.Y. Wang, Water transport through Nafion 112 membrane
in DMFCs, Electrochemical and Solid-State Letters, 8 (2005) Al-A4.
[90] F. Liu, G. Lu and C.Y. Wang, Low Crossover of Methanol and Water Through
Thin Membranes in Direct Methanol Fuel Cells, Journal of the Electrochemical
Society 153 (2006) A543-A553.
[91] W. Liu and C.Y. Wang, Modelling water transport in liquid feed direct methanol
fuel cells, Journal of Power Sources 164 (2007) 189-195.
[92] M.H. Shi, J. Wang and Y.P. Chen, Study on water transport in PEM of a direct
methanol fuel cell, Journal of Power Sources 166 (2007) 303-309.
[93] C. Xu and T.S. Zhao, In situ measurements of water crossover through the
membrane for direct methanol fuel cells, Journal of Power Sources 168 (2007)
143-153.

Chapter 8: References
254
[94] C. Xu, T.S. Zhao and Y.L. He, Effect of cathode gas diffusion layer on water
transport and cell performance in direct methanol fuel cells, Journal of Power
Sources 171 (2007) 268-274.
[95] C. Xu, T.S. Zhao and W.W. Wang, Modelling of water transport through the
membrane electrode assembly for direct methanol fuel cells, Journal of Power
Sources 178 (2008) 291-308.
[96] F. Liu and C.Y. Wang, Water and methanol crossover in direct methanol fuel cells
- Effect of anode diffusion media, Electrochimica Acta 53 (2008) 5517-5522.
[97] D.H. Jung, C.H. Lee, C.S. Kim, D.R. and Shin, Performance of a direct methanol
polymer electrolyte fuel cell, Journal of Power Sources 71 (1998) 169-173.
[98] K. Scott, W. M. Taama, P. Argyropoulos, Material aspects of the liquid feed direct
methanol fuel cell, Journal of Applied Electrochemistry 28 (1998) 1389-1397.
[99] K. Scott, W.M. Taama, S. Kramer, P. Argyropoulos, K. Sundmacher, Limiting
current behaviour of the direct methanol fuel cell, Electrochimica Acta 45 (1999)
945–957.
[100] M. Baldauf, W. and Preidel, Experimental results on the direct electrochemical
oxidation of methanol in PEM fuel cells, Journal of Applied Electrochemistry 31
(2001) 781-786.
[101] J.C. Amphlett, B.A. Peppley, E. Halliop and A. Sadiq, The effect of anode flow
characteristics and temperature on the performance of a direct methanol fuel
cell, Journal of Power Sources 96 (2001) 204-213.
[102] S.C. Thomas, X. Ren, S. Gottesfeld, P. Zelenay, Direct methanol fuel cells:
progress in cell performance and cathode research, Electrochimica Acta 47
(2002) 3741-/3748.
[103] N. Nakagawa, Y. and Xiu, Performance of a direct methanol fuel cell operated at
atmospheric pressure, Journal of Power Sources 118 (2003) 248-255.
[104] J. Ge, and H. Liu, Experimental studies of a DMFC, Journal of Power Sources
142 (2005) 56-69.

Transport Phenomena in Direct Methanol Fuel Cells: Modelling and Experimental Studies
255
[105] H. Yang, T.S. Zhao, Q. Ye, Pressure drop behaviour in the anode flow field of
liquid feed direct methanol fuel cells, Journal of Power Sources 142 (2005) 117-
124.
[106] A.S. Aricò, P. Cretì, V. Baglio, E. Modica and V. Antonucci, Influence of flow
field design on the performance of a direct methanol fuel cell, Journal of Power
Sources 91 (2000) 202-209.
[107] K. Tuber, A. Oedegaard, M. Hermann and C. Hebling, Investigation of fractal
flow-fields in portable proton exchange membrane and direct methanol fuel
cells, Journal of Power Sources 131 (2004) 175-181.
[108] Z. Wei, S. Wang, B. Yi, J. Liu, L. Chen, W. Zhou, W. Li and Q. Xin, Influence
of electrode structure on the performance of a direct methanol fuel cell, Journal
of Power Sources 106 (2002) 364-369.
[109] C. Xu, T.S. Zhao and Q. Ye, Effect of anode backing layer on the cell
performance of a direct methanol fuel cell, Electrochimica Acta 51 (2006) 5524-
5531.
[110] D. Cheddie, N. Munroe, Review and comparison of approaches to proton
exchange membrane fuel cell modeling, Journal of Power Sources 147 (2005)
72-84.
[111] K. Z. Yao, K. Karan, K. B. McAuley, P. Oosthuizen , B. Peppley, T. Xie, A
review of mathematical models for hydrogen and direct methanol polymer
electrolyte membrane fuel cells, Fuel Cells (2004), 4, No. 1-2, 3-29.
[112] K. Scott, W. Taama, J. Cruickshank, Performance and modeling of a direct
methanol solid polymer electrolyte fuel cell, Journal of Power Sources 65
(1997) 159-171.
[113] K. Sundmacher, K. Scott, Direct methanol polymer electrolyte fuel cell:
Analysis of charge and mass transfer in the vapor-liquid-solid system, Chemical
Engineering Science 54 (1999) 2927-2936.
[114] A. A. Kulikovsky, The voltage-current curve of a direct methanol fuel cell:
"exact" and fitting equations, Electrochemistry Communications 4 (2002) 939-
946.

Chapter 8: References
256
[115] A. A. Kulikovsky, Analytical model of the anode side of DMFC: the effect of
non-Tafel kinetics on cell performance, Electrochemistry Communications 5
(2003) 530-538.
[116] A. A. Kulikovsky, A method for analysis of DMFC performance curves,
Electrochemistry Communications 5 (2003) 1030-1036.
[117] K. Scott, P. Argyropoulos, A one dimensional model of a methanol fuel cell
anode, Journal of Power Sources 137 (2004) 228-238.
[118] K. Scott, P. Argyropoulos, A current distribution model of a porous fuel cell
electrode, Journal of Electroanalytical Chemistry 567 (2004) 103-109.
[119] Hang Guo, Chong-fang Ma, 2D analytical model of a direct methanol fuel cell,
Electrochemistry Communications 6 (2004) 306-312.
[120] B. L. García, V. A. Sethuraman, J. W. Weidner, R. E. White, Mathematical
Model of a Direct Methanol Fuel Cell, Journal of Fuel Cell Science and
Technology Vol.1, November 2004, 43-48.
[121] P. S. Kauranen, E. Skou, Mixed methanol oxidation/oxygen reduction currents
on a carbon supported Pt catalyst, Journal of Electroanalytical Chemistry 408
(1996) 189-198.
[122] K. Sundmacher, T. Schultz, S. Zhou, K. Scott, M. Ginkel, E.D. Gilles, Dynamics
of the direct methanol fuel cell (DMFC): experiments and model-based analysis,
Chemical Engineering Science 56 (2001) 333-341.
[123] A. Simoglou, P. Argyropoulos, E. B. Martin, K. Scott, A. J. Morris, W. M.
Taama, Dynamic modeling of the voltage response of direct methanol fuel cells
and stacks Part I: Model development and validation, Chemical Engineering
Science 56 (2001) 6761-6772.
[124] A. Simoglou, P. Argyropoulos, E. B. Martin, K. Scott, A. J. Morris, W. M.
Taama, Dynamic modeling of the voltage response of direct methanol fuel cells
and stacks Part II: Feasibility study of model-based scale-up and scale-down,
Chemical Engineering Science 56 (2001) 6773-6779.
[125] P. Argyropoulos, K. Scott, A. K. Shukla, C. Jackson, A semi-empirical model of
the direct methanol fuel cell performance Part I. Model development and
verification, Journal of Power Sources 123 (2003) 190-199.

Transport Phenomena in Direct Methanol Fuel Cells: Modelling and Experimental Studies
257
[126] H. Dohle, K. Wippermann, Experimental evaluation and semi-empirical
modeling of U/I characteristics and methanol permeation of a direct methanol
fuel cell, Journal of Power Sources 135 (2004) 152-164.
[127] K. Scott, W. Taama, J. Cruickshank, Performance of a direct methanol fuel cell,
Journal of Applied Electrochemistry 28 (1998) 289-297.
[128] A. A. Kulikovsky, J. Divisek, A.A. Kornyshev, Modeling the Cathode
Compartment of Polymer Electrolyte Fuel Cells: Dead and Active Reacting
Zones, Journal of the Electrochemical Society 146 (11), 3981-3991 (1999).
[129] P. Argyropoulos, K. Scott, W. M. Taama, Pressure drop modeling for liquid feed
direct methanol fuel cells Part 1. Model development, Chemical Engineering
Journal 73 (1999) 217-227.
[130] P. Argyropoulos, K. Scott, W. M. Taama, Pressure drop modeling for liquid feed
direct methanol fuel cells Part II. Model based parametric analysis, Chemical
Engineering Journal 73 (1999) 229-245.
[131] K. Scott, P. Argyropoulos, K. Sundmacher, A model for the Liquid Feed Direct
methanol fuel cell, Journal of Electroanalytical Chemistry 477 (1999) 97-110.
[132] P. Argyropoulos, K. Scott, W.M. Taama, One-dimensional thermal model for
direct methanol fuel cell stacks Part I. Model development, Journal of Power
Sources 79 (1999) 169-183.
[133] P. Argyropoulos, K. Scott, W. M. Taama, One-dimensional thermal model for
direct methanol fuel cell stacks Part II. Model based parametric analysis and
predicted temperature profiles, Journal of Power Sources 79 (1999) 184-198.
[134] H. Dohle, J. Divisek, R. Jung, Process engineering of the DMFC, Journal of
Power Sources 86 (2000) 469-477.
[135] A. A. Kulikovsky, Two-dimensional numerical modeling of a direct methanol
fuel cell, Journal of Applied Electrochemistry 30 (2000) 1005-1014.
[136] P. Argyropoulos, K. Scott, W. M. Taama, Modeling flow distribution for
internally manifolded direct methanol fuel cell stacks, Chemical Engineering
Technology 23 (2001) 11 985-995.
Chapter 8: References
258
[137] J. Nordlund, G. Lindbergh, A Model for the porous Direct Methanol Fuel Cell,
Journal of the Electrochemical Society 149 (9), A1107-A1113 (2002).
[138] J. P. Meyers, J. Newman, Simulation of the Direct Methanol Fuel Cell, I.
Thermodynamic Framework for a Multicomponent Membrane, Journal of the
Electrochemical Society 149 (6) A710-A717 (2002).
[139] J. P. Meyers, J. Newman, Simulation of the Direct Methanol Fuel Cell, III.
Design and Optimization, Journal of the Electrochemical Society 149 (6) A729-
A735 (2002).
[140] A. K. Shukla , C. L. Jackson , K. Scott , G. Murgia , A solid-polymer electrolyte
direct methanol fuel cell with a mixed reactant and air anode, Journal of Power
Sources 111 (2002) 43-51.
[141] K. T. Jeng, C. W. Chen, Modeling and simulation of a direct methanol fuel cell
anode, Journal of Power Sources 112 (2002) 367-375.
[142] S. S. Sandhu, R. O. Crowther, S. C. Krishnan, J. P. Fellner, Direct methanol
polymer electrolyte fuel cell modeling: reversible open-circuit voltage and
species flux equations, Electrochimica Acta 48 (2003) 2295-2303.
[143] G. Murgia, L. Pisani, A. K. Shukla, K. Scott, A Numerical Model of a Liquid-
Feed Solid Polymer Electrolyte DMFC and Its Experimental Validation, Journal
of the Electrochemical Society 150 (9) A1231-A1245 (2003).
[144] E. Birgersson, J. Nordlund, H. Ekström, M. Vynnycky, G. Lindbergh, Reduced
Two-Dimensional One-Phase Model for Analysis of the Anode of a DMFC,
Journal of the Electrochemical Society 150 (10) A1368-A1376 (2003).
[145] J. Divisek, J. Fuhrmann, K. Gärtner, R. Jung, Performance Modeling of a Direct
Methanol Fuel Cell, Journal of The Electrochemical Society 150 (6) A811-A825
(2003).
[146] Z. H. Wang, C. Y. Wang, Mathematical modeling of liquid-feed direct methanol
fuel cell Journal of The Electrochemical Society 150 (4) A508-A519 (2003).
[147] U. Krewer, Y. Song, K. Sundmacher, V. John, R. Lübke, G. Matthies, L.
Tobiska, Direct methanol fuel cell (DMFC): analysis of residence time behavior
of anodic flow bed, Chemical Engineering Science 59 (2004) 119-130.

Transport Phenomena in Direct Methanol Fuel Cells: Modelling and Experimental Studies
259
[148] E. Birgersson, J. Nordlund, C. Picard, M. Vynnycky, G. Lindbergh, Reduced
Two-Phase Model for Analysis of the Anode of a DMFC, Journal of the
Electrochemical Society 151 (12) A2157-A2172 (2004).
[149] P. Argyropoulos, K. Scott, W. M. Taama, Modeling pressure distribution and
anode/cathode streams vapor-liquid equilibrium composition in liquid feed
direct methanol fuel cells, Chemical Engineering Journal 78 (2004) 29-41.
[150] A. A. Kulikovsky, Model of the flow with bubbles in the anode channel and
performance of DMFC, Electrochemistry Communications 7 (2005) 237-243.
[151] T. Schultz, K. Sundmacher, Rigorous dynamic model of a direct methanol fuel
cell based on Maxwell-Stefan mass transport equations and a Flory-Huggins
activity model: Formulation and experimental validation, Journal of Power
Sources 145 (2005) 435-462.
[152] A. A. Kulikovsky, Comment on "A one dimensional model of a methanol fuel
cell anode", Journal of Power Sources 148 (2005) 54.
[153] A. A. Kulikovsky, Bubbles in the anode channel and performance of a DMFC:
Asymptotic solutions, Electrochimica Acta 51 (2006) 2003-2011.
[154] J.G. Liu, T.S. Zhao, R. Chen, C.W. Wong, The effect of methanol concentration
on the performance of a passive DMFC, Electrochemistry Communications 7
(2005) 288-294.
[155] B.K. Kho, B. Bae, M.A. Scibioh, J. Lee, H.Y. Ha, On the consequences of
methanol crossover in passive air-breathing direct methanol fuel cells, Journal of
Power Sources 142 (2005) 50-55.
[156] J.G. Liu, T.S. Zhao, Z.X. Liang, R. Chen, Effect of membrane thickness on the
performance and efficiency of passive direct methanol fuel cells, Journal of
Power Sources 153 (2006) 61-67.
[157] R. Chen, T.S. Zhao, J.G. Liu, Effect of cell orientation on the performance of
passive direct methanol fuel cells, Journal of Power Sources 157 (2006) 351-
357.
[158] B. Bae, B.K. Kho, T.H. Lim, I.H. Oh, S.A. Hong, H.Y. Ha, Performance
evaluation of passive DMFC single cells, Journal of Power Sources 158 (2006)
1256-1261.
Chapter 8: References
260
[159] N. Nakagawa, M.A. Abdelkareem, K. Sekimoto, Control of methanol transport
and separation in a DMFC with a porous support, Journal of Power Sources 160
(2006) 105-115.
[160] Y.H. Pan, Advanced air-breathing direct methanol fuel cells for portable
applications, Journal of Power Sources 161 (2006) 282-289.
[161] M.A. Abdelkareem, N. Nakagawa, DMFC employing a porous plate for an
efficient operation at high methanol concentrations, Journal of Power Sources
162 (2006) 114-123.
[162] H. Kim, J. Oh, J. Kim, H. Chang, Membrane electrode assembly for passive
direct methanol fuel cells, Journal of Power Sources 162 (2006) 497-501.
[163] K. Song, H. Lee, H. Kim, MEA design for low water crossover in air-breathing
DMFC, Electrochimica Acta 53 (2007) 637-643.
[164] G. Jewett, Z. Guo, A. Faghri, Water and air management systems for a passive
direct methanol fuel cell, Journal of Power Sources 168 (2007) 434-446.
[165] P. Scharfer, W. Schabel, M. Kind, Mass transport measurements in membranes
by means of in situ Raman spectroscopy- First results of methanol and water
profiles in fuel cell membranes, Journal of Membrane Science 303 (2007) 37-42.
[166] R.Chen, T.S. Zhao, Mathematical modelling of a passive-feed DMFC with heat
transfer effect, Journal of Power Sources 152 (2005) 122-130.
[167] J. Rice, A. Faghri, A transient, multi-phase and multi-component model of a
new passive DMFC, International Journal of Heat and Mass Transfer 49 (2006)
4804-4820.
[168] V. Saarinen, O. Himanen, T. Kallio, G. Sundholm, K. Kontturi, A 3D model for
the free-breathing direct methanol fuel cell: Methanol crossover aspects and
validations with current distribution measurements, Journal of Power Sources
172 (2007) 805-815.
[169] R.Chen, T.S. Zhao, W.W. Yang, C. Hu, Two-dimensional two-phase thermal
model for a passive direct methanol fuel cells, Journal of Power Sources 175
(2008) 276-287.

Transport Phenomena in Direct Methanol Fuel Cells: Modelling and Experimental Studies
261
[170] T.K. Yeh, C.H. Chen, Modelling and optimizing the performance of a passive
direct methanol fuel cell, Journal of Power Sources 175 (2008) 353-362.
[171] T.K. Sherwood, R.L. Pigford, C.R. Wilke, Mass Transfer, McGraw-Hill, 1975.
[172] Y.A. Çengel, Heat Transfer a Practical Approach, McGraw-Hill, 1998.
[173] Thorsten Schultz, Experimental and Model-based Analysis of the Steady-state
and Dynamic Operating Behaviour of the Direct Methanol Fuel Cell (DMFC),
PhD thesis, 2004.
[174] R.C. Reid, J.M. Prausnitz, T.K. Sherwood, The Properties of Gases and Liquids,
McGraw-Hill, 1977.
[175] F. Liu, C.Y. Wang, Dramatic Reduction of Water Crossover in Direct Methanol
Fuel Cells by Cathode Humidification, Electrochemical and Solid-State Letters
12 (6) (2009) B101.
[176] K. Yoshizawa, K. Ikezone, Y. Tasaki, Kramer D., E.H. Lehmann, C.C. Sherer,
Analysis of gas diffusion layer and flow field design in a PEMFC using neutron
radiography, J. Electrochemical Society 155 (2008) B223-227.
[177] Y. Wang, C.Y. Wang and K.S. Chen, Elucidating differences between carbon
paper and carbon cloth in polymer electrolyte fuel cells, Electrochimica Acta 52
(2007) 3695–9375.
[178] F. Barbir, PEM Fuel Cells: Theory and Practice, Elsevier Academic Press,
Oxford, 2005.
[179] Fideris: http://www.fideris.com
[180] J.S. Cowart, An experimental and modelling based investigation into the high
stoichiometric flow rates required in direct methanol fuel cells, Journal of Power
Sources 143 (2005) 30-35.
[181] G.B. Jung, A. Su, C.H. Tu, Y.T. Lin, F.B. Weng and S.H. Chan, Effects of
cathode flow fields on direct methanol fuel cell-simulation study, Journal of
Power Sources 171 (2007) 212-217.
[182] Perry, Robert H., Chilton, Cecil H., Chemical Engineers’ Handbook, Fifth
edition, McGraw-Hill, 1973.

Chapter 8: References
262

263
Appendix A: Uncertainty analysis
Consider generically a parameter Y by a function of n measured variables (y1, …., yn):
( )nyyyfY ,...,, 21= (A.1)
If the uncertainty of each of the measured variables is represented by δy1, …, δyn, one
can evaluate the uncertainty of parameter Y as follows (general uncertainty analysis
approach):
( )22
22
2
11
2 ...
∂∂++
∂∂+
∂∂= n
n
yy
Yy
y
Yy
y
YY δδδδ (A.2)
The evaluation of uncertainty of the parameters that affect the experimental results is
described in detail in the following sections.
A.1. Methanol concentration
The methanol solutions used in the tests performed with an active and passive feed
DMFC were prepared following the equation:
initialfinal
initialfinal C
V
VC = (A.3)
According to the general uncertainty approach, the uncertainty of the resulting variable
(Cfinal) can be calculated as follows:
( )22
2
∂∂
+
∂∂
= finalfinal
finalinitial
initial
finalfinal V
V
CV
V
CC δδδ (A.4)
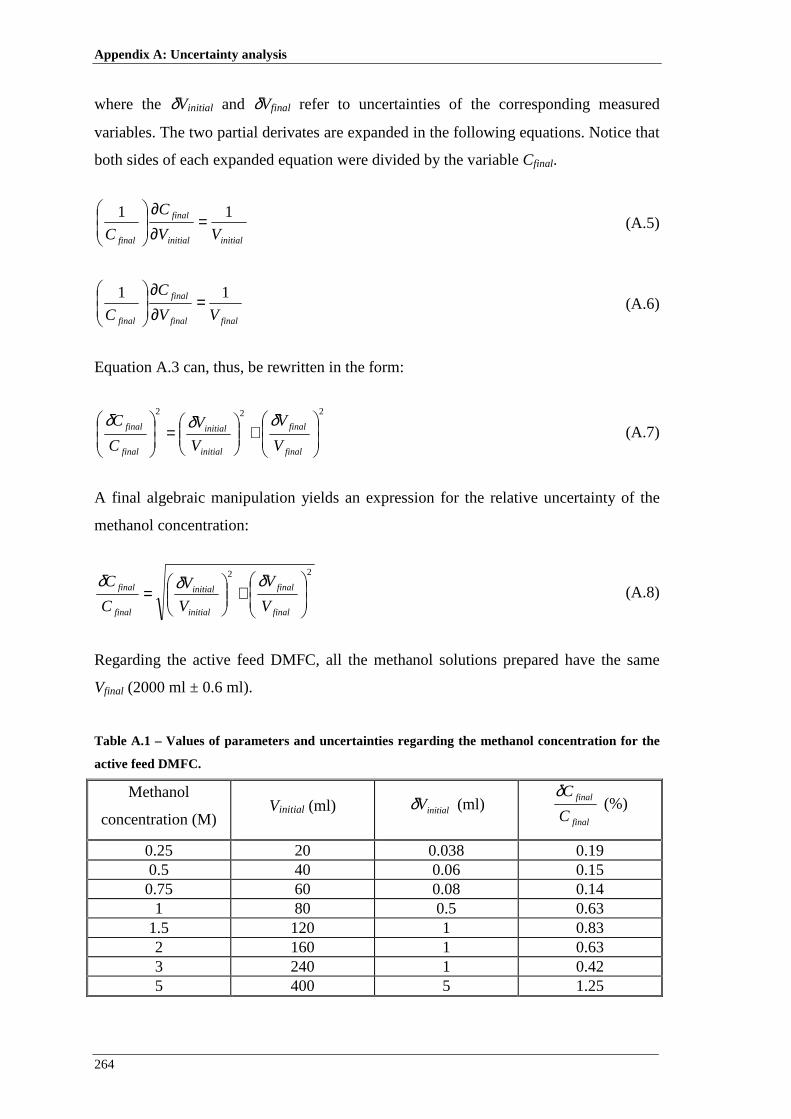
Appendix A: Uncertainty analysis
264
where the δVinitial and δVfinal refer to uncertainties of the corresponding measured
variables. The two partial derivates are expanded in the following equations. Notice that
both sides of each expanded equation were divided by the variable Cfinal.
initialinitial
final
final VV
C
C
11 =∂∂
(A.5)
finalfinal
final
final VV
C
C
11 =∂∂
(A.6)
Equation A.3 can, thus, be rewritten in the form:
222
+
=
final
final
initial
initial
final
final
V
V
V
V
C
C δδδ (A.7)
A final algebraic manipulation yields an expression for the relative uncertainty of the
methanol concentration:
22
+
=
final
final
initial
initial
final
final
V
V
V
V
C
C δδδ (A.8)
Regarding the active feed DMFC, all the methanol solutions prepared have the same
Vfinal (2000 ml ± 0.6 ml).
Table A.1 – Values of parameters and uncertainties regarding the methanol concentration for the
active feed DMFC.
Methanol
concentration (M) Vinitial (ml) initialVδ (ml)
final
final
C
Cδ (%)
0.25 20 0.038 0.19 0.5 40 0.06 0.15 0.75 60 0.08 0.14
1 80 0.5 0.63 1.5 120 1 0.83 2 160 1 0.63 3 240 1 0.42 5 400 5 1.25

Transport Phenomena in Direct Methanol Fuel Cells: Modelling and Experimental Studies
265
All the methanol solutions prepared, for the passive feed DMFC, have a Vfinal of 50 ml ±
0.06 ml.
Table A.2 – Values of parameters and uncertainties regarding the methanol concentration for the
passive feed DMFC.
Methanol
concentration (M) Vinitial (ml) initialVδ (ml)
final
final
C
Cδ (%)
1 2 0.01 0.51 2 4 0.03 0.76 3 6 0.03 0.51 4 8 0.04 0.51 5 10 0.02 0.23
A.2. Air flow rate
The air flow rate was set using the MTK unit and FCPower Software using a mass flow
controller, so the uncertainty associated with this parameter depends on the uncertainty
of the mass flow controller (δMFC), the uncertainty of the data acquisition (δData) and
the uncertainty of the measurement (δRead). According to the general uncertainty
approach, and after algebraic manipulation, the uncertainty of the resulting variable
( airq ) can be determined as follows:
222Re
+
+
=
airairairair
air
q
ad
q
Data
q
MFC
q
q δδδδ (A.9)
Since the uncertainty of the data acquisition (δData) and the measurement (δRead) are
much lower than the uncertainty of the mass flow controller (δMFC), they were
neglected in the calculation of the overall uncertainty. The uncertainty of the mass flow
controller (δMFC) is ± range×%01.0 . As already mentioned in Chapter 4 the range of
the MFC is from 0 to 10 l/min.

Appendix A: Uncertainty analysis
266
Table A.3 – Values of parameters and uncertainties regarding the air flow rate.
airq (l/min) MFCδ (l/min) OHCH
OHCH
q
q
3
3δ
(%)
3.6 0.2 5.56 2 0.2 10
1.5 0.2 13.33 1 0.2 20
0.75 0.2 26.68 0.5 0.2 40
A.3. Methanol flow rate
The methanol flow rate was set using the MTK unit and FCPower Software using a
magnetic micropump, so the uncertainty associated with this parameter depends on the
uncertainty of the micropump (δMP), the uncertainty of the data acquisition (δData)
and the uncertainty of the measurement (δRead). According to the general uncertainty
approach, and after algebraic manipulation, the uncertainty of the resulting variable
( OHCHq3
) can be calculated as follows:
222
3333
3 Re
+
+
=
OHCHOHCHOHCHOHCH
OHCH
q
ad
q
Data
q
MP
q
q δδδδ (A.10)
Since the uncertainty of the data acquisition (δData), the uncertainty of the micropump
(δMP) and the uncertainty of the measurement (δRead) are very low the overall
uncertainty is near zero, so this uncertainty was neglected.
A.4. Current
The current was set using the MTK unit and FCPower Software using a loadbank
system, so the uncertainty associated with this parameter depends on the uncertainty of
the loadbank (δLB), the uncertainty of the data acquisition (δData) and the uncertainty
of the measurement (δRead). According to the general uncertainty approach, and after
algebraic manipulation, the uncertainty of the resulting variable (ICell) can be determined
as follows:
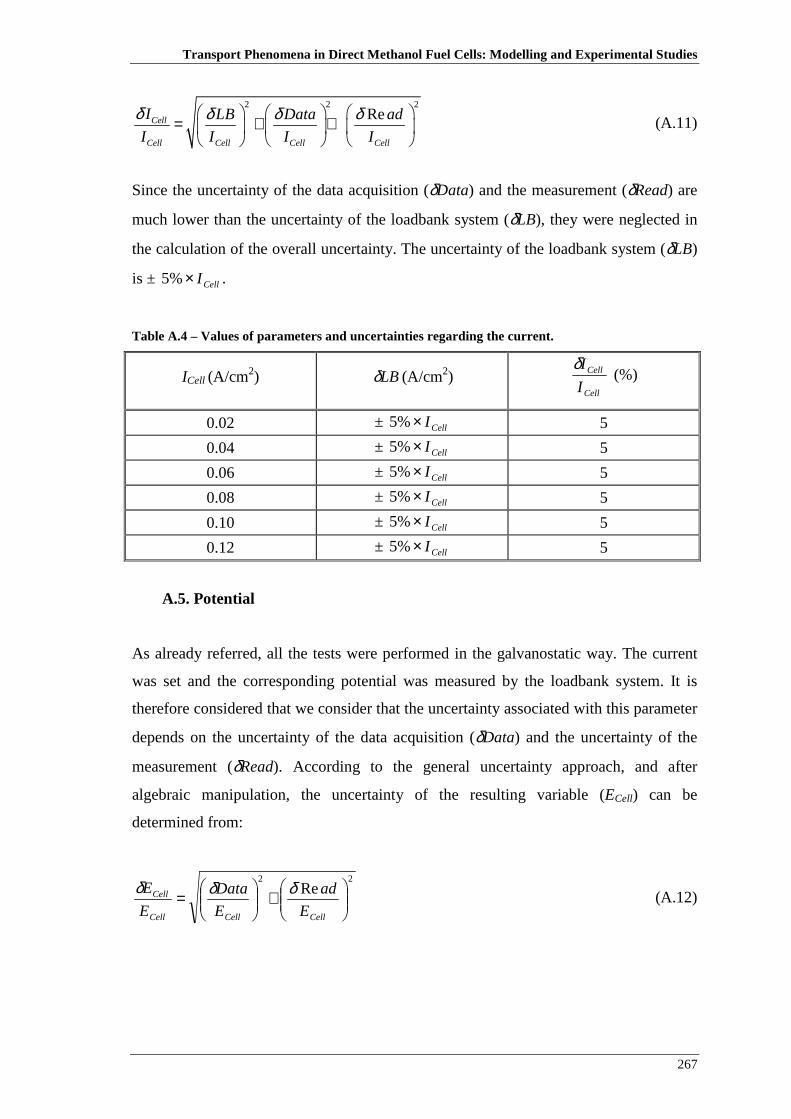
Transport Phenomena in Direct Methanol Fuel Cells: Modelling and Experimental Studies
267
2 2 2ReCell
Cell Cell Cell Cell
I LB Data ad
I I I I
δ δ δ δ = + +
(A.11)
Since the uncertainty of the data acquisition (δData) and the measurement (δRead) are
much lower than the uncertainty of the loadbank system (δLB), they were neglected in
the calculation of the overall uncertainty. The uncertainty of the loadbank system (δLB)
is ± CellI×%5 .
Table A.4 – Values of parameters and uncertainties regarding the current.
ICell (A/cm2) LBδ (A/cm2) Cell
Cell
I
Iδ (%)
0.02 ± CellI×%5 5
0.04 ± CellI×%5 5
0.06 ± CellI×%5 5
0.08 ± CellI×%5 5
0.10 ± CellI×%5 5
0.12 ± CellI×%5 5
A.5. Potential
As already referred, all the tests were performed in the galvanostatic way. The current
was set and the corresponding potential was measured by the loadbank system. It is
therefore considered that we consider that the uncertainty associated with this parameter
depends on the uncertainty of the data acquisition (δData) and the uncertainty of the
measurement (δRead). According to the general uncertainty approach, and after
algebraic manipulation, the uncertainty of the resulting variable (ECell) can be
determined from:
22Re
+
=
CellCellCell
Cell
E
ad
E
Data
E
E δδδ (A.12)

Appendix A: Uncertainty analysis
268
Since the uncertainty of the data acquisition (δData) is much lower than the uncertainty
of the measurement (δRead), it was neglected in the calculation of the overall
uncertainty.
Table A.5 – Values of parameters and uncertainties regarding the potential.
ECell (V) δRead (V) Cell
Cell
E
Eδ (%)
0.1 0.0005 0.50 0.3 0.0005 0.17 0.5 0.0005 0.10 0.7 0.0005 0.07 0.9 0.0005 0.06
A.6. Power
The power density presented in the results was determined by:
CellCellVIP = (A.13)
According to the general uncertainty approach, the uncertainty of the resulting variable
(P) is given by:
( )22
2
∂∂+
∂∂= Cell
CellCell
Cell
VV
PI
I
PP δδδ (A.14)
where the δIcell and δVCell refer to uncertainties of the corresponding measured variables.
The two partial derivates were expanded, both sides of each expanded equation were
divided by the variable P and after some algebraic manipulation of Eq. A.14 yields the
following expression for the relative uncertainty of the power density.
22
+
=
Cell
Cell
Cell
Cell
V
V
I
I
P
P δδδ (A.15)
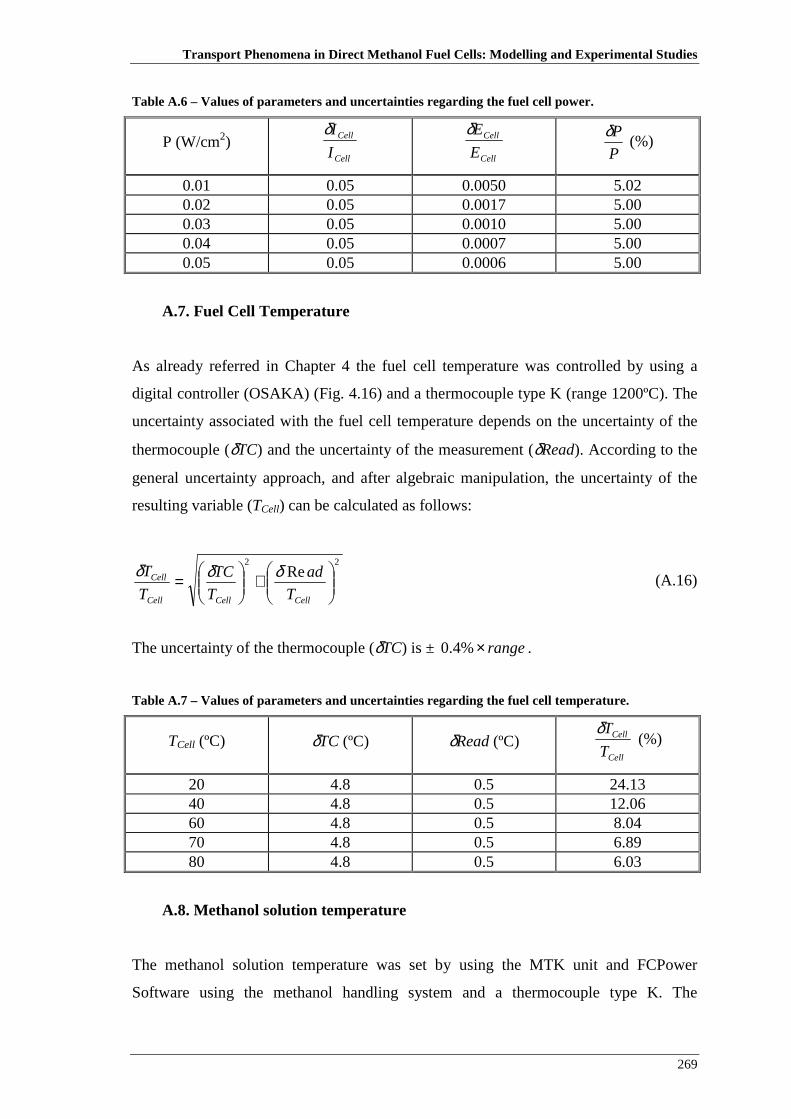
Transport Phenomena in Direct Methanol Fuel Cells: Modelling and Experimental Studies
269
Table A.6 – Values of parameters and uncertainties regarding the fuel cell power.
P (W/cm2) Cell
Cell
I
Iδ
Cell
Cell
E
Eδ
P
Pδ (%)
0.01 0.05 0.0050 5.02 0.02 0.05 0.0017 5.00 0.03 0.05 0.0010 5.00 0.04 0.05 0.0007 5.00 0.05 0.05 0.0006 5.00
A.7. Fuel Cell Temperature
As already referred in Chapter 4 the fuel cell temperature was controlled by using a
digital controller (OSAKA) (Fig. 4.16) and a thermocouple type K (range 1200ºC). The
uncertainty associated with the fuel cell temperature depends on the uncertainty of the
thermocouple (δTC) and the uncertainty of the measurement (δRead). According to the
general uncertainty approach, and after algebraic manipulation, the uncertainty of the
resulting variable (TCell) can be calculated as follows:
22Re
+
=
CellCellCell
Cell
T
ad
T
TC
T
T δδδ (A.16)
The uncertainty of the thermocouple (δTC) is ± range×%4.0 .
Table A.7 – Values of parameters and uncertainties regarding the fuel cell temperature.
TCell (ºC) δTC (ºC) δRead (ºC) Cell
Cell
T
Tδ (%)
20 4.8 0.5 24.13 40 4.8 0.5 12.06 60 4.8 0.5 8.04 70 4.8 0.5 6.89 80 4.8 0.5 6.03
A.8. Methanol solution temperature
The methanol solution temperature was set by using the MTK unit and FCPower
Software using the methanol handling system and a thermocouple type K. The

Appendix A: Uncertainty analysis
270
uncertainty associated with this parameter depends on the uncertainty of the methanol
handling system (δMHS), the uncertainty of the data acquisition (δData), the
uncertainty of the measurement (δRead) and the uncertainty of the thermocouple (δTC).
According to the general uncertainty approach, and after algebraic manipulation, the
uncertainty of the resulting variable ( OHCHT3
) can be determined by:
2222
33333
3 Re
+
+
+
=
OHCHOHCHOHCHOHCHOHCH
OHCH
T
TC
T
ad
T
Data
T
MHS
T
T δδδδδ (A.17)
Since the uncertainty of the data acquisition (δData) and the measurement (δRead) are
much lower than the others, they were neglected in the calculation of the overall
uncertainty. The uncertainty of the methanol handling system (δMHS) is ± OHCHT3
%5 × .
Table A.8 – Values of parameters and uncertainties regarding the methanol solution temperature.
OHCHT3
(ºC) δMHS (ºC) δTC (ºC) Cell
Cell
T
Tδ (%)
20 ± OHCHT3
%5 × 4.8 24.51
40 ± OHCHT3
%5 × 4.8 13.00
60 ± OHCHT3
%5 × 4.8 9.43
70 ± OHCHT3
%5 × 4.8 8.49
80 ± OHCHT3
%5 × 4.8 7.81
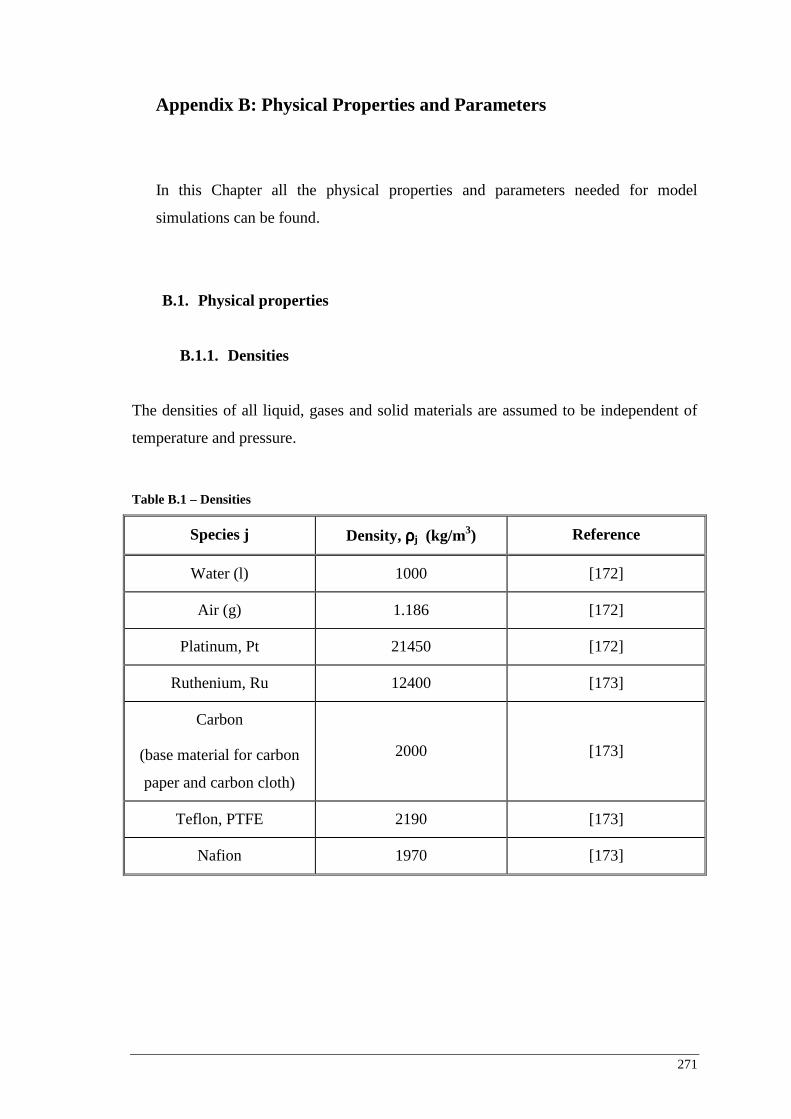
271
Appendix B: Physical Properties and Parameters
In this Chapter all the physical properties and parameters needed for model
simulations can be found.
B.1. Physical properties
B.1.1. Densities
The densities of all liquid, gases and solid materials are assumed to be independent of
temperature and pressure.
Table B.1 – Densities
Species j Density, ρρρρj (kg/m3) Reference
Water (l) 1000 [172]
Air (g) 1.186 [172]
Platinum, Pt 21450 [172]
Ruthenium, Ru 12400 [173]
Carbon
(base material for carbon
paper and carbon cloth)
2000 [173]
Teflon, PTFE 2190 [173]
Nafion 1970 [173]

Appendix B: Physical Properties and Parameters
272
B.1.2. Specific heat
The heat capacities, for all materials, are necessary for the heat balances. Literature data
are given in the next table.
Table B.2 – Specific heat
Species j Cp,j (J/molK) Reference
Liquid
water (l) 75.29 [172]
Methanol
(l) 80.96 [172]
Carbon
dioxide
(g)
( )3925 10097.410338.101754.0728.4187.4 TTT −− ×+×−+× [182]
Water
vapour (g) 33.58 [172]
Oxygen
(g) ( )39265 10544.21017.41079.8713.6187.4 TTT −−− ×−×+×−× [182]
Air 29 [172]
B.1.3. Thermal conductivities
For liquid water and air data for different temperatures are given in the literature [182].
The thermal conductivity shows a linear increase with temperature and linear
regressions yield the expressions presented.
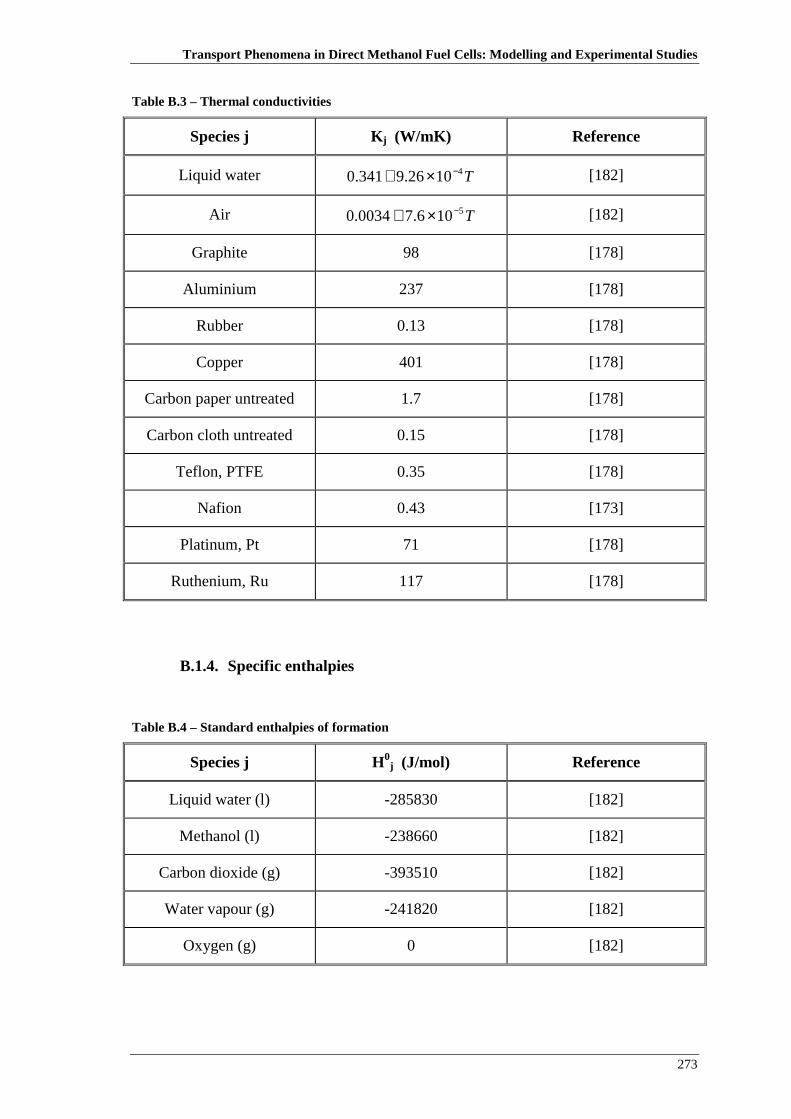
Transport Phenomena in Direct Methanol Fuel Cells: Modelling and Experimental Studies
273
Table B.3 – Thermal conductivities
Species j K j (W/mK) Reference
Liquid water T41026.9341.0 −×+ [182]
Air T5106.70034.0 −×+ [182]
Graphite 98 [178]
Aluminium 237 [178]
Rubber 0.13 [178]
Copper 401 [178]
Carbon paper untreated 1.7 [178]
Carbon cloth untreated 0.15 [178]
Teflon, PTFE 0.35 [178]
Nafion 0.43 [173]
Platinum, Pt 71 [178]
Ruthenium, Ru 117 [178]
B.1.4. Specific enthalpies
Table B.4 – Standard enthalpies of formation
Species j H0j (J/mol) Reference
Liquid water (l) -285830 [182]
Methanol (l) -238660 [182]
Carbon dioxide (g) -393510 [182]
Water vapour (g) -241820 [182]
Oxygen (g) 0 [182]
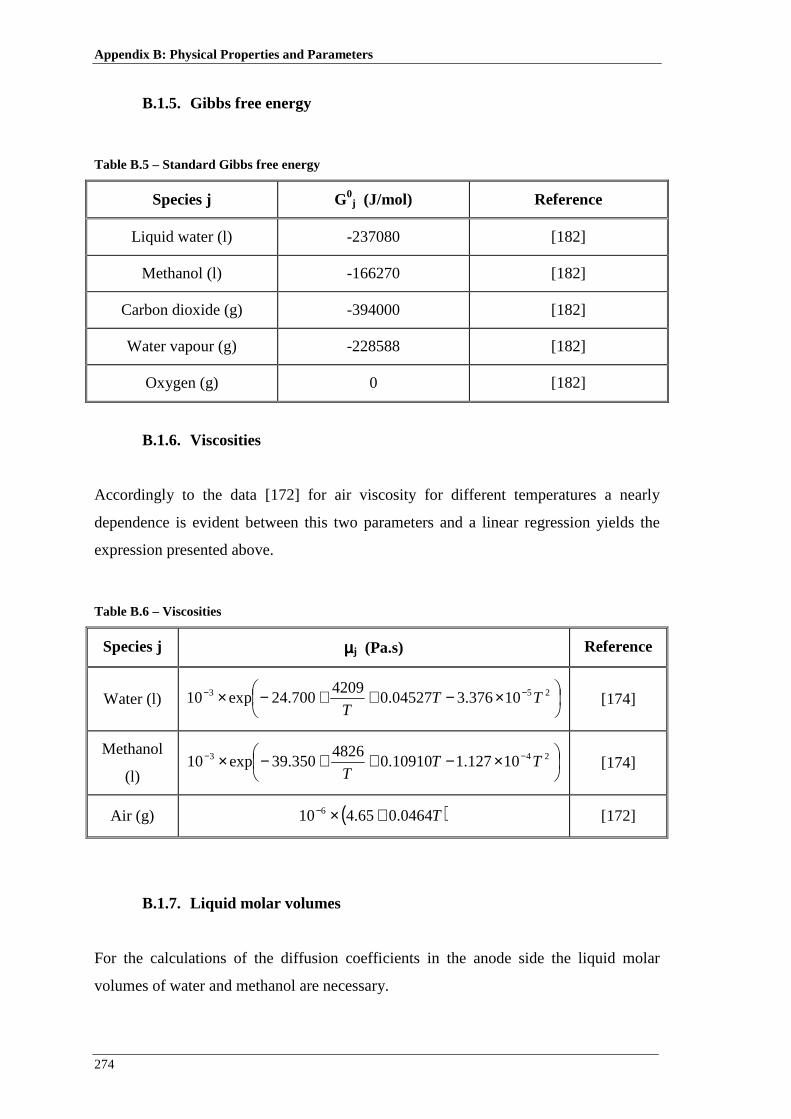
Appendix B: Physical Properties and Parameters
274
B.1.5. Gibbs free energy
Table B.5 – Standard Gibbs free energy
Species j G0j (J/mol) Reference
Liquid water (l) -237080 [182]
Methanol (l) -166270 [182]
Carbon dioxide (g) -394000 [182]
Water vapour (g) -228588 [182]
Oxygen (g) 0 [182]
B.1.6. Viscosities
Accordingly to the data [172] for air viscosity for different temperatures a nearly
dependence is evident between this two parameters and a linear regression yields the
expression presented above.
Table B.6 – Viscosities
Species j µµµµj (Pa.s) Reference
Water (l)
×−++−× −− 253 10376.304527.04209
700.24exp10 TTT
[174]
Methanol
(l)
×−++−× −− 243 10127.110910.04826
350.39exp10 TTT
[174]
Air (g) ( )T0464.065.410 6 +×− [172]
B.1.7. Liquid molar volumes
For the calculations of the diffusion coefficients in the anode side the liquid molar
volumes of water and methanol are necessary.

Transport Phenomena in Direct Methanol Fuel Cells: Modelling and Experimental Studies
275
Table B.7 – Liquid molar volumes
Species j V j (J/mol) Reference
Water (l) 6107.18 −× [174]
Methanol (l) 6105.42 −× [174]
B.1.8. Parachors
For the calculations of the diffusion coefficients in the anode side the parachors values
of water and methanol are necessary.
Table B.8 – Parachors values
Species j P (cm3g0.25/s-0.5) Reference
Water 51 [171]
Methanol 85.3 [171]
B.1.9. Diffusion volumes
For the calculations of the diffusion coefficients in the cathode side the diffusion
volumes of water, air and oxygen are necessary.
Table B.9 – Diffusion volumes
Species j ∑∑∑∑υυυυ (cm3/mol) Reference
Water 12.7 [171]
Air 20.1 [171]
Oxygen 16.6 [171]

Appendix B: Physical Properties and Parameters
276
B.1.10. Tortuosity
Table B.10 – Tortuosity
Species j τ τ τ τ Reference
Carbon cloth 1.11 [177]
Carbon paper 2.75 [177]
B.2. Diffusion coefficients
B.2.1. Anode diffusion and Catalytic layer
The binary diffusion coefficients of the mobile species in the anode diffusion and
catalytic layer are calculated using the Tyn-Calus method [174] for diffusion
coefficients in liquid solutions at infinite dilution (in [m²/s]):
ji
j
j
iij
T
P
P
V
VD
µ×
×
×= −
6.06/1
2121093.8 (B.1)
Here component i is the solute and j is the solvent. The molar volumes V are in
cm³/mol, the viscosities µ in cP and the temperature T in K. P is so-called parachors,
which are related to the liquid surface tension, but can also be estimated from a groups
contribution method developed by QUAYLE [174]. For water and methanol this
method leads to parachor values presented in table B.8. According to the literature, if
water is the solute, the parachor and molar volume values of water shall be doubled
(water is treated as a dimer).
As the mass transport takes place within a porous matrix, effective diffusion coefficients
are needed. To convert the gained values into effective coefficients, it has to be
accounted for the morphology of the solid matrix represented by the tortuosity
coefficient, τ [171]:
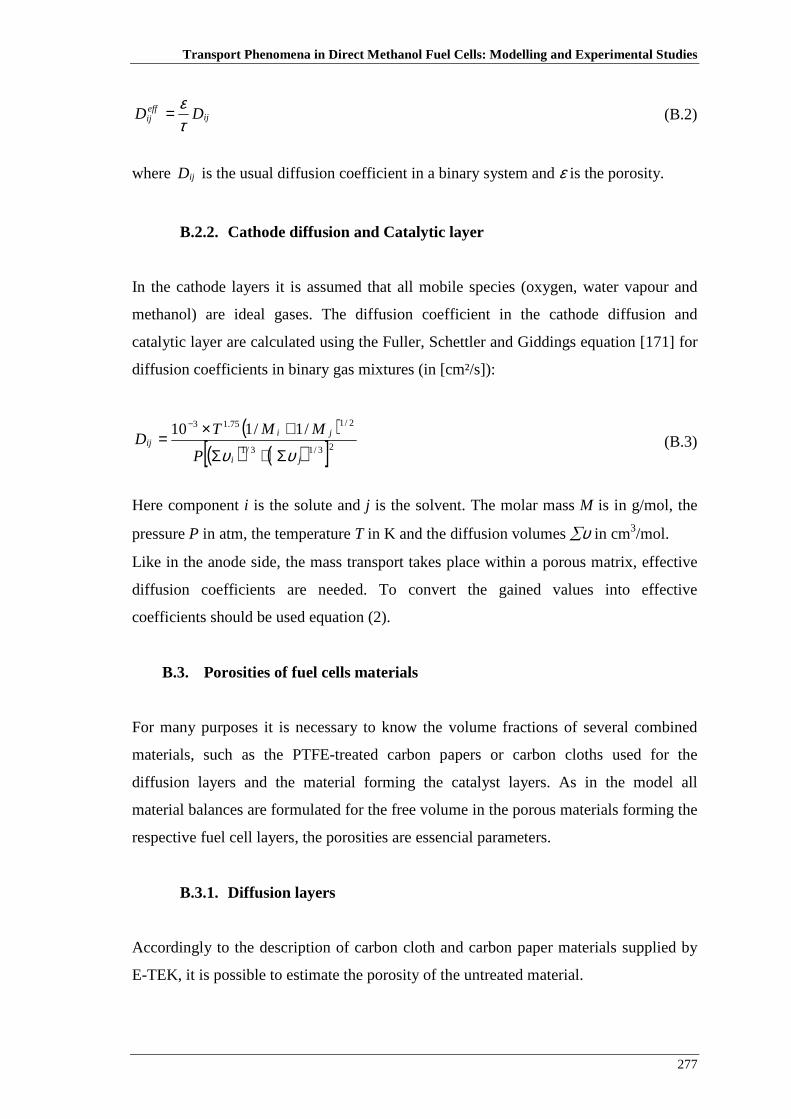
Transport Phenomena in Direct Methanol Fuel Cells: Modelling and Experimental Studies
277
ijeffij DD
τε= (B.2)
where ijD is the usual diffusion coefficient in a binary system and ε is the porosity.
B.2.2. Cathode diffusion and Catalytic layer
In the cathode layers it is assumed that all mobile species (oxygen, water vapour and
methanol) are ideal gases. The diffusion coefficient in the cathode diffusion and
catalytic layer are calculated using the Fuller, Schettler and Giddings equation [171] for
diffusion coefficients in binary gas mixtures (in [cm²/s]):
( )( ) ( )[ ]23/13/1
2/175.13 /1/110
ji
jiij
P
MMTD
υυ Σ+Σ
+×=−
(B.3)
Here component i is the solute and j is the solvent. The molar mass M is in g/mol, the
pressure P in atm, the temperature T in K and the diffusion volumes ∑υ in cm3/mol.
Like in the anode side, the mass transport takes place within a porous matrix, effective
diffusion coefficients are needed. To convert the gained values into effective
coefficients should be used equation (2).
B.3. Porosities of fuel cells materials
For many purposes it is necessary to know the volume fractions of several combined
materials, such as the PTFE-treated carbon papers or carbon cloths used for the
diffusion layers and the material forming the catalyst layers. As in the model all
material balances are formulated for the free volume in the porous materials forming the
respective fuel cell layers, the porosities are essencial parameters.
B.3.1. Diffusion layers
Accordingly to the description of carbon cloth and carbon paper materials supplied by
E-TEK, it is possible to estimate the porosity of the untreated material.

Appendix B: Physical Properties and Parameters
278
Table B.11 – Porosities of the common materials used as gas diffusion layers.
Material Porosity
Carbon paper 0.78
Carbon cloth 0.83
The porosity of a gas diffusion layer may be easily calculated using the following
equation [178]:
δρε
×−=
real
AW1 (B.4)
where WA is the areal weight in g/cm2, ρreal is the solid phase density in g/cm3 and δ is
the thickness in cm.
As the carbon paper and carbon cloth are PTFE treated the real porosity has to be
calculated as a function of the PFTE content.
volumetotal
volumePTFEvolumecarbonvolumetotaltretated −−=ε (B.5)
( ) volumetotalvolumecarbon untreated ×−= ε1 (B.6)
( ) volumetotalw
wvolumePTFE untreated
PTFE
carbon
PTFE
PTFE ×−
×−
= ερρ
11
(B.7)
Substituting equations (6) and (7) in (5) one gets
( )untreated
PTFE
carbon
PTFE
PTFEuntreatedtretated
w
w ερρεε −×
−−= 1
1 (B.8)
where wPTFE is the PTFE mass content, normally is 0.30, εtreated is the porosity of the gas
diffusion layer material after the treatment with PTFE and εuntreated the porosity of the
gas diffusion layer material before the treatment with PTFE.

Transport Phenomena in Direct Methanol Fuel Cells: Modelling and Experimental Studies
279
B.3.2. Catalytic layers
The porosity of the catalytic layer in another important parameter and it can be
calculated as:
volumetotal
volumecatalystvolumetotal −=ε (B.9)
cat
catS
cat
cat wAmvolumecatalyst
ρρ×== (B.10)
δ×= SAvolumetotal (B.11)
Substituting equations (B.10) and (B.11) in (B.9) one gets
δρ
δε cat
catw−=
(B.12)
where wcat is the catalyst loading and δ is the thickness of the catalytic layer.
In the anode side the catalyst loading is a mixture between platinum and ruthenium. In
this way, the density of the mixed anode catalyst can be calculated from the mass
fractions of both metals and their densities.
B.4. Effective thermal conductivities
B.4.1. Diffusion layers
As the diffusion layers are porous structures, their effective thermal conductivities have
to be calculated accounting for the present materials and reactants as well as their
volume fractions. In table B.3 thermal conductivities of the untreated materials are
presented. Using this value and the volume fractions of carbon fibres and PTFE as well
as the porosity, the effective thermal conductivity can be calculated accounting for the
material filling the pores and for the temperature. In the anode diffusion layer (AD) the
pores are assumed to be filled with a liquid mixture, which mainly consists of water. In

Appendix B: Physical Properties and Parameters
280
the cathode diffusion layer (CD) the pores are assumed to be filled with air. The
resulting expressions are:
( ) ( ) water
untreatedPTFE
treatedj
untreatedAD KKKK εεε +−+−= 11 (B.13)
( ) ( ) airuntreated
PTFEtreated
juntreatedCD KKKK εεε +−+−= 11
(B.14)
where j is carbon paper or carbon cloth
B.4.2. Catalytic layers
Like the diffusion layers the catalytic layers are porous structures, so a similar
procedure has to be done. Using the values presented in table B.3 and the porosity, the
effective thermal conductivity can be calculated accounting for the material filling the
pores. The resulting expressions are:
( ) waterRuPtAC KKK εε +−= −1 (B.15)
( ) airPtCC KKK εε +−= 1
(B.16)
The thermal conductivity of the mixed anode catalyst can be calculated from the mass
fractions of both metals and their thermal conductivities.
B.5. Heat transfer in finned surfaces
If we consider a fin of constant cross-sectional area, A, and length tionIIsecδ that is
attached to the surface with a perfect contact heat will flow from the surface to the fin
by conduction and from the fin to the surrounding medium by convection with the same
heat transfer coefficient, h. In the ideal case of zero thermal resistance or infinite
thermal conductivity, the temperature of the fin will be uniform and equal to the
temperature of the base Tb (TA or TC see Figure 3.1). The heat transfer from the fin will
be maximum in this case and can be calculated by [172]
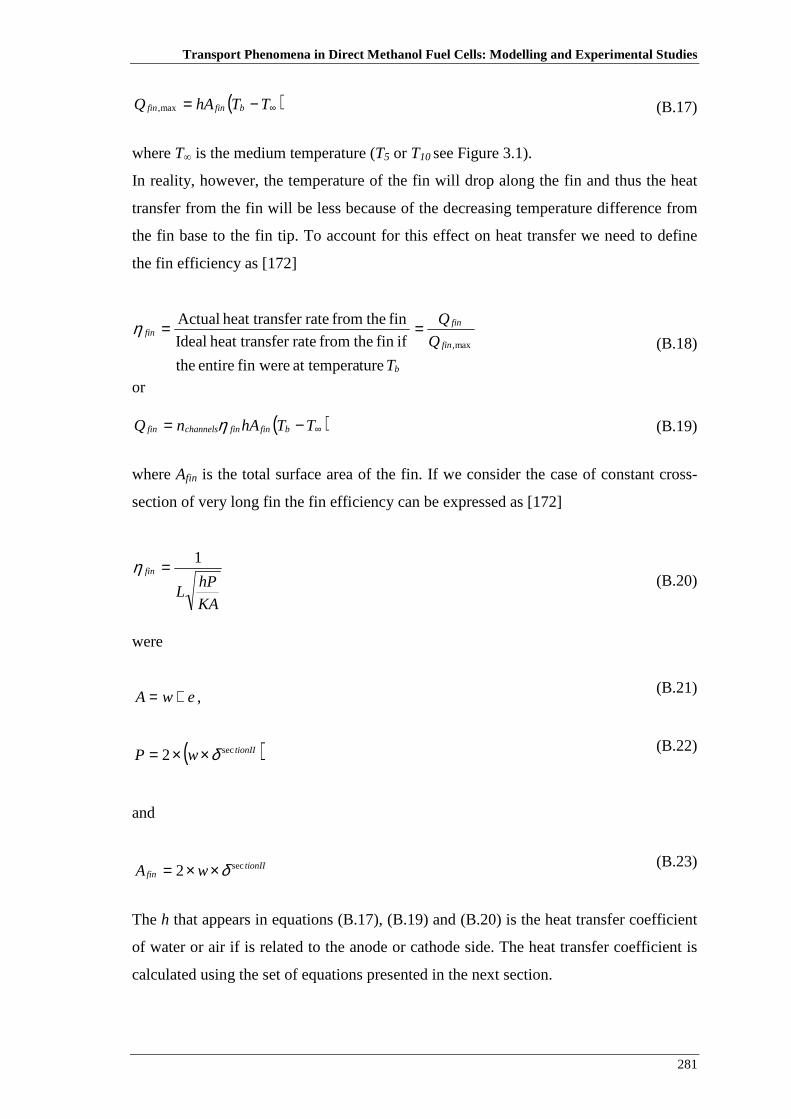
Transport Phenomena in Direct Methanol Fuel Cells: Modelling and Experimental Studies
281
( )∞−= TThAQ bfinfin max, (B.17)
where T∞ is the medium temperature (T5 or T10 see Figure 3.1).
In reality, however, the temperature of the fin will drop along the fin and thus the heat
transfer from the fin will be less because of the decreasing temperature difference from
the fin base to the fin tip. To account for this effect on heat transfer we need to define
the fin efficiency as [172]
max,
tureat tempera fin were entire the
iffin thefrom ratefer heat trans Ideal
fin thefrom ratefer heat trans Actual
fin
fin
b
finQ
Q
T
==η (B.18)
or
( )∞−= TThAnQ bfinfinchannelsfin η (B.19)
where Afin is the total surface area of the fin. If we consider the case of constant cross-
section of very long fin the fin efficiency can be expressed as [172]
KA
hPL
fin1=η
(B.20)
were
ewA += ,
(B.21)
( )tionIIwP sec2 δ××= (B.22)
and
tionII
fin wA sec2 δ××= (B.23)
The h that appears in equations (B.17), (B.19) and (B.20) is the heat transfer coefficient
of water or air if is related to the anode or cathode side. The heat transfer coefficient is
calculated using the set of equations presented in the next section.

Appendix B: Physical Properties and Parameters
282
B.6. Heat transfer coefficients in the anode and cathode channels
To calculate the heat transfer coefficients in the anode and cathode channels we use the
correlations for forced convection inside tubes with laminar flow [172]. Therefore the
hydraulic diameter is
channel
channelh
P
AD
×= 4 (B.24)
were
eA tionIIchannel ×= secδ
(B.25)
and
eP tionIIchannel 22 sec += δ
(B.26)
The maximum liquid and air velocity is
channelschannel
AFA
nA
Qv
×=max (B.27)
and
channelschannel
CFC
nA
Qv
×=max
(B.28)
The maximum Reynolds number, for anode and cathode, is
OH
OHhA
A Dv
2
2maxmaxRe
µρ××= (B.29)
and

Transport Phenomena in Direct Methanol Fuel Cells: Modelling and Experimental Studies
283
air
airhC
C Dv
µρ××= max
maxRe (B.30)
For the values assumed to the anode and cathode flow rate the Reynolds number is
inferior to 2300 which means laminar flow. For such flow conditions the Nusselt
number as representation of the heat transfer coefficient, h, defined as
K
DhNu h×= (B.31)
Can be calculated from the correlation [172]
3/1PrRe
86.1
××=w
DNu h
(B.32)
The Prandtl numbers are
OH
OHOHOH
K
Cp
2
22
2
1,Prµ×= (B.33)
and
air
airairair
K
Cp µ×=Pr (B.34)

Appendix B: Physical Properties and Parameters
284

285
Appendix C: Experimental Results of an active feed DMFC
In this Chapter all the experimental results performed with the «in-house»
developed active feed DMFC are presented. The results are very important and
useful for evaluate the effect of different operating and design parameters on fuel
cell performance and for the validation of mathematical models.
C.1. Effect of operating conditions
All the results presented in this section were obtained with a DMFC with carbon cloth
type A and ELAT (E-TEK) as, respectively, anode and cathode gas diffusion layer. The
catalyst loading used was 4 mg/cm2 of Pt/Ru and Pt, respectively, at the anode and
cathode side. The membrane used was Nafion 117 and a single serpentine flow field
both for anode and cathode.
C.1.1. Methanol concentration
Table C.1 – Set of operating conditions used to analyse the effect of methanol concentration on the
cell performance.
OHCHC3
(M) OHCHq3
(ml/min) qair (l/min) Cell temperature (ºC)
0.25
8 3.6 20
0.5 0.75
1 1.5 2 3
0.25
3 3.6 20
0.5 0.75
1 1.5 2 3 5
0.25
3 1 20
0.5 0.75
1 1.5 2 3

Appendix C: Experimental results of an active feed DMFC
286
0.0
0.1
0.2
0.3
0.4
0.5
0.6
0.7
0.8
0.00 0.01 0.02 0.03 0.04 0.05 0.06
Current density (A/cm2)
Cel
l po
ten
tial (
V)
0.25 M 0.5 M 0.75 M 1 M 1.5 M 2 M 3 M
a)
Figure C.1 – Effect of methanol concentration on a) cell performance. Operating conditions:
methanol flow rate 8 ml/min and air flow rate 3.6 l/min.
0.0
0.1
0.2
0.3
0.4
0.5
0.6
0.7
0.00 0.01 0.02 0.03 0.04 0.05 0.06
Current density (A/cm2)
Cel
l po
ten
tial (
V)
0.25 M 0.5 M 0.75 M 1 M 1.5 M 2 M 3 M 5 M
a)
Figure C.2 – Effect of methanol concentration on a) cell performance. Operating conditions:
methanol flow rate 3 ml/min and air flow rate 3.6 l/min.

Transport Phenomena in Direct Methanol Fuel Cells: Modelling and Experimental Studies
287
0.0
0.1
0.2
0.3
0.4
0.5
0.6
0.7
0.8
0.00 0.01 0.02 0.03 0.04 0.05 0.06 0.07
Current density (A/cm2)
Cel
l po
ten
tial (
V)
0.25 M 0.5 M 0.75 M 1 M 1.5 M 2 M 3 M
a)
Figure C.3 – Effect of methanol concentration on a) cell performance. Operating conditions:
methanol flow rate 3 ml/min and air flow rate 1 l/min.
C.1.2. Fuel cell temperature
Table C.2 – Set of operating conditions used to analyse the effect of cell temperature on the cell
performance.
OHCHC3
(M) OHCHq3
(ml/min) qair (l/min) Cell temperature (ºC)
0.75 8 3.6
20 40 60 70 80
0.75 3 3.6
20 40 60 70 80
0.75 3 1
20 40 60 70 80
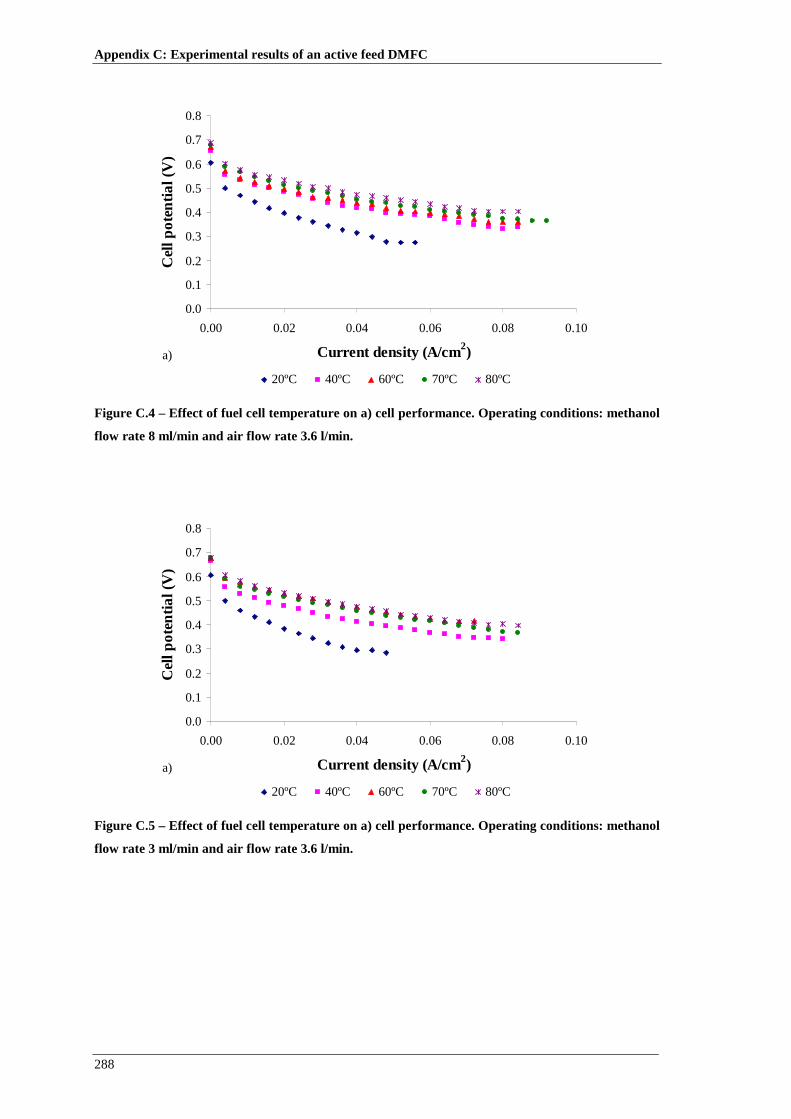
Appendix C: Experimental results of an active feed DMFC
288
0.0
0.1
0.2
0.3
0.4
0.5
0.6
0.7
0.8
0.00 0.02 0.04 0.06 0.08 0.10
Current density (A/cm2)
Cel
l po
ten
tial (
V)
20ºC 40ºC 60ºC 70ºC 80ºC
a)
Figure C.4 – Effect of fuel cell temperature on a) cell performance. Operating conditions: methanol
flow rate 8 ml/min and air flow rate 3.6 l/min.
0.0
0.1
0.2
0.3
0.4
0.5
0.6
0.7
0.8
0.00 0.02 0.04 0.06 0.08 0.10
Current density (A/cm2)
Cel
l po
ten
tial (
V)
20ºC 40ºC 60ºC 70ºC 80ºC
a)
Figure C.5 – Effect of fuel cell temperature on a) cell performance. Operating conditions: methanol
flow rate 3 ml/min and air flow rate 3.6 l/min.
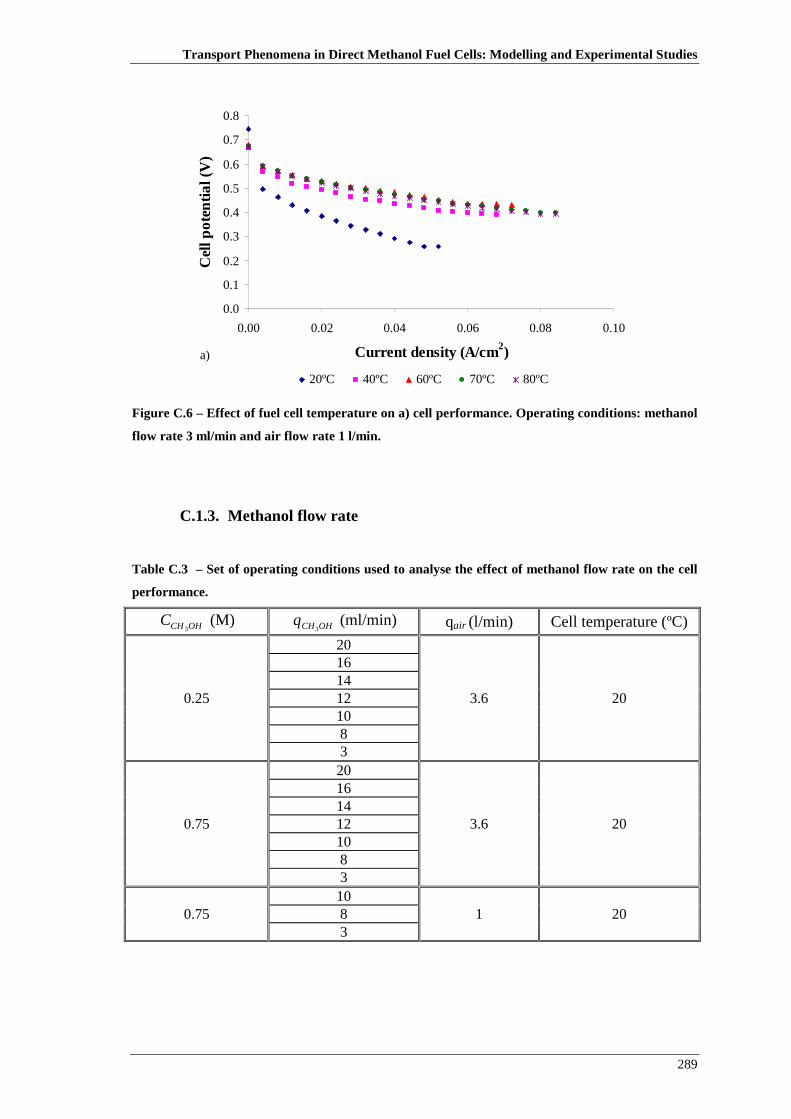
Transport Phenomena in Direct Methanol Fuel Cells: Modelling and Experimental Studies
289
0.0
0.1
0.2
0.3
0.4
0.5
0.6
0.7
0.8
0.00 0.02 0.04 0.06 0.08 0.10
Current density (A/cm2)
Cel
l po
ten
tial (
V)
20ºC 40ºC 60ºC 70ºC 80ºC
a)
Figure C.6 – Effect of fuel cell temperature on a) cell performance. Operating conditions: methanol
flow rate 3 ml/min and air flow rate 1 l/min.
C.1.3. Methanol flow rate
Table C.3 – Set of operating conditions used to analyse the effect of methanol flow rate on the cell
performance.
OHCHC3
(M) OHCHq3
(ml/min) qair (l/min) Cell temperature (ºC)
0.25
20
3.6 20
16 14 12 10 8 3
0.75
20
3.6 20
16 14 12 10 8 3
0.75 10
1 20 8 3

Appendix C: Experimental results of an active feed DMFC
290
0.0
0.1
0.2
0.3
0.4
0.5
0.6
0.7
0.8
0.000 0.006 0.012 0.018 0.024 0.030 0.036
Curren density (A/cm2)
Cel
l po
ten
tial (
V)
20 ml/min 16 ml/min 14 ml/min 12 ml/min 10 ml/min 8 ml/min 3 ml/min
a)
Figure C.7 – Effect of methanol flow rate on a) cell performance. Operating conditions: methanol
concentration 0.25M and air flow rate 3.6 l/min.
0.0
0.1
0.2
0.3
0.4
0.5
0.6
0.7
0.8
0.00 0.01 0.02 0.03 0.04 0.05 0.06 0.07 0.08
Curren density (A/cm2)
Cel
l po
ten
tial (
V)
20 ml/min 16 ml/min 14 ml/min 12 ml/min 10 ml/min 8 ml/min 3 ml/min
a)
Figure C.8– Effect of methanol flow rate on a) cell performance. Operating conditions: methanol
concentration 0.75M and air flow rate 3.6 l/min.

Transport Phenomena in Direct Methanol Fuel Cells: Modelling and Experimental Studies
291
0.0
0.1
0.2
0.3
0.4
0.5
0.6
0.7
0.8
0.00 0.01 0.02 0.03 0.04 0.05 0.06
Current density (A/cm2)
Cel
l po
ten
tial (
V)
10 ml/min 8 ml/min 3 ml/min
a)
Figure C.9 – Effect of methanol flow rate on a) cell performance. Operating conditions: methanol
concentration 0.75M and air flow rate 1 l/min.
C.1.4. Air flow rate
Table C.4 – Set of operating conditions used to analyse the effect of air flow rate on the cell
performance.
OHCHC3
(M) OHCHq3
(ml/min) qair (l/min) Cell temperature (ºC)
0.25 8
3.6
20 2 1
0.75 0.5
0.75 8
3.6
20 2
1.5 1
0.75 3
3.6
20 2 1
0.75 0.5

Appendix C: Experimental results of an active feed DMFC
292
0.0
0.1
0.2
0.3
0.4
0.5
0.6
0.7
0.8
0.000 0.006 0.012 0.018 0.024 0.030 0.036
Current density (A/cm2)
Cel
l po
ten
tial (
V)
3.6 l/min 2 l/min 1 l/min 0.75 l/min 0.5 l/min
a)
Figure C.10 – Effect of air flow rate on a) cell performance. Operating conditions: methanol
concentration 0.25M and methanol flow rate 8 ml/min.
0.0
0.1
0.2
0.3
0.4
0.5
0.6
0.7
0.8
0.00 0.01 0.02 0.03 0.04 0.05 0.06
Current density (A/cm2)
Cel
l po
ten
tial (
V)
3.6 l/min 2 l/min 1.5 l/min 1 l/min
a)
Figure C.11 – Effect of air flow rate on a) cell performance. Operating conditions: methanol
concentration 0.75M and methanol flow rate 8 ml/min.
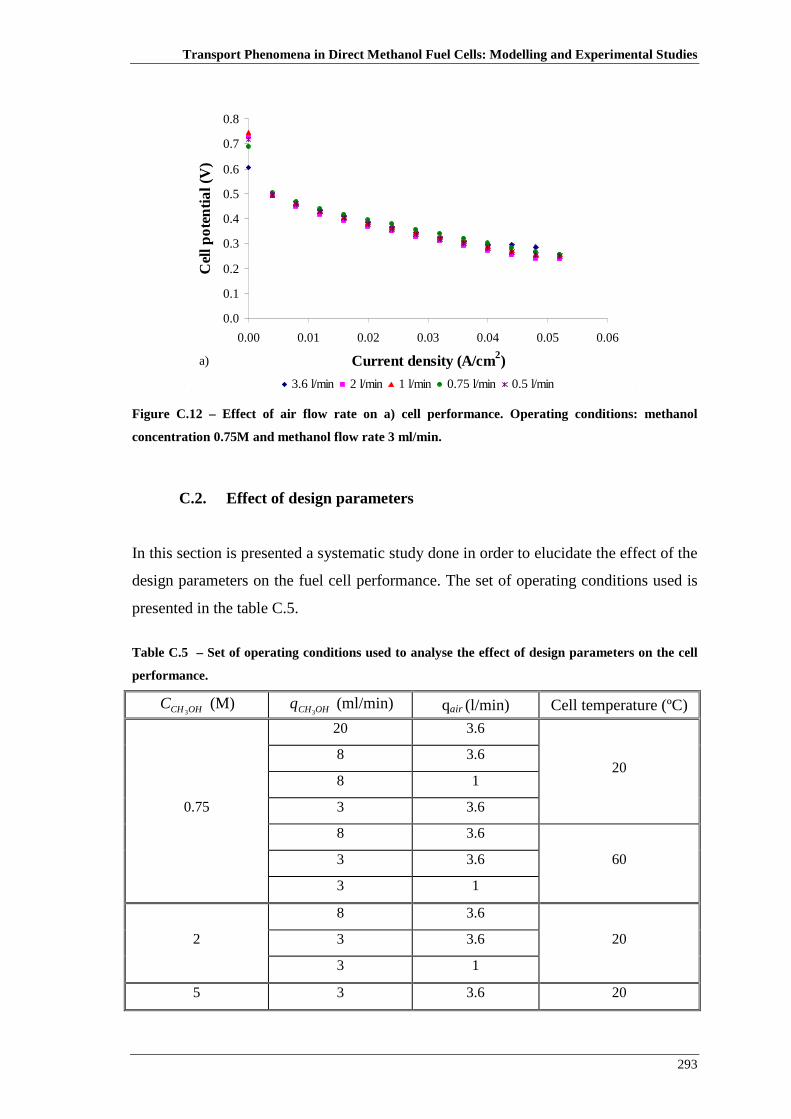
Transport Phenomena in Direct Methanol Fuel Cells: Modelling and Experimental Studies
293
0.0
0.1
0.2
0.3
0.4
0.5
0.6
0.7
0.8
0.00 0.01 0.02 0.03 0.04 0.05 0.06
Current density (A/cm2)
Cel
l po
ten
tial (
V)
3.6 l/min 2 l/min 1 l/min 0.75 l/min 0.5 l/min
a)
Figure C.12 – Effect of air flow rate on a) cell performance. Operating conditions: methanol
concentration 0.75M and methanol flow rate 3 ml/min.
C.2. Effect of design parameters
In this section is presented a systematic study done in order to elucidate the effect of the
design parameters on the fuel cell performance. The set of operating conditions used is
presented in the table C.5.
Table C.5 – Set of operating conditions used to analyse the effect of design parameters on the cell
performance.
OHCHC3
(M) OHCHq3
(ml/min) qair (l/min) Cell temperature (ºC)
0.75
20 3.6
20
8 3.6
8 1
3 3.6
8 3.6
60
3 3.6
3 1
2
8 3.6
20 3 3.6
3 1
5 3 3.6 20

Appendix C: Experimental results of an active feed DMFC
294
C.2.1. Anode diffusion layer material
Table C.6 – Set of design parameters used to analyse the effect of the diffusion layer material on
the cell performance.
Diffusion layer Anode Carbon cloth or carbon paper
Cathode ELAT
Catalyst loading Anode 4 mg/cm2 Pt/Ru
Cathode 4 mg/cm2 Pt
Flow field design Anode Serpentine
Cathode Serpentine
Membrane Nafion 117 or 212
0.0
0.1
0.2
0.3
0.4
0.5
0.6
0.7
0.8
0.9
0.00 0.01 0.02 0.03 0.04 0.05 0.06 0.07 0.08
Current density (A/cm2)
Cel
l po
ten
tial (
V)
20 ml/min; CP 20 ml/min; CC 8 ml/min; CP8 ml/min; CC 3 ml/min; CP 3 ml/min; CC
a)
Figure C.13– Effect of anode diffusion layer material on a) cell performance. Operating conditions:
methanol concentration 0.75M, air flow rate 3.6 l/min and cell temperature 20ºC. Design
parameters: Nafion117.

Transport Phenomena in Direct Methanol Fuel Cells: Modelling and Experimental Studies
295
0.0
0.1
0.2
0.3
0.4
0.5
0.6
0.7
0.8
0.00 0.01 0.02 0.03 0.04 0.05 0.06 0.07
Current density (A/cm2)
Cel
l po
ten
tial (
V)
3.6 l/min; CP 3.6 l/min; CC 1 l/min; CP 1 l/min; CC
a)
Figure C.14 – Effect of anode diffusion layer material on a) cell performance. Operating conditions:
methanol concentration 0.75M, methanol flow rate 8 ml/min and cell temperature 20ºC. Design
parameters: Nafion117.
0.0
0.1
0.2
0.3
0.4
0.5
0.6
0.7
0.8
0.9
0.00 0.01 0.02 0.03 0.04 0.05 0.06 0.07 0.08
Current density (A/cm2)
Cel
l po
ten
tial (
V)
0.75 M; CP 0.75 M; CC 2 M; CP 2 M; CC 5 M; CP 5 M; CC
a)
Figure C.15 – Effect of anode diffusion layer material on a) cell performance. Operating conditions:
methanol flow rate 3 ml/min, air flow rate 3.6 l/min and cell temperature 20ºC. Design parameters:
Nafion117.
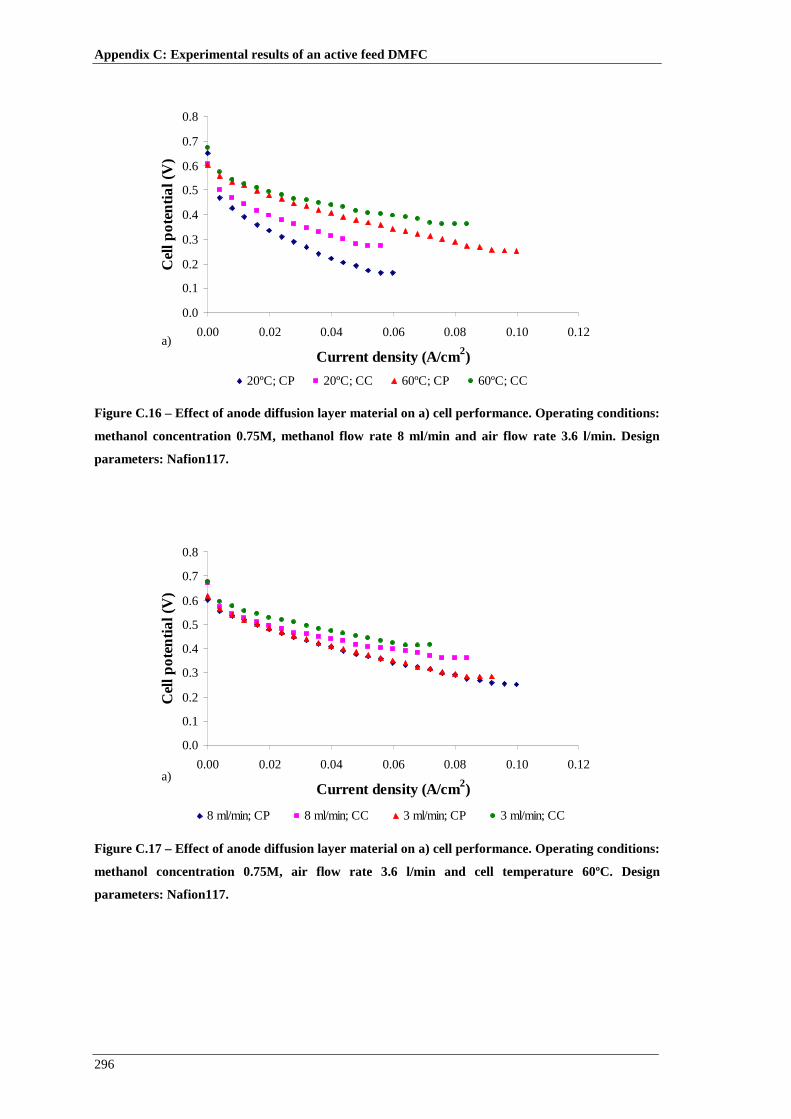
Appendix C: Experimental results of an active feed DMFC
296
0.0
0.1
0.2
0.3
0.4
0.5
0.6
0.7
0.8
0.00 0.02 0.04 0.06 0.08 0.10 0.12
Current density (A/cm2)
Cel
l po
ten
tial (
V)
20ºC; CP 20ºC; CC 60ºC; CP 60ºC; CC
a)
Figure C.16 – Effect of anode diffusion layer material on a) cell performance. Operating conditions:
methanol concentration 0.75M, methanol flow rate 8 ml/min and air flow rate 3.6 l/min. Design
parameters: Nafion117.
0.0
0.1
0.2
0.3
0.4
0.5
0.6
0.7
0.8
0.00 0.02 0.04 0.06 0.08 0.10 0.12
Current density (A/cm2)
Cel
l po
ten
tial (
V)
8 ml/min; CP 8 ml/min; CC 3 ml/min; CP 3 ml/min; CC
a)
Figure C.17 – Effect of anode diffusion layer material on a) cell performance. Operating conditions:
methanol concentration 0.75M, air flow rate 3.6 l/min and cell temperature 60ºC. Design
parameters: Nafion117.
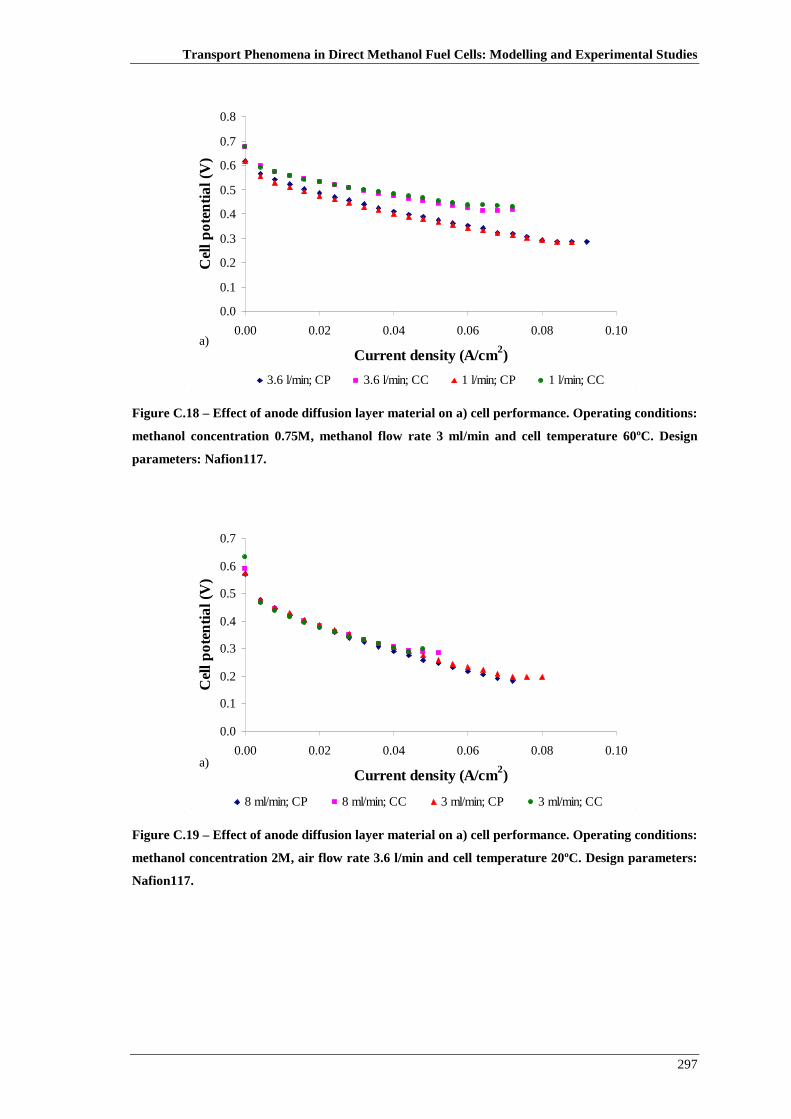
Transport Phenomena in Direct Methanol Fuel Cells: Modelling and Experimental Studies
297
0.0
0.1
0.2
0.3
0.4
0.5
0.6
0.7
0.8
0.00 0.02 0.04 0.06 0.08 0.10
Current density (A/cm2)
Cel
l po
ten
tial (
V)
3.6 l/min; CP 3.6 l/min; CC 1 l/min; CP 1 l/min; CC
a)
Figure C.18 – Effect of anode diffusion layer material on a) cell performance. Operating conditions:
methanol concentration 0.75M, methanol flow rate 3 ml/min and cell temperature 60ºC. Design
parameters: Nafion117.
0.0
0.1
0.2
0.3
0.4
0.5
0.6
0.7
0.00 0.02 0.04 0.06 0.08 0.10
Current density (A/cm2)
Cel
l po
ten
tial (
V)
8 ml/min; CP 8 ml/min; CC 3 ml/min; CP 3 ml/min; CC
a)
Figure C.19 – Effect of anode diffusion layer material on a) cell performance. Operating conditions:
methanol concentration 2M, air flow rate 3.6 l/min and cell temperature 20ºC. Design parameters:
Nafion117.

Appendix C: Experimental results of an active feed DMFC
298
0.0
0.1
0.2
0.3
0.4
0.5
0.6
0.7
0.00 0.02 0.04 0.06 0.08 0.10
Current density (A/cm2)
Cel
l po
ten
tial (
V)
3.6 l/min; CP 3.6 l/min; CC 1 l/min; CP 1 l/min; CC
a)
Figure C.20 – Effect of anode diffusion layer material on a) cell performance. Operating conditions:
methanol concentration 2M, methanol flow rate 3 ml/min and cell temperature 20ºC. Design
parameters: Nafion117.
0.0
0.1
0.2
0.3
0.4
0.5
0.6
0.00 0.01 0.02 0.03 0.04 0.05 0.06 0.07 0.08
Current density (A/cm2)
Cel
l po
ten
tial (
V)
20 ml/min; CP 20 ml/min; CC 8 ml/min; CP8 ml/min; CC 3 ml/min; CP 3 ml/min; CC
a)
Figure C.21 – Effect of anode diffusion layer material on a) cell performance. Operating conditions:
methanol concentration 0.75M, air flow rate 3.6 l/min and cell temperature 20ºC. Design
parameters: Nafion212.
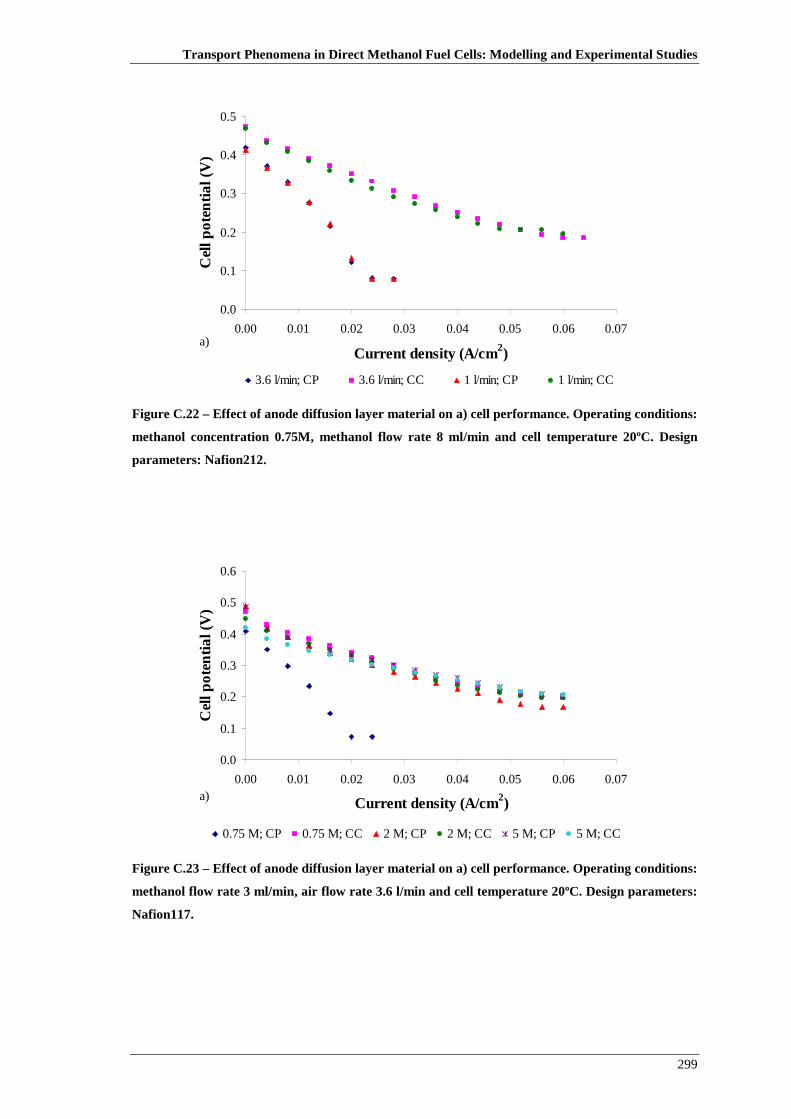
Transport Phenomena in Direct Methanol Fuel Cells: Modelling and Experimental Studies
299
0.0
0.1
0.2
0.3
0.4
0.5
0.00 0.01 0.02 0.03 0.04 0.05 0.06 0.07
Current density (A/cm2)
Cel
l po
ten
tial (
V)
3.6 l/min; CP 3.6 l/min; CC 1 l/min; CP 1 l/min; CC
a)
Figure C.22 – Effect of anode diffusion layer material on a) cell performance. Operating conditions:
methanol concentration 0.75M, methanol flow rate 8 ml/min and cell temperature 20ºC. Design
parameters: Nafion212.
0.0
0.1
0.2
0.3
0.4
0.5
0.6
0.00 0.01 0.02 0.03 0.04 0.05 0.06 0.07
Current density (A/cm2)
Cel
l po
ten
tial (
V)
0.75 M; CP 0.75 M; CC 2 M; CP 2 M; CC 5 M; CP 5 M; CC
a)
Figure C.23 – Effect of anode diffusion layer material on a) cell performance. Operating conditions:
methanol flow rate 3 ml/min, air flow rate 3.6 l/min and cell temperature 20ºC. Design parameters:
Nafion117.

Appendix C: Experimental results of an active feed DMFC
300
0.0
0.1
0.2
0.3
0.4
0.5
0.6
0.7
0.00 0.02 0.04 0.06 0.08 0.10 0.12
Current density (A/cm2)
Cel
l po
ten
tial (
V)
20ºC; CP 20ºC; CC 60ºC; CP 60ºC; CC
a)
Figure C.24 – Effect of anode diffusion layer material on a) cell performance. Operating conditions:
methanol concentration 0.75M, methanol flow rate 8 ml/min and air flow rate 3.6 l/min. Design
parameters: Nafion212.
0.0
0.1
0.2
0.3
0.4
0.5
0.6
0.7
0.00 0.02 0.04 0.06 0.08 0.10 0.12
Current density (A/cm2)
Cel
l po
ten
tial (
V)
8 ml/min; CP 8 ml/min; CC 3 ml/min; CP 3 ml/min; CC
a)
Figure C.25 – Effect of anode diffusion layer material on a) cell performance. Operating conditions:
methanol concentration 0.75M, air flow rate 3.6 l/min and cell temperature 60ºC. Design
parameters: Nafion212.

Transport Phenomena in Direct Methanol Fuel Cells: Modelling and Experimental Studies
301
0.0
0.1
0.2
0.3
0.4
0.5
0.6
0.7
0.00 0.02 0.04 0.06 0.08 0.10 0.12
Current density (A/cm2)
Cel
l po
ten
tial (
V)
3.6 l/min; CP 3.6 l/min; CC 1 l/min; CP 1 l/min; CC
a)
Figure C.26– Effect of anode diffusion layer material on a) cell performance. Operating conditions:
methanol concentration 0.75M, methanol flow rate 3 ml/min and cell temperature 60ºC. Design
parameters: Nafion212.
0.0
0.1
0.2
0.3
0.4
0.5
0.6
0.00 0.01 0.02 0.03 0.04 0.05 0.06 0.07
Current density (A/cm2)
Cel
l po
ten
tial (
V)
8 ml/min; CP 8 ml/min; CC 3 ml/min; CP 3 ml/min; CC
a)
Figure C.27 – Effect of anode diffusion layer material on a) cell performance. Operating conditions:
methanol concentration 2M, air flow rate 3.6 l/min and cell temperature 20ºC. Design parameters:
Nafion212.

Appendix C: Experimental results of an active feed DMFC
302
0.0
0.1
0.2
0.3
0.4
0.5
0.6
0.00 0.01 0.02 0.03 0.04 0.05 0.06 0.07
Current density (A/cm2)
Cel
l po
ten
tial (
V)
3.6 l/min; CP 3.6 l/min; CC 1 l/min; CP 1 l/min; CC
a)
Figure C.28 – Effect of anode diffusion layer material on a) cell performance. Operating conditions:
methanol concentration 2M, methanol flow rate 3 ml/min and cell temperature 20ºC. Design
parameters: Nafion212.
C.2.2. Cathode diffusion layer material
Table C.7 – Set of design parameters used to analyse the effect of the diffusion layer material on the
cell performance.
Diffusion layer Anode Carbon cloth
Cathode ELAT, carbon cloth or carbon paper
Catalyst loading Anode 4 mg/cm2 Pt/Ru
Cathode 4 mg/cm2 Pt
Flow field design Anode Serpentine
Cathode Serpentine
Membrane Nafion 117 or 212

Transport Phenomena in Direct Methanol Fuel Cells: Modelling and Experimental Studies
303
0.0
0.1
0.2
0.3
0.4
0.5
0.6
0.7
0.8
0.00 0.01 0.02 0.03 0.04 0.05 0.06 0.07 0.08
Current density (A/cm2)
Cel
l po
ten
tial (
V)
20 ml/min; CC 20 ml/min; CP 20 ml/min; ELAT8 ml/min; CC 8 ml/min; CP 8 ml/min; ELAT3 ml/min; CC 3 ml/min; CP 3 ml/min; ELAT
a)
Figure C.29 – Effect of cathode diffusion layer material on a) cell performance. Operating
conditions: methanol concentration 0.75M, air flow rate 3.6 l/min and cell temperature 20ºC.
Design parameters: Nafion117.
0.0
0.1
0.2
0.3
0.4
0.5
0.6
0.7
0.8
0.00 0.01 0.02 0.03 0.04 0.05 0.06 0.07 0.08
Current density (A/cm2)
Cel
l po
ten
tial (
V)
3.6 l/min; CC 3.6 l/min; CP 3.6 l/min; ELAT1 l/min; CC 1 l/min; CP 1 l/min; ELAT
a)
Figure C.30 – Effect of cathode diffusion layer material on a) cell performance. Operating
conditions: methanol concentration 0.75M, methanol flow rate 8 ml/min and cell temperature 20ºC.
Design parameters: Nafion117.

Appendix C: Experimental results of an active feed DMFC
304
0.0
0.1
0.2
0.3
0.4
0.5
0.6
0.7
0.00 0.01 0.02 0.03 0.04 0.05 0.06 0.07 0.08
Current density (A/cm2)
Cel
l po
ten
tial (
V)
0.75 M; CC 0.75 M; CP 0.75 M; ELAT2 M; CC 2M; CP 2 M; ELAT5 M; CC 5 M; CP 5 M; ELAT
a)
Figure C.31 – Effect of cathode diffusion layer material on a) cell performance. Operating
conditions: air flow rate 3.6 l/min, methanol flow rate 3 ml/min and cell temperature 20ºC. Design
parameters: Nafion117.
0.0
0.1
0.2
0.3
0.4
0.5
0.6
0.7
0.8
0.00 0.02 0.04 0.06 0.08 0.10 0.12 0.14
Current density (A/cm2)
Cel
l po
ten
tial (
V)
20ºC; CC 20ºC; CP 20ºC; ELAT60ºC; CC 60ºC; CP 60ºC; ELAT
a)
Figure C.32– Effect of cathode diffusion layer material on a) cell performance. Operating
conditions: methanol concentration 0.75M, methanol flow rate 8 ml/min and air flow rate 3.6 l/min.
Design parameters: Nafion117.

Transport Phenomena in Direct Methanol Fuel Cells: Modelling and Experimental Studies
305
0.0
0.1
0.2
0.3
0.4
0.5
0.6
0.7
0.8
0.00 0.02 0.04 0.06 0.08 0.10 0.12 0.14
Current density (A/cm2)
Cel
l po
ten
tial (
V)
8 ml/min; CC 8 ml/min; CP 8 ml/min; ELAT3 ml/min; CC 3 ml/min; CP 3 ml/min; ELAT
a)
Figure C.33 – Effect of cathode diffusion layer material on a) cell performance. Operating
conditions: methanol concentration 0.75M, air flow rate 3.6 l/min and cell temperature 60ºC.
Design parameters: Nafion117.
0.0
0.1
0.2
0.3
0.4
0.5
0.6
0.7
0.8
0.00 0.02 0.04 0.06 0.08 0.10 0.12 0.14
Current density (A/cm2)
Cel
l po
ten
tial (
V)
3.6 l/min; CC 3.6 l/min; CP 3.6 l/min; ELAT1 l/min; CC 1 l/min; CP 1 l/min; ELAT
a)
Figure C.34 – Effect of cathode diffusion layer material on a) cell performance. Operating
conditions: methanol concentration 0.75M, methanol flow rate 3 ml/min and cell temperature 60ºC.
Design parameters: Nafion117.

Appendix C: Experimental results of an active feed DMFC
306
0.0
0.1
0.2
0.3
0.4
0.5
0.6
0.7
0.00 0.02 0.04 0.06 0.08 0.10
Current density (A/cm2)
Cel
l po
ten
tial (
V)
8 ml/min; CC 8 ml/min; CP 8 ml/min; ELAT3 ml/min; CC 3 ml/min; CP 3 ml/min; ELAT
a)
Figure C.35 – Effect of cathode diffusion layer material on a) cell performance. Operating
conditions: methanol concentration 2M, air flow rate 3.6 l/min and cell temperature 20ºC. Design
parameters: Nafion117.
0.0
0.1
0.2
0.3
0.4
0.5
0.6
0.7
0.00 0.01 0.02 0.03 0.04 0.05 0.06 0.07 0.08
Current density (A/cm2)
Cel
l po
ten
tial (
V)
3.6 l/min; CC 3.6 l/min; CP 3.6 l/min; ELAT1 l/min; CC 1 l/min; CP 1 l/min; ELAT
a)
Figure C.36 – Effect of cathode diffusion layer material on a) cell performance. Operating
conditions: methanol concentration 2M, methanol flow rate 3 ml/min and cell temperature 20ºC.
Design parameters: Nafion117.

Transport Phenomena in Direct Methanol Fuel Cells: Modelling and Experimental Studies
307
0.0
0.1
0.2
0.3
0.4
0.5
0.6
0.00 0.01 0.02 0.03 0.04 0.05 0.06 0.07 0.08
Current density (A/cm2)
Cel
l po
ten
tial (
V)
20 ml/min; CC 20 ml/min; CP 20 ml/min; ELAT8 ml/min; CC 8 ml/min; CP 8 ml/min; ELAT3 ml/min; CC 3 ml/min; CP 3 ml/min; ELAT
a)
Figure C.37 – Effect of cathode diffusion layer material on a) cell performance. Operating
conditions: methanol concentration 0.75M, air flow rate 3.6 l/min and cell temperature 20ºC.
Design parameters: Nafion212.
0.0
0.1
0.2
0.3
0.4
0.5
0.6
0.00 0.01 0.02 0.03 0.04 0.05 0.06 0.07
Current density (A/cm2)
Cel
l po
ten
tial (
V)
3.6 l/min; CC 3.6 l/min; CP 3.6 l/min; ELAT1 l/min; CC 1 l/min; CP 1 l/min; ELAT
a)
Figure C.38 – Effect of cathode diffusion layer material on a) cell performance. Operating
conditions: methanol concentration 0.75M, methanol flow rate 8 ml/min and cell temperature 20ºC.
Design parameters: Nafion212.

Appendix C: Experimental results of an active feed DMFC
308
0.0
0.1
0.2
0.3
0.4
0.5
0.6
0.00 0.01 0.02 0.03 0.04 0.05 0.06 0.07
Current density (A/cm2)
Cel
l po
ten
tial (
V)
0.75 M; CC 0.75 M; CP 0.75 M; ELAT2 M; CC 2M; CP 2 M; ELAT5 M; CC 5 M; CP 5 M; ELAT
a)
Figure C.39– Effect of cathode diffusion layer material on a) cell performance. Operating
conditions: air flow rate 3.6 l/min, methanol flow rate 3 ml/min and cell temperature 20ºC. Design
parameters: Nafion212.
0.0
0.1
0.2
0.3
0.4
0.5
0.6
0.7
0.00 0.02 0.04 0.06 0.08 0.10 0.12
Current density (A/cm2)
Cel
l po
ten
tial (
V)
20ºC; CC 20ºC; CP 20ºC; ELAT60ºC; CC 60ºC; CP 60ºC; ELAT
a)
Figure C.40 – Effect of cathode diffusion layer material on a) cell performance and b) power.
Operating conditions: methanol concentration 0.75M, methanol flow rate 8 ml/min and air flow
rate 3.6 l/min. Design parameters: Nafion212.

Transport Phenomena in Direct Methanol Fuel Cells: Modelling and Experimental Studies
309
0.0
0.1
0.2
0.3
0.4
0.5
0.6
0.7
0.00 0.02 0.04 0.06 0.08 0.10 0.12
Current density (A/cm2)
Cel
l po
ten
tial (
V)
8 ml/min; CC 8 ml/min; CP 8 ml/min; ELAT3 ml/min; CC 3 ml/min; CP 3 ml/min; ELAT
a)
Figure C.41 – Effect of cathode diffusion layer material on a) cell performance and b) power.
Operating conditions: methanol concentration 0.75M, air flow rate 3.6 l/min and cell temperature
60ºC. Design parameters: Nafion212.
0.0
0.1
0.2
0.3
0.4
0.5
0.6
0.7
0.00 0.02 0.04 0.06 0.08 0.10 0.12
Current density (A/cm2)
Cel
l po
ten
tial (
V)
3.6 l/min; CC 3.6 l/min; CP 3.6 l/min; ELAT1 l/min; CC 1 l/min; CP 1 l/min; ELAT
a)
Figure C.42 – Effect of cathode diffusion layer material on a) cell performance and b) power.
Operating conditions: methanol concentration 0.75M, methanol flow rate 3 ml/min and cell
temperature 60ºC. Design parameters: Nafion212.

Appendix C: Experimental results of an active feed DMFC
310
0.0
0.1
0.2
0.3
0.4
0.5
0.6
0.00 0.01 0.02 0.03 0.04 0.05 0.06 0.07
Current density (A/cm2)
Cel
l po
ten
tial (
V)
8 ml/min; CC 8 ml/min; CP 8 ml/min; ELAT3 ml/min; CC 3 ml/min; CP 3 ml/min; ELAT
a)
Figure C.43 – Effect of cathode diffusion layer material on a) cell performance and b) power.
Operating conditions: methanol concentration 2M, air flow rate 3.6 l/min and cell temperature
20ºC. Design parameters: Nafion212.
0.0
0.1
0.2
0.3
0.4
0.5
0.6
0.00 0.01 0.02 0.03 0.04 0.05 0.06 0.07
Current density (A/cm2)
Cel
l po
ten
tial (
V)
3.6 l/min; CC 3.6 l/min; CP 3.6 l/min; ELAT1 l/min; CC 1 l/min; CP 1 l/min; ELAT
a)
Figure C.44– Effect of cathode diffusion layer material on a) cell performance and b) power.
Operating conditions: methanol concentration 2M, methanol flow rate 3 ml/min and cell
temperature 20ºC. Design parameters: Nafion212.

Transport Phenomena in Direct Methanol Fuel Cells: Modelling and Experimental Studies
311
C.2.3. Effect of membrane thickness
Table C.8 – Set of design parameters used to analyse the effect of the membrane thickness on the
cell performance.
Diffusion layer Anode Carbon cloth type A
Cathode Carbon cloth type A
Catalyst loading Anode 4 mg/cm2 Pt/Ru
Cathode 4 mg/cm2 Pt
Flow field design Anode Serpentine
Cathode Serpentine
Membrane Nafion 117, 115 or 212
0.0
0.1
0.2
0.3
0.4
0.5
0.6
0.7
0.8
0.00 0.01 0.02 0.03 0.04 0.05 0.06 0.07 0.08
Current density (A/cm2)
Cel
l po
ten
tial (
V)
20 ml/min; Nafion 117 20 ml/min; Nafion 115 20 ml/min; Nafion 2128 ml/min; Nafion 117 8 ml/min; Nafion 115 8 ml/min; Nafion 2123 ml/min; Nafion 117 3 ml/min; Nafion 115 3 ml/min; Nafion 212
a)
Figure C.45 – Effect of membrane thickness on a) cell performance and b) power. Operating
conditions: methanol concentration 0.75M, air flow rate 3.6 l/min and cell temperature 20ºC.

Appendix C: Experimental results of an active feed DMFC
312
0.0
0.1
0.2
0.3
0.4
0.5
0.6
0.7
0.8
0.00 0.01 0.02 0.03 0.04 0.05 0.06 0.07 0.08
Current density (A/cm2)
Cel
l po
ten
tial (
V)
3.6 l/min; Nafion 117 3.6 l/min; Nafion 115 3.6 l/min; Nafion 2121 l/min; Nafion 117 1 l/min; Nafion 115 1 l/min; Nafion 212
a)
Figure C.46 – Effect of membrane thickness on a) cell performance and b) power. Operating
conditions: methanol concentration 0.75M, methanol flow rate 8 ml/min and cell temperature 20ºC.
0.0
0.1
0.2
0.3
0.4
0.5
0.6
0.7
0.8
0.00 0.01 0.02 0.03 0.04 0.05 0.06 0.07 0.08
Current density (A/cm2)
Cel
l po
ten
tial (
V)
0.75 M; Nafion 117 0.75 M; Nafion 115 0.75 M; Nafion 2122 M; Nafion 117 2M; Nafion 115 2 M; Nafion 2125 M; Nafion 117 5 M; Nafion 115 5 M; Nafion 212
a)
Figure C.47 – Effect of membrane thickness on a) cell performance and b) power. Operating
conditions: air flow rate 3.6 l/min, methanol flow rate 3 ml/min and cell temperature 20ºC.

Transport Phenomena in Direct Methanol Fuel Cells: Modelling and Experimental Studies
313
0.0
0.1
0.2
0.3
0.4
0.5
0.6
0.7
0.8
0.00 0.02 0.04 0.06 0.08 0.10 0.12
Current density (A/cm2)
Cel
l po
ten
tial (
V)
20ºC; Nafion 117 20ºC; Nafion 115 20ºC; Nafion 21260ºC; Nafion 117 60ºC; Nafion 115 60ºC; Nafion 212
a)
Figure C.48 – Effect of membrane thickness on a) cell performance and b) power. Operating
conditions: methanol concentration 0.75M, methanol flow rate 8 ml/min and air flow rate 3.6 l/min.
0.0
0.1
0.2
0.3
0.4
0.5
0.6
0.7
0.00 0.02 0.04 0.06 0.08 0.10 0.12
Current density (A/cm2)
Cel
l po
ten
tial (
V)
8 ml/min; Nafion 117 8 ml/min; Nafion 115 8 ml/min; Nafion 2123 ml/min; Nafion 117 3 ml/min; Nafion 115 3 ml/min; Nafion 212
a)
Figure C.49 – Effect of membrane thickness on a) cell performance and b) power. Operating
conditions: methanol concentration 0.75M, air flow rate 3.6 l/min and cell temperature 60ºC.

Appendix C: Experimental results of an active feed DMFC
314
0.0
0.1
0.2
0.3
0.4
0.5
0.6
0.7
0.00 0.02 0.04 0.06 0.08 0.10 0.12
Current density (A/cm2)
Cel
l po
ten
tial (
V)
3.6 l/min; Nafion 117 3.6 l/min; Nafion 115 3.6 l/min; Nafion 2121 l/min; Nafion 117 1 l/min; Nafion 115 1 l/min; Nafion 212
a)
Figure C.50 – Effect of membrane thickness on a) cell performance and b) power. Operating
conditions: methanol concentration 0.75M, methanol flow rate 3 ml/min and cell temperature 60ºC.
0.0
0.1
0.2
0.3
0.4
0.5
0.6
0.7
0.00 0.02 0.04 0.06 0.08 0.10
Current density (A/cm2)
Cel
l po
ten
tial (
V)
8 ml/min; Nafion 117 8 ml/min; Nafion 115 8 ml/min; Nafion 2123 ml/min; Nafion 117 3 ml/min; Nafion 115 3 ml/min; Nafion 212
a)
Figure C.51– Effect of membrane thickness on a) cell performance and b) power. Operating
conditions: methanol concentration 2M, air flow rate 3.6 l/min and cell temperature 20ºC.

Transport Phenomena in Direct Methanol Fuel Cells: Modelling and Experimental Studies
315
0.0
0.1
0.2
0.3
0.4
0.5
0.6
0.7
0.00 0.01 0.02 0.03 0.04 0.05 0.06 0.07 0.08
Current density (A/cm2)
Cel
l po
ten
tial (
V)
3.6 l/min; Nafion 117 3.6 l/min; Nafion 115 3.6 l/min; Nafion 2121 l/min; Nafion 117 1 l/min; Nafion 115 1 l/min; Nafion 212
a)
Figure C.52 – Effect of membrane thickness on a) cell performance and b) power. Operating
conditions: methanol concentration 2M, methanol flow rate 3 ml/min and cell temperature 20ºC.
C.2.4. Effect of catalyst loading
Table C.9 – Set of design parameters used to analyse the effect of the catalyst loading on the cell
performance.
Diffusion layer Anode Carbon cloth type A
Cathode Carbon cloth type A
Catalyst loading Anode 4 mg/cm2 or 8 mg/cm2 Pt/Ru
Cathode 4 mg/cm2 or 8 mg/cm2 Pt
Flow field design Anode Serpentine
Cathode Serpentine
Membrane Nafion 117

Appendix C: Experimental results of an active feed DMFC
316
0.0
0.1
0.2
0.3
0.4
0.5
0.6
0.7
0.8
0.9
0.00 0.02 0.04 0.06 0.08 0.10
Current density (A/cm2)
Cel
l po
ten
tial (
V)
20 ml/min; 4 mg/cm2 20 ml/min; 8 mg/cm2 8 ml/min; 4 mg/cm2
8 ml/min; 8 mg/cm2 3 ml/min; 4 mg/cm2 3 ml/min; 8 mg/cm2
a)
mg/cm2
mg/cm2
mg/cm2
mg/cm2
mg/cm2
mg/cm2
Figure C.53 – Effect of catalyst loading on a) cell performance and b) power. Operating conditions:
methanol concentration 0.75M, air flow rate 3.6 l/min and cell temperature 20ºC.
0.0
0.1
0.2
0.3
0.4
0.5
0.6
0.7
0.8
0.9
0.00 0.01 0.02 0.03 0.04 0.05 0.06 0.07 0.08 0.09
Current density (A/cm2)
Cel
l po
ten
tial (
V)
3.6 l/min; 4 mg/cm2 3.6 l/min; 8 mg/cm2 1 l/min; 4 mg/cm2 1 l/min; 8 mg/cm2
a)
mg/cm2 mg/cm2 mg/cm2 mg/cm2
Figure C.54– Effect of catalyst loading on a) cell performance and b) power. Operating conditions:
methanol concentration 0.75M, methanol flow rate 8 ml/min and cell temperature 20ºC.

Transport Phenomena in Direct Methanol Fuel Cells: Modelling and Experimental Studies
317
0.0
0.1
0.2
0.3
0.4
0.5
0.6
0.7
0.8
0.9
0.00 0.02 0.04 0.06 0.08 0.10
Current density (A/cm2)
Cel
l po
ten
tial (
V)
0.75 M; 4 mg/cm2 0.75 M; 8 mg/cm2 2 M; 4 mg/cm2
2 M; 8 mg/cm2 5 M; 4 mg/cm2 5 M; 8 mg/cm2
a)
mg/cm2
mg/cm2 mg/cm2
mg/cm2mg/cm2
mg/cm2
Figure C.55 – Effect of catalyst loading on a) cell performance and b) power. Operating conditions:
air flow rate 3.6 l/min, methanol flow rate 3 ml/min and cell temperature 20ºC.
0.0
0.1
0.2
0.3
0.4
0.5
0.6
0.7
0.8
0.9
0.00 0.02 0.04 0.06 0.08 0.10 0.12
Current density (A/cm2)
Cel
l po
ten
tial (
V)
20ºC; 4 mg/cm2 20ºC; 8 mg/cm2 60ºC; 4 mg/cm2 60ºC; 8 mg/cm2
a)
mg/cm2 mg/cm2 mg/cm2 mg/cm2
Figure C.56– Effect of catalyst loading on a) cell performance and b) power. Operating conditions:
methanol concentration 0.75M, methanol flow rate 8 ml/min and air flow rate 3.6 l/min.
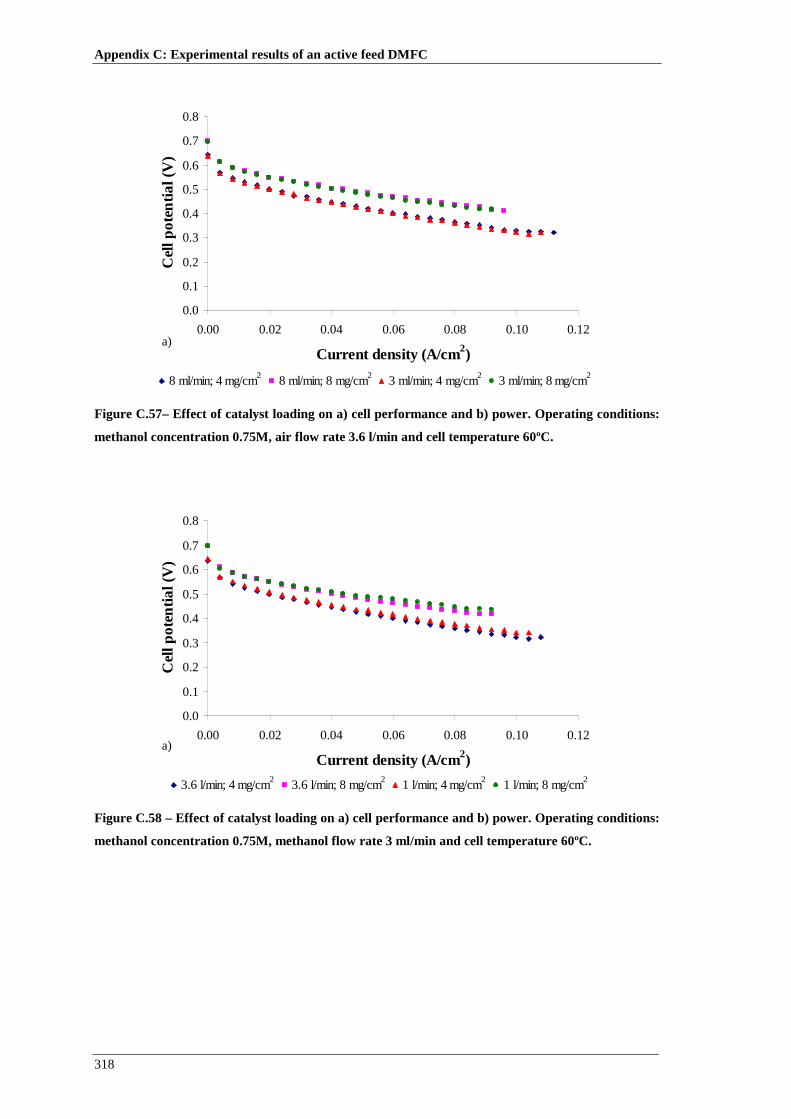
Appendix C: Experimental results of an active feed DMFC
318
0.0
0.1
0.2
0.3
0.4
0.5
0.6
0.7
0.8
0.00 0.02 0.04 0.06 0.08 0.10 0.12
Current density (A/cm2)
Cel
l po
ten
tial (
V)
8 ml/min; 4 mg/cm2 8 ml/min; 8 mg/cm2 3 ml/min; 4 mg/cm2 3 ml/min; 8 mg/cm2
a)
mg/cm2 mg/cm2 mg/cm2 mg/cm2
Figure C.57– Effect of catalyst loading on a) cell performance and b) power. Operating conditions:
methanol concentration 0.75M, air flow rate 3.6 l/min and cell temperature 60ºC.
0.0
0.1
0.2
0.3
0.4
0.5
0.6
0.7
0.8
0.00 0.02 0.04 0.06 0.08 0.10 0.12
Current density (A/cm2)
Cel
l po
ten
tial (
V)
3.6 l/min; 4 mg/cm2 3.6 l/min; 8 mg/cm2 1 l/min; 4 mg/cm2 1 l/min; 8 mg/cm2
a)
mg/cm2 mg/cm2 mg/cm2 mg/cm2
Figure C.58 – Effect of catalyst loading on a) cell performance and b) power. Operating conditions:
methanol concentration 0.75M, methanol flow rate 3 ml/min and cell temperature 60ºC.

Transport Phenomena in Direct Methanol Fuel Cells: Modelling and Experimental Studies
319
0.0
0.1
0.2
0.3
0.4
0.5
0.6
0.7
0.8
0.00 0.02 0.04 0.06 0.08 0.10
Current density (A/cm2)
Cel
l po
ten
tial (
V)
8 ml/min; 4 mg/cm2 8 ml/min; 8 mg/cm2 3 ml/min; 4 mg/cm2 3 ml/min; 8 mg/cm2
a)
mg/cm2 mg/cm2 mg/cm2 mg/cm2
Figure C.59 – Effect of catalyst loading on a) cell performance and b) power. Operating conditions:
methanol concentration 2M, air flow rate 3.6 l/min and cell temperature 20ºC.
0.0
0.1
0.2
0.3
0.4
0.5
0.6
0.7
0.8
0.00 0.02 0.04 0.06 0.08 0.10
Current density (A/cm2)
Cel
l po
ten
tial (
V)
3.6 l/min; 4 mg/cm2 3.6 l/min; 8 mg/cm2 1 l/min; 4 mg/cm2 1 l/min; 8 mg/cm2
a)
mg/cm2 mg/cm2 mg/cm2 mg/cm2
Figure C.60 – Effect of catalyst loading on a) cell performance and b) power. Operating conditions:
methanol concentration 2M, methanol flow rate 3 ml/min and cell temperature 20ºC.

Appendix C: Experimental results of an active feed DMFC
320
C.2.5. Effect of anode flow field
Table C.10 – Set of design parameters used to analyse the effect of the anode flow field on the cell
performance.
Diffusion layer Anode Carbon cloth type A
Cathode Carbon cloth type A
Catalyst loading Anode 4 mg/cm2 Pt/Ru
Cathode 4 mg/cm2 Pt
Flow field design Anode Serpentine, multi-serpentine or mixed
Cathode Serpentine
Membrane Nafion 117
0.0
0.1
0.2
0.3
0.4
0.5
0.6
0.7
0.8
0.00 0.02 0.04 0.06 0.08 0.10
Current density (A/cm2)
Cel
l po
ten
tial (
V)
20 ml/min; SFF 20 ml/min; MSFF 20 ml/min; MFF8 ml/min; SFF 8 ml/min; MSFF 8 ml/min; MFF3 ml/min; SFF 3 ml/min; MSFF 3 ml/min; MFF
a)
Figure C.61 – Effect of anode flow field design on a) cell performance and b) power. Operating
conditions: methanol concentration 0.75M, air flow rate 3.6 l/min and cell temperature 20ºC.

Transport Phenomena in Direct Methanol Fuel Cells: Modelling and Experimental Studies
321
0.0
0.1
0.2
0.3
0.4
0.5
0.6
0.7
0.8
0.00 0.02 0.04 0.06 0.08 0.10
Current density (A/cm2)
Cel
l po
ten
tial (
V)
3.6 l/min; SFF 3.6 l/min; MSFF 3.6 l/min; MFF1 l/min; SFF 1 l/min; MSFF 1 l/min; MFF
a)
Figure C.62 – Effect of anode flow field design on a) cell performance and b) power. Operating
conditions: methanol concentration 0.75M, methanol flow rate 8 ml/min and cell temperature 20ºC.
0.0
0.1
0.2
0.3
0.4
0.5
0.6
0.7
0.8
0.00 0.01 0.02 0.03 0.04 0.05 0.06 0.07 0.08
Current density (A/cm2)
Cel
l po
ten
tial (
V)
0.75 M; SFF 0.75 M; MSFF 0.75 M; MFF2 M; SFF 2M; MSFF 2 M; MFF5 M; SFF 5 M; MSFF 5 M; MFF
a)
Figure C.63 – Effect of anode flow field design on a) cell performance and b) power. Operating
conditions: air flow rate 3.6 l/min, methanol flow rate 3 ml/min and cell temperature 20ºC.

Appendix C: Experimental results of an active feed DMFC
322
0.0
0.1
0.2
0.3
0.4
0.5
0.6
0.7
0.8
0.00 0.02 0.04 0.06 0.08 0.10 0.12
Current density (A/cm2)
Cel
l po
ten
tial (
V)
20ºC; SFF 20ºC; MSFF 20ºC; MFF60ºC; SFF 60ºC; MSFF 60ºC; MFF
a)
Figure C.64 – Effect of anode flow field design on a) cell performance and b) power. Operating
conditions: methanol concentration 0.75M, methanol flow rate 8 ml/min and air flow rate 3.6 l/min.
0.0
0.1
0.2
0.3
0.4
0.5
0.6
0.7
0.00 0.02 0.04 0.06 0.08 0.10 0.12
Current density (A/cm2)
Cel
l po
ten
tial (
V)
8 ml/min; SFF 8 ml/min; MSFF 8 ml/min; MFF3 ml/min; SFF 3 ml/min; MSFF 3 ml/min; MFF
a)
Figure C.65 – Effect of anode flow field design on a) cell performance and b) power. Operating
conditions: methanol concentration 0.75M, air flow rate 3.6 l/min and cell temperature 60ºC.
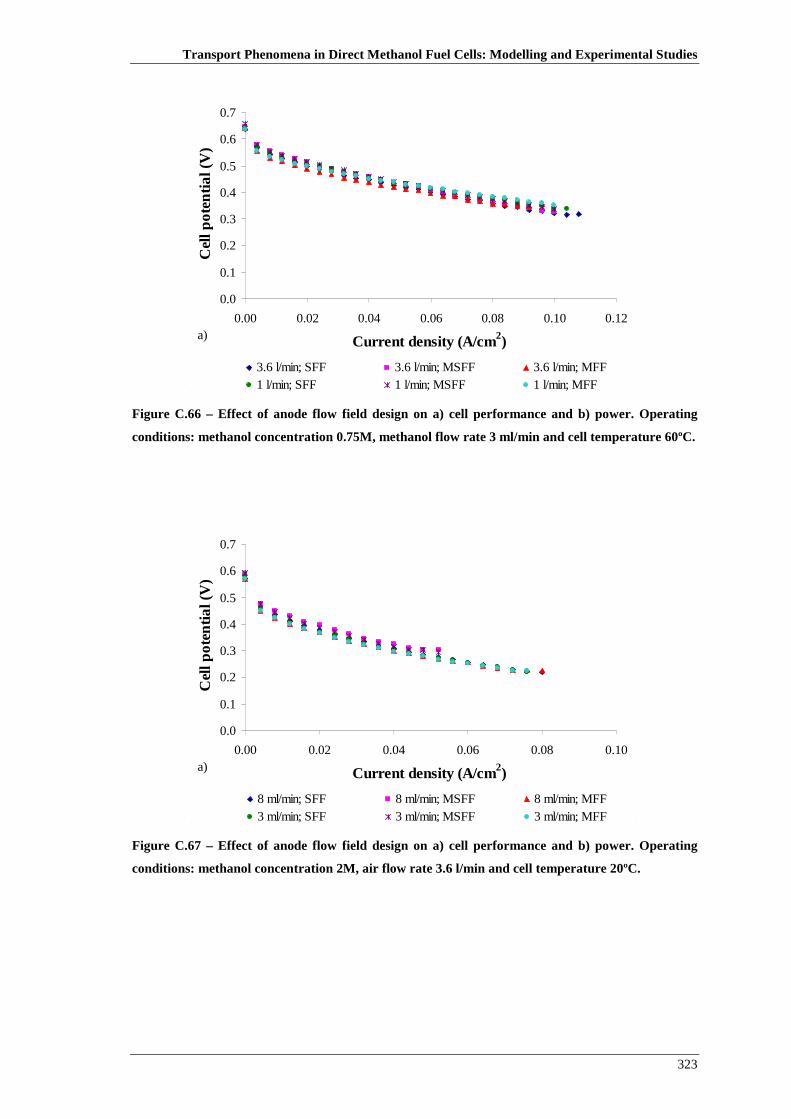
Transport Phenomena in Direct Methanol Fuel Cells: Modelling and Experimental Studies
323
0.0
0.1
0.2
0.3
0.4
0.5
0.6
0.7
0.00 0.02 0.04 0.06 0.08 0.10 0.12
Current density (A/cm2)
Cel
l po
ten
tial (
V)
3.6 l/min; SFF 3.6 l/min; MSFF 3.6 l/min; MFF1 l/min; SFF 1 l/min; MSFF 1 l/min; MFF
a)
Figure C.66 – Effect of anode flow field design on a) cell performance and b) power. Operating
conditions: methanol concentration 0.75M, methanol flow rate 3 ml/min and cell temperature 60ºC.
0.0
0.1
0.2
0.3
0.4
0.5
0.6
0.7
0.00 0.02 0.04 0.06 0.08 0.10
Current density (A/cm2)
Cel
l po
ten
tial (
V)
8 ml/min; SFF 8 ml/min; MSFF 8 ml/min; MFF3 ml/min; SFF 3 ml/min; MSFF 3 ml/min; MFF
a)
Figure C.67 – Effect of anode flow field design on a) cell performance and b) power. Operating
conditions: methanol concentration 2M, air flow rate 3.6 l/min and cell temperature 20ºC.

Appendix C: Experimental results of an active feed DMFC
324
0.0
0.1
0.2
0.3
0.4
0.5
0.6
0.7
0.00 0.02 0.04 0.06 0.08 0.10
Current density (A/cm2)
Cel
l po
ten
tial (
V)
3.6 l/min; SFF 3.6 l/min; MSFF 3.6 l/min; MFF1 l/min; SFF 1 l/min; MSFF 1 l/min; MFF
a)
Figure C.68 – Effect of anode flow field design on a) cell performance and b) power. Operating
conditions: methanol concentration 2M, methanol flow rate 3 ml/min and cell temperature 20ºC.
C.2.6. Effect of cathode flow field
Table C.11 – Set of design parameters used to analyse the effect of the cathode flow field on the cell
performance.
Diffusion layer Anode Carbon cloth type A
Cathode Carbon cloth type A
Catalyst loading Anode 4 mg/cm2 Pt/Ru
Cathode 4 mg/cm2 Pt
Flow field design Anode Serpentine
Cathode Serpentine, multi-serpentine or mixed
Membrane Nafion 117

Transport Phenomena in Direct Methanol Fuel Cells: Modelling and Experimental Studies
325
0.0
0.1
0.2
0.3
0.4
0.5
0.6
0.7
0.8
0.00 0.01 0.02 0.03 0.04 0.05 0.06 0.07 0.08
Current density (A/cm2)
Cel
l po
ten
tial (
V)
20 ml/min; SFF 20 ml/min; MSFF 20 ml/min; MFF8 ml/min; SFF 8 ml/min; MSFF 8 ml/min; MFF3 ml/min; SFF 3 ml/min; MSFF 3 ml/min; MFF
a)
Figure C.69 – Effect of cathode flow field design on a) cell performance and b) power. Operating
conditions: methanol concentration 0.75M, air flow rate 3.6 l/min and cell temperature 20ºC.
0.0
0.1
0.2
0.3
0.4
0.5
0.6
0.7
0.00 0.01 0.02 0.03 0.04 0.05 0.06 0.07 0.08
Current density (A/cm2)
Cel
l po
ten
tial (
V)
3.6 l/min; SFF 3.6 l/min; MSFF 3.6 l/min; MFF1 l/min; SFF 1 l/min; MSFF 1 l/min; MFF
a)
Figure C.70 – Effect of cathode flow field design on a) cell performance and b) power. Operating
conditions: methanol concentration 0.75M, methanol flow rate 8 ml/min and cell temperature 20ºC.

Appendix C: Experimental results of an active feed DMFC
326
0.0
0.1
0.2
0.3
0.4
0.5
0.6
0.7
0.8
0.00 0.01 0.02 0.03 0.04 0.05 0.06 0.07 0.08
Current density (A/cm2)
Cel
l po
ten
tial (
V)
0.75 M; SFF 0.75 M; MSFF 0.75 M; MFF2 M; SFF 2M; MSFF 2 M; MFF5 M; SFF 5 M; MSFF 5 M; MFF
a)
Figure C.71 – Effect of cathode flow field design on a) cell performance and b) power. Operating
conditions: air flow rate 3.6 l/min, methanol flow rate 3 ml/min and cell temperature 20ºC.
0.0
0.1
0.2
0.3
0.4
0.5
0.6
0.7
0.00 0.02 0.04 0.06 0.08 0.10 0.12
Current density (A/cm2)
Cel
l po
ten
tial (
V)
20ºC; SFF 20ºC; MSFF 20ºC; MFF60ºC; SFF 60ºC; MSFF 60ºC; MFF
a)
Figure C.72 – Effect of cathode flow field design on a) cell performance and b) power. Operating
conditions: methanol concentration 0.75M, methanol flow rate 8 ml/min and air flow rate 3.6 l/min.

Transport Phenomena in Direct Methanol Fuel Cells: Modelling and Experimental Studies
327
0.0
0.1
0.2
0.3
0.4
0.5
0.6
0.7
0.00 0.02 0.04 0.06 0.08 0.10 0.12
Current density (A/cm2)
Cel
l po
ten
tial (
V)
8 ml/min; SFF 8 ml/min; MSFF 8 ml/min; MFF3 ml/min; SFF 3 ml/min; MSFF 3 ml/min; MFF
a)
Figure C.73 – Effect of cathode flow field design on a) cell performance and b) power. Operating
conditions: methanol concentration 0.75M, air flow rate 3.6 l/min and cell temperature 60ºC.
0.0
0.1
0.2
0.3
0.4
0.5
0.6
0.7
0.00 0.02 0.04 0.06 0.08 0.10 0.12
Current density (A/cm2)
Cel
l po
ten
tial (
V)
3.6 l/min; SFF 3.6 l/min; MSFF 3.6 l/min; MFF1 l/min; SFF 1 l/min; MSFF 1 l/min; MFF
a)
Figure C.74 – Effect of cathode flow field design on a) cell performance and b) power. Operating
conditions: methanol concentration 0.75M, methanol flow rate 3 ml/min and cell temperature 60ºC

Appendix C: Experimental results of an active feed DMFC
328
0.0
0.1
0.2
0.3
0.4
0.5
0.6
0.7
0.00 0.02 0.04 0.06 0.08 0.10
Current density (A/cm2)
Cel
l po
ten
tial (
V)
8 ml/min; SFF 8 ml/min; MSFF 8 ml/min; MFF3 ml/min; SFF 3 ml/min; MSFF 3 ml/min; MFF
a)
Figure C.75 – Effect of cathode flow field design on a) cell performance and b) power. Operating
conditions: methanol concentration 2M, air flow rate 3.6 l/min and cell temperature 20ºC.
0.0
0.1
0.2
0.3
0.4
0.5
0.6
0.7
0.00 0.01 0.02 0.03 0.04 0.05 0.06 0.07 0.08
Current density (A/cm2)
Cel
l po
ten
tial (
V)
3.6 l/min; SFF 3.6 l/min; MSFF 3.6 l/min; MFF1 l/min; SFF 1 l/min; MSFF 1 l/min; MFF
a)
Figure C.76 – Effect of cathode flow field design on a) cell performance and b) power. Operating
conditions: methanol concentration 2M, methanol flow rate 3 ml/min and cell temperature 20ºC.