Transport infrastructure requirements report final · FINAL REPORT To Core Cities Group...
82
FINAL REPORT To Core Cities Group Understanding the transport infrastructure requirements to deliver growth in England’s Core Cities July 2011 Supported by expert advisors: David Begg and Jean Dent
-
Upload
truongkhanh -
Category
Documents
-
view
220 -
download
0
Transcript of Transport infrastructure requirements report final · FINAL REPORT To Core Cities Group...

FINAL REPORT
To
Core Cities Group
Understanding the transport
infrastructure requirements to deliver
growth in England’s Core Cities
July 2011
Supported by expert advisors:
David Begg and Jean Dent

July 2011 1
Contents
1 Executive Summary ..................................................................................... 2
2 Transport, Cities and the Economy ............................................................ 12
2.1 Transport's role in the operation of the Modern Economy
2.2 The importance of cities in driving growth
2.3 Britain risks being left behind
3 High Speed Rail .......................................................................................... 24
3.1 The Government case for High Speed Rail
3.2 Other UK evidence for HSR
3.3 International evidence for HSR
3.4 Further evidence
3.5 Insights for the Core Cities
4 The ongoing need for other transport investment ..................................... 52
4.1 The importance of continuing to invest in the strategic rail network alongside high speed rail
4.2 The need to maintain and improve city region rail networks
4.3 Insights for the Core Cities
Appendix A…………………………………………………………………………………………………….61
A1 Forecasts for rail growth by city
A2 Evaluation of transport investment in the UK
A3 International case study examples of the benefits of high speed rail
A4 City specific transport priorities

July 2011 2
1 Executive Summary
Key findings of research
Success in a globalised economy relies on cities and their infrastructure - the UK lags behind its
competitors in infrastructure investment: the globalising economy is characterised by innovation
and new opportunities. The agglomeration offered by cities is one of the main reasons why they
have become a key delivery mechanism for growth. The UK ranks only 34th in the world for its
infrastructure, 6th in the G8 countries1, and only spends 1.5% of GDP on infrastructure compared to
6% in Japan and 3% in France2.
Better transport results in stronger local economies and jobs growth: History shows a compelling
link between transport and economic prosperity, and recent analysis has found that a location with
10% higher rail connectivity tends to have an employment density that is 14% higher. 400,000 jobs
in Core Cities and a total 1 million in their wider urban areas will be underpinned by HSR.
The UK’s cities drive economic growth and can help rebalance the economy- transport
infrastructure is critical to achieving this: the Core Cites urban areas already deliver 27% of national
GDP. Economic growth outside London and the South East is dependant on improved transport
capacity and infrastructure between the Core Cities and London, and between the Core Cities
themselves to create more coherent and powerful economic zones across England. There will be
wider positive regeneration and economic benefits from HS2 and a full HSR network, contributing to
reshaping and rebalancing the economy.
More rail capacity will benefit wider economic areas: the agglomeration potential of cities and
their surrounding areas requires better transport networks. Improving connectivity makes labour
markets more effective, facilitates competition, and fosters innovation. This will require better
transport links – both into the city and between cities to overcome the UK’s comparative lack of
infrastructure investment in recent decades.
The economic benefit of HSR and HS2 are likely to exceed the DfT estimates: Although DfT has
made a strong economic case for investment in HSR and HS2. Based on analysis of previous HSR
schemes this estimate of jobs created is likely to be exceeded significantly. The new services bring
Birmingham within one hour of London, and the full scheme reduces times for Manchester, Leeds,
Sheffield and Newcastle to between 73 and 80 minutes. International evidence shows that such
schemes create significant economic benefits, achieve some direct financial returns, more demand
than was forecast at the outset, and reduce demand for road and air trips.
The need for HSR is fundamentally centred on the need for additional capacity on the rail network
and better connectivity between Core Cities: the West Coast Main Line (WCML), Midland Main Line
(MML) and East Coast Main Line (ECML) are forecast to be at or approaching capacity in the 2020s
and this will require a step change in capacity. Upgrading existing lines will not provide the step
change in capacity required on the main lines and would be expensive and disruptive. Meanwhile,
creating a new classic line represents poorer value for money than a new high speed line.
A new approach is needed to assessing the economic benefits of long distance rail projects in the
UK: the real benefits of this investment for the economy are not captured by the current analytical
1 World Economic Forum’s Global Competitiveness Report
2 Association for Consultancy and Engineering, Avoiding the Infrastructure Crunch
July 2011 3
approaches used for evaluating transport projects. They do not capture the transformational and
regeneration impacts that it can have, or the additional benefits of releasing capacity on existing
lines for commuter and freight uses.
Maximising the benefits of HSR will also require investment in existing lines: this is not an ‘either
or’ investment case. Investment in city region transport networks, and strategic inter-urban rail
improvements on existing lines (including electrification) between some cities, and with London are
vital to support economic growth and the rebalancing of the UK economy. It is essential therefore
that plans for HSR are part of a wider, integrated, national strategy for rail or transport.
Plans for high speed and other transport investments need to be more closely aligned with economic
development and land use planning strategies: , Transport is only a means to an end and creating a
vibrant economy will require other policies. However, without connectivity, economic activity will
not take place.
Purpose of this report
This report has been commissioned by the Core Cities Group to undertake a review of existing
evidence on the need to invest in transport infrastructure to stimulate economic growth in these
cities. Work completed by Oxford Economics3 set out how the Core Cities could generate 1 million
additional jobs by 2020, if supported by appropriate transport infrastructure. Research by
Government has shown how the proposals for a national high speed rail network could contribute to
this growth and deliver substantial economic benefits.
Transport, Cities and the Economy
Cities are the main drivers of economic growth in the UK
Cities are by far the most important source of economic activity and growth in the UK economy.
Nearly 80% of people in the UK live in an urban area and cities, even though urban areas only
covered 9% of the UK’s land mass at the time4. The Core Cities are the main drivers of economic
growth in the UK outside of London and the South East. The Core Cities and their wider urban areas
contribute an estimated 27% of UK GDP, compared to London’s contribution of 22.5% of UK GDP.
Globalisation is driving a continued shift in our economic geography as we must renew and invest in
value added activity and decarbonise the economy. Infrastructure is key to this effort.
It is vital that the Core Cities are able to enhance their productivity and economic output to maintain
and create jobs. It is therefore important to assist them in achieving the highest levels of growth
possible and closing the gap in performance between the South East and our other economic areas.
The Core Cities want to achieve their best case scenario for growth which would create an extra
£44bn of GVA and 1 million additional jobs in the Core City Local Enterprise Partnership (LEP) areas
by 20205.
3 See Oxford Economics (2011) Rail Transport Forecasts: Core Cities and Oxford Economics (2011) Rail
Transport Forecasts: Core Cities 4 ONS The UKs Major Urban Areas
5 Oxford Economics

July 2011 4
Good transport links are essential to supporting the economic competitiveness of cities
Successful city economies require high volumes and densities of face-to-face contacts between
firms, and access to wide pools of skilled labour. Good transport links, particularly rail are essential
in supporting this agglomeration, as well as the high levels of physical accessibility nationally and
internationally needed for cities to be economically competitive.
Cities generate economic growth by creating business opportunities that require face to face contact
to create new ideas. Agglomeration (or clustering) is the process by which this density of economic
activity raises productivity. It does this by facilitating knowledge transfer and fostering innovation
between firms and other knowledge producers such as universities and high-level government
functions. Considerable research has now been conducted to back this up both in theory and
evidence. Paul Krugman, a Nobel laureate economist, has been central to this work6. This manifests
itself in high densities of employment in advanced sectors such as financial and business services,
design, science and creative industries, which also help support advanced manufacturing sectors
across city regions. Access to a wide pool of skilled labour is vital in supporting these patterns of
economic activity. Good quality and high capacity transport networks, particularly rail and rapid
transit systems, are needed to support these high densities of economic activity, and enable workers
to access main city employment locations from across a wide spatial area.
HSR will support the delivery of 400,000 jobs in the Core Cities and 1million in their wider urban
areas
Investment in a full HSR network and electrification will underpin the creation of 400,000 jobs in
Core Cities, and 1million jobs in total across their wider urban areas (specifically the geography
covered by their Local Economic Partnerships).
Oxford Economics were commissioned to provide new evidence for this report[1] (see Appendix A).
This work was based on previous economic forecasts for the Core Cities which clearly demonstrated
their capacity to deliver this jobs growth. These figures are dependant on a number of internal and
external economic factors, but one of these, critically, is investment in transport infrastructure.
To support these jobs, weekly rail volumes into the Core Cities stations (and therefore the
infrastructure required) will need to increase by around 70% over the next 20 years, supporting at
least 150,000 new arrivals per day. This represents around 80,000 additional trips per day on a High
Speed line. This is likely to be underestimated. This growth represents an increase over twenty
years of 17 per cent in employment. The relationship illustrated here suggests that as much as a
doubling of rail passenger growth overall will take place.
HSR is the best way to achieve this increase in capacity, which is required to achieve these jobs
growth forecasts.
6 Fujita, Krugman and Venables, (2001) The Spatial Economy, Cities, Regions and International Trade, MIT

July 2011 5
Employment
(000s)
Population
(000s)
GVA (£m,
2006 prices)
Birmingham 80.7 21.3 4305
Bristol 43.6 5.0 2601
Leeds 73.1 6.8 3939
Liverpool 38.9 3.2 1808
Manchester 57.9 12.0 3167
Newcastle 29.5 2.5 1482
Nottingham 32.5 5.1 1637
Sheffield 41.5 3.4 1931
Core Cities 397.8 59.2 20870 Fig 1. Employment and economic growth forecasts for the Core Cities to 2021
Successful modern city economies also require good longer range contact to access markets. Inter-
urban links enable firms to access wider markets, and other hubs of knowledge and expertise. Fast
transport links between cities help firms access these wider markets and develop economic linkages
cost effectively. They also facilitate mutually beneficial economic linkages between cities. In a UK
context, fast access to London and its international gateways is recognised widely as beneficial in
attracting investment and developing complementary economic functions in the Core Cities.
History shows a compelling link between transport and economic prosperity. Eddington highlighted
the clear link between growth in passenger traffic and GDP7. KPMG’s recent analysis found that a
location with 10% higher rail connectivity tends to have an employment density that is 14% higher.
The simple chart below compares rail passenger growth with employment growth in four of the Core
Cities, showing a clear positive link between the two factors.
Figure 1.1: Growth in employment for various cities, 2001-2008
7 Eddington (2006) Eddington Transport Study: The Case for Action,

July 2011 6
Despite acknowledging this link between transport and economic growth, the UK lags behind
globally in its ability to invest in infrastructure as a means of supporting economic growth. Transport
has been identified as a key objective for the UK for the last 5 years and the UK ranks only 34th in the
world for its infrastructure, and 6th in the G8 countries8. The UK only spends 1.5% of GDP on
infrastructure compared to 6% in Japan and 3% in France9. Consequently, the UK has a massive
infrastructure deficit, estimated at £500bn over the next decade10.
A step change in rail capacity is needed to fulfil the growth potential of the Core Cities
There has been unprecedented growth in rail travel over the past 15 years, and this is forecast to
continue. Indeed looking back over the past 15 years most forecasts have significantly
underestimated rail passenger demand growth. In 2009 rail passenger miles were greater than at
any time than in the previous 60 years, on a rail network that is only 60% of the size it was in 195011.
Rail demand by 2030 will be at a level far beyond that seen before, leading to severe overcrowding
and higher fares in an attempt to price people off the network.
New research suggests that the best case growth scenario for the Core Cities will result in increased
rail demand of at least 70% from 2010-2030, which will necessitate a significant increase in
infrastructure investment to support this growth. Furthermore, rail has been playing an increasingly
important role in the Core Cities. Network Rail data shows that over the last decade, passenger trips
have grown by 60-90% in Birmingham, Leeds, Manchester and Sheffield. To achieve 70% growth will
require around 80,000 more rail trips daily into the Core Cities, something which cannot be provided
by existing capacity and connectivity. This represents around as much as one third of the projected
use of the new high speed line. Even this may be an underestimate. If investment does not take
place, then this growth will be jeopardised.
We estimate that these trips will support 350,000 more jobs in the Core Cities and indirectly a larger
number in the LEP areas. This is because of the market access that increased accessibility makes
possible to drive more effective external demand and investment, alongside incomes and consumer
spending.
Capacity is already struggling to meet demand on existing long-distance rail routes – it is generally
accepted that capacity constraints will bite first on the WCML, followed closely by the ECML.
Passenger demand is forecast to increase by between 56 and 61% on the WCML between 2009/10
and 2024/25 between London and Manchester12. On the ECML passenger journeys to and from
London to Leeds and Newcastle are forecast to grow by 44% and 22% respectively, between 2006
and 201613. Furthermore, passenger demand is set to increase by more than 30% over the next 10
years on the MML from Derby, Nottingham and Leicester to London14.
8 World Economic Forum’s Global Competitiveness Report
9 Association for Consultancy and Engineering, Avoiding the Infrastructure Crunch
10 Policy Exchange, Delivering a 21
st Century Infrastructure for Britain
11 HM Treasury and Infrastructure UK (2010) National Infrastructure Plan 2010
12 Network Rail (2010) West Coast Main Line Route Utilisation Strategy, draft for consultation
13 Network Rail (2008) East Coast Main Line Route Utilisation Strategy
14 Network Rail (2010) East Midlands Route Utilisation Strategy

July 2011 7
High speed rail is required as upgrading existing rail routes will not provide the step-change in
capacity needed and will not provide good value for money
Only a new national high speed rail network will provide the step-change in rail capacity needed. The
main rationale for high speed rail in a UK context is capacity, not speed.
Whilst there is scope for some incremental capacity improvements on existing inter-urban lines, and
some improvements are needed in the short to medium term, this is unlikely to provide the step
change in capacity required on these routes over the longer term. So although some improvements
will be required and some disruption will be inevitable, the type of large scale capacity
improvements to existing routes that would be required as an alternative to HSR would be
extremely expensive and disruptive (for example the West Coast Main Line modernisation) and have
been shown to offer poorer value for money than a new high speed network15.
High speed rail will release capacity on existing rail routes, enabling better services and benefits to
the Core Cities as well as places that will not be directly on the high speed network. This will enable
better use of existing investment.
A new approach is needed to assessing the economic benefits of transformational long distance
rail projects in the UK.
Historically the UK has not invested sufficiently in transport, and decisions have often been heavily
politicised. In addition, the methods by which we evaluate transport investment are very narrow
and tend to underestimate both the risks and the potential benefits. The existing approaches
effectively require us to assume that the economy is a zero sum game – improved activity
somewhere must be to the detriment of reduced activity elsewhere. Whilst this is sometimes the
case, investment in transport is a major factor in making the UK a more attractive place for business
globally and thus can generate economic activity and growth in our cities.
Previous UK examples show that forecasts before the event tend to underestimate the demand and
economic benefits of new transport investment. This can be seen with the original introduction of
the Inter City 125 rail services, rail improvements to cities such as Leeds, and schemes in London
such as the Jubilee Line Extension or Thameslink. In all cases the economic and regeneration benefits
have been much larger than anticipated.
High Speed Rail: The Benefits
The case set out for HS2 underestimates the economic benefits, but despite this is still strong.
We believe that the case set out by DfT and HS2 Ltd underestimates the potential benefits of HSR in
the UK, because the demand forecasts are likely to be conservative, and the methods by which
transport investment is evaluated in the UK do not currently quantify potential transformational
impacts.
15
Oxera (2011) Review of the Government’s case for a High Speed Rail Programme, prepared for the Transport
Select Committee
July 2011 8
However, even on the basis set out the case is strong. Analysis by the Government a shows a BCR of
1.6 to 2.0 for the London-West Midlands route and between 1.8 and 3.4 for the whole Y shaped
network, depending on assumptions16. The Government also estimates that HS2 will create at least
40,000 jobs and deliver £43bn to the UK economy.
The proposed HS2 network is predicted to carry 240,000 passengers per day by 2043, or 85 million
passengers per year, relieving capacity constraints on existing lines and transferring some 6 million
trips from air and 9 million road trips.
By contrast, and highlighting the conservative nature of the benefits estimated by government,
Greengauge 2117 estimate that a UK high speed rail network (based on a design that pre-dated the
announcement of the Y route) could deliver benefits of up to £125bn to the UK economy, carrying
up to 178 million passengers per year by the 2050s and creating fare revenues of £8bn (in 2008
prices), based on average fares of £40-45 per trip which is the same as the average fare paid today
for journeys18. In reality this average hides a wide range of available ticketing options – including
cheaper advance tickets for those willing to forgo flexibility and higher priced premium tickets for
more time sensitive travellers.
Separate analysis by KPMG suggests that HSR could deliver 25,000-42,000 new jobs, contributing
£17bn-£24bn per annum to the UK economy by 2040, generating £6bn-£10bn per annum in tax
revenues, or £87bn-£150bn NPV to the Exchequer19. However, this is an underestimate based on a
limited view of what constitutes additionality. We consider that job creation will be held back
without the provision of substantial additional capacity.
There would be substantial economic benefits of capacity release on existing lines
A key benefit of high speed rail will be the wholly new extra capacity it will deliver and the
opportunity for using existing lines differently and more optimally. This will create benefits to places
that do not currently have direct links to London as well as enabling intermediate places (with a
service currently) to potentially have more frequent services.
When delivering high speed rail, it is crucial to make best possible use of the capacity which will be
released on existing lines. Work by Greengauge 2120 shows that there would be significant benefits
of the released capacity on the WCML. We have specifically considered routes which take less than
1hr and are currently used for commuting purposes. It is possible to the use the existing evaluation
guidance to quantify what this increased commuter capacity could enable in terms of increased
output if workers use the new capacity to access more productive forms of employment – we
estimate that this benefit could be worth £3.4-8.4bn to the UK economy. This range reflects the
assumptions we have applied and the limitations of this approach (as a result of the absence of a
LUTI model) and therefore reflects the potential scale of benefits. As this is based only on the
capacity released on lines south of the West Midlands, it is reasonable to expect that additional
16
DfT Economic Case for HS2 The Y Network and London – West Midlands, February 2011 17
Fast Forward – A HSR Strategy for Britain, September 2009 18
Greengauge 21 HSR – affordable to all, October 2010 19
Consequences for employment and economic growth, Greengauge 21, February 2010 20
Greengauge21 (2011) Capturing the benefits of HS2 on existing lines
July 2011 9
benefits would also be created from both the western and eastern routes of the Y shaped HSR
network. Capacity release on existing lines will provide scope for more regular conventional rail
services from the core cities to places that will not be served by HS2, therefore spreading the
benefits of high speed rail beyond the places that will be accessed directly by it.
Existing approaches to evaluation are based on time savings – but the theory which supports this is
another way of talking about real economic benefits. The government’s own review of the case
suggests that there are other benefits which may still be ignored.
International examples show the significant economic benefits that can be created by high speed
rail
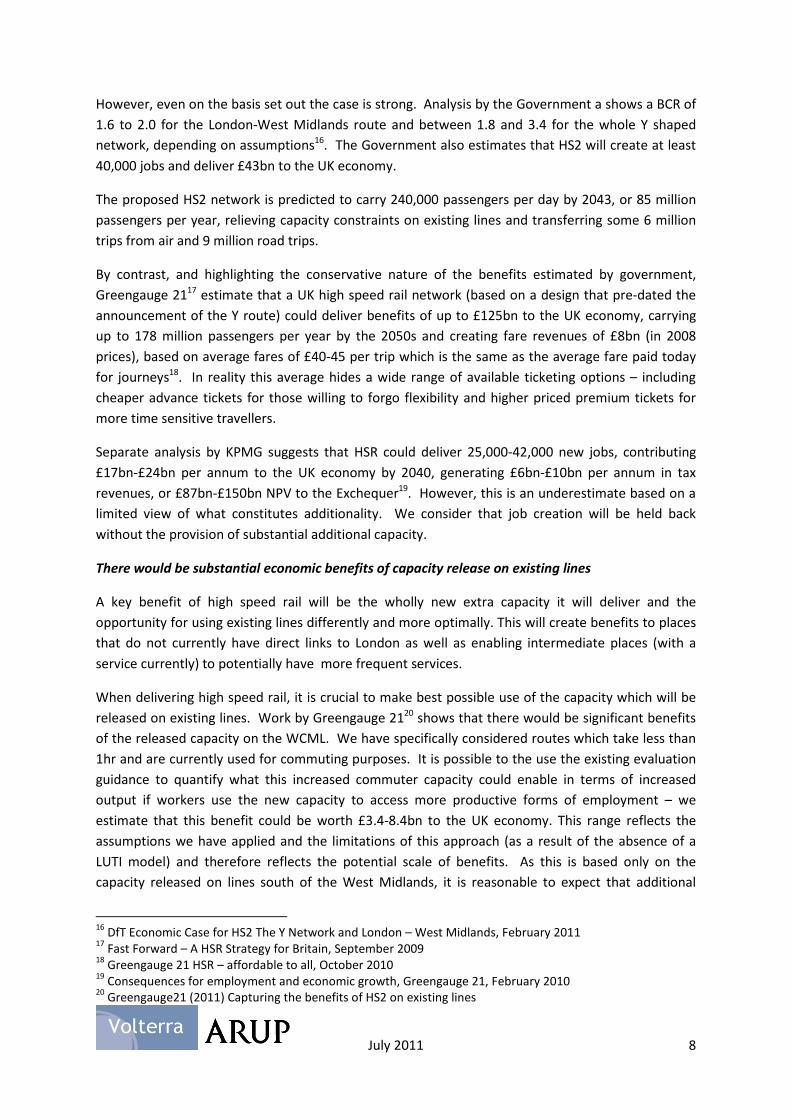
In Europe in 2008 there were 3,480 miles of high speed line in operation, 2,160 miles under
construction and another 5,280 planned. In contrast, the UK has just 70 miles – High Speed One.
Network Rail21 reports that by 2025 China will have 5,678 miles of HSR in place or planned, Spain
4,415, France 4,135, Japan 3,774 and Germany 2,237. With only 70 miles of high speed line, the UK
would lag behind countries such as Morocco with 422 miles and Saudi Arabia with 342.
Figure 2: Miles of high speed lines in place or planned by 2025
Source: UIC, International Union of Railways cited in Network Rail (2009) Meeting the Capacity Challenge: the case for new
lines
An ex-post evaluation of High Speed One between London and the Channel Tunnel estimated that
the benefits were worth £7.6bn in 2008 prices, resulting in a Benefit-Cost Ratio of 1.8, based on
existing evaluation methods22. However, the study showed that development around stations is
21
Network Rail (2009) Meeting the Capacity Challenge: the case for new lines 22
Economic Impact of High Speed 1, Colin Buchanan and Volterra, for London & Continental Railways, January
2009

July 2011 10
planned to deliver 15,000 new homes and 70,000 jobs, valued at £4.4bn in GDP per annum. Even if
only 5% of this could be attributed to HS1, it would result in a Net Present Value (NPV) over 60 years
of £10bn, which would more than double the benefits calculated by the standard appraisal.
International examples also show that HSR often:
• Pays for itself. The Tokyo-Osaka line opened in 1964, and the Paris-Lyon line in 1981. The
Japanese line reports that it long ago covered its construction cost through fares, and the French
line reports that it has also done this. The Spanish high speed network (AVE) is the only part of
the Spanish railway turning a profit.
• Exceeds demand forecasts. Even though the main Japanese HSR line is only 3% of the total
network length, it carries 25% of all traffic. In the decade to 2004, passenger traffic on HSR in
France increased 62.5%, and passenger traffic between Frankfurt and Cologne increased 133%.
• Has significant economic and regeneration benefits. In Japan, cities like Yokohama have seen
huge developments around stations. Property values around stations have been estimated to
be 67% higher and cities connected to the line grow their population 22% faster and have 26%
higher growth in employment. In France, Lyon saw a 43% increase in office space around the
station after the HSR link to Paris opened and reports suggest land prices have risen by 35%.
Development at Lille’s station supports 6,000 jobs. High speed rail has created new commuter
cities, such as Vendome, where HSR reduced the travel time from 2hrs20 to 42mins. In Spain
Lleida, a city between Madrid and Barcelona, has experienced a 15% increase in tourism and
new investment from high tech companies. Cities such as Ciudad Real have seen growth as
commuter cities, with an average of 1,000 homes built per year. The stations of Montabaur and
Limburg were added to the Frankfurt-Cologne line due to political pressure and studies show a
2.7% increase in overall economic activity.
• Reduces the demand for car and aviation trips. From Paris-Lyon the rail share of trips rose from
40-72% when HSR was introduced. HSR now accounts for 97% of the air-rail market between
Frankfurt and Cologne. The Madrid-Seville line cut air travel by a third and car fell from 60-34%.
Along the Madrid-Barcelona line, once Europe’s busiest air route, the number of train
passengers now outnumbers air.
High Speed Rail: The Benefits to the Core Cities
HS2 will bring Birmingham well within one hour’s travel time of London, and could also bring
Nottingham within around 1 hour, transforming the competitive position of these cities as
investment locations. For Leeds, Manchester and Sheffield, the full Y scheme will bring London
within 73-80 minutes, whilst Liverpool will be within 97 minutes of London through the use of classic
compatible trains. This will make it far easier and more efficient for people to do a day’s business in
London (and vice versa), with less productive time lost whilst travelling.
For Newcastle, the full Y scheme will provide a modest reduction in journey times to London until a
dedicated high speed line is built further north. It will provide a step-change in journey times to the
Sheffield City Region, and West Midlands. Whilst Bristol and Cardiff will not be part of the high
speed rail network, there could be benefits in terms of improved links to the north of England by

July 2011 11
connecting onto high speed services at Birmingham and London. However, electrification to these
cities will be required to maximise their economic contribution and benefit. Edinburgh and Glasgow
will benefit from around 1 hour reduction in journey times to Manchester, Birmingham and London,
and even greater journey time reductions to Heathrow (which will make rail highly competitive with
the main London-Scotland air services). Greater benefits can also be achieved by aligning wider
investment in transport infrastructure.
The full Y scheme will help create more integrated and powerful economic zones outside London
helping to rebalance the economy: between Birmingham and Manchester and Liverpool, and
between Birmingham the East Midlands, Sheffield City Region and Leeds, and significantly enhanced
links with Scotland in particular, Edinburgh and Glasgow.
None of these potential benefits are included in the existing case from the DfT. The case does not
include any potential benefits arising from a step change in the connectivity between the Core Cities
nor from development in their economic areas.
The Need for Other Transport Investment to Support the Economies of the Core
Cities
In order to maximise the benefits of high speed rail it will be of vital importance to continue to invest
in existing routes. Improvements are needed to existing rail routes in the short to medium term to
deliver benefits in advance of the completion of the full national high speed rail network (which
could take over 20 years).
The introduction of high speed rail will create significant capacity relief on existing conventional
lines. This can be used to benefit those places not directly served by high speed rail, for example by
enabling the operation of more frequent services. It will therefore be important to continue to invest
in these lines, for example upgrades or electrification, to not only deliver improvements in the short
to medium term, but to also lock in and maximise the capacity benefits from high speed rail over the
longer term.
For Bristol and Cardiff, which will not be part of the high speed rail network, electrification and
capacity improvements to the Great Western Main Line will be vital; to maximise their economic
potential and contribution.
As well as improvements to the strategic network there must also be improvements to local and
regional transport networks. This investment in local public transport to enhance city region
connectivity will be vital to maximise and spread the benefits of high speed rail as well as delivering
substantial economic benefits in its own right. The broad types of interventions put forward to
improve local commuter networks within the Core Cities include:
• Improving the capacity, quality and access to the network of conventional rail networks in the
region/travel to work area, to provide a more attractive journey choice for passengers ;
• Developing light rail routes, including tram-train, to provide access to the modes to a larger
number of people, to enable them to benefit from the journey times savings that these modes
can deliver;
July 2011 12
• A step change in bus connectivity on key corridors through the use of measures such as priority
measures or bus rapid transit schemes; to help to reduce journey times and encourage the use
of this mode; and
• Improving opportunities for walking and cycling within the Core Cities.
In order to maximise the benefits of these different schemes it will be important to ensure that local
strategies are aligned, including economic development and land use, with wider transport (and rail)
policies within the functioning economic geography. Furthermore, particularly in light of the current
fiscal climate, it will be important for these strategies to adopt a clear approach to the phasing of
delivery to ensure that the right priorities are delivered in the appropriate order and timeframe to
meet the desired objectives for the city. This implies a greater degree of coordination and control at
the local level will be required to achieve these levels of growth

July 2011 13
2 Transport, Cities and the Economy
It is simple. The modern economy needs connectivity to reach markets and support innovation. This
connectivity works best in cities where networks can generate new ideas and activities. The
efficiency and effectiveness of the transport system will therefore be central to future employment
and productivity in the UK.
Although cynics have been forecasting the death of city centres for decades, the reverse is
transparently the case. Technology increasingly enables many things to be done remotely but this
does not mean that no one ever need actually to be in an office or physically be at a meeting with
anyone else. Despite, or in fact perhaps because of, advancements in technology, the evidence
clearly demonstrates that people want to cluster together and interact with one another23 more and
more. Cities offer the ability to do this, and urban growth is a global phenomenon, with half the
human population living in a city for the first time in 2008. Within 50 years, that figure will be nearer
80% and the UK’s major cities require this investment to remain competitive.
In Britain, the key cities include the major cities of the industrial revolution and the main ports as
well as the capital cities of London, Cardiff and Edinburgh. All of these have shown recent revival
and are important to the future. Without sufficient infrastructure growth will not be possible.
Transport makes possible the access to markets, which is crucial to investment and to skills. This in
turn creates the coalescence of activity which creates added value and added productivity. Existing
infrastructure is insufficient.
Public transport systems enable cities to function efficiently. As Eddington found, history shows a
compelling link between transport and economic prosperity. Despite acknowledging this and
supporting infrastructure investment as a policy goal, the UK lags behind globally in its ability to
invest in transport infrastructure. Transport has been identified as a key objective for the UK for the
last 5 years and the UK ranks only 34th in the world for its infrastructure, and 6th in the G8
countries24. The UK only spends 1.5% of GDP on infrastructure compared to 6% in Japan and 3% in
France25. The UK has a massive infrastructure deficit, estimated at £500bn over the next decade,
and lags significantly behind our closest global competitors.
It seems there are two reasons that the UK finds it difficult to invest in infrastructure. Firstly it is
heavily politicised and decisions can be made and unmade or put off. Second, the technocratic
approach to modelling results in a relatively narrow approach to costs and benefits which tends to
ignore both the risks and the opportunities. Custom and practise in public sector appraisal has made
it extremely hard to bring innovations in analysis or risk management.
The economic geography of England is already changing. Rebalancing the economy and reshaping
the national geography requires investment in cities outside London, including improving
connectivity between these cities. London remains a central asset to the UK, and there need to be
stronger links to London for all major cities as well as better international reach for all.
23
British Council for Offices: The Challenges for the office sector over the next decade and beyond, May 2011 24
World Economic Forum’s Global Competitiveness Report 25
Association for Consultancy and Engineering, Avoiding the Infrastructure Crunch

July 2011 14
Transport perhaps exemplifies these issues most readily. Historic examples which evidence the
difficulty with which the UK decides to invest include the Jubilee Line Extension, Crossrail and
Thameslink.
- The Jubilee Line Extension did not pass the criteria in place at the time and the decision to
undertake it was based on a political judgment that it would make a significant difference to
Docklands. It did.
- Crossrail has taken around twenty years to finally get government backing. In making the
economic case for Crossrail, the guidance on evaluating transport investments was changed to
incorporate productivity benefits associated with relieving capacity constraints (WEBs)
- Thameslink 2000 scheme required over 30 consents under 4 different Acts and took 8 years
Crucially however, transport is not a silver bullet – to realise the regeneration and land use benefits
of transport investment, proper integration of land use and transport planning is required.
Furthermore, investment will also be needed in the strategic rail network and local commuter
networks to lock and maximise the benefits offered by high speed.
2.1 Transport’s role in the operation of the Modern Economy
Key findings:
• Transport is vital to facilitating the operations of the modern economy.
• Improved communication technologies have not meant that demand for travel has lessened.
This has created new opportunities and taking advantage of these requires both face to face
contact to create ideas and longer range contact to access markets.
• Cities provide the opportunity to create agglomerations where productivity is higher,
competition more effective and innovation fostered.
All economies need transport systems, because all economies rest on trade. It is trade, as the
classical economists pointed out long ago, which drives the ability to specialise, to create economies
of scale and scope and to innovate.
As economies evolve, they interact with the technologies and transport systems available to create
trade networks. Such networks include goods, services, labour markets and innovation.
An example is how London managed to reinvent itself as cost structures moved against
manufacturing in the UK. In the early 1970s, there were a million manufacturing jobs in London
spread out across the capital, around the inner ring road and along the main arteries. These had
largely grown up in the inter war period as road transport and electrical goods had exploded into the
market.
By the turn of the century these jobs had been replaced by those in services, especially business to
business services including legal and accountancy, marketing, consultancy, computer software and

July 2011 15
other services. These jobs are much more concentrated in the centre of the city. London was
fortunate in having a Victorian legacy of a suburban rail system and underground system which had
the capacity (just) to make possible this change in economic geography of the city. Without such
capacity this change could not have been as effective as it was. Even so, the system has strained to
cope and reinvestment has been slow and late.
Similarly, Manchester has reinvented its city centre from a history of warehouse and manufacturing
to a place with vibrant residential activity, retail and a reinvigorated public transport system. The
professional services industries have provided a backbone of new investment in employment in the
centre, while the merger of Manchester University with UMIST has strengthened the skills supply.
The trading markets served by this new economy have also changed dramatically. The old trading
geography reached to the US via Liverpool by ship and to Europe from the Port of London. Again
changing technologies changed the physical organisation of ports with containerisation, while
computer technologies changed growth rates and helped emerging economies. Cities and their
centres continued to be drivers of economic growth.
Looking forward, the intensity of communication is likely to continue to rise, as bandwidth increases
and new corporate forms are better able to take advantage of new opportunities. Taking advantage
of new opportunities requires both face to face contact to create ideas and longer range contact to
access markets.
A more technical term for the importance of face to face communication is agglomeration. This is
the process by which closeness raises productivity. It does this by facilitating knowledge transfer,
creating potential niches, fostering innovation and facilitating effective labour markets. . The theory
goes back to the earliest economists’ consideration of the drivers of economic growth. They looked
at the success of the cotton industry in Lancashire – perhaps the earliest agglomeration in capitalism
– and saw how the co-location of cotton mills facilitated an effective way to innovation, created a
market for specialist skills, and indeed mechanisms to create an effective supply chain. As a result,
Lancashire dominated the textiles industry long after cost structures had moved against it, because
it could rely on staying ahead of the innovation curve. Even now a small but successful materials
industry exists, creating highly technical and innovative materials for a variety of specialised
markets.
Northern Italy provides an example of fashion related activity, including design, manufacture finance
and distribution across the supply chain. Silicon Valley and London’s professional and finance
services are other examples of agglomerations across a supply chain of linked industries.
In addition, agglomerations need far contacts to facilitate trade and foreign direct investment, by
improving market access and also the ability to support the agglomerations of high productivity.
It is this mix of close and far contacts which will generate economic growth. Much of this can be
facilitated by the internet, but it is important to remember that each communication revolution that
we have so far experienced has not reduced the importance of other forms of communication. The
telephone did not reduce the importance of road transport, rather it enhanced it. The internet did
not reduce the demand for business aviation, it increased.
July 2011 16
So maintaining and enhancing all forms of communication will be of primary importance in a modern
economy, and ensuring that the means of transport are also modern will also be paramount. Just as
in their day, motorways offered efficient modern communication, now it is the turn of renewed
railway investment to make a contribution. This is particularly important when it is considered that
some of the main lines to London are forecast to be reaching capacity.
2.2 The importance of Cities in driving growth
Key Findings:
• Cities drive the economic success of the country. The Core Cities and their wider urban areas
contribute an estimated 27% of UK GDP, compared to London’s contribution of 22.5% of UK
GDP.
• Research has estimated that the number of jobs in the Core Cities could increase by 1 million
additional jobs by 2020. If this level of growth was to be achieved this would increase rail
volumes by 70%.
Cities are crucial in delivering the UK’s economic growth. The Core Cities are the main drivers of the
country’s economy outside of London and the South East and need to continue to be productive city
centres, achieving the highest levels of future growth possible and closing the gap in performance
between the South East and the rest of the country. In 2009 the Midlands and Northern, and South
West regions together contributed £510bn, or 41% of total GVA, to the UK economy. Scotland and
Wales contributed a further £147bn, or 12%. The Core Cities Local Economic Partnerships
contributed an estimated 24% of England’s GDP, compared to 18% in London. Whilst, the primary
urban areas of the Core Cities contribute 27%, London contributes 22.5%. Investment in transport
infrastructure is a key factor in their continued ability to grow and prosper.
In February 2011, Oxford Economics26 produced independent forecasts for the Core Cities Group
which considered the scope for future growth in the Core Cities and the geography of their Local
Enterprise Partnerships (LEP) areas. The best case scenario concluded that there is potential for an
extra £44bn of GVA and 1 million additional jobs in the Core Cities LEPs by 2020 in addition to the
base case, with 341,000 jobs in the Core Cities authority areas alone, and £15bn of GVA. The best
case analyses the consequences of a combination of factors including improved exports, a rebound
of consumer spending, increased investment both from business and in universities accompanied by
more modest public spending cuts. But these increases cannot be achieved without stronger market
access and the incomes which such access would generate. In other words, growth in turn requires
connectivity and attendant infrastructure investment.
Further work undertaken by Oxford Economics in June 201127 has estimated the potential rail
demand from 2010-2030 which would be associated with these scenarios. This concludes that the
base case would increase rail volumes by 47%, and this figure rises to 70% for the upper scenario,
with a further increase of nearly 400,000 jobs in the Core Cities of which 350,000 are in the cities
26
Oxford Economics (2011) Our Cities, Our Future, Core Cities 27
Oxford Economics (2011) Rail Transport Forecasts: Core Cities

July 2011 17
connected to the High Speed Line (see appendix A1 for a breakdown between the Core Cities). To
put this in comparison, figures from Network Rail suggest that the total long distance rail market has
grown by over 50% over the last ten years, and has grown by 60% for Birmingham, 70% for Sheffield
and 90% for Manchester and Leeds.
Two marked structural changes have impacted upon the growth in rail travel – the decline in reliance
on car travel, and the sectoral shift towards service and knowledge based industries which have a
greater propensity to use rail as a mode of travel and greater concentration in city centres. These
factors suggest that rail travel will continue to be of vital importance to support economic growth in
the UK’s core cities, and that there is a risk that the growth in travel needed to support economic
activity is likely to be still higher.
Travel needs will rise if growth opportunities are taken advantage of. This will require at a minimum
increased capacity, as there is only limited opportunity for further expansion of the existing system.
2.3 Britain risks being left behind
Key findings:
• Research has demonstrated that investing in infrastructure leads to economic growth and
success. Strong transport links improve access to markets and facilitate trade.
• However, the UK has historically underinvested in infrastructure. Between 2000 and 2007 the
UK was the lowest investor in infrastructure of all the OECD countries.
• The UK has a massive infrastructure deficit, estimated at £500bn over the next decade, and lags
significantly behind our closest global competitors28
• The current approach to appraising transport schemes means that it is difficult to assess the
benefits of these proposals and to make the case for public funding.
2.3.1 Overview
We have argued that economic growth in the 21st century will require a continued focus on cities
and the infrastructure that enables them to function. Britain is a highly developed economy and one
of the richest in the world. However, it will not retain this position without continued investment.
Standing still is not an option and the structure of the economy and its geographical disposition will
continue to evolve.
Infrastructure is the essential underpinning of how the economy functions, making small but
significant contributions to almost all activities of the economy. Much research, including most
notably Eddington29, has shown that there is a positive relationship between infrastructure
investment and economic growth. However the UK has historically underinvested in infrastructure:
28
Policy Exchange, Delivering a 21st
Century Infrastructure for Britain 29
Eddington, Eddington Transport Study: The Case for Action, December 2006

July 2011 18
• From 2000-07 it was the lowest investor of all OECD countries30;
• Although progress has been made, investment is still relatively low by European and
international standards31;
• The UK ranks only 34th in the world for its infrastructure, and 6th in the G8 countries32;
• The UK only spends 1.5% of GDP on infrastructure compared to 6% in Japan and 3% in France33;
and
• The gap in infrastructure provision between the UK and other countries is widening; in 2010 the
UK is ranked just 33rd for the quality of its infrastructure and 12th for overall competitiveness,
compared to ninth in 200534.
In summary, the UK has a massive infrastructure deficit, estimated at £500bn over the next decade,
and lags significantly behind our closest global competitors35. The need to invest in infrastructure to
improve economic competiveness forms an essential part of the rationale lying behind the ‘National
Infrastructure Plan 2010’, which sets out mechanisms to help to address this issue36.
The speed and manner in which the UK recovers from the recession will affect its future growth and
global competitiveness. Whilst public debt must be brought under control, we must focus the
spending which is made on investments which can promote both short and long term growth.
Infrastructure can help deliver this. Investment in strategic rail improvements has been identified by
groups such as Centre for Cities37 as particularly important.
There is also clear support from the business community on the benefits of improving transport
infrastructure to facilitate economic growth. The CBI and the Chambers Infrastructure Commission,
within the British Chamber of Commerce, have confirmed their support for investment to address
this issue, including the benefits that could be generated by high speed rail38. Research by the
Chamber of Commerce has shown that businesses are concerned by capacity on the rail network39.
The particular need to invest in rail infrastructure to ensure that British cities are not left behind the
rest of Europe has been highlighted in literature on this subject. Parkinson et al40 stated "the ability
to move between cities on fast and reliable networks is greater in countries like France and Germany
than it is in the UK. Thus the development of networked cities, for example the Northern Way area,
must depend partly on the development of rail networks that match the best in Europe". The report
30
OECD, Going for Growth, 2010 31
OECD, Going for Growth, 2010: Country Notes: UK 32
World Economic Forum’s Global Competitiveness Report 33
Association for Consultancy and Engineering, Avoiding the Infrastructure Crunch 34
The Global Competitiveness Report 2010-2011, World Economic Forum, September 2010. 35
Policy Exchange, Delivering a 21st
Century Infrastructure for Britain 36
HM treasury and Infrastructure UK (2010) UK Infrastructure Plan 2010 37
Centre for Cities, On Track: Why rail matters, July 2010 38
See CBI, On the right track? The business view on high speed rail 39
British Chamber of Commerce (2010) Reconnecting Britain: a business infrastructure survey 40
Parkinson, M. et al (2006)The State of the English Cities, ODPM
July 2011 19
went on to say state that "in many respects the road and rail connections between English cities are
not up to the standards of the best in Europe, which put them at a competitive disadvantage".
The way we invest in infrastructure in the UK is fraught with difficulties. It seems there are two
reasons that the UK finds it difficult to invest in infrastructure. Firstly it is heavily politicised and
decisions can be made and unmade or put off. Second, the technocratic approach to modelling
results in a relatively narrow approach to costs and benefits which tends to ignore both the risks and
the opportunities. Custom and practise in public sector appraisal has made it extremely hard to
bring innovations in analysis or risk management.
The existing evaluation approach starts from the view that the UK is a mature economy in which
infrastructure needs make only a marginal difference. Economic performance will therefore
continue regardless of such investment. This is not true in today’s world. The economy needs to
restructure and to decarbonise. Both require major investment programmes whose returns are
anything but marginal and which will provide the backdrop to the employment of the future.
Valuing such programmes requires a completely different approach to that which is used for small
changes to an existing system. It requires a focus on economic returns on a broad canvas. It is
better to be broadly right than precisely wrong.
Issues in making the case for transport investment on other schemes
The Jubilee Line Extension did not pass the investment criteria in place at the time and the decision
to undertake it was based on a political judgment that it would make a significant difference to
Docklands. Using current appraisal criteria, and the actual costs and demand experienced, it would
pass. The demand experienced reflected how people’s behaviour changed, as well as growth in
employment and population around stations, which exceeded expectations. None of this was
captured by the models in place at the time the decision was made.
Crossrail has taken around twenty years to have government funding confirmed. In making the
economic case for Crossrail, the guidance on evaluating transport investments was changed, to allow
estimation of productivity benefits associated with relieving capacity constraints into central London
and other key centres.
It is important to include the wider economic impacts of transport investments in addition to
standard transport benefits, to demonstrate the scale of benefits that can be created. Research41 has
demonstrated that by including the agglomeration benefits alone of major transport investments in
Leeds City Region, an additional 25% of benefits are provided above the conventional transport
benefits. The inclusion of agglomeration benefits therefore can help to make the case for investment
in transport, which is particularly important in the current fiscal context.
Investing in infrastructure is crucial to the future growth and competitiveness of the UK economy.
Despite the need to cut the public deficit, the importance of infrastructure must not be forgotten
when budgeting for public spending over the coming years. As Eddington concluded, any
41
Marshall, A. and Webber, C. (2007) The case for better transport investment : agglomeration and growth in
the Leeds City Region, Centre for Cities

July 2011 20
investment in infrastructure should be well researched, well planned and well evidenced. However
when doing this we must also remember that current evaluation methodologies are not always fit
for purpose.
2.3.2 Eddington
The Eddington Report is the seminal reference on the link between transport investment and
growth. Sir Rod Eddington was asked by the Government to research the long-term links between
transport and the UK’s economic productivity, growth and stability. His report was published in
December 2006.
History shows a compelling link between transport and economic prosperity, with new transport
connections enabling new economic relationships to be forged. The figure below shows the
correlation between growth in traffic and GDP from 1980 to 2005.
Figure 3: Growth in traffic, passenger kilometres, freight tonne kilometres and GDP, Great Britain, 1980-
2005
Source: Eddington
Eddington’s main findings were that:
• The economic case for targeted new infrastructure is strong and offers very high returns.
• Transport corridors are crucial to domestic and international trade, and boost the
competitiveness of the UK economy.
• New connections have been crucial in periods of rapid economic growth in many economies.
However, in many mature economies with well-developed transport networks it is transport
constraints that are most likely to impact productivity and competitiveness.
July 2011 21
• Because the UK is already well connected, the key economic challenge is to improve the
performance of the existing network. Action should be prioritised on parts of the system where
networks are critical in supporting economic growth, and where there are clear signals that
these networks are not performing.
• The priorities for long term transport policy should therefore be routes which are showing signs
of increasing congestion and unreliability, focussed around growing and congested urban areas
and their catchments; key inter-urban corridors and key international gateways.
• Government should focus on these areas because they are heavily used, of growing economic
importance, and they are places where transport constraints have significant potential to hold
back economic growth.
• The transport sector needs to meet its full environmental costs. In this way, Eddington fully
supports the Stern Review. Decisions need to be based on a comprehensive assessment of
economic, environmental and social impacts of transport policies, including climate change.
Eddington acknowledges that quantification of carbon impacts is relatively recent and requires
ongoing development.
• Investors view London as the most attractive city in which to do business in Europe, and the
quality of its international connections and domestic networks is viewed as a key element of its
locational advantage.
• The delivery chain for transport needs to adapt to changing demands. The delay and uncertainty
of the planning system for major transport projects should be substantially reduced.
Some key statistics, facts and estimates included in the report are:
• The best transport schemes can offer returns of £5-10 per pound invested
• A 5 per cent reduction in travel time for all business travel on the roads could generate around
£2.5bn of cost savings – some 0.2 per cent of GDP
• Road pricing offers potential benefits of up to £28bn each year in 2025 (around £15bn of which
are direct GDP benefits)
• Better use measures, such as traffic flow management, can offer returns as high as £5 for every
pound spent.
• Eliminating existing congestion on the road network would be worth some £7-8bn of GDP per
annum. Although it would never be economically rational to eliminate this completely it does
illustrate that the sums involved are far from trivial.
• The Thameslink 2000 scheme required over 30 consents under 4 different Acts and took 8 years.

July 2011 22
2.3.3 Other evidence
The OECD Going for Growth publications are a series of reports which have been published annually
since 2005 by the OECD. Each report provides an overview of structural policy developments over
the past year and compares and contrasts performance across Europe. Using a benchmarking
approach based on economic indicators it arrives at a set of country specific priorities to promote
future growth in individual countries.
The 2009 and 2010 reports have focussed on the recession and responding to the crisis in the most
appropriate way so as to promote long term future growth. The 2009 report is perhaps most
relevant to the importance of investing in infrastructure. It focuses on structural reform in response
to the economic crisis and encourages spending which can promote both short and long term
growth. It supports investment in infrastructure as a way to stimulate growth and assist recovery.
The report concludes that whilst country circumstances vary, and not all policies are appropriate in
all countries, investing in infrastructure is likely to positively impact upon both short and long term
growth.
The top three policy priorities which were identified for the UK in 2009 included improving public
infrastructure, especially for transport. Other relevant key priorities included improving public
sector spending efficiency and giving greater weight to economic considerations in planning
regulations. These were all still country priorities in the 2010 review.
The UK country specific notes say that under-investment in public infrastructure has resulted in road
and airport congestion and an unreliable rail system, which add to business costs and constrain
productivity. It advises on the need to follow through with planned levels of spending and ensure
that investment does not fall below these planned levels. It also suggests that the UK should
continue to prepare for a national road pricing scheme.
Infrastructure investment has been a priority policy area for the UK every year since 2005, when
Going for Growth was first published. Furthermore, this has always been focussed on transport
infrastructure.
Drawing on OECD reports is the Centre for Policy Studies’ Conditions for Growth report which
considers what the Government can do to help to create the conditions which will lead to an
increase in the long-term growth rate of the UK economy. It highlights that the speed and manner
with which the UK emerges from recession will be crucial to its long term competitiveness. It
contrasts the policy response in Asia and in Western economies. In Asia, an important part of the
stimulus took the form of investment in infrastructure, which stands to support economic growth
over the long term, whereas much of the support in the West was to private consumption (reduced
taxes and increased social payments). This will do less to support growth over the longer term.
As the chart below shows, by OECD standards, public investment relative to GDP has been very low
in the UK. Transport infrastructure in particular has been repeatedly identified as an area that needs
improvement in the UK. The figure below indicates that Germany had proportionately the next
lowest level of investment in infrastructure (following the UK). This may be as a consequence of the
fact that the country invested significantly in infrastructure in the period up to 2000. Research on

July 2011 23
investment in transport alone has shown that the country has been experiencing a long term trend
of investing a smaller proportion of GDP in transport infrastructure42.
Figure 4: Public investment as a % of GDP from 2000-07
Source: Centre for Policy Studies, Conditions for Growth
The report acknowledges that current levels of government spending in the UK are too high. For the
longer term though, it highlights the importance placed on spending that is growth-promoting.
Investment in infrastructure is considered a particularly good option for this, as well as a range of
active labour market policies, as found in the OECD Going for Growth 2009 and 2010 publications.
Finally, the report considers the split between public and private sector investment in infrastructure.
In 2009 government investment was 3.1 per cent of GDP, whereas public plus private investment
was 14 per cent in 2009, its lowest rate since the 1980s and lower than in all OECD countries except
the US.
The report therefore highlights the importance of structural policies in supporting the return of
these investment strategies in the private sector, which will be crucial to ensuring sufficient future
investment in infrastructure.
42
Kitlinski, T. and Schmidt, T. (2010) Public Infrastructure in Germany and its effect on Private Investment: Is
there a positive linkage?

July 2011 24
3 High Speed Rail
The government has produced a proposal for new capacity which is also a High Speed route. A new
line to the West Midlands and further expansion to Manchester and Leeds offers both the additional
capacity to support potential expansion but also higher speeds which has an additional role in
improving market access.
We believe that the case set out for HSR by DfT and HS2 Ltd underestimates the potential benefits of
HSR in the UK, because the demand forecasts are likely to be conservative, and the methods by
which transport investment is evaluated in the UK do not currently quantify potential
transformational impacts.
The prospects for 1 million extra jobs in the Core Cities rest on the ability to deliver more rail trips
into these cities, which cannot happen without new capacity.
Even on the basis that it has been evaluated however, the Government’s case for HS2 is strong. It is
based on conservative assumptions and a conservative approach to modelling, yet still results in a
Benefit Cost Ratio (BCR) of at least 1.6 for HS2 from London to the West Midlands and a BCR of up to
3.4 for the whole Y shaped network. This is based on estimated benefits to the UK economy of over
£40bn including wider economic impacts. Research by Greengauge 21 estimates that HSR could
actually deliver benefits of up to £125bn to the UK economy.
An ex-post evaluation of High Speed One found a BCR of 1.8 based on existing guidance but showed
that even a conservative estimate of the regeneration benefits facilitated around stations would
more than double this, generating additional benefits of £10bn. This highlights the importance and
scale of benefits which are valued and which are not. Previous work by Arup/Volterra and KPMG, as
well as new work summarised here suggests that the value of wider economic impacts included in
the existing case could be significantly underestimating the real scale of benefits from capacity
release and productivity enhancements.
With just 70 miles of track, the UK lags considerably behind other countries in the development of
HSR. International examples are all very positive suggesting that HSR lines typically:
- Outperform their original demand forecasts;
- Pay for their own construction very quickly through fare revenues;
- Transform places along the route, in terms of employment, residential development or tourism,
depending upon individual place dynamics;
- Have very large impacts upon car and aviation travel; and
- Considerably reduce journey times, increase capacity and improve reliability of services.
The creation of the high speed network will free up significant amounts of capacity on existing lines.
This can be used to benefit those that are not directly connected to the high speed network, this
could help to increase service frequencies and provide new journey opportunities, for example for
July 2011 25
those places that do not currently have direct services to London may be able to have a service. This
will also address the fundamental issue of capacity being reached on existing lines to be addressed.
HS2 will bring Birmingham well within one hour travel time of London, and could also bring
Nottingham within around 1 hour, transforming the competitive position of these cities as
investment locations. For Leeds, Manchester and Sheffield, the full Y scheme will bring London
within 73-80 minutes, whilst Liverpool will be within 97 minutes of London through the use of classic
compatible trains. This will make it far easier and more efficient for people to do a day’s business in
London (and vice versa).
For Newcastle, the full Y scheme will provide a modest reduction in journey times to London. It will
provide a step-change in journey times to the Sheffield City Region, and West Midlands. Whilst
Bristol and Cardiff will not be part of the HS2 network, there could be benefits in terms of improved
links to the north of England. Edinburgh and Glasgow will benefit from around 1 hour reduction in
journey times to Manchester, Birmingham and London, and even greater journey time reductions to
Heathrow (which will make rail highly competitive with the main London-Scotland air services.
The full Y scheme will help create more integrated and powerful non-London economic zones:
between Birmingham and Manchester and Liverpool, and between Birmingham the East Midlands,
Sheffield City Region and Leeds.
The analysis undertaken for this report by Oxford Economics shows that around 80,000 additional
trips daily would be needed to support the upper growth scenario that they have prepared and
which gives 1 million additional jobs. This scenario requires better global growth and higher
business investment. Such success will require wider and faster market access, and improved
commuter access that a new line makes possible by releasing capacity on the existing network.
The real need for a new line thus rests on its potential to make possible a higher growth scenario for
the cities that it links. This potential can be measured in output or employment, but the government
case uses a different currency, that of the time savings.
3.1 The government case for High Speed Rail
Key findings:
• The Government’s proposed Y shape network would transform connectivity between those
cities served by the line. This would facilitate the process of doing business and helping to
strengthen the economic function of the role fulfilled by the Core Cities.
• The estimated cost of the Y shaped network is £30.4bn in capital costs and £17bn in operating
costs and has a BCR of 2.2, without WEIs, or 2.6 including WEIs.
• The existing approaches effectively require us to assume that the economy is a zero sum game;
if employees are located in one place they must be doing so at the expense of being somewhere
else. We can therefore only ever value any uplift in productivity which we can attribute to the
transport investment, not the jobs themselves. We cannot value any wholly new jobs or activity

July 2011 26
which could be created by investment. This means that it is not possible to calculate the true
scale of the benefits created by high speed.
3.1.1 Latest case for HS2
The latest DfT / HS2 publication43 and its appendices provide useful information into the existing
case for HS2 from London to the West Midlands and the Y-shaped route. This work provides
detailed quantification of the conventional benefits and WEIs of HS2 to the West Midlands and
indicative further work on the Y-shaped network. An indicative map of the proposed Y shaped
network is shown below.
Figure 5: Indicative map of the proposed Y shaped HSR network
Source: HS2
43
DfT Economic Case for HS2 The Y Network and London – West Midlands, February 2011
July 2011 27
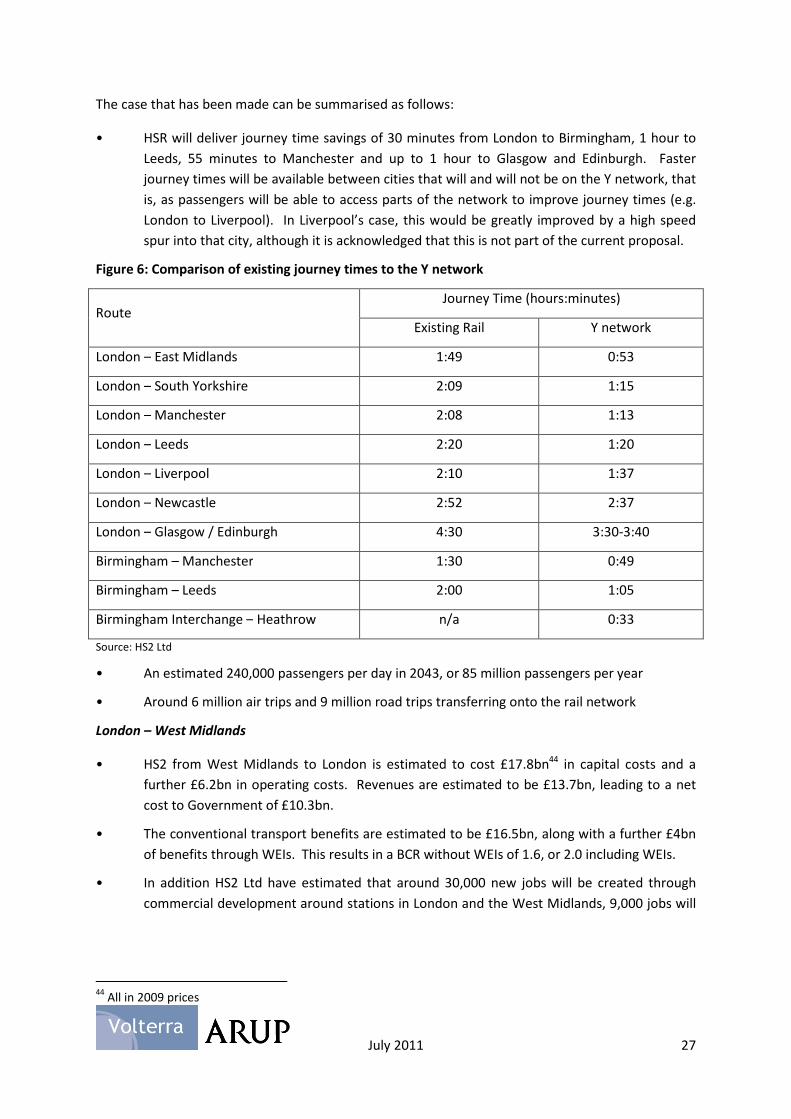
The case that has been made can be summarised as follows:
• HSR will deliver journey time savings of 30 minutes from London to Birmingham, 1 hour to
Leeds, 55 minutes to Manchester and up to 1 hour to Glasgow and Edinburgh. Faster
journey times will be available between cities that will and will not be on the Y network, that
is, as passengers will be able to access parts of the network to improve journey times (e.g.
London to Liverpool). In Liverpool’s case, this would be greatly improved by a high speed
spur into that city, although it is acknowledged that this is not part of the current proposal.
Figure 6: Comparison of existing journey times to the Y network
Route Journey Time (hours:minutes)
Existing Rail Y network
London – East Midlands 1:49 0:53
London – South Yorkshire 2:09 1:15
London – Manchester 2:08 1:13
London – Leeds 2:20 1:20
London – Liverpool 2:10 1:37
London – Newcastle 2:52 2:37
London – Glasgow / Edinburgh 4:30 3:30-3:40
Birmingham – Manchester 1:30 0:49
Birmingham – Leeds 2:00 1:05
Birmingham Interchange – Heathrow n/a 0:33
Source: HS2 Ltd
• An estimated 240,000 passengers per day in 2043, or 85 million passengers per year
• Around 6 million air trips and 9 million road trips transferring onto the rail network
London – West Midlands
• HS2 from West Midlands to London is estimated to cost £17.8bn44 in capital costs and a
further £6.2bn in operating costs. Revenues are estimated to be £13.7bn, leading to a net
cost to Government of £10.3bn.
• The conventional transport benefits are estimated to be £16.5bn, along with a further £4bn
of benefits through WEIs. This results in a BCR without WEIs of 1.6, or 2.0 including WEIs.
• In addition HS2 Ltd have estimated that around 30,000 new jobs will be created through
commercial development around stations in London and the West Midlands, 9,000 jobs will
44
All in 2009 prices

July 2011 28
be created through construction of the route, and around 1500 jobs will be created to
operate the network45.
Y shaped network
• The Y shaped network is proposed to serve the East Midlands, South Yorkshire and Leeds
north of Birmingham to the east and Manchester to the west.
• The estimated cost of the Y shaped network is £30.4bn in capital costs and £17bn in
operating costs. Cost savings on classic lines are estimated to be £3.1bn, and revenues are
estimated to be £27.2bn, leading to a net cost to Government of £17.1bn.
• The conventional transport benefits – the time savings - are estimated to be £37.3bn, along
with a further £6.3bn of WEIs. This results in a BCR without WEIs of 2.2, or 2.6 including
WEIs. The BCR ranges from 1.8 to 3.4, depending on the assumptions made about benefits
from capacity release, WEIs of the Y network, and classic line cost savings.
3.1.2 What approach has been taken to assessing the Wider Economic Impacts of High Speed
Rail?
The WEIs guidance was developed in the context of Crossrail. The approach is therefore very
appropriate for evaluating the benefits of improved transport links which either release capacity on
commuter constrained networks, or reduce journey times for commuters, making commuting more
attractive or more efficient. This is therefore highly relevant for commuter networks within city
regions, and was relevant for High Speed One, the domestic arm of which also delivers significant
additional commuter capacity into central London. Indeed the economic evaluation of HS1 showed
that the WEIs were as large again as the standard transport benefits (£3.8bn each), doubling the
Benefit Cost Ratio.
However in the context of High Speed Rail more widely, whilst it may release some commuter
capacity in some areas, it has a different primary purpose which is to improve connections between
city regions – this is not the effect that WEIs guidance was designed to capture. The WEIs
methodology was not developed nor ever intended to be used to assess what transformational
impacts large-scale longer distance infrastructure investments like High Speed Rail could have upon
the UK’s economic geography.
The existing approaches effectively require us to assume that the economy is a zero sum game – if
employees are located in one place they must be doing so at the expense of being somewhere else.
We can therefore only ever value any uplift in productivity which we can attribute to the transport
investment, not the jobs themselves. We cannot value any wholly new jobs or activity which could
be created by investment. A recent evaluation of the economic impact of High Speed One46
illustratively estimated that even if only 5 per cent of the growth delivered in Kings Cross, Stratford
and Ebbsfleet as a result of High Speed One is viewed to be really ‘additional’ then this would equate
to £10bn of regeneration benefits – which would more than double the estimates of conventional
45
HS2 London to the West Midlands Appraisal of Sustainability, Non Technical Summary, Boox&Co and Temple
for HS2 Ltd. 46
Economic Impact of High Speed 1, Colin Buchanan and Volterra, for London & Continental Railways, January
2009

July 2011 29
benefits and WEIs (which were together £7.6bn). This highlights the potential scale of benefits
which remain not captured by existing guidance.
We have had several discussions with DfT and HS2 on this issue, and they agree that the guidance in
its current form does not capture the sorts of transformational benefits which are intuitively
associated with HSR. Although much can be garnered from examples in other countries, none of
these have developed statistical methods which categorically test the impacts that such transport
investments can have. Whilst much evidence of the likely benefits does exist no definitive approach
is yet agreed on how to capture these transformational benefits.
The key outstanding issue is that guidance in its current form assumes land uses as a fixed factor,
external to the model, when in reality we need a dynamic model that allows the investment in
infrastructure to impact upon where growth occurs in the future. Whilst LUTI models try to do this
to some extent, they have as yet been unable to fully capture the dynamics of the impacts and have
often been shown to underestimate land use effects as a result of transport investment. Some work
has sought to relax this assumption, and we discuss the results from this approach.
The Transport Select Committee has published a review of the government’s case by OXERA. The
review establishes that the assumptions are those normally used by such analysis. It points out that
the case will depend at least in part on judgements on the balance of evidence on non-monetised
items, such as environment and regeneration impacts. The review acknowledges that these are
likely to be substantial. It is the regeneration – or perhaps generation – aspect that is in our view the
main role of this investment.
3.1.3 Previous government case for HSR
Prior to the conclusion to move forward with the case for the HS2 and the Y shaped network, the
government also published detailed demand models which considered the case for a variety of lines.
These highlight similar findings to the previous reports – that a robust case exists for high speed rail
serving the UK. It also highlights that the case for the extension of HS2 to the east appears to be
stronger than the case for the extension to the west.
Figure 7: Costs and Benefits of various HSR routes considered by HS2
Route Costs Benefits BCR Indirect
revenues
Revised
BCR
Central Case (Day One scenario) 11,913 28,708 2.41 1,465 2.61
Classic line alternative 11,502 22,471 1.95 1,315 2.08
Central Case without reliability 12,891 26,708 2.07 1,496 2.21
Central Case without station at Old Oak Common 12,672 27,358 2.16 1,444 2.31
Central Case without B’ham Interchange station 11,673 28,193 2.42 1,558 2.63
Central Case with a station at Heathrow 15,819 26,668 1.69 1,447 1.75

July 2011 30
Wider Networks – The Inverse A 44,848 103,097 2.30 4,928 2.46
Wider Networks – The Reverse E 46,248 88,442 1.91 4,356 2.01
Wider Networks – The Reverse S 41,166 73,886 1.79 3,920 1.88
HS2 Extensions – Manchester 15,672 37,292 2.38 1,971 2.58
HS2 Extensions – Leeds 13,206 59,896 4.54 3,071 5.61
Source: HSR London to the West Midlands and Beyond: HS2 Demand Model Analysis, February 2010
3.2 Other UK evidence on the case for High Speed Rail
Key Findings:
• There is a significant body of evidence that makes the case for the benefits that a high speed rail
network could generate.
• This work has included investigating different route options and the subsequent benefits that
could be generated.
• Additional work has been undertaken to understand the regeneration and transformational
impacts that have the potential to be created through HS1, which are not assessed as part of the
current approach to quantify the benefits of high speed. This includes plans to deliver over
15,000 homes and 70,000 jobs, estimated to be worth £4.4bn in GDP per annum. Even if only
5% of these benefits impacts were included in the appraisal considered as additional benefits,
then this would amount £10bn of regeneration benefits as a Net Present Value (NPV) over 60
years, which would more than double the estimates of conventional benefits and WEBs. This
shows the scale of the benefits that can be created, which are not currently assessed.
3.2.1 Greengauge 21
Greengauge 21 have published several reports on their recommendations for a HSR network for the
UK and the scale of potential benefits. Their proposed HSR network includes two north-south lines,
serving the North West and North East, rather than one from London to the West Midlands which
then spurs further north (the Y shaped network, which is advocated by HS2/DfT). All of
Greengauge’s work on benefits therefore assumes a different HSR network to the HS2/DfT work but
is still useful in understanding the potential scale of benefits.

July 2011 31
Figure 8: Greengauge 21’s proposed high speed rail network
Source: Greengauge Fast Forward
In summary Greengauge 21’s research makes the following arguments:
• The HSR network would generate benefits of £125bn, made up of £111bn conventional
benefits and £14bn of WEIs47. The Greengauge work arrives at higher BCRs for the north-
western than the north-eastern route. This is different to the HS2 findings that result in
significantly higher BCRs for the eastern arm of the Y shaped network than the western leg.
Figure 9: BCRs of various HSR routes considered by Greengauge
Source: Greengauge Fast Forward
47
Fast Forward – A HSR Strategy for Britain, September 2009

July 2011 32
• The HS2 case which has been made is conservative because (a) its demand assumptions rely
on significantly lower growth figures than have been seen in recent years and (b) modal
diversion could be greater than estimated
• HS1 was recently let with a 30 year concession for £2.1bn. Greengauge believe that HS2 has
the potential to generate a much greater financial return to the Exchequer
• Estimates of the revenue from fares are stated as £8bn (2008 prices) by the 2050s48. This is
based on an estimate of circa 178million passengers and average fares of £40-45.
• The benefits from capacity release on existing lines would be very significant – these have
been considered in detail in the work done for Greengauge 21 by Jonathan Tyler49 which
summarises the places which could benefit from improved frequency services (Lichfield,
Tamworth, Nuneaton, Wolverhampton, Milton Keynes, Watford Junction, Coventry, Rugby,
Northampton, Bletchley, Leighton Buzzard, Cheddington, Tring, Hemel Hempstead, Harrow
& Wealdstone, Wembley). An interesting next step is to try to quantify these using the DfT’s
‘move to more productive jobs’ methodology – we consider this in section 3.4.
• HSR could attract 10% of Heathrow air passenger demand. On the one hand it would divert
short-haul air travel to HSR, resulting in 6 million passengers per annum (mppa) fewer, on
the other hand it would create demand for additional air travel of around 4 mppa, primarily
through clawing back trips which currently use continental hubs to reach destinations
further afield. The capital cost of a rail link to serve Heathrow would be £3.2bn, and it would
have a BCR of 4.850.
• The potential for Stratford International51 to play an important role in ensuring a direct
connection between HS1 and HS2 should be investigated in more detail. This would provide
through services from regional stations in the UK to continental Europe which could create
significant benefits52
• In the long term, Greengauge believe that two north–south routes are required in order to
provide the level of capacity that will be needed to serve the north west and north east
effectively. In the short term, it is crucial to broaden the benefits of the London-West
Midlands phase by connecting to Derby and Sheffield via an improved Midland Mainline53
• The phasing of HSR is important to ensure that the benefits are maximised
• HSR should serve city centre locations rather than parkway stations in order to maximise the
benefits
48
HSR – affordable to all, October 2010 49
Capturing the Benefits of HS2 on existing lines, February 2011 50
Heathrow Opportunity, February 2010; Fast Forward – A HSR Strategy for Britain, September 2009 51
Greengauge 21 Position Statement, April 2011 52
Fast Forward – A HSR Strategy for Britain, September 2009 53
HS2 Interfaces, July 2010

July 2011 33
• The environmental case for HSR is very strong54
3.2.2 High Speed One
Published in January 2009, Colin Buchanan and Volterra undertook a study for London and
Continental Railways on the economic and regeneration benefits of High Speed One55, the link
between St Pancras and the Channel Tunnel, enabling direct services between London and a range
of destinations in north and east Kent. This study found that the benefits doubled if Wider Economic
Impacts were included.
Figure 10: Improved train journey times across Kent due to HS1
The case, evaluated in line with DfT guidance, can be summarised as follows:
• Journey time savings range from 10-40%
• The HS1 project cost £5.7bn to deliver, and an estimated £1.6bn to operate (in 2008 prices).
• Against this overall cost of £7.3bn, the forecast rail and car park revenue was estimate to be
worth £3.4bn, thereby offsetting all of the net operating costs and approximately 31% of the
capital investment
• The conventional transport benefits were estimated to be worth £3.8bn, and the WEBs were
estimated to be worth a further £3.8bn. Together these resulted in a BCR of 1.8.
54
Energy Consumption and CO2 impacts of HSR: ATOC analysis for Greengauge 21, April 2009; Fast Forward –
A HSR Strategy for Britain, September 2009. 55
Economic Impact of High Speed 1, Colin Buchanan and Volterra, for London & Continental Railways, January
2009
July 2011 34
• The WEBs were split approximately equally between ‘move to more productive jobs’
(£1.7bn) and ‘pure agglomeration’ (£1.8bn), with small further benefits (£0.3bn) through
labour force participation and imperfect competition.
HS1 has attracted and supported the delivery of three major development schemes in Kings Cross,
Stratford and Ebbsfleet, plus additional growth at Ashford. Those schemes are planned to deliver
over 15,000 homes and 70,000 jobs, estimated to be worth £4.4bn in GDP per annum. Even if only
5% of these impacts were included in the appraisal as additional benefits, then this would amount
£10bn of regeneration benefits as a Net Present Value (NPV) over 60 years, which would more than
double the estimates of conventional benefits and WEBs. Based on this analysis, the assumptions
made by HS2 Ltd of 30,000 new jobs created through development at stations in London and the
West Midlands, appear conservative. The development related impacts will increase substantially for
the full Y-shaped network.
3.2.3 Volterra/Arup work
The latest HS2 publication estimates WEIs from the London – West Midlands leg of HS2 of around
£4bn, plus a further £2.3bn for the rest of the Y network. The West Midlands element is based on
modelling but the WEIs of the rest of the Y network have only been assessed at a high level and
could be as much as £4.7bn and the figure of £2.3bn used in the consultation document represents a
central estimate.
More in depth work by Volterra and Arup has quantified the WEIs of the eastern arm of the Y shaped
network, in line with DfT guidance. This found that the WEIs through pure agglomeration alone are
of the order of £2.5bn56. This suggests that the DfT estimates are likely to considerably
underestimate the scale of potential wider impacts from the whole of the Y network. Moreover, the
Arup/Volterra work also highlights the importance and potential scale of transformational benefits,
which are not captured by the existing methodologies.
In addition, Oxford Economics were commissioned to develop rail usage forecasts for this report.
The analysis contained in their own report (see Annex A) uses the Core Cities forecast produced in
February 2011 to produce indicative estimates of potential rail demand over the period 2010 to
2030. The forecasts are produced for both the baseline and upper scenarios. The original forecast
demonstrated that an additional 400,000 jobs within the Core Cities, and 1 million in total in their
wider (Local Enterprise Partnership) areas, could be achieved over a decade. The methodology is
focussed on getting a broadly accurate estimate of the total volume of rail traffic that would be
commensurate with the economic forecasts.
The forecasts refer to people arriving at the station and as such are designed to show the volume of
passengers a station may have to deal with at any one given time. The estimates do not include
interchanges. The forecasts suggest the following:
• A 47% increase in weekday rail volumes into the Core Cities (all stations) is projected by
2030 in the baseline, representing an annual average growth of 2% per annum over the next
20 years.
56
As set out in the Sheffield City Region (2011) Transport Select Committee High Speed Rail Submission
July 2011 35
• This figure rises to 70% in the upper scenario (2.7% pa over the next 20 years)
• Commuting travel by rail increases by 61% This reflects a growth in rail journeys as a
proportion of total journeys from 4.8% to 7.1%
• In the upper scenario commuting rail journeys increase by 86% (an annual average growth
rate of 3.1%)
• The commuting increase in the baseline reflects a modest change in the mode of transport
(from car to rail) but also the sectoral shift towards industries which have a much higher
propensity to use rail for commuting (notably professional services)
• Business travel by rail increases by 31%.
• In the upper scenario business rail journeys increase by 50%
In summary, to support the creation of 400,000 jobs for the Core Cities, and 1 million in total for their wider
urban areas, weekly rail volumes into the Core Cities stations (and therefore the infrastructure required) will
need to increase by around 70% over the next 20 years, supporting at least 150,000 new arrivals per day. This
represents around 80,000 additional trips per day on a High Speed line. This is likely to be underestimated.
This growth represents an increase over twenty years of 17 per cent in employment. The relationship
illustrated here suggests that as much as a doubling of rail passenger growth overall will take place.
This increase in capacity is not possible without HSR, which is therefore required to achieve these jobs growth
forecasts
3.2.4 KPMG work
The most recent Greengauge 21 study to gain significant press coverage has been work by KPMG to
quantify the economic benefits of HSR57. A measure of a connectivity was used for each district to
represent the ability to travel to other places (journey times), along with the businesses and labour
which could be reached in these places, and the willingness of people to travel those distances. This
has been related to various factors in the local economy – wages, sectoral wages, sectoral mix and
density of employment.
The results of this analysis are as follows:
• Areas with high rail connectivity have higher wage levels – an area with 10% higher
connectivity will tend to have a wage level which is 1.1% higher;
• There are strong links between an area’s employment density and its rail connectivity – a
location with 10% higher rail connectivity tends to have an employment density that is 14%
higher;
• As with the DfT’s approach, both of these impacts are highest for business services;
• Based on Greengauge’s Fast Forward full HSR “H-shaped”network (two north-south routes:
HS-NE and HS-NW and therefore very different to the current proposed route) and
assumptions on new services on existing lines to exploit the capacity released by HSR, the
approach concludes that productivity and wage changes could be responsible for an increase
in employment of between 25,000 and 42,000 jobs.. However, through the 10 year
57
Consequences for employment and economic growth, Greengauge 21, February 2010

July 2011 36
economic forecasts from Oxford Economics, based on additional infrastructure investment,
our view is that this figure is underestimated and has the potential to rise to 350,000.
Finally KPMG assumed that 35% of this additional GVA is taken in taxes, which translates to £6bn-
£10bn per annum in tax revenues, or £87bn-£150bn NPV.
3.2.5 Northern Way
The Northern Way has undertaken a body of work to understand the case for high speed rail to the
North of England. Initially they advocated58 a national high speed network that consisted of north-
south routes to the east and to the west of the country. Included within this was high speed route
across the Pennine, connecting Leeds and Manchester. As part of this work they estimated such a
network would generate £13bn PV in agglomeration benefits. Of this £13bn, £5bn would occur in
the North of England. This would mean that proportionally, the North’s economy receives a greater
agglomeration increase than London and the South East.
Their most recently published work59 on this issue sets out further information on the benefits that
could be generated by the Government’s proposed high speed network:
• The Northern Way has concluded that the Government’s assessment of the proposed benefits of
high speed represents a conservative assessment and that the Y network could generate
substantially greater wider economic impacts than currently shown.
• Currently, the Government has not quantified the impacts of high speed rail on the size of the
economy measured by GVA. Work by the Northern way has shown that the impact on GVA from
major transport investments could be up to three times the size of welfare benefits assessed as
part of the conventional cost benefit appraisal.
3.2.6 Oxera
Oxera has recently published a review of the Government’s case for a high speed rail programme,
prepared for the Transport Select Committee60. This seeks to provide a review of the approach to
appraisal undertaken by the Government and to identify those areas that are most sensitive to the
assumptions made.
This concludes that estimates surrounding the economic (and monetised) benefits of high speed rail
are surrounded by a degree of uncertainty. This is reflected by the sensitivities that have been
published by the Government for the BCR, excluding WEIs, which show a range of 0.7-2.7. This
acknowledges that the balance of non-monetised impacts such as landscape, carbon and changes in
land use are difficult to understand currently, but which are likely to become clearer over time as
understanding of the impacts of the proposal improve.
58
Northern Way (2009) Transforming our economy and our connectivity: high speed rail for the north of
England 59
Northern Way (2011) Transforming Our Economy and Our Connectivity: High Speed Rail for the North
Issues and Evidence in Response to the Government’s High Speed Rail Consultation 60
Oxera (2011) Review of the Government’s case for a high speed rail programme
July 2011 37
This notes that the case for high speed is dependent upon when and if additional capacity on the
network is needed, what represents the best value for money solution to addressing this capacity
issue, and the benefits and the costs that the approach could generate.
3.3 International evidence on the case for high speed rail and how the
benefits can be maximised
Key findings:
With just 70 miles of track, the UK lags considerably behind other countries, including Morocco (with
422 miles) and Saudi Arabia (with 342 miles) in the development of HSR. International examples are
all very positive suggesting that HSR lines typically:
• Outperform their original demand forecasts;
• Pay for their own construction very quickly through fare revenues;
• Transform places along the route, in terms of employment, residential development or tourism,
depending upon individual place dynamics;
• Have very large impacts upon car and aviation travel; and
• Considerably reduce journey times, increase capacity and improve reliability of services.
3.3.1 Introduction
The first country to open a HSR line was Japan in 1964, with a line between Tokyo and Osaka.
France began developing its TGV network in the 1970s and the first line between Paris and Lyon
opened in 1981. These schemes were viewed as successful and networks subsequently rolled out
across Japan and France. HSR has also taken off elsewhere, most notably Europe and Asia, although
the US is now interested, with some public money being committed.
Figure 9 shows the extent of the European high speed rail network. In Europe in 2008 there were
3,480 miles of high speed line in operation, 2,160 miles under construction and another 5,280
planned. In contrast, the UK has just 70 miles – High Speed One. Network Rail (2009) reports that
by 2025 China will have 5,678 miles of HSR in place or planned, Spain 4,415, France 4,135, Japan
3,774 and Germany 2,237. With 70 miles, the UK would lag behind countries such as Morocco with
422 miles and Saudi Arabia with 342.

July 2011 38
Figure 11: HSR network in Europe
Source: High Speed Rail London to the West Midlands and Beyond: A Report to Government by High Speed Two Ltd
International examples provide a useful reference point to identify points of best practice and the
types of economic benefits that can be realised through the introduction of high speed rail services.
This helps to highlight lessons that can be learnt from this process in the development of additional
high speed rail lines in the UK. However, whilst much qualitative work has been undertaken on the
benefits of high speed rail there is relatively little quantification of the scale of these benefits in
much of the work undertaken. This reflects the difficulties encountered in quantifying such impacts.
This section sets out the emerging findings from the work undertaken to date reviewing the
available literature on this topic.
3.3.2 Route choice
The need to make compromises on the route selected to ensure that the best places are connected
is an integral element of the development of high speed rail networks. This involves weighing up the
case for generating the fastest journey times and the benefits of connecting additional places to the
next. Vickermann61 notes that when developing the route between Paris and Brussels the decision
was made to use the less direct route via Lille to connect to the metropolitan area, which has a
population in excess of one million people. However, as noted in other work, the benefits of high
61
Vickermann, R. (2007) “Indirect and wider economic impacts of high-speed rail”, Centre for European,
Regional and Transport Economics

July 2011 39
speed can be lost if intermediate stops at smaller places are made, which are not of sufficient
market scale to offset the reduced journey times that would be generated62.
3.3.3 Journey time savings
The nature of the economic geography of countries such as France and Spain has made them well
suited to the development of a high speed rail network. This is as a result of the lower population
density found here and the distances between the main towns and cities63. In contrast the UK has a
much more compact economic geography, with the Eddington Review highlighting that most major
urban areas are relatively close together when compared with other European examples.
Research has shown that different scales of benefits are created depending upon the journey time
saving generated and particularly where mode transfer from air to rail can be achieved64. This has
highlighted that when journey times are less than four hours rail has a market share of around 70%
and when journey times are less than three hours this can effectively remove the market for air
trips65. This is reinforced by data on the introduction of high speed services between Madrid and
Seville, where journey times were reduced from six and a half hours to two and a half hours66 and
where the rail share increased from 16% to 51%, whilst air decreased from 40% to 13%. This is of
particular significance for businesses as it reduces productive time lost whilst travelling by car or by
air. Furthermore, this generates new trips not undertaken prior to the introduction of high speed
services.
Greengauge 21 (2006) has classified the journey times into three broad categories, which reflect the
different markets/passengers and thus the type of benefits that can be generated:
• The primary market (medium travel time): where journey times would be between 1½ and
2½ hours, thereby enabling people to make the return journey within a day. This is of benefit
for those travelling for both business and leisure. However, it is of particular significance for
business activity, helping to facilitate the process of doing business and means that less
productive time is lost whilst travelling. This is a noted benefit as a result of the introduction
of services between Paris and Lyon, which has seen an increase in trips from both places.
• Shorter distance travel: this consists of journeys less than one hour and reflects the potential
to develop high speed lines to facilitate commuting between large cities. This can be seen to
reflect other information which estimates that commuters are generally prepared to travel
between 40-50 minutes67. In France high speed services brought both Tours and Le Mans
within an hour of Paris. Whilst this did not appear to significantly increase the number of
people commuting to employment in Paris it altered travel behaviour by meaning those who
62
Vickerman, R (1997) “High-speed rail in Europe: experiences and issues for further development”, The
Annals of Regional Science 63
See Eddington, R. (2006) The Eddington Transport Study and Greengauge 21 (2006) High speed trains and
the development and regeneration of cities 64
Nash, C. (2008) High speed rail an overview of the literature, on behalf of Network Rail 65
SDG (2006) Air and Rail Competition and Complementarity. Final report. European Commission, DGTREN 66
COST318 (1996) Interaction between High Speed Rail and Air Passenger Transport: European Commission:
Directorate General of Transport. 67
Eddington, R. (2006) The Eddington Transport Study

July 2011 40
had spent Monday to Friday in the Paris commuted on a daily basis. Furthermore, the
number of business trips increased, meaning businesses benefitted by losing less productive
time when employees were travelling. Slightly in contrast the number of people commuting
to employment in Stockholm increased through the opening of the high speed line from
Ekilstuna to Stockholm. This travel market increased sevenfold, with the majority of users
having higher incomes68.
• Longer distance travel: this consists of those journeys that are over two and a half hours
whereby journey times mean that day returns are less feasible. The benefits that can be
generated through this have been discussed above.
The different markets that have been created in other parts of Europe can be seen to reflect
patterns that could be created in the UK through the Government’s currently proposed high speed
rail network. For example, this will bring Birmingham within an hour of London, whilst Leeds and
Manchester appear to fall more within the primary market.
3.3.4 Service patterns and not just the presence of a station require consideration
When advocating that certain places should have a station on the high speed network there is also a
need to give consideration to the level of service that these places will receive. Vickermann (2007)69
observes that this is an issue that can frequently be overlooked with emphasis focusing on the
provision of a service rather than the nature of what this service will be. He notes that when
developing a service pattern on high speed lines there are significant trade-offs involved between
places on the same line in terms of the service provided. Vickermann illustrates this point through
the example of Ashford’s services being reduced or stopped to Paris or Brussels when the station at
Ebbsfleet was opened. In this manner it is important to campaign not only for a stop for a particular
city as part of the high speed network, but for the required level of service to this place.
3.3.5 Station Location
The importance of locating stations in the most appropriate places has been documented in a
number of places70. This includes balancing the costs of creating links into city centres (and
potentially using a parkway station instead) against the benefits of bringing improved rail services to
these hubs of business activity. For example, Vickermann71 cites the example of the costs associated
with tunnelling required to provide a high speed service into Antwerp being viewed as offset by the
benefits that this would generate. Similarly, the location of the through station in Lille has helped to
generate additional commercial development in this central location.
68
Froidh, O. (2005) “Market effects of regional high-speed trains on the Svealand line”, Journal of Transport
Geography, nr. 13 69
Vickermann, R. (2007) “Indirect and wider economic impacts of high-speed rail”, Centre for European,
Regional and Transport Economics 70
Urban and Regional Policy (2009) Complementary measures to facilitate regional economic benefits from
High Speed Rail, report for Greengauge 21 and Albalate, D. and Bel, G. (2010) “High speed rail: lessons for
policy makers from abroad”, Research Institute of Applied Economics 71
Vickermann, R. (2007) “Indirect and wider economic impacts of high-speed rail”, Centre for European,
Regional and Transport Economics

July 2011 41
3.3.6 Scale and type of economic benefits that can be generated
The scale and type of economic benefits that can be generated by high speed is discussed in a
number of documents, however, a significant proportion of these documents do not quantify the
scale of the benefits created. Nonetheless, it is clear that in overall terms high speed is perceived to
have positive economic impacts on places, although the scale of this impact varies from place to
place dependent upon the specific circumstances experienced in the locality and is difficult to
predict72.
In broad terms the majority of economic impact studies of high speed rail suggest that it has
relatively modest economic growth impacts of less than 1% of overall GDP, although this can be as
high as 3% in the most affected region73. Whilst in percentage terms this may appear to be a small
amount in absolute terms this can represent a significant number, depending on the scale of GDP.
Furthermore, at certain stations or in particular regions that benefit the most from proposals
benefits can be much greater.
Meanwhile, specifically in terms of wider economic impacts some research has suggested that the
benefits of schemes do not generally exceed 10-20% of measured benefits74. However, these
benefits will vary from place to place depending upon the specific local circumstances and the
opportunities afforded by high speed. For example, some research on the impacts of a potential high
speed route in the Netherlands has shown that this could add 40% in wider economic benefits to
direct benefits75.
Factors that have been cited as important to determining the levels of benefits generated within
cities include:
• Cities where there is a higher proportion of people employed in the service sector are seen
to benefit the most or where there is a growing proportion of people employed in the
service sector;
• Cities that pursue a policy of making stations a wider hub for commercial activity; and
• Cities that have stronger local public transport networks that enable people to connect to
high speed services.
Specific research has been undertaken to understand how high speed can impact upon the levels of
commercial activity and increases in land values around stations. In some cases this has led to uplifts
in excess of 50% in commercial activity and land values in these areas76. Furthermore, it has also
72
Vickerman (2006) cited in Nash, C. (2008) High speed rail an overview of the literature, on behalf of Network
Rail and Greengauge 21 (2009) Early lessons from Kent 73
Preston, J., Larbie, A. and Wall, G. (2008) The Impact of High Speed Trains on Socio-Economic Activity: The
Case of Ashford (Kent). Cited in Greengauge 21 (2009) Early lessons from Kent 74
SACTRA (1999) cited in Nash, C. (2008) High speed rail an overview of the literature, on behalf of Network
Rail 75
Oosterhaven, J. and Romp, W. E. (2003) “Indirect Economic Effects of New Infrastructure: a Comparison of
Dutch High Speed Rail Variants”, Tijdschrift Economische en Sociale Geografie cited in Nash, C. (2008) High
speed rail an overview of the literature, on behalf of Network Rail 76
Greengauge 21 (2009) Early lessons from Kent
July 2011 42
generated benefits specifically for business tourism and conferences it has also led to a reduction in
the number of overnight stays business visitors, due to the increased ability to make return journeys
within a day77.
Research has also been undertaken to attempt to determine the extent to which the presence of a
high speed station will make companies choose to locate in a place. Different authors have reached
different conclusions on this issue, with some concluding that it does effect locational decisions78
and others that it does not79. Willigers (2006) research conducted on the Netherlands notes that
high speed can impact upon firms’ locational choice, however, this is in relation to specific
businesses, which have nationally and internationally orientated offices. Furthermore, this research
found that whilst having a high speed station was not a pre-condition of office location it was a
significant beneficial factor for the development of office locations. It was also considered more
widely to have a positive impact on the image of cities connected by high speed.
3.3.7 Intra-regional distributional impacts
It would appear that high speed rail can help to reinforce the position of major regional centres that
have a station on the network, as ell as those that have secondary links to it. Much of the research
undertaken on the benefits of high speed rail appears to demonstrate that the indirect effects can
be seen to be redistributed within a region. In this sense when significant new jobs are being created
in the area surrounding a high speed station it often appears to be as a result of them being
relocated from another centre in the same region, which does not experience the same level of
connectivity80. In this sense benefits have been considered to be distributive rather than generative
by some authors, although it is important to point out that, where a neighbouring city has good
transport links to a HSR network, they can also accrue economic benefits . For cities like Liverpool
and Bristol, this reinforces the point that improvements, particularly electrification, are needed to
their main lines to maximise the economic potential and contribution of a full HSR network.
This point is further illustrated by some research on the Netherlands that has shown that the growth
in employment around stations was largely as a result of intra-regional distribution effects81. The
accessibility effect of high speed rail for commuting was negligible and accessibility by train played a
smaller role than accessibility by car and bus/tram/underground transport systems.
This effect has also been described as spatial dualisation whereby selecting some places to be
connected to high speed services over others there can be a reorganisation of economic roles and
functions. This effect has been noted in regards to Lille and Valenciennes, where activity was
77
Albalate, D. and Bel, G. (2010) “High speed rail: lessons for policy makers from abroad”, Research Institute of
Applied Economics 78
Willigers, (2006) Impact of high speed railway accessibility on the location choices of office establishments.
PhD Thesis, University Utrecht, the Netherlands 79
Albalate, D. and Bel, G. (2010) “High speed rail: lessons for policy makers from abroad”, Research Institute of
Applied Economics 80
Kamel, K. and Matthewman, R. (2008) The Non-Transport Impacts of High Speed Trains on Regional
Economic Development: A Review of the Literature 81
Willigers, (2006) Impact of high speed railway accessibility on the location choices of office establishments.
PhD Thesis, University Utrecht, the Netherlands

July 2011 43
centralised towards Lille, the stronger regional centre, and away from Valenciennes82. However,
some research has highlighted that this effect is more prevalent in those places with shorter journey
times83.
In the UK the trend in economic growth in recent years has seen the large cities driving the success
of their hinterlands regions. As such high speed could contribute to the continuation of this trend.
Consequently, in order to help spread the benefits offered through high speed it appears to be of
particular importance to develop local transport networks so that other places can connect to the
high speed network and the opportunities it generates84. This means that stations act as public
transport hubs, with this being an important element of the success of places such as Lyon, Marseille
and St. Etienne85. In contrast the benefits of high speed were much lower in Mâcon, Le Creusot,
Montceau and Montchanin where the local transport network was not as strong.
In all cases, it is clear that a combination of factors is necessary for success. Growth opportunities, a
good local transport system, and access to agglomeration are all key components which are
reflected in the opportunities facing the Core Cities in the UK.
3.3.8 Conclusions from case study analysis
The available literature on international examples of high speed rail highlights how overall the
benefits of this infrastructure can be maximised, examples of this are set out in appendix A3.
However, there is relatively little information available that specifically quantifies the economic
benefits that can be generated through high speed networks. The information available suggests
that the benefits generated will vary between different places on the route, depending strongly on
local circumstances. This includes the location of the station, integration with the public transport
network and the policy approach to develop stations as commercial hubs. Furthermore, it is also
dependent upon the level of service provided by the network, the journey times generated and the
places connected by the network itself. Consequently, whilst it would appear that high speed rail can
have a positive impact, the scale of benefits created is influenced by a variety of variables.
In summary, international examples show that high speed rail typically:
• Pays for itself. The Tokyo-Osaka line opened in 1964, and the Paris-Lyon line in 1981. The
Japanese line reports that it long ago covered its construction cost through fares, and the French
line reports that it has also done this. AVE is the only part of the Spanish railway turning a profit.
82
See Burmeister, A. and K Colletis-Wahl (1996), ‘TGV et fonctions tertiaires: grand vitesse et entreprises de
service à Lille et Valenciennes’, Transports Urbains, 93 and SES (1998), Evaluation de l’impact du TGV Nord-
Européen sur la mobilité, Les Etudes du SES cited in Vickermann, R. (2007) “Indirect and wider economic
impacts of high-speed rail”, Centre for European, Regional and Transport Economics 83
Tym, R. (2002), ‘Economic performance and the high speed line: an ex-ante appraisal of the distributional
effects’, draft report for SRA summarising studies of impact of TGV in France cited in 84
Greengauge 21 (2006) High speed trains and the development and regeneration of cities 85
Albalate, D. and Bel, G. (2010) “High speed rail: lessons for policy makers from abroad”, Research Institute of
Applied Economics

July 2011 44
• Exceeds demand forecasts. Even though the main Japanese HSR line is only 3% of the total
network length, it carries 25% of all traffic. In the decade to 2004, passenger traffic of HSR in
France increased 62.5%, and passenger traffic between Frankfurt and Cologne increased 133%.
• Has significant economic and regeneration benefits. In Japan, cities like Yokohama have seen
huge developments around stations. Property values around stations have been estimated to
be 67% higher and cities connected to the line grow their population 22% faster and have 26%
higher growth in employment. In France, Lyon saw a 43% increase in office space around the
station after the HSR link to Paris opened and reports suggest land prices have risen by 35%.
Development at Lille’s station supports 6,000 jobs. High speed rail has created new commuter
cities, such as Vendome, where HSR reduced the travel time from 2hrs20 to 42mins. In Spain
Lleida, a city between Madrid and Barcelona, has experienced 15% increase in tourism and new
investment from high tech companies. Cities such as Ciudad Real have seen growth as
commuter cities, with an average of 1,000 homes built per year. In Germany the stations of
Montabaur and Limburg were added to the Frankfurt-Cologne line due to political pressure and
studies show they saw 2.7% increase in overall economic activity.
• Reduces the demand for car and aviation trips. From Paris-Lyon the rail share of trips rose from
40-72% when HSR was introduced. HSR now accounts for 97% of the air-rail market between
Frankfurt & Cologne. The Madrid-Seville line cut air travel by a third and car fell from 60-34%.
Along the Madrid-Barcelona line, once Europe’s busiest air route, the number of train
passengers now outnumbers air.
3.4 How many jobs could be created by high speed rail?
Previous work by Volterra found a strong relationship between accessibility and employment density
across London. The chart below shows this relationship for zones across London.
Figure 12: Accessibility ~ employment density relationship for London
Source: GLA Economics: Modelling Transport and the Economy in London, Volterra & Colin Buchanan, December 2007

July 2011 45
The recent KPMG work uses a similar premise to analyse the impact of HS2 on jobs. Network Rail
has provided us with passenger trip levels into the four largest non-London UK cities of Birmingham,
Manchester, Leeds and Sheffield for 2001-2010. As shown in figure 12, the growth in rail demand
has been very significant over the last decade. During 2010/11 despite the recession, data shows
that overall rail demand grew by 7.6%86. Furthermore, rail passenger miles on Britain’s network are
greater than at any time in the last 60 years on a passenger network of roughly three-fifths the size it
was in 195087.
Figure 13: Growth in rail passenger demand for various cities, 2001-2010
City Manchester Leeds Sheffield Birmingham
Growth in rail passengers
trips 2001-10 89% 92% 71% 60%
Source: Network Rail
Employment trends for the cities between 2001 and 2008 are shown in the table below.
Figure 14: Growth in employment for various cities, 2001-2008
City Manchester Leeds Sheffield Birmingham
Employment growth
2001-2008 4.8% 8.2% 7.1% 0.2%
Source: ABI, ONS
The chart below plots these two series against one another to consider the relationship between rail
travel growth and employment growth. The two series are very highly correlated (0.89) and the R-
squared from a simple linear model linking the two is also very strong.
86
1,353 million franchised journeys were made in 2010-11, a 7.6% increase from 2009-10. Office of Rail
Regulation (2011) Current National Rail Trends, Passenger Journeys 87
Transport Statistics Great Britain: 2009 edition, Department for Transport, November 2009, cited in HM
Treasury and Infrastructure UK (2010) National Infrastructure Plan 2010, page 10

July 2011 46
Figure 15: Growth in employment for various cities, 2001-2008
The capacity of the new High Speed Line depends on the amount of rolling stock and can be varied.
The current demand forecasts suggest usage of 240,000 trips per day. This could be an
underestimate. Without the trips, the jobs will have no economic rationale.
3.5 The benefits of additional capacity on the classic network
Key findings:
• With rail lines operating at close to capacity there is a need to generate a step change in that
available on railway lines in the country in order to facilitate economic growth.
• High speed rail will generate significant benefits for those places not directly served by high
speed rail by freeing up capacity on existing lines. This will be of benefit to places that do not
currently have direct links to London and will enable intermediate places, currently with a direct
service, to have access to a more frequent service.
• We estimate that the benefits of capacity relief on the WCML alone through move to more
productive jobs would range from £110m-£270m per annum in 2009 prices, equivalent to 60yr
NPV of £3.4-8.4bn, with a central scenario of £5.9bn.
3.5.1 Capacity
There are a number of line-speed improvement, electrification, rolling stock and capacity
enhancement schemes that can deliver incremental improvements in the short-medium term

July 2011 47
(discussed in chapter 4). These should be implemented in advance of high speed rail (which is a long
term project with 20-30 year delivery timescales) in order to deliver benefits early to the Core Cities
and facilitate maximum outcomes when the first phase of High Speed 2 is completed. It should be
recognised though that these improvements to existing lines will not provide the step change in rail
capacity needed to accommodate continued passenger growth over the long term.
As a result of rising demand for rail there is forecast to be a capacity problem in meeting demand on
existing lines. It is generally accepted that this will be a problem on the WCML first, as set out by
work by Network Rail88 that has shown by 2020 that the line will effectively be full. This work also
demonstrated that the Midland Main Line and the East Coast Capacity will each reach their effective
capacity for long distance services in the 2020s.
The WCML draft Route Utilisation Strategy (RUS) states that the London to Manchester route is
forecast to be the fastest growing long distance London market with passenger demand predicted to
increase by between 56 and 61% between 2009/10 and 2024/25.Similarly the London to Liverpool
market is projected to grow by between 52 to 58% during this time period. The draft WCML RUS
states that:
“As previously identified, the crowding issues worsen to 2024 and whilst there is the potential to run
an additional off-peak LDHS [long distance high speed] service and potentially a small number of very
fast commuter services during the peak, thereafter the WCML, particularly at the south end of the
route, is effectively full and any interventions will be disproportionately expensive compared with
the benefits gained. The RUS supports the development of the proposed high speed line.”89
(emphasis added)
On the ECML passenger journeys to and from London to Leeds and Newcastle are forecast to grow
by 44% and 22% respectively, between 2006 and 201690. Furthermore, passenger demand is set to
increase by more than 30% over the next 10 years on the MML from Derby, Nottingham and
Leicester to London91. Whilst there is scope for some capacity improvements on existing inter-urban
lines, this is unlikely to provide the step change required. Potential measures to increase capacity in
the medium term could include:
• Upgrading and electrifying the Midland Main Line from Bedford to Sheffield, which has been
shown to have a positive financial case over the appraisal period92; and
• Lengthening trains on suburban and on the ECML.
Over the medium to long term other interventions to improve capacity would be very expensive
and disruptive. The cost of the disruption caused by the upgrades to the WCML, completed in 2008,
is likely to have been significant due to the level of work required. A potential option would be to
use fares as a potential means of managing and suppressing demand. However, such an approach
of upgrading the classic lines to manage demand would be unlikely to facilitate overall economic
88
Ntework Rail (2009) New Lines Programme Capacity Analysis 89
Network Rail (2010) West Coast Main Line Route Utilisation Strategy, draft for consultation 90
Network Rail (2008) East Coast Main Line Route Utilisation Strategy 91
Network Rail (2010) East Midlands Route Utilisation Strategy 92
Network Rail (2009) Electrification Network RUS

July 2011 48
activity and subsequent growth and consequently fares will rise. Only with a step change in
capacity will it be possible to provide a range of fares, including affordable options.
The recently published Oxera report93 highlights that high speed rail would represent better value
for money than alternatives to upgrade the classic lines. This report examined the BCRs of
alternative rail packages for upgrading the classic lines as examined by HS2. These show that the
alternative two proposals for upgrading the classic lines named as Rail Package 2 (RP2) and
Scenario B represented lower value for money than high speed (although the assessment for these
two packages does not include the WEIS that would be generated. The Oxera report does raise the
question though “to what extent would demand management on the conventional network delay
the need for extra rail capacity?”. This reflects other work that has stressed that the rail sector
needs to move towards an approach based on “predict, manage and provide” rather than “predict
and provide”94.
A key benefit of high speed rail will be the opportunity it will create for using existing lines
differently and more optimally. This will be of benefits to places that do not currently have direct
links to London and will enable intermediate places to have access to a more frequent service.
Work by Greengauge95 has demonstrated how services on the WCML could be transformed
through the transfer of much of the longer distance demand from the conventional to the high
speed line. This work illustrates that services to most stations on the route can be transformed,
frequencies doubled and connections improved. For example, this could provide new direct London
services from Walsall, Shropshire and Mid and North Wales. We provide some high level
quantification of the benefits of this released capacity in the next section.
The creation of capacity on existing lines means that high speed rail can be of significant benefit to
those places that are not part of the proposed network but which currently have direct services to
London or to other Core Cities. It will be of particular importance to retain frequent long distance
services to these places as they will continue to require fast, frequent services to the capital. The
additional capacity can be used to provide good services to and between intermediate locations.
Many of these are important in their own right (i.e. Leicester, Wakefield, Doncaster, Chester, and
Preston), and some are planned to grow very significantly over the next 20-30 years (such as
Peterborough, Stevenage, or Milton Keynes). Some of these places are also important hubs for
local and regional rail networks, providing connections to other significant places.
3.5.2 Quantifying the benefits of capacity release through move to more productive jobs
As detailed previously, recent work by Greengauge96 suggests that the benefits from capacity release
on existing lines could be very significant. This work provides a very useful overview of the potential
capacity release which could be delivered on the existing WCML as a result of HSR.
93
Oxera (2011) Review of the Government’s Case for a high speed rail programme, prepared for the Transport
Select Committee 94
Rail Value for Money Study (2011), ‘Realising the Potential of GB Rail’, Summary Report, June, p. 48. 95
Greengauge21 (2011) Capturing the benefits of HS2 on existing lines 96
Capturing the Benefits of HS2 on existing lines, February 2011

July 2011 49
As detailed in section 2.3.2, the DfT’s guidance on move to more productive jobs (M2MPJ) is
designed to value the productivity benefits of existing workers being able to move into more
productive forms of employment as a result of transport improvements. This can occur if transport
constraints are removed on key commuting lines as a result of an investment in transport.
Using the Greengauge work, we have compiled the following list of services which could be
improved as a result of released capacity. We have only included pairs of places where the journey
time is less than 1hr so could reasonably be used for commuting purposes. These are all on the
southern part of the network so any benefits would be associated with HS2 from London to the
West Midlands rather than the Y network north of the West Midlands, where additional benefits are
also likely to be achievable through appropriate capacity release and timetabling.
DfT’s latest guidance suggests that M2MPJ should not be estimated without a detailed LUTI model in
order to model where economic activity would take place in different scenarios. We do not have
such a model, and so have had to make some high level assumptions about the extent to which
commuting would take place on these routes. We have made reasonable assumptions and have
considered a range of options, but in order to assess the extent of these benefits in line with
guidance, further analysis would be required. The results from this analysis are set out in the table
overleaf.
Figure 16: Potential capacity release on WCML as a result of HSR
Route Number of extra trains per hr
B'ham New St - Milton Keynes 1
Rugby – London 1
Northampton – London 2
Milton Keynes – London 6
Cheddington – London 1
Tring – London 2
Hemel Hempstead – London 1
Watford Junction – London 4
Harrow & Wealdstone – Clapham Junction 1
Wembley Central – London 2
Wembley Central - Clapham Junction 1
Source: Volterra, compiled from Greengauge work: Capturing the benefits of HSR on existing lines

July 2011 50
Figure 17: Estimated benefits through ‘Move to More productive jobs’ as a result of capacity release on
WCML as a result of HSR
(£m, 2009 prices)
Route
Extra
trains
per hr
Per annum productivity improvements 60 yr NPV
Min Central Max Min Central Max
B'ham New St -
Milton Keynes 1 5.7 7.3 9.0 174 225 275
Rugby - London 1 9.4 15.0 20.5 288 458 628
Northampton -
London 2 12.8 20.3 27.8 392 622 852
Milton Keynes -
London 6 21.2 41.2 61.2 649 1,262 1,874
Cheddington -
London 1 3.7 6.0 8.4 113 184 256
Tring - London 2 7.8 14.0 20.3 238 430 621
Hemel Hempstead -
London 1 3.9 7.0 10.2 119 215 311
Watford Junction -
London 4 18.3 34.7 51.2 559 1,063 1,567
Harrow &
Wealdstone -
Clapham Junction
1 6.8 9.1 11.5 207 280 352
Wembley Central -
London 2 13.0 22.5 32.0 399 689 979
Wembley Central -
Clapham Junction 1 7.0 14.0 21.0 215 429 644
Total 110 191 273 3,354 5,856 8,358
Using the DfT’s data on productivity across the four employment sectors of manufacturing,
construction, consumer and producer services, and appropriate minimum and maximum
commuting, we estimate that the benefits through M2MPJ would range from £110m-£270m per
annum in 2009 prices, equivalent to 60yr NPV of £3.4-8.4bn, with a central scenario of £5.9bn.
3.6 How will high speed benefit the Core Cities?
Key Findings;
• The proposed high speed rail network will benefit different cities in different ways, depending
upon the nature of their connection to the network.
• The Government’s proposals for the high speed network will help to strengthen the connectivity
between the Core Cities themselves, generating more integrated and powerful non-London
economic zones that could help to rebalance the national economy.
HS2 will bring the West and East Midlands within around 1 hour of London. This will transform the
competitive position of these cities as investment locations, because it will improve the access of

July 2011 51
firms to markets and other locations across the wider London and South East economy as well as the
West Midlands. In effect these cities could become powerful growth poles alongside London within
an expanded economic space, thereby helping to rebalance the economy. The international
evidence examined in this report supports the probability of this happening, that is, economic
benefits accruing to all cities on or connected to the network.
For Leeds, Manchester and Sheffield, the full Y scheme will bring London within 73-80 minutes. This
will make it far easier and more efficient for people to do a day’s business in London (and vice
versa). Meanwhile, Liverpool will be brought with 97 minutes of London through the use of classic
compatible trains. This improved access to London will improve the competitive position of these
cities as investment locations. While some have argued that it is possible to work on trains, and
sometimes to the same efficiency as in the office, the train is still much less flexible as a workplace
than an office, or the potential to meet colleagues and mix activities. However, travel by rail and
specifically high speed rail provides more productive time compared to car or air travel.
For Newcastle, the full Y scheme will provide a modest reduction in journey times to London,
although high speed compatible trains will provide direct services, and will also be needed to
improve journey times to Liverpool. However, it will provide a step-change in journey times to the
Sheffield City Region, and West Midlands. It will also provide far faster access to Heathrow and the
Crossrail corridor via the Old Oak interchange. There will also be benefits from capacity relief on the
existing East Coast Main Line.
The full Y scheme will help create more integrated and powerful economic zones outside London:
between Birmingham and Manchester and Liverpool, and between Birmingham the East Midlands,
Sheffield City Region and Leeds. Birmingham, Leeds, Liverpool, Manchester, Newcastle and Sheffield
will all benefit from capacity improvements on existing lines. This will benefit passengers travelling
to or from places not on the high speed network.
HS2 will also transform the national accessibility and competitiveness of Birmingham International
Airport, and the full Y scheme could also potentially transform the accessibility of Manchester and
East Midlands airports.
Whilst Bristol and Cardiff will not be part of the initial HS2 network, there would be benefits in terms
of improved links to the north of England. Journey times between Bristol and Derby, Yorkshire and
the North East on the eastern leg and Manchester and Liverpool on the western leg could be
reduced as a result of the introduction of HS2. It will be of particular importance to consider the
interchange and relationship between the conventional Cross Country services and high speed rail
services to ensure that the potential journey time savings are not lost through when travelling
between stations.
Edinburgh and Glasgow could benefit from very significant reductions in journey times to London
and the core cities in England providing that the high speed network is extended to these cities. This
would probably make rail highly competitive with the main London-Scotland domestic air services,
as demonstrated by a number of examples in continental Europe.

July 2011 52
4 The ongoing need for other transport investment
Summary
High speed rail will transform the time taken to travel between the main cities, providing additional
capacity on the rail network to overcome constraints on the existing lines. In order to maximise the
benefits of high speed it will be important to continue to invest in our wider transport networks to
both in preparation for the high speed network in 2032/33 to ensure integration with other
transport networks, and to ensure the full range of economic benefits arising from better transport
connectivity are realised.
The Government recognises that investment in transport is vital for economic competitiveness and
rebalancing the economy and, therefore, it has maintained expenditure in this sector. While
Government expenditure is expected to remain constrained in the short term, there should be more
monies available in the future for strategic economic investment in transport particularly after the
completion of the Crossrail and Thameslink projects.
In the interim prior to the commencement of high speed services to Birmingham in 2026 it will be
important to invest in improving the existing strategic rail network to reduce journey times,
improving connectivity on key routes. This will provide benefits after the commencement of high
speed services to places not on the high speed network. It will also help to lock in the benefits
offered by high speed by helping to minimise journey times to Newcastle and Liverpool, where high
speed services will run onto existing main lines to access these places.
There is a need to maintain and improve rail links to London, for example through the confirmed
electrification of the GWML, reducing journey times and improving reliability to Bristol, Cardiff and
the M4 corridor and the proposed upgrading and electrification of the MML, delivering substantial
benefits to Nottingham, Derby, Leicester and Sheffield.
There is also a need to improve rail connectivity between the Core Cities themselves, for example,
the electrification of the Liverpool to Manchester Line and the Northern Hub will help to reduce
journey times and increase the frequency of services between these two cities. Similarly, for
example, reducing journey times between Nottingham and Birmingham and Leeds and Manchester
has also been highlighted as a priority, and it is important to develop the plan to deliver these critical
economic projects.
The Core Cities contain significant concentrations of employment in high value sectors, which
benefit particularly from improved rail connectivity as it enable large volumes of people to commute
in and out during the morning and evening peaks to access employment from a wide catchment.
Better inter-urban and local transport networks will spread the benefits of high speed rail across the
city regions. Each city region/LEP area is likely to only have one or maybe two high speed stations. In
order to maximise the journey time savings created by the network it will be of central importance
for people to be have strong, local networks that will enable people to interchange to the high speed
services.

July 2011 53
Improving and integrating city region transport networks for example local rail services, tram-train,
light-rail and bus networks will be vital to enable Core Cities to realise their growth aspirations.
There are a number of challenges to be addressed in improving city region rail connectivity. This
includes increasing capacity, improving the quality of the service on offer, and the willingness of
commuters to use the rail network.
4.1 The importance of continuing to invest in the strategic rail network
alongside high speed rail
Key findings:
• High speed rail represents a long term solution to the capacity constraints in the UK as even the
“Y” shaped network is not expected to be complete until 2032/33. It is clear also that a plan
needs to be developed for extending the high speed network beyond Leeds and Manchester to
the North East, Liverpool and Scotland.
• In the interim period it will be important to invest in improving the existing strategic rail network
to reduce journey times, improving connectivity on key routes. This will also provide benefits
after the commencement of high speed services to those places not on the high speed network.
It will also help to maximise the benefits offered by high speed by helping to minimise journey
times to Newcastle and Liverpool, where high speed services will run onto existing main lines to
access these places.
With the first phase of HS2 scheduled to open in 2026 and the high speed eastern and western
routes between the West Midlands and Leeds and Manchester projected to be operational by 2032-
33 it is clear that investment in high speed rail is a long term solution to the capacity and
connectivity problems in the UK, and will help to stimulate growth and create a more competitive
economy. It is a project that will address some of the long standing issues of relatively poor links
between some of the largest cities in the country. Consequently, in the short to medium term there
will be an ongoing need to invest in conventional transport alongside high speed rail to deliver
benefits prior to 2026.
The proposed network development plan for HS2 means that in order to connect to cities beyond
Birmingham in Phase 1 high speed services will need to use the conventional lines such as the
WCML, MML and ECML as an interim solution. It will be important to ensure that these main lines
are able to maximise the opportunity provided by a through connection to the high speed network.
The introduction of high speed rail will also create significant capacity relief on existing conventional
lines. This can be used to benefit those places not directly served by high speed rail, for example by
enabling more frequent services. It will be important to continue to invest in these lines, for example
upgrades or electrification, to deliver improvements in the short to medium term, and to also lock in
and maximise the capacity benefits from high speed rail over the longer term. The capacity created
on existing lines such as the WCML, ECML, and MML is also important in light of the projected levels
of growth in the Core Cities. The additional capacity created on these lines could be particularly
important to these places, which are expected to experience exponential levels of growth.
July 2011 54
As high speed rail will only connect directly to a small number of places it is important to ensure that
the existing routes continue to provide services to those places that will not be on the high speed rail
network, or where the benefits from HS2 will be modest. In particular the existing long distance
routes to London will remain important. In cities such as Bristol, Cardiff, Liverpool and Newcastle,
existing routes will need to be maintained and improved, as appropriate, to facilitate their respective
economic growth.
Improvements needed to existing routes include electrification. Electrification is committed for the
Manchester-Liverpool route, and the Great Western route between Cardiff, Bristol and London.
There is also a particularly strong business case for electrification of the Midland Main Line, and the
Transpennine routes. Electrification provides capacity, performance and journey quality
improvements and carbon savings. It also reduces significantly the operational cost of rail routes.
Indeed the electrification RUS states that the operational cost savings of electrification of the
Midland Main Line would be greater than the capital costs over a standard 60-year appraisal period.
Conventional rail will continue to play an important function in linking major urban centres outside
London. Improving the rail links between cities offers the potential to create more powerful non-
London economic zones. Currently, some of the rail links between the Core Cities are affected by
relatively slow journey times. Improving these journey times could have a significant impact on
economic productivity. Whilst high speed may help to fulfil this function on some corridors, in others
it conventional lines will be of greater use in generating these benefits. Work completed on the
benefits of reduced journey times between Manchester and Leeds shows the importance of the role
that conventional rail will continue to play in linking the Core Cities’ economies together.
The benefits of improved connectivity between Leeds and Manchester
The scale of the potential benefits that could be generated is demonstrated in relation one corridor
by the work undertaken by the Northern Way97 in relation to the Leeds Manchester corridor. This
work concluded that commuting between Local Authority areas in the Manchester City Region and
Local Authority areas in the Leeds City Region is about 40% less than might be expected given the
physical proximity of the two cities. The work found that that closer integration between
Manchester and Leeds could be expected to have a positive effect on wages. The largest estimate,
for a 20 minute reduction to rail journey times between Leeds and Manchester, was that average
wages would increase by between 1.06% and 2.7%.
The work found that (assuming 2006 prices and a discount rate of 3%), a 20 minute reduction in
train journey times between Manchester and Leeds would be worth £6.7 billion across the whole of
the north of England (assuming benefits persist indefinitely) of which £2.7 billion would accrue to
the two city regions. This is in addition to conventional transport benefits.
The work found that the effects on Manchester and Leeds will be bigger if policy interventions, such
as improved transport links, induce structural change, particularly by changing the composition and
skills of the workforce.
97
Strengthening Economic Linkages Between Leeds and Manchester: Feasibility and Implications, Northern
Way, 2009.

July 2011 55
Investment in this cross pennine corridor will also have wider benefits for trains to Manchester
Airport, and for cross country services, both providing important links between the Core Cities.
These links are in critical need of investment to improve journey times and reliability and, help
enable the Core Cities to maximise their economic potential and contribute more to the UK
economy.
Investing in high speed does not negate the need to make improvements to existing lines. In fact in
order to maximise the benefits of the high speed rail and to ensure that the Core Cities benefit from
these proposals it is vital to see them as complementary propositions rather than an either / or
scenario. This means that in the short to medium term it will be important to continue to invest in
rail as part of a strategy for the wider rail network; of which high speed rail would be an element.
Even when high speed services are operational the classic lines will continue to serve an important
function and the integration of both types of services will be instrumental in maximising the
potential benefits that can be generated.
Figure 18: Areas in the strategic rail network for investment to unlock economic growth in the Core Cities
Major Transport Hubs Electrification Other Improvements
• Birmingham New Street
Station Gateway;
• Leeds Hub; and
• Northern Hub.
• Great Western Main Line
• Liverpool to Manchester
Line; and
• Midland Main Line; and
• Transpennine North.
• Chiltern Line;
• East Coast Main Line;
• Nottingham to Leeds route
(via Sheffield);
• Transpennine South; and
• West Coast Main Line
4.2 The need to maintain and improve city region rail networks
Key findings:
• That the Core Cities contain significant concentrations of employment in high value sectors,
which are concentrated within their city centres.
• These sectors benefit particularly significantly from improved rail connectivity as it can support
high densities of travel, enabling large volumes of people to commute in and out during the
morning and evening peaks to access employment. Improving this rail network can play a vital
part in extending the potential labour market to support a city’s economy.
• There are a number of challenges to be addressed in improving city region rail connectivity. This
includes increasing capacity, improving the quality of the service on offer, and the willingness of
commuters to use the rail network.
July 2011 56
Successful Core City economies rely upon significant concentrations of high value activities in their
central areas. In particular strengths in financial and business services, company headquarters,
government, creative and cultural industries and research and innovation in fields such as education
and medicine (often connected to the presence of universities) are particularly important in
facilitating economic growth and change. These sectors have become increasingly important
determinants of successful cities as a result of economic restructuring to a more knowledge-based
economy. Consequently, the growth of these sectors has led to a growth in employment in city
centre locations, where the ongoing need for face-to-face interaction required in order to do
business is facilitated by the high density of jobs, development, and business activity. These city
centre functions, particularly in areas such as research, science, design, finance and business
services, have important synergies with advanced manufacturing sectors in the surrounding areas.
A main strength of rail as a mode of transport is that it can support growth in the service sector and
knowledge based industries, which are concentrated in relatively small geographic areas, such as city
centres. The rail network can support high densities of travel: rail can enable large volumes of
people to commute in and out during the morning and evening peaks to access employment. In
2009/10 there were in excess of 160 million entries, exits and interchanges at the rail stations in the
Core Cities98. Rail networks enable businesses to access wider pools of skilled labour, which is
essential in supporting business clustering and growth, and can be act as a significant asset when
attracting new inward investment.
Good rail connectivity has been instrumental in supporting the economic interactions between
London and towns in its wider mega city region. Gordon (2001)99 states that:
“The extended (South East) region now represents the effective territory within which
businesses , and people, can benefit from key agglomeration economies associated with a
leading international metropolis. One important aspect of this is the ability to access rapidly
central London as a locus for interaction, specialised services, decision-making and
intelligence, via the regional rail network.”
Various studies (Case for Rail100, Regional Futures101, POLYNET) have considered the role of rail in
supporting economic interactions in the London and South East mega city region. London is at the
heart of a growing “mega city” region with a population of 18.6 million, and stretching as far as
Swindon, Northampton, Peterborough, and Bournemouth. The driver for the economy of this mega
city region is the concentration of activity in central London in the key “world city” sectors of
financial and business services, government and corporate headquarters, creative and cultural,
tourism, and major public services such as education and healthcare. All these activities
simultaneously cater for local, national and (in some cases) international (export) markets.
As these sectors have grown, more routine activities have been displaced into other smaller centres
within the same polycentric “mega-city region”. For example, in and around London, business
98
Office for Rail Regulation, Station Usage Data, 2009/2010 data 99
Developments in London’s Regional Hinterland During the 1980s and 1990s, Ian Gordon, in London –New
York Study, 2001. 100
Everyone’s Railway, The Wider Case for Rail, SRA 101
Regional Futures: England’s Regions in 2030?, Arup with OEF, 2005

July 2011 57
services like law and accountancy show strong growth of globalised multi-locational firms in the
centre. Smaller firms locate and thrive in smaller towns where rents and salaries are lower,
successfully catering both for local demand but also for a London clientele.
Outside the M25, 50 towns have been identified (as part of the POLYNET study) as forming
“Functional Urban Areas” with populations of 70,000 to 300,000. These have shown consistent and
strong growth in the recent decades. Restrictive land use planning policies have kept them physically
separate, but they have become functional interdependent, supported by good rail connections
which enable commuting and also business travel. These policies have also progressively restrained
growth nearer to London, effectively diverting it to more distant towns and cities (although most
within a 1 hour rail travel time radius of the capital). These types of relationships are particularly
strong in the M4 / Western Wedge corridor, extending as far as Bristol (see Arup Western Wedge
Study102, and Thames Valley and South West RPA).
This example of the South East would reflect the importance of developing strong local commuter
networks. This raises question surrounding what extent could improved city region rail networks
have similar effects in spreading the benefits of the concentrations of high value economic activity
from the centre of the Core Cities across the surrounding city regions? Being able to spread these
benefits across the city region LEP areas will be particularly important in maximising the benefits and
opportunities afforded by high speed rail.
Research103 has shown how cities like Bristol and Leeds appear to be developing in a manner similar
to the London and the South East Mega City Region, albeit on a smaller spatial scale. This has set out
how these two cities appear to be following a similar trajectory to London with an expanding
economy, demonstrating particular strengths in knowledge–intensive services, and unemployment
improvement, coexisting with workers living increasingly further away. Consequently, growth in
Bristol and Leeds has occurred in these cities’ centres, but also outside of them, reflecting how the
growth of the city helps to stimulate growth in the wider city region. This can be seen to reflect
broader research findings that have stressed that “there was no example of a successful region
which did not have a successful city at its core"104.
In continuing to develop and improve their commuter (or city region) networks the Core Cities face a
number of challenges, some of which can be seen to go beyond the parameters of the transport
network; instead reflecting social and cultural values and the attractiveness of the city to external
investors:
• Capacity: the capacity of the rail network and its ability to be able to meet the projected
increase in demand from a rising number of passengers. For example, the recently published
Northern Route Utilisation Strategy (RUS)105 forecasts that passenger growth into the cities of
102
Arup Economics and Planning (2002) The Western Wedge: Spatial Development Strategy Technical Report
Fourteen 103
Chen, C.L. and Hall, P. (2009) The Impacts of High-Speed Trains on British Economic Geography: A Study of
the UK’s IC125/225 and its Effects, University College London 104
ODPM (2004) European Cities: where do the Core Cities Stand 105
Network Rail (2011) Northern Route Utilisation Strategy

July 2011 58
Leeds, Liverpool, Manchester, Newcastle and Sheffield by 2024 could be as much as between 41
and 52 per cent, increasing to between 56 and 66 per cent in 2029.
• Accessibility: the use of light rail and rapid transit bus systems can help to encourage modal shift
to public transport, by making it easier for commuters to access these services, and bypassing
capacity bottlenecks on conventional rail networks.
• Quality of the service on offer: the quality of the service provided on the rail network can be a
significant determinant affecting the number of people choosing to use the service. Included
within this can in part be the reliability of services, which is acknowledged106 as increasingly
important to users, and the rolling stock used to operate the services.
• Linking sectors in primary and secondary places: strong transport links between primary and
secondary places within functional, economic areas can help to develop the growth of
businesses in the same sector found in both places.
• Willingness of commuters to use rail services: whilst this may in part be linked to the previous
point the ability to encourage people to use transport is likely to be dependent upon a large
number of factors including affluence and wider social and cultural factors.
• General attractiveness of cities to invest in: a large number of factors will influence the decision
of companies on which cities to invest in. Whilst good inter and intra transport links ca act as a
significant positive attractor in this area, it is not the only determinant. As such having the wider
conditions in place to encourage growth, will be required in addition to improved local transport
networks.
Fundamentally, having in place strong local transport networks can help to support the growth of
cities through providing them with access to a wider pool of labour and by creating productivity
benefits through the generation of reduced journey times. Research has demonstrated that up to
25% of the potential benefits of major transport investments in Leeds City Region go un-counted by
the Department for Transport.
106
Eddington, R. (2006) The Eddington Transport Study

July 2011 59
4.3 Insights for the Core Cities
Key findings:
• There appeared to be broad consensus between the Core Cities on the need to improve
connectivity to facilitate economic growth. This highlighted the need to improve international,
national, regional and local connectivity, to provide access to markets and facilitate local
commuter networks.
• There is a need to improve access to airports in the city regions to enable access to international
markets. In Manchester the Metrolink extension will connect to the Airport and there are plans
to extend Birmingham’s Metro to the Airport.
• There is a need to maintain and improve rail links to London, for example through the confirmed
electrification of the GWML, reducing journey times to Bristol and Cardiff plus the proposed
upgrading and electrification of the MML to provide capacity and journey time improvements to
Nottingham and Sheffield.
• There is also a need to improve rail connectivity between the Core Cities themselves, for
example, the electrification of the Liverpool to Manchester Line and the Northern Hub will help
to reduce journey times and increase the frequency of services between these two cities.
Reducing journey times and improving capacity, including electrification, between Leeds and
Manchester and across the wider transpennine network is as a priority. Improvements and
potential electrification of the cross-country network are needed. There is also a need for
improvements to the Leeds-Sheffield-Nottingham route, and the Nottingham-Birmingham route,
both of which are particularly slow currently.
• Improving and integrating local commuter networks for example local rail connectivity, tram-
train, light-rail and bus networks will be vital to enable Core Cities to realise their growth
aspirations. For example, the reinvigoration of the Metro in Newcastle will help to improve local
rail connectivity.
An analysis of the different transport priorities of the Core Cities individually highlights broad trends
in the need to improve international, national, regional and local connectivity. This can be seen to be
a common factor across all of the eight Core Cities reflecting the different pressures and issues that
need to be balanced when developing strategies for managing transport issues within different
places.
A recurrent priority across the majority of the Core Cities was the need to improve international
connectivity, primarily through strengthening the role fulfilled by the respective local airports. Good
international connectivity is important for the economic competitiveness of Core Cities. The rail
network and light rail routes also play an important role in providing access to airports outside
London, widening their market catchments. The largest of these airports, Birmingham and
Manchester, are on existing main rail routes (the Metrolink light rail system is also being extended to
Manchester airport). Other airports such as East Midlands and Liverpool John Lennon can be
accessed by rail via short bus transfers from parkway stations on main routes. Newcastle airport is
July 2011 60
on the Tyne and Wear Metro system. Improving the bus routes to Bristol, Leeds-Bradford, and
Doncaster-Sheffield airports are important priorities. There is also scope to serve Leeds-Bradford by
tram-train in the future. Birmingham International will be on the HS2 network and there are long
term plans to extend the Metro to improve connectivity between Birmingham city centre and the
airport. Manchester Airport could be served by the second phase of HS2.
Whilst widening access to non-London airports and expanding the range of destinations they serve is
important, access to London’s airports (particularly Heathrow) and St Pancras for the rail services to
continental Europe is important. HS2 will transform accessibility from the core cities to these main
London international gateways.
At a national scale there was clear trend in the Core Cities that acknowledged the need to improve
conventional rail links between the Core Cities themselves and London. This specifically focused on
the need to reduce journey times and potentially increasing the capacity and frequency of services.
The confirmed electrification of the Great Western Main Line for example, will help to reduce
journey times between Bristol and the capital.
The relatively slow journey times entailed in travelling between some of these Cities means that
places which are fairly close together are functioning as separate economic spaces. By reducing
these journey times there is potential to strengthen economic zones outside of London, for example
between Liverpool and Manchester (which will be improved by the electrification of the line), or
Leeds and Manchester (see box on page 50), or Edinburgh to Glasgow, Leeds - Sheffield -
Nottingham, or Birmingham and Nottingham. Reducing journey times to the Core Cities from
Newcastle could help to increase its economic proximity. Meanwhile, the Northern Hub represents
an important opportunity to increase capacity in the rail network in Manchester and across the
north of England. This will help to reduce journey times, increase service frequency and improve
access to the Airport. This will include providing benefits to the services between Liverpool and
Manchester and Leeds and Manchester. Electrification to Bristol and onwards to Cardiff is agreed
and significant investment is being made at Reading.
For example the corridor between Leeds, Sheffield and Nottingham has a population of over 6
million and over 3 million jobs, but a rail service between Leeds and Nottingham via Sheffield which
takes almost two hours for a 70 mile journey (an average speed of 36 mph). In contrast, the
“Western Wedge” corridor between the London – Reading – Swindon, which operates as an
integrated economic space, is a similar distance but with an end to end rail journey time of less than
an hour.
The need to maximise the role of stations as Gateways to the city, is a priority that comes across in
relation to many of the Core Cities. Included within this is the potential role that stations can play as
centres of economic commercial activity and in stimulating regeneration in the surrounding area.
Furthermore, there also appears to be a need in many of the cities to continue to develop the role of
the Railway station as a hub for other modes of transport. The redevelopment of Birmingham New
Street acts as a good example for these plans to enhance the role of railway stations as gateways
and hubs. It is estimated that these proposals will create over 10,000 jobs locally and will generate
over £2bn in transport and wider economic benefits for the region.

July 2011 61
Whilst in all cities emphasis is being placed on encouraging modal shift, the need to address
congestion, particularly on the strategic highways network, is a significant challenge for the Core
Cities. This is often a particularly acute challenge where local and strategic flows interact around
cities. This requires a more sophisticated approach to addressing congestion through the use of
measures such as intelligent transport systems and demand management. There may also be a need
in some places for targeted approaches to increase capacity and improve the performance of the
road network. For example, the need to manage demand on key junction on the A1 around
Newcastle is set out in the city’s emerging Joint Core Strategy. Similarly addressing congestion on
the A453 in Nottingham is a priority for the city.
In each of the Core Cities there were a number of measures set out to improve the performance of
the local commuter network. As set out in section 4.2, improving local commuter networks can
generate economic benefits for cities by extending the potential labour market that firms have
access to and by generating productivity savings for businesses. The broad types of interventions put
forward to improve local commuter networks within the Core Cities are discussed below.
• Developing a coherent long term integrated strategy for strategic rail links and local feeder rail
and public transport networks. There is a need for cities to work with rail bodies to develop a
comprehensive strategy for improving capacity, speeds and quality of strategic inter-urban rail
services, and local feeder rail and public transport networks. This will require a holistic
assessment of the barriers to improvements, particularly capacity constraints, and the
opportunities for better services and market growth on main corridors. This should also include
considering the implications of high speed rail. If high speed rail stations are separate to existing
main rail stations (even if they are fairly nearby), as is proposed for Birmingham, it will be critical
there are good transit links between the two stations.
• Strengthening the role of stations as main gateways, aligning land-use and regeneration
strategies. The example of the regeneration at the main stations on HS1, and the emerging
proposals for the land around Birmingham Curzon Street (the proposed HS2 station)
demonstrate the potential for regeneration around high speed rail stations. There are several
successful examples of the creation of new hubs of economic activity around stations in the core
cities. For example, the Temple Quay scheme in Bristol, the Capital One office complex in
Nottingham, and the Digital Campus in Sheffield. High quality public realm and good pedestrian
links to the wider city centre are important.
• Achieving a step change in bus connectivity on key corridors through the use of measures such
as priority measures or bus rapid transit (BRT) schemes; to help to reduce journey times and
encourage the use of this mode. This takes different forms in different cities with Birmingham,
Bristol, and Sheffield all proposing BRT routes in key corridors across each city and New
Generation Transport in Leeds.
• Developing tram and light rail routes, including tram-train, to provide access to the modes to a
larger number of people, to enable them to benefit from the journey times savings that these
modes can create. The delivery of NET phase 2 in Nottingham will mean that nearly 30% of the
Greater Nottingham population will be within 800 metres of a tram stop, whilst long-term
aspirations for NET phase 3 will extend routes into different parts of the city. The completion of
July 2011 62
the extensions to Manchester Metrolink will mean that the city has the largest tram network in
the country. Meanwhile, the Metro Reinvigoration programme will improve the operation and
infrastructure of Newcastle’s Metro system, including refurbishing stations and purchasing new
rolling stock. In the medium to long term exploring the potential for tram train, will represent an
important means of improving connectivity and accessibility and will represent a mechanism for
freeing up additional capacity on the rail network, particularly at bottlenecks on the approaches
to the main stations.
• Improving the capacity, quality and access to the network of conventional rail, to provide a
more attractive journey choice for passengers. The Northern Hub project and capacity
improvements to Leeds Station are examples of where there are important mechanisms to
increase capacity on local services. There is also a need for improvements at Liverpool Lime
Street to increase capacity. On some services there is also a need to improve quality for example
on the Caldervale Line between Leeds and Manchester. Bristol has identified the need to
improve local rail services to minimise interchange with the strategic network.
• Improving opportunities for walking and cycling within the Core Cities. This will represent an
important means in all cities of reducing carbon emissions, by facilitating the use of sustainable
modes of transport.
This range of measures have been put forward by the Core Cities will help to address the transport
challenges being experienced in each area. Whilst the nature of these proposals obviously varies
between places, it is clear that are broad trends in the types of challenges being faced and thus the
solutions that can be implemented to address these issues. Transport priorities for each of the Core
Cities are provided in appendix A4.
In order to maximise the benefits of these different schemes it will be important to ensure that
local strategies are aligned, including economic development and land use, with wider transport
(and rail) policies. Furthermore, particularly in light of the current fiscal climate, it will be important
for these documents to adopt a clear approach to the phasing of delivery to ensure that the right
priorities are delivered in the appropriate order and timeframe to meet the desired objectives for
the city.

July 2011 63
Appendix A
A1 Forecasts for rail growth by city
A.1.1 Overview
A new report by Oxford Economics 107 based on previous forecasts for the Core Cities LEP areas,
shows that rail journeys into the Core Cities are predicted to increase by between 47% and 70%
through the use of their baseline and upper growth scenarios. This appendix provides a breakdown
of how this level of growth will be distributed between the Core Cities.
Figure 19: Percentage change in daily business and commuting journeys, Core Cities (all stations), 2010 -
2030
% avg % pa % avg % pa
Birmingham 40 1.7 61 2.4
Bristol 80 3.0 107 3.7
Leeds 52 2.1 75 2.8
Liverpool 36 1.5 57 2.3
Manchester 50 2.1 73 2.8
Newcastle 55 2.2 79 2.9
Nottingham 54 2.2 79 3.0
Sheffield 77 2.9 101 3.5
Core Cities 47 2.0 70 2.7
UpperBaseline
Source: Office for Rail Regulation, Oxford Economics
Figure 20: Core City estimates of share of workers commuting by rail
Census OE
Birmingham 5.3 6.7 8.6 10.4 12.0
Bristol 1.7 1.2 1.9 2.9 3.7
Leeds 3.5 3.2 4.5 5.8 7.0
Liverpool 7.3 5.1 8.7 10.0 11.1
Manchester 6.4 3.8 5.8 7.0 8.0
Newcastle 1.8 0.9 1.2 1.8 2.3
Nottingham 1.6 0.7 1.1 1.6 2.0
Sheffield 1.2 1.1 1.9 2.9 3.9
Core Cities 3.2 3.4 4.8 6.0 7.1
20302001
2011 2021
Source: Census, Oxford Economics
107
See Oxford economics (2011) Rail Transport Forecasts: Core Cities

July 2011 64
A.1.2 Birmingham
0
10
20
30
40
50
60
70
80
1991 1995 1999 2003 2007 2011 2015 2019 2023 2027
Upper
Baseline
Birmingham: Daily rail commuters
Source: Oxford Economics, ORR
000s
Forecast
0
5
10
15
20
25
30
35
1991 1995 1999 2003 2007 2011 2015 2019 2023 2027
Upper
Baseline
Birmingham: Daily rail business travellers
000s
Forecast
Source: Oxford Economics, ORR

July 2011 65
A.1.3 Bristol
0
2
4
6
8
10
12
14
1991 1995 1999 2003 2007 2011 2015 2019 2023 2027
Upper
Baseline
Bristol: Daily rail commuters
Source: Oxford Economics, ORR
000s
Forecast
0
1
2
3
4
5
6
7
8
9
1991 1995 1999 2003 2007 2011 2015 2019 2023 2027
Upper
Baseline
Bristol: Daily rail business travellers
000s
Forecast
Source: Oxford Economics, ORR

July 2011 66
A.1.4 Leeds
0
5
10
15
20
25
30
35
40
1991 1995 1999 2003 2007 2011 2015 2019 2023 2027
Upper
Baseline
Leeds: Daily rail commuters
Source: Oxford Economics, ORR
000s
Forecast
0
5
10
15
20
25
1991 1995 1999 2003 2007 2011 2015 2019 2023 2027
Upper
Baseline
Leeds: Daily rail business travellers
000s
Forecast
Source: Oxford Economics, ORR

July 2011 67
A.1.5 Liverpool
0
5
10
15
20
25
30
35
40
1991 1995 1999 2003 2007 2011 2015 2019 2023 2027
Upper
Baseline
Liverpool: Daily rail commuters
Source: Oxford Economics, ORR
000s
Forecast
0
5
10
15
20
25
30
35
40
45
1991 1995 1999 2003 2007 2011 2015 2019 2023 2027
Upper
Baseline
Liverpool: Daily rail business travellers
000s
Forecast
Source: Oxford Economics, ORR

July 2011 68
A.1.6 Manchester
0
5
10
15
20
25
30
35
40
1991 1995 1999 2003 2007 2011 2015 2019 2023 2027
Upper
Baseline
Manchester: Daily rail commuters
Source: Oxford Economics, ORR
000s
Forecast
0
5
10
15
20
25
1991 1995 1999 2003 2007 2011 2015 2019 2023 2027
Upper
Baseline
Manchester: Daily rail business travellers
000s
Forecast
Source: Oxford Economics, ORR

July 2011 69
A.1.7 Newcastle
0
1
2
3
4
5
6
1991 1995 1999 2003 2007 2011 2015 2019 2023 2027
Upper
Baseline
Newcastle: Daily rail commuters
Source: Oxford Economics, ORR
000s
Forecast
0
1
2
3
4
5
1991 1995 1999 2003 2007 2011 2015 2019 2023 2027
Upper
Baseline
Newcastle: Daily rail business travellers
000s
Forecast
Source: Oxford Economics, ORR
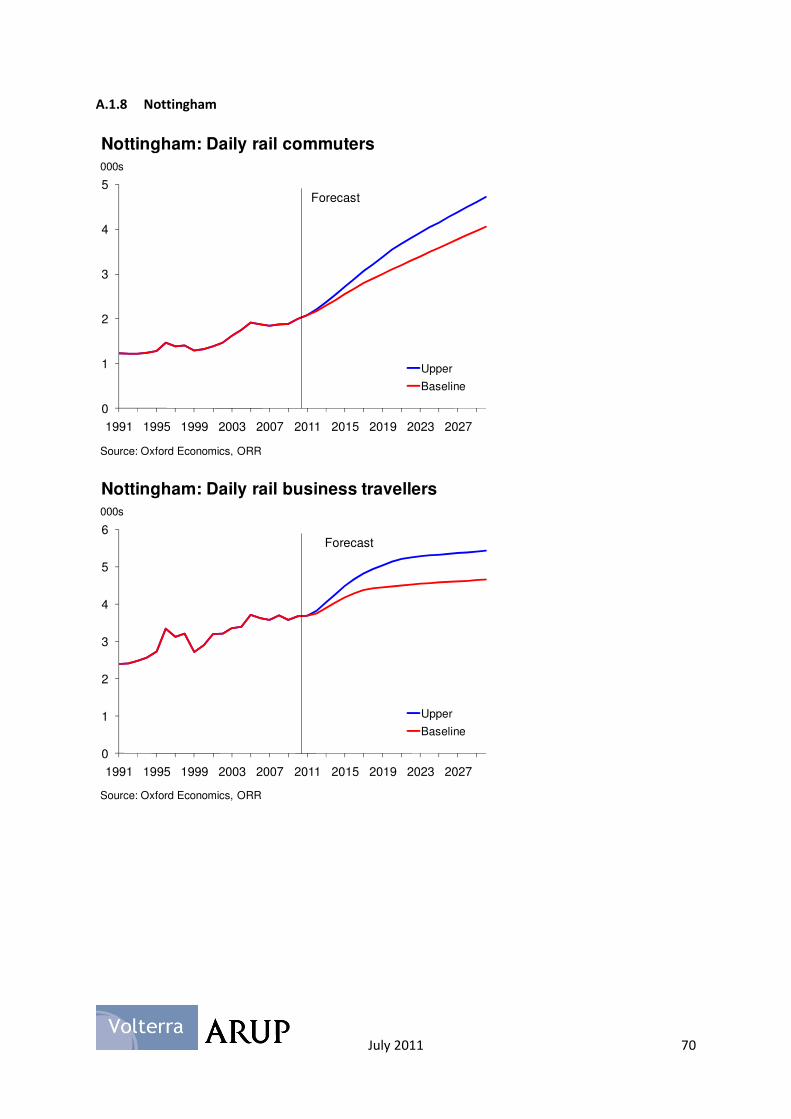
July 2011 70
A.1.8 Nottingham
0
1
2
3
4
5
1991 1995 1999 2003 2007 2011 2015 2019 2023 2027
Upper
Baseline
Nottingham: Daily rail commuters
Source: Oxford Economics, ORR
000s
Forecast
0
1
2
3
4
5
6
1991 1995 1999 2003 2007 2011 2015 2019 2023 2027
Upper
Baseline
Nottingham: Daily rail business travellers
000s
Forecast
Source: Oxford Economics, ORR

July 2011 71
A.1.9 Sheffield
0
2
4
6
8
10
12
14
1991 1995 1999 2003 2007 2011 2015 2019 2023 2027
Upper
Baseline
Sheffield: Daily rail commuters
Source: Oxford Economics, ORR
000s
Forecast
0
1
2
3
4
5
6
7
8
9
1991 1995 1999 2003 2007 2011 2015 2019 2023 2027
Upper
Baseline
Sheffield: Daily rail business travellers
000s
Forecast
Source: Oxford Economics, ORR

July 2011 72
A2 Evaluation of transport investment in the UK
A.2.1 Overview
In the UK, in order to evaluate the benefits of transport infrastructure we use a combination of
standard transport benefits and wider economic impacts (WEIs) . Standard transport benefits value
capacity relief, time savings, reliability, frequency, safety etc. In addition to this we have the WEIs
guidance which estimates the additional positive impact that transport can have upon businesses
and labour markets in terms of increased productivity. These benefits are then set against the costs
of delivering the investment to arrive at a benefit-cost ratio which can be used to determine the
value for money of investment options.
A.2.2 Wider Economic Impacts
The WEIs methodology was developed with the specific focus of considering the economic benefits
of Crossrail, the east-west cross-London commuter rail scheme. It is primarily designed to capture
the productivity benefits of (a) people being ‘effectively’ closer together and (b) enabling existing
workers to work somewhere else, where they would be more productive. These are the largest two
elements of WEIs, but there are also two further elements which consider the ability of transport to
increase competition in markets and also its ability to deliver benefits to consumers as a result of
increased production in imperfectly competitive markets. We discuss each of these elements of
WEIs in turn.
Pure agglomeration
The first of these impacts (people working closer together) is called ‘pure agglomeration’ in the
guidance and is the term given to the growth in productivity of existing workers as the effective
density of employment around them increases. Effective density is a measure of employment
density, transformed by the distance between places. For example if one city has 100 people and
another has 50 people, and they are 30 minutes apart, if they become only 20 minutes apart but still
have the same numbers of people, then they both become ‘effectively’ denser.
This denser employment leads to higher productivity, which is achieved through larger labour pools
and additional suppliers and clients, which lead to greater competition between firms and more
opportunity for specialisation. A clear example of the effects of agglomeration can be seen in the
levels of innovation of businesses in city centres and the higher prices that companies are willing to
pay to locate in these prime, accessible locations.
The productivity benefits through pure agglomeration are captured by applying an elasticity of
productivity with respect to employment density to the change in effective density created by the
transport investment. An elasticity measures how one thing changes in response to change in
something else, or in this case, how productivity changes in response to change in effective density.
Move to more productive jobs
The second of these impacts is intuitively titled ‘move to more productive jobs’ in the guidance. This
values the productivity benefits of existing workers being able to more into more productive forms
July 2011 73
of employment as a result of the transport improvement. In order to estimate any benefits as a
result of existing workers moving into more productive forms of employment, we must have some
way of measuring where workers would be located and how productive they would be both with
and without the transport investment.
In the context of Crossrail it was possible to estimate these figures because the London transport
commuter network is so over-crowded that there is evidence that people are deterred currently
from making trips. It was therefore possible to estimate what increases in demand for commuter
routes might occur as a result of the new capacity being delivered by Crossrail. The latest guidance
from DfT advises that ‘move to more productive jobs’ should not be estimated without the presence
of a Land Use Transport Interaction (LUTI) model.
Increased competition
Increased competition benefits consider the possibility of benefits that could potentially arise from a
transport improvement as better transport could break down elements of monopoly or power in
markets, thus enabling better competition.
The guidance from DfT reports that the benefits from increased competition are like to be very
small. They therefore advise that they would not generally expect appraisals to estimate wider
economic benefits of transport from increasing competition. The exceptions to this rule are where
an area shows evidence of a lack of competition in certain markets and the transport scheme can be
directly shown to be having an impact upon this level of competition.
Imperfect Competition
Transport appraisal captures benefits to firms by estimating the time savings for travel undertaken in
the course of work. As a result of time savings of their employees, firms can operate more efficiently
by serving their clients using fewer workers, so the benefits they receive from the transport
improvement are equal to the time savings to the workers valued at the price that the firms place on
their workers’ time.
Firms will respond to such cost savings by reducing prices and increasing output. This is an example
of how the time savings are transferred – because of competition, benefits are passed on from the
firm to the buyers of its products.
Where there is imperfect competition in a market, the value placed on additional production (the
price) is normally higher than the production costs. Firms and consumers would therefore be jointly
better off if firms were to increase production. If better transport induces firms to increase
production, there are precisely such benefits – the value placed on the additional production is
higher than the cost of producing it. These second round benefits would not fall to the firms that
receive the transport benefits, and the value attached to the time savings would therefore
underestimate the true benefits.
For this reason, DfT advise that benefits due to imperfectly competitive markets should be estimated
as 10% of the time savings to businesses.
July 2011 74
A3 International case study examples of the benefits of high speed rail
A.3.1 Overview
These examples highlight the need to align city and regional economic development objectives with
investment in infrastructure. High speed rail on its own will not deliver transformational change but
these examples suggest that alongside strategic plans for other investment and planning policies
which support growth it can have very beneficial effects.
Very little quantification has been carried out in this area although the following projects were
evaluated ex-post:
• TGV Sud-Est (Paris-Lyon) – Bonnafous (1987); and
• AVE (Madrid-Seville) – de Rus and Inglada (1997).
The ex-post evaluations show increases in commercial activity, and hence land values around some,
but by no means all, high speed rail stations. For example between 1983 and 1990, there was a 43%
increase in office space around Lyon Part-Dieu station. However, it is recognised that these
measures may reflect displacement of activity from elsewhere and should not be interpreted as
being indicative of net growth.
A.3.2 Japan: Tokyo-Osaka
• The idea started in the 1930s but plans only moved ahead when existing lines reached capacity.
The line finally opened in 1964, just in time for the Tokyo Olympics.
• The line covers 515.4km, travelling at 270km/hr and carrying over 150m passengers per year. It
very quickly exceeded initial demand forecasts. Even though the main line is only 3% of the total
network length, it carries 25% of all traffic.
• It cost 400bn Yen, which was double the original estimate but has long ago paid for itself
through fares.
• There have been many reports of economic and regeneration benefits resulting from the high
speed line. Cities like Yokohama have seen huge developments around stations. Property
values around stations have been estimated to be 67% higher and cities connected to the line
grow their population 22% faster and have 26% higher growth in employment
• Japan’s geography is v similar to Britain’s. Tokyo-Nagoya is a similar distance to London-
Manchester, and Tokyo-Osaka is slightly shorter than London-Edinburgh. It should be noted that
Japanese HSR does not connect to their conventional rail system.
A.3.3 France: Paris-Lyon
• This line opened in 1981. It cost 13.8bn Euro to deliver, and covers 409km, travelling at just
under 170 mph. Unlike the Japanese system, the TGV connects to the rest of the railway,
July 2011 75
meaning that everywhere on the network can benefit. France now has 2,000 km of track, almost
as much as Japan.
• This line cut journey times from Paris to Lyon from 4.5 hours to less than 2 hours. The rail share
of trips rose from 40-72%. Rail passengers rose from 12.5m in 1980 to 22.9m in 1992. From
1996-2004, passenger traffic of HSR has increased 62.5% in France.
• Like the Japanese line, reports suggest that the line has already covered its costs of construction
through fares.
• There have been many reports of economic and regeneration benefits resulting from the high
speed line. Lyon saw a 43% increase in office space around the station after HSR link to Paris
opened and reports suggest land prices have risen by 35%. Development at Lille’s station
supports 6,000 jobs (see box for more detail on Lyon and Lille). High speed rail has created new
commuter cities, such as Vendome, where HSR reduced the travel time from 2hrs20 to 42mins.
Lyon
Due to physical constraints around the existing station, a major new station to accommodate TGV
services was built adjacent to an emerging commercial district. Since the start of these services,
further development around the commercial area has followed:
• Businesses relocated to the commercial district, and office accommodation became more
valuable;
• The scale of business and commercial relocation has created its own momentum in
attracting further such activities;
• The urban public transport system has been developed to enable access to the area (and the
TGV station) from surrounding areas; and
• Hotels have been built in an area formerly lacking them; suggesting that the TGV service has
also expanded tourist travel to what was already an important tourist destination – it is
suggested that this may also indicate that visitors value hotels close to their place of arrival.
Lille
Historically, Lille had been heavily reliant on industry, being at the heart of a key industrial region.
The city benefitted from incorporating the plans for high speed rail into a wider long term vision to
transform the city as a whole. In 2004, Lille gained the position of European City of Culture.
• A new through station strictly for TGV services (Lille Europe) was built on a former barracks
site near to the original station. Most of the rest of this site was used for a major commercial
centre with offices, hotels and a large modern retail centre. The remainder was made into a
public park, replacing former open space used to build the new approach lines to Lille
Europe. The whole area is adjacent to the old city centre and has formed an extension of it.
• Further programmes have led to substantial new building of offices, public housing and a
very large conference and events hall in areas adjacent to Lille Europe. This forms part of a

July 2011 76
continuing strategy of development for the area. Further expansion is now in hand to take in
redevelopment of a closed railway goods yard and other disused land beyond the
conference hall.
• Reorganisation of the local universities has included locating some faculties in former cotton
mills in older areas, thus creating local employment and businesses in these areas. These
older areas have also benefited from regeneration programmes. In turn some of the
traditional university buildings have been taken over by larger businesses, often for regional
head offices.
A.3.4 Germany: Frankfurt-Cologne
• This line opened in 2002 and cost 6bn Euro to deliver. It covers 177km, travelling at 300km/hr.
Germany already has 1,300km of high speed track. The network links to France, Switzerland,
Austria, Belgium and Netherlands. The German HSR network is fully integrated with its existing
rail network.
• Construction began in Germany around the same time as France but politics, geography and
legal battles meant that it didn’t open until 10yrs later. The German network is also designed for
Freight (the Japanese and French networks are not).
• HSR now accounts for 97% of the air-rail market between Frankfurt & Cologne and passenger
traffic increased 133% between 1996 and 2004.
• Stations of Montabaur and Limburg were added to the Frankfurt-Cologne line due to political
pressure and studies show they saw 2.7% increase in overall economic activity.
A.3.5 Spain: Madrid-Seville
• The line opened in 1992. It covers 472km, travelling at 300km/hr. Spain’s HSR network (AVE) is
expanding faster than any other in Europe. Spain plans to expand its HSR network to 6,250km
by 2020. The proposed network would provide access for 90% of the population. Spain plans to
spend 10bn Euro per annum on rail infrastructure to deliver this (in comparison to a Network
Rail budget of £10bn for 5yrs).
• AVE is the only part of the Spanish railway turning a profit, despite the fact that ticket prices
have been kept low through public subsidies.
• The Madrid-Seville line cut air travel by a third and car fell from 60-34%. Along the Madrid-
Barcelona line, once Europe’s busiest air route, the number of train passengers now outnumbers
air.
• Lleida, a city between Madrid & Barcelona, has experienced 15% increase in tourism and new
investment from high tech companies. Cities such as Ciudad Real have seen growth as
commuter cities, with an average of 1,000 homes built per year.
A.3.6 China: Beijing-Shanghai
• HSR was introduced in 2007, and has already carried 600m passengers. The Beijing-Shanghai
line opened in 2011 and cost 220bn Yuan to deliver. It covers 1,318km, travelling at 380km/hr.
July 2011 77
China already has the world’s largest HSR network with over 8,000km. A further 17,000km are
set for construction by the end of 2020, costing $300bn.
• Over 25% of China’s population lives in cities along the existing Beijing-Shanghai line.
A4 City specific transport priorities
A.4.1 Birmingham
• New Street Station Gateway: this project aims to stimulate regeneration in the surrounding area,
potentially creating over 10,000 jobs locally. Construction has commenced with phase 1 due to
be completed in 2012 and phase 2 in 2015.
• Creating a step change in local rail connectivity: Re-opening passenger services (on the Camp Hill
line and the freight only line serving Minworth, Walmley and Sutton Coldfield) and new stations
on suburban railway lines (for example at the Fort and Castle Vale/Castle Bromwich). Improving
local rail networks will help to spread the benefits of high speed by enabling people to connect
to the stations served by the network.
• Improving multi-modal connectivity in the city centre: there is currently three railway station in
Birmingham and the current proposals for high speed will create a fourth. A priority for the city
therefore is to improve connections between these stations and between different modes to
minimise journey times during interchange. The Bordesley Chords scheme will help to increase
rail capacity by enabling more trains to access Moor Street rather than New Street Station.
• Metro extensions: work is currently underway to extend the city’s Metro network from Snow Hill
Station to New Street Stations, this will contribute to the above priority to improve connectivity
in the city centre. There are further plans for additional extension, including to the Birmingham
Airport, which will help to facilitate sustainable connections from the city centre to this other
centre of employment.
• Developing Bus Rapid Transit (BRT), Birmingham Sprint, proposals in the city will reduce journey
times on key routes
• Managing demand and helping to address congestion on the strategic highways network
remains an ongoing challenge to be addressed in the city. This also includes investing in the
maintenance of this network.
A.4.2 Bristol
• Electrification of the GWML between Cardiff, Bristol and Didcot, with funding being confirmed
for this scheme. This will reduce journey times and increase capacity on the main line to London
as well as between Bristol and Cardiff.
• The Greater Bristol Bus Network (GBBN) programme that is being completed this financial year,
representing the end of the four year delivery phase and will cumulatively represent £70m of
investment in the network through this scheme.
July 2011 78
• The GBBN will be complemented by the plans for BRT in the city. There are aspirations for three
BRT routes; Ashton Vale to Temple Meads/City Centre, North Fringe to Hengrove and South
Bristol Link, which will help to significantly improve connectivity and interchange with the local
rail network. Best and final funding bids (BAFFBs) for these three proposals are due to be
submitted to Government in September.
• Improved local rail networks in Bristol will also be important in facilitating interchange and thus
minimising journey times for people to connect to the strategic rail network. This would also
help to facilitate the local commuting network.
A.4.3 Leeds and its wider City Region
• Improving Transpennine links will be important in resolving strategic connectivity issues
between Leeds and Manchester. This potentially includes infill electrification of the Northern
Transpennine Line and the Caldervale Line. This would also help to improve connectivity to other
important economic centres such as Bradford, Halifax, York and Huddersfield.
• Increasing capacity at Leeds Railway Station will be important in facilitating economic growth in
the wider City Region by enabling more people to use rail to travel into the city centre. Peak
demand on all rail services into Leeds is forecast to increase by 37% by 2019 and by 62% by
2029108. Consequently, it will be important to unlock and develop rail capacity in the Leeds area
to facilitate the commuting network and enable the movement of freight. This could include the
wider regeneration of the station to help modernise facilities.
• Improving international connectivity through improved links to Leeds Bradford Airport has been
has been identified as one of the top three spatial transport priorities in the Leeds City Region 20
year Transport Strategy 109.
• Improving connectivity in the local transport network through targeted interventions such as bus
rapid transit, including eg the proposed New Generation Transport (NGT) trolleybus scheme, and
tram train on key corridors. Developing these modes within the city region offers the potential
opportunity to improve connectivity and quality of service, reduce journey times and generate
additional capacity on the rail network.
A.4.4 Liverpool
• The electrification of the Liverpool to Manchester line will significantly reduce journey times
between these two cities, which represent the main economic drivers in the North West. The
funding for this work is confirmed, with phase 1 expected to commence in 2013 and be
completed in 2016.
• The Northern Hub will help to improve rail connectivity with Manchester and help to address
some of the capacity constraints experienced in Merseyside. The combination of these proposals
and the electrification of the Liverpool to Manchester Line can help to minimise any unmet
demand for rail services transferring to the use of the private car.
108
Network Rail (2011) Northern Route Utilisation Strategy 109
Leeds City Region (2009) Leeds City Region Transport Strategy
July 2011 79
• Improving rail access to Liverpool Lime Street station will reduce the current restrictions placed
on capacity and could therefore help to improve interchange between the strategic and local rail
networks. Potential other improvements at the station could also include platform lengthening
and improving access from the between the station to the city centre. This could help to
enhance the role of the station as a gateway to the city.
• Addressing congestion on the A565 Great Howard Street remains a priority for the city; as set
out in LTP2 and LTP3. This scheme also forms part of the strategic regeneration framework for
Northern Liverpool.
• A key priority for Liverpool is the maintenance of the road network, where there is an ongoing
need for investment to be able to maintain accessibility and connectivity to and within the city.
A.4.5 Manchester
• The plans for the Northern Hub will help improve connectivity to and from Manchester across
the north of England. This scheme will improve rail capacity in Manchester, reducing journey
times, increasing line speed and improving access to Manchester Airport. This proposal will form
an important precursor to high speed and will mean that the journey time savings generated
through the Government’s proposed network are not lost as a result of the time taken to
connect to the high speed network, via the local transport network, from other parts of Greater
Manchester.
• The electrification of the Manchester to Liverpool Line was confirmed last year, with the project
expected to be completed by 2016. This is part of the wider electrification of the lines between
Manchester, Liverpool, Preston and Blackpool.
• Improving Northern Transpennine links with Leeds to reduce journey times between these two
cities, as the two largest economies in the north of England.
• Within Greater Manchester the planned extensions to the Metrolink will be completed by 2016,
with some completed initial links completed and opening from 2011/12. This will include
extending the Line to Manchester Airport, as well as East Didsbury, Ashton-under-Lyne, and the
town centres of Rochdale and Oldham. A second tram route across the city centre, the Second
City Crossing, is projected to be completed in 2016. In the medium to long term the potential
use of tram train could improve local transport connectivity and help to generate additional
capacity on the route.
A.4.6 Newcastle
• Maintaining and improving links to London, in addition to improving key interurban rail links
including to Sunderland, Tees Valley, York, Leeds, Edinburgh, Scotland, Carlisle and Cumbria.
• The interface between local and strategic rail services is likely to remain an issue requiring
consideration in the short to medium term. Addressing capacity constraints and service quality
issues on local rail routes in to Newcastle Central is an ongoing challenge.

July 2011 80
• Metro reinvigoration: the medium term future of the Metro has been secured through the
reinvigoration plans. In the longer term there is an opportunity to look at extensions, particularly
tram train and the use of currently disused rail corridors.
• In some corridors there is scope for quality bus/ bus priority interventions to improve
connectivity and reduce journey times.
• There remain problems of major congestion on the A1 and in particular on the Western Bypass,
which needs to be solved by a combination of network capacity and performance measures, but
also smarter choices and improved public transport to encourage behaviour change.
A.4.7 Nottingham
• The upgrade and electrification of the MML to improve links to London is identified as an
important transport priority for the city. Currently, journey times to London from the city are
relatively slow with trains on this approximately 200 mile trip having an average speed of
109kmph. The upgrading the line to straighten it and then electrification could therefore reduce
journey times on this line.
• The widening of the A453 to improve highways connectivity between the M1 and Nottingham
will help to relieve congestion between the city centre and the strategic highways network.
• Improving strategic rail connectivity with the other Core Cities is important. There is a particular
need to reduce journey times between and potentially increase capacity on the lines between
Nottingham and Birmingham and Nottingham and Leeds (via Sheffield).
• Improving the quality of the service between Liverpool and Nottingham (via Manchester and
Sheffield) is another important mechanism in improving connectivity between the Core Cities.
This route connects half of the Core Cities yet currently has a relatively poor quality service and
experiences capacity constraints in some areas. Improving rail services from Nottingham to
Lincoln remains important.
• NET phase 2 consists of the construction of two new tram lines in the city to improve public
transport provision to the west and south west of the city. This investment has been confirmed,
with construction expected to start in late 2011, with services operating from 2014. There are
also long term plans to undertake further extension of the NET network, as part of phase 3,
potentially to the north west, east and south of the city. This could also potentially include a
connection to the high speed rail station, if this was located outside of Nottingham City Centre.
A.4.8 Sheffield
• The electrification of the MML including upgrades to the Line, is an important transport priority
for the City in order to improve its strategic connectivity. The MML is the only Main Line to
London that has not been or is not being electrified. The electrification of the line could reduce
journey times to London to less than two hours. Another priority related to this is the need to
connect the MML to the first phase of HS2, via the Birmingham to Derby Line, to enable high
speed services to connect to the city from 2026.

July 2011 81
• Other strategic rail connections that have been identified as requiring improvements are
Transpennine links to Manchester and to services between Leeds, Sheffield and Nottingham.
Currently these journeys are affected by relatively slow journeys times for these short distances.
The delivery of the Northern Hub proposals will help to improve rail services in Sheffield.
• Improving external highways connectivity to the city is another priority. This includes providing
hard shoulder running on the M1 to increase capacity, reduce congestion and help to alleviate
air quality issues along this corridor. The need to improve surface access to the Robin Hood
Airport Doncaster Sheffield is also important in enabling improved international connectivity
from the city.
• At a local scale Bus Rapid Transit (BRT) has been identified as a priority for the City and a BAFFO
to the DfT for BRT North (a route to connect Sheffield city centre with Meadowhall and
Rotherham) is currently being completed, to be submitted in September 2011. This scheme has
a BCR of 3.51110 and if the submitted bid is successful the scheme would aim to be operational
by summer 2014.
• Aspirations to develop tram train to help provide additional capacity on the rail network and
improve connectivity within the local commuter network. This project would see tram-trains
potentially operating on the existing freight line between Meadowhall and Rotherham, which
could then connect to the existing Sheffield Supertram route. In the long term there are
aspirations to expand the tram network in the city.
110
SYPTE (2011) Local Authority Major Schemes Pre-Qualification Pool: Expression of Interest,
www.dft.gov.uk/adobepdf/165237/706167/706557/South-Yorkshire.pdf